Abstract
Understanding habitat quality patterns and their drivers in arid zones is of fundamental importance to the sustainability maintenance of terrestrial ecosystems, but remains elusive. Here, we applied the InVEST model to investigate the spatiotemporal patterns of habitat quality in the northern sand-prevention belt (NSPB) across five time periods (2000, 2005, 2010, 2015, 2018), coupled with the structural equation model (SEM) and boosted regression tree (BRT) model to identify their integrated driving forces. The results exhibited that habitat quality in high-level zones expanded gradually from 2000 to 2018, while the middle- and low-level zones shrank. Climate, soil, topography, and human activities were significantly correlated with habitat quality, with mean annual temperature (MAT) and human activities being key contributing factors in the high-level and low-level zones, respectively, whereas the contribution of factors varied considerably in the middle-level zones. The interactions among climate, soil, topography, and human activities jointly drive habitat quality changes. Climate intensified the positive effects of soil on habitat quality, while the topographic and human activities mainly affected habitat quality indirectly through climate and soil. Our findings offer a scientific guidance for the restoration and sustainable management of desertification ecosystems in northern China.
1. Introduction
Habitat quality is generally defined as the potential of ecosystems to provide suitable conditions for biological conservation, which has fundamental importance to biodiversity maintenance and ecosystem service functions [1,2,3]. Over the decades, land use changes have dramatically affected habitat quality [4]. Field surveys, ecological index evaluation, and ecological models were widely applied to evaluate habitat quality and explore its dynamic change. Most early studies focused on exploring regional variations in habitat conditions and suitable habitats for species in specific regions through field surveys [5]. Various ecological indexes have been used to rapidly monitor biodiversity and ecological quality across different scales with the advancements of remote sensing technology [6,7,8,9,10]. Recently, ecological models (e.g., Integrated Valuation of Ecosystem Services and Tradeoffs, InVEST) were primarily employed to quantify, evaluate, and simulate habitat quality at larger scales [11,12,13,14,15,16,17]. Exploring the spatiotemporal evolution in habitat quality and driving forces has garnered growing attention in research [18,19].
Identifying the factors influencing habitat quality provides guidance on protecting the regional ecological environment [20,21]. Natural environment factors (e.g., climate, soil, and topography) and human activities are generally recognized as the major driving forces of variations in habitat quality [22]. Climatic conditions, such as temperature and precipitation, affect the land cover, vegetation growth, and water cycle in different environments, which causes significant differences in habitat quality [12]. Soil physical and chemical properties are profoundly affected by land use changes [23], with a corresponding regulation on the distribution characteristics of habitat quality to a certain extent [24]. Topographic conditions have not altered significantly in the short term but impact surface materials, energy transfer, and land use patterns, which in turn affect ecological environment quality [2,25]. In addition, as the primary sources of disturbance to the natural ecosystems, population pressure and human socio-economic activities are emerging as the most active factors affecting the evolution of ecosystem patterns. Anthropogenic intensity [26,27], grazing pressure [28], and urban expansion [29,30,31] significantly alter the spatiotemporal characteristics of habitat quality within diverse regions, leading to ecological degradation. Investigating the effects of various factors such as climate, soil, topography, and human activities on ecological environment quality is conducive to balancing regional construction and ecological development [20]. Therefore, examining the synergistic effects of multiple factors on habitat quality is crucial to fill gaps in the quantitative analysis.
As a national-level ecological barrier in northern China, the northern sand-prevention belt (NSPB) is highly significant in maintaining ecosystem services, economic development, and ecological security patterns [32,33,34]. In recent years, regional land desertification and vegetation degradation remained severe, especially under the dual pressures of climate change and human activities [35,36]. Extensive studies have focused on the regional ecological security, ecological vulnerability assessment, and ecosystem service function in the NSPB [34,37,38]. However, studies on the interrelationship between habitat quality and driving factors often adopt simple methods including geographical detectors [39,40], a correlation analysis [41], and a multiple regression analysis [42], and these studies only focus on examining the effect of a single factor or single natural element on the ecological environment, and fail to comprehensively explore the multifactorial influencing mechanisms and grasp the impact pathways of habitat quality from the perspective of ecological integrity. Therefore, spatiotemporal patterns and integrated driving forces of habitat quality within NSPB remain poorly understood.
In this study, we assembled a comprehensive database including environmental factors and human activities’ index from 2000 to 2018. The InVEST model was then applied to quantify habitat quality of NSPB and grasp its temporal and spatial changes. Finally, the structural equation model (SEM) and boosted regression tree (BRT) model were introduced to investigate the influence of natural and anthropogenic factors on habitat quality across five time periods (2000, 2005, 2010, 2015, 2018). The specific objectives of this research were to (1) explore the habitat quality patterns in the NSPB; (2) identify the contribution of environmental and anthropogenic variables to habitat quality; (3) grasp the direct and indirect driving paths of habitat quality patterns. This study is essential for the ecological restoration and biodiversity conservation of ecological projects in northern China.
2. Materials and Methods
2.1. The Study Area
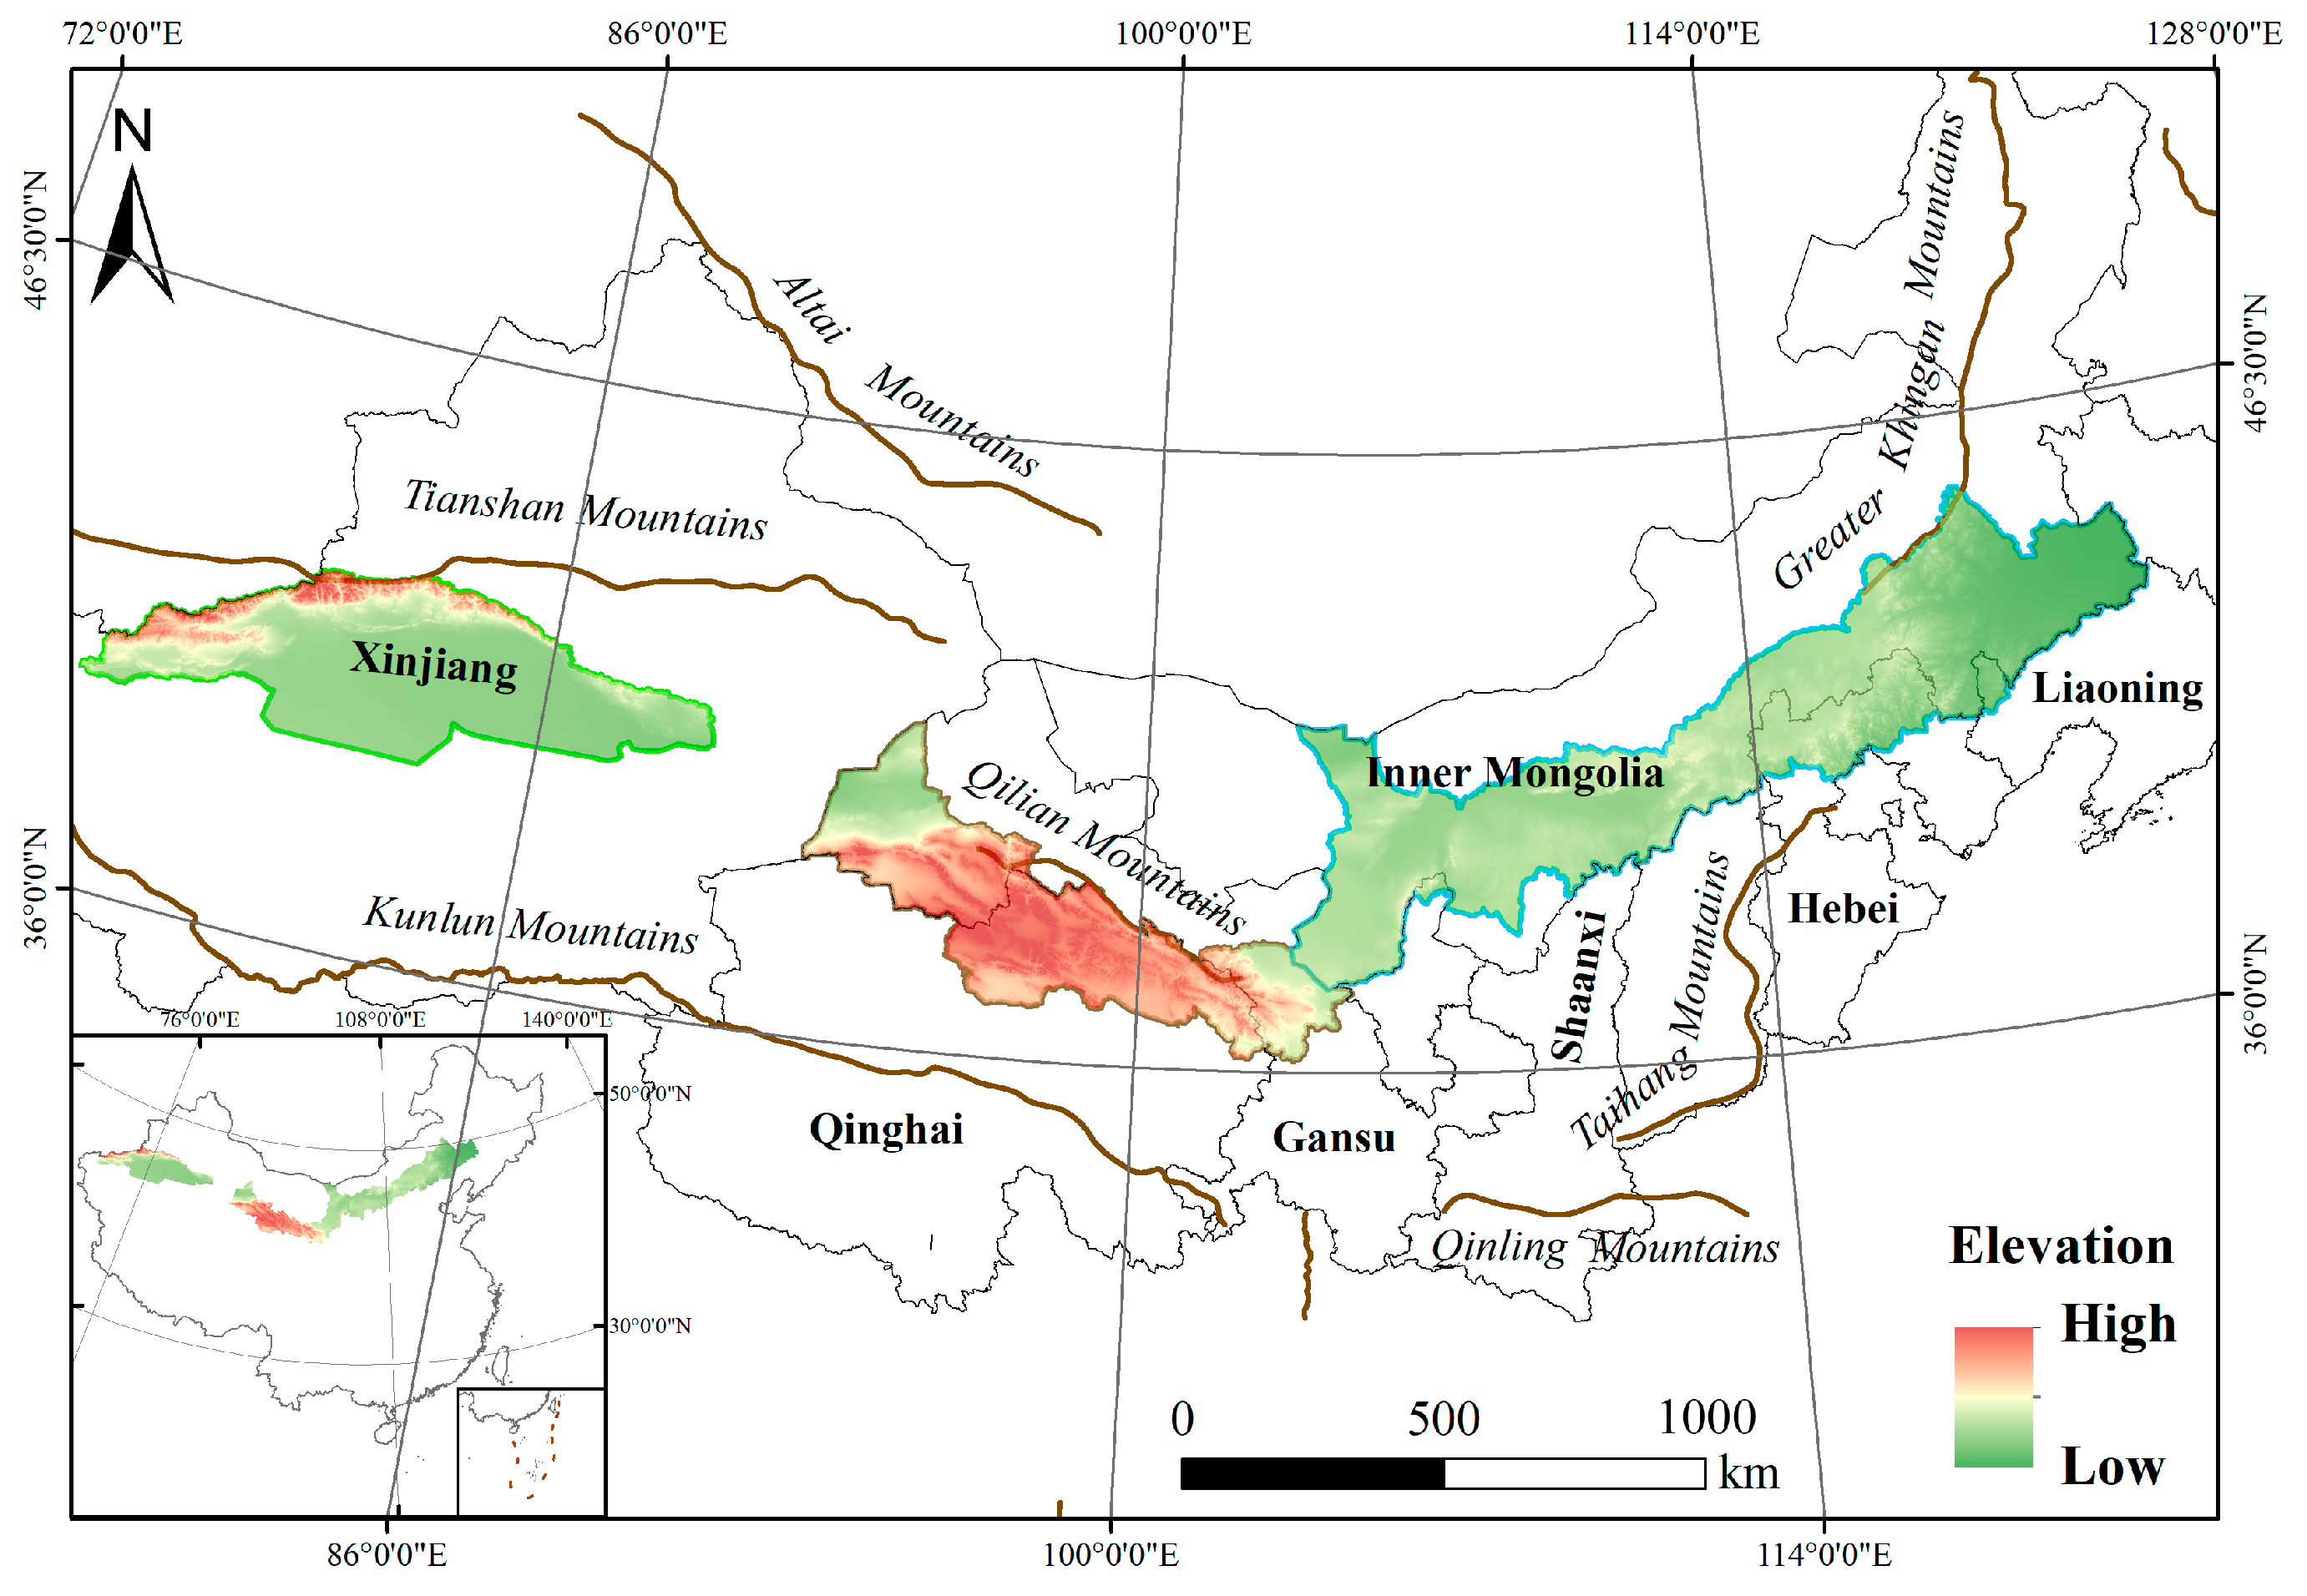
The NSPB is distributed in an elongated band across northern China (26°45′34″ N–43°53′25″ N, 71°34′23″ E–125°43′35″ E), which mainly includes three regions: the Inner Mongolia sand-prevention belt, the Tarim sand-prevention belt, and the Hexi Corridor sand-prevention belt (Figure 1). Among them, the Inner Mongolia sand-prevention belt is located in south-central Inner Mongolia, west of the Greater Khingan Mountains. The Tarim sand-prevention belt is situated between the Tianshan and Kunlun Mountains in southern Xinjiang, China. The Hexi Corridor sand-prevention belt is located in northwestern China, south of the Qilian Mountains, and includes parts of Gansu and Qinghai Provinces. The study area covers 8.1 × 10⁵ km2, with the mean annual temperature being −1.9–13.5 °C, the mean annual precipitation being 30–450 mm, and an arid and semi-arid temperate continental climate [38]. Soil types within our study area are diverse, including ordinary wind-sand mobile soil, brown desert soil, thin frozen soil, and ordinary brown soil. The biomes are mainly desert, grassland, and farmland, with typical characteristics of an agro-pastoral ecotone [38].
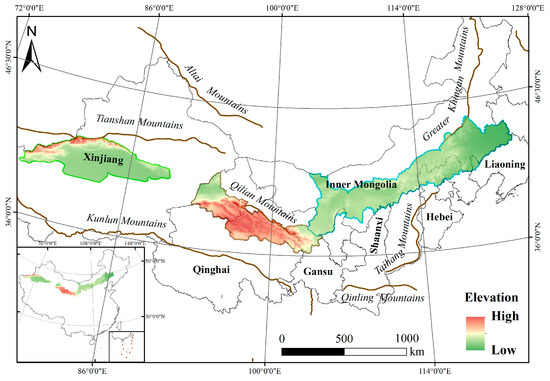
Figure 1.
The location of the NSPB in China.
2.2. Data Collection and Processing
We assembled a comprehensive database by collecting datasets on land cover, climate, soil, topography, and human activities (Table 1), which are described as follows: (1) The NSPB of China boundary data were obtained from Global Change Research Data Publishing & Repository (http://www.geodoi.ac.cn, accessed on 20 June 2023). (2) The land use data with a 30 m resolution for five periods (2000, 2005, 2010, 2015, 2018) came from the CLCD database of Yang and Huang [43]. The first-level classification of land use data includes cropland, forest, shrub, grassland, water, snow, barren, impervious, and wetland. (3) Meteorological data with a 1 km resolution mainly contain mean annual temperature (MAT), mean annual precipitation (MAP), and potential evapotranspiration (PET), from the National Earth System Science Data Center (http://loess.geodata.cn, accessed on 22 June 2023). The average values of climate factors were calculated in the four continuous time series periods: 2001–2005, 2006–2010, 2011–2015, and 2016–2018. (4) Soil factors comprise total nitrogen (TN), total phosphorus (TP), soil organic carbon (SOC), soil pH, bulk density (BD), Clay, Silt, and Sand, which were obtained from the National Tibetan Plateau Science Data Center (https://data.tpdc.ac.cn, accessed on 26 June 2023) with a resolution of 1 km. (5) The 1 km resolution digital elevation model (DEM) data were derived from the Resource and Environmental Science and Data Center of the Chinese Academy of Sciences (https://www.resdc.cn, accessed on 28 June 2023). The elevation data were processed by using the surface analysis tool of ArcGIS to obtain the Slope and Aspect. (6) The 1 km resolution human footprint index (HFI) data came from Mu et al. [44]. The average values of HFI were calculated in the continuous time series (2001–2005, 2006–2010, 2011–2015, 2016–2018) for the analysis of factors affecting habitat quality in five periods. To ensure data availability, the above data were uniformly converted into 1 km × 1 km raster data.

Table 1.
Description of data source.
2.3. Habitat Quality Assessment
The habitat quality module in the InVEST model can evaluate ecosystem suitability to support species survival and reproduction [45]. The module calculates the habitat quality index by integrating land use type sensitivity and external threat intensity. As the habitat quality index increases, the level of habitat quality improves accordingly [46]. Therefore, the InVEST model was employed to quantify habitat quality in the NSPB for five time periods. The input parameters of the model were confirmed according to the InVEST model manual and previous studies (Tables S1 and S2) [13,14,47]. On this basis, the habitat quality in the NSPB in 2000, 2005, 2010, 2015, and 2018 was calculated.
To precisely characterize the dynamic tendency of habitat quality, three levels were divided from the habitat quality in the NSPB through the natural breakpoint classification method, including low (0–0.4), medium (0.4–0.8), and high (0.8–1.0) [13].
2.4. Identify Drivers of Habitat Quality
The grid method was performed to sample in the study region at a 12 km × 12 km scale, so as to analyze the drivers of habitat quality and their contributions at a smaller unit scale. Finally, a total of 5632 sampling points in the NSPB were extracted. Data analysis tools were used to extract habitat quality of the corresponding grid and average value of environmental factors and human activities for each period. All sampling points were extracted in ArcGIS 10.8 software, and then the attribute tables were generated by removing missing values.
In order to screen out more variables by combining multicollinearity [48,49], 15 factors were analyzed with the Spearman correlation test. By combining relevant literature [40,50], we removed the variables that had a high correlation coefficient with the others (|r| > 0.8). PET, Sand, and SOC were therefore eliminated. After screening, 3 topographic factors (DEM, Aspect, Slope), 2 climatic factors (MAT, MAP), 6 soil factors (Clay, Silt, BD, pH, TN, TP), and 1 human activity (HFI) factor were included in the final modeling within the NSPB (Figure S1).
All statistical analyses in the research were performed in R (v4.3.0) [51]. To examine the correlation between habitat quality and variables, the linear mixed-effects model was conducted using the “lme4” package in R [52], habitat quality was regarded as the response variable, climate, soil, topography, and human activities were used as fixed effects, and land use types were included as a random effect. The relative importance of the screened variables on habitat quality was determined using the BRT algorithm [53] and ranked in order of importance. BRT can handle a nonlinear relationship and complicated interactions and is not constrained by covariance and missing data. The “XGBoost” package v.1.4.1.1 in R was utilized in the BRT analysis and visualization [54].
2.5. Quantify Driving Pathways of Habitat Quality
Piecewise SEM was introduced [55,56] to explore the direct and indirect effects (β represents the path coefficient) of these variables on the habitat quality in the NSPB. Piecewise SEM, as a commonly applied method for analyzing ecological data, can address non-independent observations and the non-multivariate normal distribution of residuals in response variables. The “piecewise SEM” [57], “nlme”, and “lme4” packages in R were adopted to perform piecewise SEM. We employed Fisher’s C test to evaluate the goodness of fit of the model (0 ≤ Fisher’s C/df ≤ 2, 0.05 < P ≤ 1.00), and the model was further refined based on significance (p < 0.05), and AIC values [55,58].
3. Results
3.1. Spatiotemporal Patterns of Habitat Quality
From 2000 to 2018, the high-level zones in the NSPB were primarily distributed in mountainous regions, including the Tianshan Mountain Area on the western edge of Xinjiang Province, the Qilian Mountain Area in the northeast of Qinghai Province, the edge of Greater Khingan Mountains, and other mountains areas in Inner Mongolia, covered by vegetation such as woodland, grassland, and scrubland (Figure 2). Medium-level zones were mainly dispersed in Inner Mongolia areas, where the land types mainly were cropland and grassland. Low-level zones were extensively distributed in areas spanning Xinjiang Province, a border area of Gansu Province and Inner Mongolia, as well as the northwest of Qinghai Province. These regions were mainly concentrated in large areas of desert and a small portion of grassland, while including areas strongly interfered with via human activities, such as construction land.
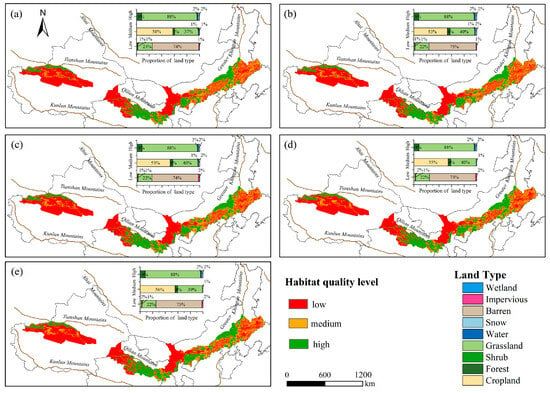
Figure 2.
Habitat quality classification and the proportion of land type at three levels in (a) 2000, (b) 2005, (c) 2010, (d) 2015, and (e) 2018.
Across the five time periods, the area ratio of low-level zones was the highest, exceeding 50% (Table 2). The area of low-level zones exhibited a trend of “decreased-increased”, decreasing from 54.10% in 2000 to 51.88% in 2010 and then increasing to 52.11% in 2018. Meanwhile, the area ratio of medium-level and high-level zones occupied over 20%, with the area of high-level zones showing a primarily increasing trend from 22.59% in 2000 to 25.24% in 2018.
Table 2.
Habitat quality area and percentage statistic for the NSPB from 2000 to 2018.
3.2. Drivers of Habitat Quality Patterns
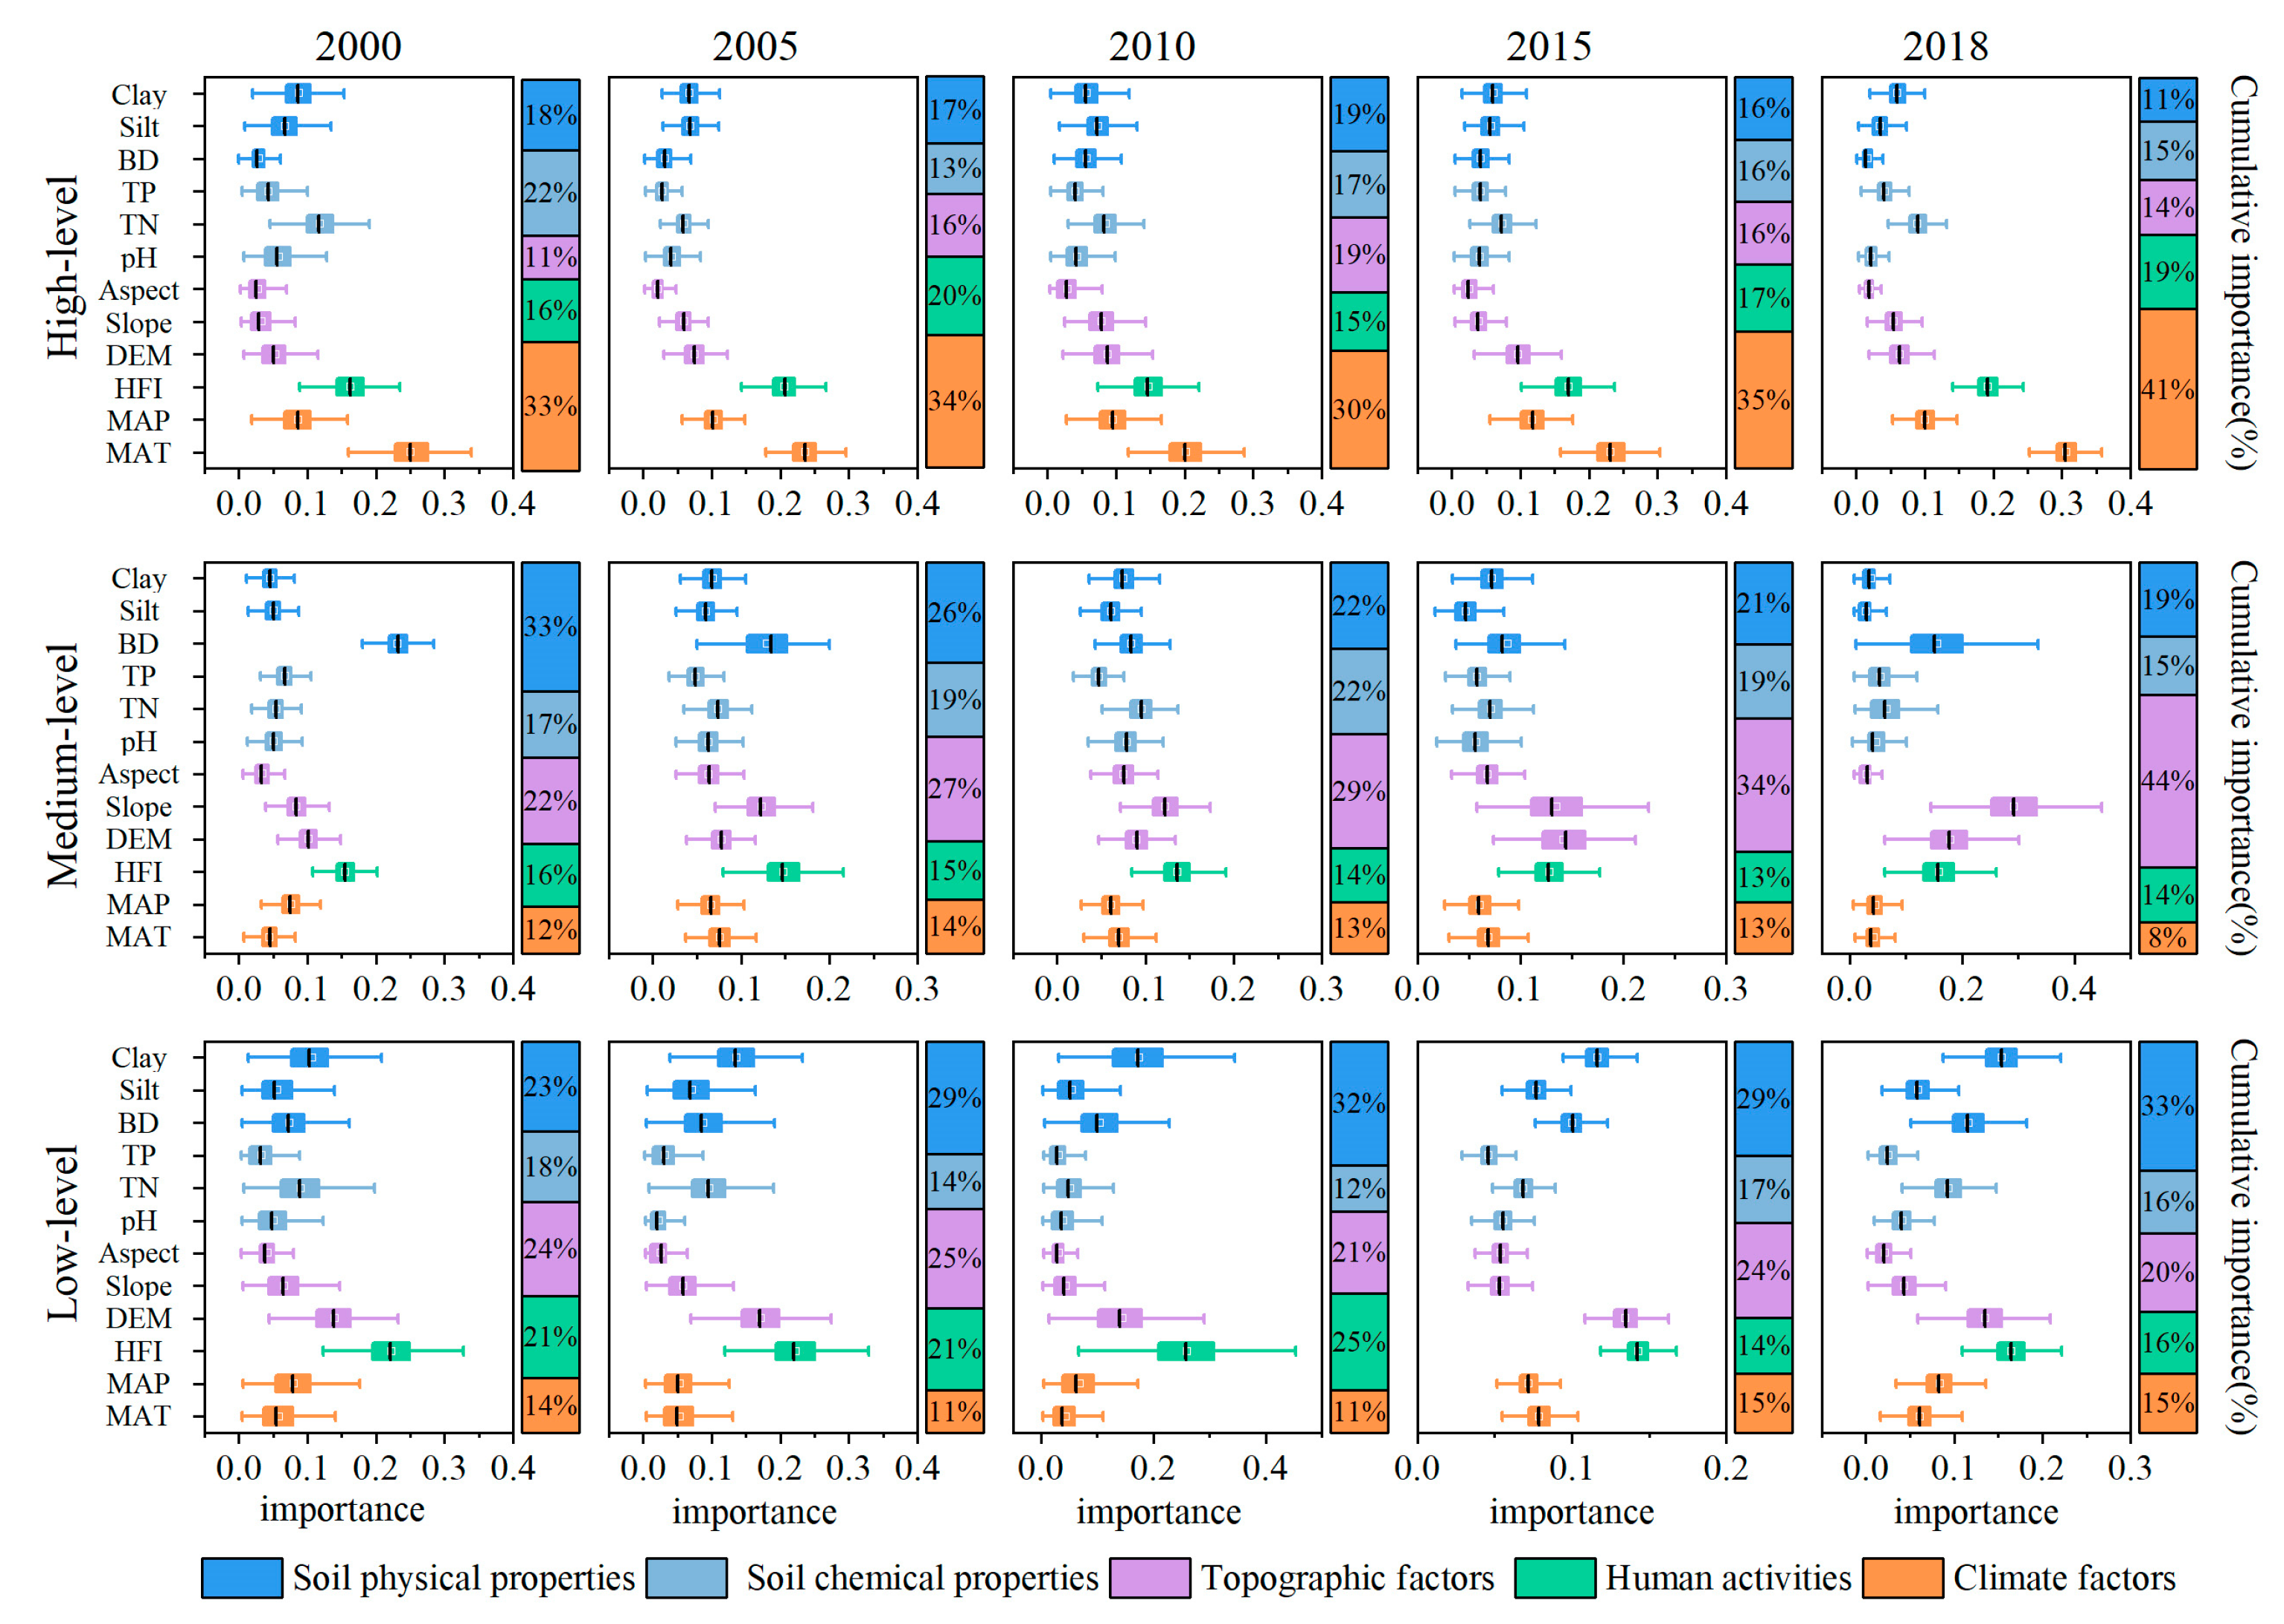
The result of the linear mixed effect analysis showed that in the high-level zones, the habitat quality from 2000–2018 was positively correlated with DEM (p < 0.001), MAP (p < 0.001), TN (p < 0.001), TP (p < 0.001), and Silt (p < 0.01), and negatively correlated with MAT (p < 0.001), pH (p < 0.01), BD (p < 0.001), and Clay (p < 0.01), while no significant relationships were found with the Slope and Aspect (Figures S2–S5). The results of BRT showed that MAT (ranked as the top one) was the dominant factor shaping habitat quality in the high-level zones from 2000 to 2018, followed by MAP and HFI. The contribution of these factors showed significant differences among different periods. Climatic factors (MAT, MAP) ranked first in the cumulative importance ordering, accounting for more than 30% (Figure 3).
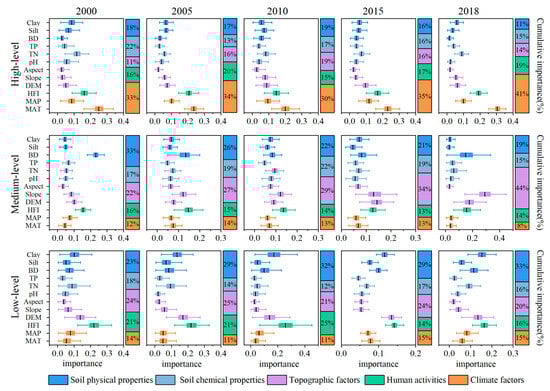
Figure 3.
Ranking of the relative importance of different environmental variables.
In medium-level zones, the habitat quality showed a positive relationship with DEM (p < 0.05), Slope (p < 0.001), and TN (p < 0.001), a negative relationship with pH (p < 0.01) and BD (p < 0.001), and no significant relationship with Clay (Figures S2–S5). The BRT results showed a significant difference in the contribution rate of each environmental factor in the middle-level zones. The primary factors contributing to the habitat quality were DEM, Slope, BD, and HFI. The importance of soil physical properties in the cumulative importance ranking decreased by years, from 33% in 2000 to 19% in 2018. On the contrary, the importance of topographic factors in the cumulative importance ordering increased by years, from 22% in 2000 to 44% in 2018 (Figure 3).
In the low-level zones, habitat quality was positively correlated with DEM (p < 0.001) and Slope (p < 0.001), and negatively correlated with MAP (p < 0.01), MAT (p < 0.05), HFI (p < 0.001), pH (p < 0.001), BD (p < 0.001), Clay (p < 0.001), and Silt (p < 0.001), while the relationship with Aspect was not significant (Figures S2–S5). We identified HFI as the major driver of affecting habitat quality with BRT analyses, and the cumulative importance ranking of human activity was significantly higher than that in the medium-level zones (Figure 3).
3.3. The Driving Paths of Habitat Quality Patterns
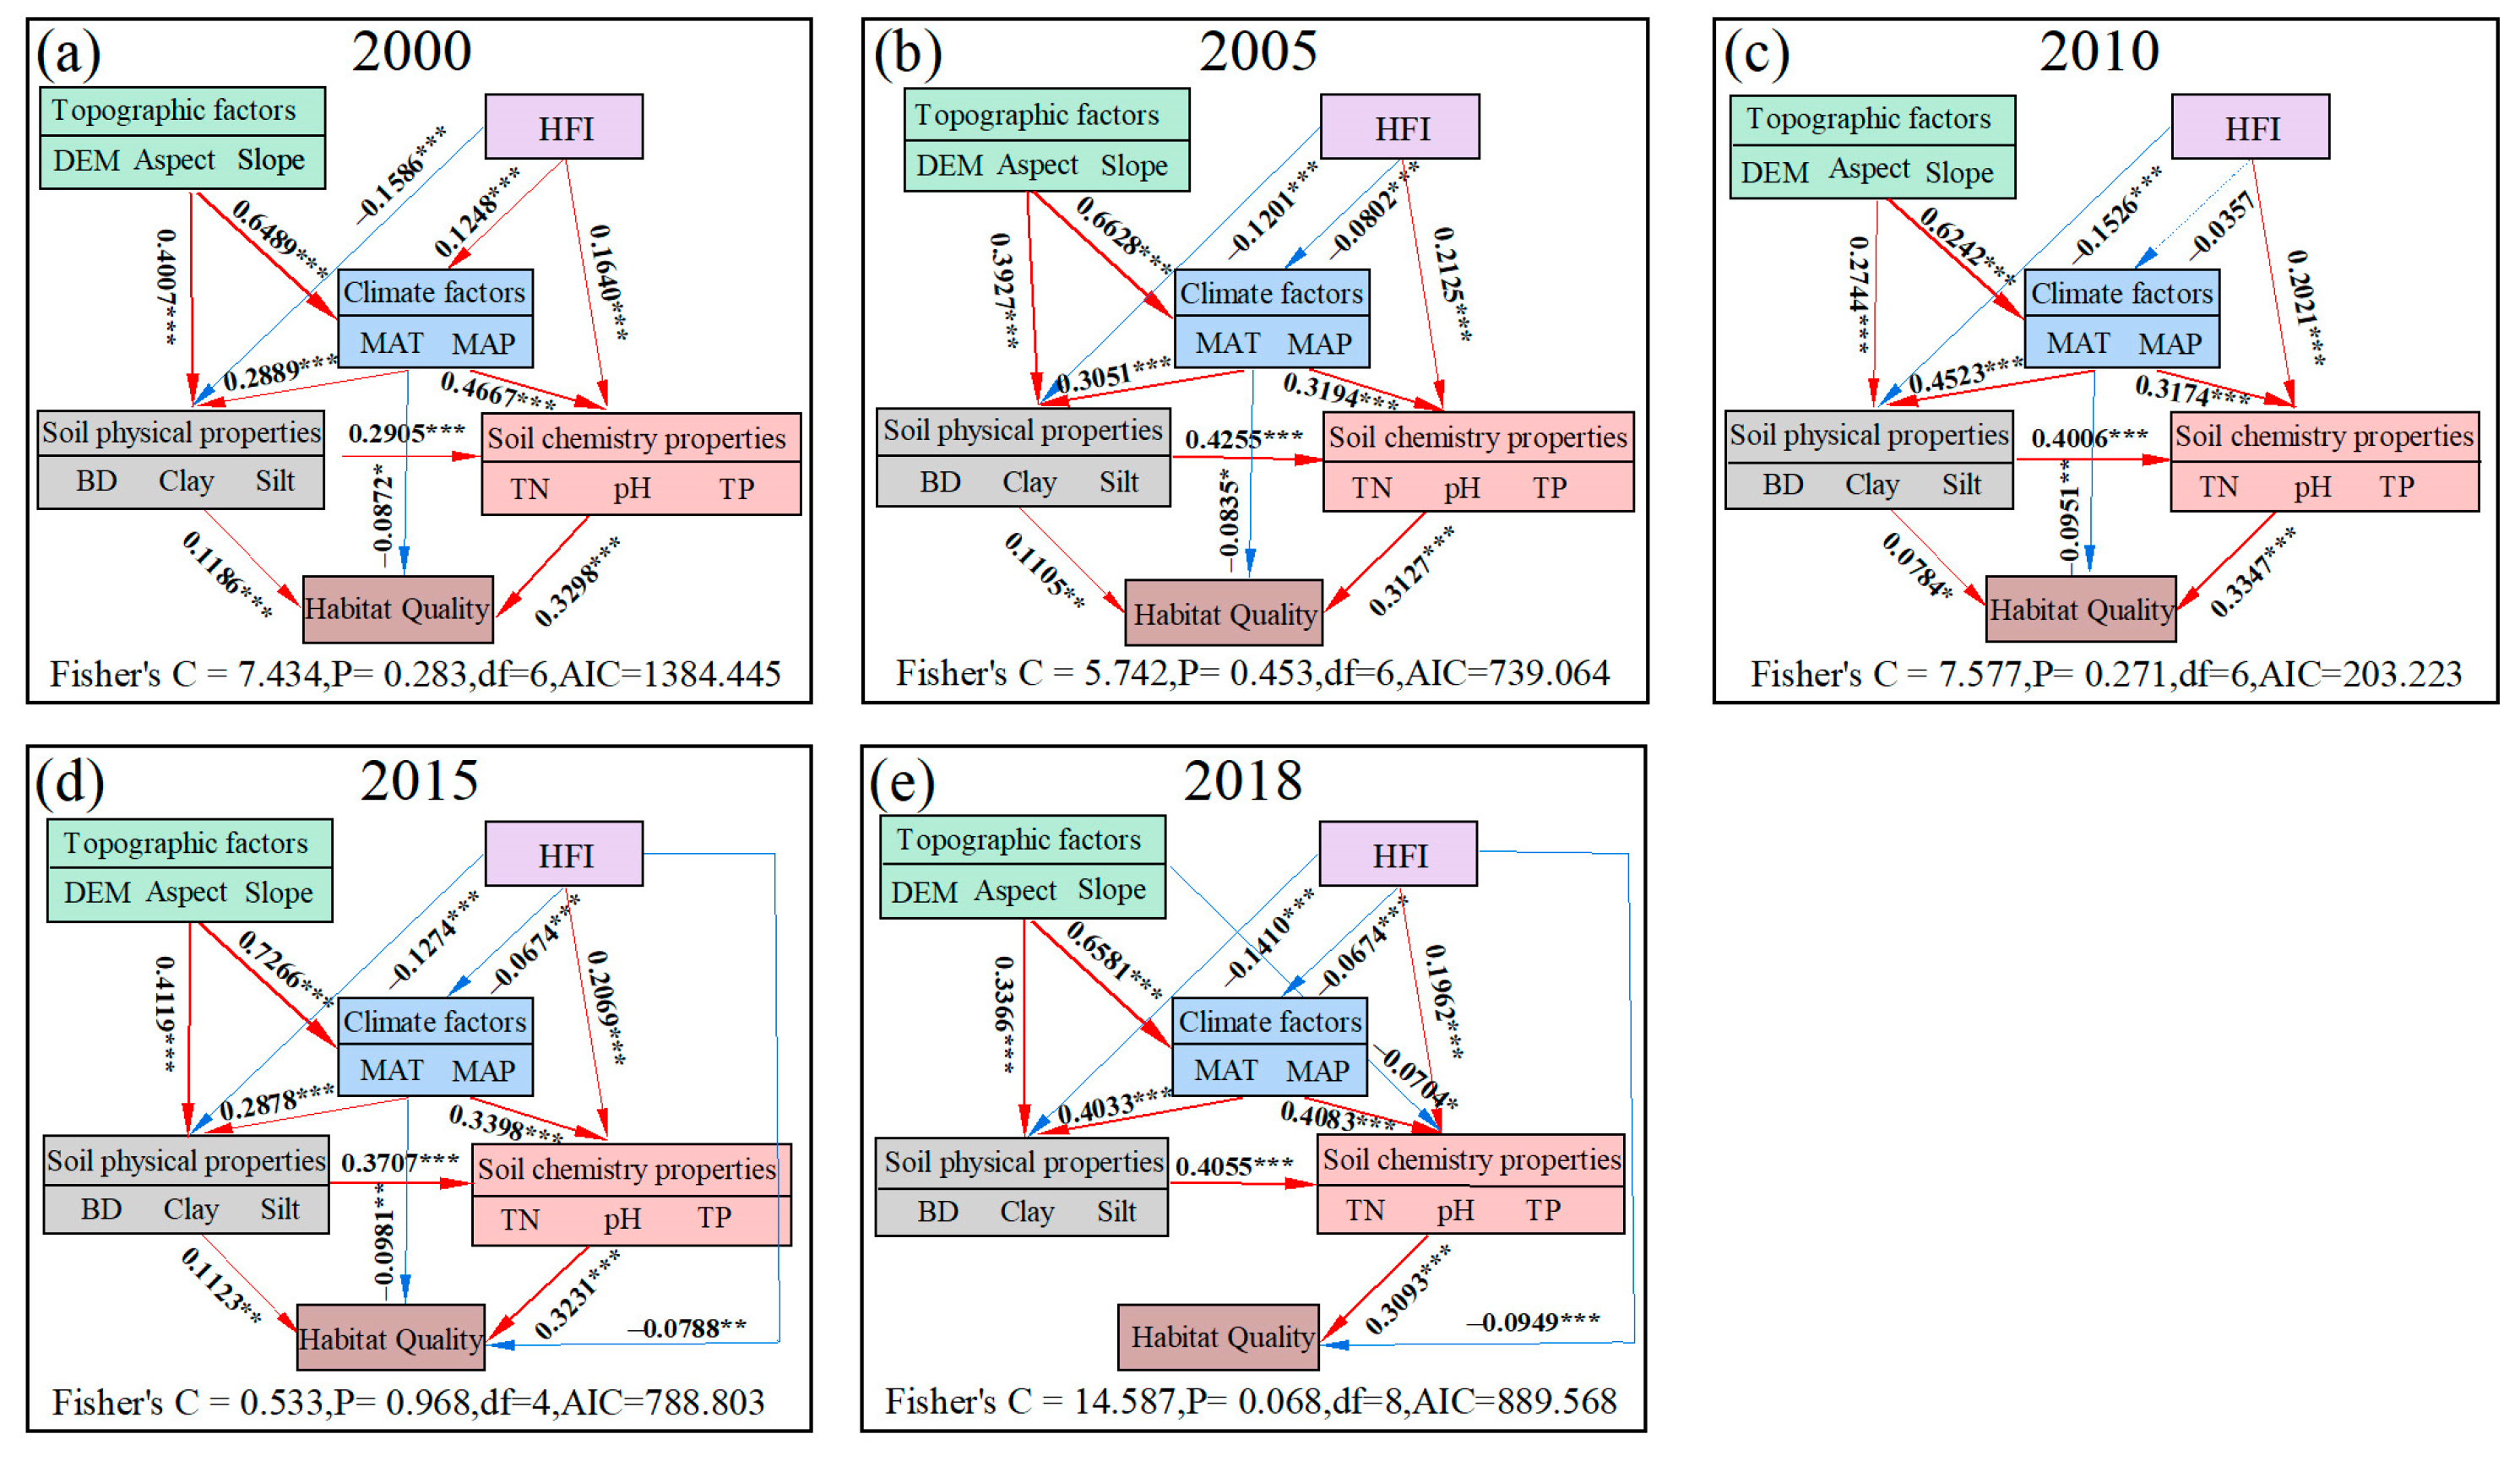
In the high-level zones, the results showed that topographic factors had an indirect and positive effect on habitat quality through climatic factors and soil physical properties (Figure 4). The path coefficient of topographic factors on climatic factors was obviously greater than that of soil physical properties. The HFI contributed indirectly to habitat quality through its effects on climatic and soil factors. In 2015 and 2018, the HFI directly negatively affected habitat quality. Climatic factors exerted an indirect positive influence on habitat quality by regulating soil properties. Moreover, climate negatively affected habitat quality in 2000 (−0.0872), 2005 (−0.0835), 2010 (−0.0951), and 2015 (−0.0981). Soil chemistry properties always had positive effects on habitat quality, with path coefficients of 0.3298, 0.3127, 0.3347, 0.3231, and 0.3093 (p < 0.001) for each period (Figure 4). Notably, the impact coefficient of soil chemical properties on habitat quality was higher than that of soil physical properties.
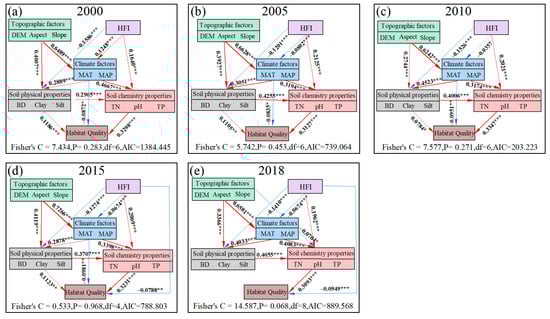
Figure 4.
Structural equation modeling paths for relevant factors and habitat quality in high-level zones in (a) 2000, (b) 2005, (c) 2010, (d) 2015, and (e) 2018 (red and blue arrows indicate significant positive and negative paths between variables, respectively. Dashed lines indicate non-significant paths. Path widths are proportional to path coefficients, * p < 0.05, ** p < 0.01, *** p < 0.001).
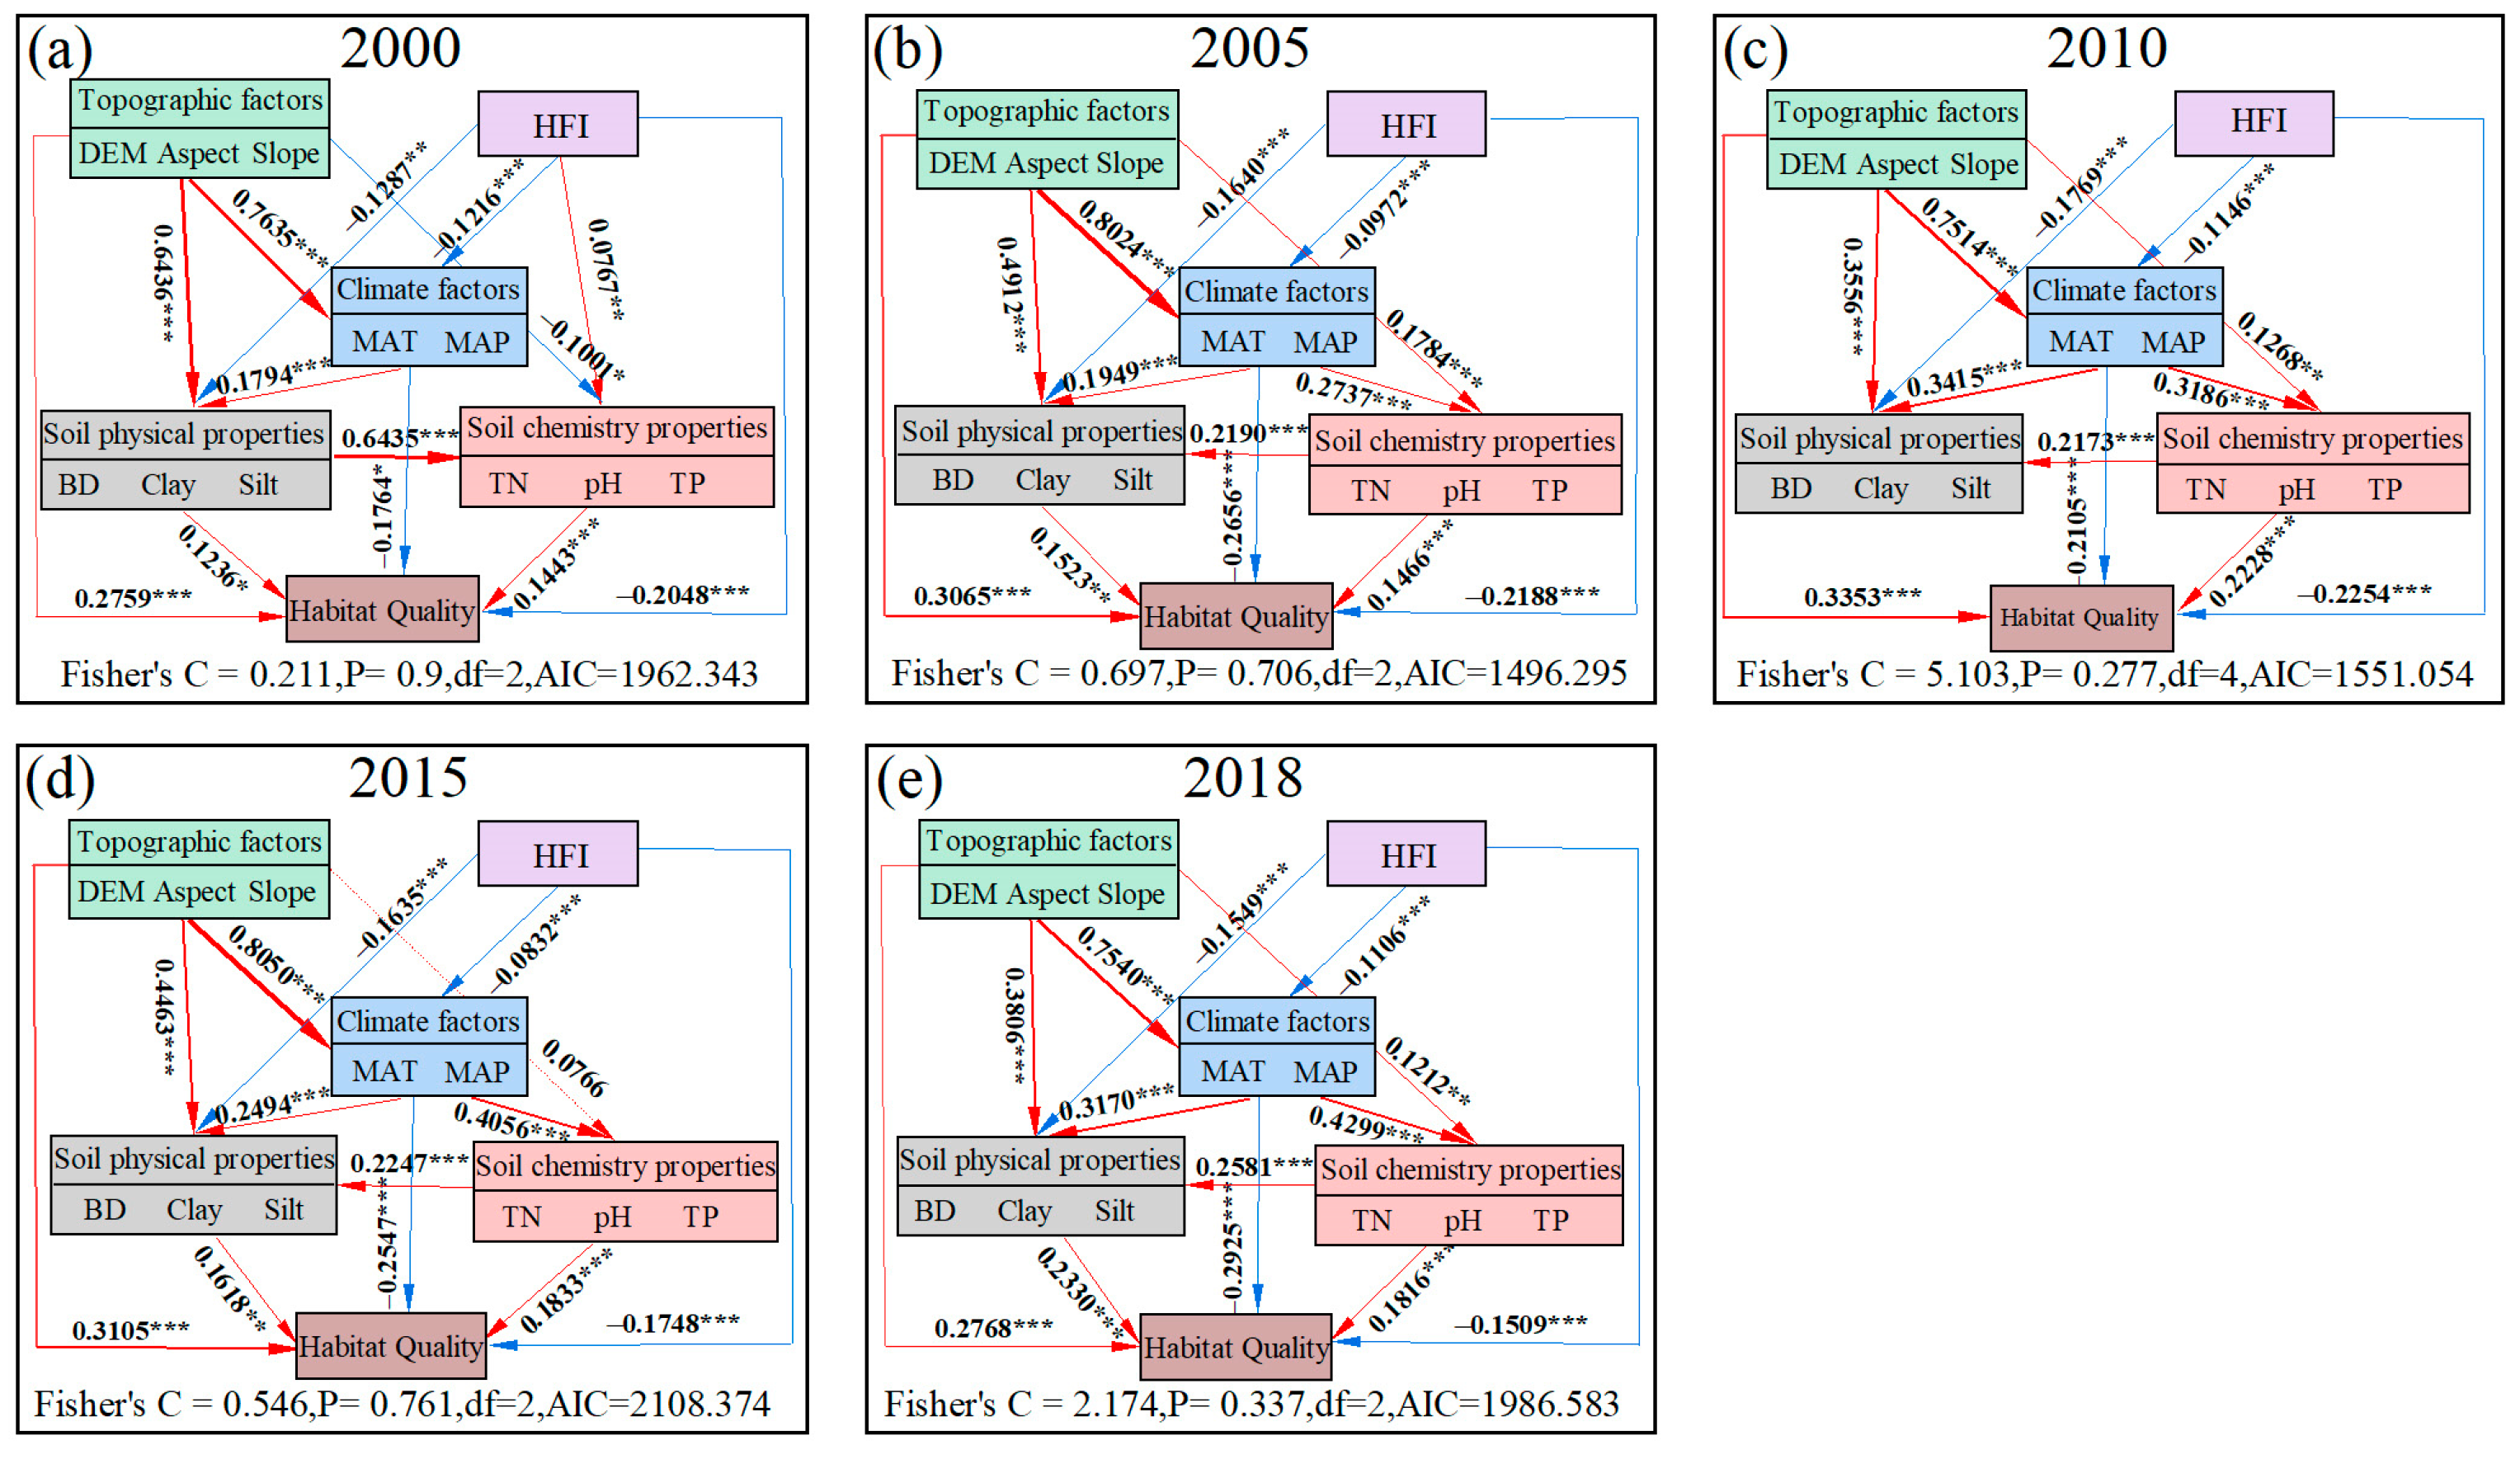
In the medium-level zones, the results demonstrated that topographic factors exerted two obvious influence paths on habitat quality from 2000 to 2018. One had a positive effect on habitat quality (β = 0.2759, 0.3065, 0.3353, 0.3105, and 0.2768, p < 0.001). Another had an indirect and positive effect through climate and soil (Figure 5). The HFI had direct negative impacts on habitat quality, with path coefficients of −0.2048, −0.2188, −0.2254, −0.1748, and −0.1509, respectively (p < 0.001), and indirectly inhibited habitat quality through adverse effects on climate and soil physical properties. In addition, climate had a direct and negative influence pathway from 2000 to 2018, with path coefficients of −0.1764 (p < 0.05), −0.2656 (p < 0.001), −0.2105 (p < 0.001), −0.2547 (p < 0.001), and −0.2925 (p < 0.001), respectively (Figure 5).
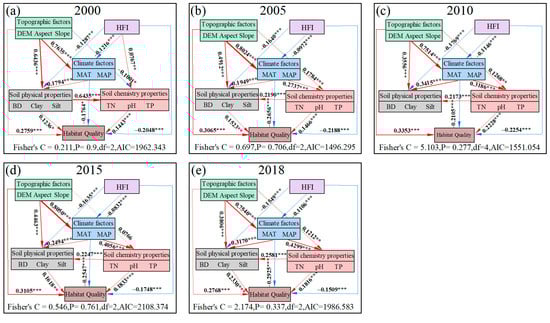
Figure 5.
Structural equation modeling paths for relevant factors and habitat quality in medium-level zones in (a) 2000, (b) 2005, (c) 2010, (d) 2015, and (e) 2018 (red and blue arrows indicate significant positive and negative paths between variables, respectively. Dashed lines indicate non-significant paths. Path widths are proportional to path coefficients, * p < 0.05, ** p < 0.01, *** p < 0.001).
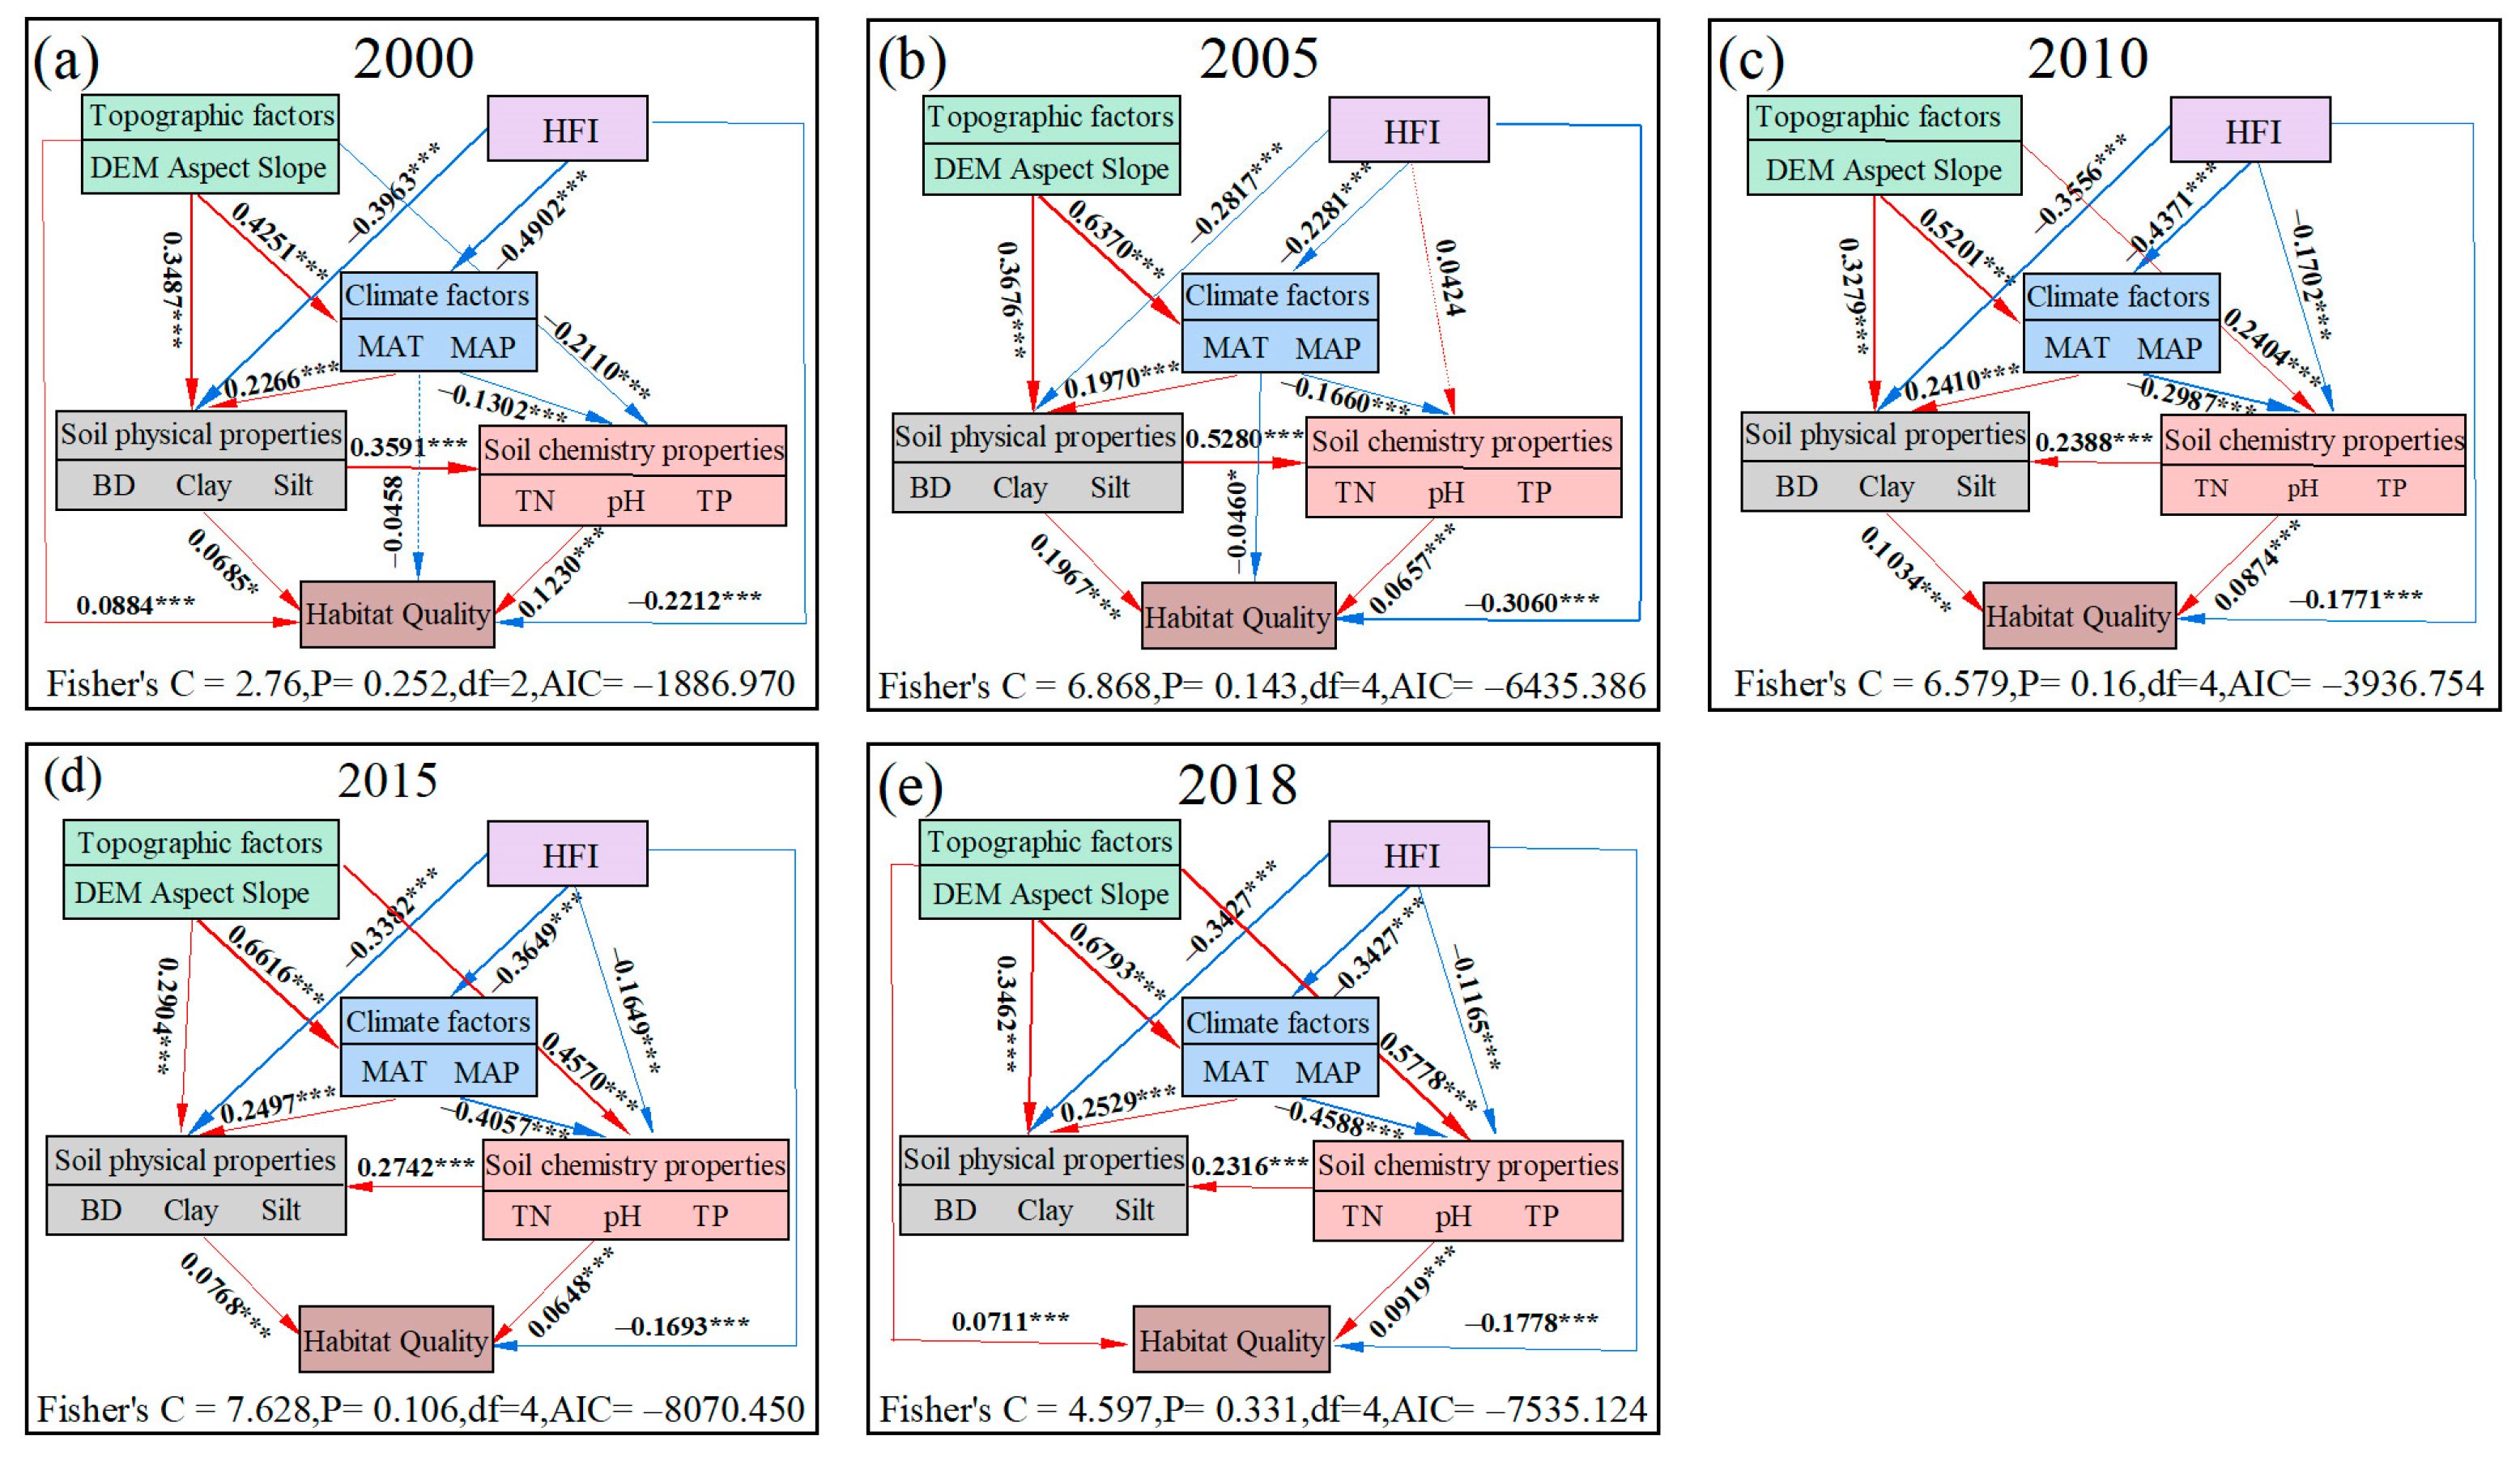
In the low-level zones, topographic factors primarily had an indirect and positive effect on habitat quality through their effects on climatic factors and soil physical properties. In 2000 and 2018, topographic factors had a weak direct positive effect on habitat quality (Figure 6). Climatic factors in this region indirectly affected habitat quality by increasing soil physical properties and inhibiting soil chemical properties. In addition, we can observe that the influence of human activities in this range is more significant than other factors. There are two observable paths, one indirectly affected habitat quality by influencing climatic factors and soil physical properties, and another directly affected habitat quality, both of which displayed negative impacts and had significant impact coefficients (β = −0.2212, −0.3060, −0.1771, −0.1693, and −0.1778, p < 0.001) (Figure 6).
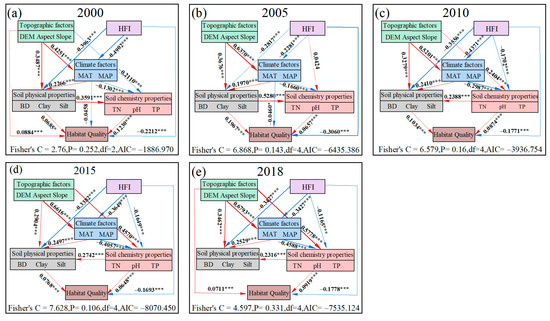
Figure 6.
Structural equation modeling paths for relevant factors and habitat quality in low-level zones in (a) 2000, (b) 2005, (c) 2010, (d) 2015, and (e) 2018 (red and blue arrows indicate significant positive and negative paths between variables, respectively. Dashed lines indicate non-significant paths. Path widths are proportional to path coefficients, * p < 0.05, *** p < 0.001).
4. Discussion
4.1. Spatiotemporal Patterns of Habitat Quality
As a key means to understand ecological conditions, habitat quality assessment significantly contributes to sustainable development and ecological security. The exploration of habitat quality patterns provides valuable guidance for regional ecological planning and biodiversity conservation in the NSPB [59]. A previous study has suggested that threat factors to habitat quality incorporate construction land, desert, and cropland [45]. We demonstrated that habitat quality in NSPB was generally low (the proportion of low-level zones is 54.10%, 53.95%, 51.88%, 52.03%, and 52.11% in the five periods, respectively). The land type dominated by deserts was the most crucial factor that severely threatened environmental conditions in the NSPB. Habitat quality of the NSPB exhibited an escalating trend from 2000 to 2018, but the range remained as fluctuating (Table 2). This finding is consistent with existing research [7], which suggested that it is primarily related to the extreme ecological environment or periodic irrational human activities. In addition, there was a high degree of consistency in the distribution of habitat quality and land type (Figure 2) [60], which is in accordance with the findings obtained by Mu et al. [61] and Bi et al. [28]. Therefore, future ecological restoration efforts should place emphasis on the low-level zones and adopt more biological conservation and land restoration strategies.
4.2. Drivers of Habitat Quality Patterns
One of the motivators that promote the formation of and change in habitat quality patterns is the external environment [20]. In this study, we comprehensively consider the driving forces of multiple factors on habitat quality at a regional scale. Topographic factors can represent the geomorphic features of the NSPB, reflecting the accessibility of human activities to some extent. Habitat quality was positively correlated with the DEM and Slope (Figure S2) [2]. Soil properties can regulate habitat quality through feedback that affects plant composition and community structure [62,63]. Across three levels, soil pH and BD were found to be negatively related to habitat quality, while soil TN was positively correlated with habitat quality (Figure S4). Those sensitive soil quality indicators (e.g., soil pH, TN, and BD) adjusted plant nutrient absorption, soil element dissolution, and microbial community diversity, which jointly regulate ecosystem function and stability [64,65,66,67]. BRT models showed that MAT had the most considerable contribution to the habitat quality in high-level zones, which largely support previous findings [40]. Conversely, habitat quality in our study is significantly negatively correlated with MAT (Figure S3). The reason may be that temperature conditions in the NSPB exceed the optimum value for plant growth [11,68]. Temperature changes directly affect the metabolic processes and growth rates of plants, influencing the ecological environment quality by altering plant habitability [69]. In addition, it was demonstrated that human activities were negatively correlated with habitat quality (Figure S5) and their contributions were higher in the low-level zones (Figure 3), which is extremely similar to a previous study [26]. The above findings suggest that human activities are essential drivers of variations in regional habitat quality [27]. Irrational human behavior can destroy the original ecological conditions and accelerate the deterioration of regional habitat quality [11].
4.3. The Driving Paths of Habitat Quality Patterns
Except for exploring the drivers of habitat quality patterns, capturing the driving pathways is vital to understanding the complex ecological mechanisms. This study innovatively uses SEM models to explore the direct and indirect pathways of climate, soil, topography, and human activities on habitat quality. The findings indicate that these factors have not only direct influences on habitat quality distribution but also indirectly affect such distribution by impacting other factors. Our study found that topographic factors directly and positively influenced habitat quality in the medium-level zones across five periods (β = 0.2759, 0.3065, 0.3353, 0.3105, and 0.2768, respectively) (Figure 5), indicating that topography has a strong influence on medium habitats dominated by farmland [70,71]. Moreover, our SEMs revealed that topography indirectly affected the habitat quality through soil physical properties and climate factors, while soil chemical properties directly affected the habitat quality. The influence coefficient of soil chemical properties in the high-level zones was higher than other factors across five periods (β = 0.3298, 0.3127, 0.3347, 0.3231, and 0.3093, respectively) (Figure 4). Environmental conditions have critical long-term effects on soil, while both topography and climate are closely related to soil variations [72,73]. Soil chemical properties may vary greatly by different land use types [24,65,74]. Therefore, the significance of soil chemical properties for the habitat quality should not be ignored. In land use development activities, attention should be paid to the destruction of soil conditions and variation in soil chemical indicators to realize the sustainable development of ecological resources.
Furthermore, the responses of habitat quality to climate change should also be a focus in arid regions. We found that climate favorably mainly affected habitat quality by regulating the soil physical and chemical properties (Figure 4, Figure 5 and Figure 6). Climate conditions influence landscape patterns, such as altering soil element concentration or moisture [64,75]. Notably, climate conditions had direct negative effects on habitat quality, and the influence pathway coefficients were higher in medium-level zones than in high-level zones across five periods (β = −0.1764, −0.2656, −0.2105, −0.2547, and −0.2925, respectively). Current climate conditions are increasingly unfavorable to habitat quality, attributed to global change and extreme weather (e.g., drought) [76,77].
Our SEMs exhibited that HFI had a direct negative influence on habitat quality, which was extremely similar to the linear mixed model results. Human activities not only directly affect the habitat quality but also indirectly impact through soil and climate (Figure 4, Figure 5 and Figure 6). Mechanisms of anthropogenic impacts on habitat quality are incredibly complex, involving various dynamic processes [29,31,78]. Many studies have reported various ecological projects, such as the “Three-North Shelter Forest Program”, “The Grain for Green Program”, and “The Beijing-Tianjin Sand Source Control Project”, which actively contribute to the environmental ecosystem in northern China [79,80,81]. Obviously, human activities can regulate the development of ecosystems in a benign direction under a strict ecological protection policy. In other words, economic development can be compatible with ecological protection.
4.4. Limitations and Outlooks
Achieving effective management of the ecological environment in the arid regions of northern China is a complicated and critical research topic. Prior studies mainly focused on how land use patterns affect variations in habitat quality, while the driving mechanism of natural and anthropogenic factors on habitat quality still needs to be clarified. This study extensively examined the spatiotemporal changes in habitat quality over the past 18 years in NSPB, and adopted multiple ecological factors to identify the drivers and influence pathways of variations in habitat quality by incorporating the natural environment and human activities into the comprehensive analysis framework, so as to better grasp the modulation of habitat quality in response to multiple factors and make up for the shortcomings of quantitative analyses in existing studies. This study has essential roles in promoting the sustainable and balanced advancement of the regional economy, society, and environment. The current database data used in this study may have accuracy limitations. In the future, more measured and observed data should be integrated to optimize the model.
Considering the complexity of the regional ecosystem, the evaluation indexes of ecological environment quality exhibit diversity. Future studies should explore how abiotic (e.g., wind, light, and nitrogen deposition) and biotic (e.g., species interactions, seed dispersal, and alien invasion) factors jointly affect habitat quality and analyze the intrinsic mechanisms of ecosystem responses to global changes. In addition, factors affecting habitat quality in different regions are often different. In the future, ecological assessment data with a regional dimension can be specifically selected, and the research framework can be extended to other regional studies with important ecological value.
5. Conclusions
This study puts forward an innovative research framework in investigating the effects of the natural environment, human activities, and their interactions on habitat quality. By assembling an integrated database including climate, soil, topography, human activities, and land use, the InVEST model, BRT model, and SEM model were applied to investigate habitat quality patterns and driving mechanisms in the NSPB. The conclusions are as follows:
(1) The habitat quality within NSPB was comparatively low, showing an upward trend from 2000 to 2018. During the study periods, the low-level and medium-level habitats tended to develop into high-level habitats, while the level of habitat quality remained as fluctuating. This result suggests that ecological conditions in the NSPB are gradually improved, but the potential risk of habitat degradation remains.
(2) Over most periods, habitat quality showed a significant correlation with the topography, climate, soil factors, and human activities, but was independent of Aspect. Across five periods, MAT and HFI were the most important for habitat quality in the high- and low-level zones, respectively, while there were period differences in the ordering of factor contributions in the middle-level zones.
(3) Focusing on the driving pathways of habitat quality variations, we found that soil chemical properties, topography, and human activities had the greatest direct influence on habitat quality of high-, medium-, and low-level zones, respectively. Habitat quality was enhanced via the soil chemical properties and topography while it was decreased via human activities. The indirect pathways showed that climate enhanced the positive effects of soil factors on habitat quality, while topographic and human activities mainly influenced habitat quality indirectly through climate and soil factors.
In conclusion, our study further indicates that climate, topographic, and soil conditions are fundamental to maintaining ecosystem stability, while human activities are a significant threat to habitat quality within NSPB. In the background of accelerated global change and human activities, habitat quality within NSPB is still improved, which suggests that the implementation of ecological projects makes a positive contribution to habitat quality in northern China. Sustained ecological projects can effectively contribute to restoring natural ecosystems and curb the negative effects of global change.
Supplementary Materials
The following supporting information can be downloaded at: https://www.mdpi.com/article/10.3390/su16041508/s1, Table S1: Habitat threat factors. Table S2: Sensitivity of land use types to the threat factors. Figure S1: Variable correlations and interactions from 2000 to 2018 (* p < =0.05). Figure S2: Relationship between topographic factors and habitat quality at three levels of habitat quality (blue, yellow, and green respectively indicate different levels of habitat quality: high, medium, and low. The solid line indicates the significance of the fitted regression line, dashed line indicates non-significance. Gray shading indicates 95% confidence intervals. The sample size is N). Figure S3: Relationship between climate factors and habitat quality at three levels of habitat quality (blue, yellow, and green respectively indicate different levels of habitat quality: high, medium, and low. The solid line indicates the significance of the fitted regression line, dashed line indicates non-significance. Gray shading indicates 95% confidence intervals. The sample size is N). Figure S4: Relationship between soil factors and habitat quality at three levels of habitat quality (blue, yellow, and green respectively indicate different levels of habitat quality: high, medium, and low. The solid line indicates the significance of the fitted regression line, dashed line indicates non-significance. Gray shading indicates 95% confidence intervals. The sample size is N). Figure S5: Relationship between human activities and habitat quality at three levels of habitat quality (blue, yellow, and green respectively indicate different levels of habitat quality: high, medium, and low. The solid line indicates the significance of the fitted regression line, dashed line indicates non-significance. Gray shading indicates 95% confidence intervals. The sample size is N).
Author Contributions
Conceptualization, H.Z. (Huayong Zhang); methodology, H.Z. (Huayong Zhang); software, J.Z.; validation, H.Z. (Huayong Zhang), H.Z. (Hengchao Zou) and Z.W.; formal analysis, J.Z.; writing—original draft preparation, H.Z. (Huayong Zhang), J.Z. and H.Z. (Hengchao Zou); writing—review and editing, H.Z. (Huayong Zhang), J.Z., H.Z. (Hengchao Zou), Z.W., X.J., S.Z. and Z.L.; visualization, J.Z.; supervision, H.Z. (Huayong Zhang), H.Z. (Hengchao Zou); funding acquisition, H.Z. (Huayong Zhang) All authors have read and agreed to the published version of the manuscript.
Funding
This research was funded by National Water Pollution Control and Treatment Science and Technology Major Project (2017ZX07101) and the Discipline Construction Program of Huayong Zhang, Distinguished Professor of Shandong University, School of Life Sciences (61200082363001).
Data Availability Statement
All links to input data are reported in the manuscript and all output data are available upon request to the authors.
Conflicts of Interest
The authors declare no conflicts of interest.
References
- Thomas, E.; Jansen, M.; Chiriboga-Arroyo, F.; Wadt, L.H.O.; Corvera-Gomringer, R.; Atkinson, R.J.; Bonser, S.P.; Velasquez-Ramirez, M.G.; Ladd, B. Habitat Quality Differentiation and Consequences for Ecosystem Service Provision of an Amazonian Hyperdominant Tree Species. Front. Plant Sci. 2021, 12, 621064. [Google Scholar] [CrossRef] [PubMed]
- Xiao, P.; Zhou, Y.; Li, M.; Xu, J. Spatiotemporal patterns of habitat quality and its topographic gradient effects of Hubei Province based on the InVEST model. Environ. Dev. Sustain. 2023, 25, 6419–6448. [Google Scholar] [CrossRef]
- Riedler, B.; Lang, S. A spatially explicit patch model of habitat quality, integrating spatio-structural indicators. Ecol. Indic. 2018, 94, 128–141. [Google Scholar] [CrossRef]
- Yohannes, H.; Soromessa, T.; Argaw, M.; Dewan, A. Spatio-temporal changes in habitat quality and linkage with landscape characteristics in the Beressa watershed, Blue Nile basin of Ethiopian highlands. J. Environ. Manag. 2021, 281, 111885. [Google Scholar] [CrossRef] [PubMed]
- Vellend, M.; Lilley, P.L.; Starzomski, B.M. Using subsets of species in biodiversity surveys. J. Appl. Ecol. 2008, 45, 161–169. [Google Scholar] [CrossRef]
- Jing, Y.; Zhang, F.; He, Y.; Kung, H.-T.; Johnson, V.C.; Arikena, M. Assessment of spatial and temporal variation of ecological environment quality in Ebinur Lake Wetland National Nature Reserve, Xinjiang, China. Ecol. Indic. 2020, 110, 105874. [Google Scholar] [CrossRef]
- Chen, A.; Yang, X.; Guo, J.; Xing, X.; Yang, D.; Xu, B. Synthesized remote sensing-based desertification index reveals ecological restoration and its driving forces in the northern sand-prevention belt of China. Ecol. Indic. 2021, 131, 108230. [Google Scholar] [CrossRef]
- Dias-Silva, K.; Vieira, T.B.; de Matos, T.P.; Juen, L.; Simião-Ferreira, J.; Hughes, R.M.; De Marco Júnior, P. Measuring stream habitat conditions: Can remote sensing substitute for field data? Sci. Total Environ. 2021, 788, 147617. [Google Scholar] [CrossRef]
- Zhang, Z.; Fan, Y.; Jiao, Z. Wetland ecological index and assessment of spatial-temporal changes of wetland ecological integrity. Sci. Total Environ. 2023, 862, 160741. [Google Scholar] [CrossRef]
- Free, G.; Bresciani, M.; Trodd, W.; Tierney, D.; O’Boyle, S.; Plant, C.; Deakin, J. Estimation of lake ecological quality from Sentinel-2 remote sensing imagery. Hydrobiologia 2020, 847, 1423–1438. [Google Scholar] [CrossRef]
- Xiao, Y.; Ouyang, Z.; Wang, L.; Rao, E.; Jiang, L.; Zhang, L. Spatial patterns of ecosystem quality in Inner Mongolia and its driving forces analysis. Acta Ecol. Sin. 2016, 36, 6019–6030. [Google Scholar] [CrossRef]
- Wu, J.; Luo, J.; Zhang, H.; Qin, S.; Yu, M. Projections of land use change and habitat quality assessment by coupling climate change and development patterns. Sci. Total Environ. 2022, 847, 157491. [Google Scholar] [CrossRef]
- Wei, Q.; Abudureheman, M.; Halike, A.; Yao, K.; Yao, L.; Tang, H.; Tuheti, B. Temporal and spatial variation analysis of habitat quality on the PLUS-InVEST model for Ebinur Lake Basin, China. Ecol. Indic. 2022, 145, 109632. [Google Scholar] [CrossRef]
- Wang, Z.; Huang, C.; Li, L.; Lin, Q. Ecological zoning planning and dynamic evaluation coupled with Invest-HFI-Plus model:A case study in Bortala Mongolian Autonomous Prefecture. Acta Ecol. Sin. 2022, 42, 5789–5798. [Google Scholar]
- Berta Aneseyee, A.; Noszczyk, T.; Soromessa, T.; Elias, E. The InVEST Habitat Quality Model Associated with Land Use/Cover Changes: A Qualitative Case Study of the Winike Watershed in the Omo-Gibe Basin, Southwest Ethiopia. Remote Sens. 2020, 12, 1103. [Google Scholar] [CrossRef]
- Moreira, M.; Fonseca, C.; Vergílio, M.; Calado, H.; Gil, A. Spatial assessment of habitat conservation status in a Macaronesian island based on the InVEST model: A case study of Pico Island (Azores, Portugal). Land Use Policy 2018, 78, 637–649. [Google Scholar] [CrossRef]
- Hack, J.; Molewijk, D.; Beißler, M.R. A Conceptual Approach to Modeling the Geospatial Impact of Typical Urban Threats on the Habitat Quality of River Corridors. Remote Sens. 2020, 12, 1345. [Google Scholar] [CrossRef]
- Li, T.; Bao, R.; Li, L.; Tang, M.; Deng, H. Temporal and Spatial Changes of Habitat Quality and Their Potential Driving Factors in Southwest China. Land 2023, 12, 346. [Google Scholar] [CrossRef]
- Dong, J.; Zhang, Z.; Liu, B.; Zhang, X.; Zhang, W.; Chen, L. Spatiotemporal variations and driving factors of habitat quality in the loess hilly area of the Yellow River Basin: A case study of Lanzhou City, China. J. Arid Land 2022, 14, 637–652. [Google Scholar] [CrossRef]
- Zhang, Y.; She, J.; Long, X.; Zhang, M. Spatio-temporal evolution and driving factors of eco-environmental quality based on RSEI in Chang-Zhu-Tan metropolitan circle, central China. Ecol. Indic. 2022, 144, 109436. [Google Scholar] [CrossRef]
- Zhang, X.; Liao, L.; Xu, Z.; Zhang, J.; Chi, M.; Lan, S.; Gan, Q. Interactive Effects on Habitat Quality Using InVEST and GeoDetector Models in Wenzhou, China. Land 2022, 11, 630. [Google Scholar] [CrossRef]
- Chen, T.; Feng, Z.; Zhao, H.; Wu, K. Identification of ecosystem service bundles and driving factors in Beijing and its surrounding areas. Sci. Total Environ. 2020, 711, 134687. [Google Scholar] [CrossRef]
- Willy, D.K.; Muyanga, M.; Mbuvi, J.; Jayne, T. The effect of land use change on soil fertility parameters in densely populated areas of Kenya. Geoderma 2019, 343, 254–262. [Google Scholar] [CrossRef]
- Seaton, F.M.; Barrett, G.; Burden, A.; Creer, S.; Fitos, E.; Garbutt, A.; Griffiths, R.I.; Henrys, P.; Jones, D.L.; Keenan, P.; et al. Soil health cluster analysis based on national monitoring of soil indicators. Eur. J. Soil Sci. 2021, 72, 2414–2429. [Google Scholar] [CrossRef]
- Liang, X.; Yuan, L.; Ning, L.; Song, C.; Cheng, C.; Wang, X. Spatial pattern of habitat quality and driving factors in Heilongjiang Province. J. Beijing Norm. Univ. (Nat. Sci.) 2020, 56, 864–872. [Google Scholar] [CrossRef]
- Zhao, Y.; Qu, Z.; Zhang, Y.; Ao, Y.; Han, L.; Kang, S.; Sun, Y. Effects of human activity intensity on habitat quality based on nighttime light remote sensing: A case study of Northern Shaanxi, China. Sci. Total Environ. 2022, 851, 158037. [Google Scholar] [CrossRef] [PubMed]
- Luan, Y.; Huang, G.; Zheng, G.; Wang, Y. Correlation between Spatio-Temporal Evolution of Habitat Quality and Human Activity Intensity in Typical Mountain Cities: A Case Study of Guiyang City, China. Int. J. Environ. Res. Public Health 2022, 19, 14294. [Google Scholar] [CrossRef] [PubMed]
- Bi, X.; Chang, B.; Hou, F.; Yang, Z.; Fu, Q.; Li, B. Assessment of Spatio-Temporal Variation and Driving Mechanism of Ecological Environment Quality in the Arid Regions of Central Asia, Xinjiang. Int. J. Environ. Res. Public Health 2021, 18, 7111. [Google Scholar] [CrossRef] [PubMed]
- Tang, J.; Zhou, L.; Dang, X.; Hu, F.; Yuan, B.; Yuan, Z.; Wei, L. Impacts and predictions of urban expansion on habitat quality in the densely populated areas: A case study of the Yellow River Basin, China. Ecol. Indic. 2023, 151, 110320. [Google Scholar] [CrossRef]
- Hu, J.; Zhang, J.; Li, Y. Exploring the spatial and temporal driving mechanisms of landscape patterns on habitat quality in a city undergoing rapid urbanization based on GTWR and MGWR: The case of Nanjing, China. Ecol. Indic. 2022, 143, 109333. [Google Scholar] [CrossRef]
- Bai, L.; Xiu, C.; Feng, X.; Liu, D. Influence of urbanization on regional habitat quality:a case study of Changchun City. Habitat Int. 2019, 93, 102042. [Google Scholar] [CrossRef]
- Xu, D.; Ding, X. Assessing the impact of desertification dynamics on regional ecosystem service value in North China from 1981 to 2010. Ecosyst. Serv. 2018, 30, 172–180. [Google Scholar] [CrossRef]
- Wang, X.; Li, Y.; Chu, B.; Liu, S.; Yang, D.; Luan, J. Spatiotemporal Dynamics and Driving Forces of Ecosystem Changes: A Case Study of the National Barrier Zone, China. Sustainability 2020, 12, 6680. [Google Scholar] [CrossRef]
- Ma, S.; Wang, H.; Wang, L.; Jiang, J.; Gong, J.; Wu, S.; Luo, G. Evaluation and simulation of landscape evolution and its ecological effects under vegetation restoration in the northern sand prevention belt, China. Catena 2022, 218, 106555. [Google Scholar] [CrossRef]
- Koutroulis, A.G. Dryland changes under different levels of global warming. Sci. Total Environ. 2019, 655, 482–511. [Google Scholar] [CrossRef] [PubMed]
- Huang, J.; Yu, H.; Guan, X.; Wang, G.; Guo, R. Accelerated dryland expansion under climate change. Nat. Clim. Chang. 2016, 6, 166–171. [Google Scholar] [CrossRef]
- Liu, J.; Xie, Z.; Wang, Q.; Wang, T.; Zheng, X.; Song, L.; Li, X. The construction and optimization of ecological security pattern in the eastern part of the sand prevention belt in Northern China. Chin. J. Ecol. 2021, 40, 3412–3423. [Google Scholar] [CrossRef]
- Li, X.; Song, L.; Xie, Z.; Gao, T.; Wang, T.; Zheng, X.; Liu, J.; Liu, L. Assessment of Ecological Vulnerability on Northern Sand Prevention Belt of China Based on the Ecological Pressure–Sensibility–Resilience Model. Sustainability 2021, 13, 6078. [Google Scholar] [CrossRef]
- Chen, A.; Yang, X.; Guo, J.; Zhang, M.; Xing, X.; Yang, D.; Xu, B.; Jiang, L. Dynamic of land use, landscape, and their impact on ecological quality in the northern sand-prevention belt of China. J. Environ. Manag. 2022, 317, 115351. [Google Scholar] [CrossRef] [PubMed]
- Wang, J.; Chen, G.; Yuan, Y.; Fei, Y.; Xiong, J.; Yang, J.; Yang, Y.; Li, H. Spatiotemporal changes of ecological environment quality and climate drivers in Zoige Plateau. Environ. Monit. Assess. 2023, 195, 912. [Google Scholar] [CrossRef]
- Ahmadi Mirghaed, F.; Souri, B. Relationships between habitat quality and ecological properties across Ziarat Basin in northern Iran. Environ. Dev. Sustain. 2021, 23, 16192–16207. [Google Scholar] [CrossRef]
- Shang, J.; Zhang, Y.; Peng, Y.; Huang, Y.; Zhu, L.; Wu, Z.; Wang, J.; Cui, Y. Climate change drives NDVI variations at multiple spatiotemporal levels rather than human disturbance in Northwest China. Environ. Sci. Pollut. Res. Int. 2022, 29, 13782–13796. [Google Scholar] [CrossRef]
- Yang, J.; Huang, X. The 30m annual land cover dataset and its dynamics in China from 1990 to 2019. Earth Syst. Sci. Data 2021, 13, 3907–3925. [Google Scholar] [CrossRef]
- Mu, H.; Li, X.; Wen, Y.; Huang, J.; Du, P.; Su, W.; Miao, S.; Geng, M. A global record of annual terrestrial Human Footprint dataset from 2000 to 2018. Sci. Data 2022, 9, 176. [Google Scholar] [CrossRef]
- Tang, F.; Fu, M.; Wang, L.; Zhang, P. Land-use change in Changli County, China: Predicting its spatio-temporal evolution in habitat quality. Ecol. Indic. 2020, 117, 106719. [Google Scholar] [CrossRef]
- Feng, S.; Liu, X.; Zhao, W.; Yao, Y.; Zhou, A.; Liu, X.; Pereira, P. Key Areas of Ecological Restoration in Inner Mongolia Based on Ecosystem Vulnerability and Ecosystem Service. Remote Sens. 2022, 14, 2729. [Google Scholar] [CrossRef]
- Shui, Y.; Lu, H.; Wang, H.; Yan, Y.; Wu, G. Assessment of habitat quality on the basis of land cover and NDVI changes in Lhasa River Basin. Acta Ecol. Sin. 2018, 38, 8946–8954. [Google Scholar] [CrossRef]
- Graham, M.H. Confronting multicollinearity in ecological multiple regression. Ecology 2003, 84, 2809–2815. [Google Scholar] [CrossRef]
- Kim, J.H. Multicollinearity and misleading statistical results. Korean J. Anesthesiol. 2019, 72, 558–569. [Google Scholar] [CrossRef] [PubMed]
- Zhang, Y.; Xu, X.; Li, Z.; Liu, M.; Xu, C.; Zhang, R.; Luo, W. Effects of vegetation restoration on soil quality in degraded karst landscapes of southwest China. Sci. Total Environ. 2019, 650, 2657–2665. [Google Scholar] [CrossRef]
- R Core Team. R: A Language and Environment for Statistical Computing; R Foundation for Statistical Computing: Vienna, Austria, 2023; Available online: https://www.R-project.org/ (accessed on 2 July 2023).
- Bates, D.; Mächler, M.; Bolker, B.; Walker, S. Fitting Linear Mixed-Effects Models Using lme4. J. Stat. Softw. 2015, 67, 1–48. [Google Scholar] [CrossRef]
- Elith, J.; Leathwick, J.R.; Hastie, T. A working guide to boosted regression trees. J. Anim. Ecol. 2008, 77, 802–813. [Google Scholar] [CrossRef] [PubMed]
- Sherman, C.S.; Simpfendorfer, C.A.; Pacoureau, N.; Matsushiba, J.H.; Yan, H.F.; Walls, R.H.L.; Rigby, C.L.; VanderWright, W.J.; Jabado, R.W.; Pollom, R.A.; et al. Half a century of rising extinction risk of coral reef sharks and rays. Nat. Commun. 2023, 14, 15. [Google Scholar] [CrossRef] [PubMed]
- Tian, P.; Liu, S.; Zhao, X.; Sun, Z.; Yao, X.; Niu, S.; Crowther, T.W.; Wang, Q. Past climate conditions predict the influence of nitrogen enrichment on the temperature sensitivity of soil respiration. Commun. Earth Environ. 2021, 2, 251. [Google Scholar] [CrossRef]
- Bezabih Beyene, B.; Li, J.; Yuan, J.; Dong, Y.; Liu, D.; Chen, Z.; Kim, J.; Kang, H.; Freeman, C.; Ding, W. Non-native plant invasion can accelerate global climate change by increasing wetland methane and terrestrial nitrous oxide emissions. Glob. Chang. Biol. 2022, 28, 5453–5468. [Google Scholar] [CrossRef] [PubMed]
- Lefcheck, J.S. piecewiseSEM: Piecewise structural equation modelling in r for ecology, evolution, and systematics. Methods Ecol. Evol. 2016, 7, 573–579. [Google Scholar] [CrossRef]
- Tian, P.; Zhao, X.; Liu, S.; Sun, Z.; Jing, Y.; Wang, Q. Soil microbial respiration in forest ecosystems along a north-south transect of eastern China: Evidence from laboratory experiments. Catena 2022, 211, 105980. [Google Scholar] [CrossRef]
- Sun, X.; Jiang, Z.; Liu, F.; Zhang, D. Monitoring spatio-temporal dynamics of habitat quality in Nansihu Lake basin, eastern China, from 1980 to 2015. Ecol. Indic. 2019, 102, 716–723. [Google Scholar] [CrossRef]
- He, J.; Huang, J.; Li, C. The evaluation for the impact of land use change on habitat quality: A joint contribution of cellular automata scenario simulation and habitat quality assessment model. Ecol. Model. 2017, 366, 58–67. [Google Scholar] [CrossRef]
- Mu, S.; Yang, H.; Li, J.; Chen, Y.; Gang, C.; Zhou, W.; Ju, W. Spatio-temporal dynamics of vegetation coverage and its relationship with climate factors in Inner Mongolia, China. J. Geogr. Sci. 2013, 23, 231–246. [Google Scholar] [CrossRef]
- Lynch, J.P.; Clair, S.B.S. Mineral stress: The missing link in understanding how global climate change will affect plants in real world soils. Field Crops Res. 2004, 90, 101–115. [Google Scholar] [CrossRef]
- Hobbie, S.E. Plant species effects on nutrient cycling: Revisiting litter feedbacks. Trends Ecol. Evol. 2015, 30, 357–363. [Google Scholar] [CrossRef]
- Ren, H.; Zhou, Q.; He, J.; Hou, Y.; Jiang, Y.; Rodrigues, J.L.M.; Cobb, A.B.; Wilson, G.W.T.; Hu, J.; Zhang, Y. Determining landscape-level drivers of variability for over fifty soil chemical elements. Sci. Total Environ. 2019, 657, 279–286. [Google Scholar] [CrossRef]
- Raiesi, F.; Salek-Gilani, S. Development of a soil quality index for characterizing effects of land-use changes on degradation and ecological restoration of rangeland soils in a semi-arid ecosystem. Land Degrad. Dev. 2020, 31, 1533–1544. [Google Scholar] [CrossRef]
- Meng, C.; Liu, H.; Wang, Y.; Li, Y.; Zhou, J.; Zhou, P.; Liu, X.; Li, Y.; Wu, J. Response of regional agricultural soil phosphorus status to net anthropogenic phosphorus input (NAPI) determined by soil pH value and organic matter content in subtropical China. Chemosphere 2018, 200, 487–494. [Google Scholar] [CrossRef]
- Kozlowski, T.T. Soil Compaction and Growth of Woody Plants. Scand. J. For. Res. 1999, 14, 596–619. [Google Scholar] [CrossRef]
- Fatima, Z.; Ahmed, M.; Hussain, M.; Abbas, G.; Ul-Allah, S.; Ahmad, S.; Ahmed, N.; Ali, M.A.; Sarwar, G.; Haque, E.u.; et al. The fingerprints of climate warming on cereal crops phenology and adaptation options. Sci. Rep. 2020, 10, 18013. [Google Scholar] [CrossRef]
- Zuo, L.; Gao, J. Quantitative attribution analysis of NPP in Karst peak cluster depression based on geographical detector. Ecol. Environ. Sci. 2020, 29, 686–694. [Google Scholar] [CrossRef]
- Xiang, Q.; Kan, A.; Yu, X.; Liu, F.; Huang, H.; Li, W.; Gao, R. Assessment of Topographic Effect on Habitat Quality in Mountainous Area Using InVEST Model. Land 2023, 12, 186. [Google Scholar] [CrossRef]
- Huang, M.; Yue, W.; Feng, S.; Zhang, J. Spatial-temporal evolution of habitat quality and analysis of landscape patterns in Dabie Mountain area of west Anhui province based on InVEST model. Acta Ecol. Sin. 2020, 40, 2895–2906. [Google Scholar] [CrossRef]
- Simpson, A.H.; Richardson, S.J.; Laughlin, D.C. Soil–climate interactions explain variation in foliar, stem, root and reproductive traits across temperate forests. Glob. Ecol. Biogeogr. 2016, 25, 964–978. [Google Scholar] [CrossRef]
- Ren, H.; Gui, W.; Bai, Y.; Stein, C.; Rodrigues, J.L.M.; Wilson, G.W.T.; Cobb, A.B.; Zhang, Y.; Yang, G. Long-term effects of grazing and topography on extra-radical hyphae of arbuscular mycorrhizal fungi in semi-arid grasslands. Mycorrhiza 2018, 28, 117–127. [Google Scholar] [CrossRef]
- Li, Y.; Ma, J.; Li, Y.; Jia, Q.; Shen, X.; Xia, X. Spatiotemporal variations in the soil quality of agricultural land and its drivers in China from 1980 to 2018. Sci. Total Environ. 2023, 892, 164649. [Google Scholar] [CrossRef] [PubMed]
- Seneviratne, S.I.; Corti, T.; Davin, E.L.; Hirschi, M.; Jaeger, E.B.; Lehner, I.; Orlowsky, B.; Teuling, A.J. Investigating soil moisture–climate interactions in a changing climate: A review. Earth-Sci. Rev. 2010, 99, 125–161. [Google Scholar] [CrossRef]
- Sun, T.; Yang, Y.; Wang, Z.; Yong, Z.; Xiong, J.; Ma, G.; Li, J.; Liu, A. Spatiotemporal variation of ecological environment quality and extreme climate drivers on the Qinghai-Tibetan Plateau. J. Mt. Sci. 2023, 20, 2282–2297. [Google Scholar] [CrossRef]
- Nicolè, F.; Dahlgren, J.P.; Vivat, A.; Till-Bottraud, I.; Ehrlén, J. Interdependent effects of habitat quality and climate on population growth of an endangered plant. J. Ecol. 2011, 99, 1211–1218. [Google Scholar] [CrossRef]
- Qi, Y.; Lian, X.; Wang, H.; Zhang, J.; Yang, R. Dynamic mechanism between human activities and ecosystem services: A case study of Qinghai lake watershed, China. Ecol. Indic. 2020, 117, 106528. [Google Scholar] [CrossRef]
- Niu, Q.; Xiao, X.; Zhang, Y.; Qin, Y.; Dang, X.; Wang, J.; Zou, Z.; Doughty, R.B.; Brandt, M.; Tong, X.; et al. Ecological engineering projects increased vegetation cover, production, and biomass in semiarid and subhumid Northern China. Land Degrad. Dev. 2019, 30, 1620–1631. [Google Scholar] [CrossRef]
- Lu, F.; Hu, H.; Sun, W.; Zhu, J.; Liu, G.; Zhou, W.; Zhang, Q.; Shi, P.; Liu, X.; Wu, X.; et al. Effects of national ecological restoration projects on carbon sequestration in China from 2001 to 2010. Proc. Natl. Acad. Sci. USA 2018, 115, 4039–4044. [Google Scholar] [CrossRef] [PubMed]
- Han, B.; Ouyang, Z.; Liu, H.; Cui, Z.; Lu, Z.; Crittenden, J. Courtyard integrated ecological system: An ecological engineering practice in China and its economic-environmental benefit. J. Clean. Prod. 2016, 133, 1363–1370. [Google Scholar] [CrossRef]

Disclaimer/Publisher’s Note: The statements, opinions and data contained in all publications are solely those of the individual author(s) and contributor(s) and not of MDPI and/or the editor(s). MDPI and/or the editor(s) disclaim responsibility for any injury to people or property resulting from any ideas, methods, instructions or products referred to in the content. |
© 2024 by the authors. Licensee MDPI, Basel, Switzerland. This article is an open access article distributed under the terms and conditions of the Creative Commons Attribution (CC BY) license (https://creativecommons.org/licenses/by/4.0/).