Article

Risk Assessment and Attribution Analysis of Potentially Toxic Elements in Soil of Dongdagou, Baiyin, Gansu Province, China

1
College of Geography and Environmental Science, Northwest Normal University, Lanzhou 730050, China
2
The Third Institute of Geology and Mineral Exploration and Development, Gansu Bureau of Geology and Mineral Exploration and Development, Lanzhou 730050, China
*
Authors to whom correspondence should be addressed.
Sustainability 2024, 16(4), 1689; https://doi.org/10.3390/su16041689
Submission received: 21 January 2024 / Revised: 9 February 2024 / Accepted: 17 February 2024 / Published: 19 February 2024
(This article belongs to the Section Environmental Sustainability and Applications)

Abstract

:
Analyzing the cause is crucial for recognizing the risks associated with potentially harmful substances found in soil, such as toxic elements. These substances can have adverse effects on both the ecological environment and human health, as they can migrate and transform within food chain networks. Therefore, it is imperative to address and prioritize the risks associated with these elements. Dongdagou, Baiyin City, Gansu Province, is a typical area of potentially toxic element pollution in farmland soil, which has attracted much attention and urgently needs to be controlled. Therefore, the main objective of this investigation is to analyze the concentrations of As, Cd, Pb, Hg, Cu, and Zn in the agricultural soil found in Dongdagou. Using statistical analysis, ecological and human health risk, principal component analysis, and the PMF model, we found that (1) there are varying degrees of accumulation in the soil in the study area, with Cu being the main component. (2) The soil in the study area has high and extremely high concentrations of Cd, posing significant risks. On the other hand, Hg presents mild and medium risks. However, there are no risks associated with As, Pb, Cu, and Zn. Overall, the ecological risks in the study area’s soil due to potentially toxic elements are predominantly extremely high (49.65%) and high (38.25%). A small proportion of the soil exhibits low risks (2.76%) and medium risks (9.33%). (3) As has a moderate acceptable carcinogenic risk for local residents, Cd has a moderate acceptable carcinogenic risk for local children, and other potentially toxic elements do not have carcinogenic or non-carcinogenic risks. (4) The source analysis shows that Cd in the soil in the study area mainly comes from agricultural activities and sewage irrigation, As mainly comes from industrial production, and Zn, Cu, Pb, and Hg are multiple sources. We recommend adopting targeted and differentiated safety utilization and control measures based on the pollution level and potential risks of potentially toxic elements in the research area, combined with the sources of potentially toxic elements.

1. Introduction

The rapid growth of industrialization and urbanization has led to increasingly severe levels of soil pollution from potentially harmful elements. This has become a critical environmental concern for mankind. A report points out that 16.1% of farmland soil in China is polluted [1], and the main pollutant is potentially toxic elements. Pure land is the key to clean food. Potentially toxic elements are stable, and excessive accumulation of potential pollutants in cultivated soil can reduce the absorption of nutrients by crops and even affect their growth and development. As a result, their accumulation in agricultural products can harm the ecological environment and human health through food webs and chains. According to previous research [2], it has been confirmed that various human illnesses can be caused by potentially harmful substances. Direct exposure to high levels of chromium can lead to increased skin sensitivity and a higher risk of cancer [3], while excessive intake of Pb can cause damage to the nervous and immune systems [4]. Extensive research conducted by both domestic and international scholars has evaluated and traced the pollution of potentially toxic elements in farmland soil. Their findings indicate varying degrees of such pollution in certain countries and regions [5,6]. In Iran, multiple provinces have encountered As pollution, which poses significant ecological hazards and a potential carcinogenic risk to human health [7]. Similarly, in eastern Ethiopia, the presence of potentially toxic elements in farmland soil also presents a carcinogenic risk to human health [8]. The accumulation of solid waste from coking plants has led to severe excessive potentially toxic elements in the surrounding soil, pollution, and damage to vegetation, posing significant risks to the local environment and the health of residents [9]. The assessment of soil pollution levels, ecological impact, and health hazards associated with potentially toxic elements is of utmost importance. It is essential to carry out a scientific evaluation and conduct traceability identification to effectively address this matter. At present, the methods for evaluating the ecological and human health risks of potentially toxic elements mainly include traditional evaluation models, comprehensive evaluation models, and the National Environmental Protection Agency (USEPA) inhalation risk model. Traditional evaluation models mainly include the quotient method and the potential ecological risk hazard index method. The quotient method is the biological exposure divided by the degree of effect. Compared with the potential ecological risk hazard index method, it does not have the ability to predict future risks [6]. The comprehensive evaluation model cannot clearly reflect the risk formation mechanism and influencing factors, while the potential ecological risk index method uses quantitative methods to divide the potential harm level of potentially toxic elements. The USEPA inhalation risk assessment model has higher sensitivity and can quantify the degree of harm based on the level of risk [10]. Principal component analysis and Positive Matrix Factorization can effectively identify the sources and contribution rates of potentially toxic elements in soil. Fang [11] used correlation analysis and the PMF model to determine the source apportionment of potentially toxic elements in the soil of the Huang-shui River Basin, and Jiang [12] used the PMF model combined with self-organizing maps to analyze the source of potentially toxic elements in the surface soil and farmland of human activity intensive areas.
Therefore, the risk assessment of potentially toxic elements in local farmland soil and the combination of different source apportionment methods to trace pollutants play a crucial role in the protection of local farmland. The purpose of this study is to (1) identify the degree of soil potentially toxic element pollution, ecological risks, and human health risks in the study area, (2) analyze the pathways and sources of soil potentially toxic element risks and pollutants in the research area, and (3) based on risk assessment, propose targeted control measures to provide a scientific basis for the safe utilization of farmland soil.

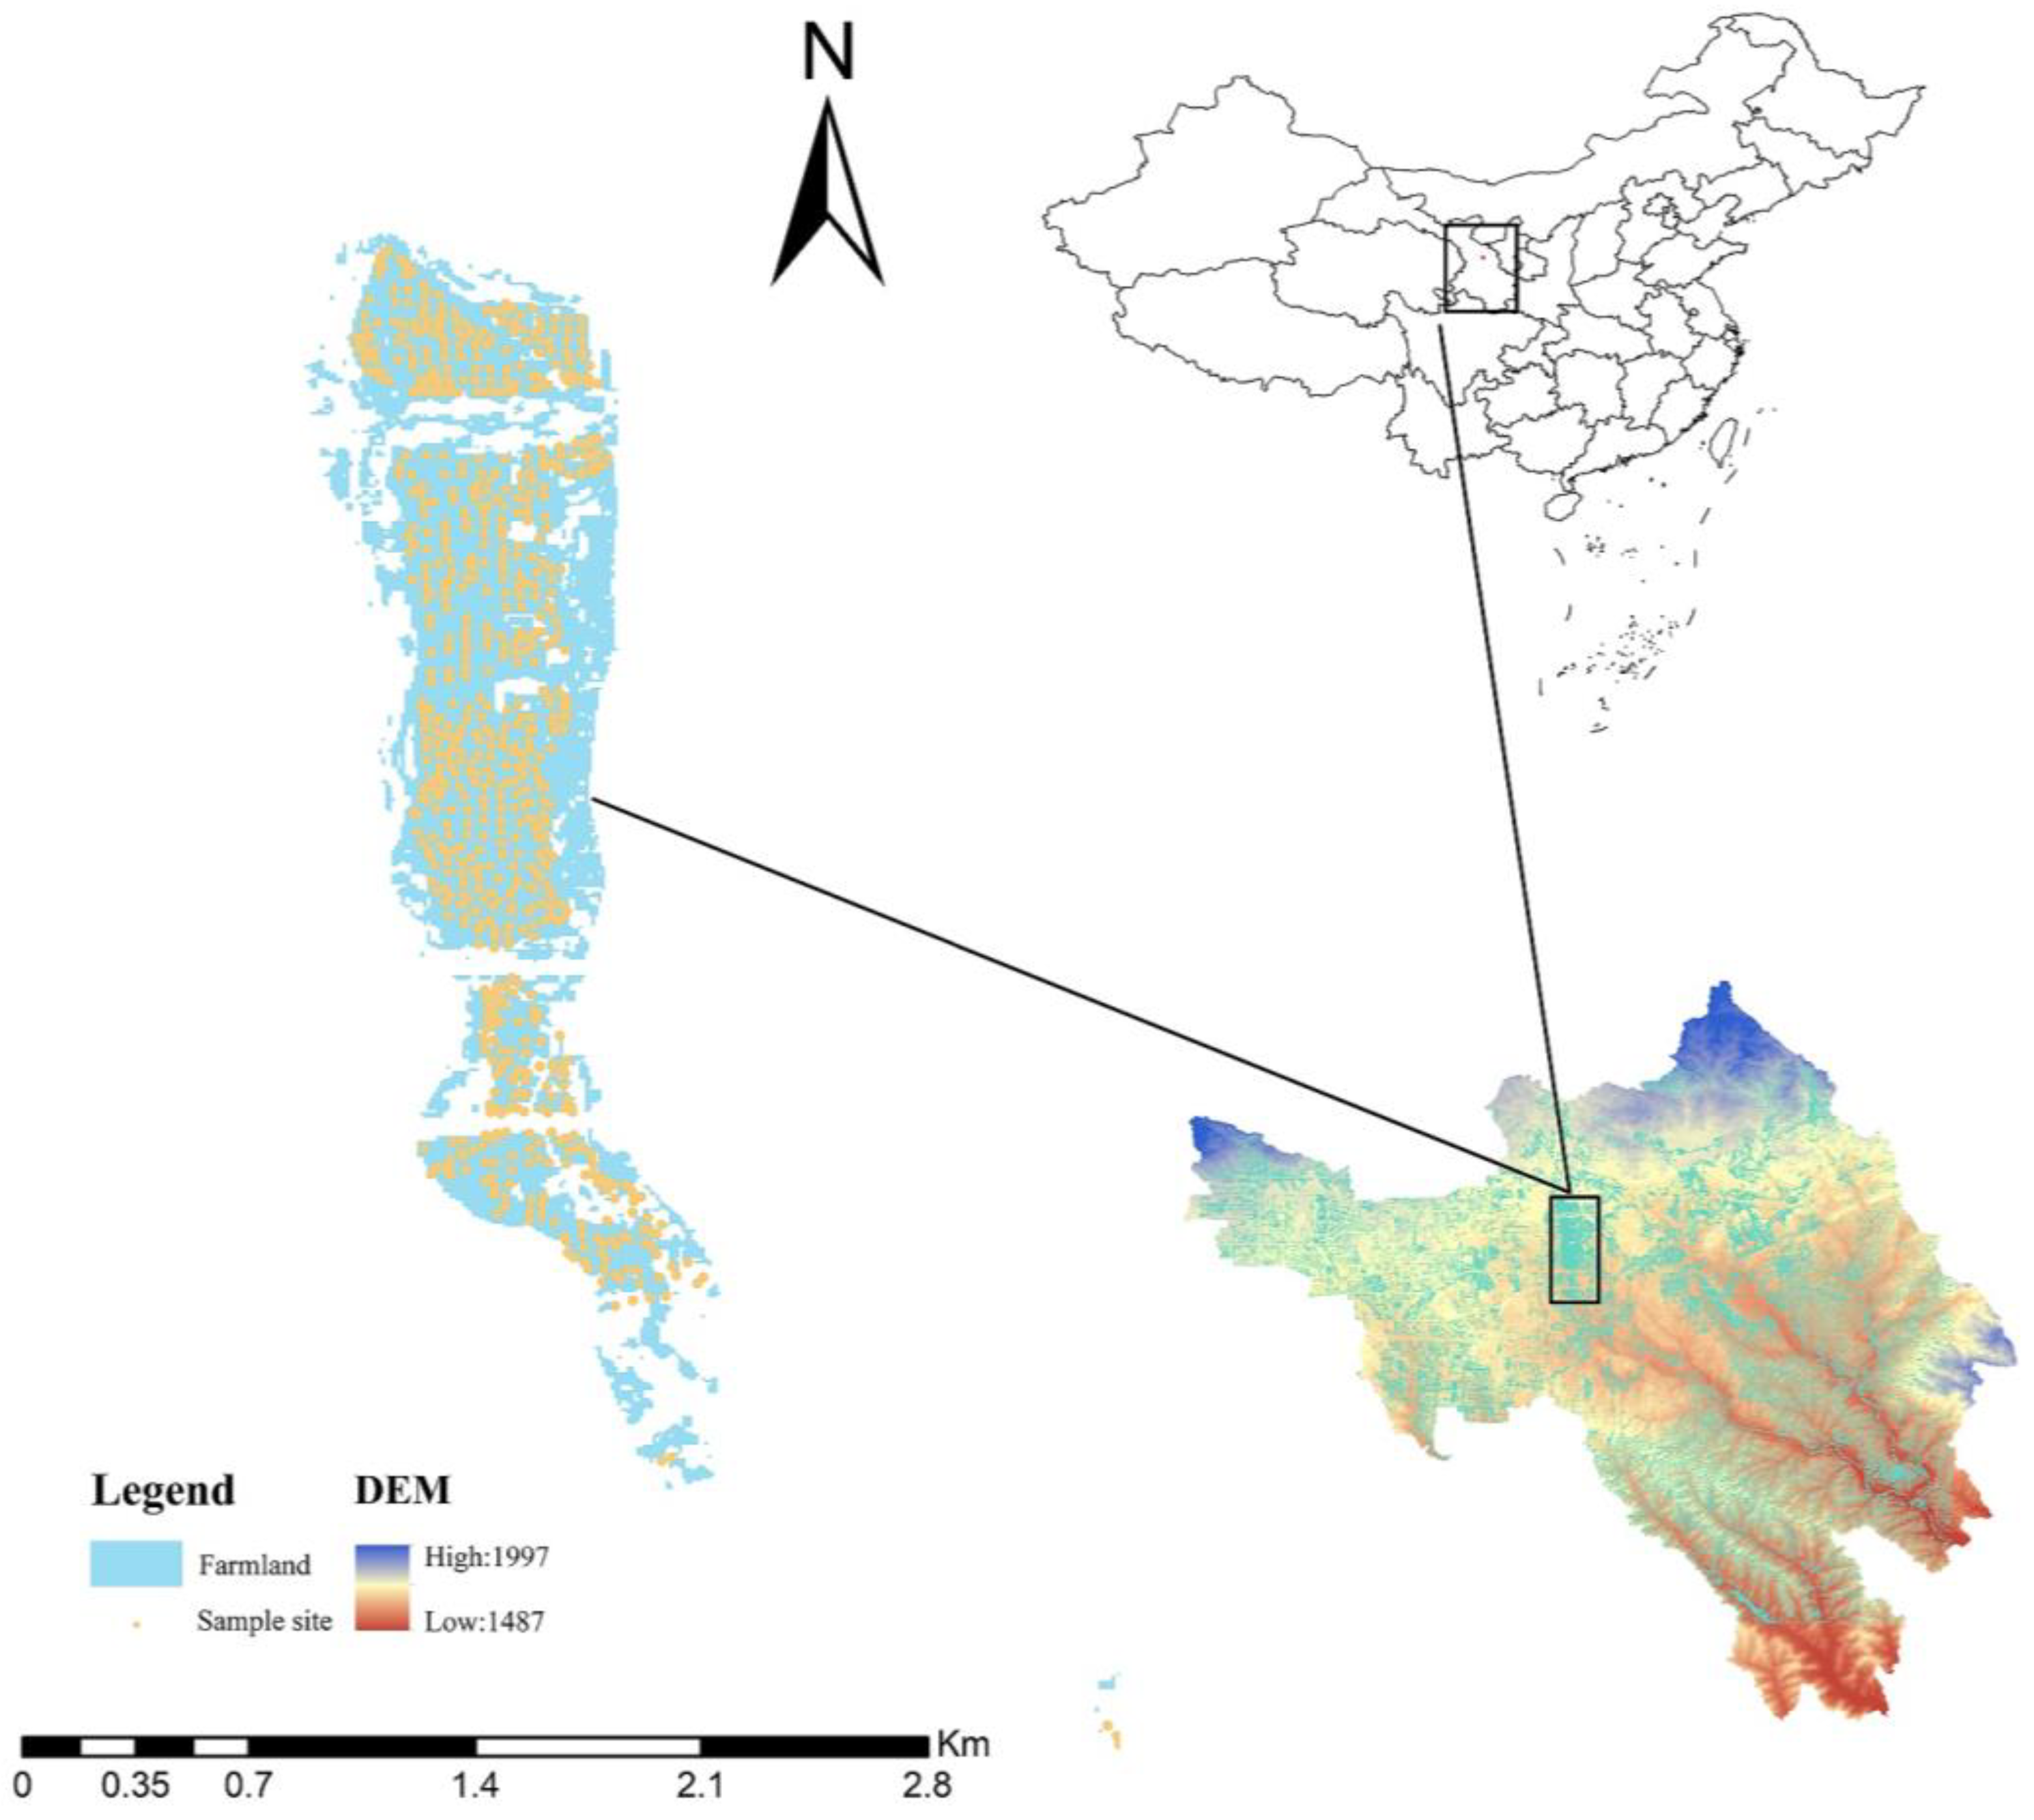
2. Overview of the Study Area

The study area, known as Tong City, is located in Dongdagou, Baiyin Basin. It spans from 104°12′42″ to 104°12′49″ E and from 36°30′41″ to 36°33′45″ N, covering a vast area of 1.32 × 10⁶ m2. Tong City is situated at the crossroads of the northwest region of China, the upper reaches of the Yellow River, the central part of Gansu Province, and the provinces of Shanxi, Gansu, Ningxia, and Qinghai. It has a total landmass of 21,200 km2 and a population of approximately 1.5546 million individuals [13]. The region experiences an arid to semi-arid continental climate with an annual precipitation range between 176 and 498 mm and an annual evaporation range of 1488–2295 mm. The prevailing wind direction in this area is typically from the northeast. Additionally, the study area is predominantly characterized by a calcareous soil composition [14] (Figure 1). Baiyin City is situated in the arid region of the upper Yellow River, serving as a hub for the extraction of non-ferrous metals such as copper, lead, zinc, and their respective minerals. Mining and resource-based industrialization have promoted the development of silver, but due to improper treatment of the “three wastes (industrial wastewater, exhaust gas, and solid waste)” [15], serious damage has been caused to the water and soil environment. At present, research on potentially toxic elements in Baiyin City mainly focuses on the degree, distribution pattern, and sources of potentially toxic element pollution in the surface soil of farmland [16,17].

3. Research Method

3.1. Sample Point Layout

A survey was conducted on farmland in Dongdagou, and 8 disconnected farmlands were selected as sampling points [18]. The arrangement of collection points for farmland soil samples adhered to the guidelines outlined in “Technical Specifications for Soil Environmental Monitoring” (HJ/T166-2004) [19]. A grid measuring 200 m × 200 m was established, utilizing ArcGIS 10.2 and Local Space Viewer software (http://www.locaspace.cn/LSV.jsp), based on remote sensing image interpretation and field investigations. A total of 869 sampling points were strategically positioned to assess surface soil characteristics and pollution levels within the study area (refer to Figure 1).

3.2. Sample Collection and Analysis

3.2.1. Sample Collection

Between 28 June and 14 July 2017, soil samples were meticulously collected at depths ranging from 0.00 to 1.50 m. This sampling took place during a period of negligible precipitation to ensure sample purity. Utilizing satellite navigation, sample points were precisely identified with a maximum fixed-point error of less than 50 m. Using the “five-point sampling method” within a 3 × 3 m area, soil mixtures were gathered at each point. The procedure involved drilling a 1.5 m hole, extracting soil in contact with the drill using a wooden shovel, and subsequently bagging the samples. Consistency was maintained by gathering 1500 g from each of the five points, thoroughly mixing them, and dividing the composite sample into four parts.
Upon transportation to the laboratory, soil samples were air-dried according to the standards outlined in the “Code for Geochemical Evaluation of Land Quality” (DZ/T 0295-2016) [20]. Subsequently, they were rolled with a wooden hammer, purified to remove impurities, ground uniformly, and sieved through a 2 mm nylon sieve. Any unsieved soil particles underwent further grinding and sieving until achieving complete sample homogeneity. Following sieving, the sample underwent thorough mixing and sealing for future analysis. Another portion of the sample was passed through a 0.15 mm nylon sieve, meticulously mixed, and sealed for subsequent investigations.

3.2.2. Sample Analysis

The determination of soil pH adhered to the guidelines stipulated in “Determination of pH in Soil” (NY/T1377-2007) [21]. To assess the levels of total mercury, total arsenic, and total Pb in soil quality, we collected a 0.2 g soil sample that had been sieved through a 2 mm sieve. Afterward, we meticulously transferred this sample into a 50 mL colorimetric cylinder. The sample was moistened with a small amount of water, followed by the addition of 10 mL of aqua regia (consisting of a 1:3:4 ratio of concentrated nitric acid to concentrated hydrochloric acid to water). The mixture was vigorously shaken and then digested in a boiling water bath for 2 h. After cooling, 10 mL of preservation solution (composed of 0.5 g potassium dichromate dissolved in water, 50 mL nitric acid, and diluted to 1000 mL) was added, reaching the mark with dilution solution (0.2 g potassium dichromate dissolved in water, added with 28 mL sulfuric acid, and diluted to 1000 mL). Post-mixing and clarification, the arsenic, mercury, and lead contents were directly determined using atomic fluorescence spectroscopy.
In accordance with “Determination of 12 Metal Elements in Soil and Sediments: Aqua regia Extraction and Inductively Coupled Plasma Mass Spectrometry” (HJ803-2016) [22], the content of Cd, Cu, and Zn in the soil underwent analysis using Inductively Coupled Plasma Mass Spectrometry (ICP-MS). Here, 250 mL of soil that passed a 0.15 mm sieve was placed in a 30 mL polytetrahedral crucible, moistened with water droplets, and treated with 2 mL of nitric acid, 10 mL of hydrofluoric acid, and 2 mL of perchloric acid. Evaporation occurred on a 200 °C electric heating plate until perchloric acid produced smoke, followed by adjustment to 260 °C until the smoke dissipated. Further treatment involved the addition of 82 mL of aqua regia, evaporating to 2–3 mL, washing the glass with deionized water, and heating for 5–10 min. After cooling, the solution was transferred to a labeled polyethylene tube, diluted, and shaken for clarity. Subsequently, a 1.00 mL aliquot was taken, diluted with 10% nitric acid to 10.0 mL, and analyzed for Cd, Cu, and Zn content.
Quality control measures included setting up two blank experiments for every 50 samples, ensuring a measurement value below the detection limit of the method (0.08–0.12 μg·L−1). Additionally, a national first-class standard substance (GBW07404-GSS-4) [23] with a recovery rate requirement of 90% to 110% was inserted per batch. Standard series concentrations, exceeding six and covering sample concentration values with a correlation coefficient above 0.999, were established for analysis.

3.3. Risk Evaluation

3.3.1. Ecological and Environmental Risks

In this study, we use the ecological hazard index method, which was initially introduced by Hakanson, a renowned Swedish scientist, in 1980. Our objective is to evaluate the potential risks associated with toxic elements in the soil of agricultural land within our specific research area.
C f i = C d i / C r i
where in Formula (1), Cfi represents the pollution coefficient of potentially toxic element i; Cdi represents the measured content of potentially toxic element i in the sample, mg/kg; and Cri is the environmental background value of potentially toxic element i in the soil of Gansu Province [14], mg/kg.
E r i = T r i × C r i
R I = i = 1 m E r i
In Formula (2), Eir represents the potential ecological hazard coefficient of the i-th potentially toxic element.
In Formula (3), RI represents the potential ecological hazard risk index of multiple potentially toxic elements and Tir represents the toxicity coefficient of the i-th potentially toxic element [24,25]. The classification criteria for potential ecological risks are shown in Table 1.

3.3.2. Human Health Risks

This article refers to the human health risk model and standards proposed by the United States Environmental Protection Agency (US EPA) to evaluate the human health risk of potentially toxic elements in soil and farmland in the study area [26]:
A D D i n g = C × I n g R × E F × E D B W × A T × 10 6
A D D i n h = C × I n g h R × E F × E D P F × B W × A T
A D D d e r m = C × S A × S L × A B E × E F × E D B W × A T × 10 6
where ADDing, ADDinh, and ADDderm represent the daily doses of potentially toxic elements ingested through the mouth, breath, and skin, respectively, mg·(kg·d)−1; C represents the content of a certain potentially toxic element in the soil, mg·kg−1; IngR represents the daily intake rate; and InhR represents the daily absorption rate. EF represents exposure frequency; ED represents the duration of exposure; BW represents average body weight; AT represents the average duration; PF represents the particulate matter release factor; SA represents the area of skin exposure; and SL represents skin adhesion factor. ABE represents skin absorption factor [27]. The reference values are shown in Table 2.
The carcinogenic and non-carcinogenic effects of potentially toxic elements in soil on human health are calculated as follows:
H Q i = A D D i j / R f D i j
H I = H Q i = A D D i j / R f D i j
C R = C R i = A D D i j × S F i j
where HI represents the non-carcinogenic risk index for multiple substances or multiple exposure modes of a substance, dimensionless; HQi represents the non-carcinogenic risk index of potentially toxic element i, dimensionless; ADDij represents the daily average exposure level of the jth exposure pathway of non-carcinogenic potentially toxic element i, mg·(kg·d)−1; ADDij represents the daily average exposure level of the j-th exposure pathway of carcinogenic potentially toxic element i, mg·(kg·d)−1; RfDij represents the reference dose for the j-th exposure pathway of non-carcinogenic potentially toxic elements, mg·(kg·d)−1; CR represents the total carcinogenic risk index of multiple substances under one or more exposure pathways; and CRi represents the carcinogenic risk index of a substance under multiple exposure pathways. SFij represents the slope coefficient of the j-th exposure pathway of carcinogenic potentially toxic element i, dimensionless (Table 3). In order to more clearly express the carcinogenic risk of potentially toxic elements in the study area, this article uses the differential method to subdivide the carcinogenic risk of potentially toxic elements in soil (Table 4) [26,27,28].

3.4. Attribution Analysis Method

3.4.1. Principal Component Analysis

Principal component analysis (PCA) uses correlation analysis and analysis of variance to recombine multiple variables that previously had certain connections into a smaller set of new variables. The latter carries information about the original variables and can explain the relationship between the original variables. To determine whether the Kaiser–Meyer–Olkin (KMO) and Bartlett sphericity test data can be used for principal component analysis: when the KMO values are 0–1, and if KMO > 0.6, principal component analysis can be performed on the relevant data. On the contrary, principal component analysis is not suitable. The Bartlett sphericity test needs to reject the original hypothesis (p > 0.05) [29]. The principal component is extracted from the original variable based on the principle that the eigenvalues are greater than 1.

3.4.2. Positive Matrix Factorization

Although principal component analysis can qualitatively identify the sources of potentially toxic elements in the study area, it cannot quantitatively analyze the contribution rate of their source component spectra. To investigate the sources of various potentially harmful components in the examined region, this research utilizes the Positive Definite Matrix Factor Analysis (PMF) model recommended by the United States Environmental Protection Agency (USEPA). EPA PMF 5.0 software is used to deconstruct the dataset from the research area and obtain the factor contribution and distribution matrices [30] as follows:
X i j = k = 1 p G i k × F i k + E i j
Q = i = 1 n j = 1 m E i j / U i j
U i j = 5 / 6 × M D L   c M D L δ × c 2 + M D L 2   c > M D L
where X is the potentially toxic elements content matrix of the sample variety. The source contribution matrix is denoted as G. F represents the source component spectral matrix. E is the residual matrix. Q refers to the objective function defined by the PMF model, and when the Q value approximates the dataset’s degree of freedom, it signifies an excellent fitting effect. U signifies uncertainty, whereas MDL indicates the detection limit. On the other hand, δ denotes the relative standard deviation. c is the content of potentially toxic elements; i represents the i-th sample out of n samples; j represents the jth potentially toxic elements among m potentially toxic elements; and k represents the k-th potential source among p potential sources.
We set 2–3 factors and performed 100 iterations. When the number of factors was 2, the Q value was the smallest, and all six potentially toxic elements showed “strong” results, with all residuals between −3 and 3. The fitting curve R2 of the predicted and measured values of the model was greater than 0.5, indicating that it had good fitting results and could better explain the information provided by the initial data.

3.5. Data Processing

This study used SPASS Statistics 25 for data processing and Origin 2022 for correlation analysis and graphic production. Interpolation analysis was performed on Arcmap 10.7. The EPA PMF 5.0 model was used to analyze and plot the contribution rate.

4. Results

4.1. Characteristics of Potentially Toxic Element Content in the Soil

Table 5 shows that the average content of As, Cu, Hg, and Pb in the 1.00–1.50 m soil layer of Dongdagou farmland in Baiyin City is the highest, while the average content of Cd and Zn in the 0.50–1.00 m soil layer is the highest, which are 1.65 ± 0.64 (1.35–1.65), 18.88 ± 9.44 (10.05–18.88), 2.72 ± 2.77 (1.59–2.72), 3.51 ± 1.46 (1.89–3.51), 4.09 ± 1.84 (3.09–4.09), and 2.37 ± 0.62 (1.86–2.37) times the background value of the soil in Gansu Province, respectively. The average contents of As, Cu, Hg, Pb, Cd, and Zn in each soil layer were 1.45 ± 0.50 (0.82–4.32), 13.80 ± 8.50 (1.58–43.60), 1.89 ± 1.14 (0.88–8.19), 3.07 ± 1.24 (0.73–8.04), 3.64 ± 1.32 (1.32–8.56), and 2.13 ± 0.76 (1.09–6.03) times higher than the background values of soil in Gansu Province [14], respectively, indicating that the contents of all six metals in the farmland soil of Dongdagou in Baiyin City are higher than the soil background value (Figure 2).
In terms of the vertical distribution of potentially toxic elements in soil, As, Cu, and Pb all have the highest mean concentrations at depths of 1–1.5 m, while Cd and Zn have the highest mean concentrations at depths of 0–1.0 m. This indicates that except for Hg, which hardly changes with depth, the concentrations of other potentially toxic elements increase with soil depth. This may be due to the much lower content of Hg in the soil compared with the other potentially toxic elements.
The farmland in the research area displays significant variability (>100%) in the Cu content at a depth of 1.0–1.5 m, indicating that human activities are the main influencing factor. The other elements show moderate variation (10–100%), suggesting that human activities have a strong impact on the potentially toxic elements found in the farmland soil within the study area.

4.2. Potentially Toxic Element Risk in the Soil

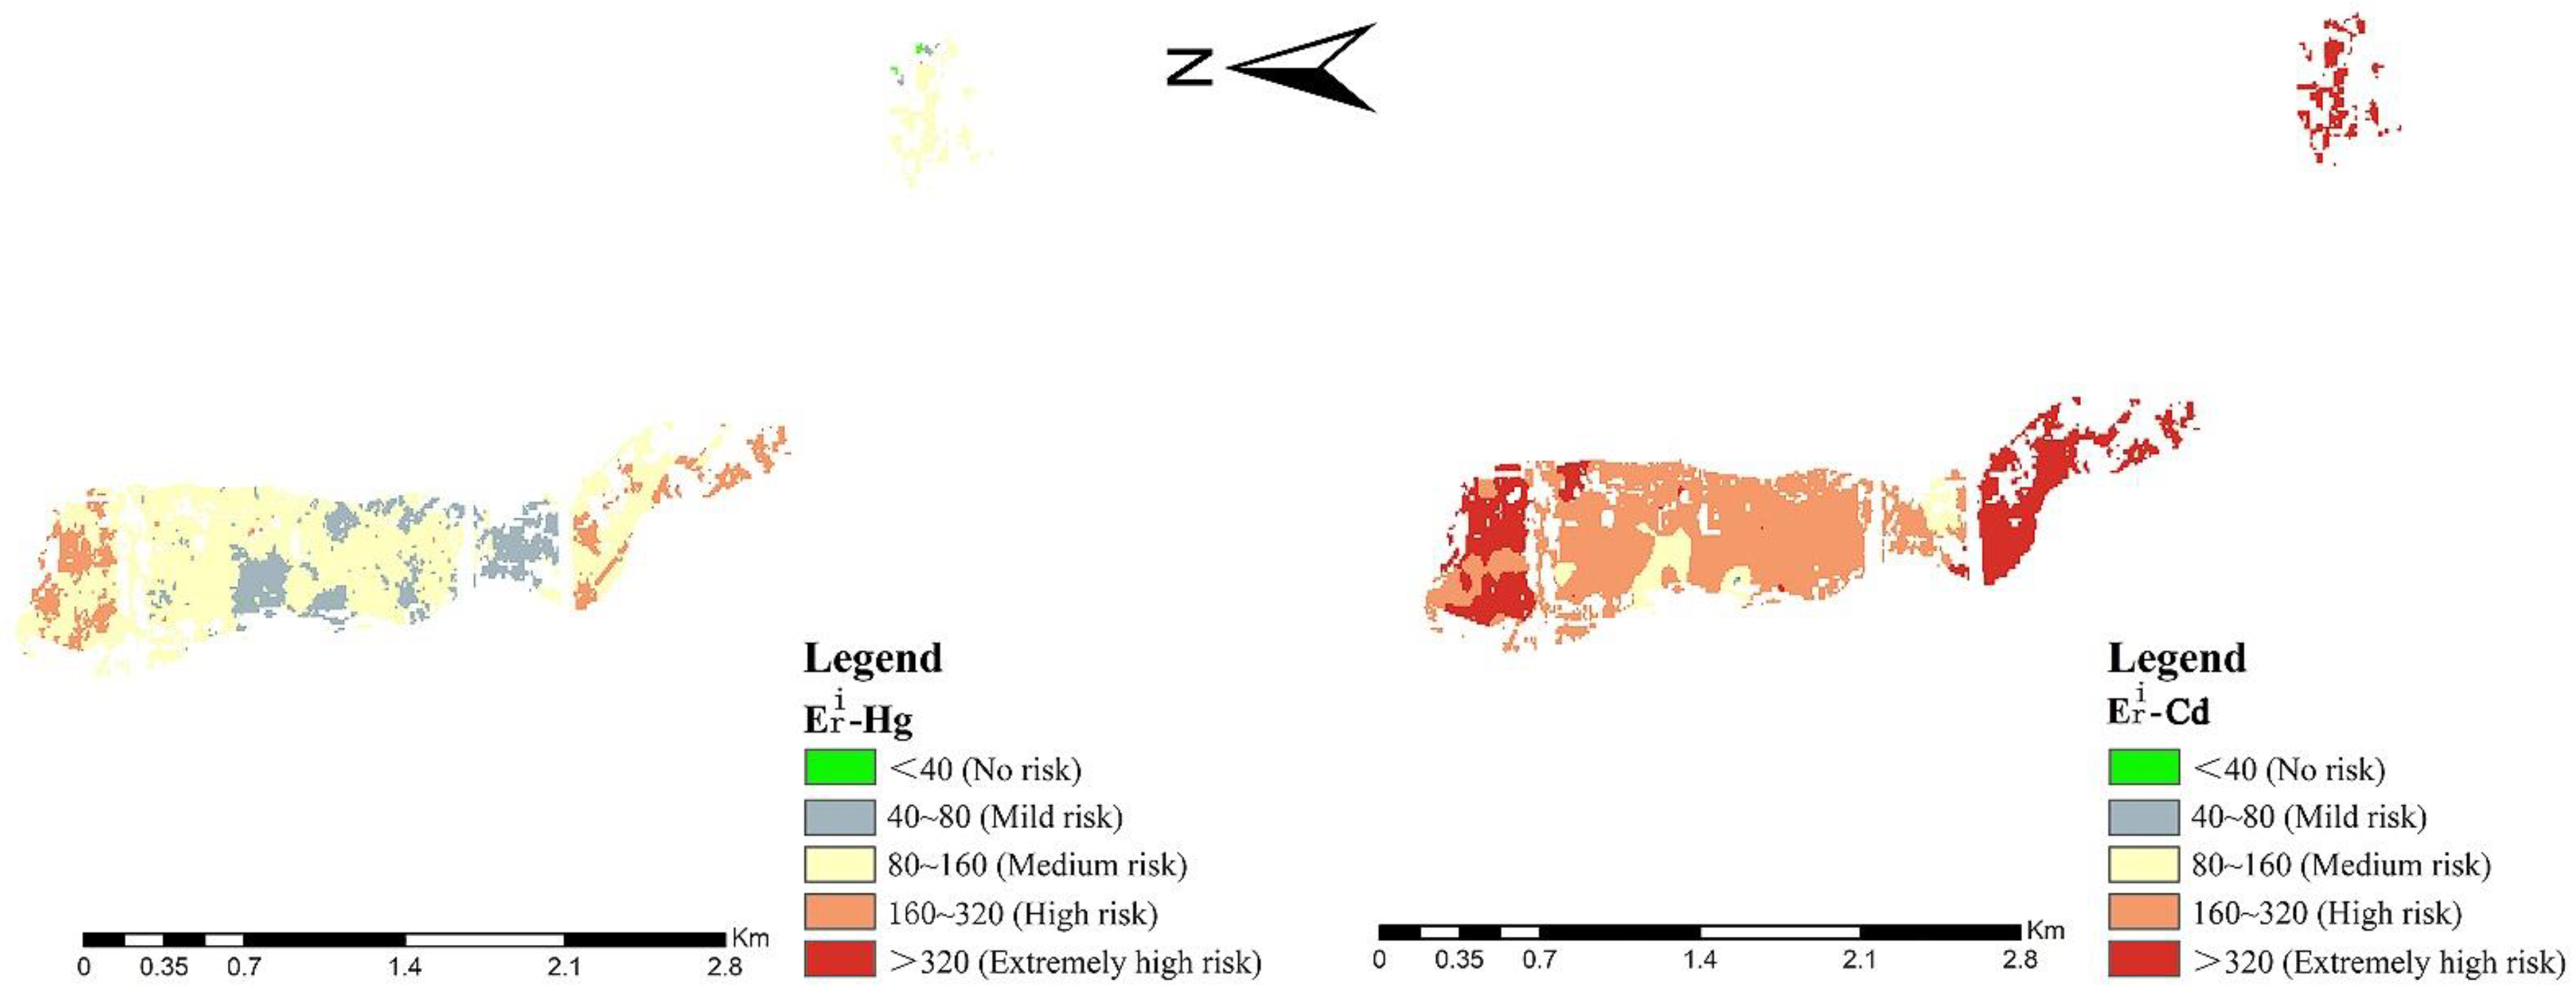
4.2.1. Potential Ecological Risks

Table 6 shows that the average values of potentially toxic elements Eri in the soil of the study area are in the following descending order: Cd > Hg > As > Pb > Cu > Zn. The Eri values of Cd and Hg are relatively high, and the potential ecological risks of Cd range from mild to extremely high, with high to extremely high risks accounting for 43.89%. The risk of Hg is mainly mild to moderate, accounting for 54.15%; As, Pb, Cu, and Zn are all risk-free.
Figure 3 shows that the potential ecological risks of Cd in the study area are mainly mild in the central and western regions, moderate in the central and northern, central, and southern regions, and high in the northern and central regions. The extremely high areas are in the north and south. The Hg no to mild-risk zone is located in the central southern region, with a discrete distribution; the high-risk areas are located in the north and south, while the extremely high-risk areas are located in the central and southern regions, distributed in a dotted pattern.
Figure 4 shows that the comprehensive ecological risk of potentially toxic elements in the soil of the study area is low, accounting for 2.76%, and medium, accounting for 9.33%, with the two mainly located in the western region. High risk accounts for 38.25%, mainly in the central region, and extremely high risk accounts for 49.65% in the north and south. Special attention should be paid to areas with medium to extremely high risk, and measures should be taken when necessary to avoid ecological hazards.

4.2.2. Human Health Risks

Non-Carcinogenic Risk

Based on the findings presented in Table 7, it is evident that the potential toxicity of various elements, both individually and in combination, in the study area decreases in the following order: oral intake > skin contact > respiratory intake. The magnitude of oral consumption is significantly higher, ranging from one to three orders of magnitude, compared with skin contact and five orders of magnitude higher than inhalation. Skin contact, on the other hand, is at most three orders of magnitude greater than inhalation. These results highlight the significant non-carcinogenic risk associated with oral consumption for individuals of all age groups, which demands immediate attention. However, it is important to note that all the non-carcinogenic risk values (HQi) for oral, inhalation, and skin contact fall below 1, suggesting a lack of non-carcinogenic risk to human health.
The comprehensive non-carcinogenic risk HQi value of potentially toxic elements in arable soil in the study area for children is 3.96 × 10⁻³–5.63 × 10⁻¹, with an average value of 1.69 × 10⁻¹, and the adult HQi value is 5.65 × 10⁻⁴–7.87 × 10⁻², with an average value of 2.40 × 10⁻², which indicates a higher non-carcinogenic risk for children compared to adults. In the study area, the non-carcinogenic risk HQi values for potentially toxic elements are ranked in descending order for adults and children as follows: Zn > Pb > As > Cd > Cu > Hg. Zn and Pb pose the highest non-carcinogenic risk, followed by As and Cd.
In the study area, the non-carcinogenic risk posed by the potentially toxic elements in the soil is higher for children compared with adults. Although the non-carcinogenic risks associated with individual or combined toxic elements are minimal, it is important to focus on the non-carcinogenic risks specifically related to Zn and Pb. This is necessary to prevent any additional accumulation of non-carcinogenic risks.

Carcinogenic Risk

Table 8 shows that the human carcinogenic risk caused by different pathways of single and six added potentially toxic elements in the study area is in the following descending order: oral intake > skin contact > respiratory intake. The highest carcinogenic risk, which should be given attention, is associated with oral ingestion for both adults and children. However, there is no cancer risk for either adults or children through skin contact or respiratory intake. Specifically, among these routes, the moderate cancer risk in children is related to the oral ingestion of As and Cd, while in adults, it is related to the oral ingestion of As.
The risk of cancer-causing elements in the soil of the surveyed area is considered moderate and acceptable for both children and adults. When the elements are ranked in order of risk, arsenic (As), cadmium (Cd), and lead (Pb) pose the highest to lowest risk, respectively. Children have a slightly higher risk of developing cancer from exposure to As and Cd, primarily through oral consumption. Specifically, As exposure poses a moderate and acceptable threat to human health, while Cd poses a similar risk specifically for children. However, Pb does not pose a carcinogenic risk to either children or adults.
As in the soil of the study area has a moderate and acceptable carcinogenic risk for all children and adults near the sampling point. Figure 5 shows that Cd has a mild (46.89%) and moderate acceptable cancer risk (53.11%) for children near the sampling point. The former is mainly located in the central part of the study area, while the latter is mainly located in the northern and southern parts of the study area with a point-like distribution in the central part. Therefore, it is necessary to focus on the carcinogenic risks of As and Cd in children and, if necessary, take measures in advance to avoid further increases in carcinogenic risks.

4.3. Sources of Potentially Toxic Elements in Soil

4.3.1. Principal Component Analysis

Figure 6 shows that the correlation coefficients (0.3–0.9) between potentially toxic elements in the farmland soil of the study area are in the following descending order: Zn-Cd (0.91) > Zn-Hg (0.76) > Pb-Hg (0.72)> Cd-Hg (0.70) > As-Hg (0.67) > As-Cu (>0.67) > Cu-Hg (0.64) > Cu- Zn (0.63) > Cu-Cd (0.58) > Zn-Pb (0.56) > As-Pb (0.51) >Cd-Pb (0.48) > Cd-Cu (0.48) > Zn-As (0.45) > As-Cd (0.32). The correlation coefficient between Cd and Zn is the highest, followed by Zn and Hg, which is followed by Pb-Hg and Cd-Hg, indicating a high degree of correlation between them. The lowest is As-Cd, the second lowest is Zn-As, and the third lowest is Pb-Cu and Pb-Cd, indicating a low correlation between them.
Figure 7 shows that the cumulative variance contribution rate of the two extracted feature values is 81.5%, which can represent the vast majority of information in the original data.
The loads of Hg, Zn, Cd, Cu, and Pb in the first principal component (PC1) were 0.917, 0.881, 0.825, 0.808, and 0.751, respectively, with a contribution rate of 67.4%. The average potentially toxic element content mentioned above was higher than the background value. In 2009, the maximum exceeding multiples of Cd, Pb, and Zn in the upstream water of Dongdagou were 4.1, 1.32, and 0.3 times, respectively. Therefore, it is speculated that the first principal component may originate from agricultural activities and sewage irrigation.
The variance contribution rate of the second principal component is 14.1%. Among them, As has a higher positive load value (0.594), followed by Hg, Cu, and Pb.

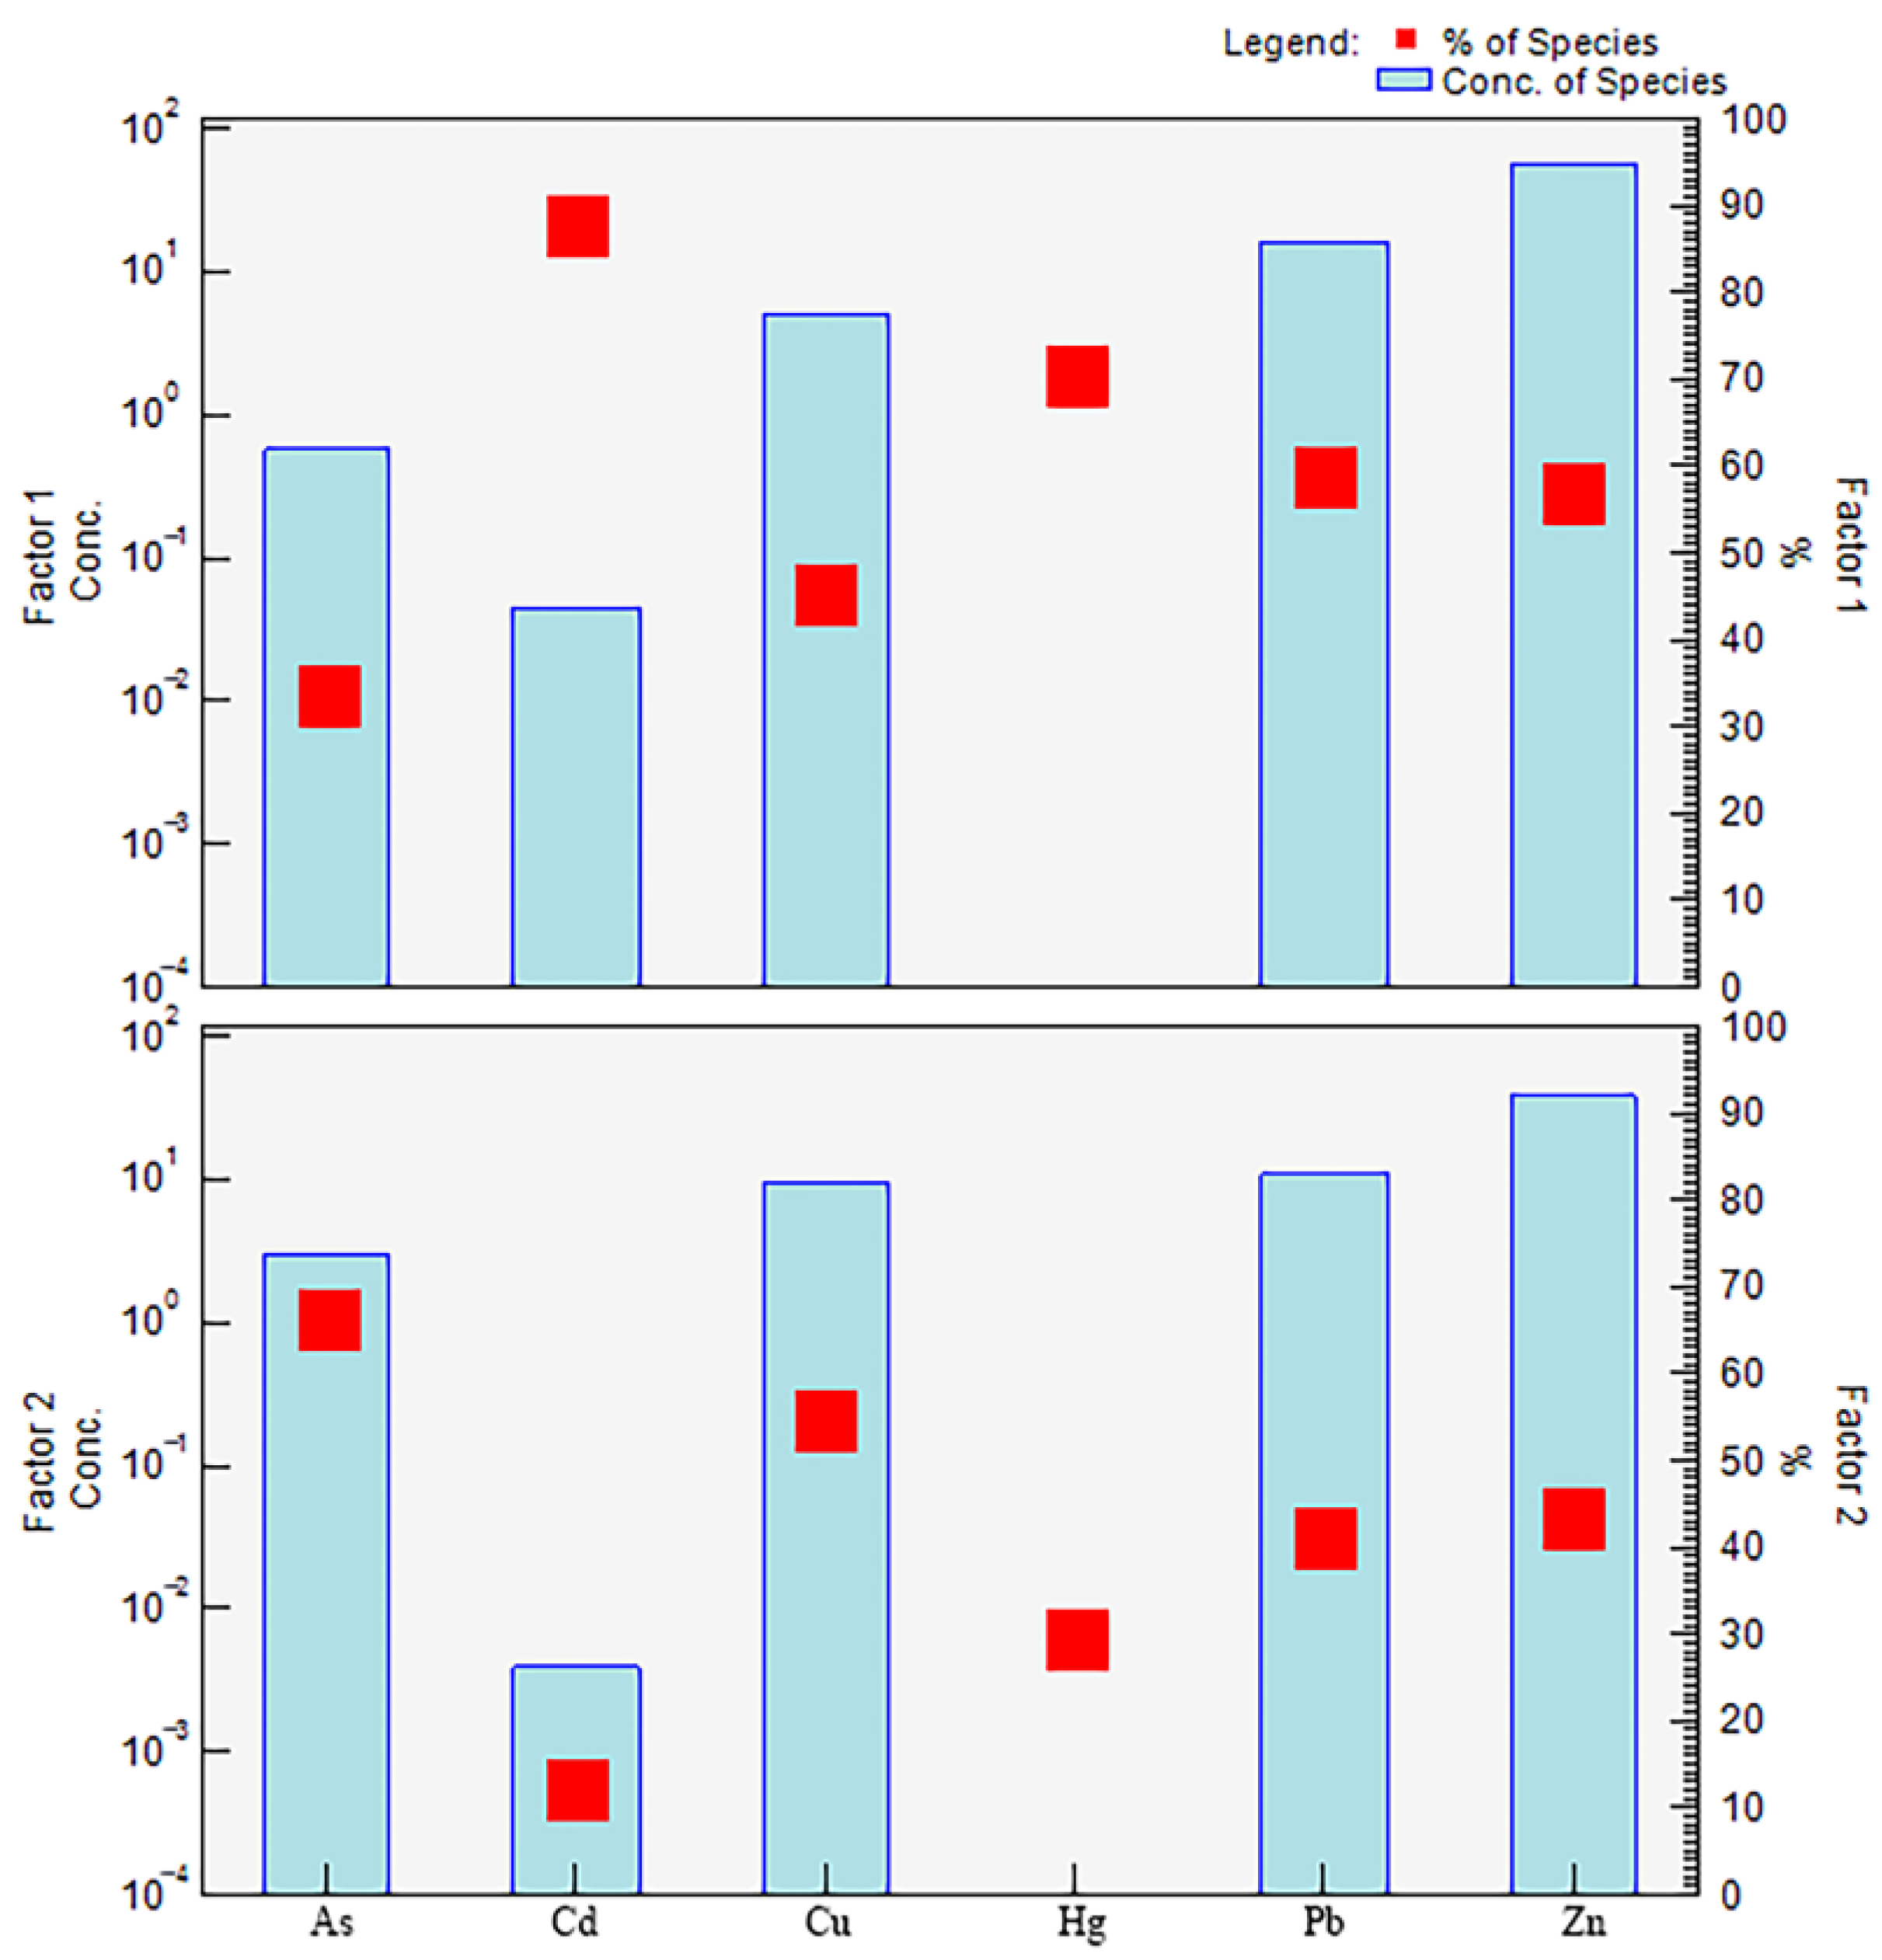
4.3.2. Source Analysis of the PMF Model

Figure 8 shows that the contribution rates of factor 1 to Cd, Hg, Pb, and Zn in the soil potentially toxic element source composition spectrum of the study area are 88.7%, 70.6%, 58.9%, and 56.8%, respectively.
The contribution rates of factor 2 to As, Cu, Zn, and Pb are 66.3%, 54.5%, 43.2%, and 41.1%, respectively.

5. Discussion

5.1. Evaluation of Soil Potentially Toxic Element Pollution

The average concentrations of the potentially toxic elements As, Cd, Cu, Pb, Zn, and Hg in the farmland soil of Dongdagou in Baiyin City were all higher than the local background values, which is similar to the research results of Wu [21] and Li [20]. Although Zn has the highest average value in soil between 0.5 and 1.00 m, the average concentration of Cu is also higher than the local soil background value, which may be due to Zn and Cu being essential elements for human and plant growth [31]. Wu found [24] that abandoned farmland in Baiyin City was severely polluted with Pb and As at 0–20 cm. The average values of As, Pb, Cu, and Zn were 4.48, 2.12, 1.14, and 0.52, respectively, which were lower than the average values in this study. This may be due to the presence of more industrial enterprises near the study area, the frequent use of farmland, and the introduction of potentially toxic elements by pesticides and fertilizers.

5.2. Soil Potentially Toxic Element Risk

Among the six potentially toxic elements in the study area, only Hg and Cd have ecological risks, while the other four potentially toxic elements are all risk-free. However, there are areas with high and extremely high potential ecological risks, which may be due to the high hazard coefficients of Hg and Cd, thereby increasing the overall ecological risk. Therefore, the potential ecological risks of Hg and Cd deserve attention.
The hazard index in the study area indicates that all potentially toxic elements pose no non-carcinogenic risk to adults and children, as they remain below 1. The highest non-carcinogenic risk is associated with the ingestion of these elements. In a study on human health risk assessment of potentially toxic elements near large smelters, Zhou Jun [32] found that indirect exposure to potentially toxic elements is the main pathway for crop accumulation through dietary plant intake, while respiratory intake of potentially toxic elements can be almost ignored.
Children have a higher non-carcinogenic risk than adults, which may be due to their sensitivity to soil potentially toxic elements at the same concentration, poor finger-sucking behavior, and detoxification and detoxification abilities, as well as the possibility of children consuming more potentially toxic elements [33,34,35].
The total carcinogenic risk of all potentially toxic elements in the study area to the human body is an acceptable moderate carcinogenic risk, while As has an acceptable carcinogenic risk to the human body and Cd has an acceptable carcinogenic risk to children, indicating that the carcinogenic risk is mainly attributed to As and Cd. Studies have shown that Cd can inhibit cell viability and lead to cell apoptosis [36]. Long-term exposure to arsenic can increase the likelihood of developing liver, lung, and kidney cancer in the human body [37].

5.3. Analysis of Potentially Toxic Element Sources in Soil

The first principal component has a high load on Hg, Zn, Cd, Cu, and Pb. Considering spatial distribution and historical legacy reasons, the Hg in high-value areas of farmland mainly comes from sewage irrigation [17]. The average content of the above-mentioned potentially toxic elements is higher than the background value. The sources of Hg, Zn, Cd, Cu, Pb, and As are often related to agriculture [38]. Cui [39] found that water is an important reason for soil element enrichment, and clay minerals and soluble elements migrate with water and accumulate in the flowing area. Wu [24] found that Cd, Pb, and As pollution is severe in sewage-irrigated farmland along Dongdagou Creek in Baiyin City. Ma [40] found that sewage irrigation related to industrialization is the main source of potentially toxic elements in the soil. The farmland in Dongdagou is a “sewage irrigation area” [41].
The second principal component has a higher load on As. The copper industry is the leading industry for silver in “Copper City”, and As is one of the characteristic pollutants (Cu, As, and Pb) in copper smelting flue gas [42]. Liang [43] and Wang [44] showed that the Zn, Cu, and Pb in soil mainly come from industrial emissions, so it is speculated that the second principal component is mainly from industrial sources.
Factor 1 has a higher contribution rate to Cd, Hg, Pb, and Zn. Huang’s research shows that fertilizers and pesticides contain Cd, Hg, Pb, and Zn, among others [45]. Li [46] believes that excessive or even excessive use of fungicides and water-soluble fertilizers can lead to the accumulation of Cu and Zn in the soil. There are many smelting enterprises, lead–zinc mines, coal mines, and other mining and beneficiation enterprises around the research area. Historically, industrial wastewater was directly discharged into Dongdagou without treatment, causing potentially toxic elements to enter farmland with sewage irrigation, causing enrichment and even pollution. Therefore, factor 1 can be considered a source of agricultural activities such as sewage irrigation, pesticides, and fertilizers.
Factor 2 has a higher contribution rate to As, Cu, Zn, and Pb. The metal smelting industry of “Tong City” silver is relatively developed, with potentially toxic element emissions such as As, Cu, Zn, and Pb [47,48], making it an important source of potentially toxic elements in the soil of the research area [49,50]. Therefore, factor 2 is an industrial source.

5.4. Repair Strategy

The Action Plan for Soil Pollution Prevention and Control in China clearly proposes to “focus on promoting the safe use of soil”, and soil pollution prevention and control needs to solve two problems: technology and strategy [51]. The key to controlling potentially toxic element pollution in farmland lies in the transportation process from the root to the aboveground, forming scalable and safe utilization technologies. However, there is currently no unified goal for the safe use of polluted farmland, such as alternative planting to reduce its carcinogenic and non-carcinogenic risks [38]. The sources of potentially toxic elements in the farmland soil of Dongdagou in Baiyin City are diverse and belong to mixed pollution. To effectively control the risk of soil potentially toxic element pollution, feasible control measures should be taken based on the degree of risk, such as deep plowing, planting low-accumulation crop varieties, adding in situ passivation materials, applying leaf blocking materials [52], using microbial regulation to reduce the effectiveness of soil potentially toxic element species, or inhibiting plant absorption of soil potentially toxic elements.
According to the potential ecological risks of potentially toxic elements in the soil of the study area and the method of classifying the soil environmental quality of agricultural land using the “Soil Ten Rules” [53], the agricultural soil in the study area can be divided into three categories: low-risk areas, which are prioritized for protection; medium-risk areas, classified as safe utilization; and high-risk and extremely high-risk areas, which are strictly controlled. For low-risk, priority-protected soil, attention should be paid to source prevention and control, strict supervision of pollution source input, strengthening soil protection, and efficient dynamic monitoring. For medium-risk, safe-use soil, a combination of source prevention and process control should be adopted. Based on good pollution source control, measures such as adjusting soil pH value and fertilization ratio should be taken to reduce the effectiveness of potentially toxic elements in farmland soil in order to control their migration and transformation and ensure the safety of soil and crops. Based on pollution source prevention and process control, necessary end treatment should be carried out for soils with high and extremely high risks. Finally, high-risk areas should be designated as prohibited crop cultivation areas, excessive accumulation of plants should be planted (such as Rose chinensis Jacq and Peony, which can be sold as ornamental cash crops after repairing potentially toxic elements pollution in soil, and Impatiens balsamina L, which can be used for dyeing and other purposes), potentially toxic elements solidification agents should be added, and microorganisms should be used to reduce the effectiveness of soil potentially toxic elements.

6. Conclusions

(1) There is a certain degree of accumulation of potentially toxic elements in the soil of the study area, where Cu reaches a maximum of 43.60 times the background value, followed by Cd, which is followed by Pb; As is the lowest, followed by Hg and Zn.
(2) The findings of this study indicate that approximately 49.65% of the sampled sites in the study area have a significantly high potential ecological risk from potentially toxic elements. Among the elements of concern, such as As, Pb, Cu, and Zn, there is no risk. However, Cd poses a predominantly high to extremely high risk (79.38%), while Hg poses a primarily mild to moderate risk (75.58%). The overall risk to human health is relatively low. The non-carcinogenic risk (HI) is ranked in the order of oral intake, skin contact, and respiratory intake, with all values below 1, indicating no non-carcinogenic risk. Specifically, local residents are not at risk of developing cancer from Pb, Cu, Zn, and Hg. As presents a moderately acceptable carcinogenic risk to the residents, while Cd poses a mild (46.89%) to moderately acceptable carcinogenic risk (53.11%) to local children.
(3) The results of the principal component analysis indicate that Cd in the soil of the study area comes from agricultural activities and sewage irrigation. As mainly comes from industrial activities such as metal smelting, while Zn, Cu, Pb, and Hg come from agricultural inputs, sewage irrigation, and industrial activities.
(4) We recommend taking effective and targeted control and governance measures based on the categories and regions of potentially toxic element risks in the research area.

Author Contributions

L.Z.: writing—original draft, conceptualization, writing—review and editing, writing—original draft, visualization, data curation, formal analysis, and resources. S.Z.: funding acquisition, supervision, and conceptualization. B.W.: conceptualization. All authors have read and agreed to the published version of the manuscript.

Funding

This research was supported by the National Natural Science Foundation of China (51068025) and Gansu Province Key Laboratory of Oasis Resources, Environment and Sustainable Development.

Institutional Review Board Statement

Not applicable.

Informed Consent Statement

Not applicable.

Data Availability Statement

The land use data are from the Ministry of Natural Resources (http://wwww.ngcc.cn, accessed on 16 September 2023), and the DEM data were obtained from the Geospatial Data Cloud website (http://www.gscloud.cn/, accessed on 25 September 2023).

Acknowledgments

Thanks to our graduate team for their assistance in collecting and preparing soil samples for laboratory measurements.

Conflicts of Interest

The authors declare no conflicts of interest.

References

  1. Li, W.-J.; Yin, Z.-X.; Yue, B.; Gao, T.-P.; Chang, G.-H. Distribution and Risk Assessment of Some Heavy Metal Elements in the Contaminated soil from Baiyin City, Gansu Province. Earth Environ. Sci. 2020, 568, 012044. [Google Scholar] [CrossRef]
  2. Wei, L.; Wang, K.; Noguera, D.R.; Jiang, J.; Oyserman, B.; Zhao, N.; Zhao, Q.; Cui, F. Transformation and speciation of typical heavy metals in soil aquifer treatment system during long time recharging with secondary effluent: Depth distribution and combination. Chemosphere 2016, 165, 100–109. [Google Scholar] [CrossRef] [PubMed]
  3. Chervona, Y.; Arita, A.; Costa, M. Carcinogenic metals and the epigenome: Understanding the effect of nickel, arsenic, and chromium. Carcinog. Met. 2012, 47, 619–627. [Google Scholar] [CrossRef]
  4. Zhang, X.; Yang, L.; Li, Y.; Li, H.; Wang, W.; Ye, B.J. Impacts of lead/zinc mining and smelting on the environment and human health in China. Environ. Monit. Assess. 2012, 184, 2261–2273. [Google Scholar] [CrossRef] [PubMed]
  5. Bibi, D.; Tőzsér, D.; Sipos, B.; Tóthmérész, B.; Simon, E. Air, and Pollution, S. Heavy Metal Pollution of Soil in Vienna, Austria. Water Air Soil Pollut. 2023, 234, 232. [Google Scholar] [CrossRef]
  6. Cui, W.; Mei, Y.; Liu, S.; Zhang, X. Health risk assessment of heavy metal pollution and its sources in agricultural soils near Hongfeng Lake in the mining area of Guizhou Province, China. Front. Public Health 2023, 11, 1276925. [Google Scholar] [CrossRef]
  7. Jahandari, A.; Abbasnejad, B. Environmental pollution status and health risk assessment of selective heavy metal (oid) s in Iran’s agricultural soils: A review. J. Geochem. Explor. 2023, 256, 107330. [Google Scholar] [CrossRef]
  8. Dejen, T.A.; Taye, A.E. Health and ecological risks of selected heavy metals in sugarcane (Saccharum Officinarum L.) and it’s soil of plantation in Sanka irrigation farmland, Northeast, Ethiopia. Int. J. Environ. Anal. Chem. 2023, 1–19. [Google Scholar] [CrossRef]
  9. Noor, A.E.; Fatima, R.; Aslam, S.; Hussain, A.; un Nisa, Z.; Khan, M.; Mohammed, A.A.; Sillanpaa, M. Health risks assessment and source admeasurement of potentially dangerous heavy metals (Cu, Fe, and Ni) in rapidly growing urban settlement. Environ. Res. 2024, 242, 117736. [Google Scholar] [CrossRef]
  10. Zhou, L.F.; Zhang, M.B.; Yuan, W.M.; Zhou, H. A study on application of inhalation risk assessment model of USEPA in occupational health risk assessment. Zhejiang J. Environ. Manag. 2014, 26, 109–113“127. [Google Scholar]
  11. Fang, Z.; Hua, C.; He, J.; Zhu, M.; Tian, Y.; Yong, X.; Ren, L. Pollution assessment and source apportionment of heavy metal (loid) s in soil of Huangshui River basin, Qinghai Province, China. Stoch. Environ. Res. Risk Assess. 2023, 37, 4843–4855. [Google Scholar] [CrossRef]
  12. Jiang, W.; Meng, L.; Liu, F.; Sheng, Y.; Chen, S.; Yang, J.; Mao, H.; Zhang, J.; Zhang, Z.; Ning, H. Distribution, source investigation, and risk assessment of topsoil heavy metals in areas with intensive anthropogenic activities using the positive matrix factorization (PMF) model coupled with self-organizing map (SOM). Environ. Geochem. Health 2023, 45, 6353–6370. [Google Scholar] [CrossRef]
  13. Li, J. Evaluation methods for water resource suitability in territorial spatial planning: A case study of baiyin city in a semi-arid region. Int. J. Environ. Res. Public Health 2022, 19, 12973. [Google Scholar] [CrossRef]
  14. Yang, Q.; Wang, S.; Nan, Z. Migration, accumulation, and risk assessment of potentially toxic elements in soil-plant (shrub and herbage) systems at typical polymetallic mines in Northwest China. Environ. Sci. Pollut. Res. 2023, 30, 46092–46106. [Google Scholar] [CrossRef] [PubMed]
  15. Wu, J.; Lu, J.; Li, L.; Min, X.; Luo, Y. Pollution, ecological-health risks, and sources of heavy metals in soil of the northeastern Qinghai-Tibet Plateau. Chemosphere 2018, 201, 234–242. [Google Scholar] [CrossRef] [PubMed]
  16. Luo, D.R.; Deng, J.X. Industrial Effluent Fees and Preventing the Industrial” Three wasters. Chin. Law Gov. 1986, 19, 108–110. [Google Scholar]
  17. Ma, J.H.; Han, C.X.; Jiang, Y.L. Some problems in the application of the potential ecological risk index method. Geogr. Res. 2020, 39, 1233–1241. [Google Scholar]
  18. GB_T 36197-2018; Soil Quality-Guidance on Sampling Techniques. Code for State Administration for Market Regulation, Code for China National Standardization Administration: Beijing, China, 2018.
  19. HJ/T 166-2004; The Technical Specification for Soil Environmental Monitoring. Code for state environmental protection administration: Beijing, China, 2004.
  20. DZ/T 0295-2016; Specification of Land Quality Geochemical Assessment. Code for Ministry of Land and Resources of the People’s Republic of China: Beijing, China, 2016.
  21. NY/T 1377-2007; Determination of pH in Soil. Code for Ministry of Agriculture of the PRC: Beijing, China, 2007.
  22. HJ 803-2016; Soil and Sediment-Determination of Aqua Regia Extracts of 12 Metal Elements-Inductively Coupled Plasma Mass Spectrometry. Code for Ministry of Environmental Protection: Beijing, China, 2016.
  23. GB_15618-1995; Environmental quality standard for soils. GSS1-16,17-22. National Environmental Protection Administration and National Technical Supervision Bureau: Beijing, China, 1995.
  24. Wu, Y.; Wang, S.; Xu, J.; Long, S.; Nan, Z. Enrichment and distribution characteristics of heavy metal (loid) s in native plants of abandoned farmlands in sewage irrigation area. Environ. Sci. Pollut. Res. 2023, 30, 50471–50483. [Google Scholar] [CrossRef] [PubMed]
  25. Li, X.N.; Ding, S.K.; Chen, W.P.; Wang, X.H.; Lü, S.D.; Liu, R. Construction and application of early warning system for soil environmental quality. Environ. Sci. 2020, 41, 2834–2841. [Google Scholar]
  26. Gong, C.; Wang, S.; Wang, D.; Lu, H.; Dong, H.; Liu, J.; Yan, B.; Wang, L. Ecological and human health risk assessment of heavy metal(loid)s in agricultural soil in hotbed chives hometown of Tangchang, Southwest China %J Scientific reports. Sci. Rep. 2022, 12, 8563. [Google Scholar] [CrossRef] [PubMed]
  27. Liu, J.; Zheng, H.; Gao, Z.; Zhang, Y.; Wang, M.; Feng, J. Evaluation of quality and risk to human health of groundwater in a coastal coal-bearing graben basin, North China. Environ. Sci. Pollut. Res. 2023, 30, 66947–66960. [Google Scholar] [CrossRef]
  28. Meng, Y.H.; Wang, J.N.; Xia, Q.; Liu, P.; Li, C. Accumulation characteristics and health risk assessment of metals around an plastic park. Environmental Monitoring in China. Environ. Monit. China 2019, 35, 69–78. [Google Scholar] [CrossRef]
  29. Zeng, W.; Wan, X.; Wang, L.; Lei, M.; Chen, T.; Gu, G. Apportionment and location of heavy metal (loid) s pollution sources for soil and dust using the combination of principal component analysis, Geodetector, and multiple linear regression of distance. J. Hazard. Mater. 2022, 438, 129468. [Google Scholar] [CrossRef]
  30. Guan, Q.; Wang, F.; Xu, C.; Pan, N.; Lin, J.; Zhao, R.; Yang, Y.; Luo, H. Source apportionment of heavy metals in agricultural soil based on PMF: A case study in Hexi Corridor, northwest China. Chemosphere 2018, 193, 189–197. [Google Scholar] [CrossRef] [PubMed]
  31. Sahin, O. Combined biofortification of soilless grown lettuce with iodine, selenium and zinc and its effect on essential and non-essential elemental composition. J. Plant Nutr. 2021, 44, 673–678. [Google Scholar] [CrossRef]
  32. Zhou, J.; Cui, H.; Zhu, Z.; Liu, M.; Xia, R.; Liu, X.; Ding, C.; Zhou, J. Long-Term and Multipoint Observations of Atmospheric Heavy Metal (Cu and Cd) Deposition and Accumulation in Soil–Crop System and Human Health Risk Evaluation around a Large Smelter. Expo. Health 2023, 1–13. [Google Scholar] [CrossRef]
  33. Duan, B.; Zhang, W.; Zheng, H.; Wu, C.; Zhang, Q.; Bu, Y. Comparison of health risk assessments of heavy metals and as in sewage sludge from wastewater treatment plants (WWTPs) for adults and children in the urban district of Taiyuan, China. Int. J. Environ. Res. Public Health 2017, 14, 1194. [Google Scholar] [CrossRef]
  34. Behrooz, R.D.; Kaskaoutis, D.; Grivas, G.; Mihalopoulos, N. Human health risk assessment for toxic elements in the extreme ambient dust conditions observed in Sistan, Iran. Chemosphere 2021, 262, 127835. [Google Scholar] [CrossRef] [PubMed]
  35. Li, D.; Zhang, Q.; Sun, D.; Yang, C.; Luo, G. Accumulation and risk assessment of heavy metals in rice: A case study for five areas of Guizhou Province, China. Environ. Sci. Pollut. Res. 2022, 29, 84113–84124. [Google Scholar] [CrossRef] [PubMed]
  36. Ma, J.Y.; Li, W.Y.; Yang, Z.Y.; Su, J.Z.; Li, L.; Deng, Y.R.; Tuo, Y.F.; Niu, Y.Y.; Xiang, P. The spatial distribution, health risk, and cytotoxicity of metal (loid) s in contaminated field soils: The role of Cd in human gastric cells damage. Sci. Total Environ. 2023, 878, 162942. [Google Scholar] [CrossRef]
  37. Chen, Q.Y.; Costa, M. Arsenic: A global environmental challenge. Annu. Rev. Pharmacol. Toxicol. 2021, 61, 47–63. [Google Scholar] [CrossRef]
  38. Guo, J.; Zheng, G.; Yang, J.; Chen, T.; Meng, X.; Xia, T. Safe utilization of cadmium-and lead-contaminated farmland by cultivating a winter rapeseed/maize rotation compared with two phytoextraction approaches. J. Environ. Manag. 2022, 304, 114306. [Google Scholar] [CrossRef]
  39. Cui, X.T.; Luan, W.L.; Wu, J.X.; Tian, M. Spatial variability and simulation of heavy metal elements in surface soil of the eastern Hebei Plain. Chinese Journal of Soil Science. Chin. J. Soil Sci. 2010, 41, 957–964. [Google Scholar] [CrossRef]
  40. Ma, H.; Mi, M.; Wang, C.; Wu, X.; Zhen, Z. The concentrations, sources, ecological and human health risk assessment of heavy metals in roadside soils of six cities in Shanxi Province, China. Environ. Toxicol. Chem. 2023, 42, 1485–1500. [Google Scholar] [CrossRef] [PubMed]
  41. Tian, Q.C.; Yang, T.B.; Shi, P.H.; Ceng, C.S.; Wang, T.X. Analysis of metal sources and measures for preventing and controlling them in Baiyin city. Environmental Monitoring in China. Environ. Monit. China 2012, 28, 40–45. [Google Scholar] [CrossRef]
  42. Zhou, F.; Guo, H.C.; Liu, Y.; Luo, D.G.; Wang, Z. A new approach for water quality assessment based on multivariate statistical analysis and radial basis function Neural networks. Acta Sci. Circumstantiae 2007, 27, 846–853. [Google Scholar] [CrossRef]
  43. Liang, J.; Liu, Z.; Tian, Y.; Shi, H.; Fei, Y.; Qi, J.; Li, M. Research on health risk assessment of heavy metals in soil based on multi-factor source apportionment: A case study in Guangdong Province, China. Sci. Total Environ. 2023, 858, 159991. [Google Scholar] [CrossRef] [PubMed]
  44. Wang, C.; Yang, Z.; Zhong, C.; Ji, J. Temporal–spatial variation and source apportionment of soil heavy metals in the representative river–alluviation depositional system. Environ. Pollut. 2016, 216, 18–26. [Google Scholar] [CrossRef] [PubMed]
  45. Huang, H.B.; Lin, C.Q.; Hu, G.R.; Yu, R.L.; Hao, C.L.; Chen, F.H. Source appointment of heavy metals in agricultural soils of the Jiulong river basin based on positive mateix factorization. Environ. Sci. 2020, 41, 430–437. [Google Scholar] [CrossRef]
  46. Li, C.F.; Wang, F.; Cao, W.T.; Pan, J.; Wu, Y.Q. Source analysis, spatial distribution and pollution assessment of heavy sewage irrigation area farmland soils of Longkou city. Environ. Sci. 2017, 38, 1018–1027. [Google Scholar] [CrossRef]
  47. Tang, X.; Shen, C.; Shi, D.; Cheema, S.A.; Khan, M.I.; Zhang, C.; Chen, Y. Heavy metal and persistent organic compound contamination in soil from Wenling: An emerging e-waste recycling city in Taizhou area, China. J. Hazard. Mater. 2010, 173, 653–660. [Google Scholar] [CrossRef]
  48. Zhou, Y.L.; Wang, Q.L.; Wang, C.W.; Liu, F.; Song, Y.T. Heavy metal pollution and cumulative effect of soil-crop systems around typical enterprises in Xiong’an new district. Environ. Sci. 2021, 425977–425987. [Google Scholar] [CrossRef]
  49. Peng, H.; Chen, Y.; Weng, L.; Ma, J.; Ma, Y.; Li, Y.; Shafiqual, I. Comparisons of heavy metal input inventory in agricultural soils in North and South China: A review. Sci. Total Environ. 2019, 660, 776–786. [Google Scholar] [CrossRef]
  50. Wang, Y.; Duan, X.; Wang, L. Spatial distribution and source analysis of heavy metals in soils influenced by industrial enterprise distribution: Case study in Jiangsu Province. Sci. Total Environ. 2020, 710, 134953. [Google Scholar] [CrossRef]
  51. Lin, H.; Wang, Z.; Liu, C.; Dong, Y. Technologies for removing heavy metal from contaminated soils on farmland: A review. Chemosphere 2022, 305, 135457. [Google Scholar] [CrossRef] [PubMed]
  52. Pouresmaieli, M.; Ataei, M.; Forouzandeh, P.; Azizollahi, P.; Mahmoudifard, M. Recent progress on sustainable phytoremediation of heavy metals from soil. J. Environ. Manag. 2022, 10, 108482. [Google Scholar] [CrossRef]
  53. Dai, Y. Discussion on Soil Pollution and Its Prevention and Control in China Based on the “Ten Principles of Soil”. Resour. Econ. Environ. Prot. 2018, 6, 96–98. [Google Scholar]
Figure 1. Overview of the study area and the sampling sites.
Sustainability 16 01689 g001
Figure 2. The concentration of potentially toxic elements in Dongdagou soil in Baiyin City.
Sustainability 16 01689 g002
Figure 3. Distribution of potential ecological hazards of Cd and Hg in farmland soil in the study area.
Sustainability 16 01689 g003
Figure 4. Spatial distribution of soil potentially toxic element comprehensive ecological environmental risks in the research area.
Sustainability 16 01689 g004
Figure 5. Spatial distribution of the risk of childhood cancer from As and Cd in the soil of the study area.
Sustainability 16 01689 g005
Figure 6. Correlation of potentially toxic elements in the soil of the study area.
Sustainability 16 01689 g006
Figure 7. Principal component analysis.
Sustainability 16 01689 g007
Figure 8. Study area PMF source composition map.
Sustainability 16 01689 g008
Table 1. Classification standard of potential ecological hazard grade of heavy metals.
EriSingle Factor Potential Ecological Hazard IndexRIComprehensive Potential Ecological Hazard Risk
Eri < 40No riskRI < 110Low risk
40 ≤ Eri < 80Minor risk110 ≤ RI < 220Medium risk
80 ≤ Eri < 160Medium risk220 ≤ RI < 440High risk
160 ≤ Eri < 320High riskRI ≥ 440Extremely high risk
Eri ≥ 320Extremely high risk
Table 2. Exposure parameters of the US EPA health risk assessment model.
ParameterUnitChildrenAdult
IngRmg·d−1200100
InhRm3·d−17.514.5
EFd·a−1350350
EDa624
BWkg15.956.8
ATdED × 365 (non-carcinogenic)70 × 365(carcinogenic)
PFm3·kg−11.36 × 1091.36 × 109
SAcm250005000
SLmg·cm−20.070.07
ABE 0.0010.001
Table 3. RfD and SF reference values of soil potentially toxic elements exposed by different pathways.
Potentially Toxic ElementRfD/mg·(kg·d)−1SF/mg·(kg·d)−1
Oral CavityBreatheSkinOral CavityBreatheSkin
Pb0.00350.00003520.0000525--0.0085
As0.0030.0001230.003011.50.00431.5
Cd0.0010.0010.0016.106.306.10
Hg0.00030.00030.000024---
Zn0.0030.30.06---
Cu0.040.04020.012---
Table 4. Classification standard of carcinogenic risk of soil potentially toxic elements.
GradeUSEPA StandardStandards for This Study
CRCancer RiskCRCancer Risk
1CR ≤ 10−6No riskCR ≤ 10−6No risk
210−6 < CR ≤ 10−4Risk present, acceptable10−6 < CR ≤ 10−5Low risk, acceptable
3CR > 10−4Risk present, unacceptable10−5 < CR ≤ 10−4Moderate risk, acceptable
4 CR > 10−4High risk, unacceptable
Table 5. Statistics on the contents of soil potentially toxic elements.
Potentially Toxic ElementDepth (m)mg/kgSDSkewnessKurtosisCV (%)
MinMaxAvg
As0–0.211.4087.1019.727.003.6825.9835.48
0.2–0.511.3073.2020.506.792.6113.6033.09
0.5–113.0037.9019.465.721.953.5529.37
1–1.511.4050.8023.779.231.243.1138.81
Cd0–0.20.2813.002.291.711.373.4174.69
0.2–0.50.036.491.811.021.151.8656.23
0.5–10.445.603.401.70−0.44−1.4450.10
1–1.50.396.322.441.691.020.6169.28
Cu0–0.226.40225.0050.3421.063.6522.5741.83
0.2–0.526.00320.0048.4922.425.3755.3246.24
0.5–127.6063.9049.1711.30−0.81−0.9122.98
1–1.527.60390.0082.9484.323.009.74101.67
Hg0–0.20.020.450.090.051.909.5054.95
0.2–0.50.020.300.100.040.520.8441.88
0.5–10.030.160.110.03−1.030.5128.55
1–1.50.030.190.120.05−0.50−0.9543.50
Pb0–0.225.10232.0070.6830.160.671.0042.67
0.2–0.523.00226.0085.2330.230.210.4235.47
0.5–136.90126.0083.5118.74−0.141.5122.44
1–1.536.00199.0093.5842.030.580.4344.91
Zn0–0.277.50524.00141.9351.491.647.5936.28
0.2–0.573.60612.00134.3941.893.7937.6231.17
0.5–182.70220.00171.3245.14−0.79−0.9826.35
1–1.581.50387.00166.8981.111.562.2648.60
Table 6. Ecological hazard risk of potentially toxic elements in the soil of the study area based on the hazard coefficient.
ProjectAsCdCuHgPbZn
mg/kgMax37.992166.6725.57545.4539.748.42
Min7.8543.331.724.245.021.01
Avg14.03349.583.29116.5517.291.92
Exceeding standard sample points (%)No risk1000.001005.30100100
Minor risks0.005.070.0021.430.000.00
Medium risk0.0015.550.0054.150.000.00
High risk0.0035.480.0018.430.000.00
Extremely high risk0.0043.890.000.690.000.00
Table 7. Non-carcinogenic risk of potentially toxic elements in the soil of the study area.
Potentially Toxic ElementChildrenAdult
Oral CavityBreathSkinHQiOral CavityBreathSkinHQi
As8.12 × 10−21.46 × 10−51.42 × 10−48.14 × 10−21.14 × 10−22.95 × 10−53.97 × 10−51.14 × 10⁻²
Cd2.53 × 10−21.86 × 10−54.42 × 10−52.53 × 10−23.54 × 10−33.77 × 10−71.24 × 10−53.55 × 10⁻³
Cu1.51 × 10−21.10 × 10−58.81 × 10−51.52 × 10−22.11 × 10−32.24 × 10−72.47 × 10−52.14 × 10⁻³
Hg3.87 × 10−36.77 × 10−68.46 × 10−53.96 × 10−35.41 × 10−45.77 × 10−82.37 × 10−55.65 × 10⁻⁴
Pb2.73 × 10−12.00 × 10−23.19 × 10−23.25 × 10−13.82 × 10−24.05 × 10−48.92 × 10−34.76 × 10⁻²
Zn5.62 × 10−14.13 × 10−64.92 × 10−45.63 × 10−17.87 × 10−28.39 × 10−81.38 × 10−57.87 × 10⁻²
HI9.61 × 10−12.00 × 10−23.27 × 10−21.02 × 1001.35 × 10−14.35 × 10−49.04 × 10−31.44 × 10⁻¹
Table 8. Carcinogenic risk of potentially toxic elements in the soil of the study area.
Potentially Toxic ElementsChildrenAdult
Oral CavityBreathSkinCRiOral CavityBreatheSkinCRi
As3.13 × 10−56.61 × 10−115.48 × 10−83.14 × 10−51.75 × 10−55.37 × 10−126.14 × 10−81.76 × 10−5
Cd1.32 × 10−51.01 × 10−82.31 × 10−81.33 × 10−57.41 × 10−68.17 × 10−102.59 × 10−87.43 × 10−6
Cu--------
Hg--------
Pb--1.22 × 10−91.22 × 10−9--1.36 × 10−91.36 × 10−9
Zn--------
CR4.46 × 10−51.01 × 10−87.92 × 10−84.46 × 10−52.49 × 10−58.22 × 10−108.87 × 10−82.50 × 10−5
Disclaimer/Publisher’s Note: The statements, opinions and data contained in all publications are solely those of the individual author(s) and contributor(s) and not of MDPI and/or the editor(s). MDPI and/or the editor(s) disclaim responsibility for any injury to people or property resulting from any ideas, methods, instructions or products referred to in the content.

