Article

Using 7Be and 137Cs for Assessing the Land Stability of Alexandria Region, Egypt

1
Department of Environmental Studies and Research, Institute of Graduate Studies and Research, Alexandria University, Alexandria 21526, Egypt
2
College of Engineering and Technology, American University of the Middle East, Egaila 54200, Kuwait
3
Renewable Energy and Environmental Technology Center, University of Tabuk, Tabuk 47913, Saudi Arabia
4
Physics Department, Faculty of Science, Alexandria University, Alexandria 21511, Egypt
*
Author to whom correspondence should be addressed.
Sustainability 2024, 16(4), 1692; https://doi.org/10.3390/su16041692
Submission received: 4 December 2023 / Revised: 20 January 2024 / Accepted: 31 January 2024 / Published: 19 February 2024

Abstract

:
This paper presents an assessment of land stability using fallout environmental radioisotopes 7Be and 137Cs. The measurement of both isotopes was carried out in samples of soil collected from twenty-five sites covering the studied region. At each site, the samples were taken from five consecutive vertical depth levels to show the vertical displacement or compactness of the soil column. The collected samples were carefully transferred for radioactivity measurement at Alexandria University’s Institute of Graduate Studies and Research. A high-resolution gamma-ray spectrometer utilizing high-purity germanium was employed for the measurements. Surface distribution of the radionuclides levels was used to show the studied lands’ stability over the short- and long-term based on the used radionuclides’ nuclear half-life. For short-term (months) stability, 7Be (half-life: 35.5 days) levels showed that about 73% of the area is very low in stability, while the areas that recorded low, moderate, and high stability are at 18%, 4%, and 5%, respectively. For long-term (years) stability, 137Cs (half-life: 30 years) levels showed that about 80% of the areas are very low in stability, while the remaining areas, predicted as 12.8%, 5.6%, and 1.6%, are low, moderate, and high stability, respectively. It is clear that the eastern side of Alexandria is suffering from soil erosion and subsidence; on the other hand, the western side is more stable. Consequently, due to the origin of the soil, the nature of soil geological formations, and the environmental prevailing conditions, Alexandria is found to be more vulnerable to the consequences of sea-level rise and climate change. Therefore, adequate strategic management, including mitigation measures and adaptation, should be planned and implemented.

1. Introduction

In recent times, available resources of land and water have been placed under pressure due to population growth. Consequently, many nations around the world will confront great challenges in terms of securing sufficient food and freshwater, as well as adequate infrastructure in a sustainable manner, owing to the shrinking amount of suitable land available per capita. This is exacerbated by the severe degradation of land through soil erosion and relaxation, which increase the risks associated with the land. The estimate of land degradation globally is approximately 1.9 billion ha [1,2,3]. The primary process of land degradation occurring globally is soil erosion, with over 75% of the total erosion-affected agricultural land mass being located in Africa, Asia, and Latin America’s developing nations. Globally, agricultural lands are the origin of over 75% of soil loss, with estimations of the associated costs [4].
Recently, the impacts of sea level rises and climate change have affected the soil stability, particularly in coastal areas. Alexandria Governorate is considered one of the most affected in the Middle East and North Africa (MENA) region as it extends along the Mediterranean coast in northern Egypt. The Alexandria region is highly vulnerable to risks associated with climate change, and the rise in sea levels particularly. Such high vulnerability is expected to have significant consequences on the sustainability of local communities, infrastructures, and ecosystems. The vulnerability of the Alexandria Governorate to sea level rises is partly determined by the instability of the ground, which is evident from the varied rates of vertical and horizontal movements. An accurate vulnerability assessment of the impact of elevations in the sea level requires the availability of data on the movement of the earth’s crust and land stability.
A soil’s erodibility K(y−1) is a metric of its erosion susceptibility, and it depends on a number of soil characteristics, which include the organic matter, permeability, structure, and texture [5]. Soils are subject to various forces, such as water (splash, sheet wash, ditching), wind, ice (freeze-thaw, glacial, periglacial), gravity (dry fray, creep, overturn, landslides, earth currents), tillage, and biological turbulence. Therefore, soil depth levels are moved by various processes. Disturbances (clearing, compaction, drying fire, overgrazing, and tillage) often accelerate erosion by destroying the structure of the soil and removing vegetation cover [6]. Significant research efforts have been conducted in the past five decades in terms of employing radioisotopes (man-made and natural) to explore the phenomena of sedimentation and erosion, attracting considerable attention. Natural radionuclides (cosmogenic and terrestrial), in addition to fission products, have been utilized to achieve independent determinations of ground stability patterns, sediment deposition rates, and soil erosion [7,8,9].
In the search for alternative cost- and time-effective approaches to the assessment of soil erosion, which can accompany the traditional techniques, employing fallout radionuclides (FRNs) has drawn the attention of researchers. The radionuclides that are particularly used are fission product cesium-137 (137Cs, half-life of 30 years) for long-term erosion processes and natural cosmogenic beryllium-7 (7Be half-life of 53.3 days) for short-term. These FRNs move with soil materials, and therefore, can be used as tracers for obtaining quantitative soil deposition and erosion estimations [10]. For this purpose, the previously mentioned FRNs can assist in profiling the trends of land instability at both vertical and horizontal scales. The soil relaxation depth, h0 (cm), describes the shape of the naturally radioisotope 7Be exponential soil depth distribution. The h0 is 1/e (about 0.37) of the 7Be activities in the upmost surface soil. The 7Be (Bq·m2) measured at the sampling point surface will reflect the local 7Be reference inventory, while its levels with vertical depths of soil will reflect the soil relaxation at these points.
In recent years, there has been an increase in the application of the 7Be radionuclide as an environmental processes tracer in numerous fields, which include air mass transport, metal scavenging processes, sediment sources assessment, and soil redistribution, among many others [11]. 7Be represents a cosmogenic radionuclide that emerges from the oxygen–nitrogen spallation nuclear reaction due to cosmic rays in the upper troposphere and the lower stratosphere. Consequently, it is naturally introduced into the environment through constituents, including the air, lakes, oceans, rainwater, rivers, sediments, soil, and vegetation [11]. Many factors and processes control the quantity of 7Be reaching the earth’s surface, such as cosmic-ray intensity, dry and wet deposition, horizontal transportation from the subtropics, vertical transportation in the troposphere, and mid-latitudes into the tropical and polar regions [12]. Following the production of 7Be, it quickly forms BeO or Be (OH)2 through ionic reactions and associates with aerosol particles of a sub-micrometer nature. Its decay is via electron capture to 7Li, with approximately 10% of all 7Be disintegrations emitting gamma rays. The continuous production rates of 7Be, its relatively short half-life, and its reactivity render the radionuclide a resource with considerable potential for the examination of environmental processes [13]. It is likely that 7Be’s vertical mobility influences the radionuclide’s depth distribution profile, which is significant for frequently applied conversion models for soil erosion, as described by [10,14,15,16]. One of these models’ critical components is the previously mentioned relaxation depth value, h0 [17]. In terms of the present tracer applications, geochemical partitioning characterization provides a basis for considering the irreversible sorption assumption. Ref. [18] presented a discussion on the scope for change in environmental conditions, within 7Be’s timescale for utilization as a tracer, for the introduction of uncertainty into deposition and storage estimates.
Studies on adsorption have shown that the majority of soils can retain 137Cs when a low-level application is applied, as found in fallout. Repeated extractions with myriad chemicals also showed that 137Cs atoms are strongly adsorbed and immobilized in soil. However, their movements are restricted by various chemical processes. Therefore, its redistribution in the field can only be done through physical processes [19]. The depth distribution of cesium-137 in the profile is dependent upon the disturbance of the soil post-fallout. In soils that have not been cultivated, there is an exponential decrease in the concentration of cesium-137 with depth, while in soils that have been cultivated, a uniform distribution occurs in the plow depth layer [20].

2. Materials and Methods

2.1. Study Area

The area under investigation is Alexandria Governorate, a coastal city located west of the Nile Delta, as shown in Figure 1 [21]. The study area extends from 29°50′ to 30°22′ E and from 31°09′ to 31°27′ N. The land elevations range from 2 m below mean sea level at the eastern parts of Alexandria to about 50 m above mean sea level in the southwestern parts, as shown in Figure 2.

2.2. Geology of the Area

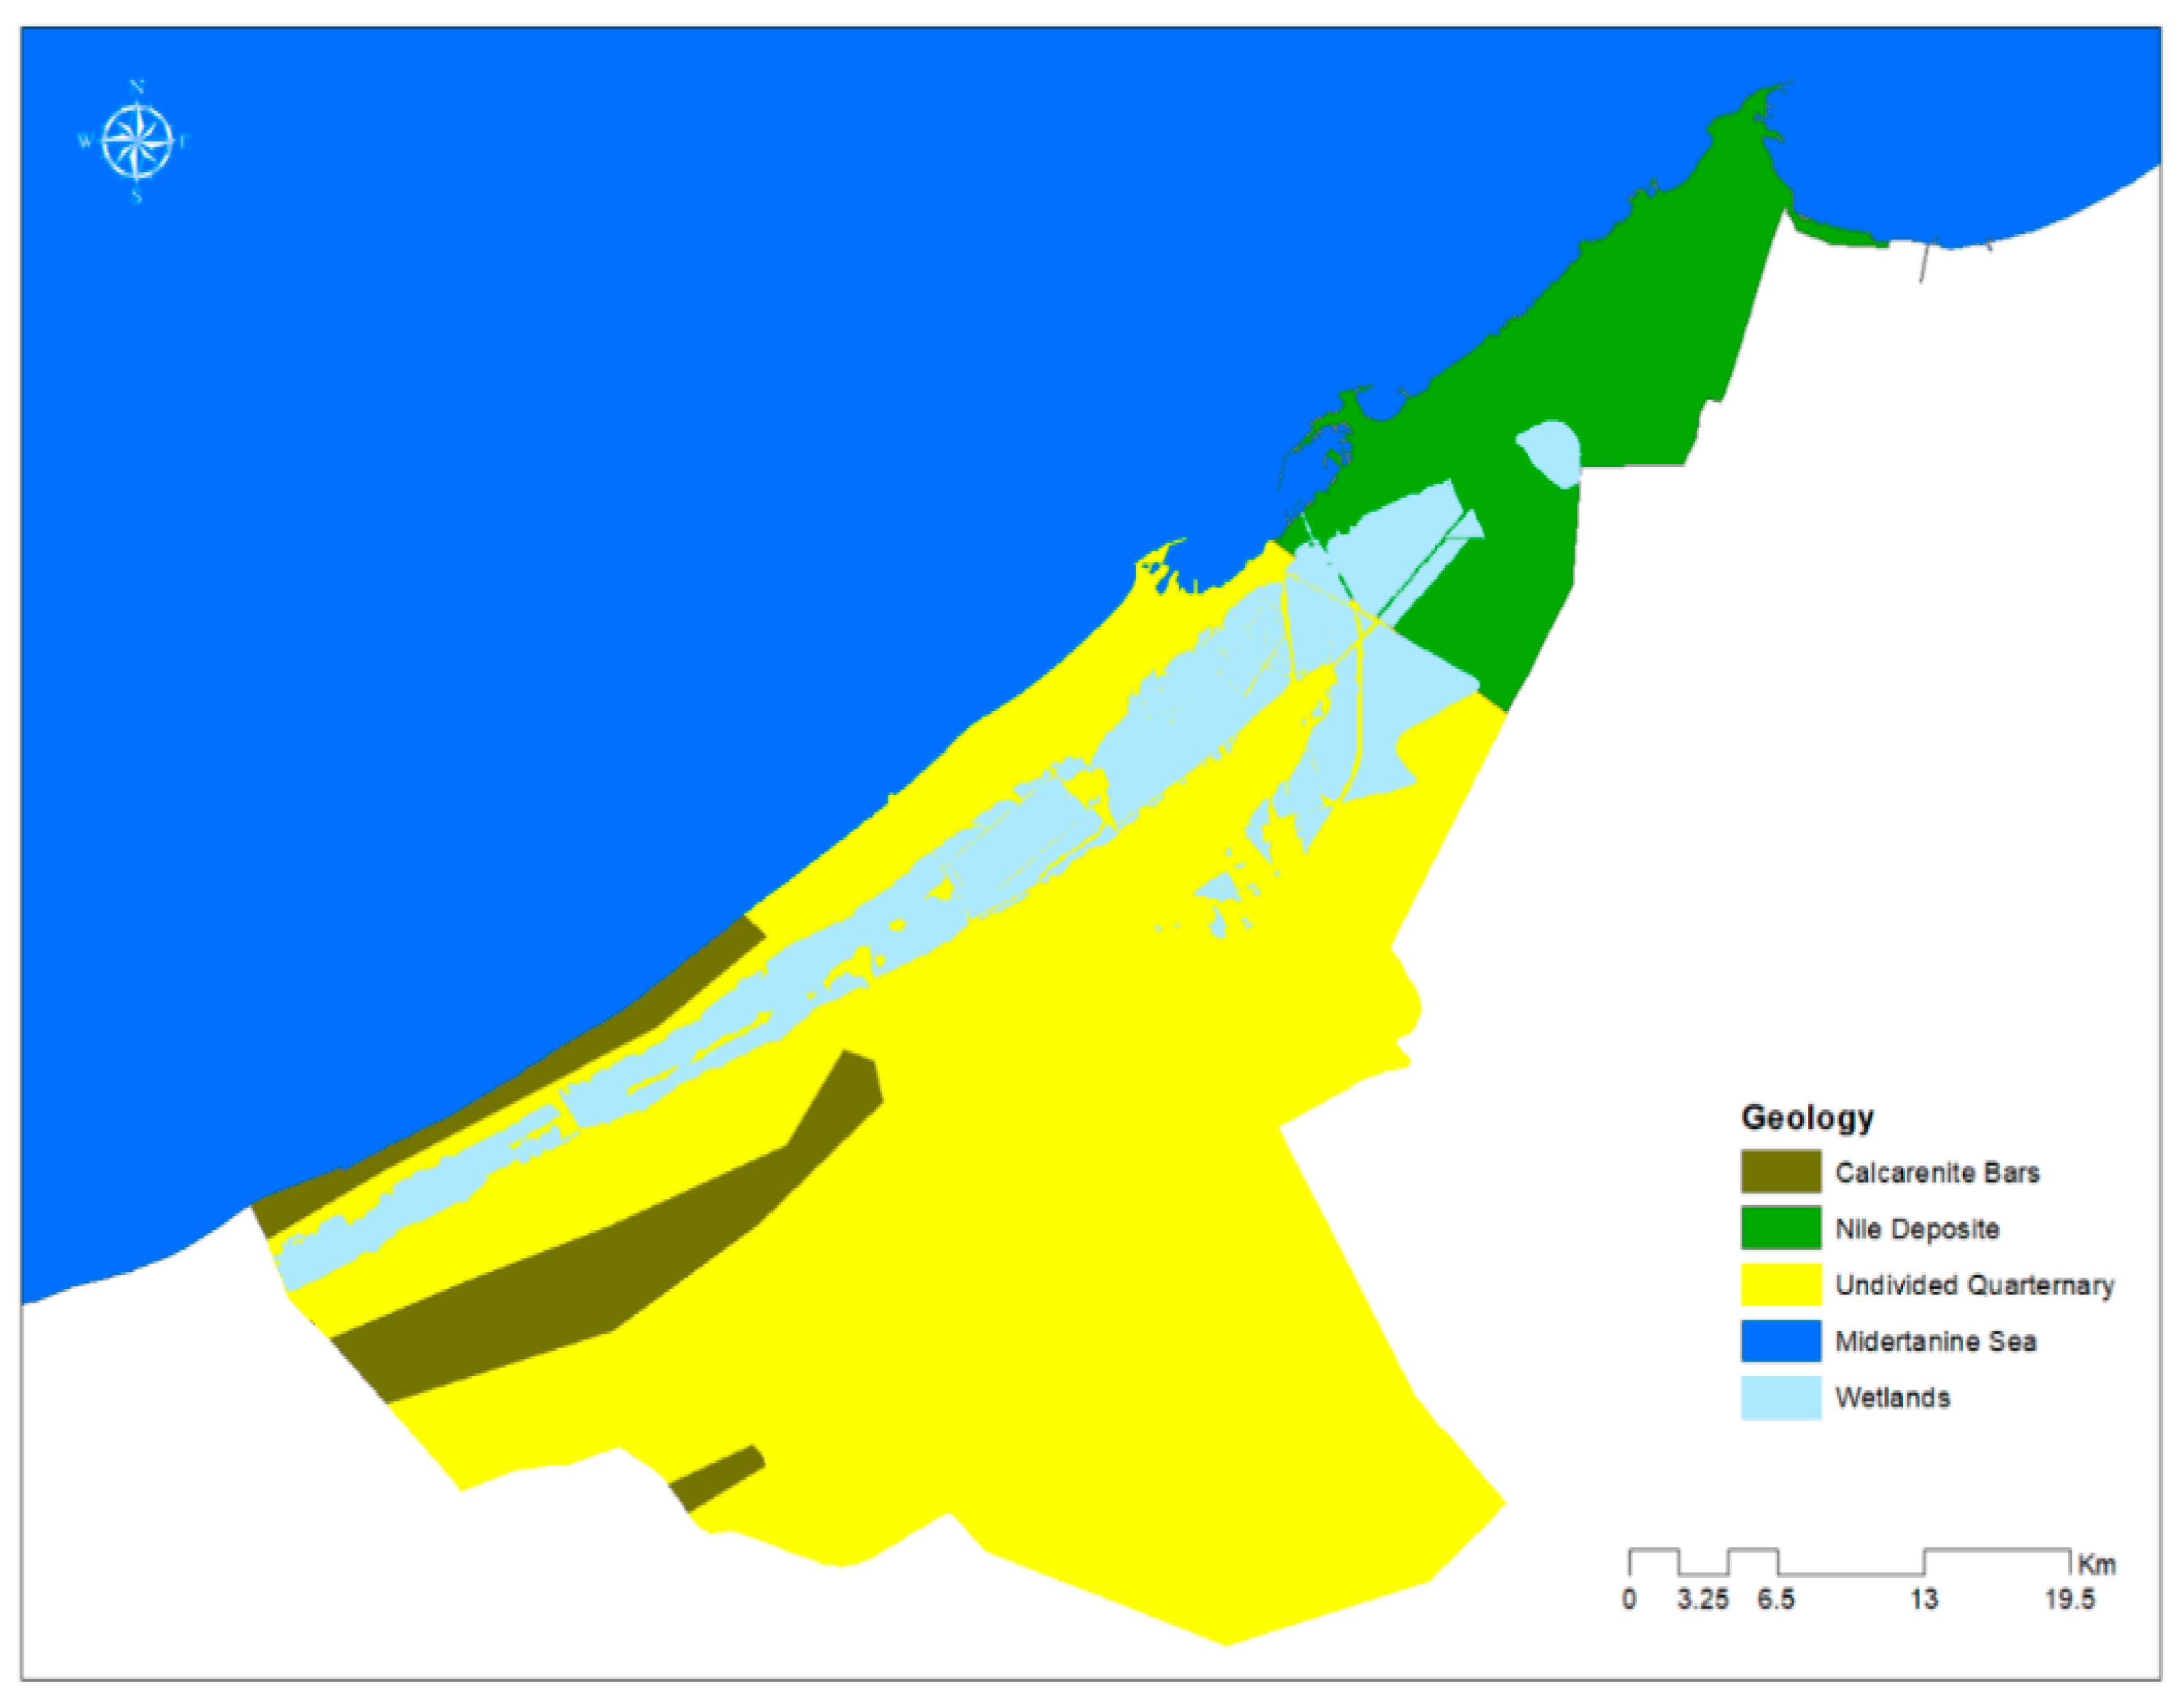
According to the geology map of Egypt 1981 (Ministry of Industrial and Mineral Recourses, the Egyptian geological survey and mining authority), the study area consists of 1381.2 km2 (13.44%) of Nile deposit, 233.8 Km2 (73%) of undivided quaternary, and 117.4 km2 (6.78%) of calcarenite bars, as shown in Figure 3.

2.3. Soil Sampling

The total investigated area was divided into four main sectors according to the land elevation. The sampling program for the study area covered 25 sampling sites distributed throughout all sectors, as shown in Figure 4. The site selection criteria were existing in its natural status, undisturbed, and not affected by any human activities. The ground sampling sites of the studied four sectors are displayed in Figure 5.

2.4. Sample Collection and Preparation

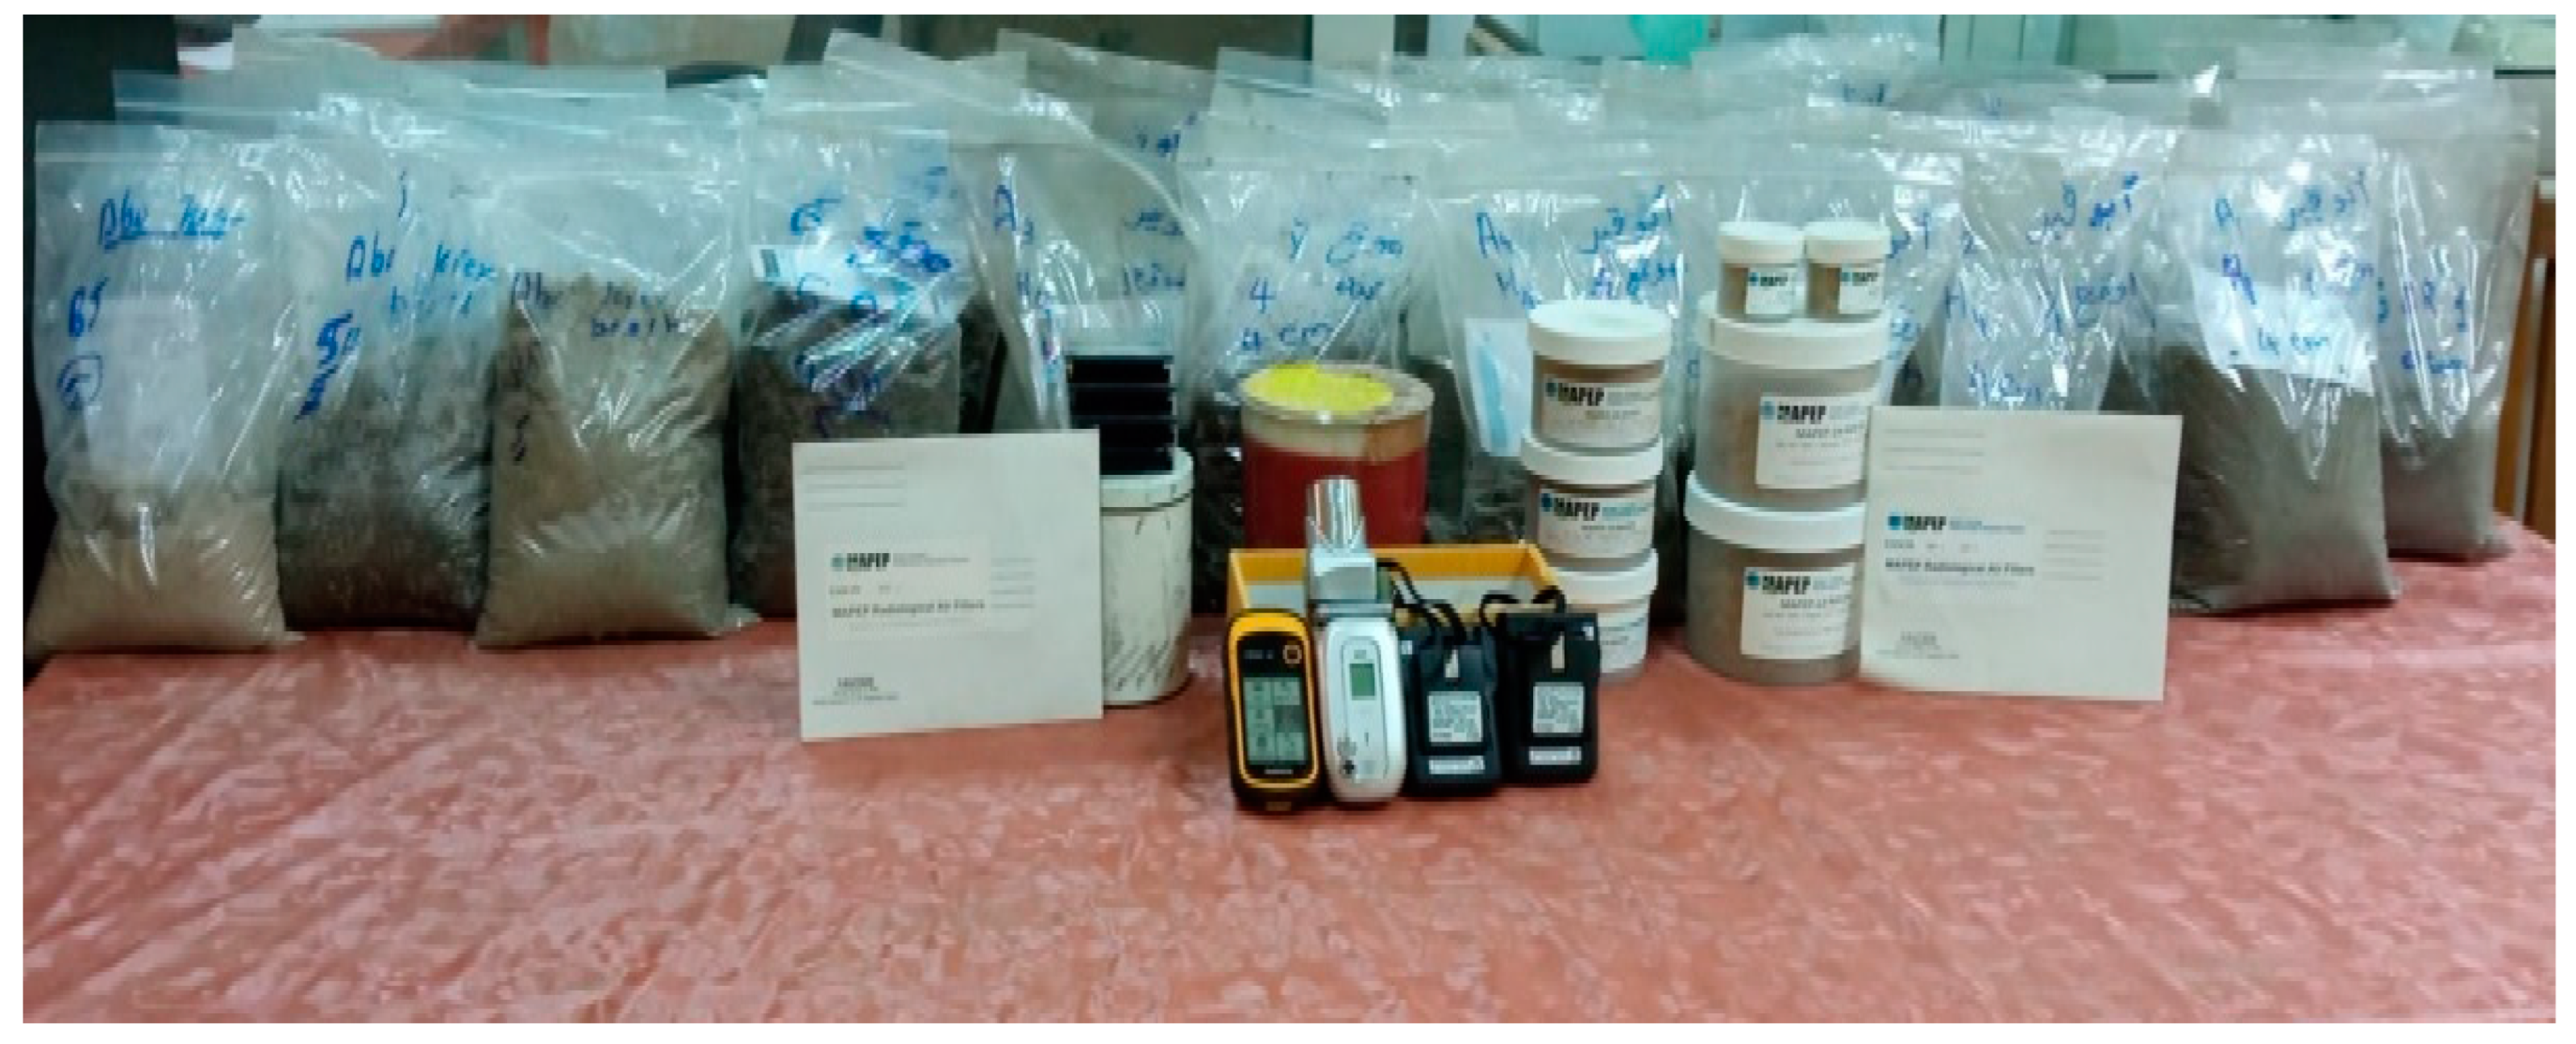
A total of 125 soil samples were collected from 25 sites throughout the investigated area. Each site was subjected to a sampling protocol where 5 samples were taken to represent single vertical soil columns of 5 successive depth levels. Each sample was collected by employing a template method of 1 m × 1 m up to a depth of 1 cm, and the subsequent depth levels were sampled using the same method. Each sample was pooled separately, and then approximately 1.5 kg of its mass was transferred to the radiation laboratory at the Institute of Graduate Studies and Research, Alexandria University, for radioactivity measurements. In the laboratory, the collected soil samples were dried in an oven at 105–110 °C for approximately 24 h, and then sieved through a 2 mm mesh-sized sieve to remove stones, pebbles, and other macro-impurities. The samples were homogenized by crashing and milling, and then weighed and packed in radioactivity measurement containers (Marinelli beakers with a 1 L capacity).

2.5. Radioactivity Measurements

The radioactivity of the prepared samples was measured by a gamma-ray spectrometer system consisting of a p-type coaxial HPGe with an efficiency of 24.5% and a resolution of 1.7 keV at 1.33 MeV. The detector was shielded using a 0.1 m thick cylindrical lead castle with an internal wall made of copper. The gamma-ray spectra were recorded using a PC-based 8192 channel analyzer and processed by Genie-2000 software, as shown in Figure 6. The spectrometer was calibrated for energy using a set of certified gamma radiation standard sources (137Cs, 60Co, 57Co, and 241Am). The gamma-ray energy spectra were accumulated for 50,000 s for each case. The counting efficiencies for the gamma-ray energies of 477.6 keV (with a yield of 10.3) from the decay of the 7Be and of 661.6 (with a yield of 0.85) from the decay of the 137Cs were determined for all soil samples. A certified standard source (152Eu) of shape and composition, simulating the investigated sample matrix, was used for the determination of these efficiencies. The efficiencies of detection were found to be 0.03 and 0.02 for 7Be and 137Cs, respectively. The decay of 7Be was corrected to the date of the sample collection. For internal quality control requirements, reference soil samples were analyzed during the measurements to confirm the two types of calibrations. Externally, the laboratory participates periodically in a proficiency testing (PT) program (MAPEP) for radiation measurements.
The minimum detectable activity (MDA) for 7Be was calculated using Equation (1) [21,22]. The minimum detectable activities of the mass M were calculated based on the counting conditions being 0.50 Bq·kg−1 and 0.11 Bq·kg−1 for 7Be and 137Cs, respectively.
M D A = L D T × E f f ( E ) × P γ ( E ) × M
where T is the counting time, Eff (E) is the full-energy photopeak efficiency at the photon energy E, and Pγ (E) is the emission probability. LD is the detection limit calculated by the following equation:
L D = L C + σ D
where LC is the critical level below which no signal can be detected, σ D is the standard deviation, and is the error probability. Figure 7 shows the method of stability classification based on 7Be residence in only the surface depth levels of the soil.

2.6. Soil Stability Indicator Calculations

2.6.1. Soil Erodibility and Residence Times

The soil credibility, K (y−1), was quantified as the annual scavenging rate of 7Be from the tested soil, as shown in Equation (3) [21,22].
I = K + λ A s
A s = A   ρ   d
where I (Bq/m2/yr) is the annual deposition rate of 7Be, given by [22] to be 785.7 Bq/m2/yr, λ (4.73 yr−1) is the nuclear decay constant of 7Be, As (Bq/m2) is the area concentration of 7Be, determined according to Equation (4), A is the mass concentration of 7Be in the sample (Bq/kg), ρ is the sample density (kg/m3), and d is the depth of the sample in (m).

2.6.2. Soil Relaxation

The estimated values of relaxation and deposition soil are mainly dependent on the mass relaxation coefficient, ho, and the initial concentration of 7Be or 137Cs in the soil surface, Co. The determination of the cited parameter is only possible based on the knowledge of the 7Be relaxation profile in the soil, according to Equation (5) [23].
C X = C O   e α x
where C(x) (Bq/kg−1) is the 7Be activity at the relaxation depth (x, cm), Co is the activity concentration at the surface, and α (cm−1) is the coefficient of the vertical distribution. The relaxation depth ho (cm) is defined as 1/α and represents the depth above which 63.2% of the total radionuclide inventory can be found [24,25].

3. Results and Discussion

3.1. Radionuclide Distribution

3.1.1. 7BeLevels in the Area

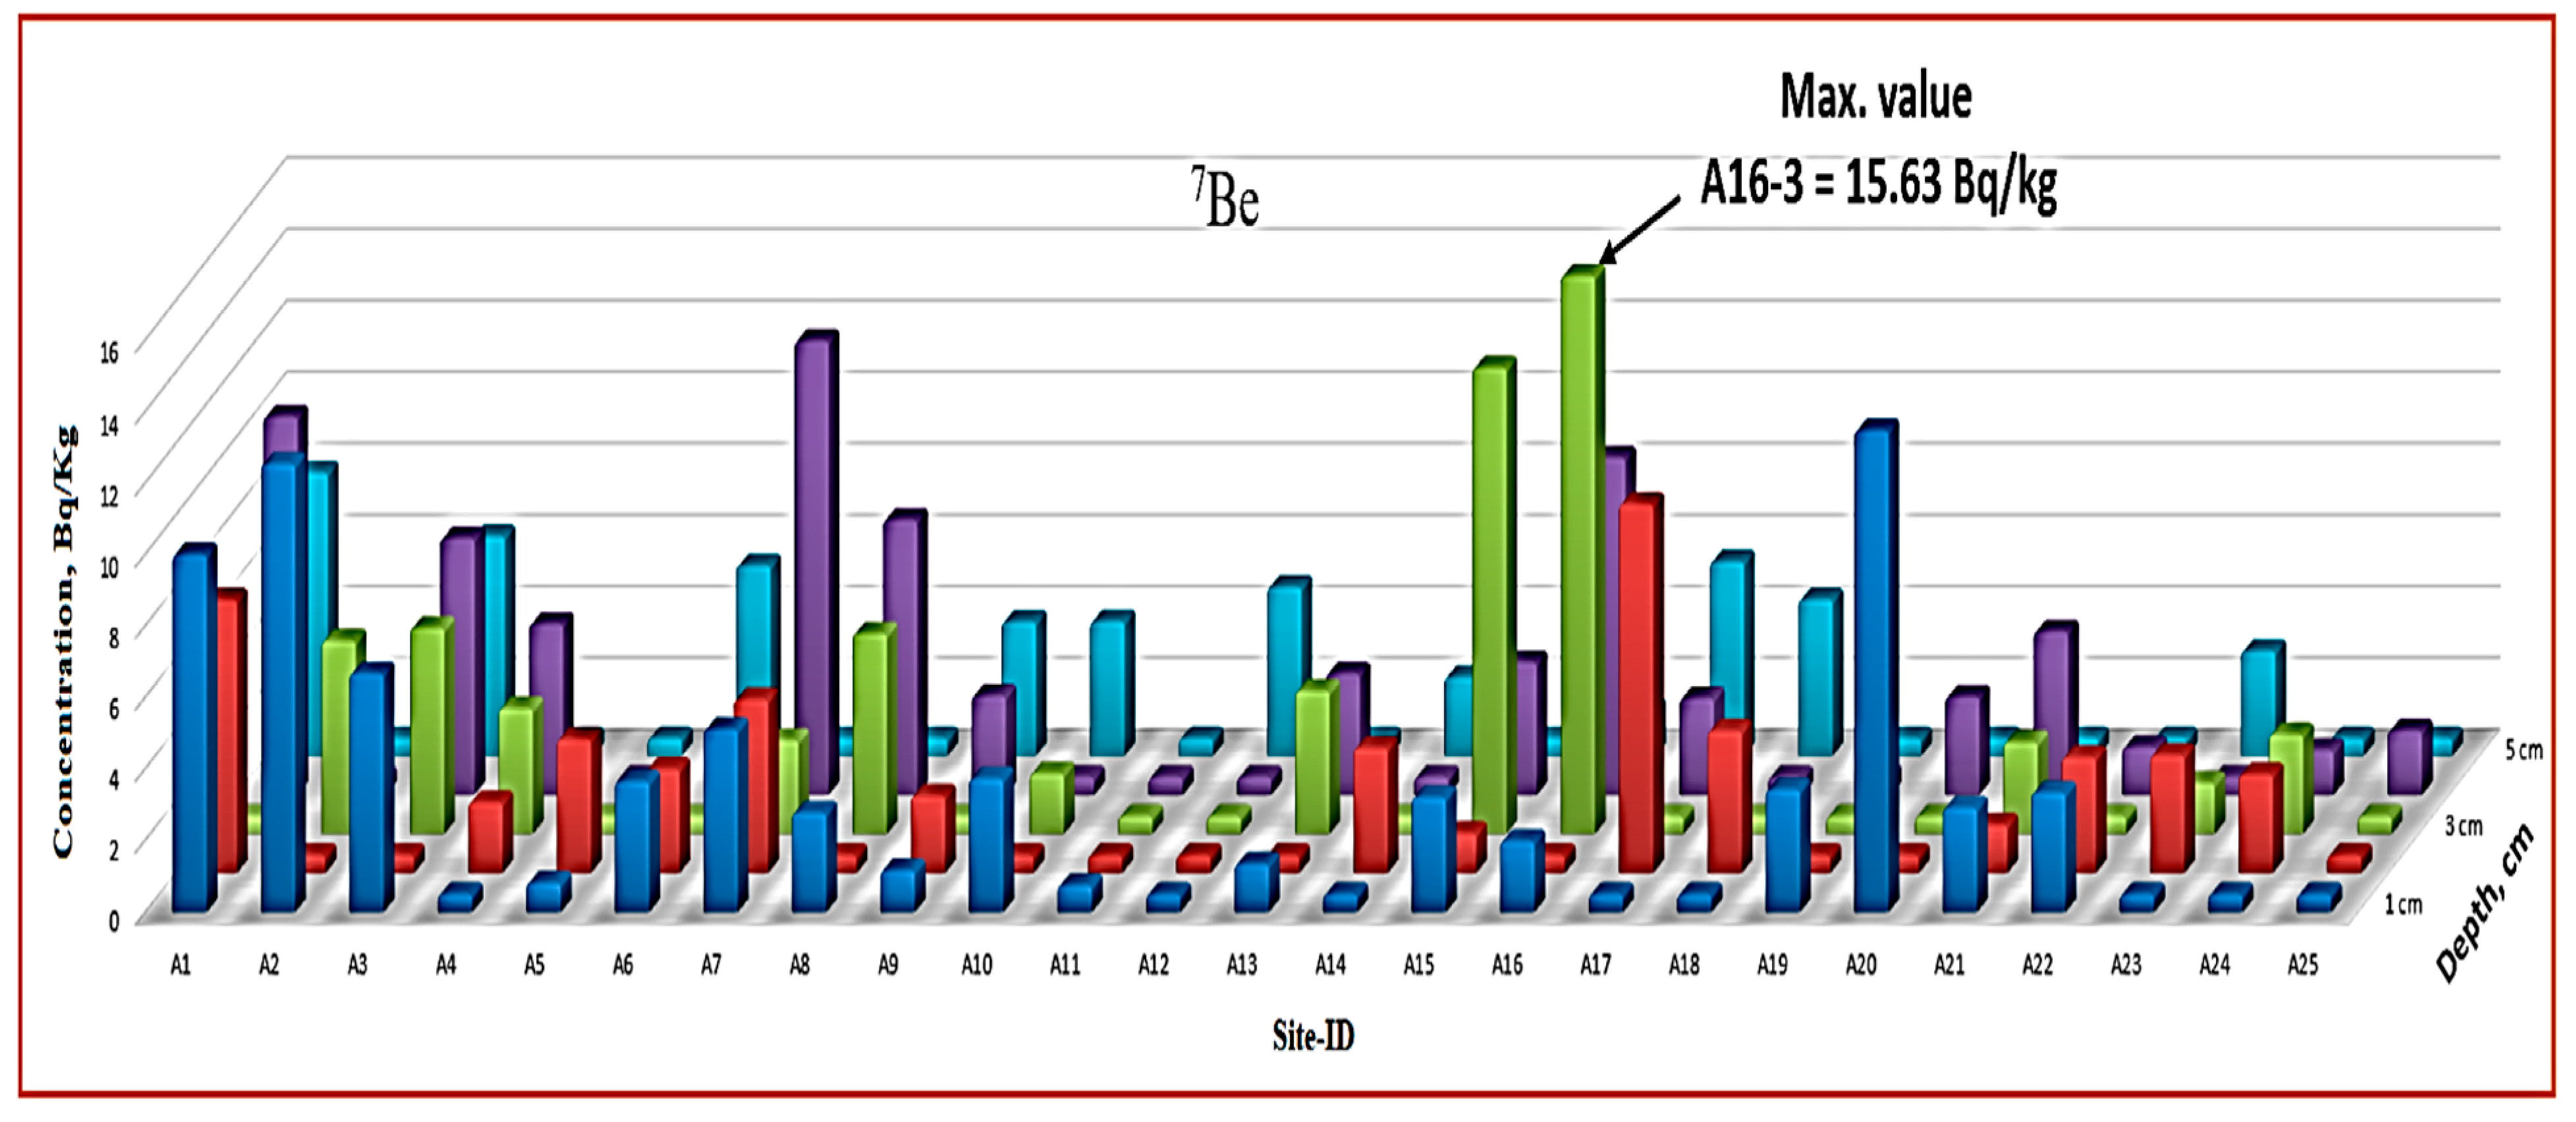
The 7Be activity concentrations in all studied sites ranged from lower than 0.50 Bq/kg (MDA) to 15.63 Bq/kg, and an average value of 2.77 Bq/kg was calculated. It was observed that about 44% of the levels were below the MDA. The maximum value was obtained in the (A16-3) Ketaa Elnahda-Elamria District, and the results are tabulated in Table 1. The distribution of the observed levels is illustrated in Figure 8. GIS mapping was carried out using ARC-model software (version number: 10.8.0.12790) to show the distribution throughout the whole investigated area, as shown in Figure 9.
Since 7Be formation does not occur in soil but is deposited on its surface from atmospheric fallout, and since it is characterized by a relatively short half-life (t1/2 = 54.3 days), it enables us to estimate the redistribution of soil across shorter timescales. The movement of this radionuclide in the soil is mainly controlled by soil transposition and stability. Therefore, the use of nuclear techniques enables the rigorous assessment of soil conservation measures and can help to determine soil sustainability for different soil uses [25].
The obtained 7Be levels in the soil depth levels were divided into four classes, reflecting the degree of stability of the soil. Based on this classification, the short-time soil stability ranged from very low stability, representing about 78% of the total studied sites, to the highest stability, representing about 5% of the total sites, as shown in Table 2.

3.1.2. 137Cs Levels in the Area

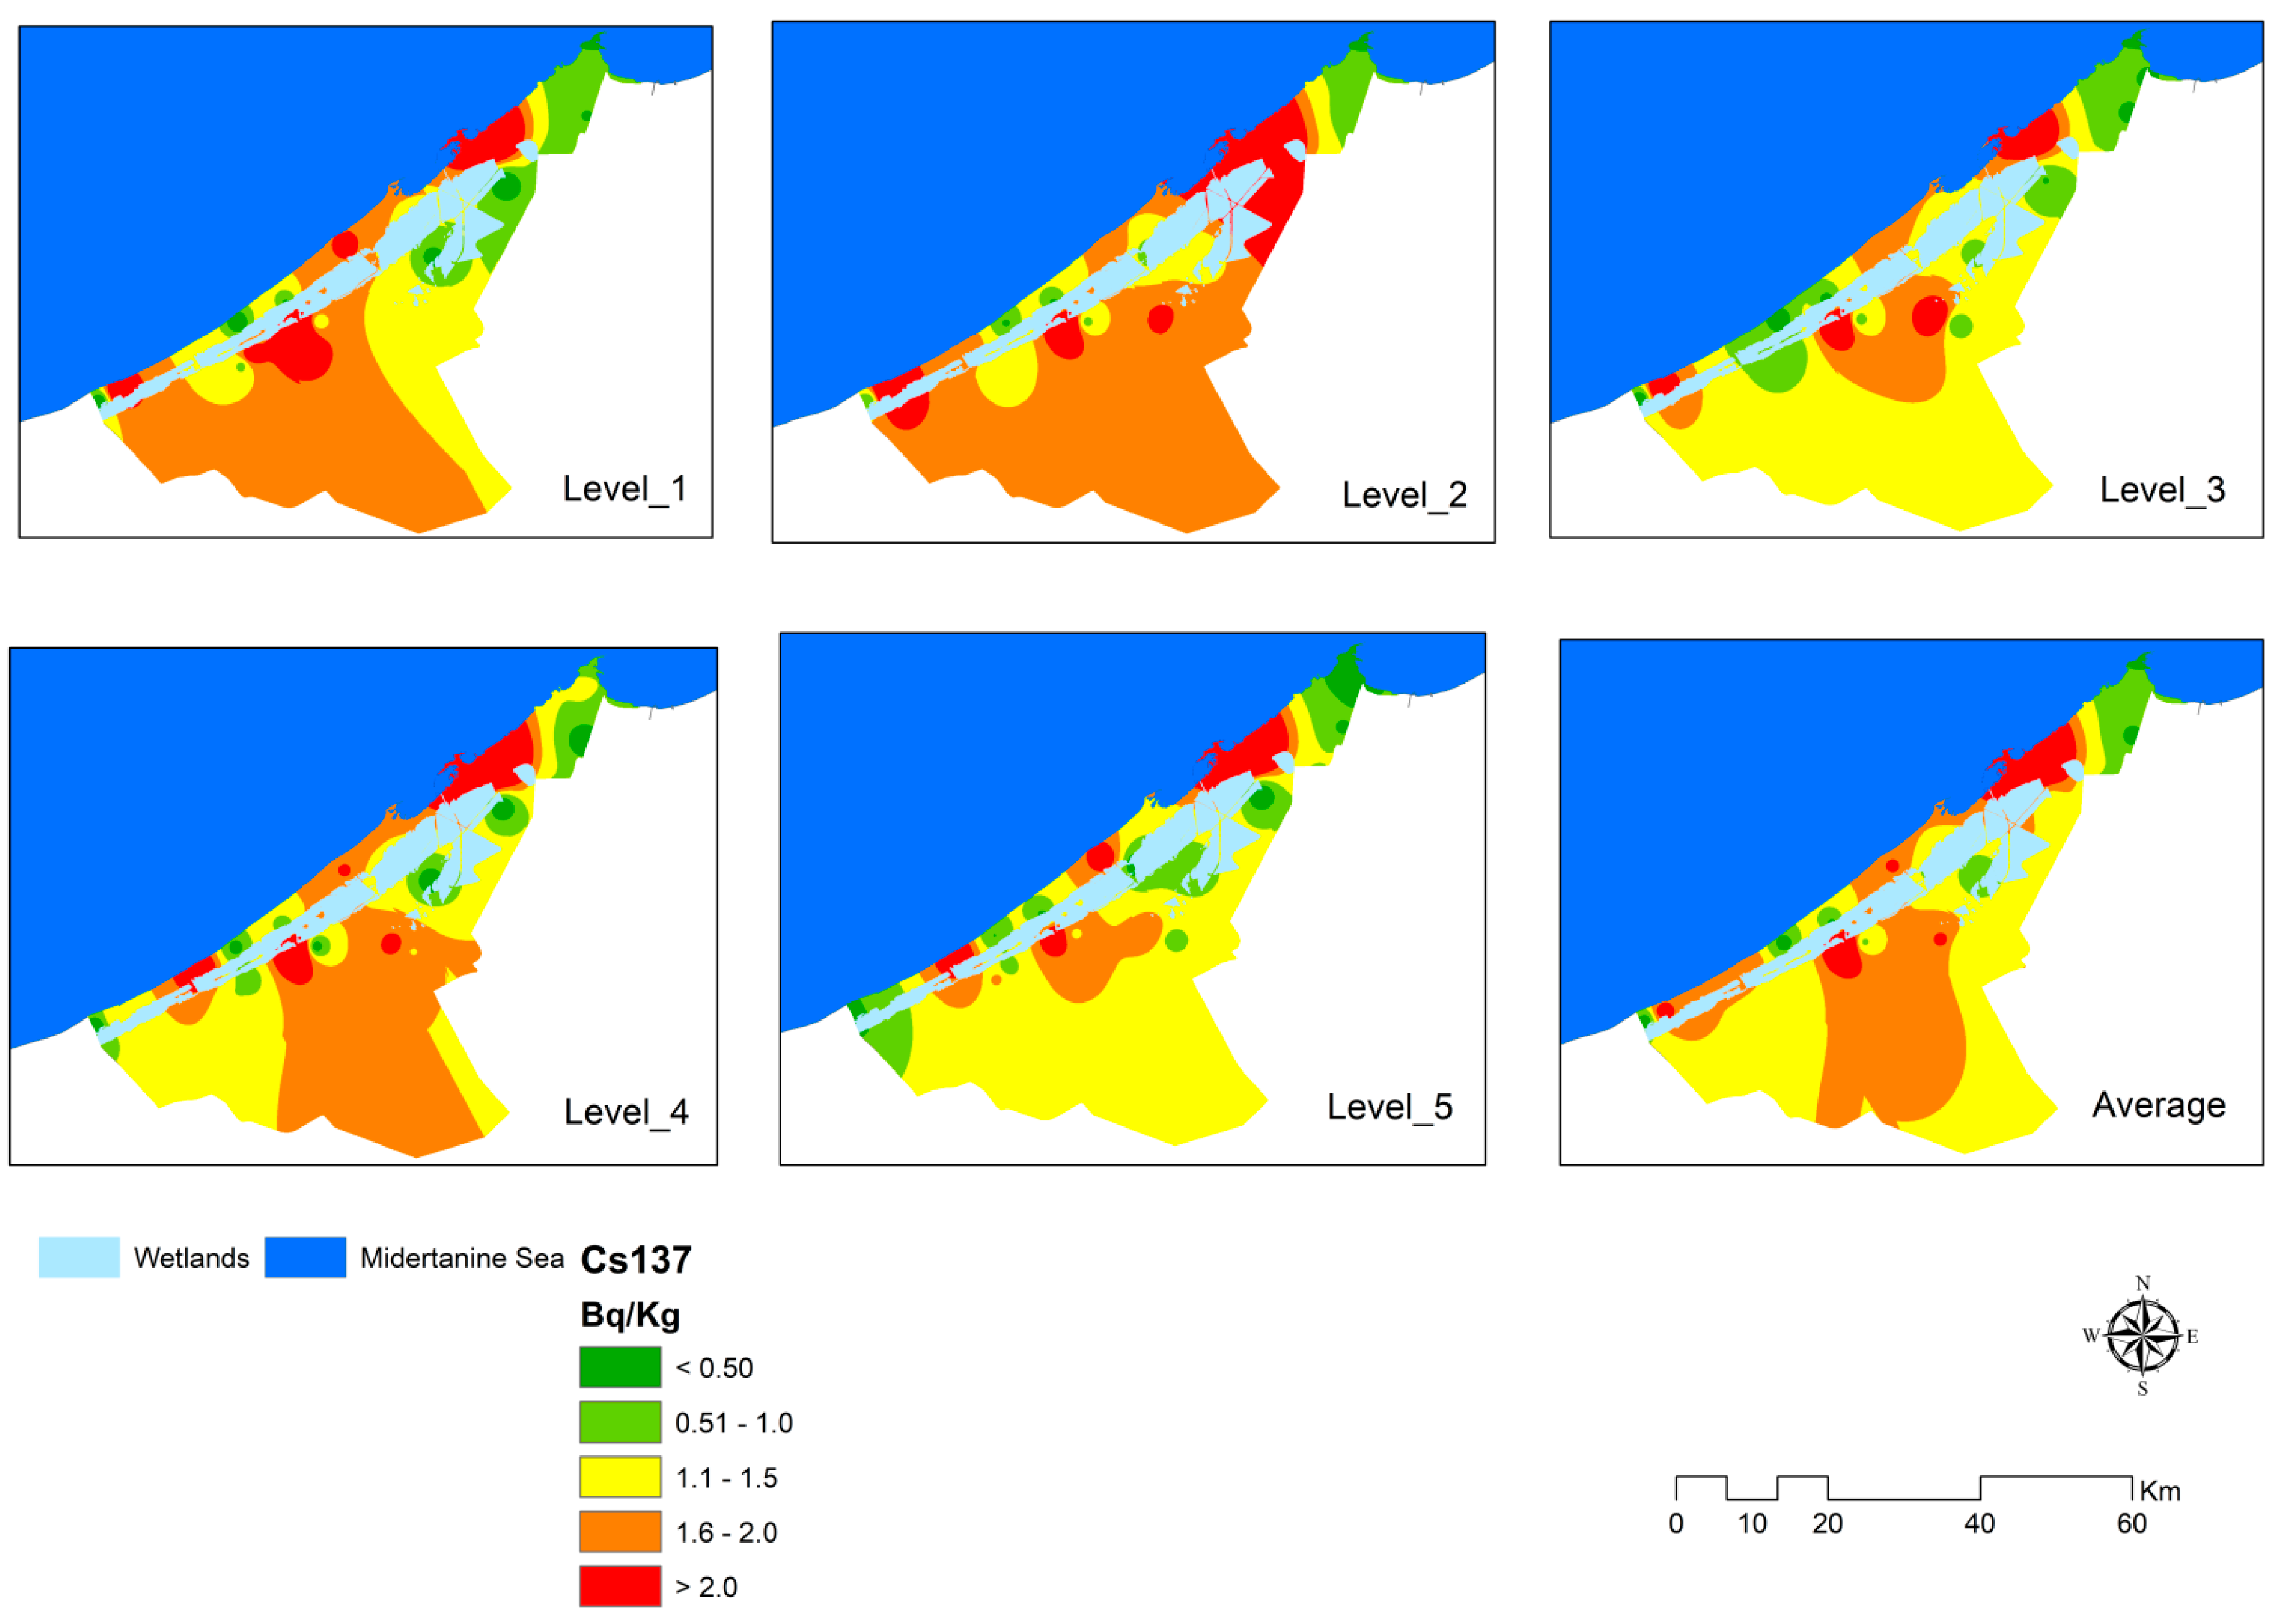
The measured levels ranged from 0.11 Bg/kg (MDA) to 7.86 Bq/kg. It was noticed that about 10% of sites recorded levels below the MDA, while the highest was in the Bab Sharqui and Wabor Elmia Wasat District (A1–4). The distribution is shown in Figure 10, and GIS mapping of the 137Cs distribution in the five depths and the average for the whole studied area (long-term stability) is illustrated in Figure 11. It is well known that 137Cs is released into the environment from human-made sources (nuclear fission), and its half-life is about 30 years; therefore, it is suitable for long-term soil stability assessment [19].
The range of variation was classified into four classes according to the degree of long-term of soil stability. The degree of stability ranged from very low stability to the highest. The percentage of very low stability represents about 80% of the area, 12.8% has low stability, and the areas of moderate and high stability are 5.6% and 1.6%, respectively, for the total studied sites, as shown in Table 3.

3.2. Soil Stability Indicators

Quantitative analyses were carried out for the annual soil erosion at each site. The annual erosion, KS (y−1), for the top layer of soil was assessed for each site, based on the 7Be residence in the surface layer only, and for the average value KA (y−1) of all depths at each site. The soil relaxation depth h0 (cm) was also deduced for the investigated sites.

3.2.1. Surface Erosion Assessment, KS (y−1)

The obtained results indicate that site A20 (Borg Elarab) is the only site that undergoes deposition (accretion) since its KS is a negative value, which means that the 7Be accumulates at this site with a level exceeding that of the fallout. On the other hand, the other sites recorded a wide range of surface erosion values, with very low erosion/very high stability (0.1 y−1) at site A5 (Sharq District), and the highest erosion/lowest stability (59.83 y−1) at site A12 (Elmontaza District). The classes of annual surface erosion and corresponding surface stabilities are listed in Table 4.

3.2.2. Average Erosion Assessment, KA (y−1)

The average erosion values, KA (y−1), were found to be the lowest (23.79 y−1) and the highest (103.39 y−1) at sites A5 (Sharq District) and A12 (Elmontaza District), respectively. The same behavior was observed for surface erosion; it was lowest at site A5 and highest at site A12. The classes of annual average erosion and their corresponding average stabilities are listed in Table 5.

3.2.3. Soil Subsidence h0 (cm)

Soil subsidence is an indicator of soil relaxation. The values were calculated based on fitting the concentrations of 7Be with the soil depths for the selected sites. Wide variations in the obtained subsidence values were recorded, and this could be attributed to the diversity of the nature of the soil in Alexandria. The average value was 0.6 cm at site A20 (Borg Elarab), and this was the only site that does not suffer from erosion, which confirms the high stability of this location. On the other hand, the highest subsidence was 83 cm, observed at site number A18 (Zawia Abe Elkader/Elamria). Other sites recorded high subsidence, such as Abokeer (site A10) and Elmontaza (site A6), with values of 16.67 cm and 9.1 cm, respectively. From this evidence, it is clear that the eastern side of Alexandria is suffering from soil subsidence, and consequently, it is more vulnerable. The classes of soil subsidence and their corresponding average stabilities are listed in Table 6.
The obtained results are in agreement with others reported by different studies using remote sensing techniques, which indicates that the eastern side of Alexandria is low-lying, suffers from severe changes such as erosion, and is vulnerable to accelerated sea-level rise [21]. Also, ref. [22] found that the eastern side of Alexandria is undergoing severe soil erosion. Therefore, the eastern region of the city is vulnerable to accelerated sea level rise. The soil textures in the area range from dominant sand, affected by the desert to the west, to clay on the eastern side, affected by the Nile River.
Comparisons with other results from different countries are listed in Table 7. The levels of soil subsidence may be attributed to the nature of the soil and the prevailing conditions in each area.

4. Conclusions

Alexandria Governorate is coastal city overlooking the Mediterranean Sea. The region is severely impacted by climate change, such as land erosion and subsidence, as a consequence of sea level rise. From this study, we can conclude the following points:
  • The results of the study on 7Be indicate that the distribution of its levels in the area is related to the soil stability in the short term. The evidence shows that about 73% of the area suffers from very low stability, 18% is classified as low stability, 4% as moderate, and only 5% is highly stable.
  • The 137Cs levels are related to long-period stability, and their distribution shows that about 80% of the area has very low stability. Furthermore, 13% is low, 6% is moderate, and only 5% is characterized by high stability.
  • The Borg El Arab area is the only area that is characterized by deposition of 7Be since the concentration of 7Be exceeds the concentration generated from its inventory.
  • The highest subsidence was observed in (Zawia Abe Elkader/Elamria), recording a value of 83 cm.
  • The lowest and highest values for surface erosion and average erosion were observed at the same sites: Sharq District and Elmontaza District, respectively.
  • It is clear that eastern Alexandria is suffering from soil subsidence and is consequently more vulnerable.
Recommendations
  • The obtained results can help in implementing soil conservation strategies where the study areas were found to suffer from the most instability.
  • This study can help decision makers employ sustainable land use management and soil conservation measures to mitigate the consequences of climate change and implement proper adaptation.
  • The developmental strategies at any selected site should be suitable for the geological hazards and geo-environmental conditions of the study area.
  • Nuclear techniques can provide reliable results for assessing land stability and can be applied for studying other regions.
  • The assessment of 137Cs and 7Be in highly heterogeneous environments, such as those found in the Mediterranean area, needs to be further investigated to improve the accuracy of the estimates of surface redistribution provided by environmental radionuclide fallout measurements.

Author Contributions

Methodology, M.E.; Software, N.M.I. and M.I.; Validation, I.H.S.; Formal analysis, N.M.I. and R.M.; Investigation, M.A.H.; Resources, Z.F.G., J.A. and M.I.; Data curation, M.A.H.; Writing—original draft, M.I. and M.E.; Writing—review & editing, M.E.; Visualization, Z.F.G.; Supervision, I.H.S.; Project administration, R.M.; Funding acquisition, J.A. All authors have read and agreed to the published version of the manuscript.

Funding

This research received no external funding.

Institutional Review Board Statement

Not applicable.

Informed Consent Statement

Not applicable.

Data Availability Statement

The data presented in this study are available on request from the corresponding author.

Conflicts of Interest

The authors declare no conflict of interest.

References

  1. Koning, N.; Smaling, E. Environmental crisis or ‘lie of the land’? The debate on soil degradation in Africa. Land Use Policy 2005, 22, 3–11. [Google Scholar] [CrossRef]
  2. Abu Hammad, A.; Tumeizi, A. Land degradation: Socioeconomic and environmental causes and consequences in the eastern Mediterranean. Land Degrad. Dev. 2012, 23, 216–226. [Google Scholar] [CrossRef]
  3. Eswaran, H.; Lal, R.; Reich, P.F. Land degradation: An overview. In Response to Land Degradation; CRC Press: Boca Raton, FL, USA, 2019; pp. 20–35. [Google Scholar]
  4. Pimentel, D.; Harvey, C.; Resosudarmo, P.; Sinclair, K.; Kurz, D.; McNair, M.; Crist, S.; Shpritz, L.; Fitton, L.; Saffouri, R.; et al. Environmental and economic costs of soil erosion and conservation benefits. Science 1995, 267, 1117–1123. [Google Scholar] [CrossRef] [PubMed]
  5. Rosskopf, C.M.; Di Iorio, E.; Circelli, L.; Colombo, C.; Aucelli, P.P. Assessing spatial variability and erosion susceptibility of soils in hilly agricultural areas in Southern Italy. Int. Soil Water Conserv. Res. 2020, 8, 354–362. [Google Scholar] [CrossRef]
  6. Matisoff, G.; Whiting, P.J. Measuring soil erosion rates using natural (7Be, 210Pb) and anthropogenic (137Cs, 239,240Pu) radionuclides. In Handbook of Environmental Isotope Geochemistry; Springer: Berlin/Heidelberg, Germany, 2012; pp. 487–519. [Google Scholar]
  7. Mabit, L.; Benmansour, M.; Walling, D.E. Comparative advantages and limitations of the fallout radionuclides 137Cs, 210Pbex and 7Be for assessing soil erosion and sedimentation. J. Environ. Radioact. 2008, 99, 1799–1807. [Google Scholar] [CrossRef]
  8. Walling, D.E. Use of 137Cs and Other Fallout Radionuclide in Soil Erosion Investigations: Progress, Problems and Prospects; IAEA: Vienna, Austria, 1998. [Google Scholar]
  9. Santos, I.R.; Burnett, W.C.; Godoy, J.M. Radionuclides as tracers of coastal processes in Brazil: Review, synthesis, and perspectives. Braz. J. Oceanogr. 2008, 56, 115–130. [Google Scholar] [CrossRef]
  10. Sukadana, K.; Dercon, G.; Mabit, L.F.; Zapata, M.; Zaman, M.L.; Nguyen, L.K.H. Soil-Specific Farming: Precision Agriculture; CRC Press: Boca Raton, FL, USA, 2015; Volume 22, p. 247. [Google Scholar]
  11. Jasiulionis, R.; Wershofen, H. A study of the vertical diffusion of the cosmogenic radionuclides, 7Be and 22Na in the atmosphere. J. Environ. Radioact. 2005, 79, 157–169. [Google Scholar] [CrossRef] [PubMed]
  12. Blake, W.H.; Walling, D.E.; He, Q. Using cosmogenic beryllium-7 as a tracer in sediment budget investigations. Geogr. Ann. Ser. A—Phys. Geogr. 2002, 84A, 89–102. [Google Scholar] [CrossRef]
  13. Heikkilä, U.; Beer, J.; Abreu, J.A.; Steinhilber, F. On the atmospheric transport and deposition of the cosmogenic radionuclides (10Be): A review. Space Sci. Rev. 2013, 176, 321–332. [Google Scholar] [CrossRef]
  14. Steinmann, P.; Billen, T.; Loizeau, J.L.; Dominik, V. Beryllium-7 as a tracer to study mechanisms and rates of metal scavenging from lake surface waters. Geochim. Cosmochim. Acta 1999, 63, 1621–1633. [Google Scholar] [CrossRef]
  15. Blake, W.H.; Walling, D.E.; He, Q. Fallout beryllium-7 as a tracer in soil erosion investigations. Appl. Radiat. Isot. 1999, 51, 599–605. [Google Scholar] [CrossRef] [PubMed]
  16. Ryken, N.; Al-Barri, B.; Taylor, A.; Blake, W.; Maenhout, P.; Sleutel, S.; Tack, F.; Dierick, M.; Bodé, S.; Boeckx, P.; et al. Quantifying the spatial variation of 7Be depth distributions towards improved erosion rate estimations. Geoderma 2016, 269, 10–18. [Google Scholar] [CrossRef]
  17. Taylor, A.; Blake, W.H.; Smith, H.G.; Mabit, L.; Keith-Roach, M.J. Assumptions and challenges in the use of fallout beryllium-7 as a soil and sediment tracer in river basins. Earth-Sci. Rev. 2013, 126, 85–95. [Google Scholar] [CrossRef]
  18. Sigurgeirsson, M.Á.; Arnalds, O.; Pálsson, S.E.; Howard, B.J.; Gudnason, K. Radiocaesium fallout behaviour in volcanic soils in Iceland. J. Environ. Radioact. 2005, 79, 39–53. [Google Scholar] [CrossRef] [PubMed]
  19. Andrello, A.C.; Guimarães, M.D.F.; Appoloni, C.R.; Nascimento Filho, V.F.D. Use of cesium-137 methodology in the evaluation of superficial erosive processes. Braz. Arch. Biol. Technol. 2003, 46, 307–314. [Google Scholar] [CrossRef]
  20. Abdrabo, M.A.; Abdelwahab, R.G.; Hassaan, M.A. Urban dynamics and potential vulnerability of coastal urban areas to sea level rise in the southeastern Levantine Basin. Urban Clim. 2022, 44, 101212. [Google Scholar] [CrossRef]
  21. Olsen, C.R.; Larsen, I.L.; Lowry, P.D.; Cutshall, N.H.; Nichols, M.M. Geochemistry and deposition of 7Be in river-estuarine and coastal waters. J. Geophys. Res. Ocean. 1986, 91, 896–908. [Google Scholar] [CrossRef]
  22. Saleh, I.H.; Abdel-Halim, A.A. 7Be in soil, deposited dust and atmospheric air and its using to infer soil erosion along Alexandria region, Egypt. J. Environ. Radioact. 2017, 172, 24–29. [Google Scholar] [CrossRef] [PubMed]
  23. Marestoni, L.D.; Martins, E.L.; Appoloni, C.R.; Andrello, A.C. 7Be Fallout for Superficial Soil Erosion Assessment; IAEA: Vienna, Austria, 2009. [Google Scholar]
  24. Isaksson, M.; Raaf, C.L. Environmental Radioactivity and Emergency Preparedness; CRC Press: Boca Raton, FL, USA, 2017. [Google Scholar]
  25. Taylor, A.; Blake, W.H.; Iurian, A.R.; Millward, G.E.; Mabit, L. The use of Be-7 as a soil and sediment tracer. In Assessing Recent Soil Erosion Rates through the Use of Beryllium-7 (Be-7); Springer: Cham, Switzerland, 2019; pp. 1–13. [Google Scholar]
  26. Mohamed, M.A.O. A Study on Radiological Baseline Assessment and Impacts of Nuclear Power Plant at El-Dabaa Region on Agriculture Soil of Alexandria-Egypt; Alexandria University: Alexandria, Egypt, 2018; Available online: https://maps.app.goo.gl/T3awoni3noQ4Bjzz6 (accessed on 20 January 2024).
  27. Jha, A.; Schkade, U.; Kirchner, G. Estimating short-term soil erosion rates after single and multiple rainfall events by modelling the vertical distribution of cosmogenic 7Be in soils. Geoderma 2015, 243, 149–156. [Google Scholar] [CrossRef]
  28. Schuller, P.; Iroumé, A.; Walling, D.E.; Mancilla, H.B.; Castillo, A.; Trumper, R.E. Use of beryllium-7 to document soil redistribution following forest harvest operations. J. Environ. Qual. 2006, 35, 1756–1763. [Google Scholar] [CrossRef] [PubMed]
Figure 1. Land use/cover of Alexandria Governorate.
Sustainability 16 01692 g001
Figure 2. Land elevation of the study area.
Sustainability 16 01692 g002
Figure 3. Geology information of the study area.
Sustainability 16 01692 g003
Figure 4. Picture of the collected samples.
Sustainability 16 01692 g004
Figure 5. Sampling sites.
Sustainability 16 01692 g005
Figure 6. Arrangement of HPGe detector.
Sustainability 16 01692 g006
Figure 7. The method of stability classification based on the amount of 7Be residence in each layer of soil.
Sustainability 16 01692 g007
Figure 8. 7Be concentrations in the studied area.
Sustainability 16 01692 g008
Figure 9. 7Be distribution at five depths and the average for the whole studied area (short-term stability).
Sustainability 16 01692 g009
Figure 10. 137Cs concentrations in the studied area.
Sustainability 16 01692 g010
Figure 11. 137Cs distribution in the five studied depths and the average distribution for the whole studied area (long-term stability).
Sustainability 16 01692 g011
Table 1. The 7Be and 137Cs concentrations of the present sites taken from five soil samples at each site.
Site IDLocation Name7Be-Specific Activity (Bq/kg)137Cs-Specific Activity (Bq/kg)
1 cm2 cm3 cm4 cm5 cm1 cm2 cm3 cm4 cm5 cm
A1Bab Sharqui and Wabor Elmia10.01 ± 0.057.65 ± 0.05≤0.5010.59 ± 0.057.93 ± 0.055.08 ± 0.045.39 ± 0.043.63 ± 0.027.86 ± 0.056.47 ± 0.04
A2Elagamy Elkeblia_Om Zigo12.54 ± 0.07≤0.505.41 ± 0.04≤0.50≤0.501.49 ± 0.020.73 ± 0.011.22 ± 0.021.21 ± 0.02≤0.11
A3Sharq6.68 ± 0.03≤0.505.77 ± 0.047.19 ± 0.046.15 ± 0.040.41 ± 0.011.13 ± 0.021.10 ± 0.020.84 ± 0.020.84 ± 0.02
A4Sharq≤0.501.98 ± 0.013.52 ± 0.034.79 ± 0.04≤0.500.83 ± 0.020.23 ± 0.000.63 ± 0.010.62 ± 0.011.52 ± 0.02
A5Sharq0.82 ± 0.013.75 ± 0.04≤0.50≤0.50≤0.500.18 ± 0.001.01 ± 0.020.41 ± 0.010.48 ± 0.010.97 ± 0.01
A6Eltwfekia3.66 ± 0.032.91 ± 0.03≤0.50≤0.505.33 ± 0.040.48 ± 0.010.52 ± 0.010.44 ± 0.01≤0.110.42
A7Sharq5.12 ± 0.044.86 ± 0.042.63 ± 0.0212.71 ± 0.06≤0.500.72 ± 0.010.93 ± 0.020.43 ± 0.010.70 ± 0.010.23 ± 0.01
A8Elmaamora2.78 ± 0.01≤0.505.61 ± 0.047.70 ± 0.05≤0.500.92 ± 0.010.73 ± 0.010.80 ± 0.011.26 ± 0.020.32 ± 0.01
A9Abeis 71.17 ± 0.012.16 ± 0.02≤0.502.78 ± 0.033.76 ± 0.030.13 ± 0.004.84 ± 0.040.49 ± 0.01≤0.11≤0.11
A10Abokeer Elgariba3.74 ± 0.03≤0.501.70 ± 0.01≤0.503.77 ± 0.03≤0.11≤0.110.18 ± 0.000.56 ± 0.010.32 ± 0.01
A11Abokeer Elgariba0.75 ± 0.01≤0.50≤0.50≤0.50≤0.50≤0.11≤0.11≤0.110.45 ± 0.010.23 ± 0.01
A12Elmontaza District≤0.50≤0.50≤0.50≤0.504.73 ± 0.04≤0.110.75 ± 0.01≤0.110.32 ± 0.010.48 ± 0.01
A13Elhawaria1.35 ± 0.01≤0.504.01 ± 0.033.40 ± 0.03≤0.505.41 ± 0.024.43 ± 0.044.37 ± 0.035.12 ± 0.042.99 ± 0.02
A14Shyakha Baheg≤0.503.50 ± 0.03≤0.50≤0.502.21 ± 0.012.53 ± 0.031.36 ± 0.020.77 ± 0.010.71 ± 0.010.75 ± 0.01
A15Shyakha Baheg3.21 ± 0.031.12 ± 0.0113.05 ± 0.063.72 ± 0.03≤0.500.87 ± 0.021.32 ± 0.010.84 ± 0.020.99 ± 0.021.57 ± 0.02
A16Ketaa Elnahda1.99 ± 0.01≤0.5015.63 ± 0.089.44 ± 0.061.29 ± 0.011.18 ± 0.011.57 ± 0.020.56 ± 0.011.49 ± 0.020.80 ± 0.01
A17Ketaa Maryout≤0.5010.33 ± 0.06≤0.502.71 ± 0.025.44 ± 0.041.13 ± 0.022.28 ± 0.032.96 ± 0.032.19 ± 0.011.99 ± 0.03
A18Zawia Abe Elkader≤0.503.98 ± 0.04≤0.50≤0.504.38 ± 0.040.38 ± 0.011.08 ± 0.020.86 ± 0.010.27 ± 0.010.64 ± 0.01
A19Elzraa Elbahary3.43 ± 0.03≤0.50≤0.500.53 ± 0.01≤0.502.17 ± 0.031.71 ± 0.021.97 ± 0.022.05 ± 0.012.42 ± 0.03
A20Borg Elarab13.48 ± 0.06≤0.50≤0.502.75 ± 0.03≤0.50≤0.110.46 ± 0.010.21 ± 0.000.36 ± 0.010.50 ± 0.01
A21Elsahal Elshamaly2.92 ± 0.031.35 ± 0.012.57 ± 0.034.58 ± 0.04≤0.501.37 ± 0.021.68 ± 0.010.94 ± 0.022.94 ± 0.032.79 ± 0.01
A22Hod Sokara We Abo-Hamad3.34 ± 0.033.24 ± 0.03≤0.501.33 ± 0.01≤0.502.86 ± 0.033.45 ± 0.032.81 ± 0.031.45 ± 0.010.78 ± 0.02
A23Hod Sokara We Abo-Hamad≤0.503.30 ± 0.031.43 ± 0.01≤0.502.94 ± 0.030.26 ± 0.010.65 ± 0.010.27 ± 0.010.33 ± 0.010.17 ± 0.01
A24Elhawaria≤0.502.76 ± 0.032.79 ± 0.031.25 ± 0.02≤0.500.41 ± 0.010.39 ± 0.010.26 ± 0.010.56 ± 0.010.41 ± 0.01
A25Elhawaria≤0.50≤0.50≤0.501.81 ± 0.01≤0.501.19 ± 0.020.85 ± 0.020.80 ± 0.020.29 ± 0.011.46 ± 0.02
Table 2. 7Be classes and their percentages in the total studied area.
Range of 7Be
in Bq/kg
Stability ClassArea Percentage %
0–3.9Very low73%
4–7.9Low18%
8–11.9Moderate4%
12–16High5%
Table 3. 137Cs classes and their percentages in the study area.
Range of 137Cs
in Bq/kg
Stability ClassArea Percentage %
0–1.9Very low80%
2–3.9Low12.8%
4–5.9Moderate5.6%
6–8High1.6%
Table 4. The classes of annual surface erosion and corresponding surface stabilities.
Erosion Class (y−1)ErosionStabilityArea (km2)%
<0Accretion (-)Deposition (Buildup)2.240.13
0–5Very LowVery High83.504.97
5–10LowHigh662.8439.47
10–15ModerateModerate747.9644.54
15–20HighLow121.457.23
>20Very HighVery Low61.493.66
Table 5. The classes of annual average erosion and corresponding average stabilities.
Erosion Class (y−1)ErosionStabilityArea (km2)%
<45Very LowVery High127.227.58
45–50LowHigh299.6017.84
50–55ModerateModerate192.9111.49
55–60HighLow346.2520.62
>65Very HighVery Low712.1442.48
Table 6. The classes of subsidence and corresponding average stabilities.
Subsidence Class (cm)RelaxationStabilityArea (km2)%
<3Very LowVery High95.805.70
3–6LowHigh458.6327.31
6–9ModerateModerate495.3729.50
9–15HighLow358.6121.35
>15Very highVery Low271.0416.14
Table 7. The comparison of subsidence (h) of the depth profiles of 7Be from different sites around the world.
h (cm)ReferenceCity/Country
0.6–83Present studyAlexandria/Egypt
0.87–1.26[26]Alexandria/Egypt
(Agricultural Soil)
1.35–6.80[14]Alexandria/Egypt
1.60[27]Germany
4.17[23]Brazil
2.14[28]Chile
5.40[15]UK
Disclaimer/Publisher’s Note: The statements, opinions and data contained in all publications are solely those of the individual author(s) and contributor(s) and not of MDPI and/or the editor(s). MDPI and/or the editor(s) disclaim responsibility for any injury to people or property resulting from any ideas, methods, instructions or products referred to in the content.