Article

Spatial Distribution, Ecological Risk Assessment, and Source Identification of Metals in Sediments of the Krka River Estuary (Croatia)

Division for Marine and Environmental Research, Ruđer Bošković Institute, Bijenička Cesta 54, 10000 Zagreb, Croatia
*
Author to whom correspondence should be addressed.
Sustainability 2024, 16(5), 1800; https://doi.org/10.3390/su16051800
Submission received: 26 December 2023 / Revised: 9 February 2024 / Accepted: 17 February 2024 / Published: 22 February 2024

Abstract

:
To evaluate the level of contamination and predict the potential toxicity risk, selected metal concentrations (Cd, Pb, Cr, Mn, Co, Ni, Cu, Zn, and As) were determined in 40 surface sediment samples from the stratified karstic Krka River estuary (Croatia). In addition, diffusive gradients in thin films (DGT) probes were deployed in situ to understand the mobilization mechanisms and bioavailability of metals in the sediment. The results show significant spatial differences between the upper and lower estuary, with the latter being more affected by anthropogenic pollution. The pollution assessment using the enrichment factor (EF), the geoaccumulation index (Igeo), and the pollution load index (PLI) showed a strong enrichment of metals in the lower part of the estuary, especially of Mn, Cu, Zn, Pb, and As. The statistical analysis (PCA) revealed the former ferromanganese factory and the port as major sources of pollution in the area. Nickel, Co, and Cr, although slightly elevated, may be attributed to the natural origin. The metal mobility in the estuarine sediment was primarily governed by early diagenetic processes (aerobic organic matter mineralization, Fe and Mn oxyhydroxide reduction), which caused the release of metals from the sediment into the pore water and subsequently into the overlying water column.

1. Introduction

Historically, estuaries have been preferable places of human settlement because of their favorable position between marine and terrestrial environments [1]. The increasing development of human activities, including rapid urbanization and industrialization, has placed significant pressure on estuarine ecosystems. Of particular note is the deterioration of the estuarine ecosystem resulting from the anthropogenic input of contaminants, among which metals are recognized as a significant environmental threat because of their persistence, toxicity, and bioaccumulation. Upon introduction into the aquatic environment, metals undergo redistribution between abiotic and biotic compartments. A significant portion of these metals promptly associate with inorganic and organic particles, leading to their deposition and subsequent accumulation in sediments [2,3,4]. It is widely recognized that sediments are not just a final repository for contaminants; they can also be a source of contamination for the water column via chemical (desorption, diffusion), physical (resuspension), and biological (bioturbation, bioirrigation) processes [5,6,7,8]. Indeed, metals can be recycled many times across the sediment–water interface (SWI) prior to their ultimate deposition in the sediment or release into the overlying water [9,10]. Hence, metal contamination in sediments can result in deterioration of the water quality and pose adverse effects on aquatic organisms, causing long-term implications for ecosystem and human health [11,12,13,14,15,16].
Owing to the above-described properties and the ability to record and combine environmental events over time, sediments provide useful spatial and temporal information [5,17]. Therefore, they are increasingly being used to assess the impact of anthropogenic activities on the condition of aquatic environments. To evaluate sediment quality in terms of metal pollution, total metal concentrations may be used to calculate various environmental quality indices, such as the enrichment factor (EF), geoaccumulation index (Igeo), and pollution load index (PLI). Furthermore, total sediment chemistry can be used to assess the impact of contaminated sediment on the surrounding environment, particularly on the benthic community, by comparing the measured values with the empirically based sediment quality guidelines (SQG). These guidelines have been developed by matching field sediment chemistry and field or laboratory biological effects data [18,19] and have become an important tool for identifying contaminants and regions of concern [20,21]. To further investigate the toxicity of sediment, it is generally recommended to assess the bioavailability of the metal contaminants. The diffusive gradients in thin film (DGT) are passive samplers that are used for in situ measurements of labile metal species present in pore water and weakly bound metals that could be released from the solid phase [22]. This simple device (probe), developed by Davison and Zhang [23], uses a hydrogel binding layer impregnated with, e.g., Chelex resin to selectively accumulate metal cations in a time-integrated manner; therefore, it is increasingly being applied in environmental studies with a focus on metal bioavailability and toxicity in the water column, sediment, and SWI [24,25,26,27].
In this study, the above-described approaches were applied to assess the sediment quality and ecological state of a typical highly stratified Mediterranean estuary. The Krka River estuary is a marine protected area (MPA) and a well-known site for mussels and fish farming. Most of the Krka River’s freshwater section is protected as a national park, meaning that there is negligible human pressure in the area upstream of the estuary. As a result, the freshwater entering the estuary, as well as the estuarine water, is extremely clean in terms of trace metals [28,29]. In the sediments of the lower Krka River estuary, however, several studies have found elevated quantities of Hg [30,31] and Cd, Pb, Cd, and Cu [32,33,34]. The increased concentrations in this part of the estuary are most probably related to the human activities within the Šibenik Bay, i.e., to the untreated wastewater discharge, the ferromanganese industry, repair shipyard, and phosphate transshipment port. Currently, some of the sources are eliminated; wastewater has been treated and discharged in the open sea since 2007, and the electrode and ferroalloy factory (TEF factory) was closed nearly three decades ago. However, the removal of industry from the estuary resulted in the growth of nautical tourism, which poses a new anthropogenic threat to the estuarine ecosystem [28,35]. Concerning elevated concentrations reported previously in the Krka River estuary and changes in contamination sources, a detailed study was conducted in order to (1) determine the spatial distribution of metals in surface sediments, (2) evaluate the degree of recent sediment contamination, and assess the potential ecological risk of these metals to the estuarine environment, and (3) establish the relationship between metal concentrations and possible anthropogenic sources. Given that the Krka River estuary is a marine protected area (MPA), the results of this study will be of great importance to stakeholders and local authorities because they will provide essential information for the strategic design of future pollution control and sustainable management of the MPA.

2. Materials and Methods

2.1. Study Site

The karstic Krka River estuary, situated in the Eastern Middle Adriatic (Croatia), has a total length of 23 km (Figure 1). The depth of the estuary gradually increases from <2 m at the head of the estuary to 42 m at the mouth [36]. The catchment area is predominantly composed of Upper Cretaceous and Eocene limestones, with a subordinate quantity of clastic rocks [36,37]. Similar to other Mediterranean estuaries, it is characterized by a narrow tidal range (0.2–0.5 m) and almost negligible tidal currents. The micro-tidal environment combined with the sheltered geographical position induces permanent vertical stratification, where the depth and thickness of the halocline vary, depending on the riverine freshwater inflow. The main water supplier is the Krka River, with a mean annual discharge of ~50 m3 s−1 and considerable seasonal variations ranging from 5 to 480 m3 s−1 [38]. The input of terrigenous material into the estuary through the primary waterway (the Krka River) is typically low. This is due to the karstic drainage area and the presence of tufa barriers along the stream, which substantially reduce the transport of suspended material. The main supplier of terrigenous material is the small tributary Guduča, whose catchment area is composed mainly of Upper Eocene-Oligocene flysch and flysch-like deposits. Notably, there are no tufa barriers present along the watercourse that could effectively retain particulate material [36,39,40].

2.2. Sediment Sampling and Analysis

Surface sediment (0–5 cm) sampling of the Krka River estuary was conducted in the summer of 2016 using a Uwitec gravity corer (Mondsee, Austria) (PVC tubes, diameter = 9 cm). In total, 40 samples were collected, with higher sampling density in Šibenik Bay, an estuary area that is more exposed to anthropogenic pressures. The samples were stored in high-density polyethylene (HDPE) containers and preserved at −20 °C until further treatment. Before analysis, all samples were lyophilized and sieved under 2 mm, and a subsample of the < 2 mm fraction was ground for subsequent multi-element analysis. The particle size distribution was determined using a laser diffraction particle size analyzer LS 13320 (Beckman Coulter Inc., Brea, CA, USA) with a measuring range of 0.4–2000 μm. Each sample was dispersed in deionized water and treated in an ultrasonic bath (3 min) before analysis. All samples were measured in triplicate. The total carbon (C) in the sediment was measured using a Thermo Scientific Flash 2000 CHNS Analyzer (Waltham, MA, USA). Samples were weighed (~10–15 mg) in a tin capsule and introduced into the combustion reactor via the Thermo Scientific™ MAS™ 200R autosampler (Waltham, MA, USA) along with an appropriate quantity of oxygen. Soil NC Reference Material (Thermo Scientific, Waltham, MA, USA) was used as the control. To determine the semi-total concentrations of Al, Fe, Li, Ti, Cd, Pb, U, Cr, Mn, Co, Ni, Cu, Zn, As, and P, ~100 mg of sediment subsamples were digested in Teflon (PTFE) bombs with 10 mL of aqua regia (HNO3:HCl 1:3, Trace Analysis grade, Fisher Scientific, Waltham, MA, USA) in a microwave oven (Multiwave 3000, ANTON PAAR, Graz, Austria) at controlled pressure and temperature (step 1: 1200 W power for 10 min—hold 40 min, step 2: 0 W power for 20 min). After digestion, the homogenous solutions were filtered and diluted to 100 mL with MQ water (Milli-Q water, 18.2 MΩ, Millipore, Burlington, VT, USA). In the same way, a composite sample of slag collected in the TEF factory area was processed. Before analysis by high-resolution inductively coupled plasma mass spectrometry (HR ICP-MS, Element 2, Thermo, Bremen, Germany), samples were acidified with 2% HNO3 (suprapur), and indium (1 μgL−1) was added as an internal standard. The instrumental settings are provided in Table S1. The analyses were performed at the Ruđer Bošković Institute, Division for Marine and Environmental Research. Quality control of the analytical procedure was performed by simultaneous analysis of blank and certified reference material (PACS-2, National Research Council of Canada, Ottawa, ON, Canada) (Table S2).

2.3. Diffusive Gradients in Thin Films and Supporting Pore Water Analysis

As the total dissolved concentration of trace elements is not sufficient to interpret their mobility, reactivity, and toxicity/bioavailability, the well-accepted technique of DGT sediment probes was applied. It is a passive sampling technique that allows labile metals present in pore waters and weakly bound to the solid phase to be assessed in situ in a time-integrated manner [22,25]. Two DGT sediment probes (exposure window 150 × 18 mm, diffusive gel 0.08 mm) (DGT Research Ltd., Lancaster, UK) were placed in sediment in situ for 94 h in the marina-shipyard area (close to sampling station 32). Upon retrieval, the DGT probes were rinsed with MQ water, disassembled, and sliced using a Teflon-coated razor blade with a resolution of 5 mm. Each slice was extracted in 1.5 Ml 1 M HNO3 (Merck, Darmstadt, Germany, Suprapur). The DGT eluates were diluted 3-fold before the measurement of extracted metals (Fe, Mn, Cd, Zn, Pb, Cu, Co, and Ni) by HR ICP-MS. Indium (1 μgL−1) was added as an internal standard. A five-point external standard calibration (0, 0.1, 1, 10, and 100 ppb) was used for the determination of unknown concentrations in DGT eluates.
The fluxes (F) induced by DGT can be calculated using the following Equation (1):
F = M A · t   ,
where M is the mass of the solute accumulated on the binding gel, A is the exposure area, and t is the deployment time. The accumulated mass can be calculated as follows (2):
M = C e ( V g + V e ) f e   ,
where Ce is the concentration of the metal measured in the elution solution, Vg is the volume of the gel, Ve is the volume of the elution solution, and fe is the elution efficiency (0.8).
To provide supporting information for the interpretation of the DGT results, two sediment cores were collected by a diver at the DGT deployment site. The first core had predrilled holes (each cm) and was used only to measure pH and Eh in the sediment. For the pH and Eh measurement, an expandable ion analyzer EA 920 (Orion Research, Cambridge, MA, USA) was used combined with a glass electrode (Fisherbrand 1179–6348, Fisher Scientific, Waltham, MA, USA) for pH and Pt electrode vs Ag/AgCl (saturated KCl) reference electrode for Eh. The second core was used to retrieve pore water samples. To extract the pore water, the sediment core was sliced at a resolution of 1 cm, and each slice was centrifuged (in 2 × 50 mL centrifuge tubes for 15 min at 4000 rpm at 20 °C, Sigma 3–18 K, Osterode am Harz, Germany). Porewater samples were filtered (0.2 µm on-line syringe filters, cellulose nitrate, Sartorius, Göttingen, Germany), stored in pre-calcinated (4 h, 450 °C) glass tubes (24 mL (Wheaton Industries Inc., Millville, NJ, USA) with Teflon/silicon septum La-pha-pack GmbH, Langerwehe, Germany), and poisoned with NaN3 (1 mM final concentration, Sigma Aldrich, St. Louis, MO, USA). Dissolved organic carbon was measured using a TOC-VCSH analyzer (Shimadzu, Kyoto, Japan), and certified reference material (MISSIPPI-03, Environment Canada, Burlington, ON, Canada) was used to validate the analytical results.

2.4. Sediment Contamination Assessment

To differentiate between naturally occurring metal concentrations in sediments and anthropogenic contamination, EF, Igeo, and PLI were calculated. Data from the sediment core (layer 34–36 cm) sampled at the top of the Krka River estuary [39] were used as background values for the calculations. The observed layer was deposited approximately 180 years ago, according to a local sedimentation rate of 2 mm y−1 [41], i.e., prior to industrialization in the studied area.

2.4.1. Enrichment Factor (EF)

The EF is an effective tool for evaluating the degree of anthropogenic impact on sediment, and it is calculated as follows (3):
E F = M x s a m p l e M x b a c k g r o u n d   ,
where the (M/x) sample is the ratio between the concentrations of the examined metal and the conservative element in the analyzed sample, and the (M/x) background is the ratio between the concentrations of the examined metal and the conservative element in the natural background. Several conservative elements, including Al, Fe, Li, and Ti, may be used. Due to its superior recovery rate compared with Al, the potential anthropogenic input of Al [42] and Fe in the estuary of the Krka River, and the contribution of Fe to early diagenesis processes that can alter the metal/Fe ratio, Li was selected as the conservative element in this research. Five categories can be used to categorize contamination based on the calculated enrichment factor [43]: EF < 2—deficiency to low enrichment, EF 2–5—moderate enrichment, EF 5–20—significant enrichment, EF 20–40—very high enrichment, EF > 40—extremely high enrichment.

2.4.2. Geoaccumulation Index (Igeo)

The Igeo is a widely used criterion for determining the degree of metal pollution in sediments. Müller [44] first developed it to assess and characterize the presence of metal pollutants in sedimentary environments by comparing present concentrations with pre-industrial levels. Igeo is computed using the following Equation (4):
I g e o = l o g 2 C n 1.5 B n   ,
where Cn represents the concentration of the metal (n) in the observed sediment and Bn denotes the regional background value of the metal (n). Factor 1.5 was introduced to minimize the potential impact of fluctuations in background values, which could be due to differences in lithology within the sediment. Müller [44] classified Igeo values into seven categories: Igeo ≤ 0—unpolluted, 0 < Igeo < 1—unpolluted to moderately polluted, 1 < Igeo < 2—moderately polluted, 2 < Igeo < 3—moderately to heavily polluted, 3 < Igeo < 4—heavily polluted, 4 < Igeo < 5—heavily to extremely polluted, Igeo > 5—extremely polluted.

2.4.3. Pollution Load Index (PLI)

The PLI is used to determine the overall pollutant loading in sediment [45] and is expressed as follows (5):
P L I = ( C F 1 · C F 2 · C F 3 · · C F n ) 1 / n ,
where CF is the ratio of the content of the examined metal to the background value, and n is the number of metals assessed. This empirical index offers a straightforward, comparative method for determining the level of sediment pollution by metals. PLI values are divided into two levels: PLI < 1, no pollution, and PLI > 1, polluted sediments.

2.4.4. Mean ERM Quotient (m-ERM-Q)

To further estimate the potential ecological risk of multiple contaminations, the mean ERM quotient (m-ERM-Q) was calculated. Sediment quality guidelines, developed by Long et al. [46], define two threshold values to estimate the probability of negative effects of present metals on benthic organisms: effect(s) range-low (ERL) and effect(s) range-median (ERM). The ERL value indicates the concentration limit for each pollutant above which negative effects on organisms can occur, whereas the ERM value indicates the concentration limit above which adverse effects would frequently occur. By dividing each chemical concentration by its respective ERM and averaging the individual quotient, m-ERM-Q determines the possible biological effect of the combined metals as follows (6):
m E R M Q = i = 1 n ( C i E R M i ) n
where Ci is the concentration of a metal in the sediment, ERMi is the ERM value for metal I, and n is the number of metals. The classes of toxicity probability for biota are defined as follows [47]: m-ERM-Q < 0.1—9% probability of toxicity, 0.11–0.5—21% probability of toxicity, 0.51–1.5—49% probability of toxicity, and m-ERM-Q > 1.51—76% probability of toxicity.

2.5. Statistical Analysis

To identify similarities between sampling points and to elucidate different sources of elements, principal component analysis (PCA) with Varimax rotation was performed using the XLSTAT 2023.3.0 software package (Addinsoft, 2023). The dataset comprised the analytical results of 16 parameters (Al, Fe, Li, Ti, Cd, Pb, U, Cr, Mn, Co, Ni, Cu, Zn, As, C, and P) measured in the 40 surface sediment samples. The Kaiser-Meyer-Olkin (KMO) value was 0.711. Kaiser’s criterion was applied to determine the number of principal components (PCs) to be retained; more precisely, only PCs with eigenvalues higher than 1 were retained. In addition, study site maps and spatial distribution maps for the eleven elements (Al, Fe, Ni, Cr, Co, As, Cd, Cu, Pb, Mn, and Zn), m-ERM-Q, and PLI were created using Surfer 15 software (Golden Software LLC, 2017, Golden, Co, USA). Spatial interpolation was based on surface sediment data (0–5 cm, 40 sampling locations) and was performed using the inverse distance to power algorithm.

3. Results and Discussion

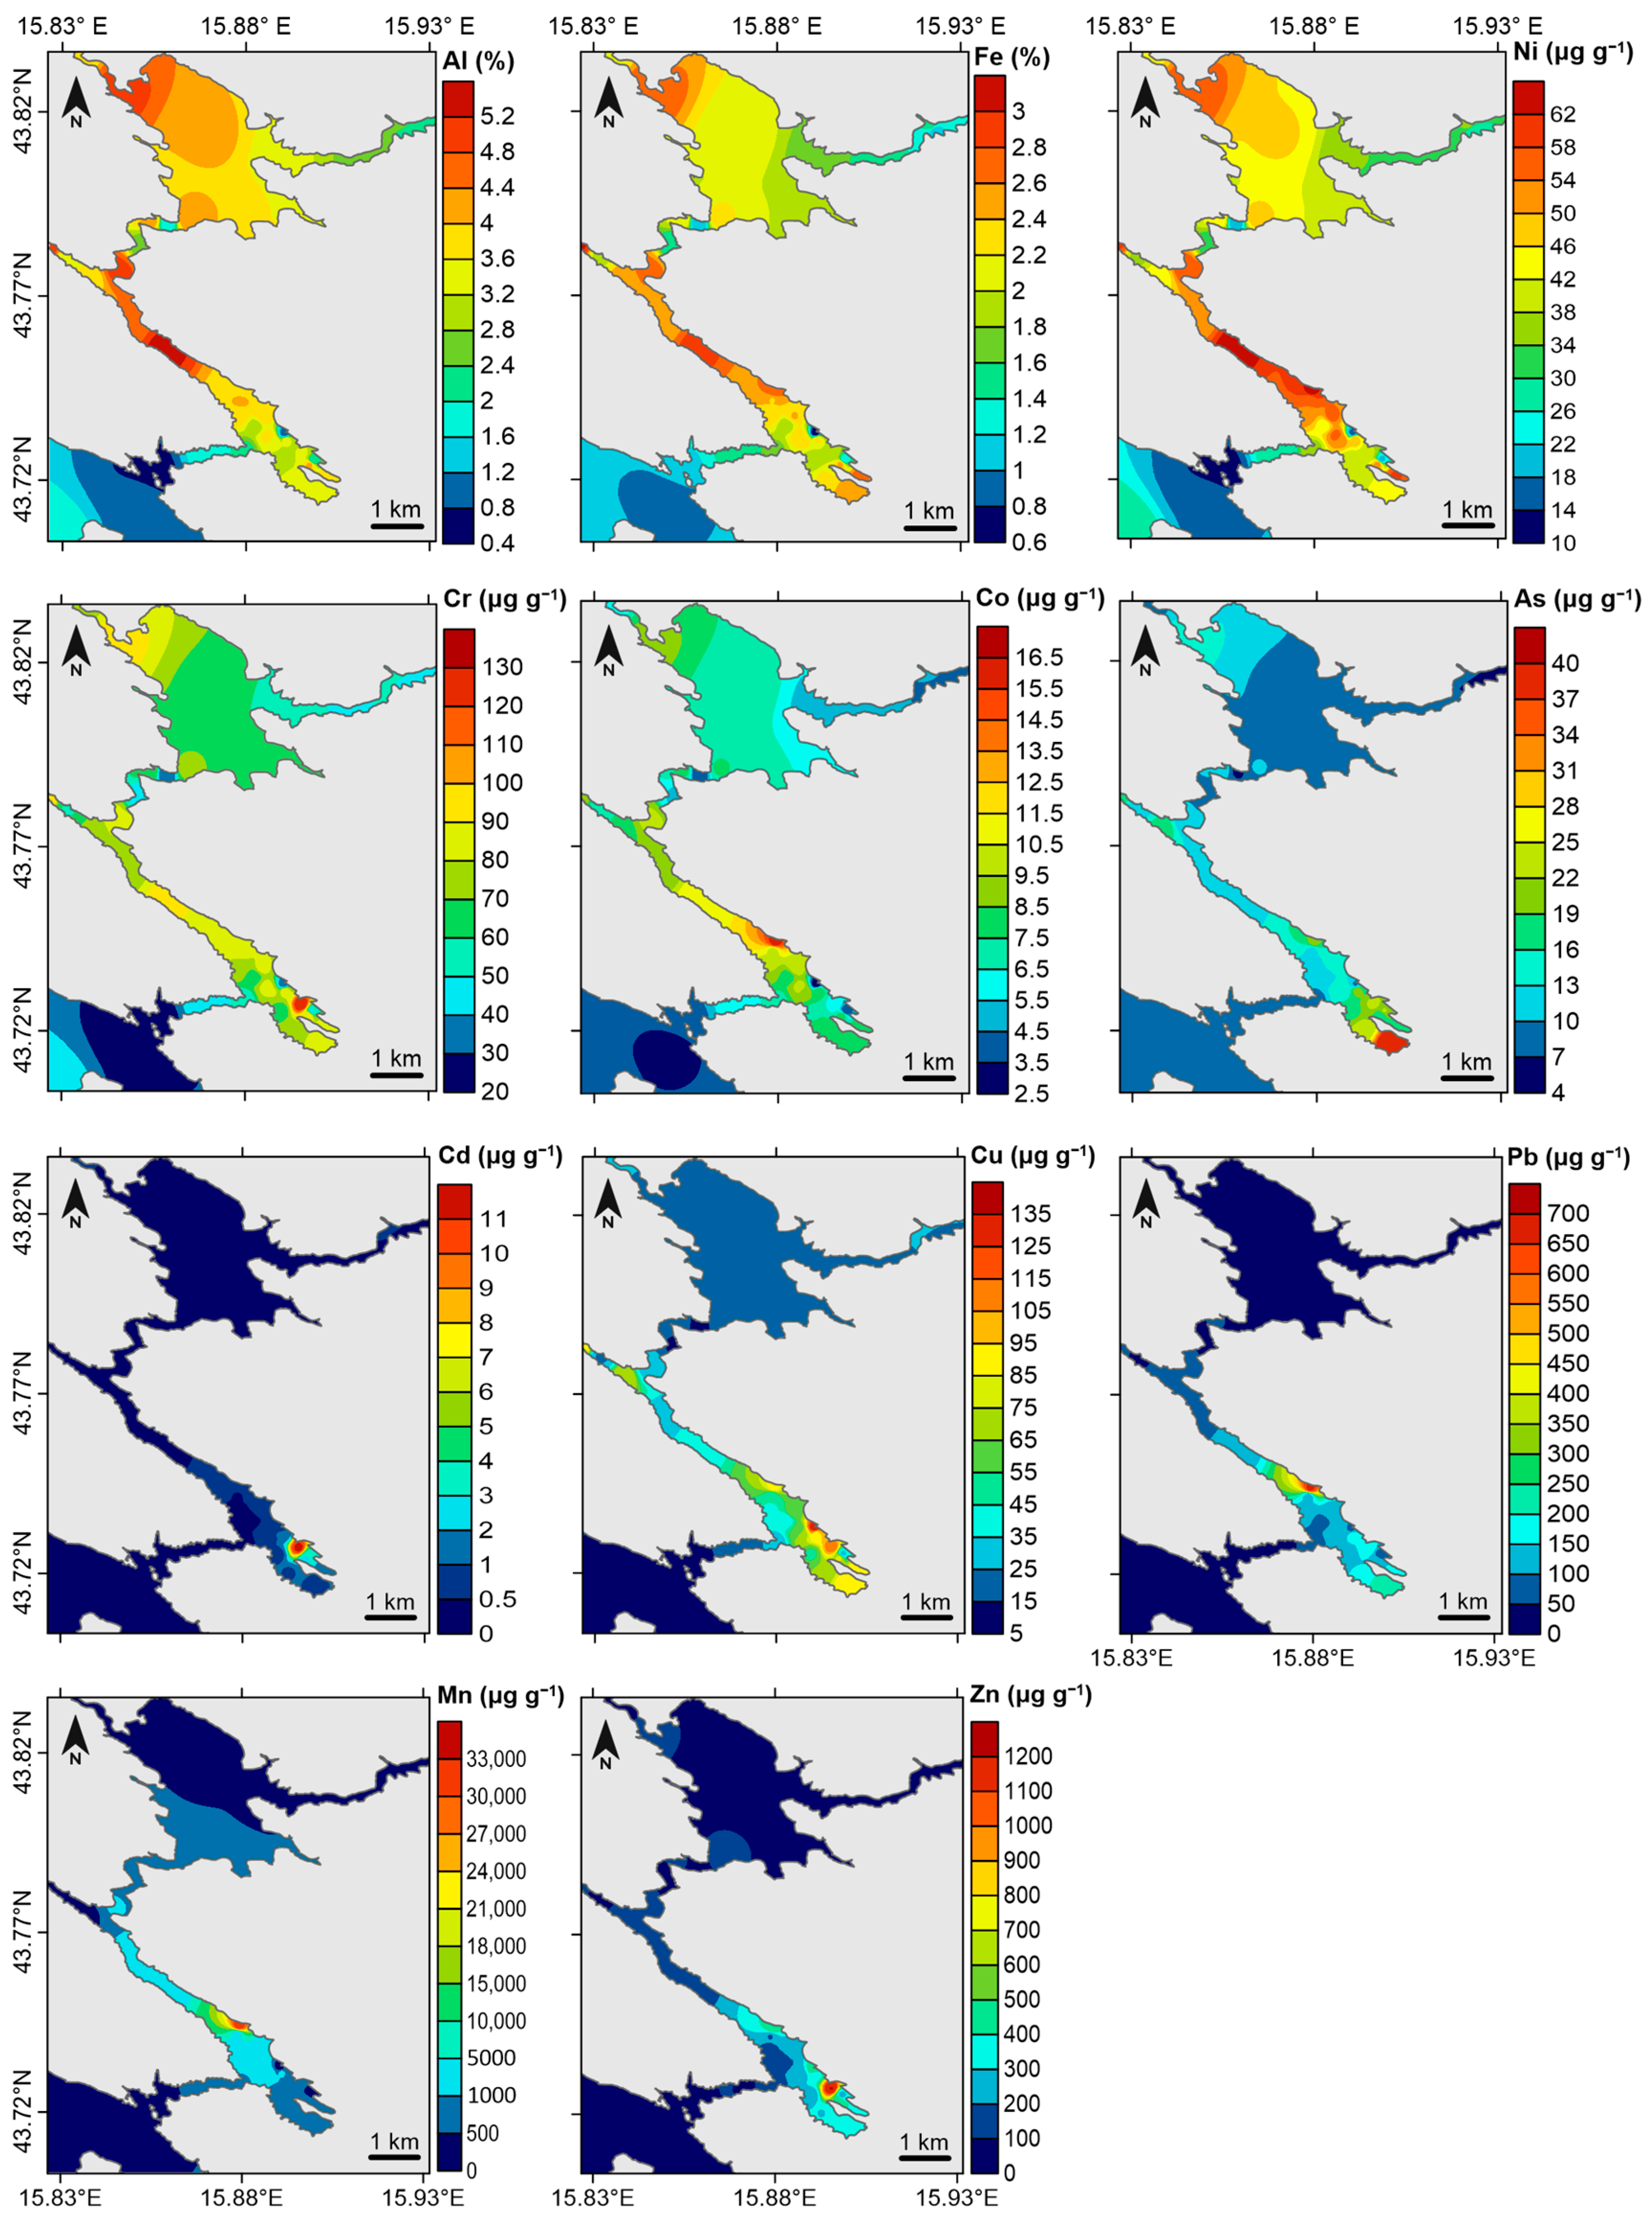
3.1. Contents of Metals in Surface Sediments

Metal concentrations in the surface sediment from the Krka River estuary were found in the following ranges: 0.545–5.29% (Al), 0.647–1.94% (Fe), 11.3–63.4 μg g−1 (Ni), 20.7–129 μg g−1 (Cr), 2.52–16.1 μg g−1 (Co), 5.43–39.6 μg g−1 (As), 0.11–11.2 μg g−1 (Cd), 37.6–1200 μg g−1 (Zn), 18.0–665 μg g−1 (Pb), 128–32037 μg g−1 (Mn), and 5.25–132 μg g−1 (Cu) (Figure 2, Table S3).
Two overall observations can be drawn from the spatial distribution maps. First, terrigenous elements exhibit a distribution pattern characterized by the highest values obtained in sediment from the Guduča mouth, Zaton Bay, and sampling location 19. Second, potentially toxic metals display distribution patterns that distinctly differentiate the upper pristine estuary from the lower estuary, which is impacted by several contamination sources. The spatial distributions of Fe and Al obtained in this study align closely with previous research conducted in the same area, which demonstrated low input of terrigenous material from the Krka River to the estuary and identified Guduča River and Litno Spring (Zaton) as primary sources of detrital material entering the estuary [36,48]. Nevertheless, the increased concentrations that were found in this research at location K19 are unexpected, and the origin of this material is still unclear. A possible explanation may be the input of terrigenous material through a not yet detected submarine spring.
The spatial distributions of Ni, Cr, and Co exhibited a notable correspondence with those of Al and Fe. However, increased values of these metals were found in Šibenik Bay, close to the ferromanganese industry site. In general, elevated metal levels found in Šibenik Bay can be ascribed to anthropogenic pollution originating from three main sources in the area: the ferromanganese industry (former TEF factory), the port (phosphate ore transshipment), and the shipyard/marina area. The Mn content in the Krka River estuary was significantly influenced by the former TEF factory, as evidenced by the recorded values of up to 3.2% in the vicinity of the former factory and confirmed by the elemental composition of the slag collected in the factory area (Table S4). This represents a substantial increase compared with the Mn levels observed in the pristine section of the estuary, as well as in other locations in the Adriatic Sea and elsewhere (Table S5, [49,50,51]). The factory also appeared to be a source of other metals, including Pb, Fe, Co, and Ni, and, to a lesser extent, Zn, Cu, and As. Although there are some disagreements in the slag analysis from this study and the one reported previously [52], probably due to the marked heterogeneity of the slag and different sampling times (remediation of the area was done in 2013), the analysis confirms that the major long-term source of anthropogenic contamination in the area is slag deposited on the factory grounds. The activities conducted inside the port of Šibenik are believed to have had a significant impact on the concentrations of Zn, Cd, and Cr in Šibenik Bay. In addition, the port has been found to contribute to elevated levels of As, Cu, and Pb. The concentrations of Zn, Cd, and Cr are comparable to or even higher than the reported values observed in contaminated areas such as Rijeka Harbor and Toulon Bay (Table S5, [4,53]). Furthermore, the shipyard/marina area exhibits the highest reported values of As, which are significantly higher than those in uncontaminated to moderately contaminated areas in the Adriatic Sea (Table S5, [51,54,55], and fall within the range typically observed in coastal and estuarine sites that are more affected by anthropogenic input of metals (Table S5, [4,53,56,57]). A previous study indicated that sediments in this particular area had significant levels of Hg contamination [58].
Furthermore, based on the distribution maps of metal concentrations in surface sediments, it can be concluded that contamination does not spread outside the estuary into the open sea. A similar finding has also been reported for Hg distribution in the Krka River estuary [58]. The distribution pattern is likely driven by several variables, including the closed morphology of the estuary, the movement of the bottom seawater layer toward land, which hinders the transfer of metals in a seaward direction [31], and the rapid adsorption of metals onto particles and subsequent deposition onto the seabed. Bilinski et al. [59] investigated the process of metal adsorption on inorganic solid phases in Krka River water with different salinities (S = 3, 20, and 38). The researchers found evidence to support the exceptional self-purification capacity of the Krka River estuary in relation to the removal of Hg, Zn, and Pb contaminants. The postulation made by the authors suggests that the surface sediments found in the Krka River estuary, which contain calcite and aluminosilicates, may serve as sinks for most trace metals.

3.2. Risk Assessment

3.2.1. Enrichment Factor

The enrichment factors (Figure 3) obtained from the analysis of surface sediments provide clear evidence of variations between the upper (Prokljan Lake and upstream) and lower (downstream of Prokljan Lake) sections of the estuary. These differences align with the metal concentration distribution maps, which indicate distinct patterns in these areas. Most sampling stations in the upper estuary did not exhibit significant enrichment, as indicated by EF values of less than 2. Enrichment was observed in all sampling locations downstream from Prokljan Lake, exhibiting different levels of enrichment, from moderate to extremely high, according to the observed metal. The EF ranges of Fe, Cr, Co, and Ni were found to be 0.93–2.73, 0.87–3.64, 0.77–2.49, and 0.83–1.77, respectively. While examining the data, it was observed that Fe, Cr, and Co exhibited values exceeding 2. However, it is important to note that this was only observed at two sampling locations for Fe and Co and three sampling sites for Cr. Hence, it may be concluded that Fe, Cr, Co, and Ni in the surface sediments of the Krka River estuary are primarily of natural origin. The EF range of As suggests moderate to large enrichment in the Šibenik Bay area and no enrichment in the other estuary areas. Cadmium contamination in surface sediment was restricted to the port area, where extremely high EF values were observed, reaching up to 36.6. In contrast to Cd, which exhibited limited enrichment within a specific area, the following elements were enriched across the lower estuary: Cu, Pb, Mn, and Zn. Lead and Zn, exhibiting EF within the ranges of 1.18–29.6 and 1.46–38.8 respectively, have demonstrated even very high enrichment in certain areas, including the former TEF factory (Pb), the port (Zn), and the Šibenik waterfront (Zn). Extremely high enrichment was, moreover, observed for Cu with a value of 45.4 and Mn with a value of 103, which can be attributed to the Šibenik waterfront (wastewater) (Cu) and the former TEF factory (Mn).

3.2.2. Geoaccumulation Index

The calculated Igeo values for Fe, Cr, Ni, and Co were below 1 at all sampling stations, except for Co (Igeo max = 1.14) at the former TEF factory site (Figure 3). These findings are in line with the outcomes of the EF calculation, which implies a dominant natural origin of these elements in the Krka River estuary. According to Igeo values, As is moderately polluted only in the vicinity of potential sources of pollution, i.e., the TEF factory, the Šibenik port, and the nautical marine/shipyard area. In addition, the calculated Igeo values offer additional support for the findings reported by EF: (1) the sediment metal contamination levels in the upper and lower estuary are notably distinct, and (2) the major pollutants in the Krka River estuary are Mn (Igeo-max = 6.58), Pb (Igeo-max = 4.79), Zn (Igeo-max = 4.33), Cd (Igeo-max = 4.24) and Cu (Igeo-max = 3.24).

3.2.3. The Pollution Load Index (PLI)

The PLI values obtained for the surface sediment samples ranged between 0.711 and 8.30 (Figure 4). Values below 1, indicating no pollution, were found only at the referent site and two sites at the estuarine mouth. In the upper part of the estuary, the PLI values ranged between 1.01 and 1.98, implying very low metal pollution. In contrast, much higher PLI values were calculated for the sediment in the lower estuary, confirming the negative anthropogenic influence of the city of Šibenik on the estuarine environment. The highest values were found in the vicinity of the former TEF factory (8.29) and Šibenik port (7.06).

3.2.4. Mean ERM Quotients (m-ERM-Q)

The m-ERM-Q values were calculated using seven studied elements, namely Cd, Pb, Cr, Ni, Cu, Zn, and As. Cobalt is excluded from the calculation because the ERM value for Co is not defined. The m-ERM-Q values observed in the surface sediment of the Krka River estuary ranged from 0.09 to 0.97, with an average value of 0.34. As depicted in Figure 4, most of the studied area falls within the 0.11–0.5 class, suggesting that the combination of the studied metals has a toxicity probability of 21%. Higher toxicity is expected in the vicinity of anthropogenic contamination sources, namely the former TEF factory, the port, and the marina/shipyard area, where the toxicity probability is 49%.

3.3. Diffusive Gradient in Thin Films

The DGT vertical profiles measured in the sediments and overlying waters are shown in Figure 5. Peaks in DGT metal fluxes for Fe, Mn, Cd, Zn, Pb, Cu, Co, and Ni, accompanied by a sharp decrease in Eh with depth, indicate that diagenetic processes control metal mobility in the sediment at the marina/shipyard site in the Krka River estuary. It is well known that a major driver of early diagenesis in estuarine and coastal sediments is the microbially driven oxidation of organic matter (OM) and associated reductive dissolution of Fe and Mn oxyhydroxides [60,61,62,63]. The observed peaks of labile Cd, Zn, Cu, and Ni at the SWI, coupled with elevated DOC concentrations, imply that the release of OM-bound metals due to aerobic mineralization is an important contributor to the large supply of Cu, Zn, and Ni measured by DGT, as previously reported [64,65]. When oxygen becomes depleted in the sediment, the reduction of Fe and Mn oxyhydroxides becomes a key driver of OM mineralization and consequent mobilization of adsorbed metals. In the Krka River estuary, labile Mn and Fe followed the ideal redox sequence in the coastal sediments, with the observed peak of the Mn DGT flux at a depth (2 cm) shallower than that of Fe (8 cm). The high increase of dissolved Co below the SWI concurs with the Mn peak, and most probably can be related to the mobilization of Mn, as the adsorption of Co by MnO2 is well documented in the literature [66]. Moreover, the co-occurrence of peaks of labile Pb, Cu, Co, and Ni with those of Fe confirms the pivotal role of reductive dissolution of Fe oxyhydroxides in the mobilization of metals in the sediment of the Krka River estuary.

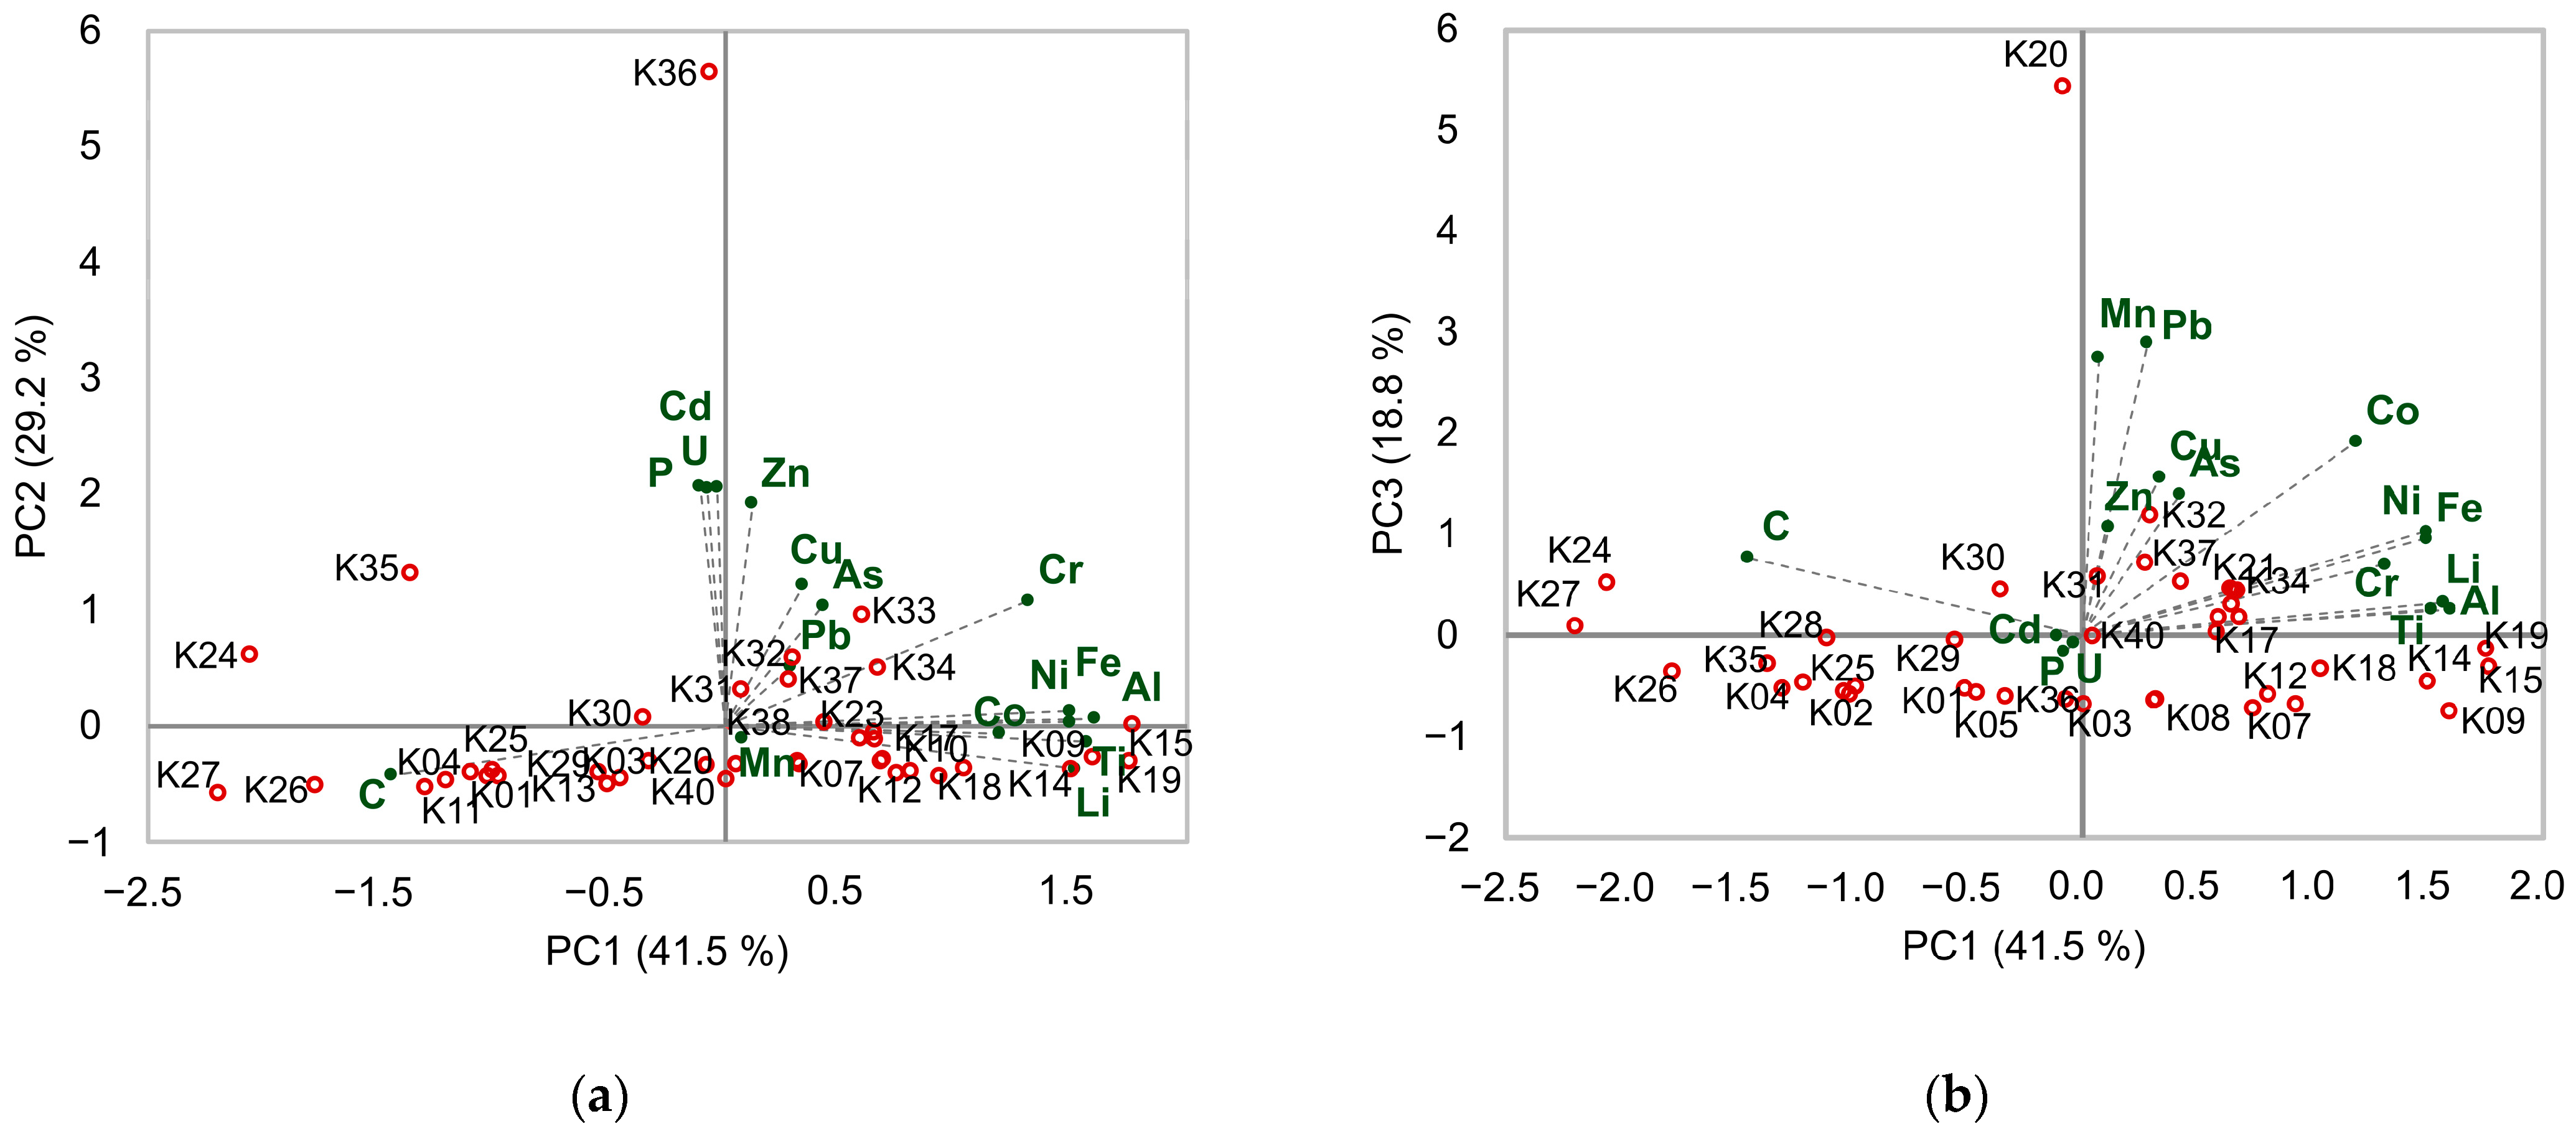
3.4. Source Identification of Metals in Surface Estuarine Sediments

To identify different sources of metals and to determine similarities between sampling points, a Pearson correlation matrix and PCA were used. The PCA revealed that 89.5% of the data variance may be explained by the first three PCs (Table S6). PC1 accounted for 41.5% of the variance and was dominated by high loadings of Al, Ti, Fe, and Li (Table S6), i.e., terrigenous elements that are rarely significantly influenced by human activities because of their high natural concentrations in sediment. Moreover, Ni, Co, and Cr were also associated with PC1. Because of the similar PC loading and significant correlation with terrigenous elements (r > 0.7, p < 0.01) (Table S7), it can be concluded that these elements have the same origin, i.e., Ni, Co, and Cr in the sediment come from natural sources. This finding is supported by the low EFs calculated in this study, which also indicate the natural origin of these metals. However, Cr also demonstrated a significant correlation (r > 0.45, p < 0.01) with some of the contaminants, more precisely, with those elements that had elevated concentrations in the port area (Cd, U, Cu, Zn, As, Pb, P). Based on the correlation, PCA, and spatial distribution maps, it can be concluded that Cr is predominantly of natural origin in the Krka River estuary with possible anthropogenic input in the port area. PC2 was dominated by Cd, U, Zn, and P, accounting for 29.2% of the total variance (Table S6). The absence of a correlation between Cd and Zn with terrigenous elements, increased Efs, and spatial distributions indicating higher concentrations in the vicinity of the port lead to the conclusion that these elements have a common anthropogenic source. Undoubtedly, a portion of the detected pollution can be ascribed to raw phosphate ore and artificial fertilizers, which constitute the primary category of goods managed at the Šibenik port. Specifically, phosphate rocks used to manufacture phosphate fertilizers contain varying quantities of associated elements, such as Cd and U, which can be transferred to fertilizers and can even become more concentrated during manufacturing processes. In addition to U and Cd, fertilizers may contain As, Zn, Pb, Cr, Cu, V, Hg, and Ni. Contamination of soil, mostly by Cd and U, due to the use of phosphate fertilizers has been documented in many studies [67,68,69,70]. Contamination of the port sediment by raw phosphates and fertilizers is supported by the significant correlation between P and Cd (r = 0.99, p < 0.001), Cd and U (r = 0.98, p < 0.001), and P and U (r = 0.99, p < 0.001) (Table S7). According to the correlation matrix, it can be concluded that the raw phosphates and fertilizers mostly contribute to the high concentrations of Cd and U in the port sediments, whereas other elements come from several sources, e.g., untreated wastewater from Šibenik city, which was formerly released into the estuary at this specific site. PC3 was mainly characterized by strong positive loading of Mn and Pb and accounted for 18.8% of the total variance (Table S6). The comparable PC loading of these two elements and their significant correlation (r = 0.88, p < 0.001) indicate a common anthropogenic origin. Based on the distribution maps, it is evident that the former TEF factory is a common source of these two elements. While the predominant source of Co in the surface sediments of the Krka River estuary is the input of terrigenous material, there is likely some Co in the sediment near the former factory that can be attributed to anthropogenic activities. This conclusion was made based on the high loading of Co in PC3, its statistically significant correlation with Mn and Pb (r = 0.61 and 0.70, p < 0.001), as well as its moderate enrichment in the K20 sampling site according to the EF. Furthermore, it is worth noting that C also shows positive loading in PC3, which is likely indicative of the elevated levels of organic pollutants in the TEF factory area, as reported by Mandić et al. [71].
From the biplots, shown in Figure 6, we can see that sedimentation in the estuary is governed by two different processes. The sampling points with high scores in the PC1, represent the terrigenous endmember. These are points in the upper part of the estuary and in the Zaton Bay, where input of terrigenous material through the Guduča tributary and the Litno spring play an important role in sedimentation. This sediment is characterized by a high abundance of Al, Li, Fe, Ti, and Ni, and a smaller mean grain size (Table S2). The sampling points with high negative scores in the PC1 represent the carbonate end member. These are points from the lower estuary, in particular the estuarine mouth, where marine carbonate sedimentation prevails. This sediment is characterized by higher C content and higher mean grain size (Table S2). However, there are also intermediate cases, where the sediment is the mixture of the two endmembers. The divergence of K20 and K36 from the other sampling points is most likely attributed to a strong anthropogenic influence, leading to very high concentrations of some metals, such as Mn, in these specific locations.

4. Conclusions

This study focused on the analysis of metal distribution in the sediments of the Krka River estuary, with a particular emphasis on identifying the sources of metals and assessing the levels of contamination. The spatial distribution of the terrigenous elements in the surface sediment of the Krka River estuary confirms that the Guduča River and the Litno Spring in Zaton Bay serve as the main input pathways for the terrigenous particulate material. The suspended material transported from these sources originates from flysch deposits and plays an important role in the distribution of certain elements, such as Ni and Cr. The upper estuary is rather pristine; however, the sediment in Šibenik Bay is heavily loaded with several metals due to human-caused pollution originating from three main sources: the former electrode and ferroalloy factory (Mn, Pb), the port of Šibenik (Cd, Zn, Cr, Cu, and As), and the nautical marina/repair shipyard (As). The findings show that the extent and significance of metal contamination in the lower estuary are greater than those previously recognized. Certain metals (e.g., Pb, Zn, Mn, Cd, Cu, and As) are comparable to those found in seriously contaminated coastal and estuarine areas in Europe. Although some of the sources of contamination were removed many years ago (the TEF factory, wastewater), the long history of the anthropogenic impact is still evident in the sediment. There is no dispersion of contaminants from the estuary to the open sea. The distribution pattern is likely driven by several variables, including the closed morphology of the estuary, the landward movement of the bottom seawater layer preventing the transport of metals in a seaward direction, and the fast adsorption of metals to the particles, leading to their deposition on the seabed. Nevertheless, due to the bottom water movement, a fraction of metals is transported in an upstream direction from its sources in Šibenik Bay.
The probability of negative effects of multiple sediment contamination on living organisms was assessed based on the m-ERM-Q. Most of the Krka River estuary exhibits a toxicity probability of 21%, whereas areas close to contamination sources demonstrate a higher toxicity probability of 49%. The DGT deployment results indicate that the distribution and recycling of metals in the pore water and sediment were mostly influenced by the microbial oxidation of organic matter and the associated reduction of Fe and Mn oxyhydroxides. The accumulation of easily exchangeable metals at the SWI indicates that sediments may act as a source of metal for the overlying water column. With regard to the findings of this study, more targeted and comprehensive toxicity studies will be required to fully comprehend the effects of the high metal concentrations in the sediment on living organisms in the lower Krka River estuary.

Supplementary Materials

The following supporting information can be downloaded at https://www.mdpi.com/article/10.3390/su16051800/s1, Table S1: Instrumental settings for HR ICP-MS; Table S2: Measured element mass fractions (mean ± standard deviation) and obtained recoveries of certified reference material (PACS-2, National Research Council of Canada); Table S3: Chemical and granulometric composition of the 40 surface sediment samples (0–5 cm) (K1–K40) from the Krka River estuary. Element concentrations are expressed in μg g−1. Granulometric fractions (<63 μm, >63 μm) are expressed in percentages. Mean grain size (Mz) is expressed in μm; Table S4: Metal concentrations in the slag (a this study, b [52]) and soil (b [52]) from the former TEF factory. Values are expressed in μg g−1, except for Mn, Al, and Fe, which are in %; Table S5: Ranges of metal concentrations in the Krka River estuary and in the coastal and estuarine environments in Croatia and other European countries. Values are expressed as μg g−1; Table S6: Percentage of variance, cumulative variance, loadings, and component scores (after Varimax rotation) of the principal components obtained in the analysis; Table S7: Pearson correlation matrix for parameters measured in the surface sediment from the Krka River estuary [4,49,50,51,53,54,55,56,57].

Author Contributions

Conceptualization, D.O. and N.C. (Neven Cukrov); methodology, D.O.; formal analysis, N.C. (Nuša Cukrov), D.O., A.-M.C., and N.C. (Neven Cukrov); investigation, N.C. (Nuša Cukrov), D.O., A.-M.C., and N.C. (Neven Cukrov); resources, D.O. and N.C. (Neven Cukrov); writing—original draft preparation, N.C. (Nuša Cukrov); writing—review and editing, D.O., A.-M.C., and N.C. (Neven Cukrov); visualization, N.C. (Nuša Cukrov); supervision, N.C. (Neven Cukrov); funding acquisition, D.O. All authors have read and agreed to the published version of the manuscript.

Funding

This work was financially supported by the Croatian Science Foundation under project IP-2014-09-7530.

Institutional Review Board Statement

Not applicable.

Informed Consent Statement

Not applicable.

Data Availability Statement

Data are contained within the article and Supplementary Materials.

Acknowledgments

The authors express their gratitude to the Public Institute Nature of Šibenik-Knin County for providing the boat necessary for sampling.

Conflicts of Interest

The authors declare no conflicts of interest.

References

  1. Ridgway, J.; Shimmield, G. Estuaries as repositories of historical contamination and their impact on shelf seas. Estuar. Coast. Shelf Sci. 2002, 55, 903–928. [Google Scholar] [CrossRef]
  2. Di Leonardo, R.; Tranchida, G.; Bellanca, A.; Neri, R.; Angelone, M.; Mazzola, S. Mercury levels in sediments of central Mediterranean Sea: A 150+ year record from box-cores recovered in the Strait of Sicily. Chemosphere 2006, 65, 2366–2376. [Google Scholar] [CrossRef] [PubMed]
  3. Petranich, E.; Croce, S.; Crosera, M.; Pavoni, E.; Faganeli, J.; Adami, G.; Covelli, S. Mobility of metal(loid)s at the sediment-water interface in two tourist port areas of the Gulf of Trieste (northern Adriatic Sea). Environ. Sci. Pollut. Res. 2018, 25, 26887–26902. [Google Scholar] [CrossRef] [PubMed]
  4. Tessier, E.; Garnier, C.; Mullot, J.-U.; Lenoble, V.; Arnaud, M.; Raynaud, M.; Mounier, S. Study of the spatial and historical distribution of sediment inorganic contamination in the Toulon bay (France). Mar. Pollut. Bull. 2011, 62, 2075–2086. [Google Scholar] [CrossRef] [PubMed]
  5. Birch, G. Determination of sediment metal background concentrations and enrichment in marine environments—A critical review. Sci. Total Environ. 2017, 580, 813–831. [Google Scholar] [CrossRef] [PubMed]
  6. Duan, L.; Song, J.; Liang, X.; Yin, M.; Yuan, H.; Li, X.; Ren, C.; Zhou, B.; Kang, X.; Yin, X. Dynamics and diagenesis of trace metals in sediments of the Changjiang Estuary. Sci. Total Environ. 2019, 675, 247–259. [Google Scholar] [CrossRef]
  7. Förstner, U.; Salomons, W. Trace metal analysis on polluted sediments: Part I: Assessment of sources and intensities. Environ. Technol. Lett. 1980, 1, 494–505. [Google Scholar] [CrossRef]
  8. Saulnier, I.; Mucci, A. Trace metal remobilization following the resuspension of estuarine sediments: Saguenay Fjord, Canada. Appl. Geochem. 2000, 15, 191–210. [Google Scholar] [CrossRef]
  9. Sakellari, A.; Plavšić, M.; Karavoltsos, S.; Dassenakis, M.; Scoullos, M. Assessment of copper, cadmium and zinc remobilization in Mediterranean marine coastal sediments. Estuar. Coast. Shelf Sci. 2011, 91, 1–12. [Google Scholar] [CrossRef]
  10. Santschi, P.; Höhener, P.; Benoit, G.; Brink, M.B.-T. Chemical processes at the sediment-water interface. Mar. Chem. 1990, 30, 269–315. [Google Scholar] [CrossRef]
  11. Dou, Y.; Li, J.; Zhao, J.; Hu, B.; Yang, S. Distribution, enrichment and source of heavy metals in surface sediments of the eastern Beibu Bay, South China Sea. Mar. Pollut. Bull. 2013, 67, 137–145. [Google Scholar] [CrossRef]
  12. Garmendia, M.; de Vallejuelo, S.F.-O.; Liñero, O.; Gredilla, A.; Arana, G.; Soto, M.; de Diego, A. Long term monitoring of metal pollution in sediments as a tool to investigate the effects of engineering works in estuaries. A case study, the Nerbioi-Ibaizabal estuary (Bilbao, Basque Country). Mar. Pollut. Bull. 2019, 145, 555–563. [Google Scholar] [CrossRef]
  13. Ip, C.C.; Li, X.-D.; Zhang, G.; Wai, O.W.; Li, Y.-S. Trace metal distribution in sediments of the Pearl River Estuary and the surrounding coastal area, South China. Environ. Pollut. 2007, 147, 311–323. [Google Scholar] [CrossRef]
  14. Pan, K.; Wang, W.-X. Trace metal contamination in estuarine and coastal environments in China. Sci. Total Environ. 2012, 421, 3–16. [Google Scholar] [CrossRef]
  15. Zhang, J.; Gao, X. Heavy metals in surface sediments of the intertidal Laizhou Bay, Bohai Sea, China: Distributions, sources and contamination assessment. Mar. Pollut. Bull. 2015, 98, 320–327. [Google Scholar] [CrossRef]
  16. Zhao, G.; Ye, S.; Yuan, H.; Ding, X.; Wang, J. Surface sediment properties and heavy metal pollution assessment in the Pearl River Estuary, China. Environ. Sci. Pollut. Res. 2017, 24, 2966–2979. [Google Scholar] [CrossRef] [PubMed]
  17. Jahan, S.; Strezov, V. Comparison of pollution indices for the assessment of heavy metals in the sediments of seaports of NSW, Australia. Mar. Pollut. Bull. 2018, 128, 295–306. [Google Scholar] [CrossRef]
  18. Burton, G.A. Sediment quality criteria in use around the world. Limnology 2002, 3, 65–76. [Google Scholar] [CrossRef]
  19. Long, E.R.; MacDonald, D.D. Recommended Uses of Empirically Derived, Sediment Quality Guidelines for Marine and Estuarine Ecosystems. Hum. Ecol. Risk Assess. Int. J. 1998, 4, 1019–1039. [Google Scholar] [CrossRef]
  20. Birch, G.; Lee, J.-H. The use of sedimentary metal data in predictive modelling of estuarine contamination, assessment of environmental condition and pollutant source identification (Narrabeen Lagoon, Sydney, Australia). Environ. Sci. Pollut. Res. 2020, 27, 43685–43699. [Google Scholar] [CrossRef] [PubMed]
  21. Birch, G. A review of chemical-based sediment quality assessment methodologies for the marine environment. Mar. Pollut. Bull. 2018, 133, 218–232. [Google Scholar] [CrossRef] [PubMed]
  22. Zhang, H.; Davison, W.; Miller, S.; Tych, W. In situ high resolution measurements of fluxes of Ni, Cu, Fe, and Mn and concentrations of Zn and Cd in porewaters by DGT. Geochim. Cosmochim. Acta 1995, 59, 4181–4192. [Google Scholar] [CrossRef]
  23. Davison, W.; Zhang, H. In situ speciation measurements of trace components in natural waters using thin-film gels. Nature 1994, 367, 546–548. [Google Scholar] [CrossRef]
  24. Amato, E.D.; Wadige, C.P.M.; Taylor, A.M.; Maher, W.A.; Simpson, S.L.; Jolley, D.F. Field and laboratory evaluation of DGT for predicting metal bioaccumulation and toxicity in the freshwater bivalve Hyridella australis exposed to contaminated sediments. Environ. Pollut. 2018, 243, 862–871. [Google Scholar] [CrossRef] [PubMed]
  25. Amato, E.D.; Simpson, S.L.; Jarolimek, C.V.; Jolley, D.F. Diffusive gradients in thin films technique provide robust prediction of metal bioavailability and toxicity in estuarine sediments. Environ. Sci. Technol. 2014, 48, 4485–4494. [Google Scholar] [CrossRef]
  26. Ren, J.; Williams, P.N.; Luo, J.; Ma, H.; Wang, X. Sediment metal bioavailability in Lake Taihu, China: Evaluation of sequential extraction, DGT, and PBET techniques. Environ. Sci. Pollut. Res. 2015, 22, 12919–12928. [Google Scholar] [CrossRef]
  27. Xie, M.; Simpson, S.L.; Huang, J.; Teasdale, P.R.; Wang, W.-X. In Situ DGT Sensing of Bioavailable Metal Fluxes to Improve Toxicity Predictions for Sediments. Environ. Sci. Technol. 2021, 55, 7355–7364. [Google Scholar] [CrossRef]
  28. Cindrić, A.-M.; Garnier, C.; Oursel, B.; Pižeta, I.; Omanović, D. Evidencing the natural and anthropogenic processes controlling trace metals dynamic in a highly stratified estuary: The Krka River estuary (Adriatic, Croatia). Mar. Pollut. Bull. 2015, 94, 199–216. [Google Scholar] [CrossRef]
  29. Elbaz-Poulichet, F.; Guan, D.M.; Martin, J.-M. Trace-metal behavior in a highly stratified mediterranean estuary—The Krka (Yugoslavia). Mar. Chem. 1991, 32, 211–224. [Google Scholar] [CrossRef]
  30. Kwokal, Ž.; Frančišković-Bilinski, S.; Bilinski, H.; Branica, M. A comparison of anthropogenic mercury pollution in Kaštela Bay (Croatia) with pristine estuaries in Öre (Sweden) and Krka (Croatia). Mar. Pollut. Bull. 2002, 44, 1152–1157. [Google Scholar] [CrossRef]
  31. Mikac, N.; Kwokal, Z.; May, K.; Branica, M. Mercury distribution in the krka river Estuary (Eastern Adriatic Coast). Mar. Chem. 1989, 28, 109–126. [Google Scholar] [CrossRef]
  32. Bogner, D.; Ujević, I.; Zvonarić, T.; Barić, A. Distribution of selected trace metals in coastal surface sediments from the middle and south Adriatic. Fresenius Environ. Bull 2004, 13, 1281–1287. [Google Scholar]
  33. Martinčić, D.; Kwokal, Ž.; Branica, M. Distribution of zinc, lead, cadmium and copper between different size fractions of sediments II. The Krka River Estuary and the Kornati Islands (Central Adriatic Sea). Sci. Total Environ. 1990, 95, 217–225. [Google Scholar] [CrossRef]
  34. Martinčić, D.; Kwokal, Ž.; Stoeppler, M.; Branica, M. Trace metals in sediments from the adriatic sea. Sci. Total Environ. 1989, 84, 135–147. [Google Scholar] [CrossRef]
  35. Carić, H.; Cukrov, N.; Omanović, D. Nautical tourism in marine protected areas (MPAs): Evaluating an impact of copper emission from antifouling coating. Sustainability 2021, 13, 11897. [Google Scholar] [CrossRef]
  36. Prohić, E.; Juračić, M. Heavy metals in sediments—Problems concerning determination of the anthropogenic influence. Study in the Krka River estuary, eastern Adriatic coast, Yugoslavia. Environ. Geol. 1989, 13, 145–151. [Google Scholar] [CrossRef]
  37. Prohić, E.; Kniewald, G. Heavy metal distribution in recent sediments of the Krka River Estuary—An example of sequential extraction analysis. Mar. Chem. 1987, 22, 279–297. [Google Scholar] [CrossRef]
  38. Bonacci, O.; Andrić, I.; Roje-Bonacci, T. Hydrological analysis of Skradinski Buk tufa waterfall (Krka River, Dinaric karst, Croatia). Environ. Earth Sci. 2017, 76, 669. [Google Scholar] [CrossRef]
  39. Cukrov, N. Metal Dynamics in the Sediments of the Krka River Estuary. Ph.D. Thesis, University of Zagreb, Zagreb, Croatia, 2021. [Google Scholar]
  40. Juračić, M.; Prohić, E. Mineralogy, Sources of Particles, and Sedimentation in the Krka River Estuary (Croatia). Geološki Vjesnik 1991, 44, 195–200. [Google Scholar]
  41. Cukrov, N.; Barišić, D.; Juračić, M. Calculated sedimentation rate in the Krka River Estuary using vertical Distribution of 137Cs. Rapp. Comm. Int. Mer. Medit. 2007, 38, 81. [Google Scholar]
  42. Prohić, E. Distribution of Trace Elements in Recent Sediments of the Krka Estuary. Ph.D. Thesis, University of Zagreb, Zagreb, Croatia, 1984. (In Croatian). [Google Scholar]
  43. Sutherland, R.A. Bed sediment-associated trace metals in an urban stream, Oahu, Hawaii. Environ. Geol. 2000, 39, 611–627. [Google Scholar] [CrossRef]
  44. Müller, G. Schwermetalle in den Sedimenten des Rheins—Veränderungen seit. Umschau 1979, 79, 133–149. [Google Scholar]
  45. Tomlinson, D.L.; Wilson, J.G.; Harris, C.R.; Jeffrey, D.W. Problems in the assessment of heavy-metal levels in estuaries and the formation of a pollution index. Helgoländer Meeresunters 1980, 33, 566–575. [Google Scholar] [CrossRef]
  46. Long, E.R.; Macdonald, D.D.; Smith, S.L.; Calder, F.D. Incidence of adverse biological effects within ranges of chemical concentrations in marine and estuarine sediments. Environ. Manag. 1995, 19, 81–97. [Google Scholar] [CrossRef]
  47. Long, E.R.; MacDonald, D.D.; Severn, C.G.; Hong, C.B. Classifying probabilities of acute toxicity in marine sediments with empirically derived sediment quality guidelines. Environ. Toxicol. Chem. 2000, 19, 2598–2601. [Google Scholar] [CrossRef]
  48. Juračić, M.; Pravdić, V. The Role of Suspended Matter in Assessing the Assimilative Capacity Case Study of Two Estuaries in the Adriatic Sea. Chem. Ecol. 1991, 5, 241–248. [Google Scholar] [CrossRef]
  49. de Vallejuelo, S.F.-O.; Arana, G.; de Diego, A.; Madariaga, J.M. Risk assessment of trace elements in sediments: The case of the estuary of the Nerbioi–Ibaizabal River (Basque Country). J. Hazard. Mater. 2010, 181, 565–573. [Google Scholar] [CrossRef]
  50. Jurina, I.; Ivanić, M.; Vdović, N.; Troskot-Čorbić, T.; Lojen, S.; Mikac, N.; Sondi, I. Deposition of trace metals in sediments of the deltaic plain and adjacent coastal area (the Neretva River, Adriatic Sea). J. Geochem. Explor. 2015, 157, 120–131. [Google Scholar] [CrossRef]
  51. Komar, D.; Dolenec, M.; Belak, Ž.L.; Matešić, S.S.; Lojen, S.; Kniewald, G.; Vrhovnik, P.; Dolenec, T.; Šmuc, N.R. Geochemical characterization and environmental status of Makirina bay sediments (Northern Dalmatia, Republic of Croatia). Geol. Croat. 2015, 68, 79–92. [Google Scholar] [CrossRef]
  52. Oreščanin, V.; Barišić, D.; Lovrenčić Mikelić, I.; Rožmarić, M. Environmental contamination assessment of the sur-roundings of the ex-Šibenik’s ferro-manganese Smelter, Croatia. J. Environ. Sci. Health Part A 2004, 39, 2493–2506. [Google Scholar] [CrossRef] [PubMed]
  53. Cukrov, N.; Frančišković-Bilinski, S.; Hlača, B.; Barišić, D. A recent history of metal accumulation in the sediments of Rijeka harbor, Adriatic Sea, Croatia. Mar. Pollut. Bull. 2011, 62, 154–167. [Google Scholar] [CrossRef]
  54. Acquavita, A.; Predonzani, S.; Mattassi, G.; Rossin, P.; Tamberlich, F.; Falomo, J.; Valic, I. Heavy Metal Contents and Distribution in Coastal Sediments of the Gulf of Trieste (Northern Adriatic Sea, Italy). Water Air Soil Pollut. 2010, 211, 95–111. [Google Scholar] [CrossRef]
  55. Cukrov, N.; Frančišković-Bilinski, S.; Bogner, D. Metal contamination recorded in the sediment of the semi-closed Bakar Bay (Croatia). Environ. Geochem. Health 2013, 36, 195–208. [Google Scholar] [CrossRef]
  56. Coynel, A.; Gorse, L.; Curti, C.; Schafer, J.; Grosbois, C.; Morelli, G.; Ducassou, E.; Blanc, G.; Maillet, G.M.; Mojtahid, M. Spatial distribution of trace elements in the surface sediments of a major European estuary (Loire Estuary, France): Source identification and evaluation of anthropogenic contribution. J. Sea Res. 2016, 118, 77–91. [Google Scholar] [CrossRef]
  57. Montuori, P.; Aurino, S.; Garzonio, F.; Nardone, A.; Triassi, M. Estimation of heavy metal loads from Tiber River to the Tyrrhenian Sea and environmental quality assessment. Environ. Sci. Pollut. Res. 2016, 23, 23694–23713. [Google Scholar] [CrossRef]
  58. Cukrov, N.; Doumandji, N.; Garnier, C.; Tucaković, I.; Dang, D.H.; Omanović, D.; Cukrov, N. Anthropogenic mercury contamination in sediments of Krka River estuary (Croatia). Environ. Sci. Pollut. Res. 2020, 27, 7628–7638. [Google Scholar] [CrossRef] [PubMed]
  59. Bilinski, H.; Kozar, S.; Plavšić, M.; Kwokal, Ž.; Branica, M. Trace metal adsorption on inorganic solid phases under estuarine conditions. Mar. Chem. 1991, 32, 225–233. [Google Scholar] [CrossRef]
  60. Jokinen, S.A.; Jilbert, T.; Tiihonen-Filppula, R.; Koho, K. Terrestrial organic matter input drives sedimentary trace metal sequestration in a human-impacted boreal estuary. Sci. Total Environ. 2020, 717, 137047. [Google Scholar] [CrossRef]
  61. Prajith, A.; Rao, V.P.; Chakraborty, P. Distribution, provenance and early diagenesis of major and trace metals in sediment cores from the Mandovi estuary, western India. Estuarine Coast. Shelf Sci. 2016, 170, 173–185. [Google Scholar] [CrossRef]
  62. Santos-Echeandia, J.; Prego, R.; Cobelo-García, A.; Millward, G. Porewater geochemistry in a Galician Ria (NW Iberian Peninsula): Implications for benthic fluxes of dissolved trace elements (Co, Cu, Ni, Pb, V, Zn). Mar. Chem. 2009, 117, 77–87. [Google Scholar] [CrossRef]
  63. Tankere-Muller, S.; Zhang, H.; Davison, W.; Finke, N.; Larsen, O.; Stahl, H.; Glud, R.N. Fine scale remobilisation of Fe, Mn, Co, Ni, Cu and Cd in contaminated marine sediment. Mar. Chem. 2007, 106, 192–207. [Google Scholar] [CrossRef]
  64. Gao, L.; Li, R.; Liang, Z.; Wu, Q.; Yang, Z.; Li, M.; Chen, J.; Hou, L. Mobilization mechanisms and toxicity risk of sediment trace metals (Cu, Zn, Ni, and Pb) based on diffusive gradients in thin films: A case study in the Xizhi River basin, South China. J. Hazard. Mater. 2021, 410, 124590. [Google Scholar] [CrossRef]
  65. Wang, W.; Wang, W.-X. Trace metal behavior in sediments of Jiulong River Estuary and implication for benthic exchange fluxes. Environ. Pollut. 2017, 225, 598–609. [Google Scholar] [CrossRef]
  66. Murray, J.W.; Dillard, J.G. The oxidation of cobalt(II) adsorbed on manganese dioxide. Geochim. Cosmochim. Acta 1979, 43, 781–787. [Google Scholar] [CrossRef]
  67. Alkhader, A.M.F. The Impact of Phosphorus Fertilizers on Heavy Metals Content of Soils and Vegetables Grown on Selected Farms in Jordan. Agrotechnology 2015, 5, 137. [Google Scholar] [CrossRef]
  68. Carnelo, L.G.L.; de Miguez, S.R.; Marbán, L. Heavy metals input with phosphate fertilizers used in Argentina. Sci. Total Environ. 1997, 204, 245–250. [Google Scholar] [CrossRef] [PubMed]
  69. Schipper, L.A.; Sparling, G.P.; Fisk, L.M.; Dodd, M.B.; Power, I.L.; Littler, R.A. Rates of accumulation of cadmium and uranium in a New Zealand hill farm soil as a result of long-term use of phosphate fertilizer. Agric. Ecosyst. Environ. 2011, 144, 95–101. [Google Scholar] [CrossRef]
  70. Schnug, E.; Haneklaus, N. Uranium, the hidden treasure in phosphates. Procedia Eng. 2014, 83, 265–269. [Google Scholar] [CrossRef]
  71. Mandić, J.; Tronczyński, J.; Kušpilić, G. Polycyclic aromatic hydrocarbons in surface sediments of the mid-Adriatic and along the Croatian coast: Levels, distributions and sources. Environ. Pollut. 2018, 242, 519–527. [Google Scholar] [CrossRef]
Figure 1. Map of the Krka River estuary with marked surface sediment sampling locations (dark blue circles) and DGT deployment location (light blue triangle). The red square in the broader map (upper right) denotes the study area.
Sustainability 16 01800 g001
Figure 2. Distribution of Al, Fe, Ni, Cr, Co, As, Cd, Cu, Pb, Mn, and Zn in the surface sediment of the Krka estuary.
Sustainability 16 01800 g002
Figure 3. Calculated enrichment indices for surface sediments (0–5 cm) from the Krka River estuary: (a) enrichment factors (EF); (b) geoaccumulation indices (Igeo).
Sustainability 16 01800 g003
Figure 4. (a) Spatial distribution of the pollution load index (PLI) in the surface sediment of the Krka River estuary. Values <1 indicate no pollution, whereas values >1 indicate polluted sediment; (b) Spatial distribution of the mean ERM quotients (m-ERM-Q) in the surface sediment of the Krka River estuary (on the right). The classes of toxicity probability for biota are defined as m-ERM-Q < 0.1, 9% probability of toxicity; 0.11–0.5, 21% probability of toxicity; 0.51–1.5, 49% probability of toxicity; and >1.51, 76% probability of toxicity.
Sustainability 16 01800 g004
Figure 5. DGT profiles of Fe, Mn, Cd, Zn, Pb, Cu, Co, and Ni measured in the sediment in the Krka River estuary (marina—shipyard area). Vertical profiles of pH, Eh, and dissolved organic carbon (DOC) in the pore water of the sediment core sampled at the DGT deployment site.
Sustainability 16 01800 g005
Figure 6. The principal component analysis (PCA) biplots of the 16 elements measured in the 40 surface sediment samples from the Krka River estuary. (a) PC1 versus PC2 and (b) PC1 versus PC3 are shown. Red circle symbols represent sampling points. Labels are given for 31 of 40 points, due to clarity reasons.
Sustainability 16 01800 g006
Disclaimer/Publisher’s Note: The statements, opinions and data contained in all publications are solely those of the individual author(s) and contributor(s) and not of MDPI and/or the editor(s). MDPI and/or the editor(s) disclaim responsibility for any injury to people or property resulting from any ideas, methods, instructions or products referred to in the content.

