
Blockchain Traceability Adoption in Low-Carbon Supply Chains: An Evolutionary Game Analysis

Abstract
:1. Introduction
2. Review of the Literature and Theoretical Structure
2.1. Blockchain Mechanisms
2.2. Carbon Footprint Management in Supply Chain
2.3. Blockchain-Based Carbon Emission Traceability in Supply Chain
2.4. Evolutionary Game Theory
3. Evolutionary Game Model
3.1. Game Model Assumption
3.1.1. Model Hypothesis
- All stakeholders aim to maximize their own interests and make strategic decisions based on finite rationality. They have the option to adopt blockchain traceability.
- The initial proportion of stakeholders choosing traceability strategies does not impact the final outcome.
- Changes in various parameters will affect the decision making of corresponding stakeholders, which will ultimately be reflected in the speed of evolution and the results.
- Rewards and penalties do not have equal effectiveness for all stakeholders.
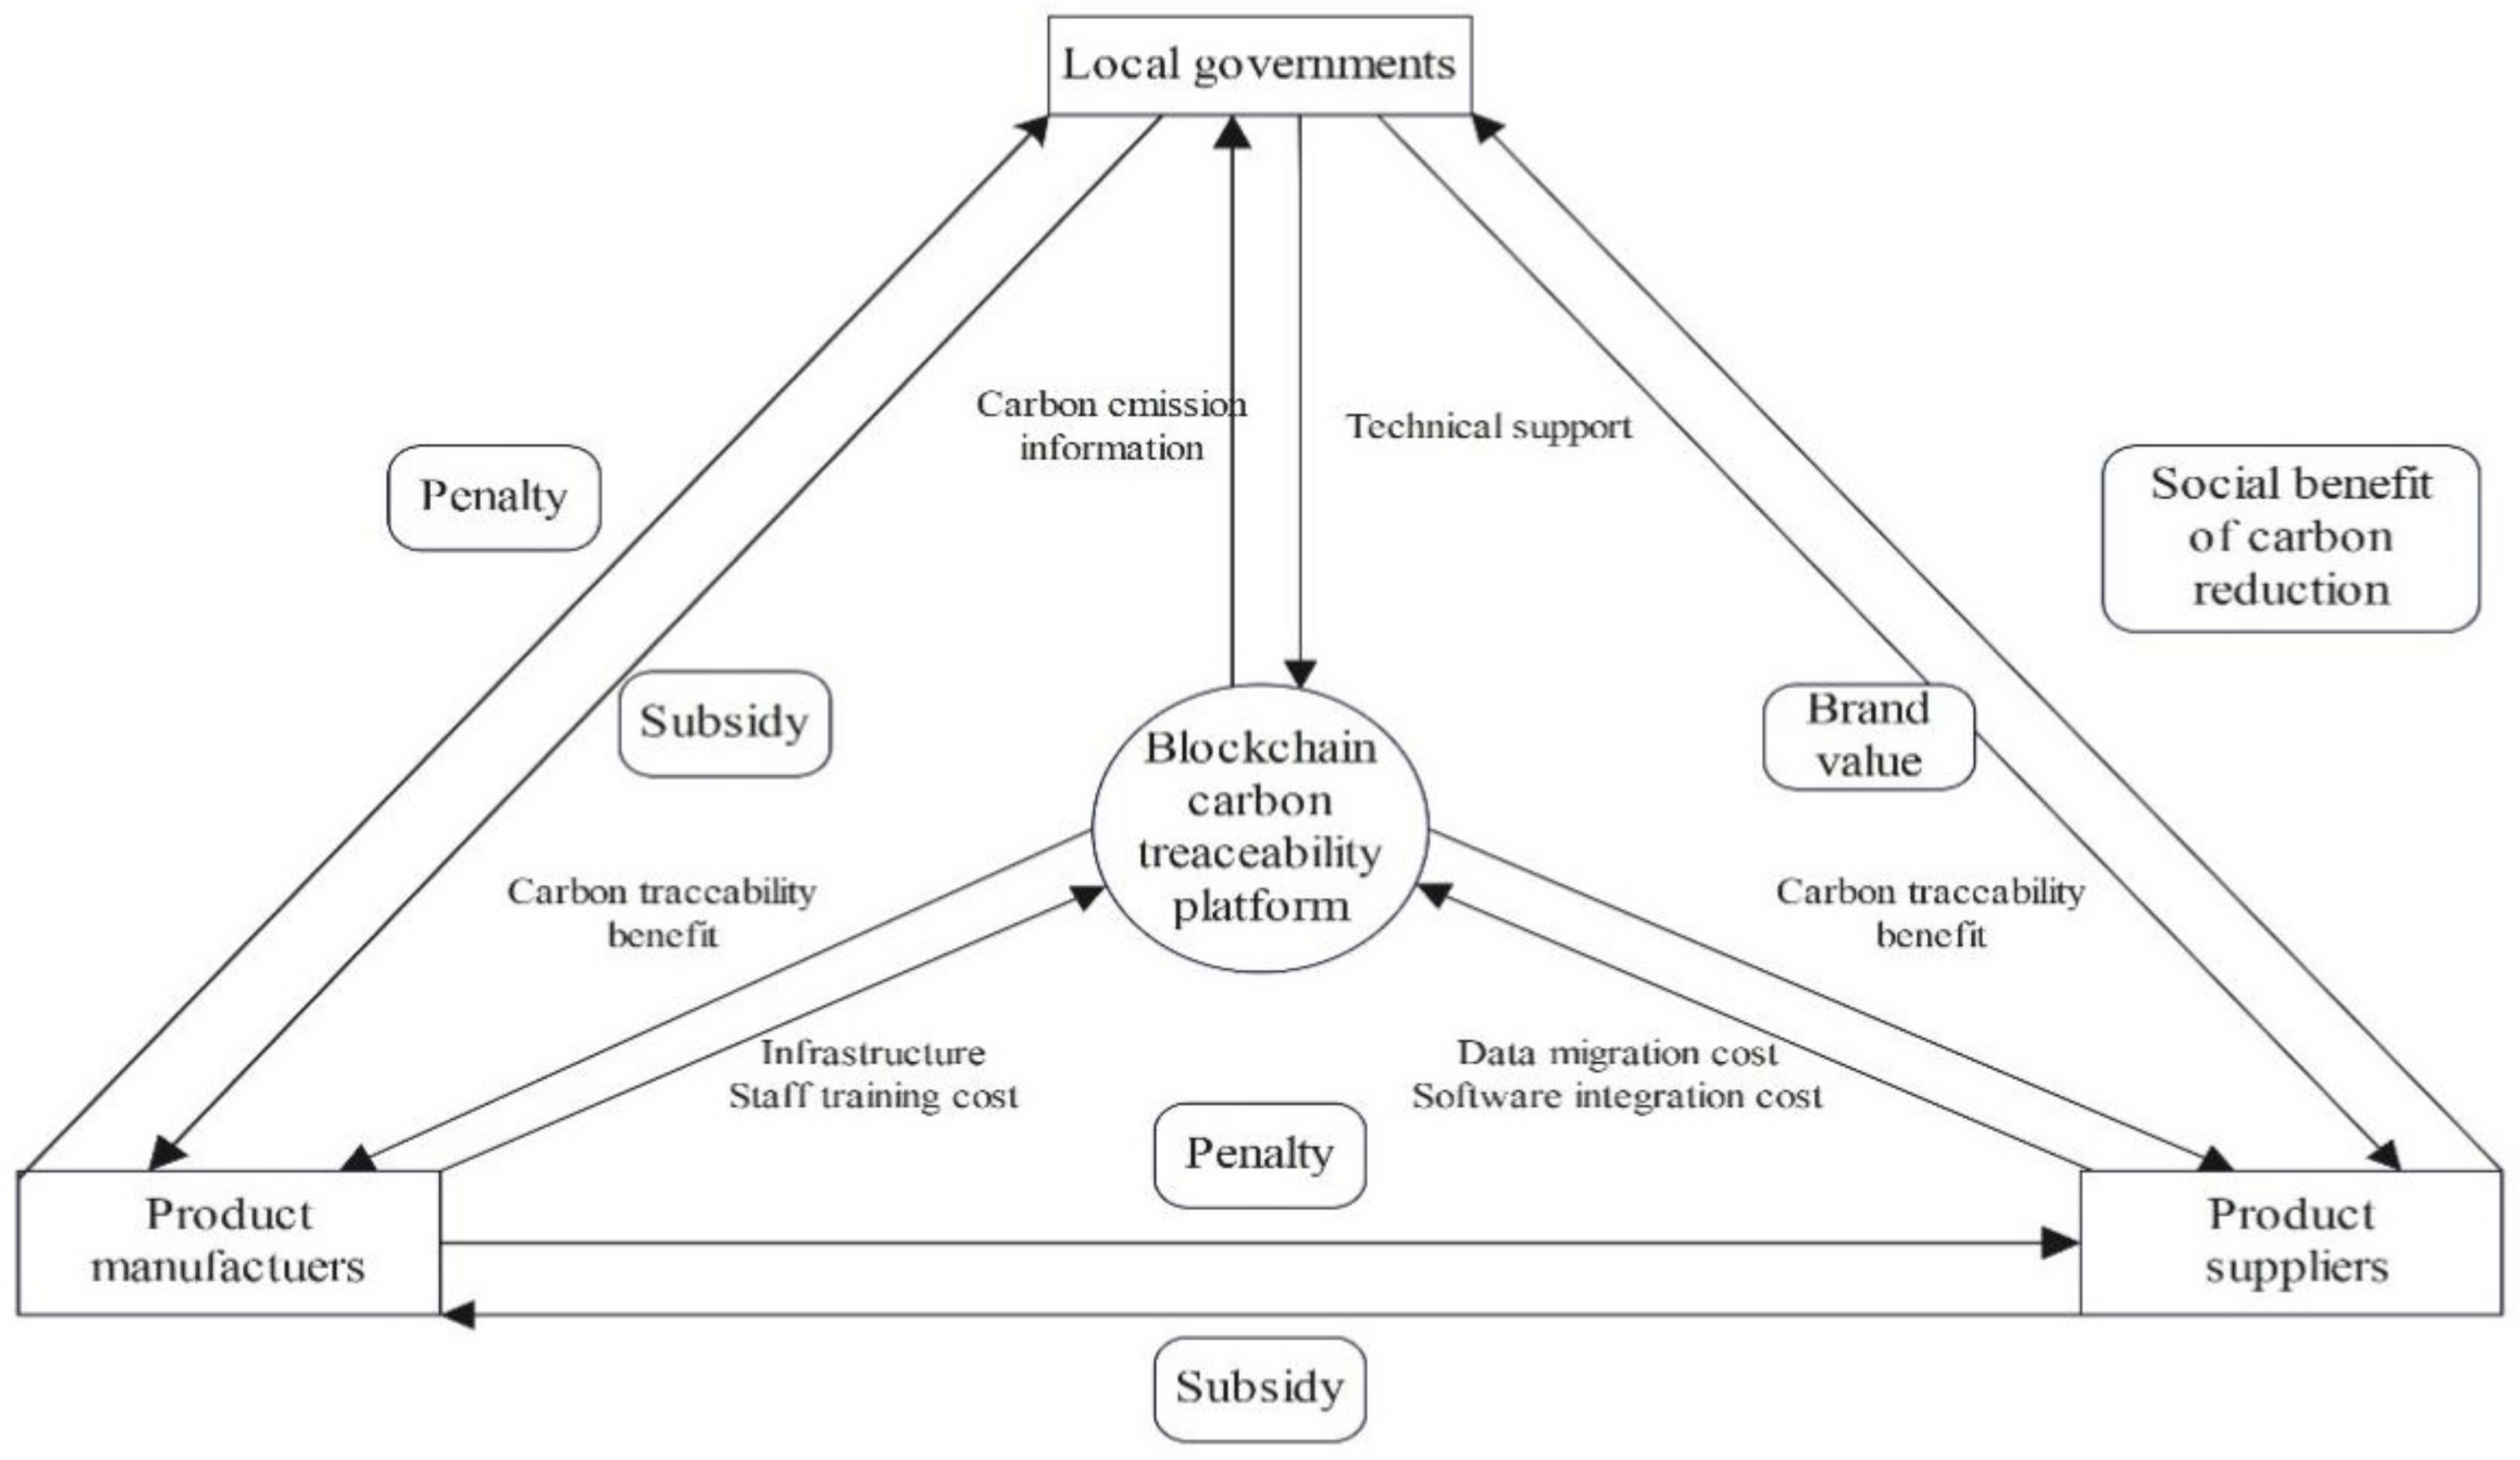
3.1.2. Stakeholders
3.1.3. Parameter Assumption
3.2. Replicator Dynamic of the Game Model
3.2.1. The PMs’ Anticipated Rewards and Strategy Analysis
3.2.2. The PSs’ Anticipated Rewards and Strategy Analysis
3.2.3. The LGs’ Anticipated Rewards and Strategy Analysis
4. Equilibrium Points and Stability Analysis
5. Numerical Simulation
5.1. ESSs in Different Scenarios
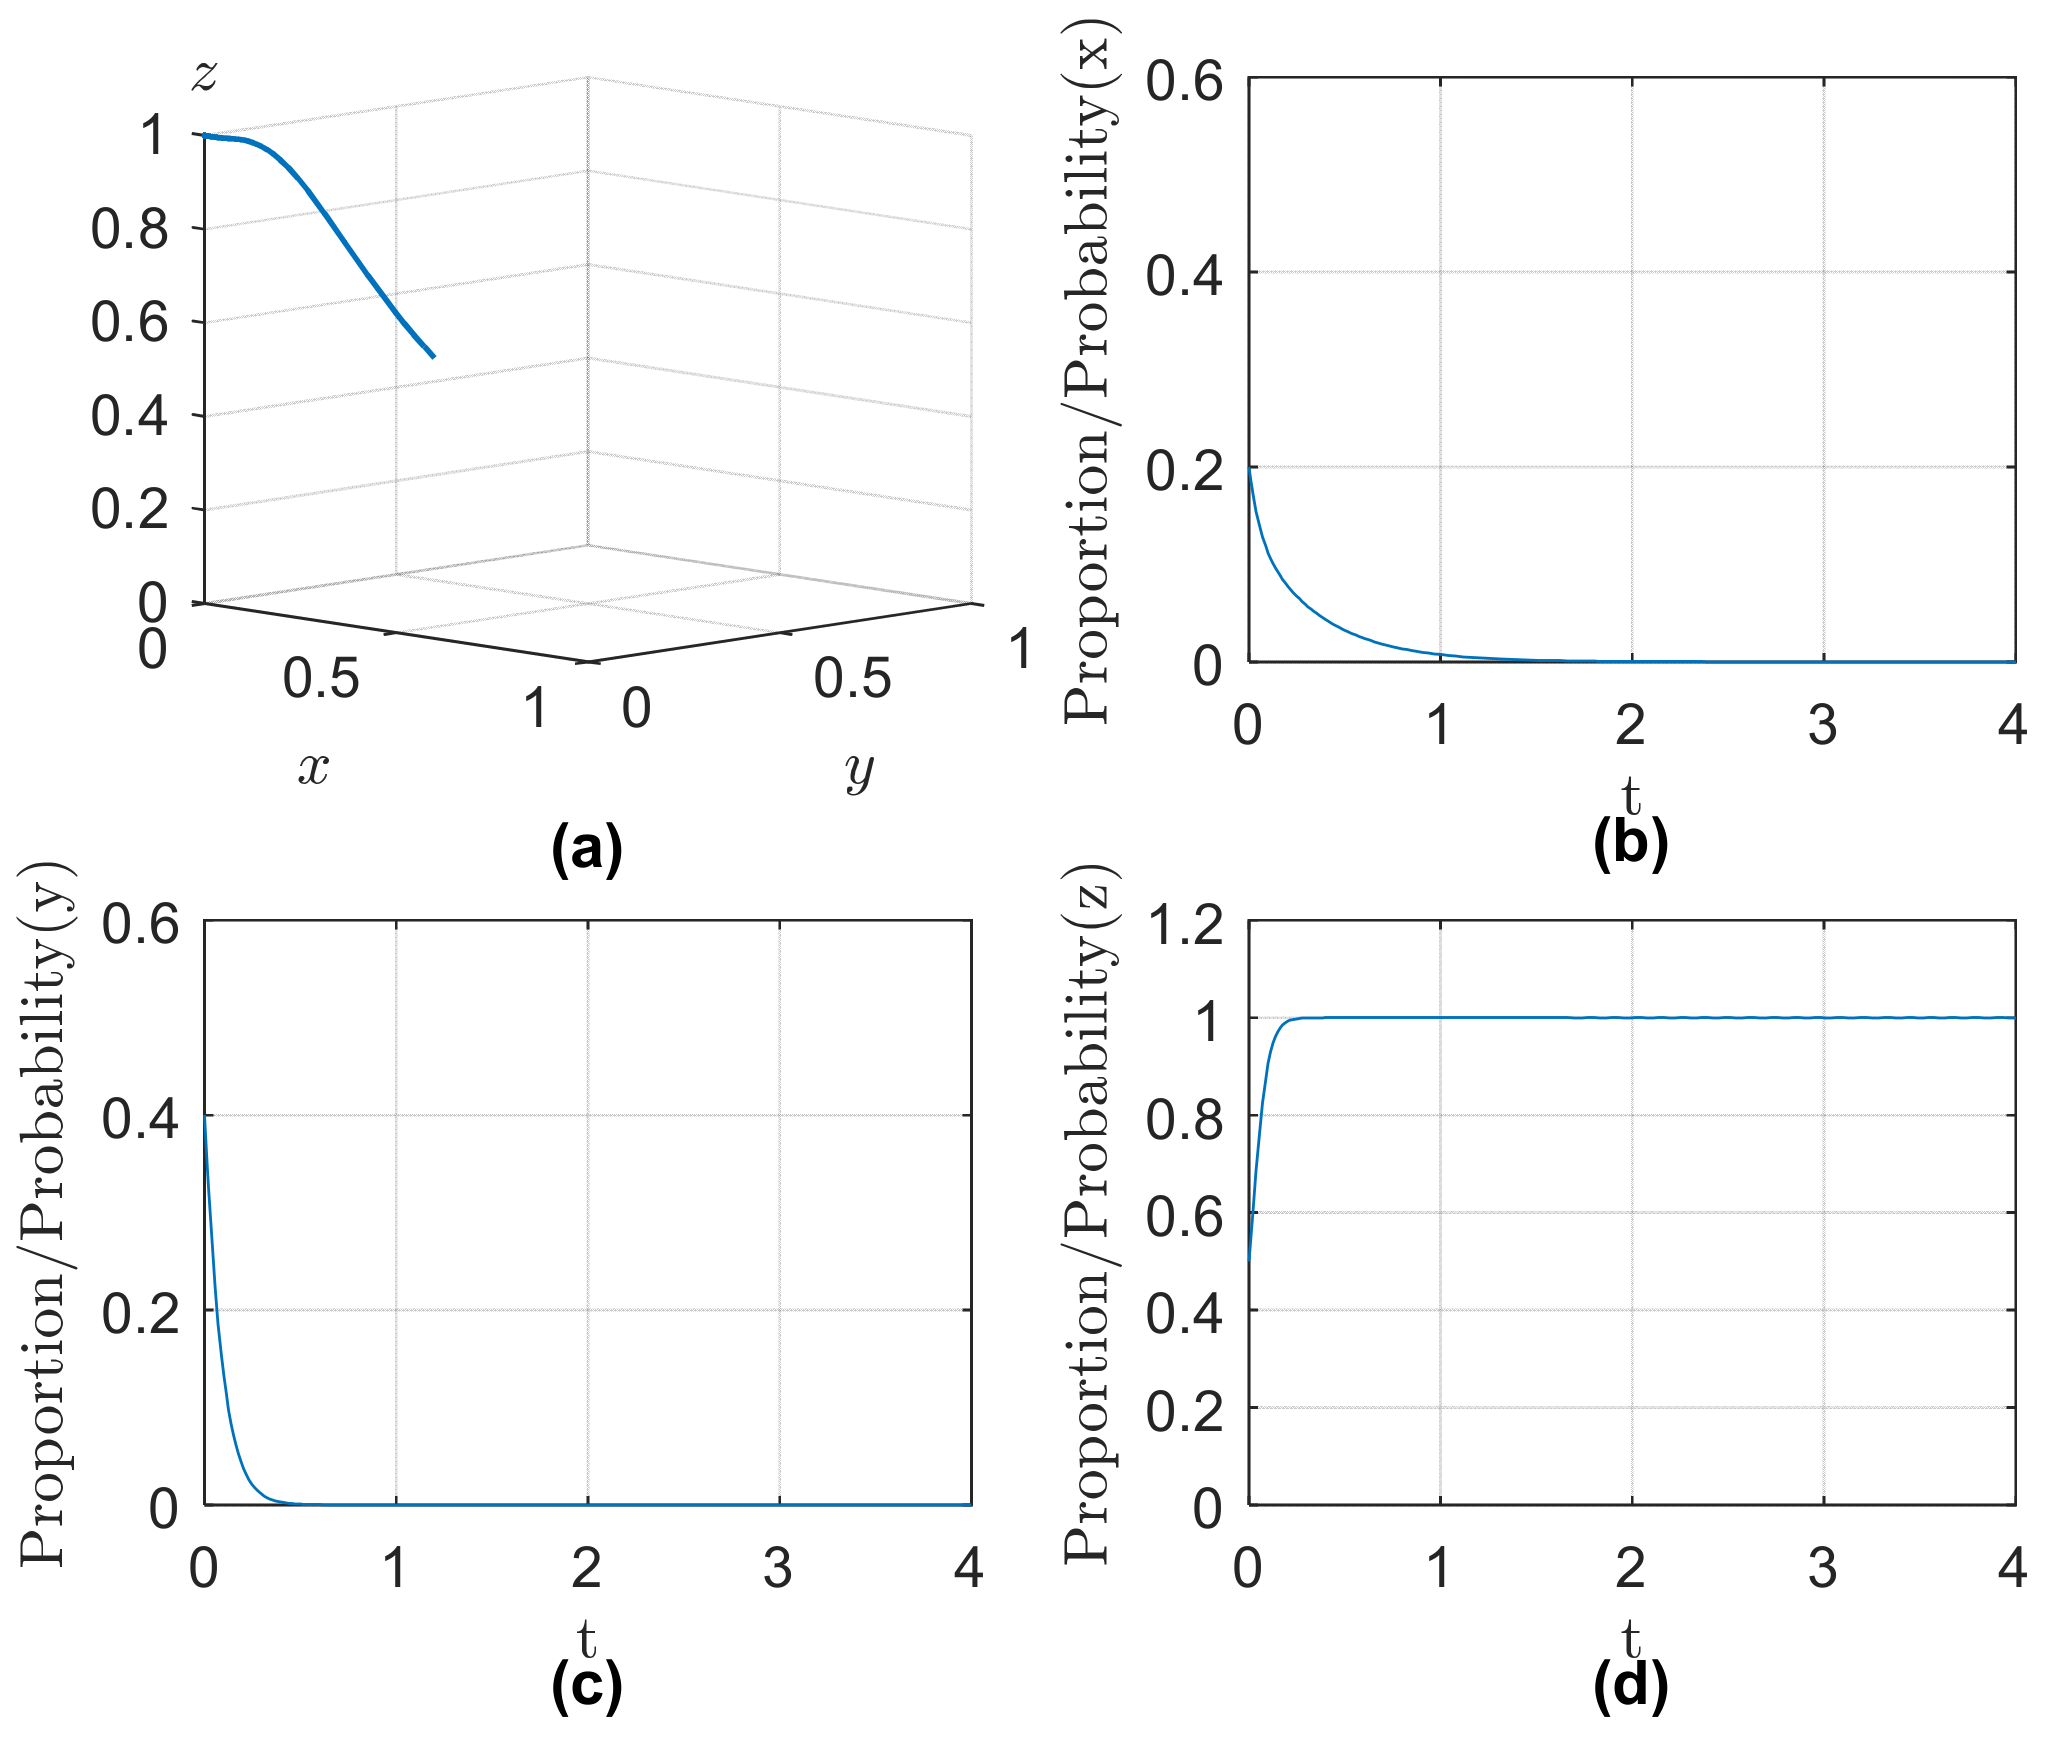
5.1.1. Scenario 1
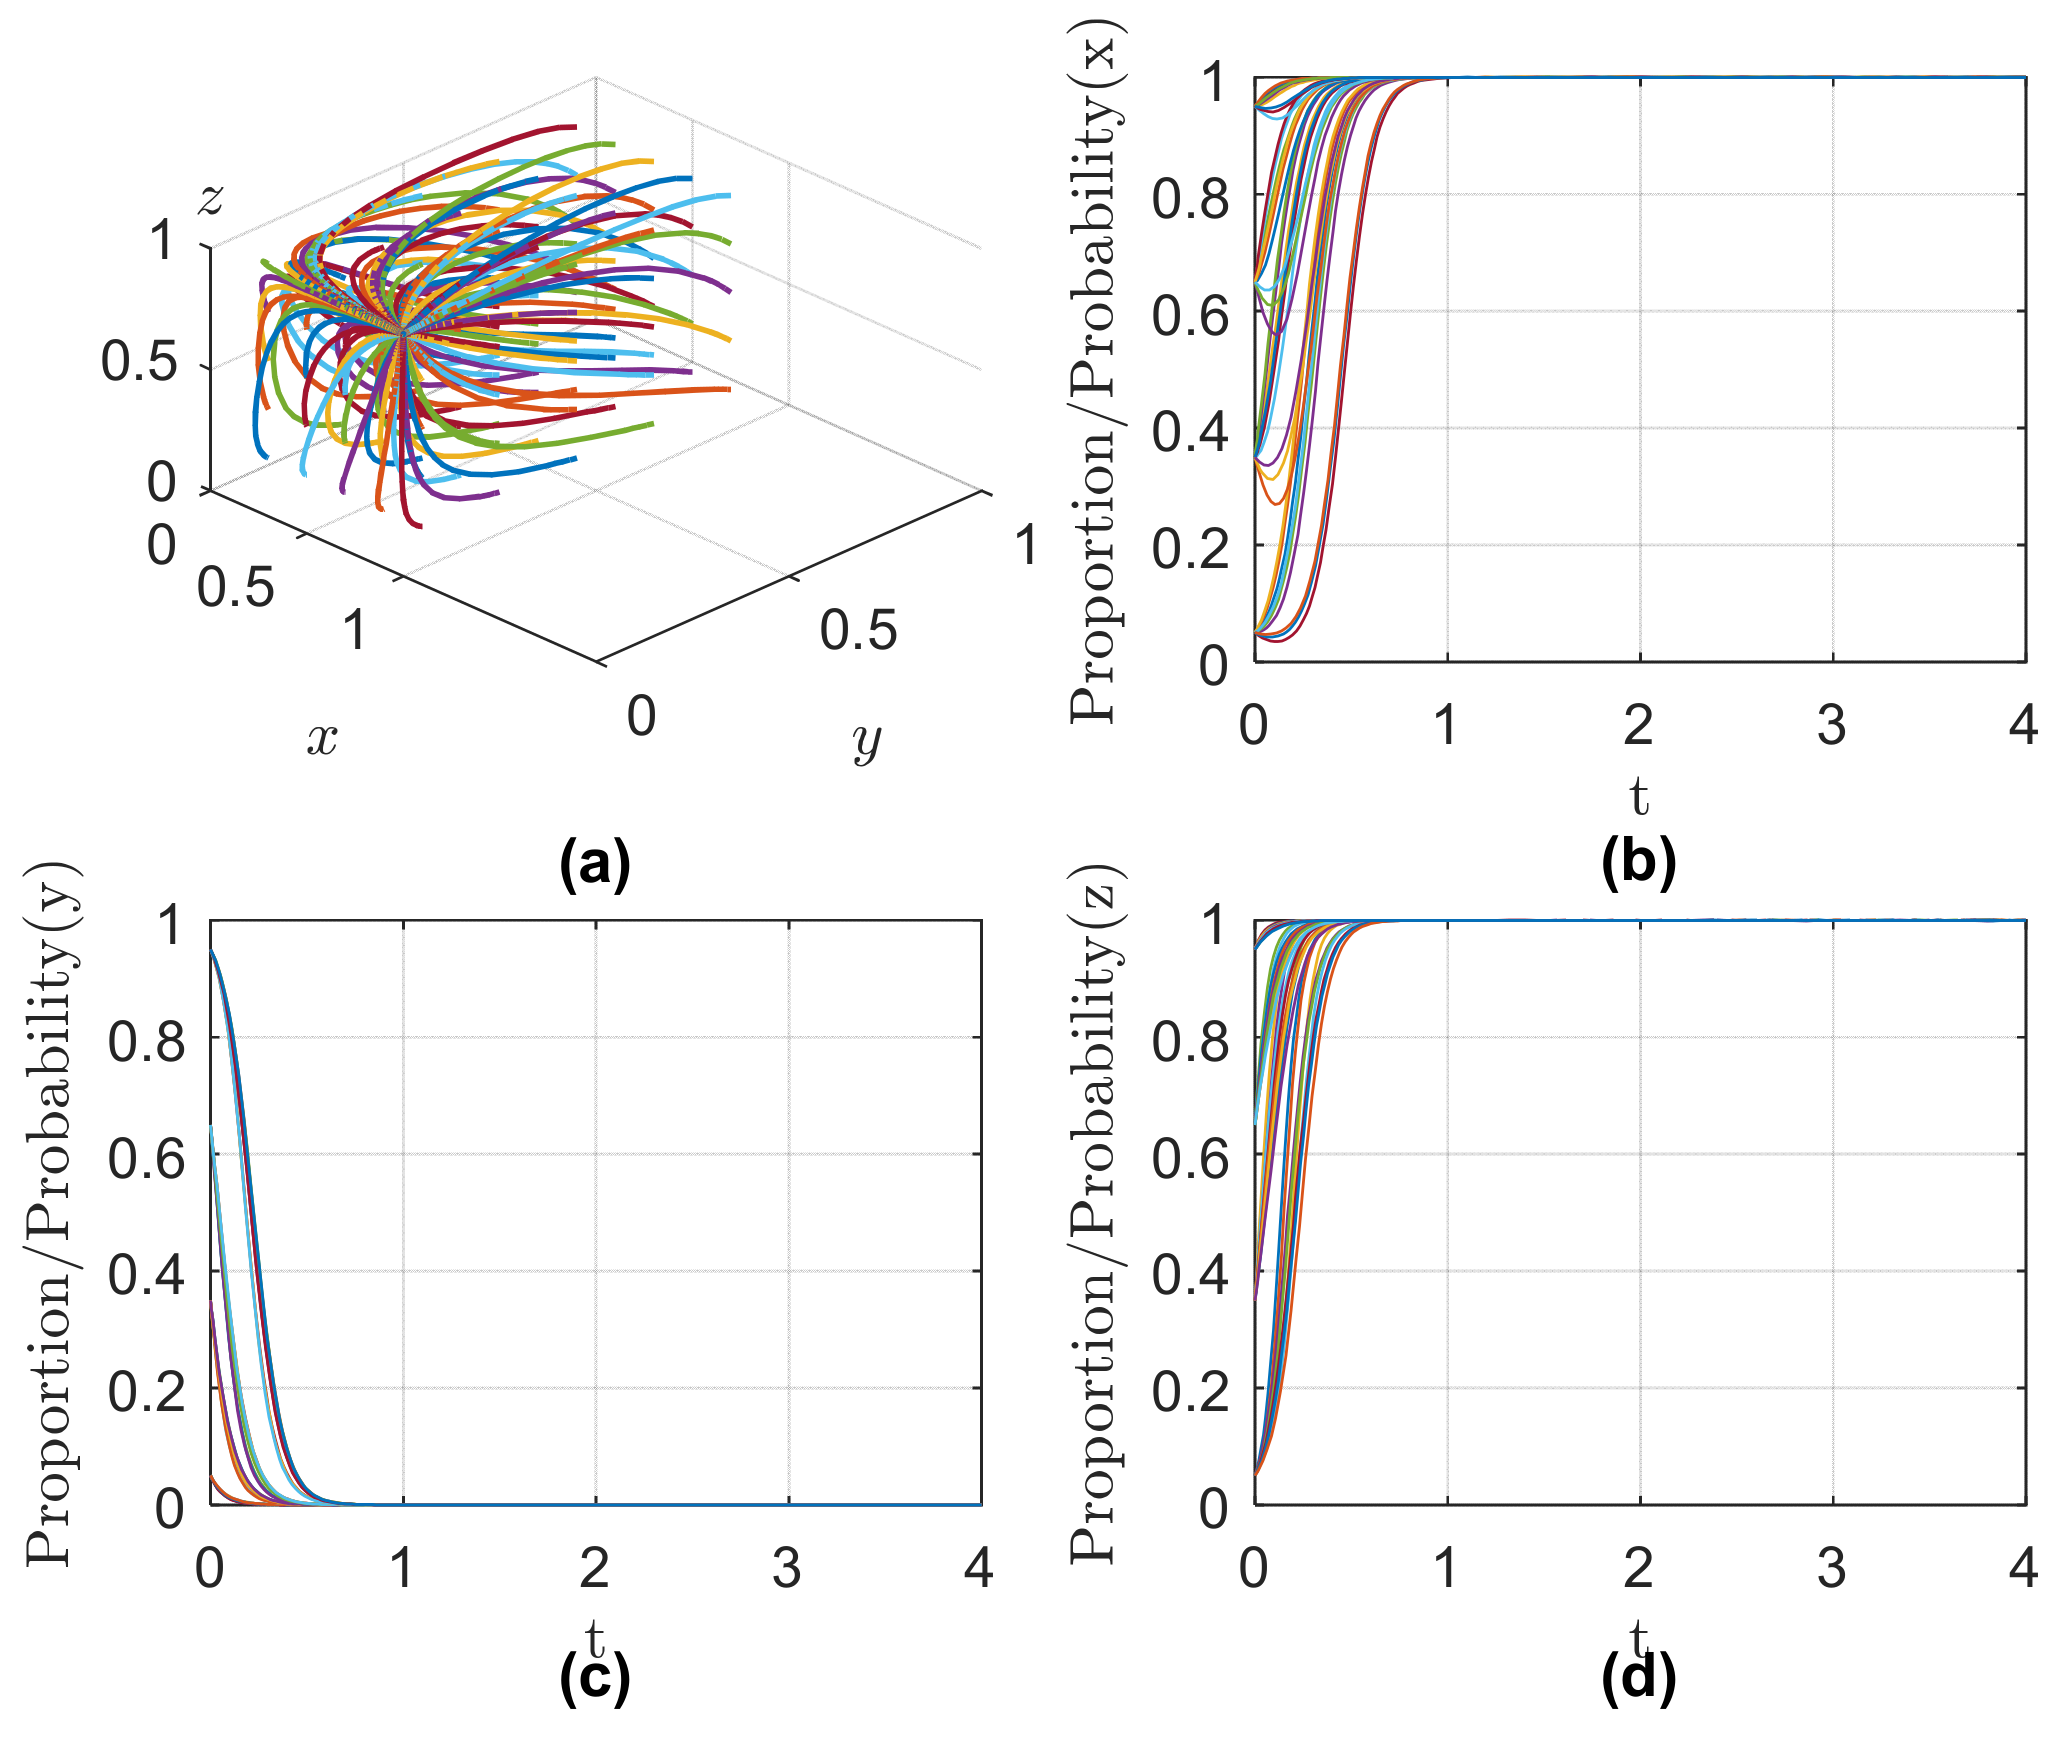
5.1.2. Scenario 2
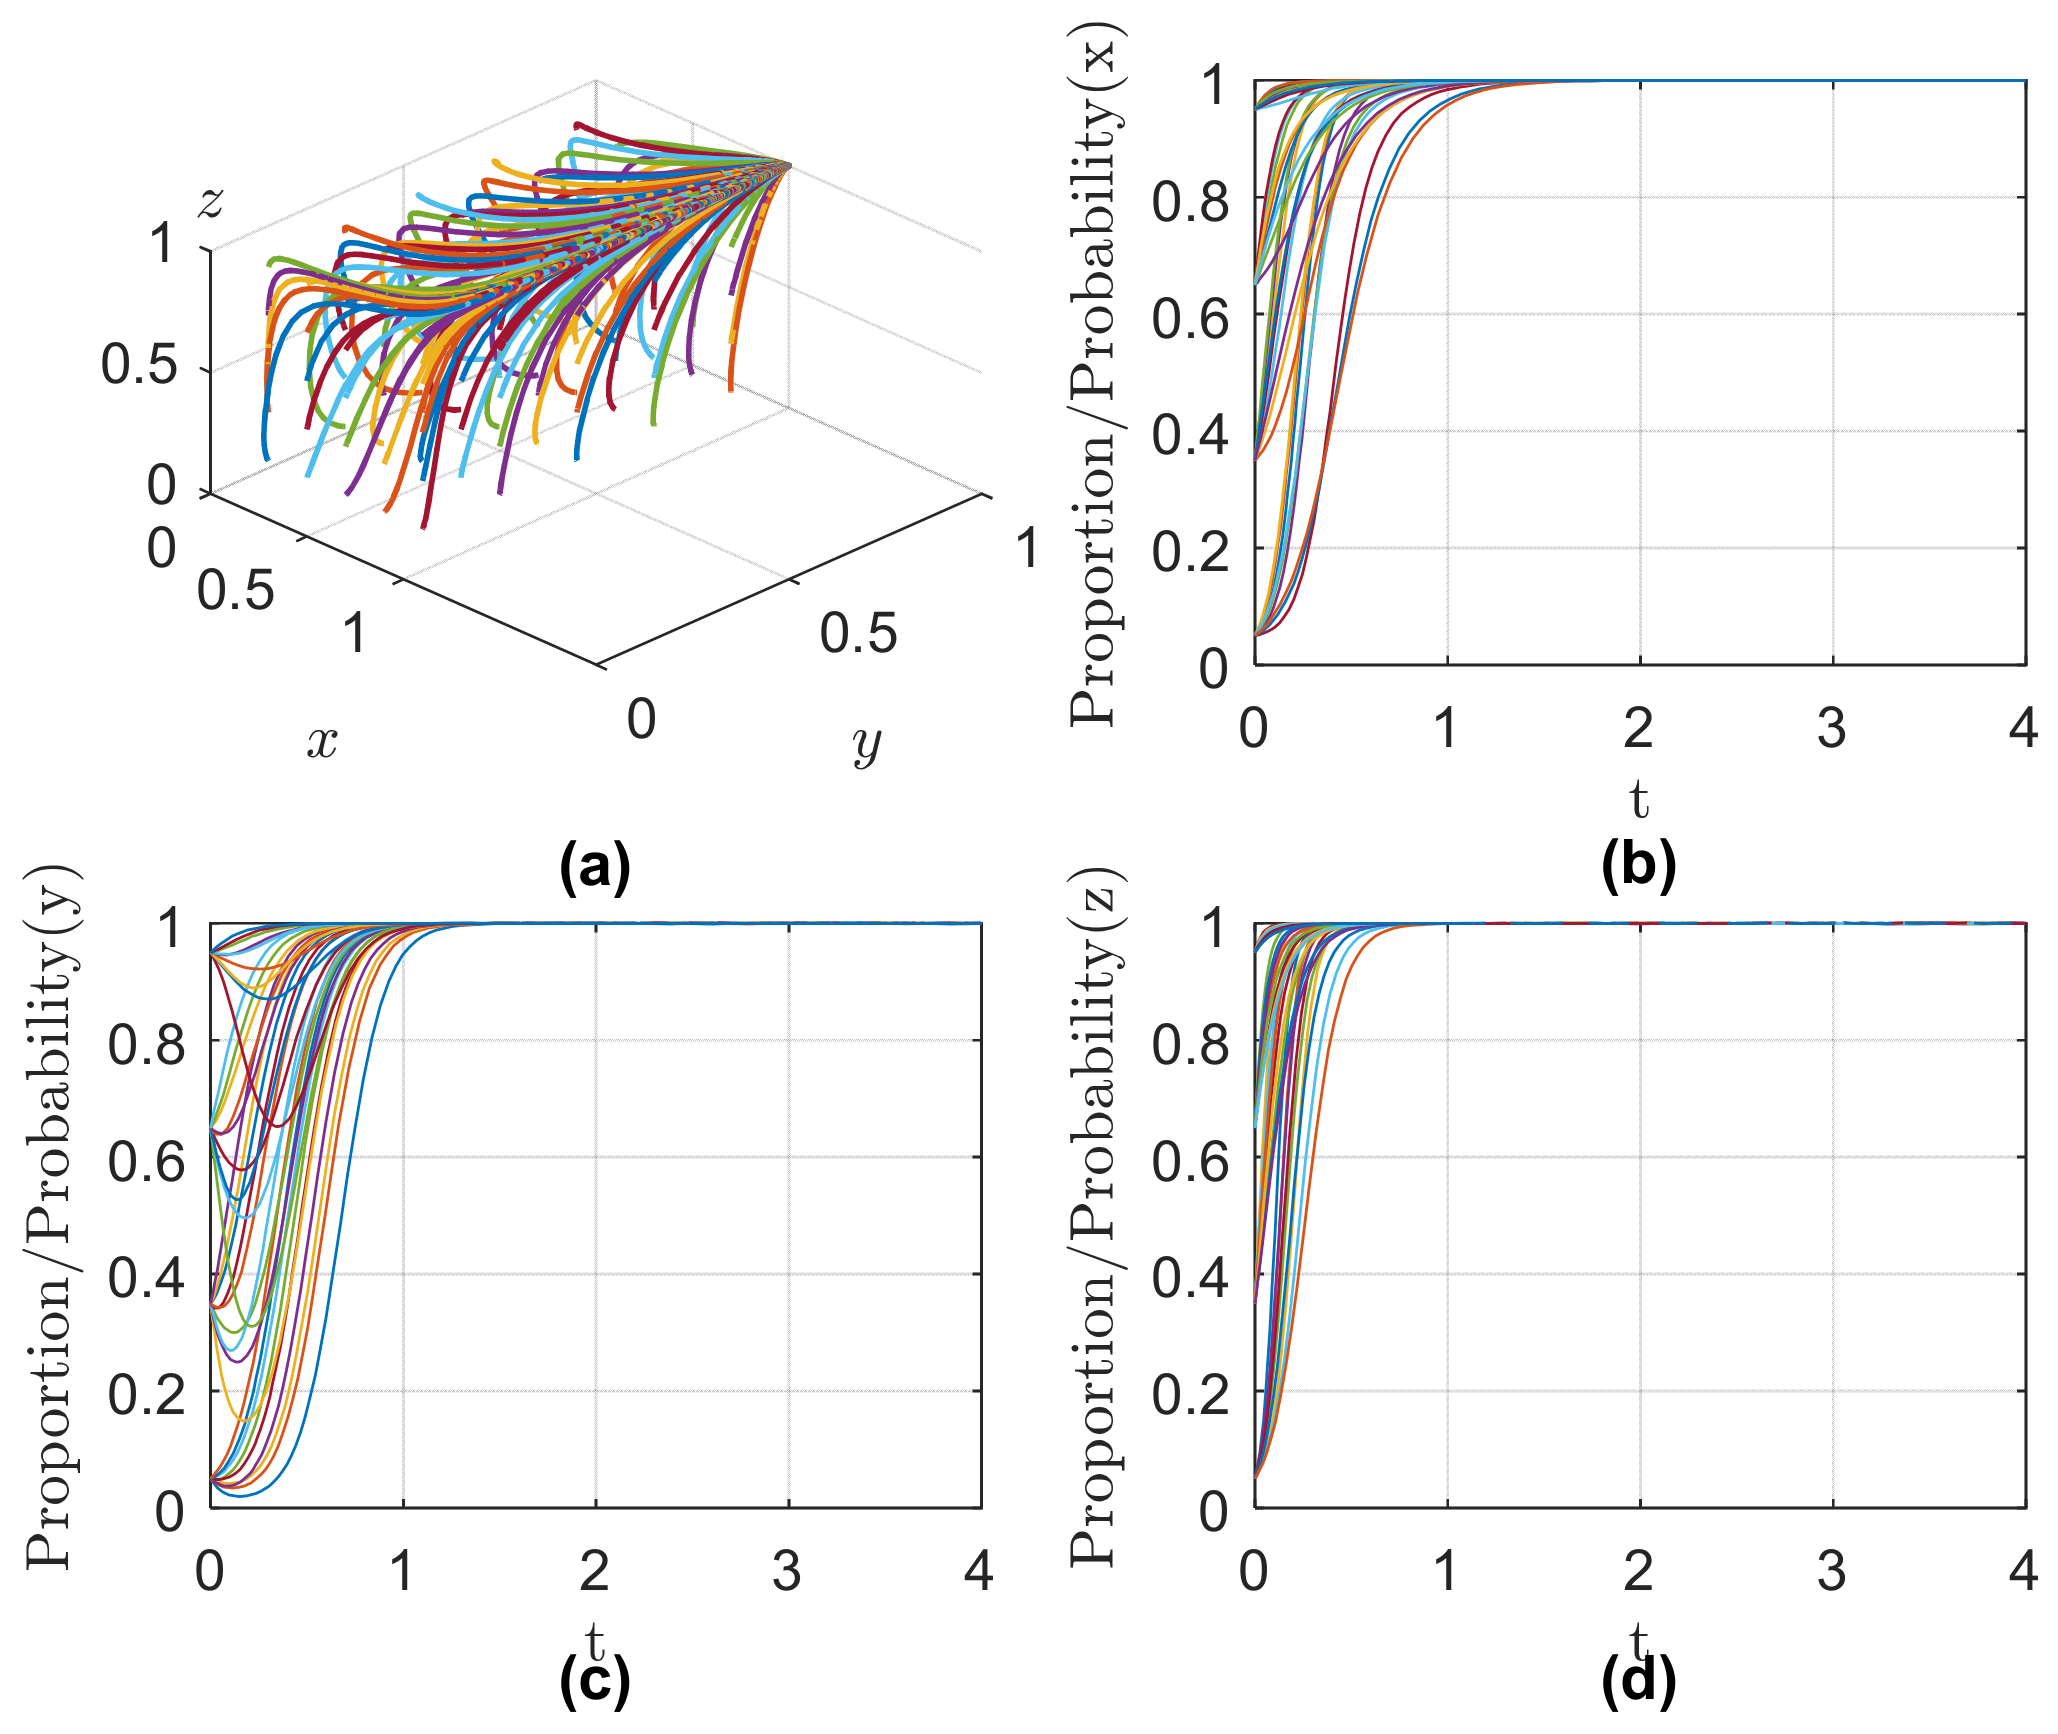
5.1.3. Scenario 3
5.1.4. Scenario 4
5.2. Impacts of Parameter Variations on the Evolutionary Results
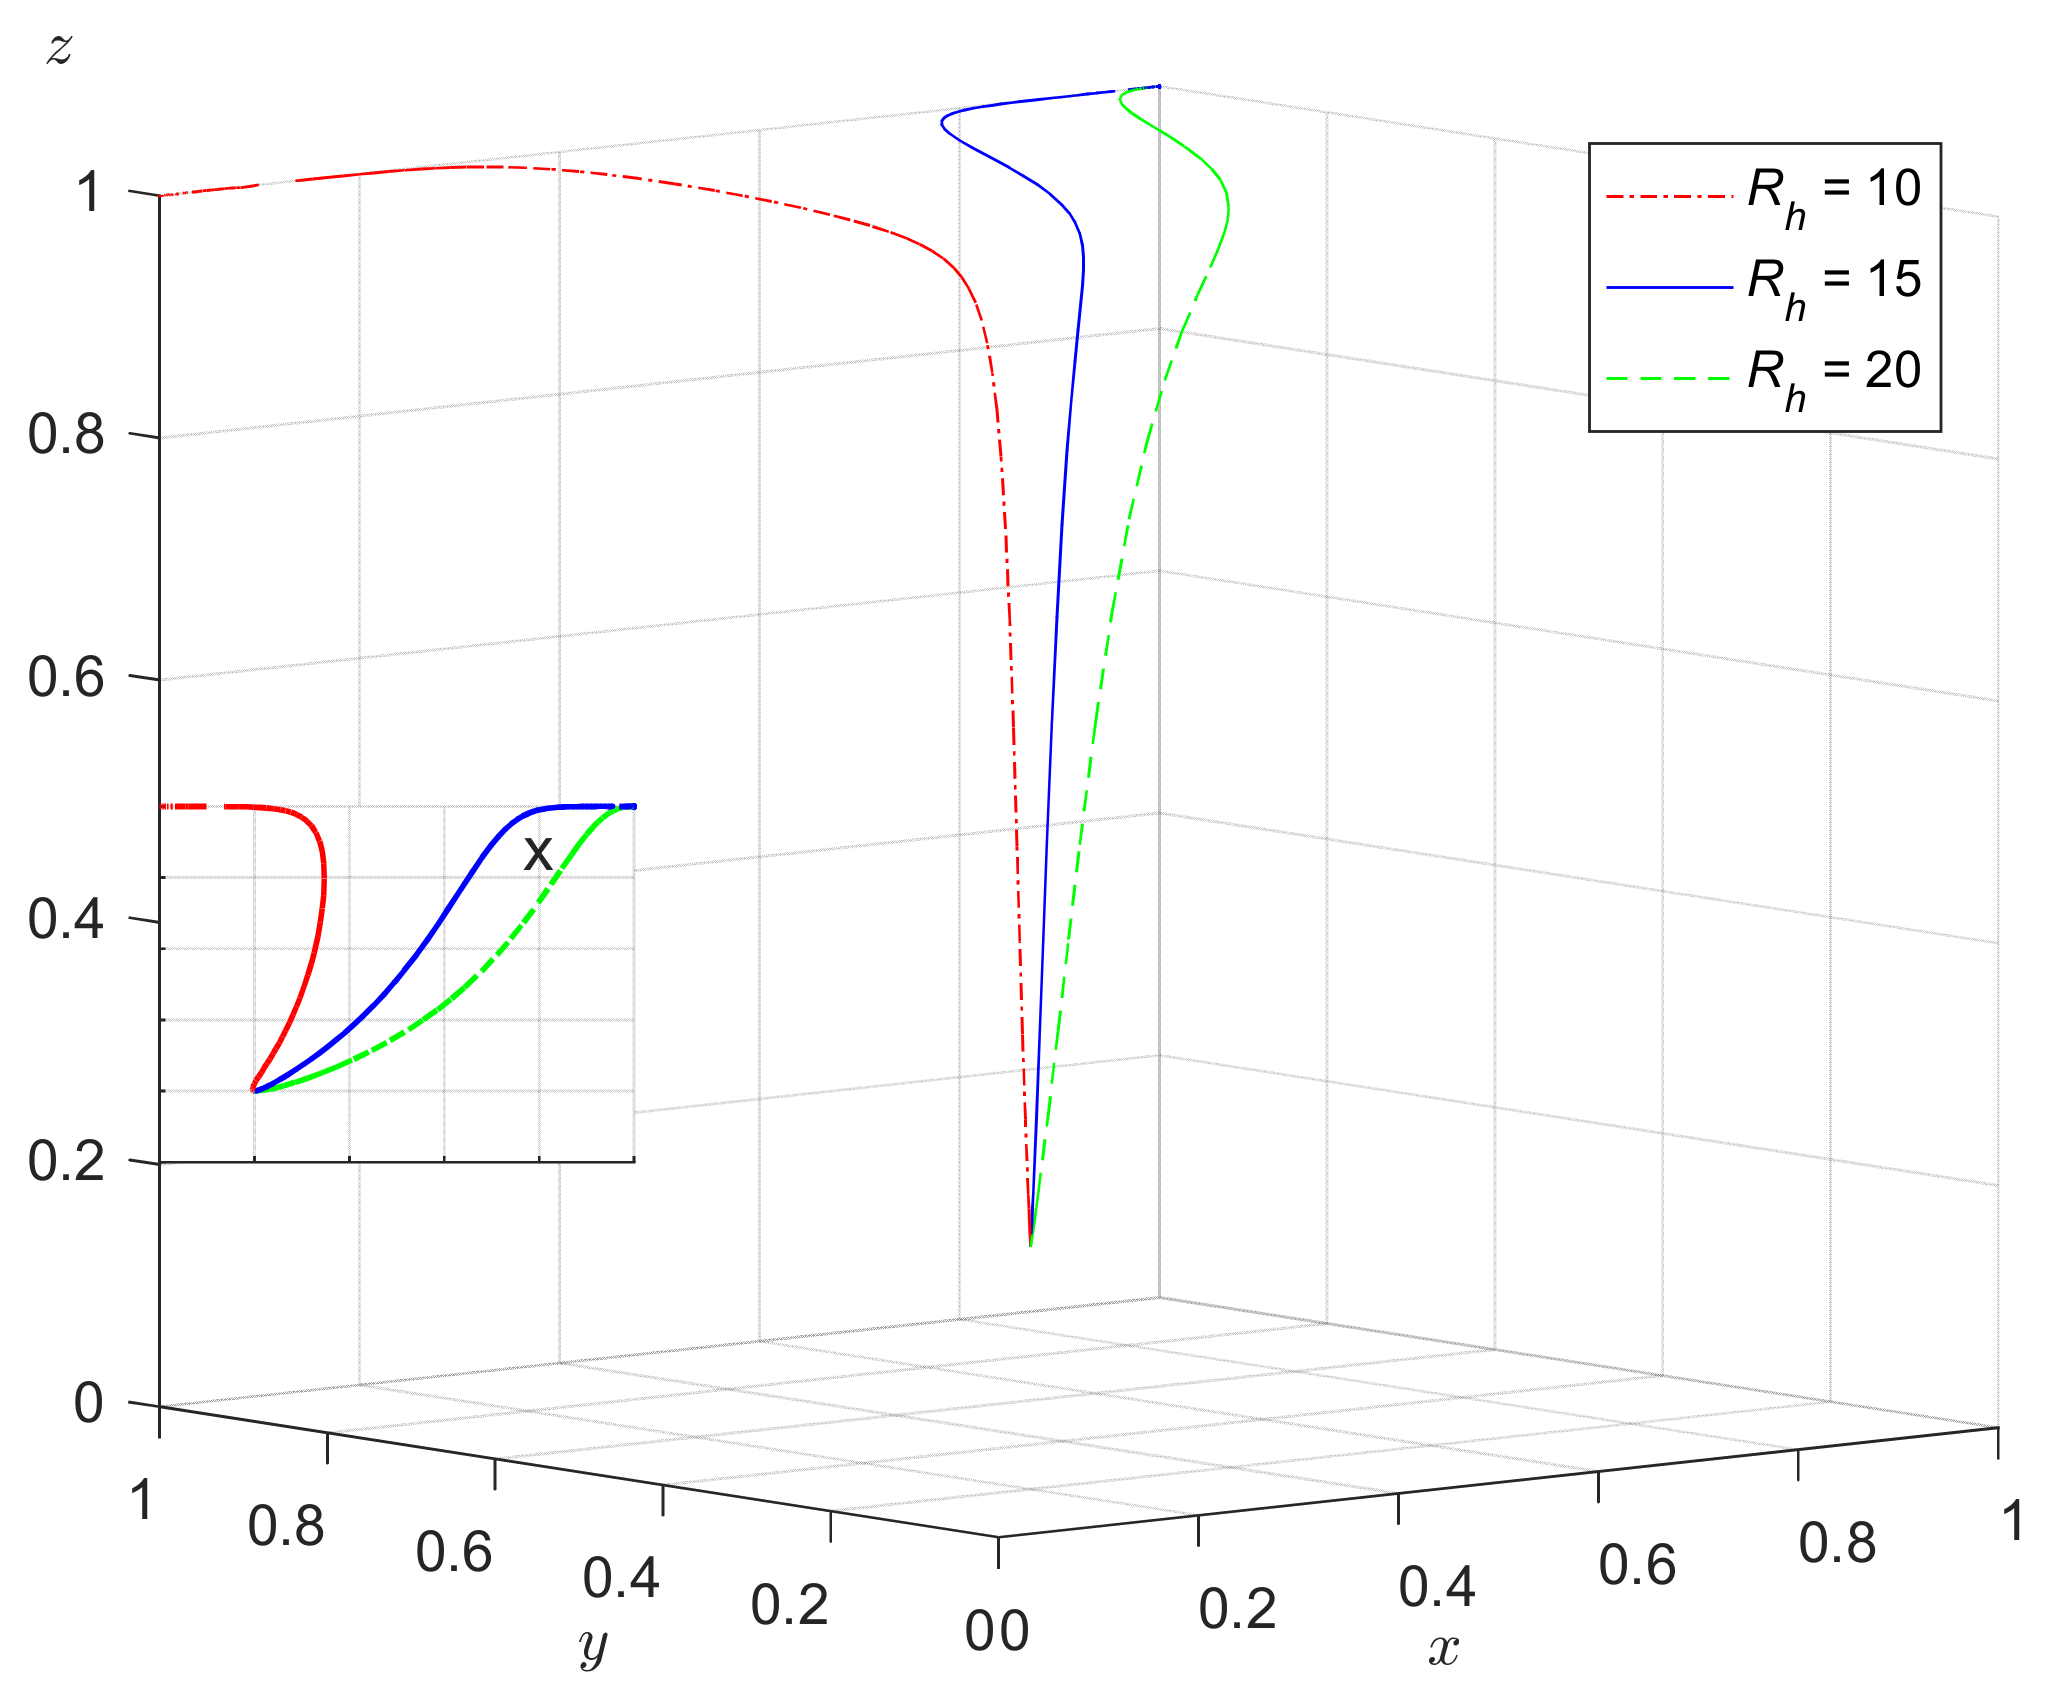
5.2.1. The Impact of Blockchain Traceability Benefits
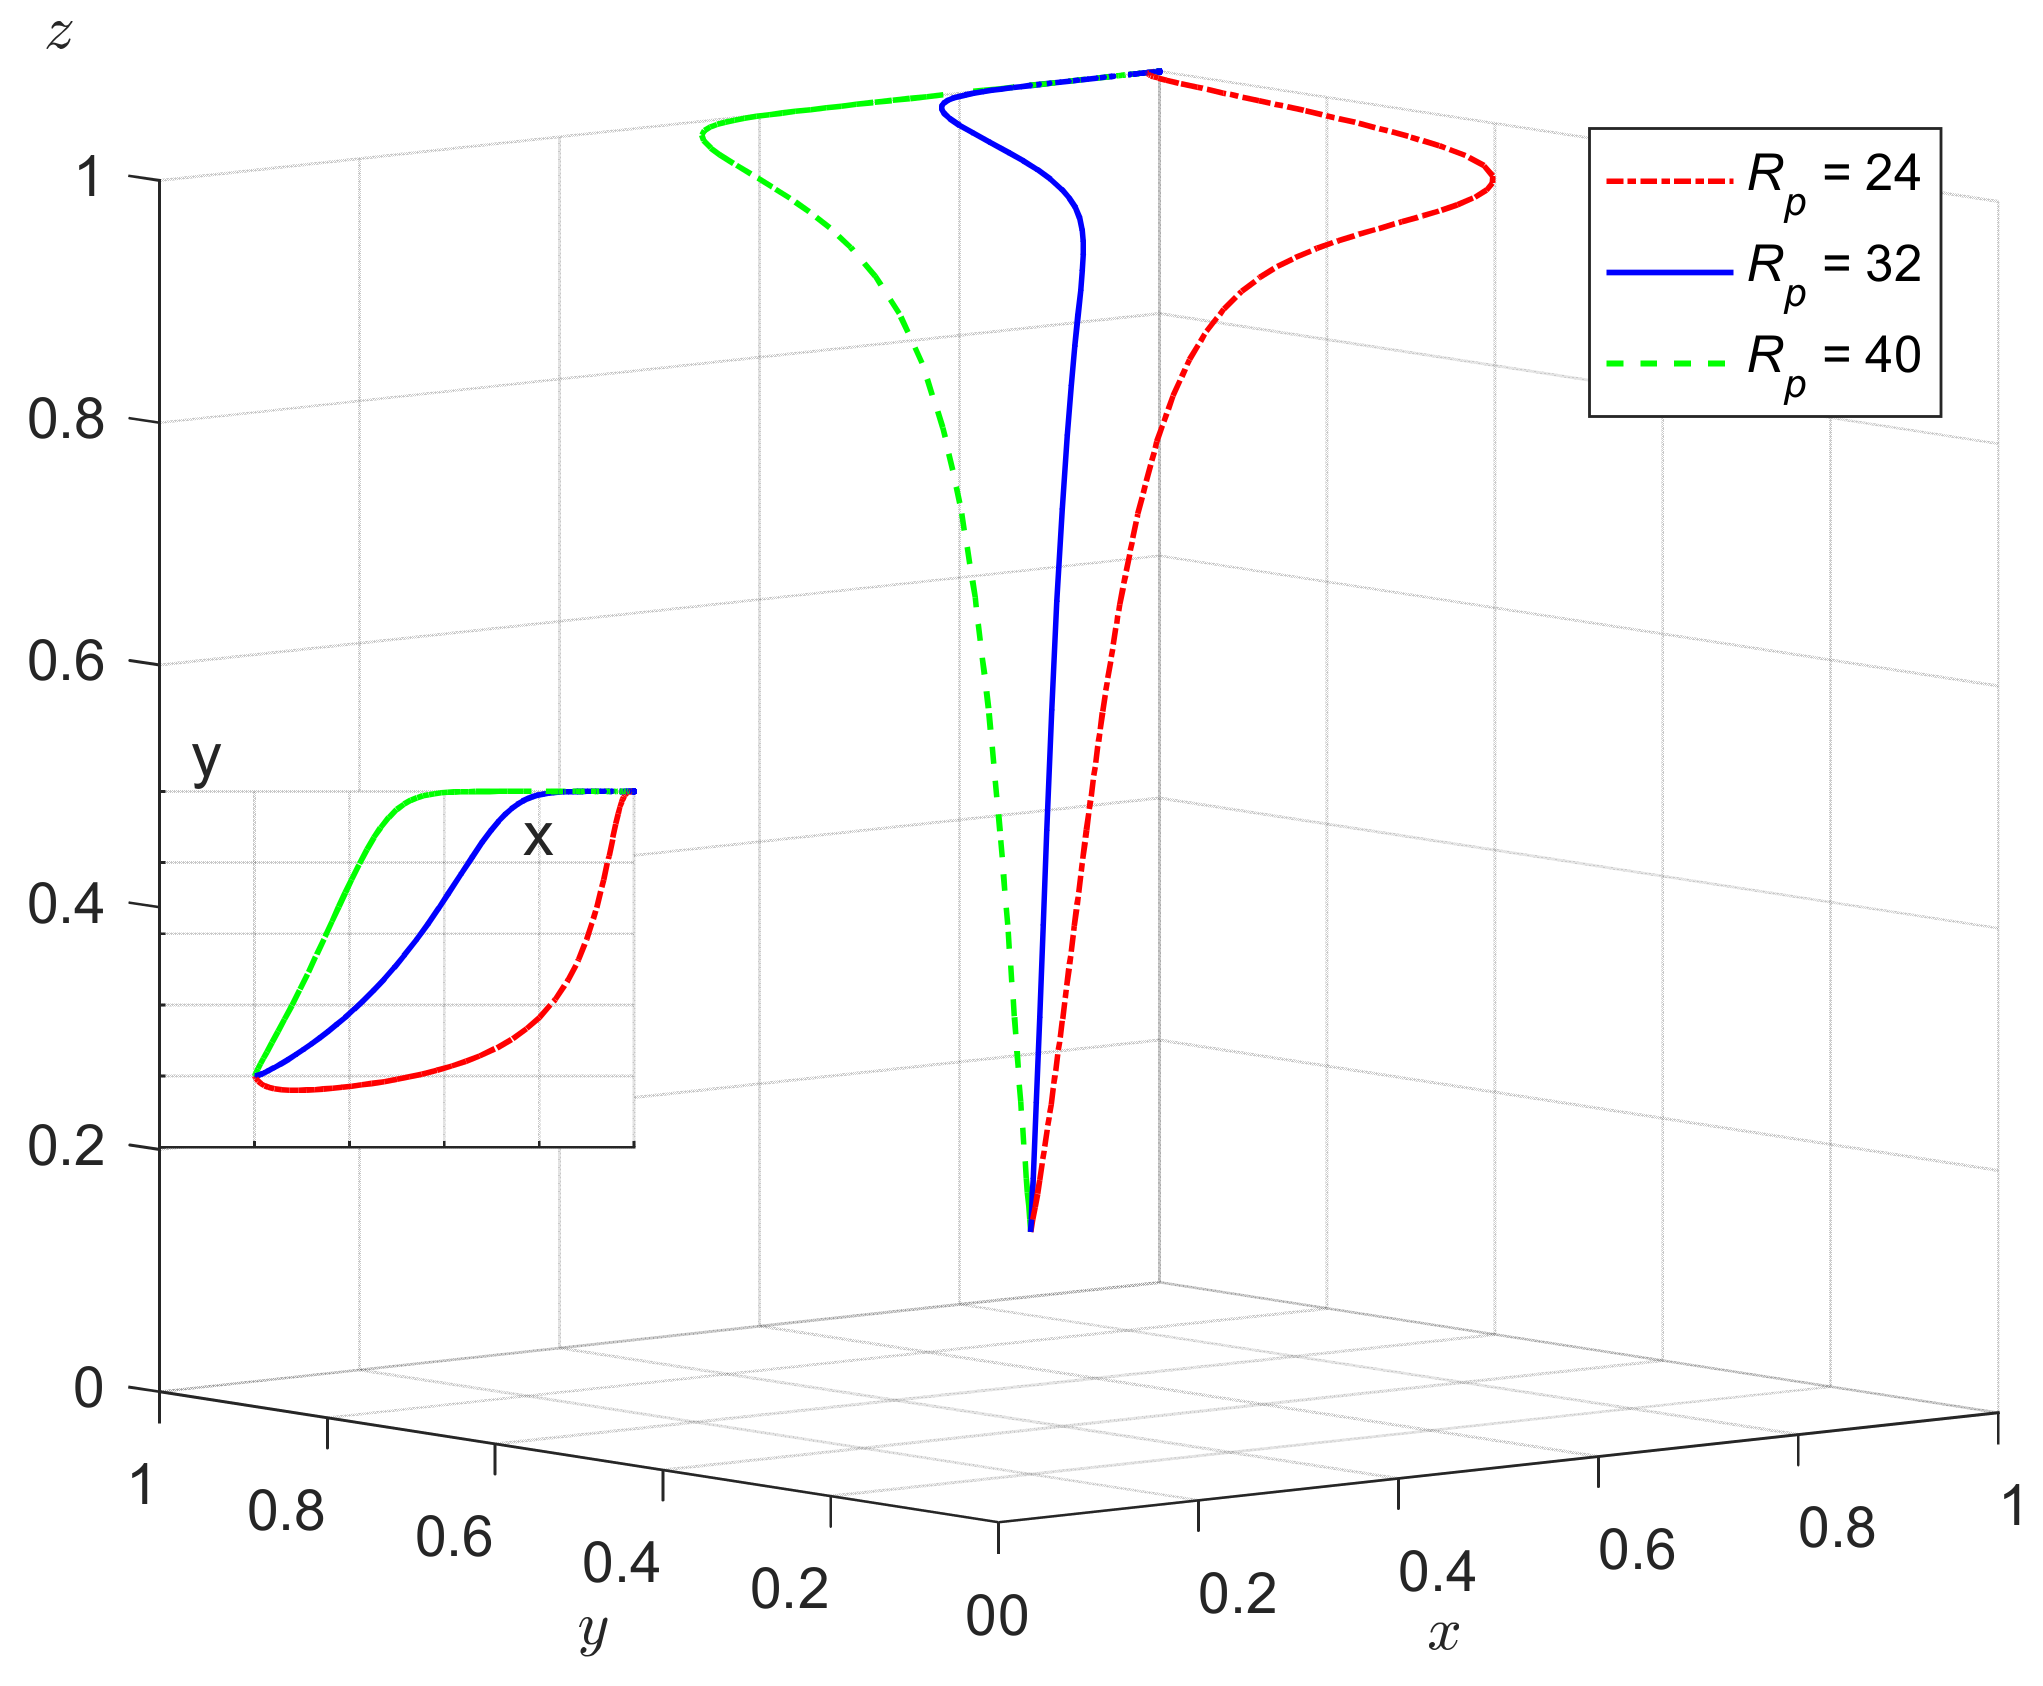
5.2.2. The Impact of Blockchain Traceability Costs
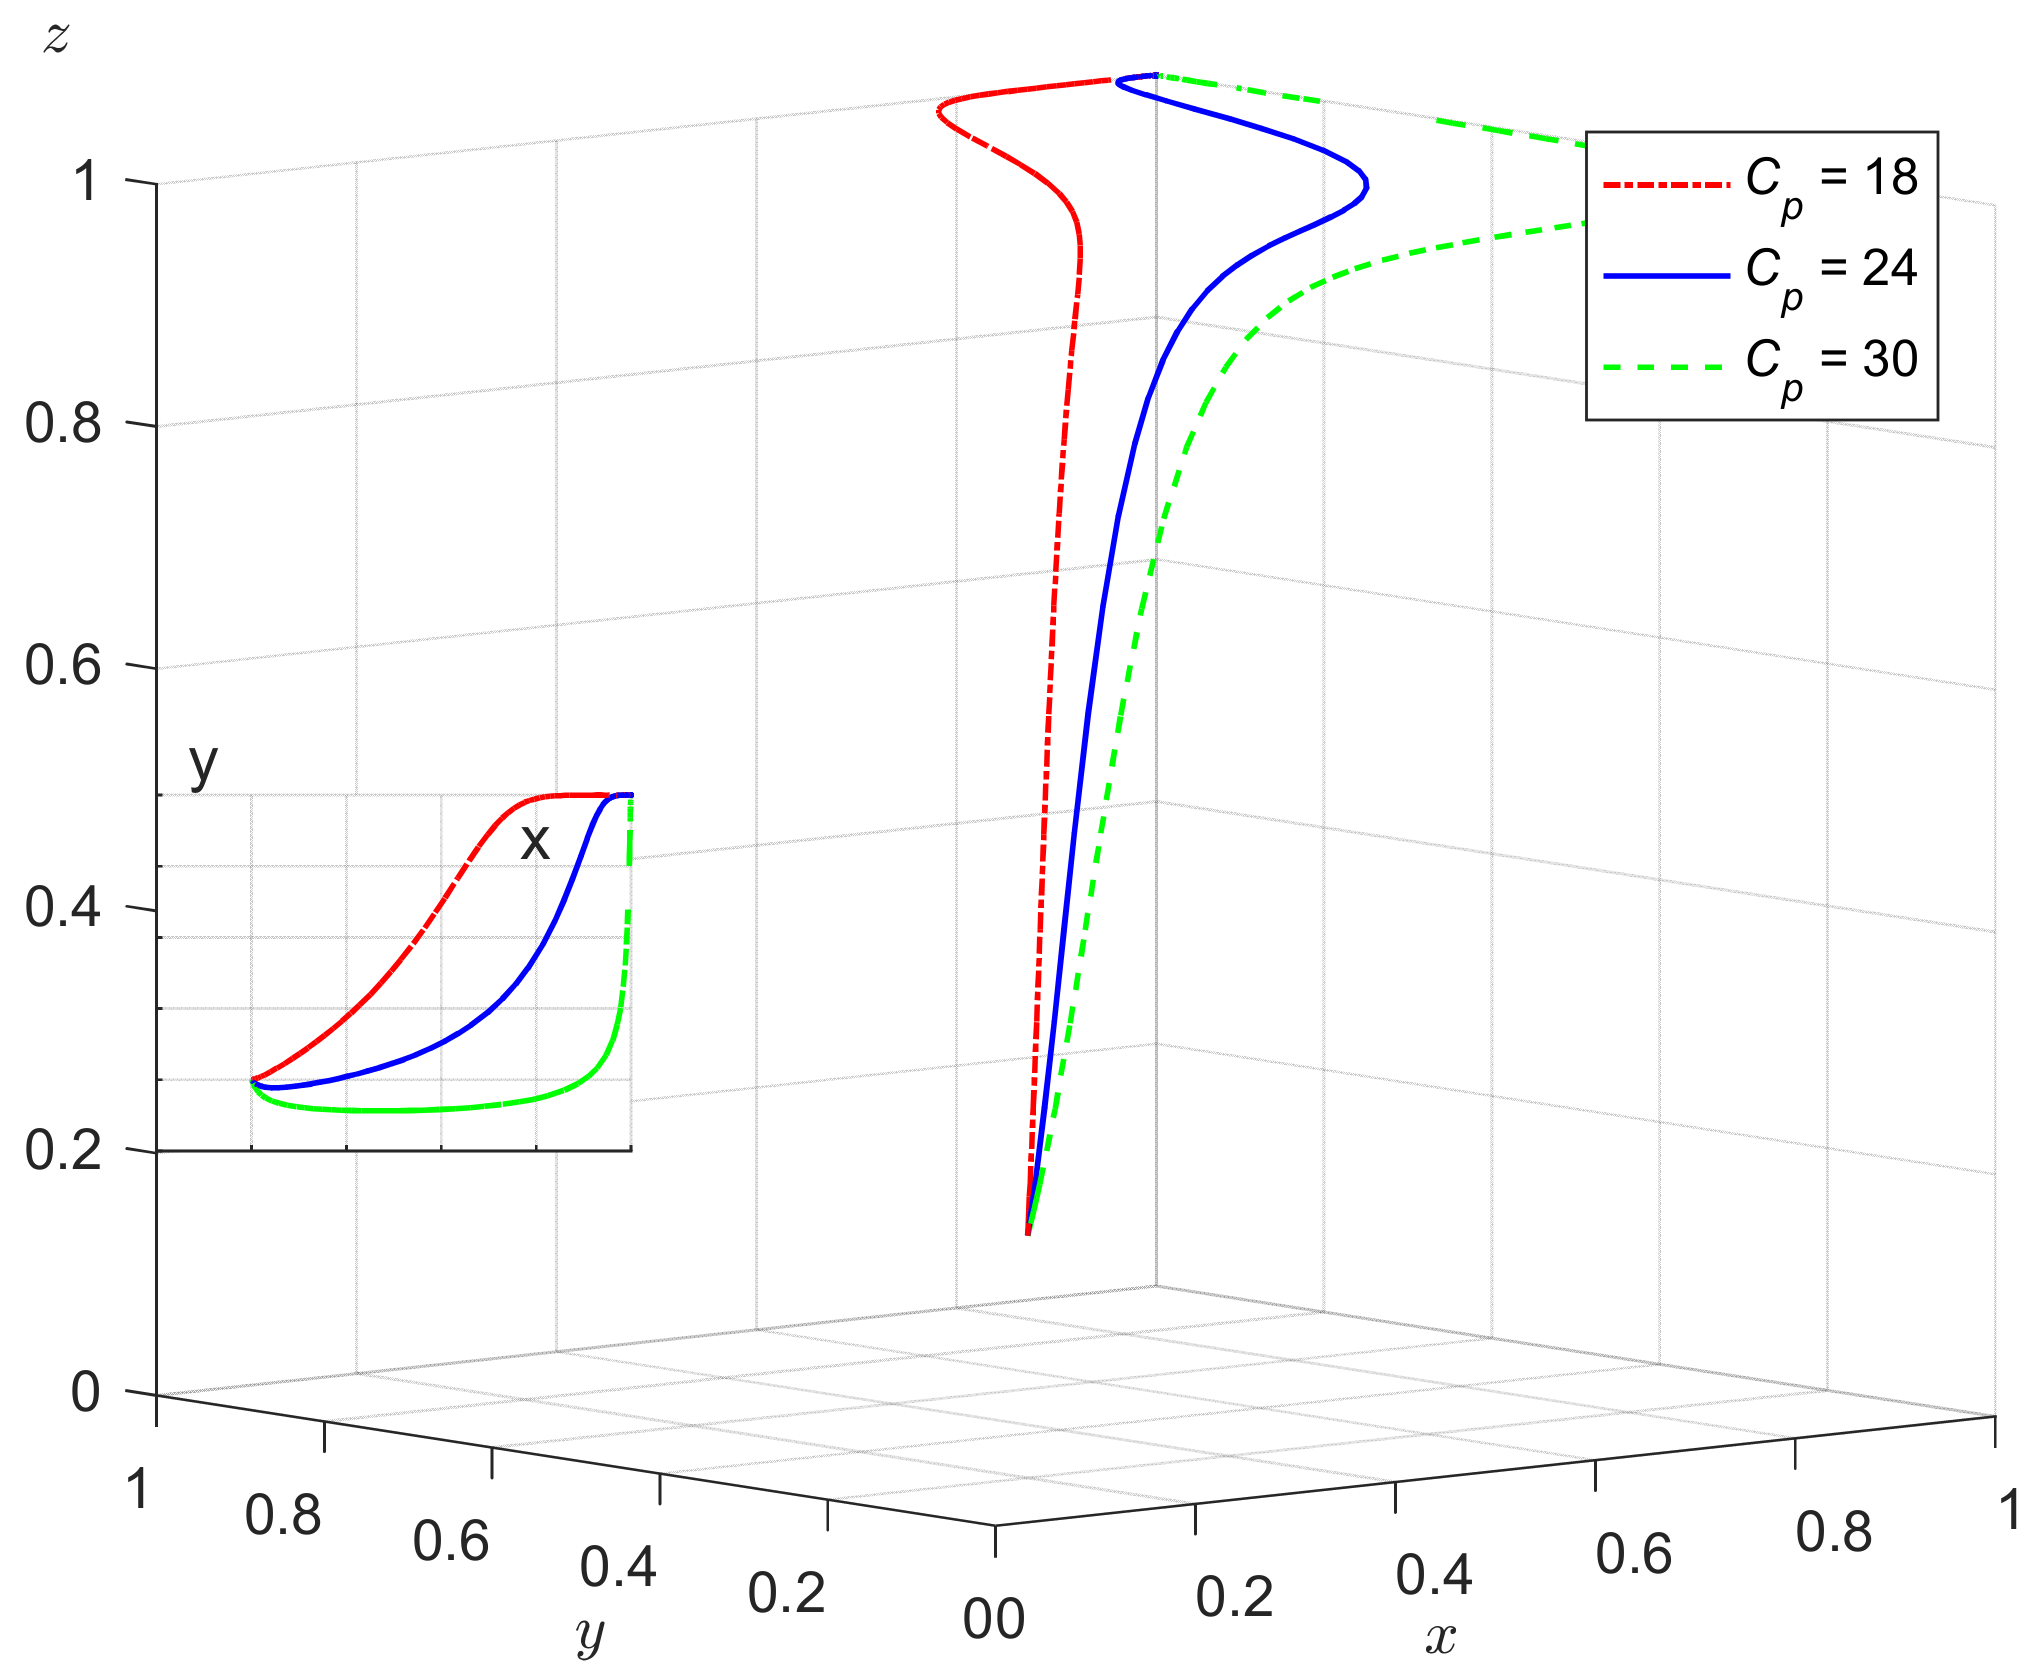
5.2.3. The Impact of Free-Riding Benefits
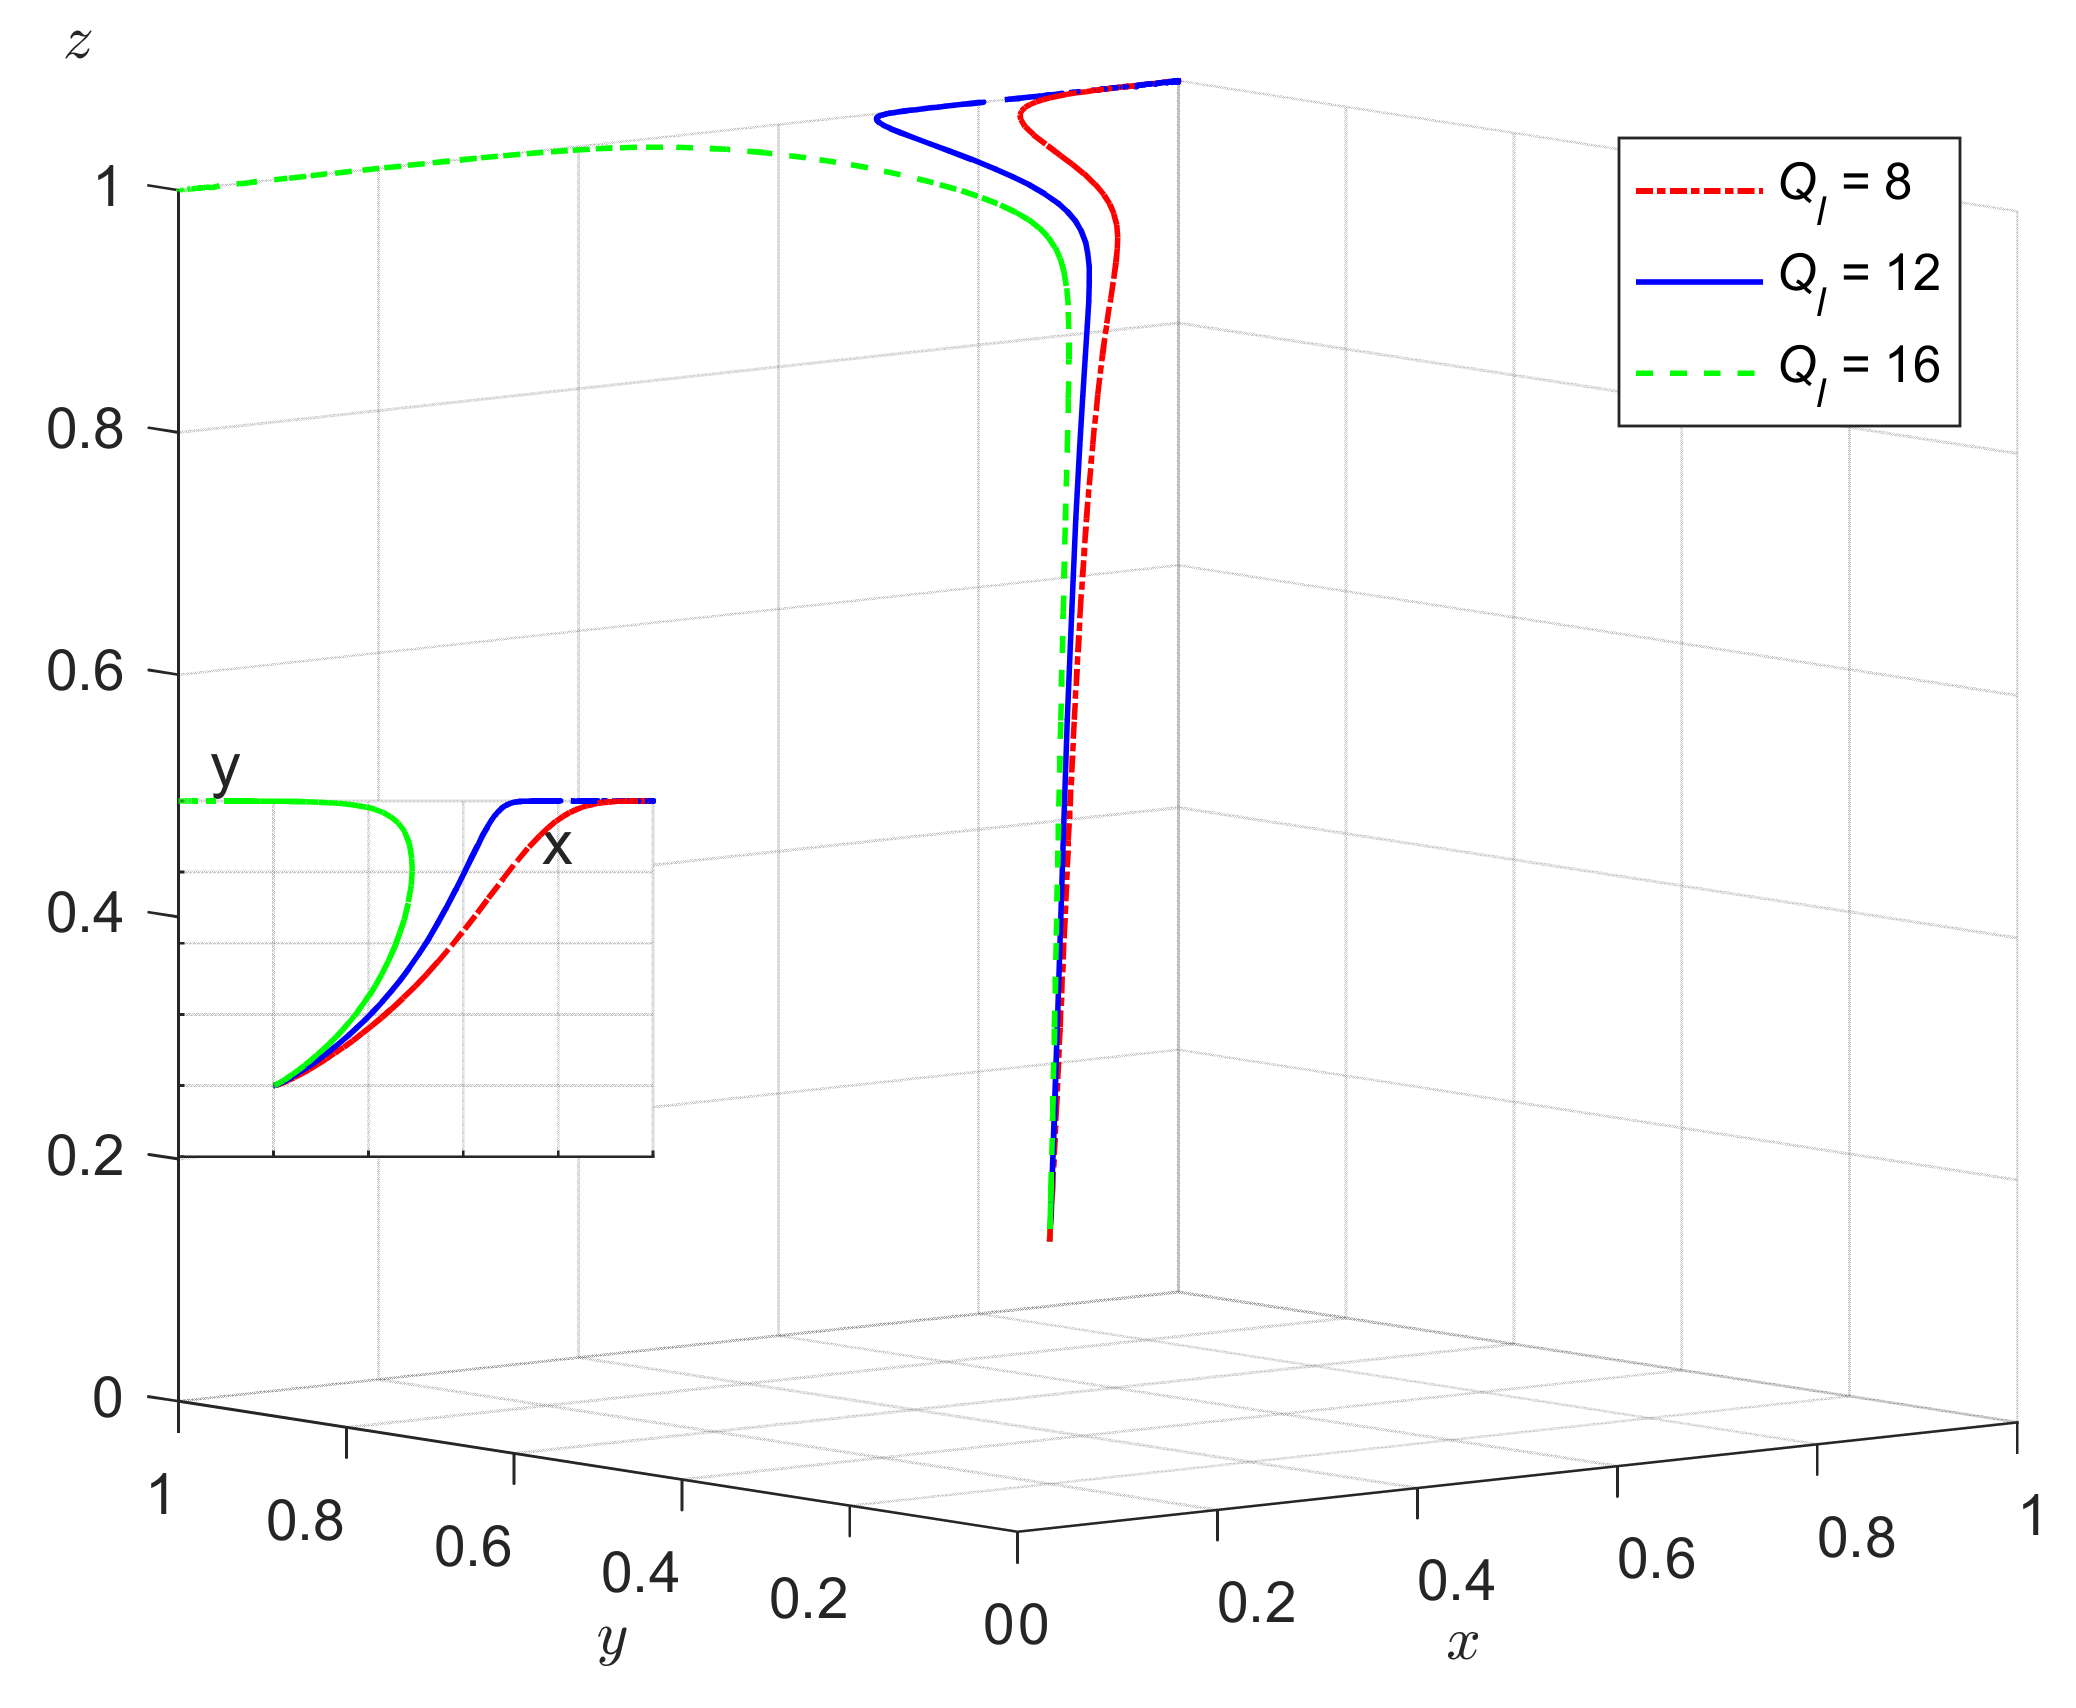
5.2.4. The Impact of Brand Benefits
5.3. The Analysis of the Effectiveness of Subsidies and Penalties
6. Conclusions and Policy Implications
6.1. Conclusions
6.2. Policy Enlightenments
Author Contributions
Funding
Institutional Review Board Statement
Informed Consent Statement
Data Availability Statement
Conflicts of Interest
References
- Xia, A.; Cao, J.; Xu, Y. Carbon emission reduction alliance, green technology, and emission reduction performance: An empirical study based on the synergistic perspective of environment and economy. Environ. Sci. Pollut. Res. 2023, 30, 55864–55883. [Google Scholar] [CrossRef]
- Dong, H.; Liu, Y.; Zhao, Z.; Tan, X.; Managi, S. Carbon neutrality commitment for China: From vision to action. Sustain. Sci. 2022, 17, 1741–1755. [Google Scholar] [CrossRef]
- Zheng, Y.; Xu, Y. Optimizing Green Strategy for Retired Electric Vehicle Battery Recycling: An Evolutionary Game Theory Approach. Sustainability 2023, 15, 15464. [Google Scholar] [CrossRef]
- Dwivedi, A.; Agrawal, D.; Jha, A.; Mathiyazhagan, K. Studying the interactions among Industry 5.0 and circular supply chain: Towards attaining sustainable development. Comput. Ind. Eng. 2023, 176, 108927. [Google Scholar] [CrossRef]
- Ju, Y.; Sugiyama, M.; Kato, E.; Matsuo, Y.; Oshiro, K.; Herran, D.S. Industrial decarbonization under Japan’s national mitigation scenarios: A multi-model analysis. Sustain. Sci. 2021, 16, 411–427. [Google Scholar] [CrossRef]
- Kshetri, N.; Loukoianova, E. Blockchain adoption in supply chain networks in Asia. IT Prof. 2019, 21, 11–15. [Google Scholar] [CrossRef]
- Wang, M.; Asian, S.; Wood, L.C.; Wang, B. Logistics innovation capability and its impacts on the supply chain risks in the Industry 4.0 era. Mod. Supply Chain Res. Appl. 2020, 2, 83–98. [Google Scholar] [CrossRef]
- Fernando, Y.; Rozuar, N.H.M.; Mergeresa, F. The blockchain-enabled technology and carbon performance: Insights from early adopters. Technol. Soc. 2021, 64, 101507. [Google Scholar] [CrossRef]
- Park, A.; Li, H. The effect of blockchain technology on supply chain sustainability performances. Sustainability 2021, 13, 1726. [Google Scholar] [CrossRef]
- Fu, B.; Shu, Z.; Liu, X. Blockchain enhanced emission trading framework in fashion apparel manufacturing industry. Sustainability 2018, 10, 1105. [Google Scholar] [CrossRef]
- Manupati, V.K.; Schoenherr, T.; Ramkumar, M.; Wagner, S.M.; Pabba, S.K.; Inder Raj Singh, R. A blockchain-based approach for a multi-echelon sustainable supply chain. Int. J. Prod. Res. 2020, 58, 2222–2241. [Google Scholar] [CrossRef]
- Available online: https://antdigital.com/docs/11/445028 (accessed on 10 August 2023).
- Ju, C.; Shen, Z.; Bao, F.; Weng, P.; Xu, Y.; Xu, C. A Novel Credible Carbon Footprint Traceability System for Low Carbon Economy Using Blockchain Technology. Int. J. Environ. Res. Public Health 2022, 19, 10316. [Google Scholar] [CrossRef]
- Kampan, K.; Tsusaka, T.W.; Anal, A.K. Adoption of blockchain technology for enhanced traceability of livestock-based products. Sustainability 2022, 14, 13148. [Google Scholar] [CrossRef]
- Wang, M.; Wang, B.; Abareshi, A. Blockchain Technology and Its Role in Enhancing Supply Chain Integration Capability and Reducing Carbon Emission: A Conceptual Framework. Sustainability 2020, 12, 10550. [Google Scholar] [CrossRef]
- Zhu, Q.; Duan, Y.; Sarkis, J. Supply chain carbon transparency to consumers via blockchain: Does the truth hurt? Int. J. Logist. Manag. 2023. ahead-of-print. [Google Scholar] [CrossRef]
- Wang, M.; Wu, J.; Chen, X.; Zhu, X. Grandfathering or benchmarking? The performance of implementing blockchain technology in a low-carbon supply chain. Energy 2023, 284, 128691. [Google Scholar] [CrossRef]
- Lim, M.K.; Li, Y.; Wang, C.; Tseng, M.L. A literature review of blockchain technology applications in supply chains: A comprehensive analysis of themes, methodologies and industries. Comput. Ind. Eng. 2021, 154, 107133. [Google Scholar] [CrossRef]
- Faber, A.; Frenken, K. Models in evolutionary economics and environmental policy: Towards an evolutionary environmental economics. Technol. Forecast. Soc. Change 2009, 76, 462–470. [Google Scholar] [CrossRef]
- Liu, Z.; Qian, Q.; Hu, B.; Shang, W.-L.; Li, L.; Zhao, Y.; Zhao, Z.; Han, C. Government regulation to promote coordinated emission reduction among enterprises in the green supply chain based on evolutionary game analysis. Resour. Conserv. Recycl. 2022, 182, 106290. [Google Scholar] [CrossRef]
- Kayikci, Y.; Subramanian, N.; Dora, M.; Bhatia, M.S. Food supply chain in the era of Industry 4.0: Blockchain technology implementation opportunities and impediments from the perspective of people, process, performance, and technology. Prod. Plan. Control. 2022, 33, 301–321. [Google Scholar] [CrossRef]
- Schütte, J.; Fridgen, G.; Prinz, W.; Rose, T.; Urbach, N.; Hoeren, T.; Guggenberger, C.; Welzel, S.; Holly, A.; Schulte, P.; et al. Blockchain-technologien, forschungsfragen und anwendungen. In Blockchain Positionspapier; Fraunhofer: München, Germany, 2017; pp. 1–39. [Google Scholar]
- Creydt, M.; Fischer, M. Blockchain and more-Algorithm driven food traceability. Food Control 2019, 105, 45–51. [Google Scholar] [CrossRef]
- Kouhizadeh, M.; Saberi, S.; Sarkis, J. Blockchain technology and the sustainable supply chain: Theoretically exploring adoption barriers. Int. J. Prod. Econ. 2021, 231, 107831. [Google Scholar] [CrossRef]
- Lu, Y. The blockchain: State-of-the-art and research challenges. J. Ind. Inf. Integr. 2019, 15, 80–90. [Google Scholar] [CrossRef]
- Chan, K.Y.; Abdullah, J.; Khan, A.S. A framework for traceable and transparent supply chain management for agri-food sector in malaysia using blockchain technology. Int. J. Adv. Comput. Sci. Appl. 2019, 10, 11. [Google Scholar] [CrossRef]
- Dasaklis, T.K.; Voutsinas, T.G.; Tsoulfas, G.T.; Casino, F. A systematic literature review of blockchain-enabled supply chain traceability implementations. Sustainability 2022, 14, 2439. [Google Scholar] [CrossRef]
- Veuger, J.J.F. Trust in a Viable Real Estate Economy with Disruption and Blockchain. Facilities 2018, 36, 103–120. [Google Scholar] [CrossRef]
- Zheng, X.R.; Lu, Y. Blockchain technology–recent research and future trend. Enterp. Inf. Syst. 2022, 16, 1939895. [Google Scholar] [CrossRef]
- Sunny, J.; Undralla, N.; Pillai, V.M. Supply chain transparency through blockchain-based traceability: An overview with demonstration. Comput. Ind. Eng. 2020, 150, 106895. [Google Scholar] [CrossRef]
- Drljevic, N.; Aranda, D.A.; Stantchev, V. Perspectives on risks and standards that affect the requirements engineering of blockchain technology. Comput. Stand. Interfaces 2020, 69, 103409. [Google Scholar] [CrossRef]
- Hyla, T.; Pejaś, J. Long-term verification of signatures based on a blockchain. Comput. Electr. Eng. 2020, 81, 106523. [Google Scholar] [CrossRef]
- Ahmed, W.A.; MacCarthy, B.L. Blockchain-enabled supply chain traceability in the textile and apparel supply chain: A case study of the fiber producer, Lenzing. Sustainability 2021, 13, 10496. [Google Scholar] [CrossRef]
- Casino, F.; Kanakaris, V.; Dasaklis, T.K.; Moschuris, S.; Stachtiaris, S.; Pagoni, M.; Rachaniotis, N.P. Blockchain-based food supply chain traceability: A case study in the dairy sector. Int. J. Prod. Res. 2021, 59, 5758–5770. [Google Scholar] [CrossRef]
- Wang, Z.; Wang, T.; Hu, H.; Gong, J.; Ren, X.; Ao, Q. Blockchain-based framework for improving supply chain traceability and information sharing in precast construction. Autom. Constr. 2020, 111, 103063. [Google Scholar] [CrossRef]
- Zheng, Y.; Xu, Y.; Qiu, Z. Blockchain Traceability Adoption in Agricultural Supply Chain Coordination: An Evolutionary Game Analysis. Agriculture 2023, 13, 184. [Google Scholar] [CrossRef]
- Pandey, D.; Agrawal, M.; Pandey, J.S. Carbon footprint: Current methods of estimation. Environ. Monit. Assess. 2011, 178, 135–160. [Google Scholar] [CrossRef]
- Lee, K.H. Integrating carbon footprint into supply chain management: The case of Hyundai Motor Company (HMC) in the automobile industry. J. Clean. Prod. 2011, 19, 1216–1223. [Google Scholar] [CrossRef]
- Benjaafar, S.; Li, Y.; Daskin, M. Carbon footprint and the management of supply chains: Insights from simple models. IEEE Trans. Autom. Sci. Eng. 2012, 10, 99–116. [Google Scholar] [CrossRef]
- Kanakoudis, V.; Papadopoulou, A. Allocating the cost of the carbon footprint produced along a supply chain, among the stakeholders involved. J. Water Clim. Chang. 2014, 5, 556–568. [Google Scholar] [CrossRef]
- Das, C.; Jharkharia, S. Low carbon supply chain: A state-of-the-art literature review. J. Manuf. Technol. Manag. 2018, 29, 398–428. [Google Scholar] [CrossRef]
- Liu, M.L.; Li, Z.H.; Anwar, S.; Zhang, Y. Supply chain carbon emission reductions and coordination when consumers have a strong preference for low-carbon products. Environ. Sci. Pollut. Res. 2021, 28, 19969–19983. [Google Scholar] [CrossRef] [PubMed]
- Ghosh, P.; Jha, A.; Sharma, R.R.K. Managing carbon footprint for a sustainable supply chain: A systematic literature review. Mod. Supply Chain Res. Appl. 2020, 2, 123–141. [Google Scholar] [CrossRef]
- Centobelli, P.; Cerchione, R.; Del Vecchio, P.; Oropallo, E.; Secundo, G. Blockchain technology for bridging trust, traceability and transparency in circular supply chain. Inf. Manag. 2022, 59, 103508. [Google Scholar] [CrossRef]
- Li, B.K.; Nan, Y.F.; Yao, R.X. Carbon neutrality cognition, environmental value, and consumption preference of low-carbon products. Front. Environ. Sci. 2022, 10, 979783. [Google Scholar] [CrossRef]
- Tang, C.S.; Veelenturf, L.P. The strategic role of logistics in the industry 4.0 era. Transp. Res. Part E Logist. Transp. Rev. 2019, 129, 1–11. [Google Scholar] [CrossRef]
- Li, Z.; Xu, X.; Bai, Q.; Chen, C.; Wang, H.; Xia, P. Implications of information sharing on blockchain adoption in reducing carbon emissions: A mean–variance analysis. Transp. Res. Part E Logist. Transp. Rev. 2023, 178, 103254. [Google Scholar] [CrossRef]
- Liu, K.H.; Chang, S.F.; Huang, W.H.; Lu, I.C. The framework of the integration of carbon footprint and blockchain: Using blockchain as a carbon emission management tool: Eco design of products and services. In Technologies and Eco-Innovation towards Sustainability; Springer: Berlin/Heidelberg, Germany, 2019; Volume I, pp. 15–22. [Google Scholar]
- Koh, S.L.; Genovese, A.; Acquaye, A.A.; Barratt, P.; Rana, N.; Kuylenstierna, J.; Gibbs, D. Decarbonising product supply chains: Design and development of an integrated evidence-based decision support system–the supply chain environmental analysis tool (SCEnAT). Int. J. Prod. Res. 2013, 51, 2092–2109. [Google Scholar] [CrossRef]
- Shakhbulatov, D.; Arora, A.; Dong, Z.; Rojas-Cessa, R. Blockchain implementation for analysis of carbon footprint across food supply chain. In Proceedings of the 2019 IEEE International Conference on Blockchain 2019 (Blockchain), Atlanta, GA, USA, 14–17 July 2019; pp. 546–551. [Google Scholar]
- Woo, J.; Fatima, R.; Kibert, C.J.; Newman, R.E.; Tian, Y.; Srinivasan, R.S. Applying blockchain technology for building energy performance measurement, reporting, and verification (MRV) and the carbon credit market: A review of the literature. Build. Environ. 2021, 205, 108199. [Google Scholar] [CrossRef]
- Yuan, M.; Li, Z.; Li, X.; Li, L.; Zhang, S.; Luo, X. How to promote the sustainable development of prefabricated residential buildings in China: A tripartite evolutionary game analysis. J. Clean. Prod. 2022, 349, 131423. [Google Scholar] [CrossRef]
- Wang, S.; Xu, Y. Complex Network-Based Evolutionary Game for Knowledge Transfer of Social E-Commerce Platform Enterprise’s Operation Team under Strategy Imitation Preferences. Sustainability 2022, 14, 15383. [Google Scholar] [CrossRef]
- Xin, Y.; Xu, Y.; Zheng, Y. A Study on Green Agricultural Production Decision-Making by Agricultural Cooperatives under Government Subsidies. Sustainability 2024, 16, 1219. [Google Scholar] [CrossRef]
- Husain, S.O.; Franklin, A.; Roep, D. The political imaginaries of blockchain projects: Discerning the expressions of an emerging ecosystem. Sustain. Sci. 2020, 15, 379–394. [Google Scholar] [CrossRef]
- Zhou, Y.; Bao, M.; Chen, X.; Xu, X. Co-op advertising and emission reduction cost sharing contracts and coordination in low-carbon supply chain based on fairness concerns. J. Clean. Prod. 2016, 133, 402–413. [Google Scholar] [CrossRef]
- Fan, Z.P.; Wu, X.Y.; Cao, B.B. Considering the traceability awareness of consumers: Should the supply chain adopt the blockchain technology? Ann. Oper. Res. 2022, 309, 837–860. [Google Scholar] [CrossRef]
- Chen, W.; Hu, Z.H. Using evolutionary game theory to study governments and manufacturers’ behavioral strategies under various carbon taxes and subsidies. J. Clean. Prod. 2018, 201, 123–141. [Google Scholar] [CrossRef]
- Wei, J.; Wang, C. Improving interaction mechanism of carbon reduction technology innovation between supply chain enterprises and government by means of differential game. J. Clean. Prod. 2021, 296, 126578. [Google Scholar] [CrossRef]
- Rattle, I.; Gailani, A.; Taylor, P.G. Decarbonisation strategies in industry: Going beyond clusters. Sustain. Sci. 2023, 19, 105–123. [Google Scholar] [CrossRef]


| Authors | Fields | Highlights | Effect |
|---|---|---|---|
| (Ahmed and MacCarthy, 2021) [33] | Textile and Apparel | Clarified the objectives of the traceability program and properly defined the scope of the traceability solution. | Enriched the discussion on key supply chain traceability considerations and the scope of product identification throughout the supply chain. |
| (Casino and Kanakaris, 2021). [34] | Dairy Sector | Developed and tested a distributed, trusted, and secure architecture for the FSC traceability system. | Demonstrated the applicability and overall benefits of the model through the development of fully functional smart contracts and a local private blockchain. |
| (Wang and Wang, 2020) [35] | Precast Construction | Established a novel blockchain traceability information management framework. | Solved the problems of automated information sharing, traceability, and visibility in a precast supply chain. |
| (Zheng and Xu, 2023) [36] | Farm Commodities | Examined the decision-making process for blockchain adoption traceability in agriculture. | Analyzed the key factors for implementing a blockchain-enabled agricultural product traceability system and made policy recommendations. |
| Parameters | Descriptions | Notes |
|---|---|---|
| Benefits of the PMs and the PSs when choosing the traceability strategy | ||
| Benefits of the PMs and the PSs when not choosing the traceability strategy | ||
| Cost of choosing the traceability strategy for the PMs and the PSs | ||
| Free-riding benefits of the PMs the PSs not choosing the traceability strategy while the PSs adopting | ||
| Subsidies of the PMs from the PSs for choosing the traceability strategy | ||
| Penalties of the PMs from the PSs for not choosing the traceability strategy | ||
| Additional brand value of the PMs choosing the traceability strategy when the LGs strictly regulate | ||
| Subsidies of the PSs from the LGs for choosing the traceability strategy | ||
| Penalties of the PSs from the LGs for not choosing the traceability strategy | ||
| Utilities of the LGs when the PSs adopt the strict regulation strategy | ||
| Utilities of the LGs when the PSs adopt the passive regulation strategy | ||
| Cost of the LGs when strictly regulating | ||
| Additional benefit of the LGs when strictly regulating | ||
| negative benefits of the LGsWhen negative regulation causes the PMs and the PSs to not choose the traceability strategy |
| The LGs Choose the Strict Regulation Strategy | |||
|---|---|---|---|
| PSs | traceability | not traceability | |
| PMs | |||
| traceability | ) | ||
| not traceability | |||
| The LGs choose the passive regulation strategy | |||
| PSs | traceability | not traceability | |
| PMs | |||
| traceability | |||
| not traceability | |||
| Eigenvalues | Eigenvalues | ||
|---|---|---|---|
| Equilibrium Points | Stability Conditions | Scenario |
|---|---|---|
| ; ; | 1 | |
| ; ; | 2 | |
| ; ; | 3 | |
| ; ; | 4 |
| Scenario 1 | 10 | 25 | 15 | 10 | 10 | 8 | 32 | 28 | 20 | 15 | 5 | 12 | 20 | 10 | 10 | 5 |
| Scenario 2 | 15 | 20 | 12 | 20 | 16 | 4 | 32 | 24 | 25 | 10 | 10 | 5 | 20 | 10 | 10 | 5 |
| Scenario 3 | 10 | 15 | 15 | 8 | 20 | 18 | 30 | 28 | 20 | 15 | 10 | 8 | 20 | 10 | 10 | 5 |
| Scenario 4 | 20 | 15 | 15 | 10 | 10 | 10 | 28 | 20 | 18 | 18 | 5 | 10 | 20 | 10 | 10 | 5 |
Disclaimer/Publisher’s Note: The statements, opinions and data contained in all publications are solely those of the individual author(s) and contributor(s) and not of MDPI and/or the editor(s). MDPI and/or the editor(s) disclaim responsibility for any injury to people or property resulting from any ideas, methods, instructions or products referred to in the content. |
© 2024 by the authors. Licensee MDPI, Basel, Switzerland. This article is an open access article distributed under the terms and conditions of the Creative Commons Attribution (CC BY) license (https://creativecommons.org/licenses/by/4.0/).
Share and Cite
Zhang, C.; Xu, Y.; Zheng, Y. Blockchain Traceability Adoption in Low-Carbon Supply Chains: An Evolutionary Game Analysis. Sustainability 2024, 16, 1817. https://doi.org/10.3390/su16051817
Zhang C, Xu Y, Zheng Y. Blockchain Traceability Adoption in Low-Carbon Supply Chains: An Evolutionary Game Analysis. Sustainability. 2024; 16(5):1817. https://doi.org/10.3390/su16051817
Chicago/Turabian StyleZhang, Chen, Yaoqun Xu, and Yi Zheng. 2024. "Blockchain Traceability Adoption in Low-Carbon Supply Chains: An Evolutionary Game Analysis" Sustainability 16, no. 5: 1817. https://doi.org/10.3390/su16051817