1. Introduction
Brazil is one of the major agricultural players in the world, aiming to become one of the most important food suppliers globally in the long term [
1]. Brazil’s competitive advantages rely on its agriculture, which is adapted to tropical regions with remarkable productivity, as well as increased profitability per cultivation area. The country also has an increasingly qualified workforce, operations technology, and well-established agricultural procedures [
2].
These factors have resulted in a dynamic national agribusiness that is connected to various segments of the agro-industrial production chain, as well as production with lower relative costs compared to global competitors, which has increased Brazil’s market share [
3]. Brazil is the fourth largest exporter of agricultural products in the world, and is only behind the entire European Union, the United States, and China [
4]. The main exported products are soybeans, coffee, orange juice, sugar, chicken meat, and beef [
5]. Regarding the Gross Production Value (GPV), which corresponds to the revenue within national agricultural establishments, the products with the highest GPV in 2021 were soybeans, beef, corn, milk, and chicken [
4]. In relation to job creation, the 2022 National Household Sample Survey pointed out that more than 20% of the Brazilian employed population works in the agricultural sector, corresponding to almost 20 million workers [
6].
Currently, one of the main challenges of this sector is aligning the increased agricultural productivity with the use of water and energy resources [
7,
8]. That is due to competition for water resources, rising energy costs, and increasing water scarcity [
9,
10]. This shortage is increased by climate change and deforestation, and in response to such challenges, sector agents are seeking improvements to optimize the efficiency of using these inputs through irrigated agriculture [
11,
12].
Irrigated crops are production models that are designed to produce sustainable food in irrigated areas, i.e., using water and energy efficiently [
13]. Its efficiency also involves selecting the most suitable irrigation method and establishing criteria for determining each crop’s water needs. After establishing adequate irrigation management, in addition to saving water and energy, greater agricultural productivity has been achieved [
14,
15,
16].
Although the potential of Brazilian irrigated agriculture is widely agreed on, several challenges still need to be overcome [
8,
9,
10,
13,
16,
17]. Achieving socioeconomic sustainability stands out as one of the major challenges, since it involves economic, financial, and administrative practices. These practices aim to promote rural economic development and social responsibility while preserving the environment for future generations, combining technical and financial practices and considering not only profit but the effects on the environment and communities [
18].
In this sense, irrigated agriculture should not be seen only as a matter of engineering but also as an activity with a relevant social role, which can be considered another challenge. Such practices should be evaluated within technical, economic, environmental, and social criteria according to their distinct production scales [
19,
20]. On the one hand, there are large vertical enterprises operating in raw material production, industrialization, and trading, with mechanized labor, a high operational performance, and exploiting extensive territorial areas. On the other hand, there are numerous small and medium-sized producers located in smaller areas, with their market niche being characterized by a reduced production scale and less technological input [
21,
22]. However, these producers still play a pivotal role in supplying local agricultural markers, e.g., CEASA (in Portuguese), which are large supplier centers that are dedicated to receiving and organizing the marketing of agricultural products at a wholesale level for a given region.
Considering the high competition and dynamism of the national agricultural sector, smaller-scale producers need to be increasingly prepared to meet sustainable business criteria in the long term. One of the leading tools for improving project management is financial planning, which comprises the financial management of an enterprise based on its objectives for the long term [
23,
24]. Through planning combined with feasibility studies and risk management, it is possible to assist decision makers in steering future scenarios and visualize the enterprise’s success/failure, as well as understanding whether it aligns with the agricultural market. By anticipating these scenarios, rural producers can achieve optimized business management and capacity to reflect positively on future outcomes [
25].
However, it is noteworthy that many rural producers do not formulate or plan their projects and do not perform long-term financial planning, which limits their understanding of future scenarios relating to the business. Generally, rural producers only carry out their implementation and follow their operational status based on prior knowledge derived from family tradition and sociocultural factors [
26,
27].
Several studies in the literature have carried out economic feasibility studies on smaller-scale irrigated agricultural systems [
9,
12,
14,
15,
20,
28,
29]. Most of them use traditional and deterministic economic methods to evaluate crops’ viability. Nevertheless, there is still a research gap regarding the use of financial tools in rural areas. Some works also indicate that small-scale crops have financial barriers that can delay their progress. One of the main challenges is their reduced financial management, considered a critical factor of success. Some other barriers that are usually found are the decision making process being motivated by cultural factors; reduced knowledge of financial instruments; and an inadequate capital structure.
The current study aims to fill this gap by improving the knowledge on financial tools, aiming to assess socioeconomic sustainability in agricultural production systems. To this end, a financial planning tool was implemented for smaller-scale irrigated crops through the development of a simplified financial model. The analysis was conducted based on agricultural projects in the Bom Sucesso/Santa Cruz Settlement, located in the Tocantins-Araguaia Hydrographic Basin in the Central-West Region of Brazil.
This region is recognized for its agricultural occupation and for its high dependence on irrigation, which justifies studies, interventions, and also public policies aiming to improve the rural development of this and other areas.
This paper is organized as follows:
Section 2 presents the data collection and the methodology for developing the financial planning tool;
Section 3 presents the results; and
Section 4 discusses the results, followed by the Conclusions in
Section 5.
2. Materials and Methods
The current study utilized a combination of descriptive research with a quali–quantitative approach, following the methodological structure presented in
Figure 1.
2.1. Data Collection
This work relies on primary and secondary data. Primary data were gathered through interviews and online questionnaires with local producers in the Bom Sucesso/Santa Cruz Settlement, totaling 25 people who were directly involved in irrigated production. Although not a very large sample of producers were able to respond to the interviews/queries, they were selected due to their representation in terms of quantity and quality of technical and financial information, and also for reasons of schooling and willingness to talk. The interviews were based on three axes of questions: (i) productive aspects; (ii) technical aspects about irrigation; and (iii) financial aspects of production and irrigation.
Secondary data, such as sectorial and market information, were collected from specialized Brazilian agricultural websites (such as CNA, IBGE, CEASA) and from a literature review. Data sources were mostly primary, and the collection period was between January 2022 and July 2023.
2.2. Site Characterization
The study area is the Bom Sucesso/Santa Cruz Settlement, located in Flores de Goiás municipality in Goiás state, Central-West Region of Brazil, at coordinates 14°26′18″ S of latitude and 47°2′55″ W of longitude. The area is part of the Tocantins-Araguaia hydrographic basin, the largest basin belonging exclusively to Brazil, and encompasses 178 municipalities in the Central-West Region.
The Settlement, established on 23 August 2000, shelters 84 families in its 2605 hectares (~31 ha/family). Agriculture is the economic force playing the main role in the Settlement, with passion fruit, cashew, mango, and vegetable crops, e.g., okra, as the main crops. The areas with irrigated agriculture are incipient, with the Paranã River as its main water body. The Settlement also has small areas of eucalyptus plantation for firewood, fences, and other uses.
Regarding its edaphoclimatic characteristics, the study area has a semi-humid tropical climate with rainy summers and dry winters, an average annual temperature of 20 °C, and an average annual precipitation of 1000–1300 mm. The predominant soil class is Gleisols, and vegetation is predominantly natural, typical Brazilian Cerrado, with areas of pasture and agriculture [
30].
2.3. Financial Planning Tool
The financial planning tool was evaluated in the economic study of the production of 1 hectare of okra. Okra cultivation is the main agricultural activity in the Bom Sucesso/Santa Cruz Settlement. Two small-scale irrigated production models that are used in the Settlement, and which are considered common in Brazil and developing countries, were compared based on the following characterization:
Production system with furrow irrigation (PS-furrow): Okra cultivation with non-automated furrow irrigation, where water is pumped from a nearby river into canals using an electric pump, and where it is taken to the cultivation area by animal traction, being slowly thrown into the furrows. This model is called “water rolling” by producers [
31] and is currently performed by settlers located in productive areas close to the Paranã River, combining manual, animal, and electrical pumping activities.
Production system with drip irrigation (PS-drip): Okra cultivation with an automated drip irrigation system. The irrigation equipment has an electric pump, 10 thousand meters of drip hose, 100 dripping records, 100 inserted connections between the water meter and the pipeline, as well as 17 PVC pipes (50 mm). According to interviewees, this model is followed by producers located in areas farther from the river.
The okra production cycle reported by producers comprises the stages of soil preparation, area clearing, liming, plowing, harrowing, furrowing, fertilization, sowing, herbicide application, and post-planting amendments of crop cover. All operations last approximately 30 days, and irrigation is carried out with a daily watering shift. Once okra seedlings reach 45 days and the fruit is already soft, harvesting takes place. Harvesting selection and transportation are carried out manually, lasting around 90 days. The entire cycle lasts around 130 and 140 days, leading to 2.5 annual production cycles [
32].
2.3.1. Financial Planning
Both primary and secondary data were analyzed and classified into financial and technical information and, therefore, arranged in a financial planning model developed in Excel
®. The model “financial planning tool” was developed based on the structures proposed in financial management manuals [
33,
34], with inputs and outputs (
Figure 2) combining cash flow budgeting, economic–financial feasibility analysis, risk analysis, and adjustments to the reality of smaller-scale rural producers.
2.3.2. Economic–Financial Analysis
This analysis aimed to determine the economic viability of the production systems by using the following indicators as outputs: Net Present Value (NPV), Modified Internal Rate of Return (MIRR), Cost–Benefit Index (CBI), investment return time (Discounted Payback), and Average Cost of Production (ACP).
To calculate the indicators, the cash flow of each production system was projected in the financial planning tool. The cash flow is the sum of financial inflows (positive values) and outflows (negative values) over 10 years of the investment’s life, corresponding to the investment depreciation period. All values were in Brazilian Reais (BRL) and were converted into the average USD of the period in the proportion of BRL 5.00 to USD 1.00.
The financial inputs are related to production and, consequently, the estimated revenue. Revenue calculation was made based on the average productivity data, which were the same for both production systems, i.e., 480 boxes of okra harvested per cycle multiplied by 18 kg of okra per box. From that amount, 3% of losses were deducted due to handling and transportation, totaling 8381 kg of okra sold per cycle. To estimate the annual production, this value was multiplied by 2.5 annual cycles [
32]. The average selling price for the entire period was USD 10.00/box (USD 0.56/kg), i.e., the historical average value gathered from the interviews. Therefore, the estimated annual revenue corresponds to the annual production discounted from losses and multiplied by the average sale price.
The financial costs were the inputs related to initial investments, production costs, and sales, as well as general and administrative expenses (
Table 1).
After cash flow projections, the financial performance of each production system was measured using viability indicators. To this end, the conventional capital investment analysis technique called discounted cash flow (DCF) was applied to estimate each production system’s return, discounted at a rate that reflects the investment risks. The indicators based on several references are described below [
34,
35,
36,
37].
- a.
Net Present Value (NPV)
NPV is a financial formula used to determine the present value of the sum of future cash flows, discounted at a given interest rate (i). The production system will be economically feasible if its NPV is positive. The higher the NPV is, the more economically attractive the project will be. On the other hand, once the NPV is negative, the project becomes economically unfeasible. The interest rate (i) was determined as 10% p.a., which is above the average interest rate for rural credit (8% p.a.) [
38]. The NPV equation is expressed by
where i = interest rate; R
j = revenues at the end of the year j; C
j = costs at the end of the year j; and e, n = project duration in years, expected to be 10 years
- b.
Modified Internal Rate of Return (MIRR)
IRR is the rate that leads to an NPV of zero. MIRR is a derivation of IRR, aiming to correct its limitations by assuming that positive cash flows are reinvested at the capital cost, and the initial investments are financed at the project’s financing cost rather than at the IRR itself [
39]. The production system will be economically viable if the MIRR is greater than the interest rate (i), established as the minimum attractive rate (MAR), i.e., MIRR > MAR = 10% p.a. The MIRR equation is expressed by
where r = reinvestment rate that is equivalent to interest rate i, set at 10% p.a.; f = financing rate set at 8% p.a.; n = project duration in years, expected to be 10 years; l = revenue discount period; and k = cost discount period
- c.
Cost–Benefit Index (CBI)
CBI indicates the return on invested capital. CBI is acquired by dividing the NPV of projected revenues by the project costs’ NPV. If the result of this division is greater than 1.00, the investor receives a return on the invested capital; if the CBI is less than 1.00, the investor does not receive a return.
- d.
Discounted Payback
The Discounted Payback is used to determine how long an investment reimbursement takes. It is calculated by accumulating the inflows and outflows of the discounted cash flow up to the period in which the negative values become to positive ones.
- e.
Other indicators
The Average Cost of Production (ACP) was calculated by dividing the total estimated cost for the project and updated to the present value by the equivalent estimated total production.
It was also possible to calculate the minimum viable sale price in order to verify the minimum price that still maintains a viable production system, i.e., with NPV > USD 0.00 in a pessimistic scenario. The analysis was carried out in Excel, using the Hypothesis Test/Achieve Goal tool with NPV = USD 0.01.
2.3.3. Risk Analyses
After obtaining the outputs of the economic–financial analysis, the risk analyses were integrated in the financial planning tool through the following techniques: (i) sensitivity analysis; (ii) tornado plot; and (iii) Monte Carlo simulation.
The sensitivity analysis (i) was performed to verify how the return of production systems, expressed by their NPV, is affected by changes in critical variables, such as okra’s production and sale price. More pessimistic and optimistic scenarios were also modeled to evaluate the NPV’s impact under different production and market conditions.
The tornado plot (ii) assessed the NPV sensitivity to 20% increases and decreases in several significant variables. That resulted in a graphical arrangement of the variables that most impacted the return of each project, ordered from the most influential to the least influential. Both analyses (i) and (ii) were performed in Excel using the Hypothesis Test/Data Table tool, already integrated into the financial planning tool.
Monte Carlo simulation (iii) applied probabilistic distributions in various cash flow components in a mathematical model. The simulations were repeated 10,000 times (iterations) to obtain the NPV probability distributions of each production system, as well as the probability of reaching NPV > USD 0.00, i.e., the project’s success/failure probability. A Macro was developed in Excel for such simulations.
Table 2 indicates the selected variables for the simulation, their probability distributions, and the simulated values.
3. Results
3.1. Economic–Financial Analysis
Figure 3 compares the financial projections of the irrigated production systems relative to the annual and the cumulative free cash flows for the investment life cycle (10 years).
Even achieving the same okra productivity, the production systems presented different annual free cash flows. PS-drip had lower annual free cash flow values, a disparity that is mainly due to (i) its higher expenses arising from investments in the irrigation system, including higher annual maintenance expenses and (ii) higher irrigation costs (water and energy).
Therefore, PS-furrow resulted in an enhanced cash flow, even though its irrigation system is considered simple and non-automated. When delving deeper into the technical field, it is noteworthy that PS-furrow takes place close to a river, which plays a role in terms of costs.
Regarding the cumulative FCF, both systems had negative values in year zero, the year of investments, and year one, which was the start of okra production. However, PS-furrow reached a positive cumulative cash flow in year two, while PS-drip accumulated a positive balance only after five years. That is led by the lower initial investment for installing the PS-furrow compared to the other system, corroborating previous findings [
40,
41,
42,
43,
44].
The results indicate that PS-furrow from year two onwards provides sufficient revenue from the sale of okra to cover all annual investments, planting and harvesting costs, and expenses, thus generating a positive cash balance for the first time. PS-drip takes longer to reach such a pattern. By analyzing the cumulative cash flow, both production systems achieved cash sustainability after the reimbursement of the investment without losses in the following years, thus improving the enterprise’s cash management.
This analysis also involves the Discounted Payback indicator, which is presented in
Table 3 together with other economic viability indicators.
Table 3 shows that both production systems were economically viable, since they presented positive NPVs, MIRRs above the previously defined discount rate (>10% p.a.), and CBIs that were greater than 1.00.
It is noteworthy that PS-furrow led to the best financial results, with a higher NPV (USD 5625.34), MIRR (27.4%), and CBI (1.07). Although PS-drip has shown comparatively lower values, i.e., NPV (USD 732.27), MIRR (12.3%), and CBI (1.01), the system can still be seen as viable in all aspects.
Regarding the Discounted Payback, PS-furrow reimbursed the investment in 1.6 years, while PS-drip took 7.4 years, a significantly longer period in the comparative analysis between them.
PS-furrow’s Average Cost of Production was marginally better than PS-drip, i.e., USD 0.50/kg versus USD 0.53/kg, respectively. The difference between them resulted from the lower operational costs in PS-furrow due to its reduced energy costs. Furthermore, PS-furrow investments were relatively contained over time. Its minimum sale price also outshined the other irrigated system’s price, which reached USD 9.20/box versus USD 9.84/box for PS-drip.
3.2. Risk Analyses
Table 4 and
Table 5 present the NPV sensitivity analyses of PS-furrow and PS-drip, respectively.
It can be observed that if the sale price remains constant at USD 10.00/box for PS-furrow, a permanent decrease in the quantity of harvested boxes (36/week) would lead to a negative NPV (
Table 4). In contrast, if the quantity of harvest boxes remains at 40, the selling price dropping to USD 9.00/box would make the enterprise unviable, with negative NPVs. To enable a USD 8.00/box market price, which in the market’s recent history can be considered a low price, the production would have to reach ≥48 boxes/week.
Regarding the NPV sensitivity analysis for PS-drip (
Table 5), if the selling price was maintained as constant at USD 10.00/box, 38 harvested boxes per week would lead to negative NPV values. On the other hand, if maintaining 40 harvested boxes per week and if a reduction in selling price to 9.00/box occurred, the enterprise would be unfeasible, with negative NPVs. Below USD 9.00/box, there is no tested production scenario that could maintain the business viability under such circumstances, which implies reduced market and production resilience for PS-drip. The results obtained in the sensitivity analysis should be considered relevant, as they represent the financial return of the systems under pessimistic and optimistic market and production conditions.
Figure 4 presents the tornado plot analysis for PS-furrow (a) and PS-drip (b), applied in the financial planning tool, in which the graph’s central axes are their NPVs.
As shown in
Figure 4, the most influential variables for the PS-furrow’s financial performance were the okra’s sale price, production, harvesting costs, and planting costs, respectively. Acquisitions, energy costs, and investments in the irrigation systems had a relatively minor impact on its NPV.
PS-drip’s NPV performance followed a similar pattern in the tornado plot, and the most relevant variables were the okra’s sale price, production, harvesting costs, and planting costs, as well. A reduced impact of the NPV was observed for the variables investment in irrigation system, energy costs, and acquisitions. When comparing the outcomes between the two production systems, only irrigation investments and acquisitions changed in order of relevance, in which irrigation investments had some financial importance for PS-drip, due to its higher values. The tornado plot results can be interpreted as pertinent, since they present the key variables that affect the financial return of the projects.
The last risk analysis, the Monte Carlo simulation, led to the indicators shown in
Table 6.
The Monte Carlo results demonstrated that the average of 10,000 NPVs was USD 8795 for PS-furrow and USD 1499 for PS-drip. These values exceeded the deterministic NPVs obtained, which were USD 5625 and USD 732, respectively. The average Monte Carlo NPVs can be considered high values due to the various risk factors, including some more conservative factors that were considered in the calculations.
PS-furrow’s probability of success (P (NPV > 0)) was 89%, while PS-drip scored 58%. That means that the probability that the project’s NPV is greater than zero was higher than the probability of scoring an NPV below zero, which was 11% and 42%, respectively. Given the simulated risk factors, including some pessimistic ones, PS-furrow had a significant probability of success, while PS-drip showed a reasonable probability of success. The Monte Carlo simulation results were pertinent, as they simulated seven relevant variables under realistic conditions of the market, prices, and productivity, being a proxy of the probability of success of the enterprises.
4. Discussion
Comparing the results obtained in this study with the literature, it is important to mention that a gap exists regarding the economic analysis of irrigated crops. Most of the literature focuses on technical analyses and only uses traditional financial indicators, such as the Total Annual Operating Cost, to examine irrigated agricultural projects over just one year, which does not consider the investment life cycle, as investigated in the present study.
For instance, Souza et al. [
12] estimated the Total Annual Operating Cost of irrigated sweet corn production in the northeast of Mato Grosso do Sul state, Brazil. The authors also evaluated several treatments involving irrigation plates and growing seasons, and their outcomes demonstrated that irrigated sweet corn was technically and economically viable for one year, with greater productivity during the summer/autumn season.
Souza et al. [
28] analyzed the technical and economic feasibility of hybrid tomatoes grown with irrigation in the northeast of Mato Grosso do Sul state, Brazil, as well, also using the Total Annual Operating Cost. Their results pointed out that irrigation had no effect on the agronomic characteristic of the tomatoes that were planted in the rainy season. Moreover, they observed that hybrids grown in the rainfed system had greater economic viability over one year due to positive returns on investments.
Silva et al. [
14] compared the economic viability of two irrigation systems with central pivots for sugar cane and soybeans in Brazil. Unlike other research, this study evaluated irrigation systems’ NPV and Payback for a useful life of 27 years of investments. Their outcomes uncovered that the two irrigated crops had positive NPVs and a Payback of 7 years for 27 years of investments in the central pivot irrigation system.
The current work brought to light that PS-furrow reached higher economic indicators than PS-drip in terms of comparative economic viability due to the difference in initial irrigation investments and in operating costs, including the energy ones. Although equivalent production was perceived and PS-drip is still considered economically viable, this system had lower viability and worse financial indicators.
On the other hand, a drip irrigation system is generally believed to be more efficient and technological compared to a traditional furrow irrigation system, which could implicate a better productivity for a drip system. However, it does not occur in the present work, as some difficulties for producers in using the drip system were reported in the interviews, e.g., problems with water quality, pipe clogging, maintenance, and operational troubles.
It is also important to comment on the implications of the study for sustainable agriculture. The combination of technological and financial analysis performed in this study generated results that can improve information levels for producers, opening possibilities to plan water’s and other resources’ allocation and improve their management, contributing to water conservation and preventing fertilizer leakage.
The risk analyses performed in the study showed higher financial resilience for PS-furrow, with comparatively better indicators regarding reductions in okra’s selling price and production, while PS-drip was more susceptible to production and market fluctuations. Both investments were considered sensitive to market conditions (selling price), productivity, harvesting, and planting costs, but in terms of financial resilience, okra’s production with furrow irrigation can be considered a simple and a more profitable system in terms of the technical and financial conditions observed in the present study.
Hence, it can be seen that the financial planning tool led to improvements in comparison to the limitations of the traditional economic analysis. This resulted from many factors: (i) the tool allows for the evaluation of different production and market scenarios through a sensitive risk analysis followed by a tornado plot and Monte Carlo simulation; (ii) the traditional economic evaluation is deterministic, whereas the Monte Carlo simulation can assign probability distributions to the main variables and estimate the enterprise’s chance of success, thus providing a holistic perspective for calculating the viability of an agricultural enterprise; (iii) the integration of economic–financial and risk analyses provided a wide range of tools for the agricultural manager; and (iv) the view of the business’ cash flow generated by the tool enables improvements in the producer’s cash management, leading to a better capital and resource allocation over time.
The financial planning tool could induce economic and social sustainability in rural areas by generating knowledge on financial administration, given the technical and economic aspects of these kinds of projects. The tornado plot, for instance, facilitates the determination of the most relevant variables for the success or failure of smaller-scale crops, which were, in the present study, okra’s sale price and productivity.
From the producer point of view, in order to maintain and/or to improve their sale prices, farmers must have market power and organizational capacity, a quality that is achievable through cooperatives, management development, and emerging rural companies that could together positively impact business sustainability, as previously discussed in the literature [
22,
24,
26,
27,
45]. Another variable that is relevant for improving small-scale irrigated crops is productivity, which requires producers to increase their operation, the quality of planted material, crop knowledge, and soil and fertilization practices and implement improved irrigation systems, such as sprinklers and central pivot systems, or even seek to adjust their current irrigation systems. Agricultural fertilizer costs can also be reduced with greater organization and management by smaller-scale producers [
46,
47,
48].
However, there are still challenges and limitations to applying a financial tool in rural areas [
49,
50,
51]. Monte Carlo, for example, is not a simple tool and is generally based on paid software. In its use, it is also difficult to estimate the relationship between the variables and define the probability distribution of the variables in order to obtain realistic research results, which requires financial and technical knowledge from the researcher/manager. Furthermore, taking financial instruments to farmers requires financial education, extensive programs of training and monitoring of the use of the tools tested, development of free software and applications that are user-friendly, as well as support from the rural population. These challenges can limit the application of financial planning in rural areas and have to be considered for decision makers in ongoing and future public policies.


 and
and 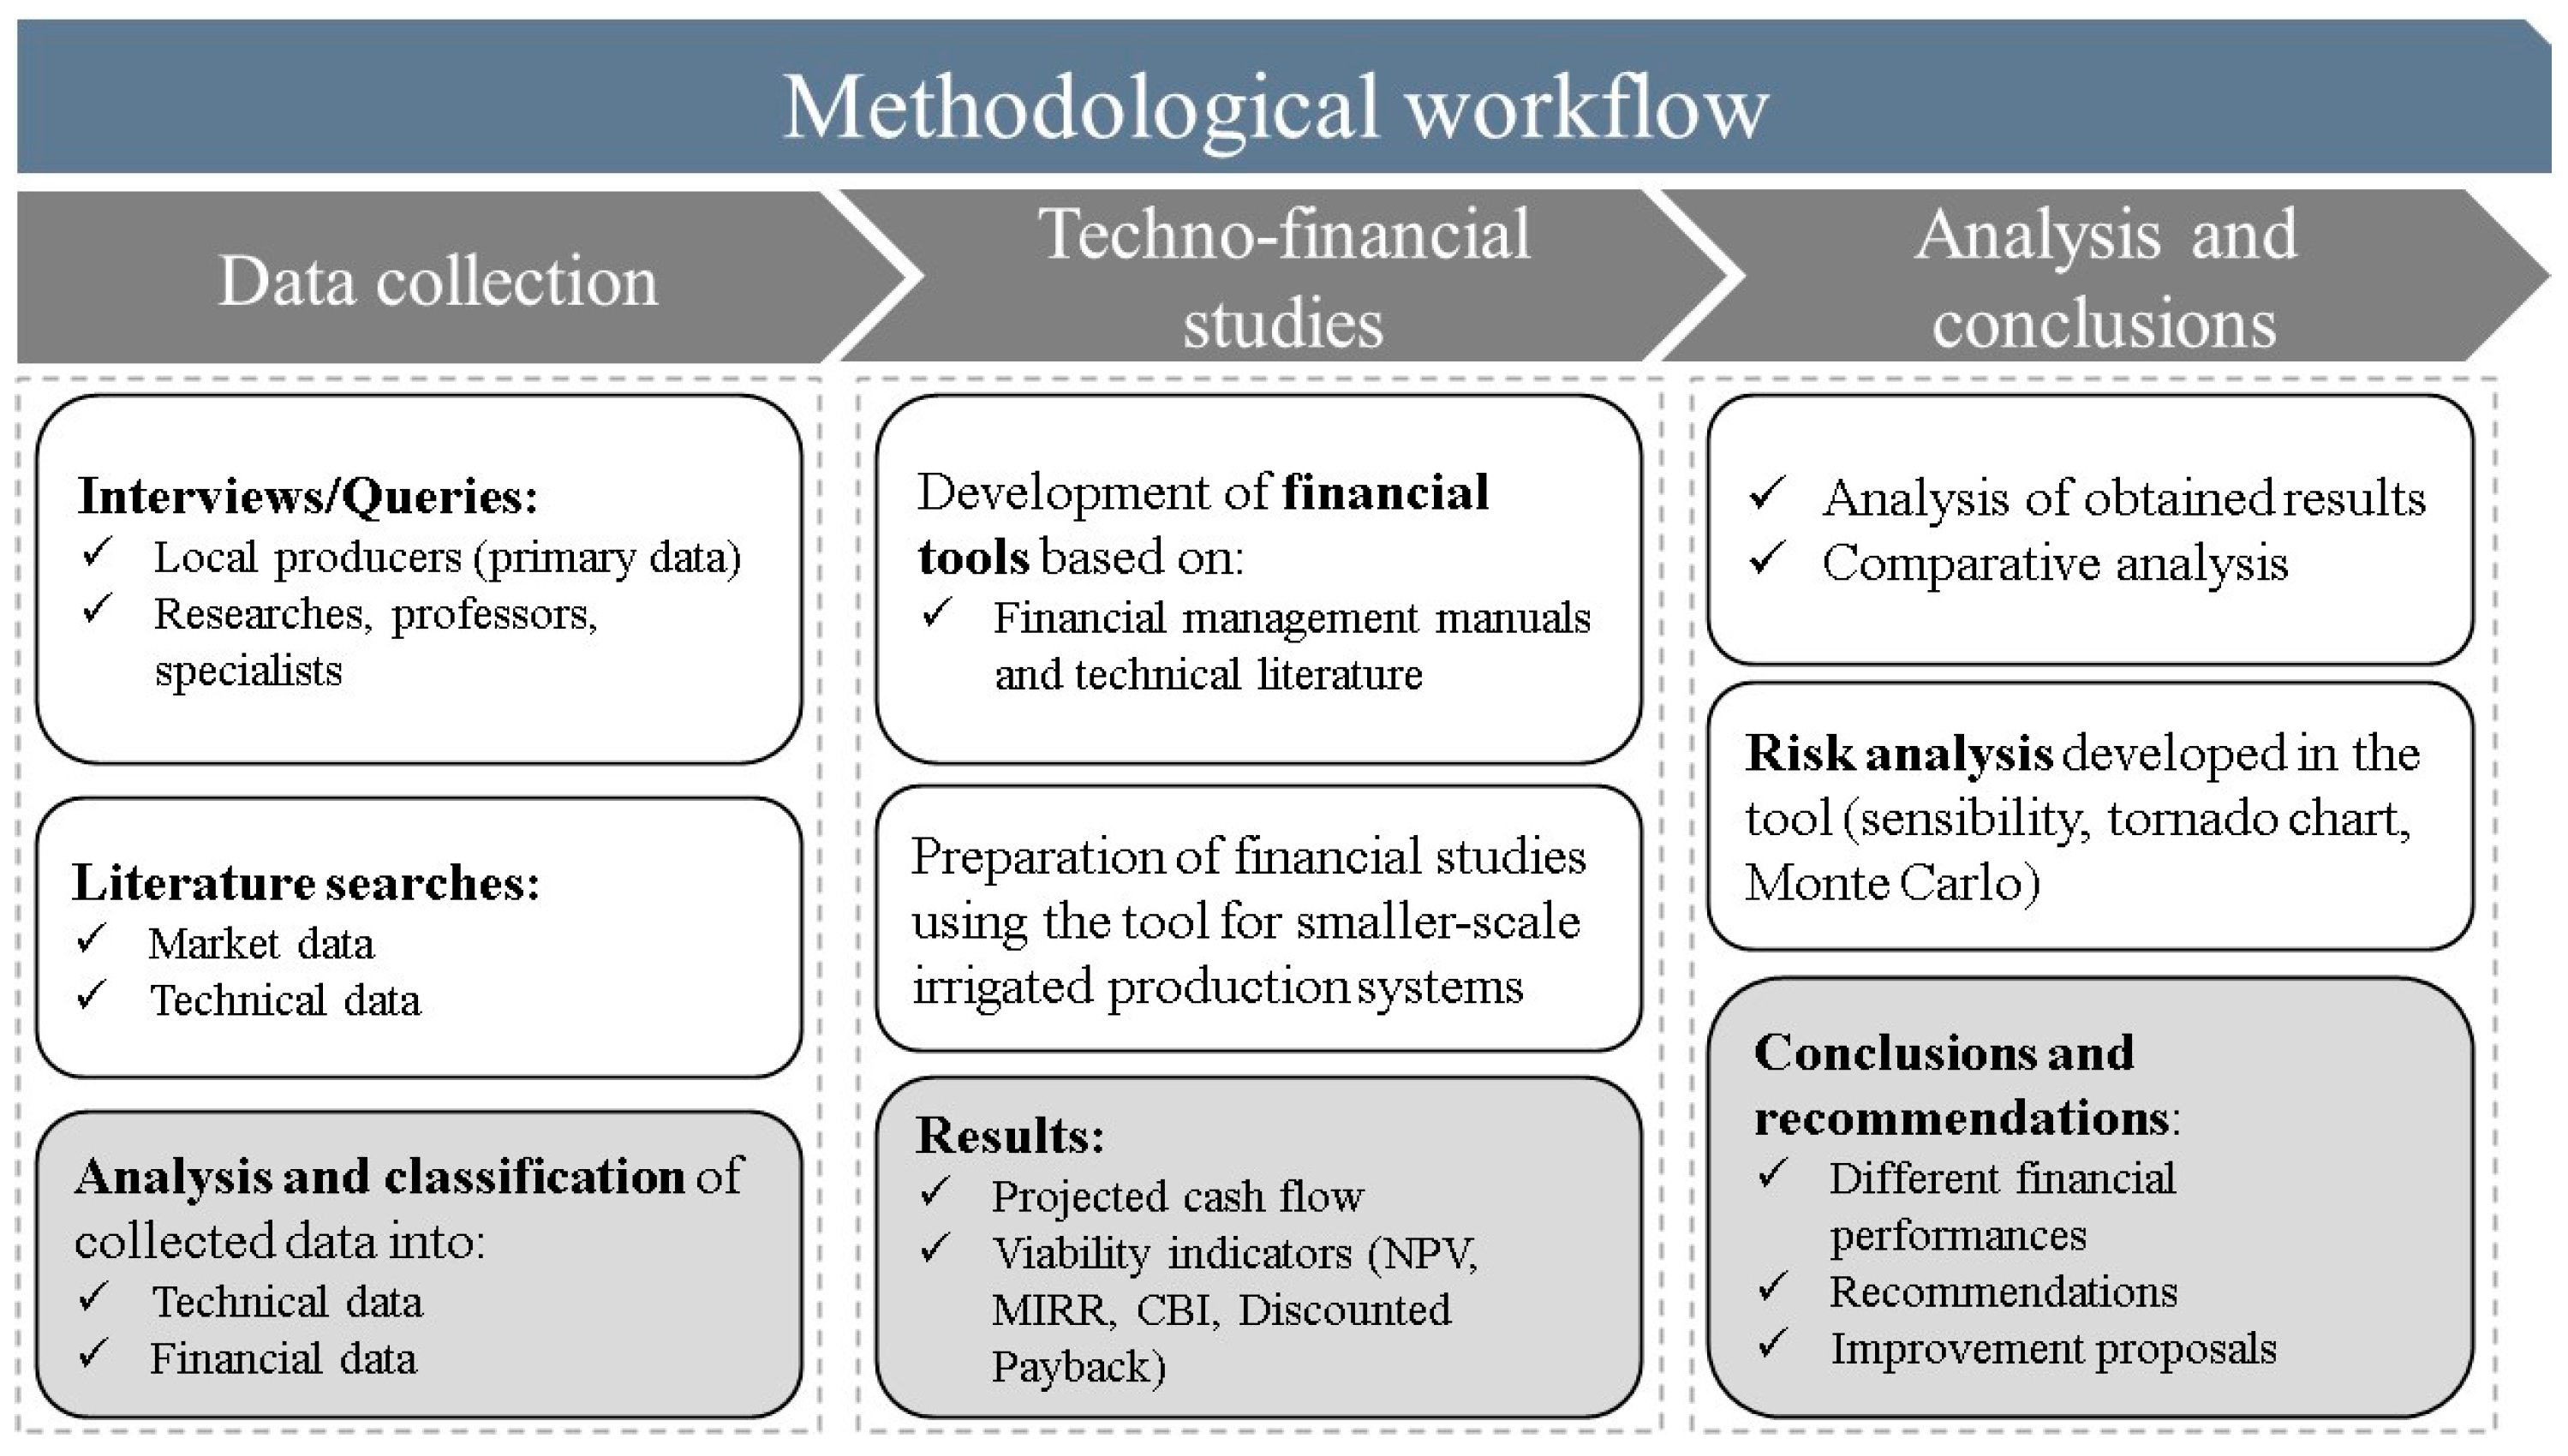


