Abstract
This research paper analyzes consumer expectations and priorities concerning environmental indicators within the food industry. The study’s overall objective was to understand the importance of various environmental indicators on consumer purchasing decisions. A survey was conducted in Poland, utilizing a representative sample to measure participants’ opinions. Respondents were asked to assess the importance of various environmental indicators in influencing their purchasing choices. The findings underscore a high demand among Polish consumers for environmental responsibility from companies operating in the food sector. Key indicators include the effectiveness of environmental management systems, pro-environmental investments, the promotion of environmental awareness, waste management, water conservation, and attention to supply chain and wastewater issues. This study provides a comprehensive understanding of consumer preferences, offering guidance for industry stakeholders and policymakers seeking to enhance sustainability practices and align their efforts with consumer expectations in the dynamic landscape of the food sector.
1. Introduction
The globalization and internationalization of the economy contribute to changes in individual household members’ attitudes and consumption behaviors. They are shaped by many determinants, not only economic but also social and cultural. With the growing wealth and consumer awareness of societies, their purchasing decisions regarding food products are increasingly conditioned by the assessment of the ability of food products to meet additional buyer expectations. Consumer food purchasing behavior is changing significantly worldwide, and consumers are now increasingly interested in the excellent taste, convenience, and health properties of food [1,2,3,4]. When making purchasing decisions regarding food products, consumers are guided primarily by their assessment and the importance they attribute to them now and what benefits they will bring for them in the future [5,6,7]. When making purchasing decisions, consumers pay attention to product quality and brand [8,9,10,11]. Available research results indicate that when choosing food products, consumers take into account freshness, taste, price, convenience of use, the composition and nutritional value of the product, its healthiness, and brand [12,13,14,15,16]—increasing consumer awareness results in an increase in demand for food perceived as health-promoting. Emotional factors are also taken into account when purchasing products [16]. However, interest in food that does not benefit consumers’ health is decreasing [17]. There are already studies on consumer preferences, not only in terms of quality reasons for purchased products but also environmental and ethical reasons [18,19]. Consumers expect food to increase the pleasure of consumption and the effects of vitality, health, and beauty [13,20]. Modern research shows that respondents increasingly take health and the environment into account [21,22]. The origin of food products is becoming essential for consumers. The products they buy must be produced using ecological, environmentally friendly methods, using raw materials from non-genetically modified crops, and breeding [17,23]. In recent years, awareness and demand for environmental awareness and concerns about climate change have increased, prompting consumers and importing countries to reconsider their perspectives on the products they consume. Consumers are increasingly willing to pay a premium for high-quality food products that are produced using responsible farming practices, taking into account health and environmental factors [7,24,25,26]. In examining consumer awareness of organic foods, Lee and Hwang found that “consumers who believe that organic foods are safe and environmentally friendly may also believe that the overall quality of organic foods is high, which increases value perceptions.” [27]. In their study, Annunziata and Mariani proved that the segment of egocentric consumers is more significant than that of consumers focused on sustainable development [15]. There is consumer demand for products from healthy ecosystems, as well as private actors taking initiatives to protect biodiversity and achieve climate neutrality goals [28,29].
The growing consumer awareness of sustainable development influences the activities of entrepreneurs in providing food products that meet consumers’ specific needs and expectations. New trends in consumer awareness are moving the agricultural sector towards sustainable practices, such as traceability and crop labels, and connecting farmers and consumers through sustainable labeling programs [30,31]. Environmental awareness is growing among consumers, who are increasingly concerned about the scale of threats resulting from ecological degradation. Consumers are paying more attention to the benefits they can obtain by changing their current behavior and replacing conventional products with ecological products [32]. This encourages companies and other organizations to adopt eco-efficient practices, which are becoming accepted in many different sectors, to achieve a competitive advantage in price and cost. Promoting consumer behavior related to purchasing environmentally friendly products is the key to sustainable environmental development [33]. Therefore, organizations’ management strives to look for new sources of competitive advantage. Research has shown that various factors influence organizations’ environmental effectiveness, stimulating or hindering it. These include economic, social, legal, and organizational factors [34]. New product categories have appeared on the market, whose identification and classification are based on production methods and environmental and societal impact. Therefore, many enterprises use activities to achieve environmental effects based on various environmental indicators. Many organizations also apply best environmental management practices along with sectoral environmental indicators and benchmarks of excellence, which can be found in the EU sector reference document [35]. The identification of environmental factors influencing consumers’ decisions regarding purchasing food products can be used by entrepreneurs to better meet consumers’ needs and expectations.
Broad and deep reviews of the literature indicate that factors influencing customers’ purchase intentions have not been well identified through a comprehensive literature review and an exploratory approach, and only the relative importance of a limited set of factors has been determined [36,37,38,39,40,41]. Azam, Othman, Musa, Fatah, and Awal [6] analyzed the factors affecting consumers’ purchase intentions for organic food products. Kareklas, Carlson, and Muehling [12] provided a theoretical assessment of the factors influencing consumer purchase behavior for organic food products. Zarif Sagheb, Ghasemi, and Nourbakhsh [36] researched the factors influencing the purchasing preferences of food products. They defined 13 factors: corporate social responsibility, customer knowledge and awareness, perceived risk, retailers’ commercial image, customers’ personality characteristics, social identity, product features, attitude, country of origin, perceived value, subjective norm, loyalty, and perceived behavioral control. However, they did not isolate the environmental factors influencing consumers’ purchasing decisions. Therefore, a research gap is the lack of identified environmental factors influencing consumer purchasing preferences.
Generally, no pioneering study in this field would provide a comprehensive set of environmental factors influencing consumers’ food purchasing decisions. More research should be conducted on identifying environmental factors influencing the intention to purchase food products based on an exploratory approach in the relevant literature. This study collected all these factors. The study aimed to obtain information on essential issues from consumers’ perspectives when making purchasing decisions and to diagnose the needs of individual users based on environmental data. The following questions arise in this regard:
- Q1. What environmental factors influence the willingness to buy food products?
- Q2. What environmental issues does a consumer take into account when deciding to purchase a food product?
- Q3. What environmental indicators are important for individual consumers when purchasing food?
Based on the literature analysis, this study proposes environmental factors influencing purchasing decisions for food products. These were arranged into several groups as factors influencing energy, water, waste and resource consumption, and others. It was also examined whether, when making purchasing decisions, information about the impact of a given product on the environment or information about the manufacturer’s impact on the environment is more important for the consumer. In addition, it examined what environmental indicators are essential when purchasing food products.
2. Materials and Methods
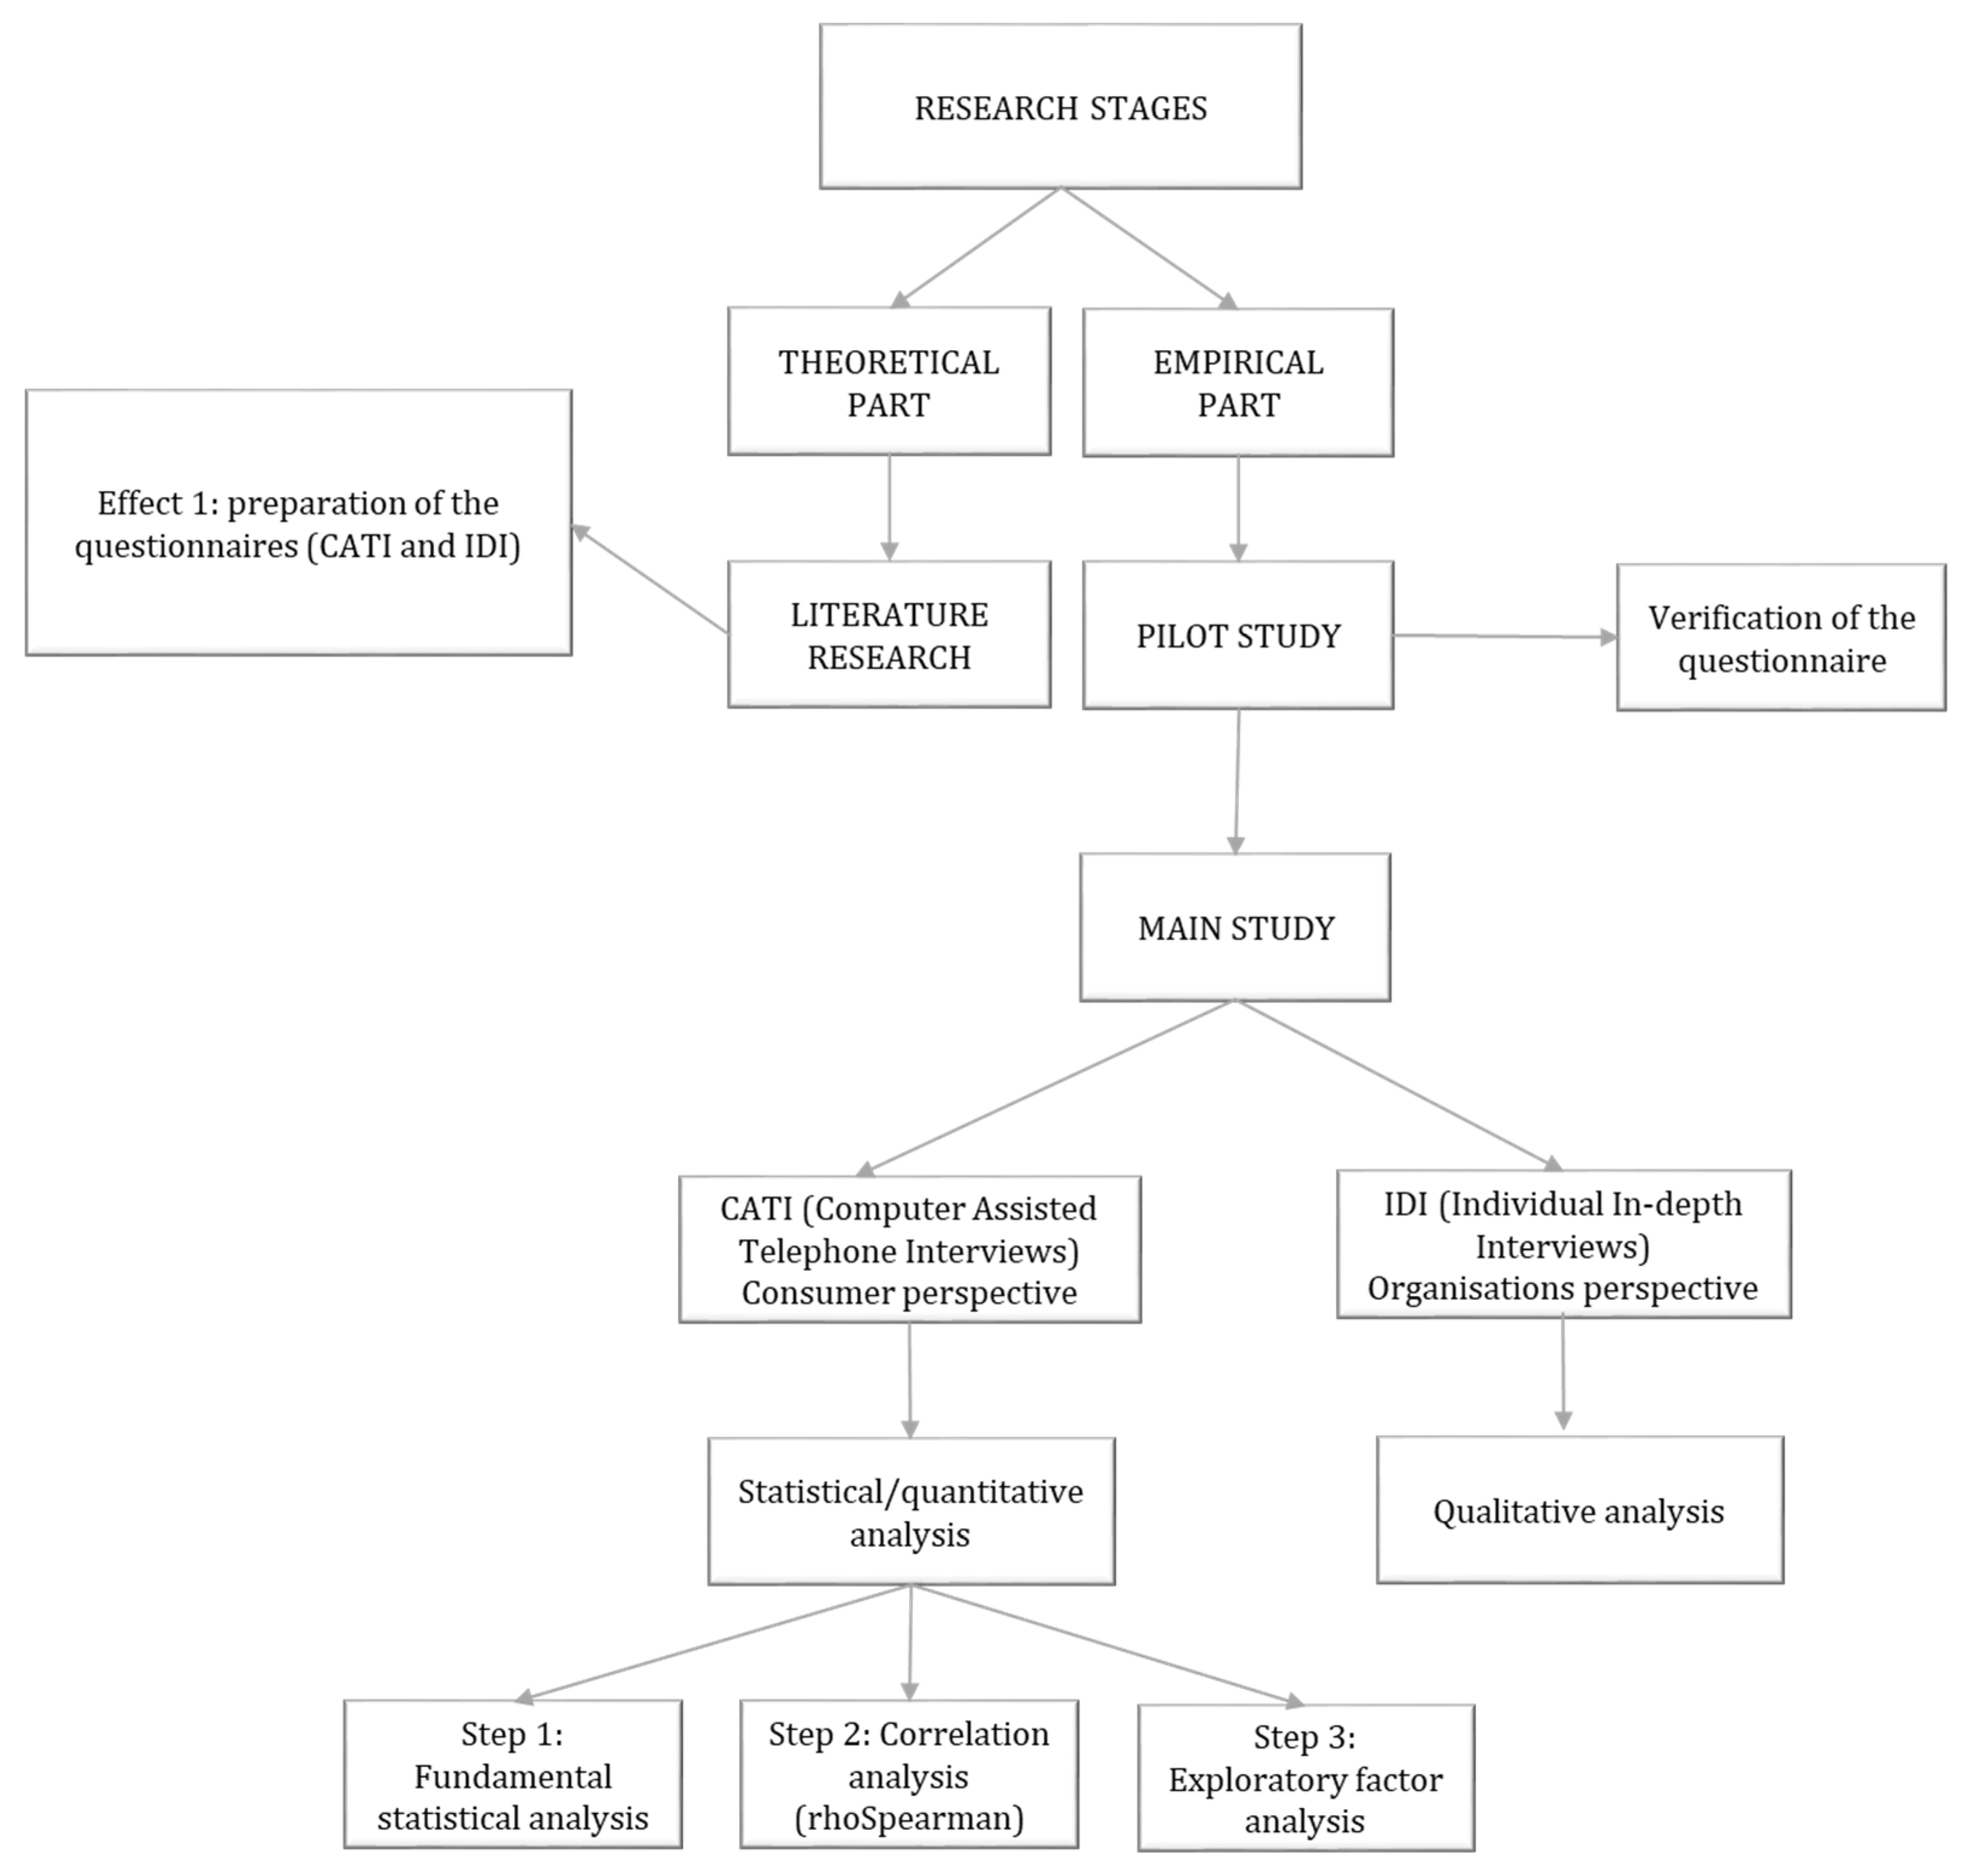
The study was conducted in 2022 using a triangulation strategy. This approach combines various methods to explore the research problem and to increase the knowledge gathered and the usefulness of the data. The research contained several stages. The research questions were initially developed based on existing knowledge and aligned with the study’s objectives. Once the questionnaires were developed, a preliminary study was conducted to validate the research questionnaires to ensure the validity of the questions. The questionnaires utilized in the study were developed by the research team based on a review of the relevant literature and expert consultation. Data collection adopted two methodological approaches: computer-assisted telephone interviews (CATIs) were used to engage customers for their views, and individual in-depth interviews (IDIs) were conducted with experts. CATIs were conducted over the phone with the help of a computer, and IDIs were one-on-one interviews conducted for detailed insights. The obtained responses were subjected to statistical analysis (Figure 1).

Figure 1.
Research Plan.
This study focused on the geographical area of Poland. The CATI research was undertaken using a representative sample of Polish citizens. To guarantee the sample’s representativeness, the data collection was outsourced to an external company with access to representative survey panels. The targeted number of questionnaires for this study was initially set at n = 1038. The actual responses exceeded expectations, reaching n = 1221. The sample size was calculated for the Polish population, estimated at approximately 37.97 million, with a 95% confidence level and a maximum error of 3%. To ensure representativeness, the sample was planned considering characteristics such as gender, age, and education.
The CATI survey questionnaire contained seven questions and metrics systematically designed to collect specific information from consumers. The most important part of the survey involved scrutinizing 21 environmental indicators. The set of environmental indicators was selected using a combination of a top–down approach and a bottom–up approach [42,43]. The top–down approach involves using experts such as researchers and government groups to define a comprehensive set of indicators at a broad and macro-level [44,45]. The collection of indicators was based on the Sectoral Reference Document (SRD) [35] on Best Environmental Practices (BEMP) in the food and beverage manufacturing industry [46], indicators proposed by the International Organization for Standardization in the ISO 14031 standard [47], and the literature reviews [6,13,21,22,33,35,43,45]. The bottom–up approach established indicators by involving a diverse range of stakeholders, including academics and experts. The bottom–up approach was facilitated through interviews and brainstorming. Interviews allowed for direct engagement with stakeholders, enabling a deeper understanding of their perspectives, concerns, and suggestions, whereas brainstorming provided a structured platform for generating ideas collaboratively. The questionnaire, with a 5-point Likert scale (1—definitely unimportant; 5—definitely important) of a general set of environmental indicators, was answered by 1221 respondents in Poland to determine the importance of each environmental indicator during purchasing decisions for food products. To preserve the privacy and confidentiality of respondents, the collected data remained anonymous, with responses analyzed collectively and without individual identification. The analysis of the responses to the 1221 completed questionnaires occurred in three steps.
- Step 1 of the analysis: A fundamental statistical analysis, with a particular focus on the calculation of the mean and standard deviations. It consisted of a straightforward data analysis to summarize central tendency and variability and a reference point. It laid the groundwork for a preliminary understanding of the dataset’s distribution and formed a foundation for more in-depth analyses in subsequent steps.
- Step 2 of the analysis. Correlation between the respondents’ profiles and their responses to the indicators. It involved the application of Spearman’s rho coefficient. This coefficient is a non-parametric measure that evaluates the presence of variables influencing the importance of indicators. The correlation is weak for a coefficient between 0.10 and 0.39, moderate between 0.40 and 0.69, and vital if the coefficient is between 0.70 and 1.00 [47]. The correlation intensity helped determine the degree of influence of variables such as age, education level, household size, and financial situation.
- Step 3 of the analysis. The exploratory factor analysis models are used to reduce a multi-element set of variables to a smaller set of factors, which contain most of the information in the output variables and reveal hidden relationships in the analyzed dataset [48,49,50,51]. The exploratory factor analysis aimed to identify and evaluate key environmental indicators influencing individual consumers’ food purchasing. Bartlett’s test and the Kaiser–Meyer–Olkin index (KMO) were used to assess the suitability of variables. A KMO value above 0.5 is generally considered acceptable, while some suggest a threshold of at least 0.6 [48]. Bartlett’s test examined the hypothesis that the correlation matrix is an identity matrix; rejecting it justifies a factor analysis of the dataset [52].
The subsequent phase of the study involved individual in-depth interviews (IDI) with organizational representatives. Conducted online for convenience and flexibility, the IDI questionnaire was standardized and partitioned into six segments to facilitate a comprehensive exploration of the organizational perspective. The data collected from the IDIs were qualitative, contributing to the overall research. In total, 8 interviews were conducted. The sample is not representative, as the data are deemed qualitative, not quantitative.
This paper aims to evaluate the impact of different environmental indicators on consumer purchasing decisions for food products. Assessing the consumer perspective is based on the results of qualitative research obtained from the CATI survey (first stage). The information gathered in this study is non-sensitive and excludes details related to health, genetic information, intimate life, political views, ethnicity, beliefs, or religious beliefs. No continuous tracking or observation methods were employed in the study. Participants engaged by completing survey questionnaires, and their responses were treated anonymously, undergoing collective analysis without individual identification. The study identified no risks associated with psychological or physical harm to either respondents or researchers. It obtained a favorable opinion from the Ethics Committee, ensuring the inclusion of ethical considerations throughout the research process. An exploratory factor analysis—principal components analysis—was carried out to isolate and assess the importance of key environmental indicators determining consumers’ food purchase decisions.
3. Results and Discussion
3.1. Participant Profile Analysis and Fundamental Statistical Analysis
The study sample included individuals selected to ensure representative demographic characteristics. Regarding gender distribution, the sample consisted of 47.4% males and 52.6% females. Age-wise, the largest segment within the sample comprised individuals aged 55 years or older (33.2% of the participants). Subsequent age groups were 25–34 years old (20.1%), 45–54 years old (17.9%), 35–44 years old (17.0%), and 18–24 years old (11.8%). Educationally, the sample included individuals with diverse levels of education. Most had completed higher education (34.1%), while 9.2% held a bachelor’s degree. Furthermore, 12.6% had postsecondary education, and 31.5% had secondary school education. Those with vocational school education accounted for 10.2%, and 2.5% had elementary education. Regarding household size, the distribution was as follows: one-person household, 13.5%; two-person household, 30.7%; three-person household, 26.4%; four-person household, 18.8%; and five-person household, 10.6%. Concerning financial situations, the distribution was as follows: very good (can afford anything), 1.5%; good (occasionally able to indulge in some luxury goods, trips, recreation), 32.6%; average (need to plan for all major expenses), 53.1%; bad (usually only enough for the basics and necessities), 9.9%; and very bad (sometimes not even enough for necessities), 2.9%.
The mean score for the importance of all 21 indicators collectively was 3.68. The data reveal a gender difference in the significance of environmental indicators, with women attributing them slightly more importance (mean score of 3.77) compared to men (mean score of 3.58). These findings align with the research results on the influence of consumer lifestyle on purchasing behavior, which showed that gender was the most considerable statistically significant difference in the impact on a healthy lifestyle and plays a role in consumer purchasing decisions for food products [53]. Also, Wandel and Bugge [54] noted that women and those with higher education were more likely to prioritize environmental aspects.
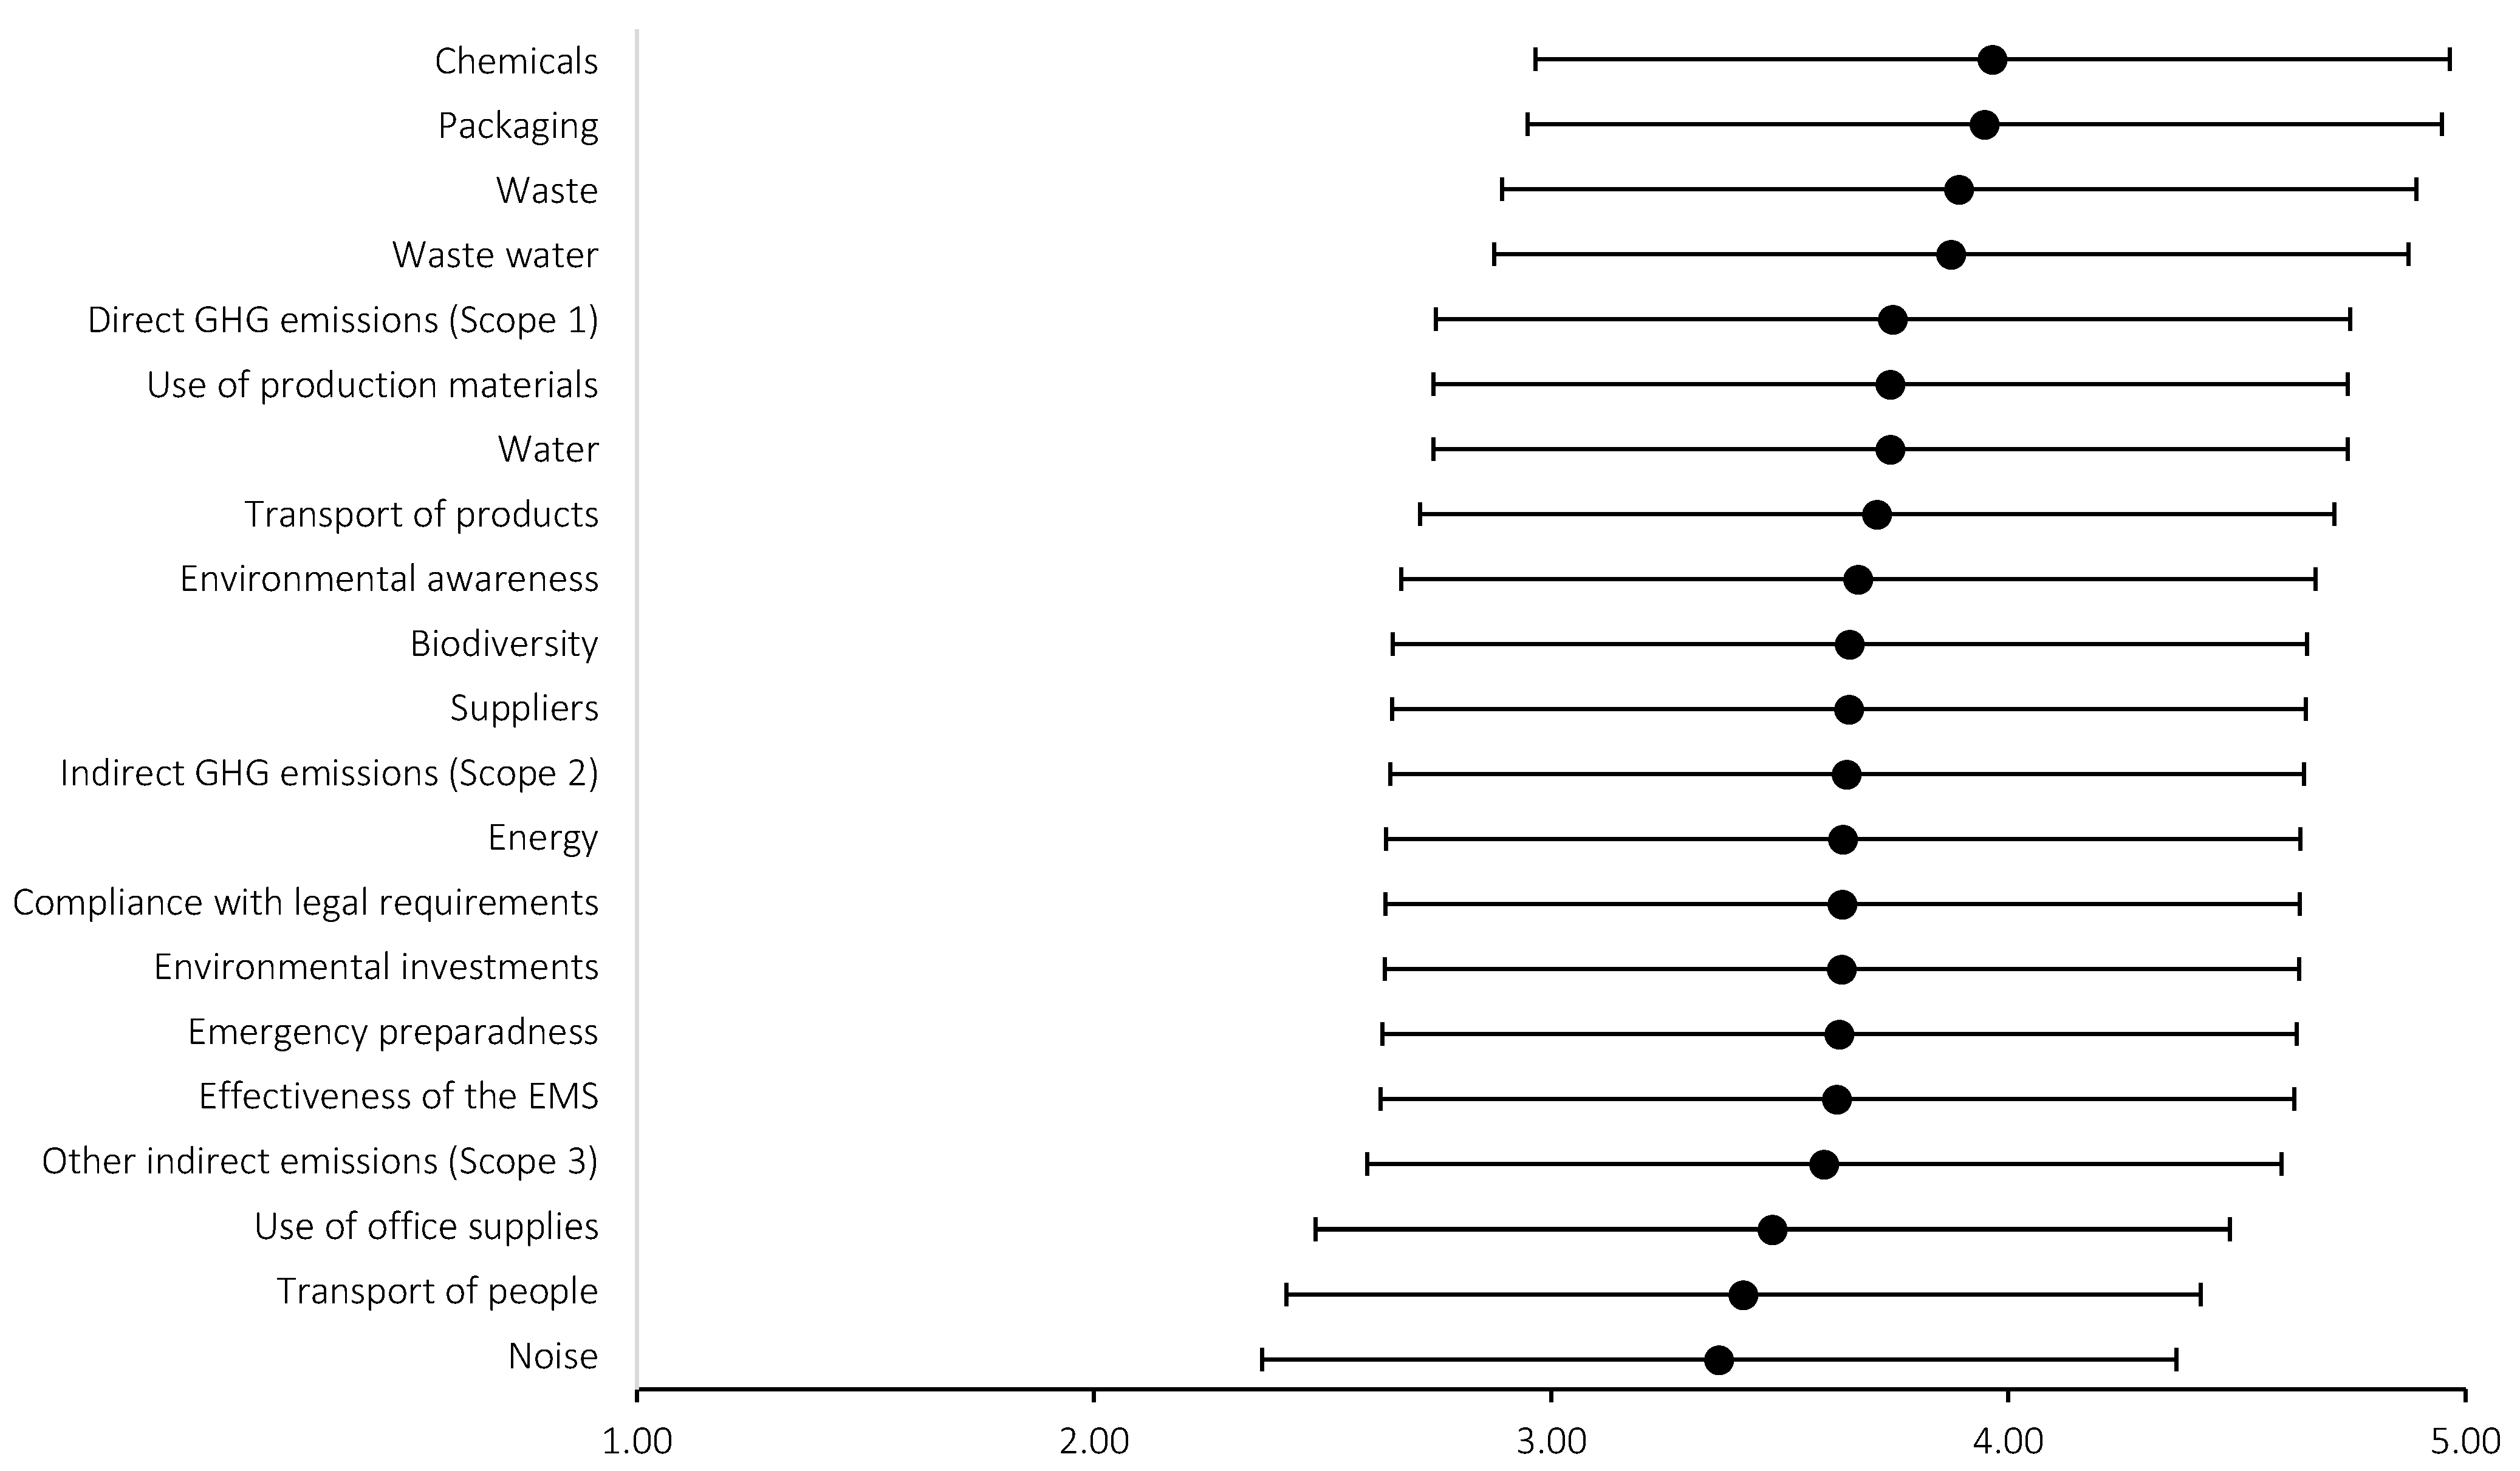
As shown in Figure 2, the respondents placed the highest importance on indicators such as the use of chemicals (3.97), packaging (3.95), waste (3.89), wastewater (3.88), direct emissions (3.75), the use of production materials (3.74), and water (3.74). Conversely, indicators like noise, the transportation of people, and the use of office materials were considered less important. Women consistently assigned higher importance to individual environmental indicators than men. The top three areas rated highest (chemicals, packaging, and waste management) are highly regulated in Poland and the European Union regarding legal environmental requirements, which may contribute to consumer awareness. Chemicals, being potential health hazards, received significant attention, and waste management aligns with current awareness and the requirement for waste segregation in the country. The importance of packaging was also emphasized in research conducted by Lea and Worsley [55] and Wansink [56].
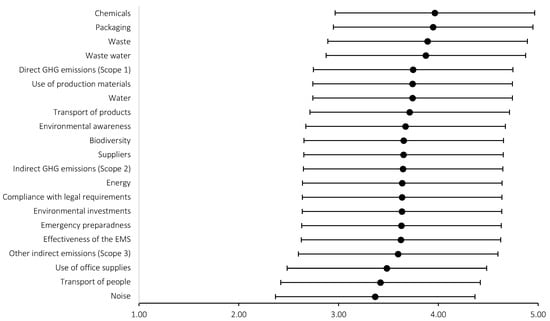
Figure 2.
Importance of environmental indicators in purchasing decisions for food products (mean and standard deviation on a 5-point Likert scale, where 1 is definitely unimportant and 5 is definitely important).
Among the respondents, 27.5% saw environmental indicators as definitely important in their food purchasing decisions, 29.2% saw them as rather important, 32.1% remained neutral, 6.1% deemed them rather unimportant, and 5.1% considered them definitely unimportant. On average, the importance of environmental indicators was rated at 3.68 on a 5-point scale, indicating a moderate significance level. The moderate level of importance of environmental indicators was previously confirmed by Bergström, Solér, and Shanahan [57] and Grankvist and Biel [58], who found that parameters such as price had the greatest influence on product preference, with environmental factors having a lesser impact. The importance of environmental indicators may be linked to consumers’ general views and values. Research by Barker [59] revealed a link between environmental worldviews and the importance of environmental criteria in food purchasing, with those subscribing to ecocentric values placing greater importance on environmental factors.
3.2. Correlation Analysis
Spearman’s rho coefficient revealed that the variables regarding age, level of education, household size, and financial situation showed only a significant correlation of p < 0.01 or p < 0.05 with weak intensity, as classified by Dancey and Reidy [48] (see Table 1). Spearman’s rho coefficient shows that this linear trend in the responses, however significant, has a weak intensity of max rho = 0.197 (p < 0.05) and exists only for age as a variable.

Table 1.
Spearman’s rho coefficient.
The survey contained a question about the respondents’ expectations regarding corporate responsibility for environmental impact. A substantial majority of respondents (80.5%) believed that companies should be responsible for their environmental impact (“definitely yes” and “rather yes” on a five-point scale); on the other hand, only 0.8% responded with a definitive “no”, and 2.3% opted for “rather no”. The average response on the 5-point scale was 4.18. The study uncovered variations in expectations across different demographic groups. Surprisingly, individuals aged 55 and over emerged as the most demanding in terms of environmental responsibility expectations, with 87.2% responding with “yes” and “rather yes” (resulting in a mean score of 4.34). Following closely were those aged 45–54 (83.1%, mean score: 4.19), 35–44 (77.9%, mean score: 4.12), 25–34 (76.5%, mean score: 4.07), and the most minor demanding group were individuals aged 18–24, with 69.5% expecting environmental responsibility from companies (mean score: 4.00).
These findings seem to contradict some findings suggesting that younger respondents (in particular, Generation Z) generally have higher expectations of companies regarding environmental responsibility and sustainability [60,61,62,63]. The potential trend where pro-environmental expectations of companies increase with age may be linked to greater purchasing power among older consumers.
Cramer’s V coefficient was calculated to gauge the strength of the correlation between age and consumer expectations, yielding a value of 0.100764. This indicates a fragile relationship between the two variables. Despite differences in the level of expectations regarding environmental responsibility across various age groups, this weak relationship implies that age alone might not be a strong predictor of environmental responsibility expectations.
The correlation analysis also shows that the respondents’ profiles in terms of variables such as level of education, household size, and financial situation do not significantly impact the importance of environmental indicators. No linear correlation was observed for the influence of those variables on consumer purchasing decisions regarding food products. In this sense, it can be seen that these test results are satisfactory, as they show that there were no significant leanings from the respondents; that is, the respondent groups were unbiased and neutral. Ricciuto, Tarasuk, and Yatchew [64], in research conducted among Canadian households, found that household size, composition, income, and education significantly influence food purchasing, with higher education levels associated with increased purchases of vegetables and fruit. Turrell et al. [65] further emphasized the importance of education, occupation, and household income in food purchasing behavior, with lower socio-economic groups less likely to purchase healthy foods. These studies suggest that while education, household size, and financial situation may not directly impact the importance of environmental indicators in food purchasing, they do play a significant role in shaping overall food purchasing behavior. Therefore, based on the existing knowledge, it can be concluded that the lack of significant impact of variables such as level of education, household size, and financial situation on the importance of environmental indicators in food purchasing indicates that other factors or personal values play a stronger role.
3.3. Identification of Key Environmental Indicators Influencing Consumer Food Purchases
The aim of the exploratory factor analysis was to isolate and assess the importance of key environmental indicators that would be important in the process of purchasing food according to individual consumers. The preparation for conducting the exploratory factor analysis began with building and analyzing a correlation matrix between variables. In the case of food products, many statistically significant correlations were observed between observable variables, which confirmed the validity of using a factor analysis. Then, Bartlett’s test of sphericity was performed, and the Kaiser–Meyer–Olkin index (KMO) was calculated. The KMO test is a measure of the adequacy of the selection of primary variables for a factor analysis. This indicator is used to determine the degree of correlation among input variables and has a value between 0 and 1. The higher its value, the stronger the basis for conducting a factor analysis. The proposal of H.F. Kaiser assumes the following categorization of the value of the discussed indicator: 0.9—very high, 0.8—high, 0.7—medium, 0.6—moderate, and less than 0.5—very low. It is also believed that the threshold value of the KMO measure should be at least 0.5, and some authors even suggest that it should be at least 0.6 [31]. Bartlett’s test of sphericity tests the null hypothesis that the correlation matrix of variables is an identity matrix, which would mean there is no correlation between the variables. If the null hypothesis is rejected as a result of the test, it is considered justified to conduct a factor analysis on the tested dataset [49].
Table 2 presents the results of the Kaiser–Mayer–Olkin test and Bartlett’s test of sphericity in the food product dataset. The value of the KMO index turned out to be high and amounted to 0.9795, and the result of Bartlett’s test for sphericity allowed for the rejection of the null hypothesis assuming that the correlation matrix of variables is a unitary matrix (p = 0.000); therefore, it could be assumed that there are grounds for applying a factor analysis on this dataset. In the next stage of the research procedure, the principal components method was used to isolate key environmental indicators that would be important in the process of purchasing food products for individual consumers, which involves transforming correlated input variables into components that are uncorrelated and ranked according to the variance explained by them. Determining the number of factors was based on the so-called Kaiser’s criterion, which assumes that only those factors are taken into account whose eigenvalue is greater than 1.0, which means that the value of the variance explained by factors meeting this criterion is greater than by a single input variable [49].
Table 2.
KMO index and Bartlett’s test.
In the case of the data obtained in the food category, based on the analysis of the eigenvalues of the factors (components), it was found that two of them had eigenvalues greater than 1.0, explaining in total almost 72% of the total variability, of which over 66% was accounted for by the first factor (Table 3). Then, factor loadings were calculated using Varimax orthogonal rotation. The limit for recognizing the analyzed factor loadings as significant was arbitrarily set to 0.6. The analysis of the rotated component matrix allowed for grouping measurable variables into components corresponding to the main indicators that consumers would take into account when purchasing food products (Table 4).
Table 3.
Eigenvalues and variance in exploratory factor analysis.
Table 4.
Main environmental factors influencing consumers’ food purchases.
The variables grouped into the first component (effectiveness of the environmental management system, environmental investments, and environmental awareness) are elements of Sustainable Management. The second component includes variables relating to Materials and Wastes (factors related to waste, water, suppliers, and water waste). The next step in the described research process was to assess the significance of the main components resulting from the factor analysis (Table 5).
Table 5.
Assessment of the main environmental factors influencing food purchases.
In the context of environmental indicators that significantly influence purchasing decisions, the Materials and Wastes component ( = 3.89) was clearly more important than the Sustainable Management component ( = 3.46). Respondents ranked indicators related to the operational activities of the organizations higher than indicators related to the management activities of the organizations. This may be due to several underlying factors. First of all, operational activities are often more tangible and visible to the public compared to management activities. Operational activities directly influence an organization’s day-to-day environmental performance. Actions such as waste management directly affect the environment and are more noticeable to stakeholders. The respondents might prioritize these indicators because they have a visible and immediate environmental impact, making them more concerning. On the other hand, management activities are often complex and involve various intangible aspects of organizational functioning. The respondents might have limited knowledge or exposure to these management indicators, leading them to prioritize the more straightforward operational ones they understand better. Management activities might include setting sustainable policies, conducting environmental audits, and implementing long-term strategies. These aspects are often not as transparent to the public, resulting in less awareness and potentially undervalued rankings.
3.4. Study Limitations and Future Research
This study was conducted in Poland, which is one of the limitations. Its findings may not be widely applicable to other countries due to cultural and economic variations affecting consumer attitudes towards environmental responsibility and the importance of environmental indicators. Despite being representative of European culture, Poland’s unique characteristics may not fully capture the diversity across regions. Also, mass-media discussions surrounding environmental issues, including those related to food products, may be an important factor shaping consumers’ behaviors in this matter. Future research could replicate the study in different countries for a comprehensive understanding of consumer expectations.
Another limitation is that the study relies on self-reported data, potentially biased by socially desirable responses. To enhance reliability, future studies could incorporate objective measures or observational surveys.
Moreover, the study’s timing during the spring season may influence human behavior and food product purchases. Future research could explore variations across seasons to provide a more comprehensive understanding. Another limitation is the lack of investigation into consumers’ attitudes towards imported food products. Additionally, the study does not differentiate between various product categories, such as beverages, vegetables, meat, cereals, sweets, and functional foods, which could impact purchase decisions differently. Addressing these limitations in future research would facilitate a more nuanced comparison across product types and enhance the study’s applicability and relevance.
Despite these limitations, the study aligns with previous research highlighting increasing consumer expectations for environmental responsibility. It contributes by offering specific insights into the expectations and priorities of Polish consumers.
4. Conclusions
The study found a gender difference in terms of the importance attributed to environmental indicators, with women rating individual environmental indicators slightly higher than men. This aligns with previous research indicating that gender influences consumer purchasing decisions regarding healthy lifestyles and food products.
The top-rated environmental indicators included using chemicals, packaging, and waste management, aligning with legal environmental requirements in Poland and the European Union. Women consistently rated these indicators higher than men. Consumer awareness in these areas may be influenced by regulations, especially considering the potential health hazards associated with chemicals and the emphasis on waste segregation in the country.
Regarding expectations of corporate responsibility for environmental impact, most respondents believed that companies should be responsible, with older age groups showing higher expectations. Surprisingly, the older individuals, particularly those aged 55 and over, expressed higher expectations for corporate environmental responsibility than the younger groups. This contradicts some findings suggesting that younger respondents generally have higher expectations regarding environmental responsibility.
The study explored the relationship between demographic variables. While a weak correlation was observed for age, level of education, household size, and financial situation, only age exhibited a significant correlation. The analysis revealed no significant impact of variables such as level of education, household size, and financial situation.
The exploratory factor analysis highlighted two main components influencing purchasing decisions—Sustainable Management and Materials and Wastes. The Material and Wastes component was considered more influential regarding environmental indicators affecting purchasing decisions, possibly due to its tangible and immediate environmental impact compared to management activities.
Author Contributions
Conceptualization, B.P., A.M.-F. and M.A.; data curation, B.P. and M.A.; formal analysis, B.P., A.M.-F. and M.A.; funding acquisition, B.P. and A.M.-F.; methodology, B.P., A.M.-F. and M.A.; project administration, B.P.; supervision, B.P. and A.M.-F.; validation, B.P. and A.M.-F.; visualization, B.P.; writing—original draft, B.P., A.M.-F. and M.A.; writing—review and editing, B.P., A.M.-F. and M.A. All authors have read and agreed to the published version of the manuscript.
Funding
This research has been supported by the National Centre for Research and Development (Poland) within the framework of project No. TANGO-V-A/0043/2021-00. The use of information technology improves the effectiveness of the Environmental Management System (EMS).
Institutional Review Board Statement
The study was conducted and approved by the Ethics Committee of Poznan University of Economics and Business (protocol code 12-2022 dated 31 March 2022, protocol code 16-2022 dated 22 April 2022, and protocol code 22-2022 dated 06 June 2022).
Informed Consent Statement
Informed consent was obtained from all subjects involved in the study.
Data Availability Statement
Dataset available upon request from the authors.
Conflicts of Interest
The authors declare no conflicts of interest.
References
- Ali, T.; Alam, A.; Ali, J. Factors affecting consumers’ purchase behaviour for health and wellness food products in an emerging market. Glob. Bus. Rev. 2021, 117, 151–168. [Google Scholar] [CrossRef]
- da Silva, T.F.; Conti-Silva, A.C. Preference mappings for gluten-free chocolate cookies: Sensory and physical characteristics. Nutr. Food Sci. 2016, 46, 374–387. [Google Scholar] [CrossRef]
- Lessa, K.; Zulueta, A.; Esteve, M.J.; Frigola, A. Study of consumer perception of healthy menus at restaurants. Food Qual. Prefer. 2017, 55, 102–106. [Google Scholar] [CrossRef]
- Shamal, S.; Mohan, B.C. Consumer behaviour in fortified food choice decisions in India. Nutr. Food Sci. 2017, 47, 229–239. [Google Scholar] [CrossRef]
- Baruk, A.I.; Bialoskurski, S. Wybrane determinanty wizerunku produktu spożywczego. Żywność. Nauka. Technologia. Jakość 2015, 3, 203–214. [Google Scholar]
- Azam, N.H.M.; Othman, N.; Musa, R.; Fatah, A.F.; Awal, A. Determinants of organic food purchase intention. In Proceedings of the ISBEIA 2012: IEEE Symposium on Business, Engineering and Industrial Applications, Bandung, Indonesia, 23–26 September 2012; pp. 748–753. [Google Scholar] [CrossRef]
- Hoek, A.C.; Pearson, D.; James, S.W.; Lawrence, M.A.; Friel, S. Healthy and environmentally sustainable food choices: Consumer responses to point-of-purchase actions. Food Qual. Prefer. 2017, 58, 94–106. [Google Scholar] [CrossRef]
- Cuong, D.T. The Relationship Between Product Quality, Brand Image, Purchase Decision, and Repurchase Intention. In Proceedings of the International Conference on Emerging Technologies and Intelligent Systems, Sanya, China, 20–22 January 2022; Volume 299. [Google Scholar]
- Saputri, A.; Guritno, A. The Effect of Product Quality, Brand Image, and Halal Labeling on Purchase Decisions with Purchase Intentions as Intervening Variables. In Proceedings of the Annual International Conference on Islamic Economics and Business (AICIEB), 25 November 2021. Volume 1, pp. 359–374. Available online: https://e-journal.uinsalatiga.ac.id/index.php/aicieb/article/view/36 (accessed on 14 January 2024).
- Arif, M.; Siregar, I.K. Purchase decision affects, price, product quality and word of mouth. Int. J. Econ. Technol. Soc. Sci. Inject. 2021, 2, 260–273. [Google Scholar] [CrossRef]
- Nur, A. Effect of Product Quality, Prices and Places On Purchase Decisions. J. Res. Bus. Econ. Educ. 2020, 2, 391–398. [Google Scholar]
- Kareklas, I.; Carlson, J.R.; Muehling, D.D. I eat organic for my benefit and yours: Egoistic and altruistic considerations for purchasing organic food and their implications for advertising strategists. J. Advert. 2014, 43, 18–32. [Google Scholar] [CrossRef]
- Gutkowska, K.; Ozimek, I. Wybrane Aspekty Zachowań Konsumentów na Rynku Żywności—Kryteria Różnicowania; Wydawnictwo SGGW: Warszawa, Poland, 2005. [Google Scholar]
- Barska, A. Kryteria wyboru produktów żywnościowych przez młodych konsumentów z Polski, Czech i Słowacji. Zagadnienia Ekon. Rolnej 2013, 4, 113–121. [Google Scholar]
- Annunziata, A.; Mariani, A. Consumer perception of sustainability attributes in organic and local food. Recent Pat. Food Nutr. Agric. 2018, 9, 87–96. [Google Scholar] [CrossRef]
- Kovacs, I.; Keresztes, E.R. Perceived consumer effectiveness and willingness to pay for credence product attributes of sustainable foods. Sustainability 2022, 14, 4338. [Google Scholar] [CrossRef]
- Goryńska-Goldmann, E.; Ratajczak, P. Świadomość żywieniowa a zachowania żywieniowe konsumentów. J. Agribus. Rural. Dev. 2010, 4, 41–48. [Google Scholar]
- Faber, I.; Rini, L.; Schouteten, J.J.; Bom Frøst, M.; De Steur, H.; Perez-Cueto, F.J.A. The mediating role of barriers and trust on the intentions to consume plant-based foods in Europe. Food Qual. Prefer. 2024, 114, 105101. [Google Scholar] [CrossRef]
- Byrareddy, V.M.; Islam, M.A.; Nguyen-Huy, T.; Slaughter, G. A systematic review of emerging environmental markets: Potential pathways to creating shared value for communities. Heliyon 2023, 9, e19754. [Google Scholar] [CrossRef]
- Bong Ko, S.; Jin, B. Predictors of purchase intention toward green apparel products: A cross-cultural investigation in the USA and China. J. Fash. Mark. Manag. Int. J. 2017, 21, 70–87. [Google Scholar] [CrossRef]
- Kumar, P.; Ghodeswar, B.M. Factors affecting consumers’ green product purchase decisions. Mark. Intell. Plan. 2015, 33, 330–347. [Google Scholar] [CrossRef]
- Maniatis, P. Investigating factors influencing consumer decision-making while choosing green products. J. Clean. Prod. 2016, 132, 215–228. [Google Scholar] [CrossRef]
- Annunziata, A.; Scarpato, D. Factors affecting consumer attitudes towards food products with sustainable attributes. Agric. Econ. 2014, 60, 353–363. [Google Scholar] [CrossRef]
- Canavari, M.; Coeroni, S. Consumer stated preferences for dairy products with carbon footprint labels in Italy. Agric. Food Econ. 2020, 8, 4. [Google Scholar] [CrossRef]
- Zhang, B.; Fu, Z.; Huang, J.; Wang, J.; Xu, S.; Zhang, L. Consumers’ perceptions, purchase intention, and willingness to pay a premium price for safe vegetables: A case study of Beijing, China. J. Clean. Prod. 2018, 197, 1498–1507. [Google Scholar] [CrossRef]
- Kuźniar, W.; Surmacz, T.; Wierzbiński, B. The Impact of Ecological Knowledge on Young Consumers’ Attitudes and Behaviours towards the Food Market. Sustainability 2021, 13, 1984. [Google Scholar] [CrossRef]
- Lee, H.J.; Hwang, J. The driving role of consumers’ perceived credence attributes in organic food purchase decisions: A comparison of two groups of consumers. Food Qual. Prefer. 2016, 54, 141–151. [Google Scholar] [CrossRef]
- Acampora, A.; Ruini, L.; Mattia, G.; Pratesi, C.A.; Lucchetti, M.C. Towards carbon neutrality in the agri-food sector: Drivers and barriers. Resour. Conserv. Recycl. 2023, 189, 106755. [Google Scholar] [CrossRef]
- Wang, J.; Zhuang, Z. A novel cluster based multi-index nonlinear ensemble framework for carbon price forecasting. Environ. Dev. Sustain. 2022, 25, 6225–6247. [Google Scholar] [CrossRef]
- Jaďuďová, J.; Badida, M.; Badidová, A.; Marková, I.; Ťahúňová, M.; Hroncová, E. Consumer behavior towards regional eco-labels in Slovakia. Sustainability 2020, 12, 5146. [Google Scholar] [CrossRef]
- Risitano, M.; Romano, R.; Rusciano, V.; Civero, G.; Scarpato, D. The impact of sustainability on marketing strategy and business performance: The case of Italian fisheries. Bus. Strat. Environ. 2022, 31, 1538–1551. [Google Scholar] [CrossRef]
- Mazurek-Łopacińska, K.; Sobocińska, M.; Krupowicz, J. Purchase Motives and Factors Shaping Consumer Behaviour on the Ecological Product Market (Poland Case Study). Sustainability 2022, 14, 15274. [Google Scholar] [CrossRef]
- Pham, T.H.; Nguyen, N.; Phan, T.T.H.; Nguyen, N.T. Evaluating the purchase behaviour of organic food by young consumers in an emerging market economy. J. Strateg. Mark. 2019, 27, 540–556. [Google Scholar] [CrossRef]
- Matuszak-Flejszman, A.; Paliwoda, B.; Banach, J.K. Factors influencing the environmental effectiveness of the dairy industry in Poland. Sci. Pap. Silesian Univ. Technol. Organ. Manag. Ser. 2023, 184, 275–297. [Google Scholar]
- Commission Decision (EU) 2017/1508 of 28 August 2017 on the reference document on best environmental management practice, sector environmental performance indicators and benchmarks of excellence for the food and beverage manufacturing sector under Regulation (EC) No 1221/2009 of the European Parliament and of the Council on the voluntary participation by organisations in a community eco-management and audit scheme (EMAS). Available online: https://eur-lex.europa.eu/legal-content/EN/ALL/?uri=CELEX:32017D1508 (accessed on 14 January 2024).
- Zarif Sagheb, M.; Ghasemi, B.; Nourbakhsh, S.K. Factors affecting purchase intention of foreign food products: An empirical study in the Iranian context. Br. Food J. 2020, 122, 1485–1504. [Google Scholar] [CrossRef]
- Moon, J.; Chadee, D.; Tikoo, S. Culture, product type, and price influences on consumer purchase intention to buy personalized products online. J. Bus. Res. 2008, 61, 31–39. [Google Scholar] [CrossRef]
- Nguyen, T.D.; Nguyen, T.T.M.; Barrett, N.J. Consumer ethnocentrism, cultural sensitivity, and intention to purchase local products—Evidence from Vietnam. J. Consum. Behav. 2008, 7, 88–100. [Google Scholar] [CrossRef]
- Parkvithee, N.; Miranda, M.J. The interaction effect of country-of-origin, brand equity and purchase involvement on consumer purchase intentions of clothing labels. Asia Pac. J. Mark. Logist. 2012, 24, 7–22. [Google Scholar] [CrossRef]
- Kim, N.; Chun, E.; Ko, E. Country of origin effects on brand image, brand evaluation, and purchase intention: A closer look at Seoul, New York, and Paris fashion collection. Int. Mark. Rev. 2017, 34, 254–271. [Google Scholar] [CrossRef]
- Chen, C.C.; Hsiao, K.L.; Wu, S.J. Purchase intention in social commerce: An empirical examination of perceived value and social awareness. Libr. Hi Tech 2018, 36, 583–604. [Google Scholar] [CrossRef]
- Chee Tahir, A.; Darton, R.C. The Process Analysis Method of selecting indicators to quantify the sustainability performance of a business operation. J. Clean. Prod. 2010, 18, 1598–1607. [Google Scholar] [CrossRef]
- Turcu, C. Re-thinking sustainability indicators: Local perspectives of urban sustainability. J. Environ. Plann. Manag. 2013, 56, 695–719. [Google Scholar] [CrossRef]
- Lähtinen, K.; Myllyviita, T.; Leskinen, P.; Pitkänen, S.K. A systematic literature review on indicators to assess local sustainability of forest energy production. Renew. Sustain. Energy Rev. 2014, 40, 1202–1216. [Google Scholar] [CrossRef]
- Feil, A.A.; do Amaral, C.C.; Walter, E.; Bagatini, C.A.; Schreiber, D.; Maehler, A.E. Set of sustainability indicators for the dairy industry. Environ. Sci. Pollut. Res. 2023, 30, 52982–52996. [Google Scholar] [CrossRef]
- Antonopoulos, M.; Canfora, I.S.; Gaudillat, P. Best Environmental Management Practice for the Food and Beverage Manufacturing Sector; Publications Office of the European Union: Luxembourg, 2018. [Google Scholar] [CrossRef]
- ISO 14031:2021; Environmental Management—Environmental Performance Evaluation—Guidelines. ISO: Geneva, Switzerland, 2021.
- Dancey, C.P.; Reidy, J. Statistics Without Maths for Psychology; Pearson/Prentice Hall: Old Bridge, NJ, USA, 2007. [Google Scholar]
- Wieczorkowska, G.; Wierzbiński, J. Statystyka: Od Teorii do Praktyki; Statistics: From the Theory to Practice; Wydawnictwo Naukowe Scholar: Warszawa, Poland, 2011. (In Polish) [Google Scholar]
- Churchill, G.A. Badania Marketingowe: Podstawy Metodologiczne; Wydaw. Naukowe PWN: Warszawa, Poland, 2002. [Google Scholar]
- Makalarska, A. Statystyczna Analiza Danych Wspomagana Programem SPSS; SPSS Polska: Kraków, Poland, 2005. [Google Scholar]
- Walesiak, M.; Bąk, A. Wykorzystanie analizy czynnikowej w badaniach marektingowych. Badania Oper. 1997, 1, 75–87. [Google Scholar]
- Jánská, M.; Žambochová, M.; Kita, P. The influence of Slovak consumer lifestyle on purchasing behaviour in the consumption of organic food. Br. Food J. 2023, 125, 3028–3049. [Google Scholar] [CrossRef]
- Wandel, M.; Bugge, A. Environmental concern in consumer evaluation of food quality. Food Qual. Prefer. 1997, 8, 19–26. [Google Scholar] [CrossRef]
- Lea, E.; Worsley, A. Australian consumers’ food-related environmental beliefs and behaviours. Appetite 2008, 50, 207–214. [Google Scholar] [CrossRef]
- Wansink, B. Environmental factors that increase the food intake and consumption volume of unknowing consumers. Annu. Rev. Nutr. 2004, 24, 455–479. [Google Scholar] [CrossRef]
- Bergström, K.; Solér, C.; Shanahan, H. Professional food purchasers’ practice in using environmental information. Br. Food J. 2005, 107, 335–351. [Google Scholar] [CrossRef]
- Grankvist, G.; Biel, A. The impact of environmental information on professional purchasers’ choice of products. Bus. Strategy Environ. 2006, 16, 421–429. [Google Scholar] [CrossRef]
- Barker, M.; Wong, F.; Russell, J. Food Purchasing Decisions and Environmental Ideology: An Exploratory Survey of UK Shoppers. Sustainability 2019, 11, 6279. [Google Scholar] [CrossRef]
- Clark, C.E. Do Consumers See Your Business as a Force for Good? MIT Sloan Management Review. 26 July 2023. Available online: https://sloanreview.mit.edu/article/do-consumers-see-your-business-as-a-force-for-good/ (accessed on 14 January 2024).
- Pieters, L.; Cascone, J.; Rogers, S.; Pankratz, D.; Waelter, A. Green Products Come of Age: Expectations of Sustainable Products Are Rising, But Consumers Are Likely to Reward Brands That Deliver. Deloitte Insights. 2023. Available online: https://www2.deloitte.com/us/en/insights/industry/retail-distribution/consumer-behavior-trends-state-of-the-consumer-tracker/sustainable-products-customer-expectations.html (accessed on 14 January 2024).
- Zhao, X.; An, H.-S. Research on the Mechanism of Heterogeneous Corporate Environmental Responsibility in Z-Generation Consumers’ Sustainable Purchase Intention. Sustainability 2023, 15, 10318. [Google Scholar] [CrossRef]
- Su, C.-H.; Tsai, C.-H.; Chen, M.-H.; Lv, W.Q. Sustainable Food Market Generation Z Consumer Segments. Sustainability 2019, 11, 3607. [Google Scholar] [CrossRef]
- Ricciuto, L.; Tarasuk, V.; Yatchew, A. Socio-demographic influences on food purchasing among Canadian households. Eur. J. Clin. Nutr. 2006, 60, 778–790. [Google Scholar] [CrossRef]
- Turrell, G.; Hewitt, B.; Patterson, C.; Oldenburg, B. Measuring socio-economic position in dietary research: Is choice of socio-economic indicator important? Public Health Nutr. 2003, 6, 191–200. [Google Scholar] [CrossRef]
Disclaimer/Publisher’s Note: The statements, opinions and data contained in all publications are solely those of the individual author(s) and contributor(s) and not of MDPI and/or the editor(s). MDPI and/or the editor(s) disclaim responsibility for any injury to people or property resulting from any ideas, methods, instructions or products referred to in the content. |
© 2024 by the authors. Licensee MDPI, Basel, Switzerland. This article is an open access article distributed under the terms and conditions of the Creative Commons Attribution (CC BY) license (https://creativecommons.org/licenses/by/4.0/).