A Review of the Effects of Urban and Green Space Forms on the Carbon Budget Using a Landscape Sustainability Framework


Abstract
:1. Introduction
2. Carbon Budget Analysis Framework Based on Landscape Sustainability Science
2.1. Influence of Urban and Green Space Forms on the Carbon Budget
2.2. Shortcomings of Existing Studies
- Despite substantial differences between urban and green space forms, a complex relationship exists between their effects on emission reduction and carbon sink increases [28,29]. Effective urban spatial planning involves the analysis of the interaction between urban form and land use, and appropriate green space planning must consider urban form indicators, which are often intertwined. However, most existing studies analyzed urban or green space indicators separately; therefore, we systematically review and analyze studies investigating the influence of the two factors on the carbon budget.
- Existing studies did not sufficiently consider sustainability for balancing the carbon budget. Limiting urban construction or expanding green spaces does not achieve a carbon budget balance without affecting human welfare and development. The impact of landscape pattern optimization on urban development should not be underestimated. For example, urban green space optimization improves urban development because of environmental optimization. However, there are also problems in landscape pattern optimization. Although the optimization can reduce carbon emissions, an excessive emphasis on the integrity and scale of green space during planning squeezes the space of urban construction [27,30,31]. Research on the effect of landscape planning on the carbon budget can be improved by considering landscape sustainability and comprehensively analyzing studies on human development and biodiversity conservation.
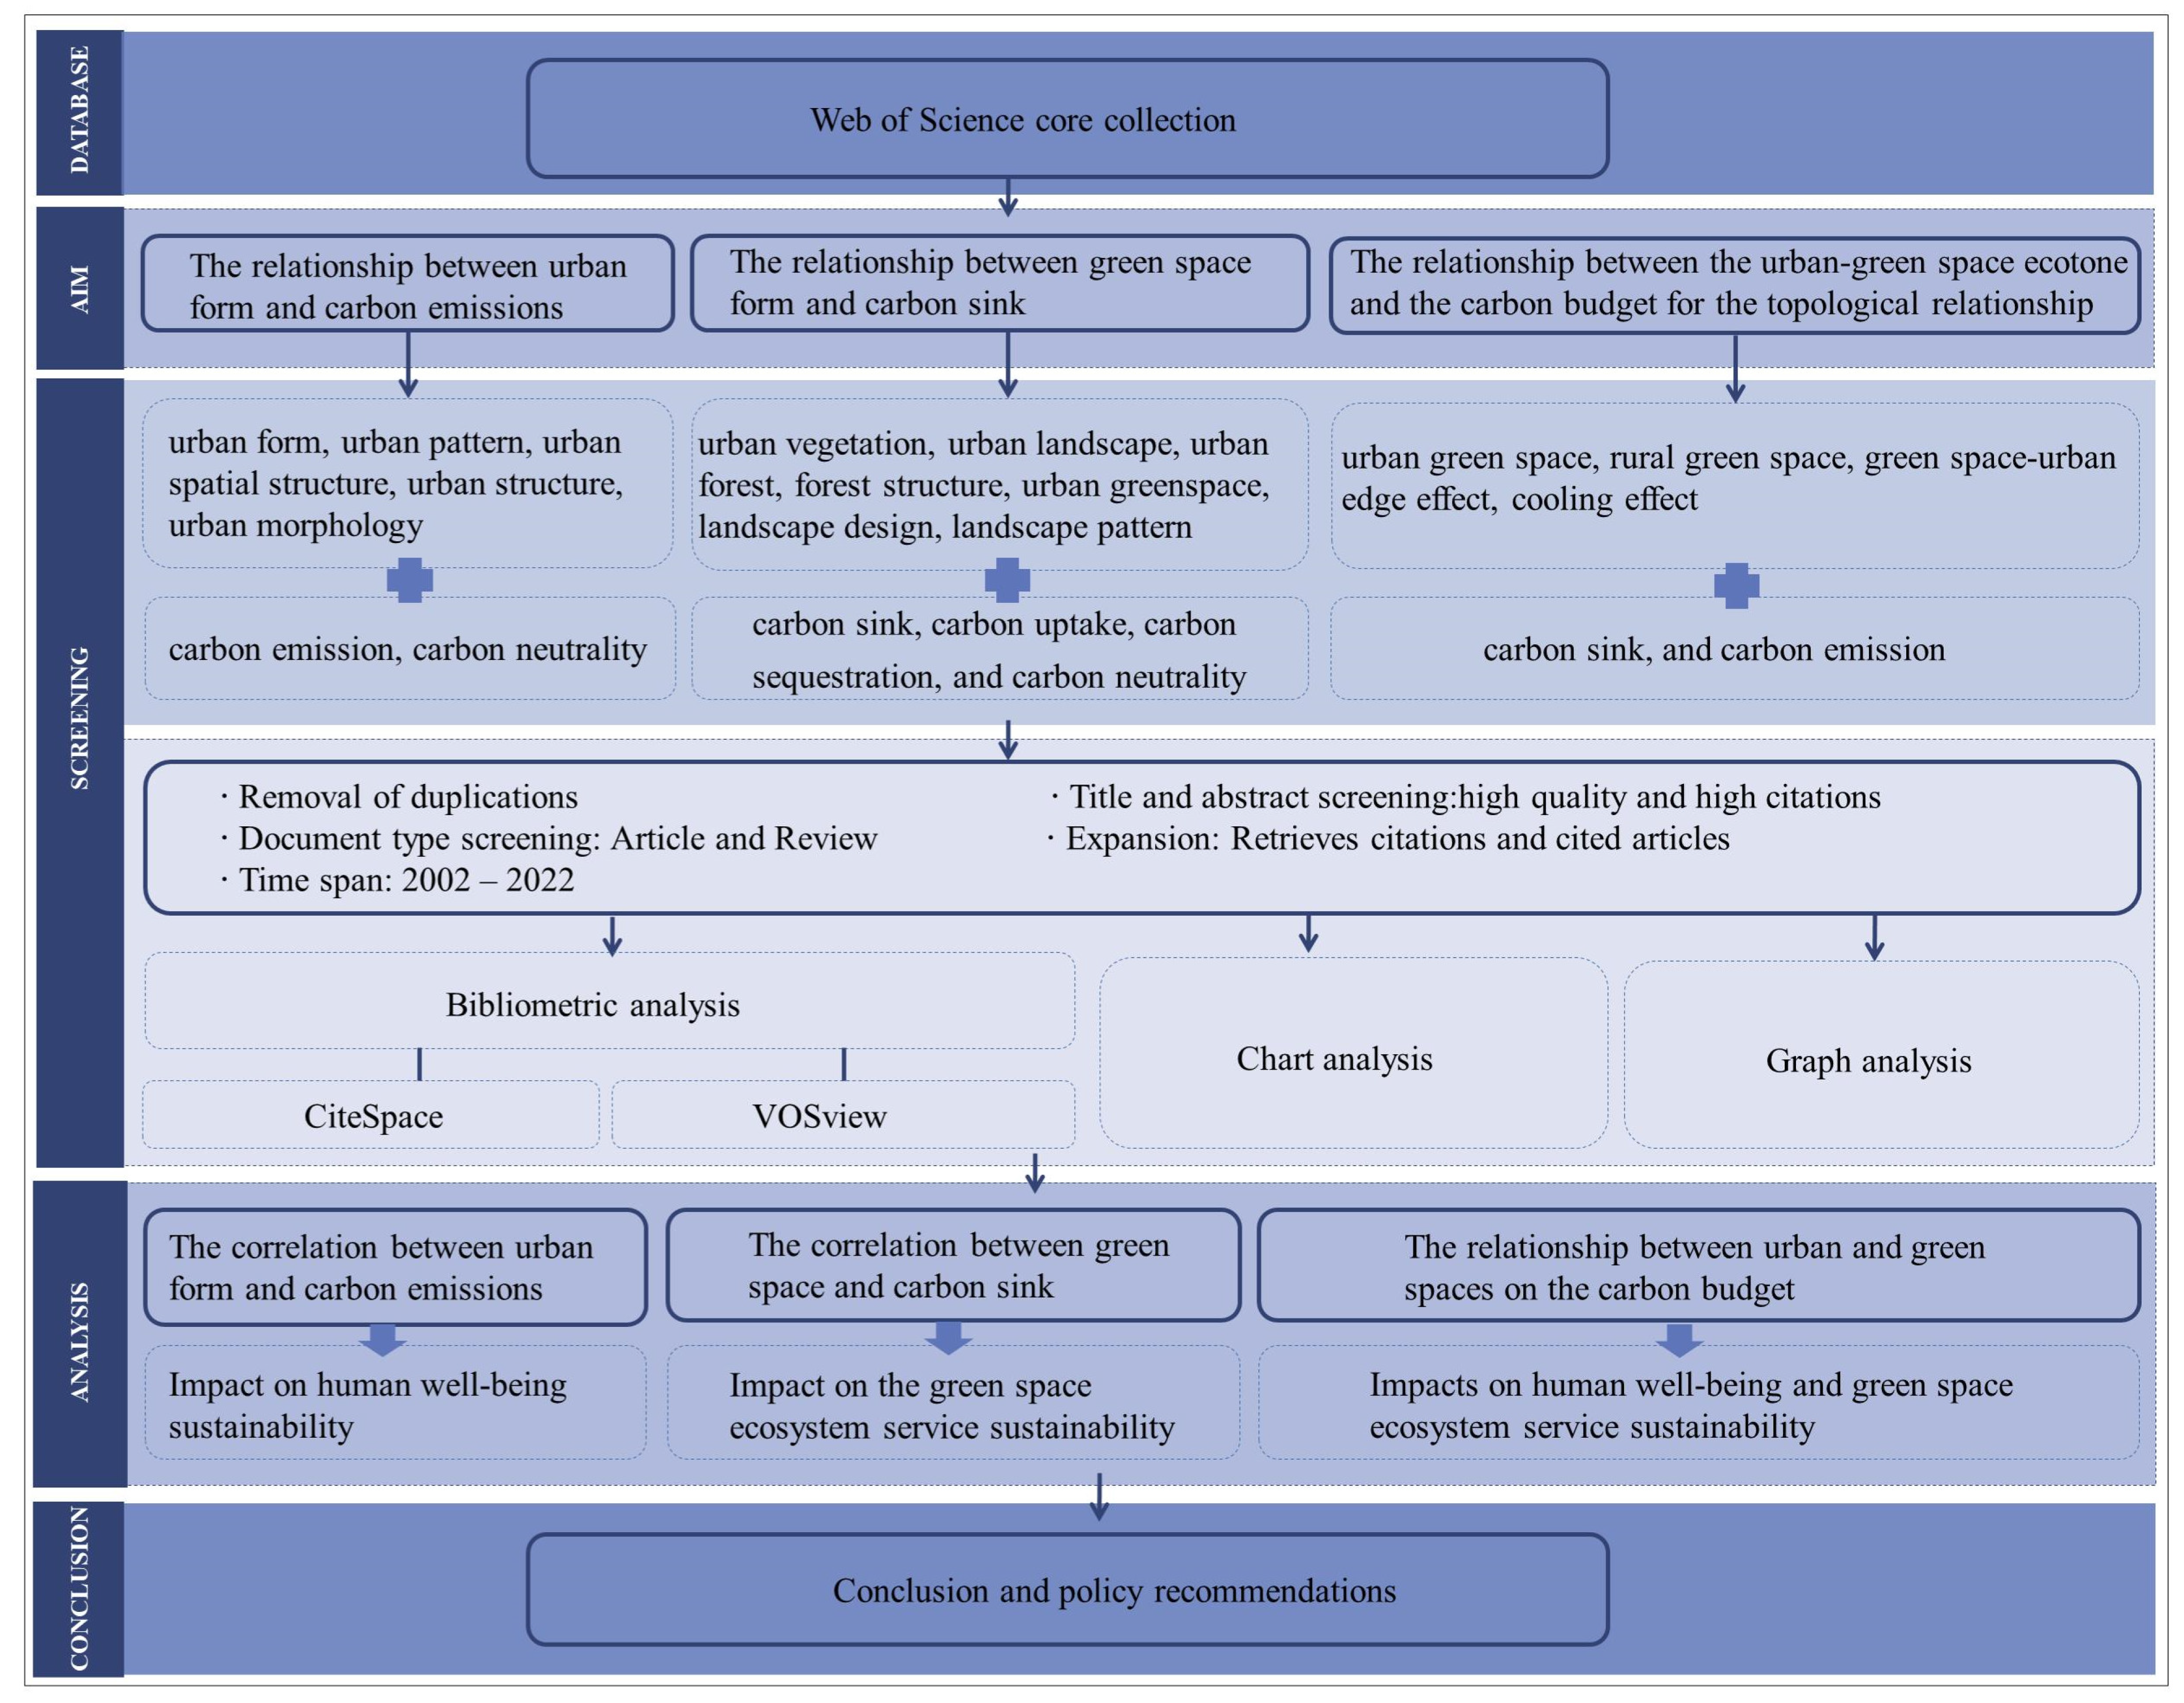
3. Literature Selection Method
- We searched the most authoritative database, Web of Science, due to the interdisciplinary nature of this study. The search terms (topic words) regarding the relationship between urban form and carbon emissions were “#1:TS = urban form, urban pattern, urban spatial structure, urban structure, urban morphology” and “#2:TS = carbon emission, carbon neutrality”. The search terms (topic words) for the relationship between green space forms and carbon sink were “#1:TS = urban vegetation, urban landscape, urban forest, forest structure, urban greenspace, landscape design, landscape pattern” and “#2:TS = carbon sink, carbon uptake, carbon sequestration, and carbon neutrality.” The search terms (topic words) regarding the relationship between the carbon budget and the urban–green space ecotonal relationship included urban green space, rural green space, green space–urban edge effect, cooling effect, carbon sink, and carbon emission. We prioritized articles published in core journals and checked titles, abstracts, and subject headings to remove publications irrelevant to the study. We screened the records to exclude duplicates and irrelevant documents. Finally, we reviewed the references cited in the articles to extract and integrate the necessary information.
- We narrowed the preliminary search results by selecting articles matching our research objectives. The first concern was the academic quality of the articles; therefore, we focused on peer-reviewed articles published in academic journals. Second, we selected empirical studies investigating the correlation between carbon emissions and urban form indicators, carbon sinks, and green space form indicators, as well as the carbon budget and the interaction indicators between urban and green spaces. We focused on the following contents consistent with the theme of our review: the research field, urban planning indicators, carbon dioxide emissions, carbon sources, green space planning indicators, carbon sinks (capacity), interactions between urban and green space landscape planning, research objectives, research methods, and research results.
- We evaluated the degree of landscape sustainability in the publications based on optimized urban planning, green space landscape design, and the interaction between urban and green spaces. We tabulated the search results of the second step and the sustainable methods and systematically analyzed them. In addition, the potential relationship between the influencing indicators and their mechanisms was analyzed.
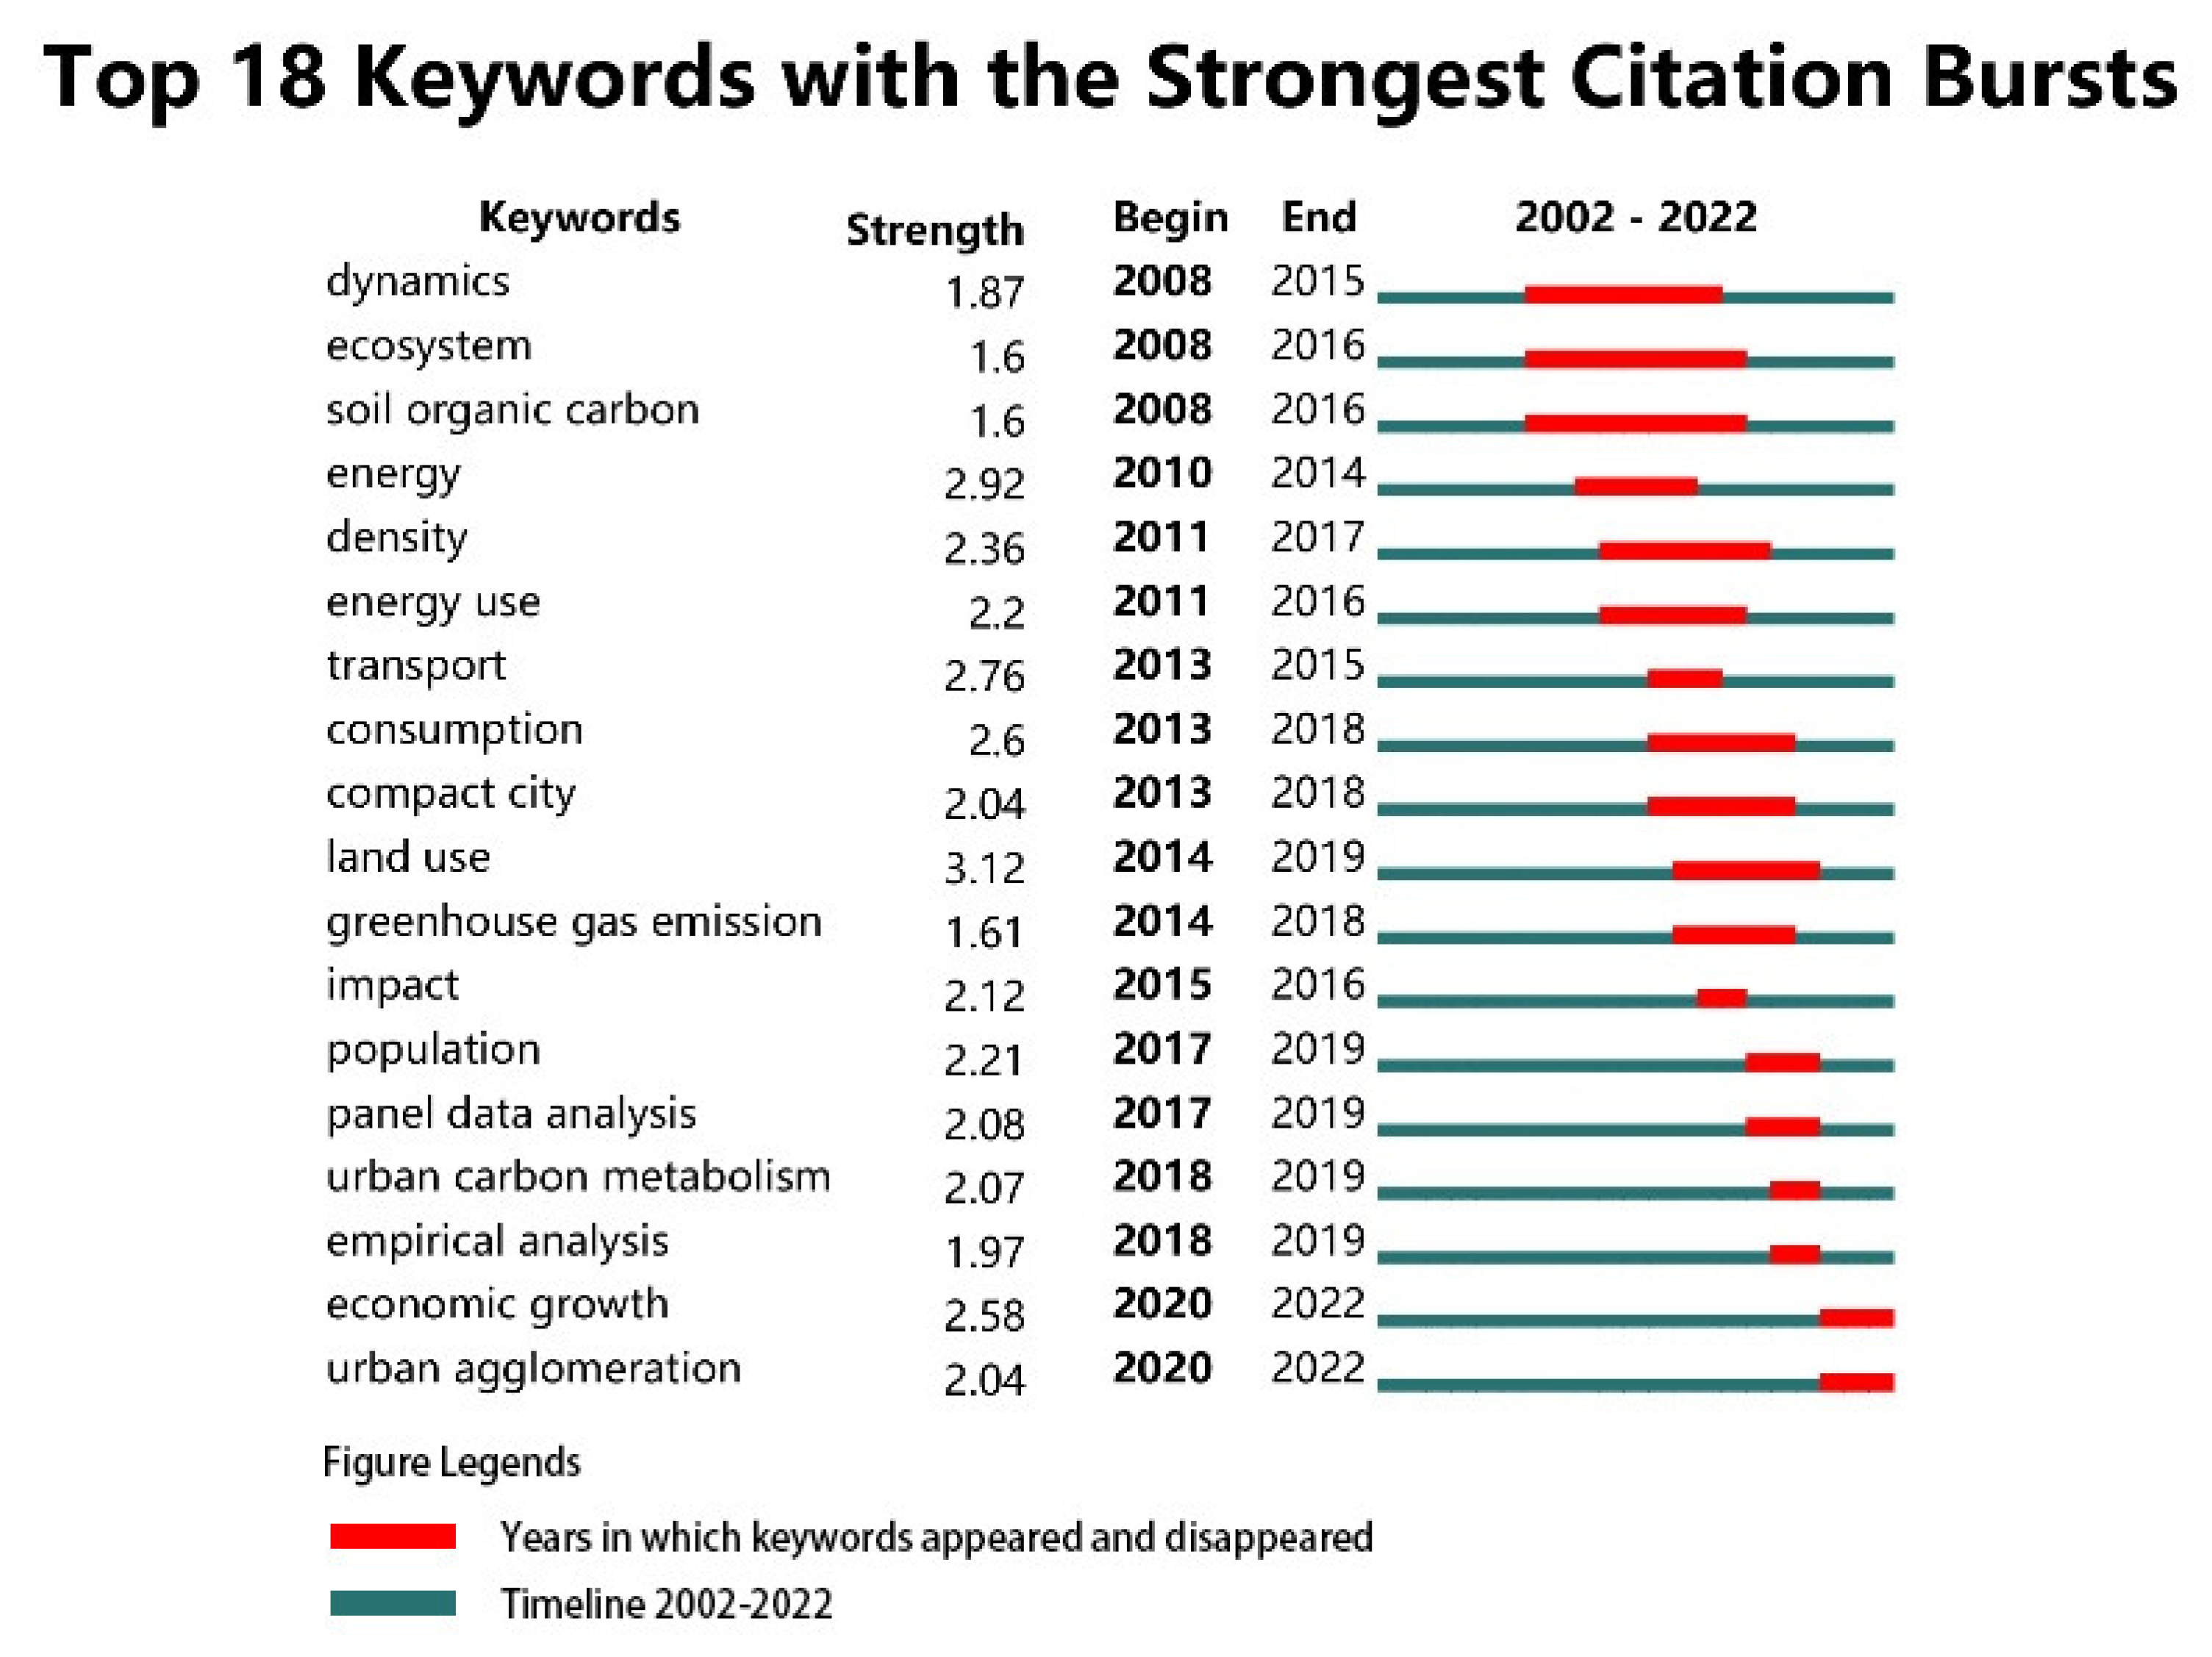
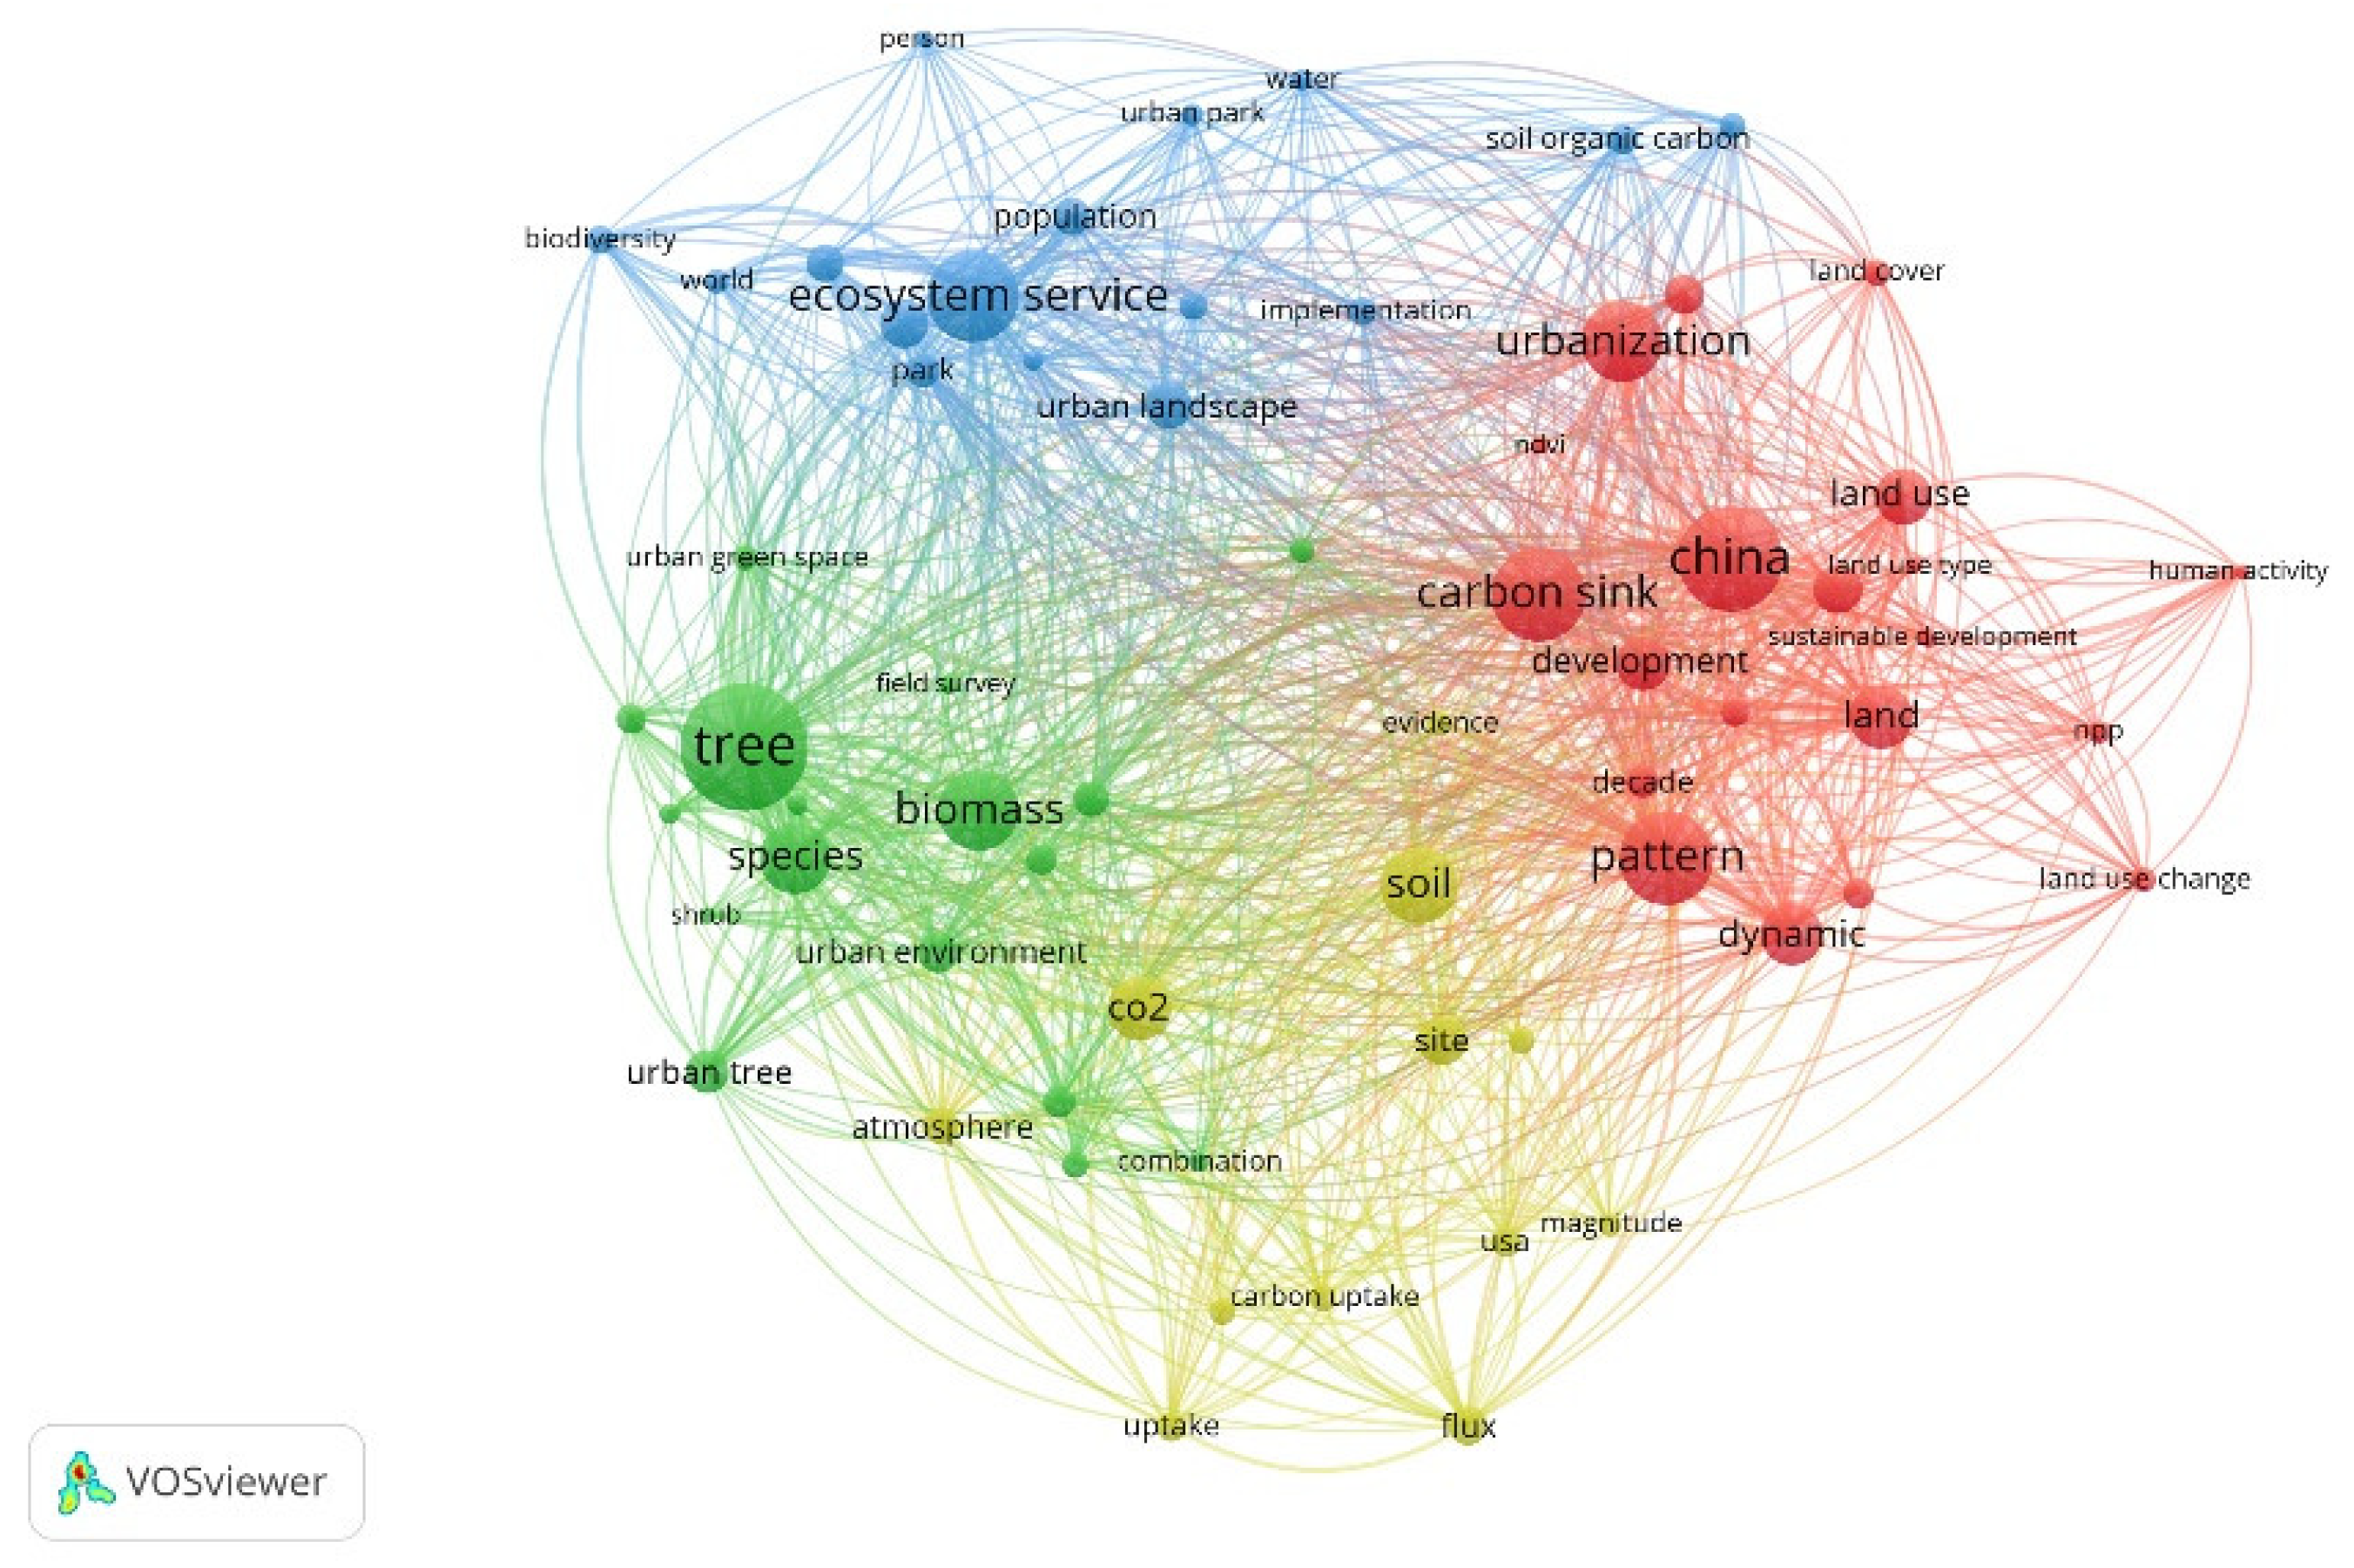
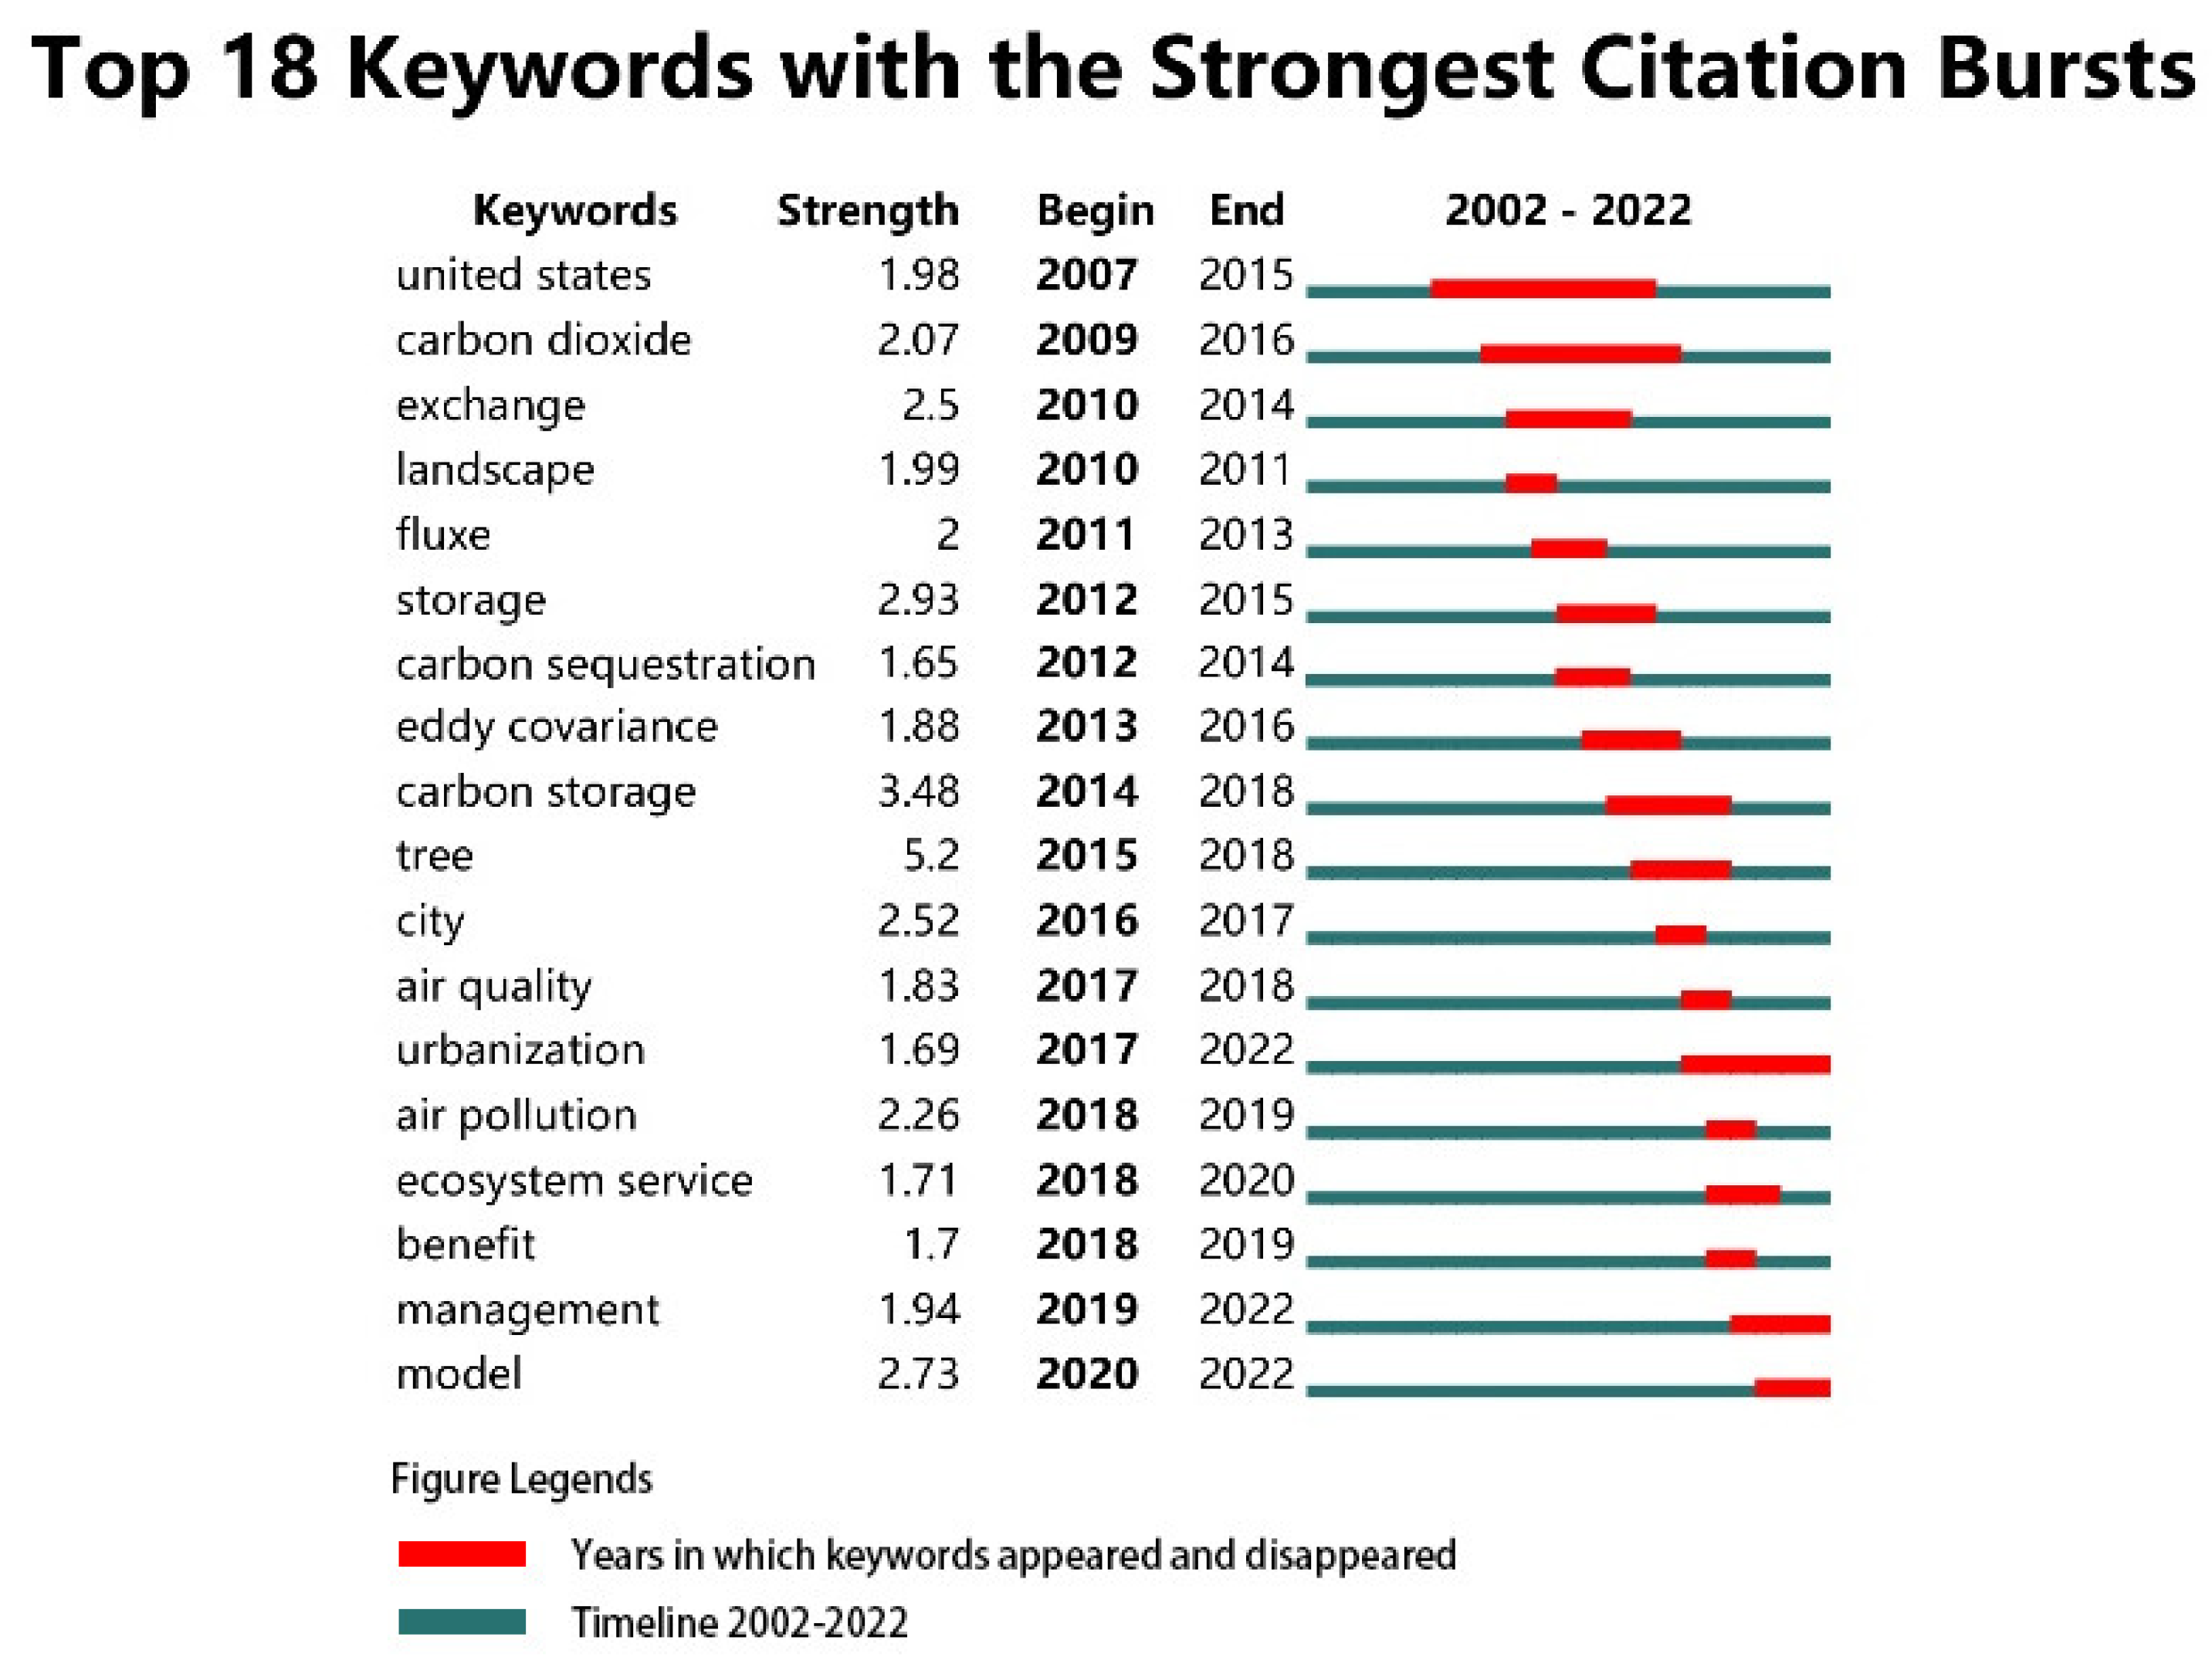
- We employed bibliometric analysis, which is a quantitative research technique that uses textual data and indicators to determine the characteristics and trends of a topic or study. We used VOSviewer and CiteSpace for bibliometric analysis. Citespace and Vosview were used to process the publications and visualize the results. After analyzing the literature, we used Citespace to generate knowledge maps to assess and visualize key articles and research interests in urban form, carbon emissions, green space form, and carbon sinks.
4. Results
4.1. Impacts of Urban Form Indicators on Carbon Emissions
4.1.1. Regional-Level Studies at or above the Municipal Level
4.1.2. Landscape-Level Studies at the City Level
4.2. Influence of Green Space Forms on Carbon Sink
4.2.1. Regional-Level Studies of Large, Contiguous Green Spaces
4.2.2. Landscape-Level Studies of Small Green Patches
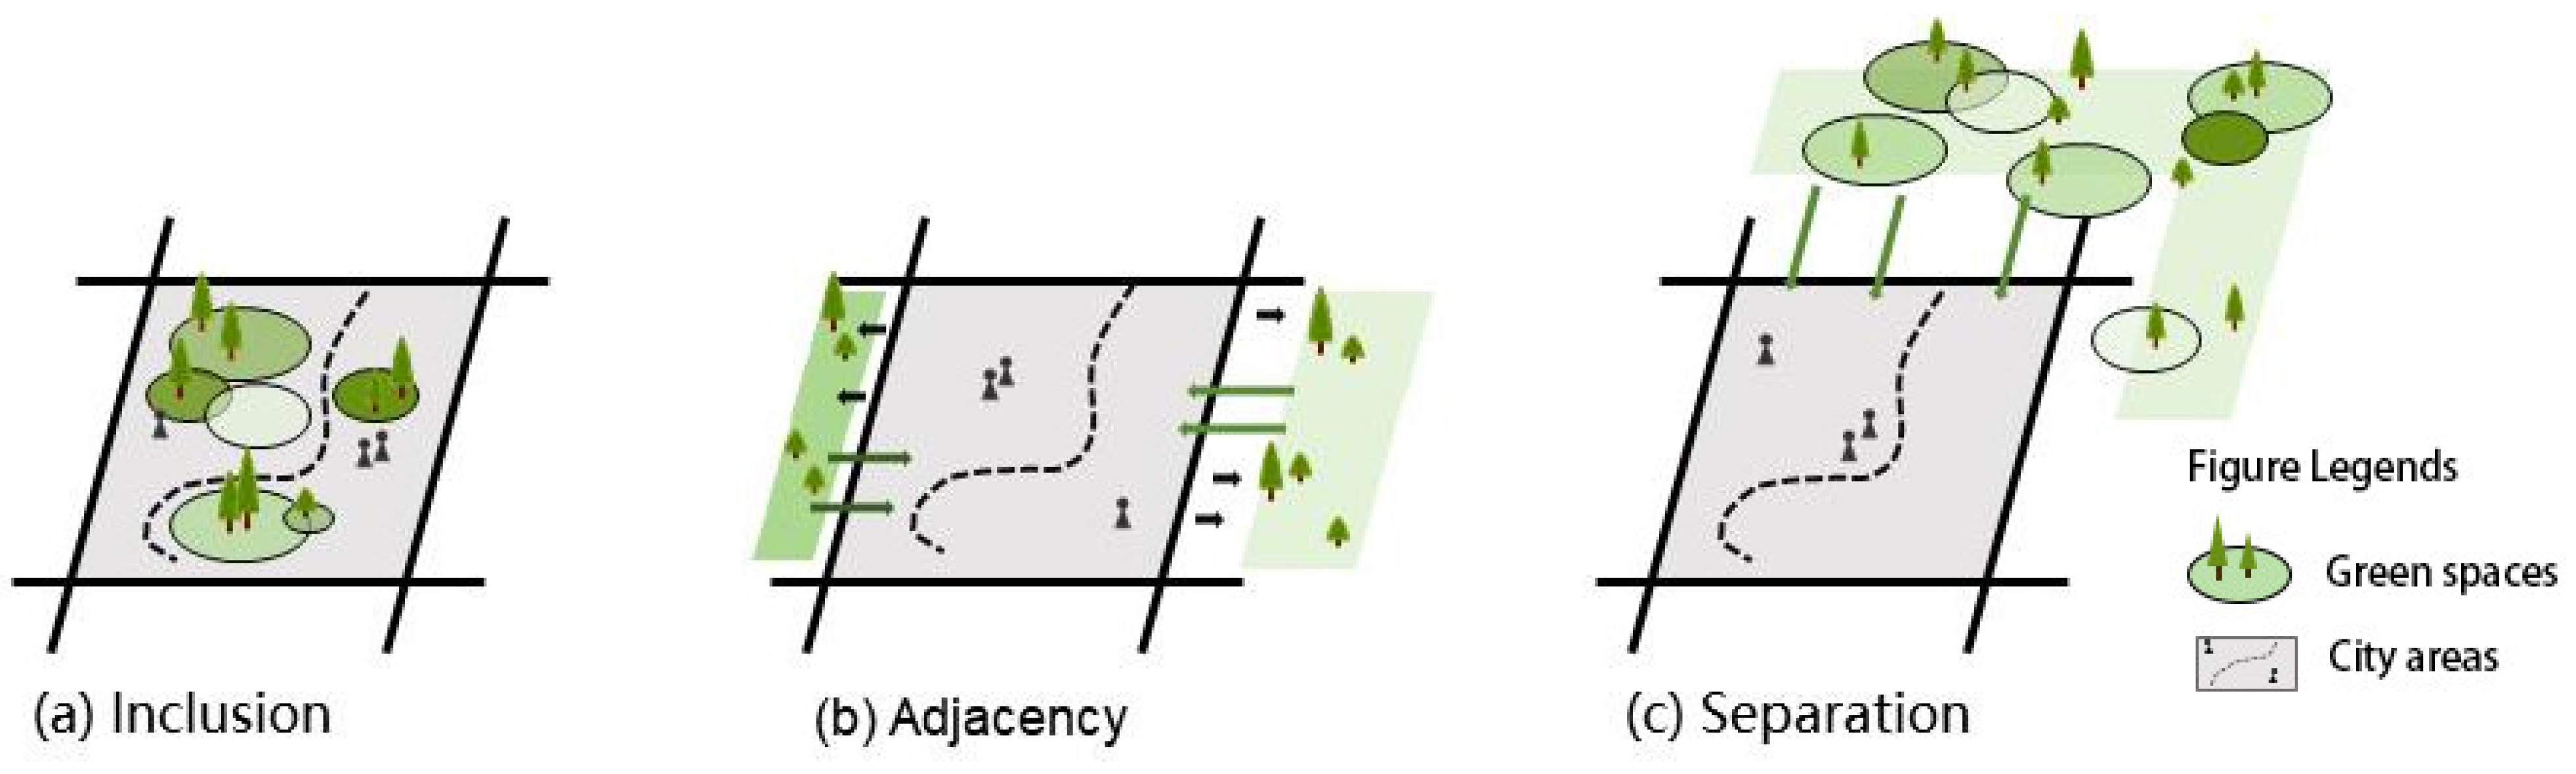
4.3. Influence of Topological Relationship between Urban and Green Spaces on the Carbon Budget
4.3.1. Regional-Level Studies of the Urban–Large Green Space Ecotonal Relationship
4.3.2. Landscape-Level Studies of the Urban–Small Green Space Ecotone
5. Discussion
5.1. Urban Landscape Design
- (1)
- Improvements in urban patch shape complexity, land use, and traffic connectivity can reduce carbon emissions and ensure sustainability.
- (2)
- Although compact cities and centralized structures are hot topics in sustainability studies, it is unclear whether they reduce carbon emissions.
5.2. Green Landscape Design
- (1)
- Appropriate landscape richness can increase the carbon sink capacity and sustainability.
- (2)
- Although green patch complexity, compact form, and stand density are hot topics in sustainability studies, it is unclear whether these indicators improve the carbon sink level.
5.3. Urban–Green Space Ecotone Design
6. Conclusions
Author Contributions
Funding
Conflicts of Interest
References
- Grimm, N.B.; Faeth, S.H.; Golubiewski, N.E.; Redman, C.L.; Wu, J.; Bai, X.; Briggs, J.M. Global change and the ecology of cities. Science 2008, 319, 756–760. [Google Scholar] [CrossRef]
- Solomon, S.; Plattner, G.-K.; Knutti, R.; Friedlingstein, P. Irreversible climate change due to carbon dioxide emissions. Proc. Natl. Acad. Sci. USA 2009, 106, 1704–1709. [Google Scholar] [CrossRef]
- Cai, W.; Li, K.; Liao, H.; Wang, H.; Wu, L. Weather conditions conducive to Beijing severe haze more frequent under climate change. Nat. Clim. Chang. 2017, 7, 257–262. [Google Scholar] [CrossRef]
- Gornitz, V.; Oppenheimer, M.; Kopp, R.; Horton, R.; Orton, P.; Rosenzweig, C.; Solecki, W.; Patrick, L. Enhancing New York City’s resilience to sea level rise and increased coastal flooding. Urban Clim. 2020, 33, 100654. [Google Scholar] [CrossRef]
- Li, B.; Gasser, T.; Ciais, P.; Piao, S.; Tao, S.; Balkanski, Y.; Hauglustaine, D.; Boisier, J.-P.; Chen, Z.; Huang, M. The contribution of China’s emissions to global climate forcing. Nature 2016, 531, 357–361. [Google Scholar] [CrossRef] [PubMed]
- Zhao, P.; Zhang, M. The impact of urbanisation on energy consumption: A 30-year review in China. Urban Clim. 2018, 24, 940–953. [Google Scholar] [CrossRef]
- IEA. CO2 Emissions in 2022, IEA, Paris. 2023. Available online: https://www.iea.org/reports/co2-emissions-in-2022 (accessed on 2 June 2023).
- Zhao, R.; Huang, X.; Zhong, T.; Chuai, X. Carbon effect evaluation and low-carbon optimization of regional land use. Trans. Chin. Soc. Agric. Eng. 2013, 29, 220–229. [Google Scholar] [CrossRef]
- Harris, N.L.; Gibbs, D.A.; Baccini, A.; Birdsey, R.A.; De Bruin, S.; Farina, M.; Fatoyinbo, L.; Hansen, M.C.; Herold, M.; Houghton, R.A. Global maps of twenty-first century forest carbon fluxes. Nat. Clim. Chang. 2021, 11, 234–240. [Google Scholar] [CrossRef]
- Melica, G.; Treville, A.; Franco De Los Rios, C.; Baldi, M.; Monforti-Ferrario, F.; Palermo, V.; Ulpiani, G.; Ortega Hortelano, A.; Lo Vullo, E.; Barbosa, P.; et al. Covenant of Mayors: 2021 Assessment; Publications Office of the European Union: Luxembourg, 2022. [Google Scholar]
- Ciardini, V.; Caporaso, L.; Sozzi, R.; Petenko, I.; Bolignano, A.; Morelli, M.; Melas, D.; Argentini, S. Interconnections of the urban heat island with the spatial and temporal micrometeorological variability in Rome. Urban Clim. 2019, 29, 100493. [Google Scholar] [CrossRef]
- Dian, C.; Pongrácz, R.; Dezső, Z.; Bartholy, J. Annual and monthly analysis of surface urban heat island intensity with respect to the local climate zones in Budapest. Urban Clim. 2020, 31, 100573. [Google Scholar] [CrossRef]
- Roxon, J.; Ulm, F.-J.; Pellenq, R.-M. Urban heat island impact on state residential energy cost and CO2 emissions in the United States. Urban Clim. 2020, 31, 100546. [Google Scholar] [CrossRef]
- Cao, X.; Yang, W. Examining the effects of the built environment and residential self-selection on commuting trips and the related CO2 emissions: An empirical study in Guangzhou, China. Transp. Res. Part D Transp. Environ. 2017, 52, 480–494. [Google Scholar] [CrossRef]
- Yang, W.; Cao, X. Examining the effects of the neighborhood built environment on CO2 emissions from different residential trip purposes: A case study in Guangzhou, China. Cities 2018, 81, 24–34. [Google Scholar] [CrossRef]
- Yang, W.; Zhou, S. Using decision tree analysis to identify the determinants of residents’ CO2 emissions from different types of trips: A case study of Guangzhou, China. J. Clean. Prod. 2020, 277, 124071. [Google Scholar] [CrossRef]
- Sharifi, E.; Larbi, M.; Omrany, H.; Boland, J. Climate change adaptation and carbon emissions in green urban spaces: Case study of Adelaide. J. Clean. Prod. 2020, 254, 120035. [Google Scholar] [CrossRef]
- Yan, L.; Jia, W.; Zhao, S. The Cooling Effect of Urban Green Spaces in Metacities: A Case Study of Beijing, China’s Capital. Remote Sens. 2021, 13, 4601. [Google Scholar] [CrossRef]
- Gao, Y.; Liu, K. Planning for diverse slow activities of Shenzhen Greenway. Planners 2019, 35, 39–45. [Google Scholar] [CrossRef]
- Li, X. Thinking on the Urban Development Path Under Carbon Emission Peak and Carbon Neutrality Strategic Goal. Urban Dev. Stud. 2022, 29, 1–11. [Google Scholar] [CrossRef]
- Zhang, H.; Peng, J.; Wang, R.; Zhang, J.; Yu, D. Spatial planning factors that influence CO2 emissions: A systematic literature review. Urban Clim. 2021, 36, 100809. [Google Scholar] [CrossRef]
- Dong, J.; Jiang, H.; Gu, T.; Liu, Y.; Peng, J. Sustainable landscape pattern: A landscape approach to serving spatial planning. Landsc. Ecol. 2022, 37, 31–42. [Google Scholar] [CrossRef]
- Wu, J. Landscape sustainability science (II): Core questions and key approaches. Landsc. Ecol. 2021, 36, 2453–2485. [Google Scholar] [CrossRef]
- Wu, J. Landscape sustainability science: Ecosystem services and human well-being in changing landscapes. Landsc. Ecol. 2013, 28, 999–1023. [Google Scholar] [CrossRef]
- Liu, M. Significance, Foundation, Challenge and Policy Focus of Realizing the Goal of “Carbon Neutralization” in China. Price Theory Pract. 2021, 440, 8–13. [Google Scholar] [CrossRef]
- Meadows, D.H.; Meadows, D. The history and conclusions of The Limits to Growth. Syst. Dyn. Rev. J. Syst. Dyn. Soc. 2007, 23, 191–197. [Google Scholar] [CrossRef]
- Ma, M.; Jin, Y. What if Beijing had enforced the 1st or 2nd greenbelt?–Analyses from an economic perspective. Landsc. Urban Plan. 2019, 182, 79–91. [Google Scholar] [CrossRef]
- Moindjie, I.-A.; Pinsard, C.; Accatino, F.; Chakir, R. Interactions between ecosystem services and land use in France: A spatial statistical analysis. Front. Environ. Sci. 2022, 10, 954655. [Google Scholar] [CrossRef]
- Pan, H.; Zhang, L.; Cong, C.; Deal, B.; Wang, Y. A dynamic and spatially explicit modeling approach to identify the ecosystem service implications of complex urban systems interactions. Ecol. Indic. 2019, 102, 426–436. [Google Scholar] [CrossRef]
- Jun, M.-J. The effects of Seoul’s greenbelt on the spatial distribution of population and employment, and on the real estate market. Ann. Reg. Sci. 2012, 49, 619–642. [Google Scholar] [CrossRef]
- Siedentop, S.; Fina, S.; Krehl, A. Greenbelts in Germany’s regional plans—An effective growth management policy? Landsc. Urban Plan. 2016, 145, 71–82. [Google Scholar] [CrossRef]
- Wu, J. Landscape ecology, cross-disciplinarity, and sustainability science. Landsc. Ecol. 2006, 21, 1–4. [Google Scholar] [CrossRef]
- Erker, T.; Townsend, P.A. Trees in cool climate cities may increase atmospheric carbon by altering building energy use. Environ. Res. Commun. 2019, 1, 081003. [Google Scholar] [CrossRef]
- Pregitzer, C.C.; Hanna, C.; Charlop-Powers, S.; Bradford, M.A. Estimating carbon storage in urban forests of New York City. Urban Ecosyst. 2022, 25, 617–631. [Google Scholar] [CrossRef]
- Cheng, Z.; Hu, X. The effects of urbanization and urban sprawl on CO2 emissions in China. Environ. Dev. Sustain. 2022, 25, 1792–1808. [Google Scholar] [CrossRef]
- Ewing, R.; Rong, F. The impact of urban form on US residential energy use. Hous. Policy Debate 2008, 19, 1–30. [Google Scholar] [CrossRef]
- Falahatkar, S.; Rezaei, F. Towards low carbon cities: Spatio-temporal dynamics of urban form and carbon dioxide emissions. Remote Sens. Appl. Soc. Environ. 2020, 18, 100317. [Google Scholar] [CrossRef]
- Mohajeri, N.; Gudmundsson, A.; French, J.R. CO2 emissions in relation to street-network configuration and city size. Transp. Res. Part D: Transp. Environ. 2015, 35, 116–129. [Google Scholar] [CrossRef]
- Song, W.; Zhang, X.; An, K.; Yang, T.; Li, H.; Wang, C. Quantifying the spillover elasticities of urban built environment configurations on the adjacent traffic CO2 emissions in mainland China. Appl. Energy 2021, 283, 116271. [Google Scholar] [CrossRef]
- Liu, Y.; Huang, L.; Onstein, E. How do age structure and urban form influence household CO2 emissions in road transport? Evidence from municipalities in Norway in 2009, 2011 and 2013. J. Clean. Prod. 2020, 265, 121771. [Google Scholar] [CrossRef]
- Wang, S.; Liu, X.; Zhou, C.; Hu, J.; Ou, J. Examining the impacts of socioeconomic factors, urban form, and transportation networks on CO2 emissions in China’s megacities. Appl. Energy 2017, 185, 189–200. [Google Scholar] [CrossRef]
- Yi, Y.; Ma, S.; Guan, W.; Li, K. An empirical study on the relationship between urban spatial form and CO2 in Chinese cities. Sustainability 2017, 9, 672. [Google Scholar] [CrossRef]
- Crawford, T.W. Urban Form as a Technological Driver of Carbon Dioxide Emission: A Structural Human Ecology Analysis of Onroad and Residential Sectors in the Conterminous US. Sustainability 2020, 12, 7801. [Google Scholar] [CrossRef]
- Guo, R.; Leng, H.; Yuan, Q.; Song, S. Impact of Urban Form on CO2 Emissions under Different Socioeconomic Factors: Evidence from 132 Small and Medium-Sized Cities in China. Land 2022, 11, 713. [Google Scholar] [CrossRef]
- Li, Z.; Wu, H.; Wu, F. Impacts of urban forms and socioeconomic factors on CO2 emissions: A spatial econometric analysis. J. Clean. Prod. 2022, 372, 133722. [Google Scholar] [CrossRef]
- Xie, Q.; Liu, J. Combined nonlinear effects of economic growth and urbanization on CO2 emissions in China: Evidence from a panel data partially linear additive model. Energy 2019, 186, 115868. [Google Scholar] [CrossRef]
- Makido, Y.; Dhakal, S.; Yamagata, Y. Relationship between urban form and CO2 emissions: Evidence from fifty Japanese cities. Urban Clim. 2012, 2, 55–67. [Google Scholar] [CrossRef]
- Ou, J.; Liu, X.; Wang, S.; Xie, R.; Li, X. Investigating the differentiated impacts of socioeconomic factors and urban forms on CO2 emissions: Empirical evidence from Chinese cities of different developmental levels. J. Clean. Prod. 2019, 226, 601–614. [Google Scholar] [CrossRef]
- Wang, S.; Fang, C.; Wang, Y.; Huang, Y.; Ma, H. Quantifying the relationship between urban development intensity and carbon dioxide emissions using a panel data analysis. Ecol. Indic. 2015, 49, 121–131. [Google Scholar] [CrossRef]
- Chang, C.-T.; Yang, C.-H.; Lin, T.-P. Carbon dioxide emissions evaluations and mitigations in the building and traffic sectors in Taichung metropolitan area, Taiwan. J. Clean. Prod. 2019, 230, 1241–1255. [Google Scholar] [CrossRef]
- Liu, X.; Sweeney, J. Modelling the impact of urban form on household energy demand and related CO2 emissions in the Greater Dublin Region. Energy Policy 2012, 46, 359–369. [Google Scholar] [CrossRef]
- Bereitschaft, B.; Debbage, K. Urban form, air pollution, and CO2 emissions in large US metropolitan areas. Prof. Geogr. 2013, 65, 612–635. [Google Scholar] [CrossRef]
- Song, S.; Diao, M.; Feng, C.-C. Individual transport emissions and the built environment: A structural equation modelling approach. Transp. Res. Part A Policy Pract. 2016, 92, 206–219. [Google Scholar] [CrossRef]
- Choi, K.; Zhang, M. The impact of metropolitan, county, and local land use on driving emissions in US metropolitan areas: Mediator effects of vehicle travel characteristics. J. Transp. Geogr. 2017, 64, 195–202. [Google Scholar] [CrossRef]
- Wang, S.-H.; Huang, S.-L.; Huang, P.-J. Can spatial planning really mitigate carbon dioxide emissions in urban areas? A case study in Taipei, Taiwan. Landsc. Urban Plan. 2018, 169, 22–36. [Google Scholar] [CrossRef]
- Aguiléra, A.; Voisin, M. Urban form, commuting patterns and CO2 emissions: What differences between the municipality’s residents and its jobs? Transp. Res. Part A Policy Pract. 2014, 69, 243–251. [Google Scholar] [CrossRef]
- Waygood, E.O.D.; Sun, Y.; Susilo, Y.O. Transportation carbon dioxide emissions by built environment and family lifecycle: Case study of the Osaka metropolitan area. Transp. Res. Part D Transp. Environ. 2014, 31, 176–188. [Google Scholar] [CrossRef]
- Ma, J.; Liu, Z.; Chai, Y. The impact of urban form on CO2 emission from work and non-work trips: The case of Beijing, China. Habitat Int. 2015, 47, 1–10. [Google Scholar] [CrossRef]
- Shen, Y.-S.; Lin, Y.-C.; Cui, S.; Li, Y.; Zhai, X. Crucial factors of the built environment for mitigating carbon emissions. Sci. Total Environ. 2022, 806, 150864. [Google Scholar] [CrossRef] [PubMed]
- Tan, X.; Tu, T.; Gu, B.; Zeng, Y. Scenario simulation of CO2 emissions from light-duty passenger vehicles under land use-transport planning: A case of Shenzhen International Low Carbon City. Sustain. Cities Soc. 2021, 75, 103266. [Google Scholar] [CrossRef]
- Xia, C.; Xiang, M.; Fang, K.; Li, Y.; Ye, Y.; Shi, Z.; Liu, J. Spatial-temporal distribution of carbon emissions by daily travel and its response to urban form: A case study of Hangzhou, China. J. Clean. Prod. 2020, 257, 120797. [Google Scholar] [CrossRef]
- Wang, X.; Shao, C.; Yin, C.; Dong, C. Exploring the effects of the built environment on commuting mode choice in neighborhoods near public transit stations: Evidence from China. Transp. Plan. Technol. 2021, 44, 111–127. [Google Scholar] [CrossRef]
- Liu, Z.; Ma, J.; Chai, Y. Neighborhood-scale urban form, travel behavior, and CO2 emissions in Beijing: Implications for low-carbon urban planning. Urban Geogr. 2017, 38, 381–400. [Google Scholar] [CrossRef]
- Ashik, F.R.; Rahman, M.H.; Antipova, A.; Zafri, N.M. Analyzing the impact of the built environment on commuting-related carbon dioxide emissions. Int. J. Sustain. Transp. 2022, 17, 258–272. [Google Scholar] [CrossRef]
- Yang, W.; Wang, W.; Ouyang, S. The influencing factors and spatial spillover effects of CO2 emissions from transportation in China. Sci. Total Environ. 2019, 696, 133900. [Google Scholar] [CrossRef] [PubMed]
- Sun, H.; Li, M.; Xue, Y. Examining the factors influencing transport sector CO2 emissions and their efficiency in central China. Sustainability 2019, 11, 4712. [Google Scholar] [CrossRef]
- Son, C.H.; Baek, J.I.; Ban, Y.U. Structural impact relationships between urban development intensity characteristics and carbon dioxide emissions in Korea. Sustainability 2018, 10, 1838. [Google Scholar] [CrossRef]
- Song, Y.; Gurney, K.R. The Relationship between On-Road FFCO2 Emissions and Socio-Economic/Urban Form Factors for Global Cities: Significance, Robustness and Implications. Sustainability 2020, 12, 6028. [Google Scholar] [CrossRef]
- Yang, W.; Li, T.; Cao, X. Examining the impacts of socio-economic factors, urban form and transportation development on CO2 emissions from transportation in China: A panel data analysis of China’s provinces. Habitat Int. 2015, 49, 212–220. [Google Scholar] [CrossRef]
- Zhou, C.; Wang, S. Examining the determinants and the spatial nexus of city-level CO2 emissions in China: A dynamic spatial panel analysis of China’s cities. J. Clean. Prod. 2018, 171, 917–926. [Google Scholar] [CrossRef]
- Su, Q. The effect of population density, road network density, and congestion on household gasoline consumption in US urban areas. Energy Econ. 2011, 33, 445–452. [Google Scholar] [CrossRef]
- Shi, F.; Liao, X.; Shen, L.; Meng, C.; Lai, Y. Exploring the spatiotemporal impacts of urban form on CO2 emissions: Evidence and implications from 256 Chinese cities. Environ. Impact Assess. Rev. 2022, 96, 106850. [Google Scholar] [CrossRef]
- Wang, S.; Shi, C.; Fang, C.; Feng, K. Examining the spatial variations of determinants of energy-related CO2 emissions in China at the city level using Geographically Weighted Regression Model. Appl. Energy 2019, 235, 95–105. [Google Scholar] [CrossRef]
- Zhou, X.; Wang, H.; Huang, Z.; Bao, Y.; Zhou, G.; Liu, Y. Identifying spatiotemporal characteristics and driving factors for road traffic CO2 emissions. Sci. Total Environ. 2022, 834, 155270. [Google Scholar] [CrossRef] [PubMed]
- Ou, J.; Liu, X.; Li, X.; Chen, Y. Quantifying the relationship between urban forms and carbon emissions using panel data analysis. Landsc. Ecol. 2013, 28, 1889–1907. [Google Scholar] [CrossRef]
- Fang, C.; Wang, S.; Li, G. Changing urban forms and carbon dioxide emissions in China: A case study of 30 provincial capital cities. Appl. Energy 2015, 158, 519–531. [Google Scholar] [CrossRef]
- Li, S.; Zhou, C.; Wang, S.; Hu, J. Dose urban landscape pattern affect CO2 emission efficiency? Empirical evidence from megacities in China. J. Clean. Prod. 2018, 203, 164–178. [Google Scholar] [CrossRef]
- Wang, S.; Wang, J.; Fang, C.; Li, S. Estimating the impacts of urban form on CO2 emission efficiency in the Pearl River Delta, China. Cities 2019, 85, 117–129. [Google Scholar] [CrossRef]
- Chen, Y.; Li, X.; Zheng, Y.; Guan, Y.; Liu, X. Estimating the relationship between urban forms and energy consumption: A case study in the Pearl River Delta, 2005–2008. Landsc. Urban Plan. 2011, 102, 33–42. [Google Scholar] [CrossRef]
- Li, Z.; Wang, F.; Kang, T.; Wang, C.; Chen, X.; Miao, Z.; Zhang, L.; Ye, Y.; Zhang, H. Exploring differentiated impacts of socioeconomic factors and urban forms on city-level CO2 emissions in China: Spatial heterogeneity and varying importance levels. Sustain. Cities Soc. 2022, 84, 104028. [Google Scholar] [CrossRef]
- Zheng, S.; Huang, Y.; Sun, Y. Effects of urban form on carbon emissions in china: Implications for low-carbon urban planning. Land 2022, 11, 1343. [Google Scholar] [CrossRef]
- Xu, X.; Ou, J.; Liu, P.; Liu, X.; Zhang, H. Investigating the impacts of three-dimensional spatial structures on CO2 emissions at the urban scale. Sci. Total Environ. 2021, 762, 143096. [Google Scholar] [CrossRef] [PubMed]
- Liu, X.; Ou, J.; Chen, Y.; Wang, S.; Li, X.; Jiao, L.; Liu, Y. Scenario simulation of urban energy-related CO2 emissions by coupling the socioeconomic factors and spatial structures. Appl. Energy 2019, 238, 1163–1178. [Google Scholar] [CrossRef]
- Sha, W.; Chen, Y.; Wu, J.; Wang, Z. Will polycentric cities cause more CO2 emissions? A case study of 232 Chinese cities. J. Environ. Sci. 2020, 96, 33–43. [Google Scholar] [CrossRef] [PubMed]
- Xu, C.; Haase, D.; Su, M.; Yang, Z. The impact of urban compactness on energy-related greenhouse gas emissions across EU member states: Population density vs physical compactness. Appl. Energy 2019, 254, 113671. [Google Scholar] [CrossRef]
- Wang, M.; Madden, M.; Liu, X. Exploring the relationship between urban forms and CO2 emissions in 104 Chinese cities. J. Urban Plan. Dev. 2017, 143, 04017014. [Google Scholar] [CrossRef]
- Burgalassi, D.; Luzzati, T. Urban spatial structure and environmental emissions: A survey of the literature and some empirical evidence for Italian NUTS 3 regions. Cities 2015, 49, 134–148. [Google Scholar] [CrossRef]
- Lee, S.; Lee, B. The influence of urban form on GHG emissions in the US household sector. Energy Policy 2014, 68, 534–549. [Google Scholar] [CrossRef]
- Hankey, S.; Marshall, J.D. Impacts of urban form on future US passenger-vehicle greenhouse gas emissions. Energy Policy 2010, 38, 4880–4887. [Google Scholar] [CrossRef]
- Zhu, E.; Qi, Q.; Chen, L.; Wu, X. The spatial-temporal patterns and multiple driving mechanisms of carbon emissions in the process of urbanization: A case study in Zhejiang, China. J. Clean. Prod. 2022, 358, 131954. [Google Scholar] [CrossRef]
- Zhu, K.; Tu, M.; Li, Y. Did polycentric and compact structure reduce carbon emissions? A spatial panel data analysis of 286 Chinese cities from 2002 to 2019. Land 2022, 11, 185. [Google Scholar] [CrossRef]
- Gim, T.-H.T. Analyzing the city-level effects of land use on travel time and CO2 emissions: A global mediation study of travel time. Int. J. Sustain. Transp. 2022, 16, 496–513. [Google Scholar] [CrossRef]
- Liu, Y.; Song, Y.; Song, X. An empirical study on the relationship between urban compactness and CO2 efficiency in China. Habitat Int. 2014, 41, 92–98. [Google Scholar] [CrossRef]
- Liu, S.; Shen, J.; Liu, G.; Wu, Y.; Shi, K. Exploring the effect of urban spatial development pattern on carbon dioxide emissions in China: A socioeconomic density distribution approach based on remotely sensed nighttime light data. Comput. Environ. Urban Syst. 2022, 96, 101847. [Google Scholar] [CrossRef]
- Yi, Y.; Wang, Y.; Li, Y.; Qi, J. Impact of urban density on carbon emissions in China. Appl. Econ. 2021, 53, 6153–6165. [Google Scholar] [CrossRef]
- Tamura, S.; Iwamoto, S.; Tanaka, T. The impact of spatial population distribution patterns on CO2 emissions and infrastructure costs in a small Japanese town. Sustain. Cities Soc. 2018, 40, 513–523. [Google Scholar] [CrossRef]
- Ye, H.; He, X.; Song, Y.; Li, X.; Zhang, G.; Lin, T.; Xiao, L. A sustainable urban form: The challenges of compactness from the viewpoint of energy consumption and carbon emission. Energy Build. 2015, 93, 90–98. [Google Scholar] [CrossRef]
- Zuo, S.; Dai, S.; Ren, Y. More fragmentized urban form more CO2 emissions? A comprehensive relationship from the combination analysis across different scales. J. Clean. Prod. 2020, 244, 118659. [Google Scholar] [CrossRef]
- Leqin, Z.; Suping, C.; Yawen, Z.; Xinwang, X. The measurement of carbon emission effect of construction land changes in Anhui Province based on the extended LMDI model. J. Resour. Ecol. 2013, 4, 186–192. [Google Scholar] [CrossRef]
- Rasool, Y.; Zaidi, S.A.H.; Zafar, M.W. Determinants of carbon emissions in Pakistan’s transport sector. Environ. Sci. Pollut. Res. 2019, 26, 22907–22921. [Google Scholar] [CrossRef]
- Xu, L.; Du, H.; Zhang, X. Driving forces of carbon dioxide emissions in China’s cities: An empirical analysis based on the geodetector method. J. Clean. Prod. 2021, 287, 125169. [Google Scholar] [CrossRef]
- Baiocchi, G.; Creutzig, F.; Minx, J.; Pichler, P.-P. A spatial typology of human settlements and their CO2 emissions in England. Glob. Environ. Chang. 2015, 34, 13–21. [Google Scholar] [CrossRef]
- Lu, I.; Lin, S.J.; Lewis, C. Decomposition and decoupling effects of carbon dioxide emission from highway transportation in Taiwan, Germany, Japan and South Korea. Energy Policy 2007, 35, 3226–3235. [Google Scholar] [CrossRef]
- Heres-Del-Valle, D.; Niemeier, D. CO2 emissions: Are land-use changes enough for California to reduce VMT? Specification of a two-part model with instrumental variables. Transp. Res. Part B Methodol. 2011, 45, 150–161. [Google Scholar] [CrossRef]
- Liu, J.; Li, M.; Ding, Y. Econometric analysis of the impact of the urban population size on carbon dioxide (CO2) emissions in China. Environ. Dev. Sustain. 2021, 23, 18186–18203. [Google Scholar] [CrossRef]
- Hong, J.-W.; Hong, J.; Chun, J.; Lee, Y.H.; Chang, L.-S.; Lee, J.-B.; Yi, K.; Park, Y.-S.; Byun, Y.-H.; Joo, S. Comparative assessment of net CO2 exchange across an urbanization gradient in Korea based on eddy covariance measurements. Carbon Balance Manag. 2019, 14, 13. [Google Scholar] [CrossRef]
- Gudipudi, R.; Fluschnik, T.; Ros, A.G.C.; Walther, C.; Kropp, J.P. City density and CO2 efficiency. Energy Policy 2016, 91, 352–361. [Google Scholar] [CrossRef]
- Ma, M.; Rozema, J.; Gianoli, A.; Zhang, W. The impacts of city size and density on CO2 emissions: Evidence from the Yangtze River delta urban agglomeration. Appl. Spat. Anal. Policy 2022, 15, 529–555. [Google Scholar] [CrossRef]
- Lin, J.; Lu, S.; He, X.; Wang, F. Analyzing the impact of three-dimensional building structure on CO2 emissions based on random forest regression. Energy 2021, 236, 121502. [Google Scholar] [CrossRef]
- Hong, J. Non-linear influences of the built environment on transportation emissions: Focusing on densities. J. Transp. Land Use 2017, 10, 229–240. [Google Scholar] [CrossRef]
- Wang, Y.; Niu, Y.; Li, M.; Yu, Q.; Chen, W. Spatial structure and carbon emission of urban agglomerations: Spatiotemporal characteristics and driving forces. Sustain. Cities Soc. 2022, 78, 103600. [Google Scholar] [CrossRef]
- Sun, B.; Han, S.; Li, W. Effects of the polycentric spatial structures of Chinese city regions on CO2 concentrations. Transp. Res. Part D Transp. Environ. 2020, 82, 102333. [Google Scholar] [CrossRef]
- Veneri, P. Urban polycentricity and the costs of commuting: Evidence from Italian metropolitan areas. Growth Chang. 2010, 41, 403–429. [Google Scholar] [CrossRef]
- Han, S.; Miao, C. Does a Polycentric Spatial Structure Help to Reduce Industry Emissions? Int. J. Environ. Res. Public Health 2022, 19, 8167. [Google Scholar] [CrossRef]
- Jung, M.C.; Kang, M.; Kim, S. Does polycentric development produce less transportation carbon emissions? Evidence from urban form identified by night-time lights across US metropolitan areas. Urban Clim. 2022, 44, 101223. [Google Scholar] [CrossRef]
- Chow, A.S. Spatial-modal scenarios of greenhouse gas emissions from commuting in Hong Kong. J. Transp. Geogr. 2016, 54, 205–213. [Google Scholar] [CrossRef]
- Gratani, L.; Varone, L.; Bonito, A. Carbon sequestration of four urban parks in Rome. Urban For. Urban Green. 2016, 19, 184–193. [Google Scholar] [CrossRef]
- Kaushal, S.; Baishya, R. Stand structure and species diversity regulate biomass carbon stock under major Central Himalayan forest types of India. Ecol. Process. 2021, 10, 14. [Google Scholar] [CrossRef]
- Lv, H.; Wang, W.; He, X.; Wei, C.; Xiao, L.; Zhang, B.; Zhou, W. Association of urban forest landscape characteristics with biomass and soil carbon stocks in Harbin City, Northeastern China. PeerJ 2018, 6, e5825. [Google Scholar] [CrossRef]
- Ren, Y.; Wei, X.; Wei, X.; Pan, J.; Xie, P.; Song, X.; Peng, D.; Zhao, J. Relationship between vegetation carbon storage and urbanization: A case study of Xiamen, China. For. Ecol. Manag. 2011, 261, 1214–1223. [Google Scholar] [CrossRef]
- Wang, Y.; Chang, Q.; Li, X. Promoting sustainable carbon sequestration of plants in urban greenspace by planting design: A case study in parks of Beijing. Urban For. Urban Green. 2021, 64, 127291. [Google Scholar] [CrossRef]
- Nowak, D.J.; Crane, D.E. Carbon storage and sequestration by urban trees in the USA. Environ. Pollut. 2002, 116, 381–389. [Google Scholar] [CrossRef] [PubMed]
- Sun, Y.; Xie, S.; Zhao, S. Valuing urban green spaces in mitigating climate change: A city-wide estimate of aboveground carbon stored in urban green spaces of China’s Capital. Glob. Chang. Biol. 2019, 25, 1717–1732. [Google Scholar] [CrossRef]
- Timilsina, N.; Escobedo, F.J.; Staudhammer, C.L.; Brandeis, T. Analyzing the causal factors of carbon stores in a subtropical urban forest. Ecol. Complex. 2014, 20, 23–32. [Google Scholar] [CrossRef]
- Yao, X.; Zhao, M.; Escobedo, F.J. What causal drivers influence carbon storage in Shanghai, China’s urban and Peri-urban forests? Sustainability 2017, 9, 577. [Google Scholar] [CrossRef]
- Amara, E.; Heiskanen, J.; Aynekulu, E.; Pellikka, P.K. Relationship between carbon stocks and tree species diversity in a humid Guinean savanna landscape in northern Sierra Leone. South. For. A J. For. Sci. 2019, 81, 235–245. [Google Scholar] [CrossRef]
- Wiesmeier, M.; Prietzel, J.; Barthold, F.; Spörlein, P.; Geuß, U.; Hangen, E.; Reischl, A.; Schilling, B.; von Lützow, M.; Kögel-Knabner, I. Storage and drivers of organic carbon in forest soils of southeast Germany (Bavaria)–Implications for carbon sequestration. For. Ecol. Manag. 2013, 295, 162–172. [Google Scholar] [CrossRef]
- Islam, M.; Deb, G.P.; Rahman, M. Forest fragmentation reduced carbon storage in a moist tropical forest in Bangladesh: Implications for policy development. Land Use Policy 2017, 65, 15–25. [Google Scholar] [CrossRef]
- Meena, A.; Bidalia, A.; Hanief, M.; Dinakaran, J.; Rao, K. Assessment of above-and belowground carbon pools in a semi-arid forest ecosystem of Delhi, India. Ecol. Process. 2019, 8, 8. [Google Scholar] [CrossRef]
- Ordway, E.M.; Asner, G.P. Carbon declines along tropical forest edges correspond to heterogeneous effects on canopy structure and function. Proc. Natl. Acad. Sci. USA 2020, 117, 7863–7870. [Google Scholar] [CrossRef] [PubMed]
- Olorunfemi, I.E.; Komolafe, A.A.; Fasinmirin, J.T.; Olufayo, A.A. Biomass carbon stocks of different land use management in the forest vegetative zone of Nigeria. Acta Oecologica 2019, 95, 45–56. [Google Scholar] [CrossRef]
- Salunkhe, O.; Khare, P.; Kumari, R.; Khan, M. A systematic review on the aboveground biomass and carbon stocks of Indian forest ecosystems. Ecol. Process. 2018, 7, 17. [Google Scholar] [CrossRef]
- Lahoti, S.; Lahoti, A.; Joshi, R.K.; Saito, O. Vegetation structure, species composition, and carbon sink potential of urban green spaces in Nagpur City, India. Land 2020, 9, 107. [Google Scholar] [CrossRef]
- Orihuela-Belmonte, D.; De Jong, B.; Mendoza-Vega, J.; Van der Wal, J.; Paz-Pellat, F.; Soto-Pinto, L.; Flamenco-Sandoval, A. Carbon stocks and accumulation rates in tropical secondary forests at the scale of community, landscape and forest type. Agric. Ecosyst. Environ. 2013, 171, 72–84. [Google Scholar] [CrossRef]
- Fleiss, S.; Waddell, E.H.; Ola, B.B.; Banin, L.F.; Benedick, S.; Sailim, A.B.; Chapman, D.S.; Jelling, A.; King, H.; McClean, C.J. Conservation set-asides improve carbon storage and support associated plant diversity in certified sustainable oil palm plantations. Biol. Conserv. 2020, 248, 108631. [Google Scholar] [CrossRef]
- Li, Y.; Bao, W.; Bongers, F.; Chen, B.; Chen, G.; Guo, K.; Jiang, M.; Lai, J.; Lin, D.; Liu, C. Drivers of tree carbon storage in subtropical forests. Sci. Total Environ. 2019, 654, 684–693. [Google Scholar] [CrossRef]
- Li, Y.; Bruelheide, H.; Scholten, T.; Schmid, B.; Sun, Z.; Zhang, N.; Bu, W.; Liu, X.; Ma, K. Early positive effects of tree species richness on soil organic carbon accumulation in a large-scale forest biodiversity experiment. J. Plant Ecol. 2019, 12, 882–893. [Google Scholar] [CrossRef]
- Yan, G.; Bongers, F.J.; Trogisch, S.; Li, Y.; Chen, G.; Yan, H.; Deng, X.; Ma, K.; Liu, X. Climate and mycorrhizae mediate the relationship of tree species diversity and carbon stocks in subtropical forests. J. Ecol. 2022, 110, 2462–2474. [Google Scholar] [CrossRef]
- Ren, Y.; Wei, X.; Wang, D.; Luo, Y.; Song, X.; Wang, Y.; Yang, Y.; Hua, L. Linking landscape patterns with ecological functions: A case study examining the interaction between landscape heterogeneity and carbon stock of urban forests in Xiamen, China. For. Ecol. Manag. 2013, 293, 122–131. [Google Scholar] [CrossRef]
- Sari, R.R.; Saputra, D.D.; Hairiah, K.; Rozendaal, D.M.; Roshetko, J.M.; Van Noordwijk, M. Gendered species preferences link tree diversity and carbon stocks in cacao agroforest in Southeast Sulawesi, Indonesia. Land 2020, 9, 108. [Google Scholar] [CrossRef]
- Wies, G.; Arzeta, S.N.; Ramos, M.M. Critical ecological thresholds for conservation of tropical rainforest in Human Modified Landscapes. Biol. Conserv. 2021, 255, 109023. [Google Scholar] [CrossRef]
- Liu, X.; Trogisch, S.; He, J.-S.; Niklaus, P.A.; Bruelheide, H.; Tang, Z.; Erfmeier, A.; Scherer-Lorenzen, M.; Pietsch, K.A.; Yang, B. Tree species richness increases ecosystem carbon storage in subtropical forests. Proc. R. Soc. B 2018, 285, 20181240. [Google Scholar] [CrossRef]
- Dai, E.; Zhu, J.; Wang, X.; Xi, W. Multiple ecosystem services of monoculture and mixed plantations: A case study of the Huitong experimental forest of Southern China. Land Use Policy 2018, 79, 717–724. [Google Scholar] [CrossRef]
- Xu, F.; Liu, W.; Ren, W.; Zhong, Q.; Zhang, G.; Wang, K. Effects of community structure on carbon fixation of urban forests in Shanghai, China. Chin. J. Ecol. 2010, 29, 439–447. [Google Scholar] [CrossRef]
- Castro-Izaguirre, N.; Chi, X.; Baruffol, M.; Tang, Z.; Ma, K.; Schmid, B.; Niklaus, P.A. Tree diversity enhances stand carbon storage but not leaf area in a subtropical forest. PLoS ONE 2016, 11, e0167771. [Google Scholar] [CrossRef] [PubMed]
- Muluneh, M.G.; Worku, B.B. Contributions of urban green spaces for climate change mitigation and biodiversity conservation in Dessie city, Northeastern Ethiopia. Urban Clim. 2022, 46, 101294. [Google Scholar] [CrossRef]
- Huang, Y.; Chen, Y.; Castro-Izaguirre, N.; Baruffol, M.; Brezzi, M.; Lang, A.; Li, Y.; Härdtle, W.; Von Oheimb, G.; Yang, X. Impacts of species richness on productivity in a large-scale subtropical forest experiment. Science 2018, 362, 80–83. [Google Scholar] [CrossRef] [PubMed]
- Schnabel, F.; Schwarz, J.A.; Dănescu, A.; Fichtner, A.; Nock, C.A.; Bauhus, J.; Potvin, C. Drivers of productivity and its temporal stability in a tropical tree diversity experiment. Glob. Chang. Biol. 2019, 25, 4257–4272. [Google Scholar] [CrossRef]
- Schnabel, F.; Liu, X.; Kunz, M.; Barry, K.E.; Bongers, F.J.; Bruelheide, H.; Fichtner, A.; Härdtle, W.; Li, S.; Pfaff, C.-T. Species richness stabilizes productivity via asynchrony and drought-tolerance diversity in a large-scale tree biodiversity experiment. Sci. Adv. 2021, 7, eabk1643. [Google Scholar] [CrossRef]
- Wang, G.; Liu, Y.; Wu, X.; Pang, D.; Yang, X.; Hussain, A.; Zhou, J. Stand structural diversity and species with leaf nitrogen conservation drive aboveground carbon storage in tropical old-growth forests. Forests 2020, 11, 994. [Google Scholar] [CrossRef]
- Chaplin-Kramer, R.; Ramler, I.; Sharp, R.; Haddad, N.M.; Gerber, J.S.; West, P.C.; Mandle, L.; Engstrom, P.; Baccini, A.; Sim, S. Degradation in carbon stocks near tropical forest edges. Nat. Commun. 2015, 6, 10158. [Google Scholar] [CrossRef]
- Qie, L.; Lewis, S.L.; Sullivan, M.J.; Lopez-Gonzalez, G.; Pickavance, G.C.; Sunderland, T.; Ashton, P.; Hubau, W.; Abu Salim, K.; Aiba, S.-I. Long-term carbon sink in Borneo’s forests halted by drought and vulnerable to edge effects. Nat. Commun. 2017, 8, 342. [Google Scholar] [CrossRef]
- Brinck, K.; Fischer, R.; Groeneveld, J.; Lehmann, S.; Dantas De Paula, M.; Pütz, S.; Sexton, J.O.; Song, D.; Huth, A. High resolution analysis of tropical forest fragmentation and its impact on the global carbon cycle. Nat. Commun. 2017, 8, 14855. [Google Scholar] [CrossRef]
- Hansen, M.C.; Wang, L.; Song, X.-P.; Tyukavina, A.; Turubanova, S.; Potapov, P.V.; Stehman, S.V. The fate of tropical forest fragments. Sci. Adv. 2020, 6, eaax8574. [Google Scholar] [CrossRef] [PubMed]
- Silva Junior, C.H.; Aragão, L.E.; Anderson, L.O.; Fonseca, M.G.; Shimabukuro, Y.E.; Vancutsem, C.; Achard, F.; Beuchle, R.; Numata, I.; Silva, C.A. Persistent collapse of biomass in Amazonian forest edges following deforestation leads to unaccounted carbon losses. Sci. Adv. 2020, 6, eaaz8360. [Google Scholar] [CrossRef]
- Pütz, S.; Groeneveld, J.; Henle, K.; Knogge, C.; Martensen, A.C.; Metz, M.; Metzger, J.P.; Ribeiro, M.C.; De Paula, M.D.; Huth, A. Long-term carbon loss in fragmented Neotropical forests. Nat. Commun. 2014, 5, 5037. [Google Scholar] [CrossRef]
- Li, D.; Yang, Y.; Xia, F.; Sun, W.; Li, X.; Xie, Y. Exploring the influences of different processes of habitat fragmentation on ecosystem services. Landsc. Urban Plan. 2022, 227, 104544. [Google Scholar] [CrossRef]
- Reis, S.M.; Marimon, B.S.; Marimon Junior, B.H.; Morandi, P.S.; Oliveira, E.A.d.; Elias, F.; Neves, E.C.d.; Oliveira, B.d.; Nogueira, D.d.S.; Umetsu, R.K. Climate and fragmentation affect forest structure at the southern border of Amazonia. Plant Ecol. Divers. 2018, 11, 13–25. [Google Scholar] [CrossRef]
- Shen, C.; Shi, N.; Fu, S.; Ye, W.; Ma, L.; Guan, D. Decline in Aboveground Biomass Due to Fragmentation in Subtropical Forests of China. Forests 2021, 12, 617. [Google Scholar] [CrossRef]
- Morreale, L.L.; Thompson, J.R.; Tang, X.; Reinmann, A.B.; Hutyra, L.R. Elevated growth and biomass along temperate forest edges. Nat. Commun. 2021, 12, 7181. [Google Scholar] [CrossRef] [PubMed]
- Reinmann, A.B.; Hutyra, L.R. Edge effects enhance carbon uptake and its vulnerability to climate change in temperate broadleaf forests. Proc. Natl. Acad. Sci. USA 2017, 114, 107–112. [Google Scholar] [CrossRef]
- Liu, S.; Yin, Y.; Liu, X.; Cheng, F.; Yang, J.; Li, J.; Dong, S.; Zhu, A. Ecosystem Services and landscape change associated with plantation expansion in a tropical rainforest region of Southwest China. Ecol. Model. 2017, 353, 129–138. [Google Scholar] [CrossRef]
- Liu, C.; Li, X. Carbon storage and sequestration by urban forests in Shenyang, China. Urban For. Urban Green. 2012, 11, 121–128. [Google Scholar] [CrossRef]
- Shen, C.; Ma, L.; Hu, J.; Huang, L.; Chen, Y.; Guan, D. Soil carbon storage and its determinants in forest fragments of differentiated patch size. Forests 2019, 10, 1044. [Google Scholar] [CrossRef]
- Zhang, D.; Wang, W.; Zheng, H.; Ren, Z.; Zhai, C.; Tang, Z.; Shen, G.; He, X. Effects of urbanization intensity on forest structural-taxonomic attributes, landscape patterns and their associations in Changchun, Northeast China: Implications for urban green infrastructure planning. Ecol. Indic. 2017, 80, 286–296. [Google Scholar] [CrossRef]
- Reinmann, A.B.; Smith, I.A.; Thompson, J.R.; Hutyra, L.R. Urbanization and fragmentation mediate temperate forest carbon cycle response to climate. Environ. Res. Lett. 2020, 15, 114036. [Google Scholar] [CrossRef]
- Wei, S.; Chen, Q.; Wu, W.; Ma, J. Quantifying the indirect effects of urbanization on urban vegetation carbon uptake in the megacity of Shanghai, China. Environ. Res. Lett. 2021, 16, 064088. [Google Scholar] [CrossRef]
- Lin, J.; Ma, Q.; Ju, Y.; Zhang, H.; Wang, Q.; Huang, B. Relationships between urbanization, tree morphology, and carbon density: An integration of remote sensing, allometric models, and field survey. Urban For. Urban Green. 2022, 76, 127725. [Google Scholar] [CrossRef]
- Luyssaert, S.; Schulze, E.; Börner, A.; Knohl, A.; Hessenmöller, D.; Law, B.E.; Ciais, P.; Grace, J. Old-growth forests as global carbon sinks. Nature 2008, 455, 213–215. [Google Scholar] [CrossRef] [PubMed]
- Meng, Y.; Zhang, Y.; Li, C.; Wang, Z.; Li, Y. The Effect of Thinning Management on the Carbon Density of the Tree Layers in Larch–Birch Mixed Natural Secondary Forests of the Greater Khingan Range, Northeastern China. Forests 2022, 13, 1035. [Google Scholar] [CrossRef]
- Jo, H.-K. Impacts of urban greenspace on offsetting carbon emissions for middle Korea. J. Environ. Manag. 2002, 64, 115–126. [Google Scholar] [CrossRef] [PubMed]
- Mexia, T.; Vieira, J.; Príncipe, A.; Anjos, A.; Silva, P.; Lopes, N.; Freitas, C.; Santos-Reis, M.; Correia, O.; Branquinho, C. Ecosystem services: Urban parks under a magnifying glass. Environ. Res. 2018, 160, 469–478. [Google Scholar] [CrossRef] [PubMed]
- Tang, Y.; Chen, A.; Zhao, S. Carbon storage and sequestration of urban street trees in Beijing, China. Front. Ecol. Evol. 2016, 4, 53. [Google Scholar] [CrossRef]
- O’Donoghue, A.; Shackleton, C.M. Current and potential carbon stocks of trees in urban parking lots in towns of the Eastern Cape, South Africa. Urban For. Urban Green. 2013, 12, 443–449. [Google Scholar] [CrossRef]
- Wang, W.; Wei, X.; Liao, W.; Blanco, J.A.; Liu, Y.; Liu, S.; Liu, G.; Zhang, L.; Guo, X.; Guo, S. Evaluation of the effects of forest management strategies on carbon sequestration in evergreen broad-leaved (Phoebe bournei) plantation forests using FORECAST ecosystem model. For. Ecol. Manag. 2013, 300, 21–32. [Google Scholar] [CrossRef]
- Meeussen, C.; Govaert, S.; Vanneste, T.; Haesen, S.; Van Meerbeek, K.; Bollmann, K.; Brunet, J.; Calders, K.; Cousins, S.A.; Diekmann, M. Drivers of carbon stocks in forest edges across Europe. Sci. Total Environ. 2021, 759, 143497. [Google Scholar] [CrossRef] [PubMed]
- Pöpperl, F.; Seidl, R. Effects of stand edges on the structure, functioning, and diversity of a temperate mountain forest landscape. Ecosphere 2021, 12, e03692. [Google Scholar] [CrossRef]
- Wekesa, C.; Kirui, B.K.; Maranga, E.; Muturi, G.M. Variations in forest structure, tree species diversity and above-ground biomass in edges to interior cores of fragmented forest patches of Taita Hills, Kenya. For. Ecol. Manag. 2019, 440, 48–60. [Google Scholar] [CrossRef]
- Remy, E.; Wuyts, K.; Boeckx, P.; Ginzburg, S.; Gundersen, P.; Demey, A.; Van Den Bulcke, J.; Van Acker, J.; Verheyen, K. Strong gradients in nitrogen and carbon stocks at temperate forest edges. For. Ecol. Manag. 2016, 376, 45–58. [Google Scholar] [CrossRef]
- Saeed, S.; Sun, Y.; Beckline, M.; Chen, L.; Lai, Z.; Mannan, A.; Ahmad, A.; Shah, S.; Amir, M.; Ullah, T. Altitudinal gradients and forest edge effect on soil organic carbon in Chinese fir (Cunninghamia lanceolata): A study from southeastern China. Appl. Ecol. Environ. Res. 2019, 17, 745–757. [Google Scholar] [CrossRef]
- Smith, I.A.; Hutyra, L.R.; Reinmann, A.B.; Thompson, J.R.; Allen, D.W. Evidence for edge enhancements of soil respiration in temperate forests. Geophys. Res. Lett. 2019, 46, 4278–4287. [Google Scholar] [CrossRef]
- Schedlbauer, J.L.; Miller, J. Edge effects increase soil respiration without altering soil carbon stocks in temperate broadleaf forests. Ecosphere 2022, 13, e4092. [Google Scholar] [CrossRef]
- d’Albertas, F.; Costa, K.; Romitelli, I.; Barbosa, J.M.; Vieira, S.A.; Metzger, J.P. Lack of evidence of edge age and additive edge effects on carbon stocks in a tropical forest. For. Ecol. Manag. 2018, 407, 57–65. [Google Scholar] [CrossRef]
- Ziter, C.; Bennett, E.M.; Gonzalez, A. Temperate forest fragments maintain aboveground carbon stocks out to the forest edge despite changes in community composition. Oecologia 2014, 176, 893–902. [Google Scholar] [CrossRef] [PubMed]
- Garvey, S.M.; Templer, P.H.; Pierce, E.A.; Reinmann, A.B.; Hutyra, L.R. Diverging patterns at the forest edge: Soil respiration dynamics of fragmented forests in urban and rural areas. Glob. Chang. Biol. 2022, 28, 3094–3109. [Google Scholar] [CrossRef] [PubMed]
- Bae, J.; Ryu, Y. The magnitude and causes of edge effects on soil organic carbon stocks within and across urban to rural forest patches. Landsc. Urban Plan. 2021, 215, 104223. [Google Scholar] [CrossRef]
- Guan, Y.; Li, X.; Li, S.; Sun, H.; Liu, H. Effect of Urban fringes green space fragmentation on ecosystem service value. PLoS ONE 2022, 17, e0263452. [Google Scholar] [CrossRef] [PubMed]
- Hladnik, D.; Kobler, A.; Pirnat, J. Evaluation of forest edge structure and stability in peri-urban forests. Forests 2020, 11, 338. [Google Scholar] [CrossRef]
- Chen, X.; Zhang, X.; Liu, M.; Xu, Z.; Wei, H. Urbanization induced changes in the accumulation mode of organic carbon in the surface soil of subtropical forests. CATENA 2022, 214, 106264. [Google Scholar] [CrossRef]
- Trlica, A.; Hutyra, L.R.; Morreale, L.L.; Smith, I.A.; Reinmann, A.B. Current and future biomass carbon uptake in Boston’s urban forest. Sci. Total Environ. 2020, 709, 136196. [Google Scholar] [CrossRef]
- Awal, M.; Ohta, T.; Matsumoto, K.; Toba, T.; Daikoku, K.; Hattori, S.; Hiyama, T.; Park, H. Comparing the carbon sequestration capacity of temperate deciduous forests between urban and rural landscapes in central Japan. Urban For. Urban Green. 2010, 9, 261–270. [Google Scholar] [CrossRef]
- Zhao, M.; Kong, Z.-h.; Escobedo, F.J.; Gao, J. Impacts of urban forests on offsetting carbon emissions from industrial energy use in Hangzhou, China. J. Environ. Manag. 2010, 91, 807–813. [Google Scholar] [CrossRef]
- Zhang, W.; Ma, J.; Liu, M.; Li, C. Impact of Urban Expansion on Forest Carbon Sequestration: A Study in Northeastern China. Pol. J. Environ. Stud. 2020, 29, 451–461. [Google Scholar] [CrossRef] [PubMed]
- Ren, Y.; Yan, J.; Wei, X.; Wang, Y.; Yang, Y.; Hua, L.; Xiong, Y.; Niu, X.; Song, X. Effects of rapid urban sprawl on urban forest carbon stocks: Integrating remotely sensed, GIS and forest inventory data. J. Environ. Manag. 2012, 113, 447–455. [Google Scholar] [CrossRef] [PubMed]
- Ren, Z.; Zheng, H.; He, X.; Zhang, D.; Shen, G.; Zhai, C. Changes in spatio-temporal patterns of urban forest and its above-ground carbon storage: Implication for urban CO2 emissions mitigation under China’s rapid urban expansion and greening. Environ. Int. 2019, 129, 438–450. [Google Scholar] [CrossRef] [PubMed]
- Jo, H.-K.; McPherson, E.G. Indirect carbon reduction by residential vegetation and planting strategies in Chicago, USA. J. Environ. Manag. 2001, 61, 165–177. [Google Scholar] [CrossRef] [PubMed]
- Lin, W.; Wu, T.; Zhang, C.; Yu, T. Carbon savings resulting from the cooling effect of green areas: A case study in Beijing. Environ. Pollut. 2011, 159, 2148–2154. [Google Scholar] [CrossRef]
- Moody, R.; Geron, N.; Healy, M.; Rogan, J.; Martin, D. Modeling the spatial distribution of the current and future ecosystem services of urban tree planting in Chicopee and Fall River, Massachusetts. Urban For. Urban Green. 2021, 66, 127403. [Google Scholar] [CrossRef]
- Rui, L.; Buccolieri, R.; Gao, Z.; Ding, W.; Shen, J. The impact of green space layouts on microclimate and air quality in residential districts of Nanjing, China. Forests 2018, 9, 224. [Google Scholar] [CrossRef]
- Akbari, H. Shade trees reduce building energy use and CO2 emissions from power plants. Environ. Pollut. 2002, 116, S119–S126. [Google Scholar] [CrossRef]
- Luck, M.; Wu, J. A gradient analysis of urban landscape pattern: A case study from the Phoenix metropolitan region, Arizona, USA. Landsc. Ecol. 2002, 17, 327–339. [Google Scholar] [CrossRef]
- Ali, G.; Abbas, S.; Pan, Y.; Chen, Z.; Hussain, J.; Sajjad, M.; Ashraf, A. Urban environment dynamics and low carbon society: Multi-criteria decision analysis modeling for policy makers. Sustain. Cities Soc. 2019, 51, 101763. [Google Scholar] [CrossRef]
- Maat, K.; Timmermans, H.J. A causal model relating urban form with daily travel distance through activity/travel decisions. Transp. Plan. Technol. 2009, 32, 115–134. [Google Scholar] [CrossRef]
- Engelfriet, L.; Koomen, E. The impact of urban form on commuting in large Chinese cities. Transportation 2018, 45, 1269–1295. [Google Scholar] [CrossRef]
- Zhang, J.; Xie, Y.; Luan, B.; Chen, X. Urban macro-level impact factors on Direct CO2 Emissions of urban residents in China. Energy Build. 2015, 107, 131–143. [Google Scholar] [CrossRef]
- Kenworthy, J.R.; Laube, F.B. Automobile dependence in cities: An international comparison of urban transport and land use patterns with implications for sustainability. Environ. Impact Assess. Rev. 1996, 16, 279–308. [Google Scholar] [CrossRef]
- Bahadure, S.; Kotharkar, R. Assessing sustainability of mixed use neighbourhoods through residents’ travel behaviour and perception: The case of Nagpur, India. Sustainability 2015, 7, 12164–12189. [Google Scholar] [CrossRef]
- Fan, T.; Chapman, A. Policy Driven Compact Cities: Toward Clarifying the Effect of Compact Cities on Carbon Emissions. Sustainability 2022, 14, 12634. [Google Scholar] [CrossRef]
- Camagni, R.; Gibelli, M.C.; Rigamonti, P. Urban mobility and urban form: The social and environmental costs of different patterns of urban expansion. Ecol. Econ. 2002, 40, 199–216. [Google Scholar] [CrossRef]
- Gordon, P.; Richardson, H.W. Are compact cities a desirable planning goal? J. Am. Plan. Assoc. 1997, 63, 95–106. [Google Scholar] [CrossRef]
- Thinh, N.X.; Arlt, G.; Heber, B.; Hennersdorf, J.; Lehmann, I. Evaluation of urban land-use structures with a view to sustainable development. Environ. Impact Assess. Rev. 2002, 22, 475–492. [Google Scholar] [CrossRef]
- Van Der Waals, J. The compact city and the environment: A review. Tijdschr. Voor Econ. En Soc. Geogr. 2000, 91, 111–121. [Google Scholar] [CrossRef]
- Cirilli, A.; Veneri, P. Spatial structure and carbon dioxide (CO2) emissions due to commuting: An analysis of Italian urban areas. Reg. Stud. 2014, 48, 1993–2005. [Google Scholar] [CrossRef]
- Gaigné, C.; Riou, S.; Thisse, J.-F. Are compact cities environmentally friendly? J. Urban Econ. 2012, 72, 123–136. [Google Scholar] [CrossRef]
- Asgarzadeh, M.; Koga, T.; Yoshizawa, N.; Munakata, J.; Hirate, K. Investigating green urbanism; building oppressiveness. J. Asian Archit. Build. Eng. 2010, 9, 555–562. [Google Scholar] [CrossRef]
- Li, Y.; Xiong, W.; Wang, X. Does polycentric and compact development alleviate urban traffic congestion? A case study of 98 Chinese cities. Cities 2019, 88, 100–111. [Google Scholar] [CrossRef]
- Heikkila, E.J.; Xu, Y. Polycentric Urbanization and Sustainable Development in China. Glob. Policy 2022, 13, 69–78. [Google Scholar] [CrossRef]
- Huang, Y.; Liao, R. Polycentric or monocentric, which kind of spatial structure is better for promoting the green economy? Evidence from Chinese urban agglomerations. Environ. Sci. Pollut. Res. 2021, 28, 57706–57722. [Google Scholar] [CrossRef]
- Loreau, M.; Hector, A. Partitioning selection and complementarity in biodiversity experiments. Nature 2001, 412, 72–76. [Google Scholar] [CrossRef]
- Cardinale, B.J.; Matulich, K.L.; Hooper, D.U.; Byrnes, J.E.; Duffy, E.; Gamfeldt, L.; Balvanera, P.; O’connor, M.I.; Gonzalez, A. The functional role of producer diversity in ecosystems. Am. J. Bot. 2011, 98, 572–592. [Google Scholar] [CrossRef]
- Wang, H.; Tassinary, L.G. Effects of greenspace morphology on mortality at the neighbourhood level: A cross-sectional ecological study. Lancet Planet. Health 2019, 3, e460–e468. [Google Scholar] [CrossRef]
- Li, Y.; Zhu, Y.; Wang, Y. Effects of Plant Diversity of Urban Green Space on Citizens’ Spiritual Restoration. J. Chin. Urban For. 2021, 19, 28–34. [Google Scholar] [CrossRef]
- Kang, W.; Minor, E.S.; Park, C.-R.; Lee, D. Effects of habitat structure, human disturbance, and habitat connectivity on urban forest bird communities. Urban Ecosyst. 2015, 18, 857–870. [Google Scholar] [CrossRef]
- Kaushik, M.; Tiwari, S.; Manisha, K. Habitat patch size and tree species richness shape the bird community in urban green spaces of rapidly urbanizing Himalayan foothill region of India. Urban Ecosyst. 2022, 25, 423–436. [Google Scholar] [CrossRef]
- Murcia, C. Edge effects in fragmented forests: Implications for conservation. Trends Ecol. Evol. 1995, 10, 58–62. [Google Scholar] [CrossRef] [PubMed]
- Harper, K.A.; Macdonald, S.E.; Burton, P.J.; Chen, J.; Brosofske, K.D.; Saunders, S.C.; Euskirchen, E.S.; Roberts, D.; Jaiteh, M.S.; Esseen, P.A. Edge influence on forest structure and composition in fragmented landscapes. Conserv. Biol. 2005, 19, 768–782. [Google Scholar] [CrossRef]
- Smith, I.A.; Hutyra, L.R.; Reinmann, A.B.; Marrs, J.K.; Thompson, J.R. Piecing together the fragments: Elucidating edge effects on forest carbon dynamics. Front. Ecol. Environ. 2018, 16, 213–221. [Google Scholar] [CrossRef]
- Chen, S.; An, W.; Chen, B.; Chen, G. Decisive factors impacting the carbon sequestration in mangrove ecological restoration. J. Appl. Oceanogr. 2021, 40, 34–42. [Google Scholar]
- Rybicki, J.; Abrego, N.; Ovaskainen, O. Habitat fragmentation and species diversity in competitive communities. Ecol. Lett. 2020, 23, 506–517. [Google Scholar] [CrossRef]
- Kuipers, K.J.; Hilbers, J.P.; Garcia-Ulloa, J.; Graae, B.J.; May, R.; Verones, F.; Huijbregts, M.A.; Schipper, A.M. Habitat fragmentation amplifies threats from habitat loss to mammal diversity across the world’s terrestrial ecoregions. One Earth 2021, 4, 1505–1513. [Google Scholar] [CrossRef]
- Marquard, E.; Weigelt, A.; Roscher, C.; Gubsch, M.; Lipowsky, A.; Schmid, B. Positive biodiversity–productivity relationship due to increased plant density. J. Ecol. 2009, 97, 696–704. [Google Scholar] [CrossRef]
- Han, J.; Dong, Y.; Ren, Z.; Du, Y.; Wang, C.; Jia, G.; Zhang, P.; Guo, Y. Remarkable Effects of Urbanization on Forest Landscape Multifunctionality in Urban Peripheries: Evidence from Liaoyuan City in Northeast China. Forests 2021, 12, 1779. [Google Scholar] [CrossRef]
- Vaccari, F.P.; Gioli, B.; Toscano, P.; Perrone, C. Carbon dioxide balance assessment of the city of Florence (Italy), and implications for urban planning. Landsc. Urban Plan. 2013, 120, 138–146. [Google Scholar] [CrossRef]
- Pouyat, R.V.; Yesilonis, I.D.; Nowak, D.J. Carbon storage by urban soils in the United States. J. Environ. Qual. 2006, 35, 1566–1575. [Google Scholar] [CrossRef]
- Akbari, H.; Kurn, D.M.; Bretz, S.E.; Hanford, J.W. Peak power and cooling energy savings of shade trees. Energy Build. 1997, 25, 139–148. [Google Scholar] [CrossRef]
- McHale, M.R.; McPherson, E.G.; Burke, I.C. The potential of urban tree plantings to be cost effective in carbon credit markets. Urban For. Urban Green. 2007, 6, 49–60. [Google Scholar] [CrossRef]
- Bao, T.; Li, X.; Zhang, J.; Zhang, Y.; Tian, S. Assessing the distribution of urban green spaces and its anisotropic cooling distance on urban heat island pattern in Baotou, China. ISPRS Int. J. Geo-Inf. 2016, 5, 12. [Google Scholar] [CrossRef]
- Tan, M.; Li, X. Integrated assessment of the cool island intensity of green spaces in the mega city of Beijing. Int. J. Remote Sens. 2013, 34, 3028–3043. [Google Scholar] [CrossRef]
- Hartig, T.; Evans, G.W.; Jamner, L.D.; Davis, D.S.; Gärling, T. Tracking restoration in natural and urban field settings. J. Environ. Psychol. 2003, 23, 109–123. [Google Scholar] [CrossRef]
- Tello-García, E.; Gamboa-Badilla, N.; Álvarez, E.; Fuentes, L.; Basnou, C.; Espelta, J.M.; Pino, J. Plant species surplus in recent peri-urban forests: The role of forest connectivity, species’ habitat requirements and dispersal types. Biodivers. Conserv. 2021, 30, 365–384. [Google Scholar] [CrossRef]


| Theme | Indicator | Metrics | Scale | Impact on Carbon Emissions | Articles | Impact on Sustainable Human Well-Being |
|---|---|---|---|---|---|---|
| Land use | Degree of mixed land use | Land use mix (LUM) Entropy type land use mix (ELUM) Residential-to-employment area ratio Public service accessibility Distance from work to residence Distance traveled for non-work Land use diversity | Regional | − | [43,52,53,54] | Highly mixed land use has a positive impact on economic development and facilitates residents’ daily activities. |
| Landscape | − | [14,15,55,56,57,58,59,60,61,62,63] | ||||
| / | [64] | |||||
| Road network | Traffic volume | Road density Road length Per capita road area Paving rate | Regional | + | [38,42,65,66,67,68,69] | Improving the density and connectivity of the road network improves economic development and residents’ travel. |
| − | [41,70] | |||||
| / | [71] | |||||
| * | [72] | |||||
| ? | [73] | |||||
| Landscape | + | [74] | ||||
| − | [14,15,62,63] | |||||
| Connectivity | Coupling degree between urban spatial structure and road network Interblock connectivity | Regional | − | [41,45,70,75] | ||
| Distribution of public transport facilities | Density of public facilities (subway stations, bus stations, parking facilities) Number of public transport routes Accessibility between work and public transport systems | Regional | + | [49,66] | A well-developed public transport system improves economic development and residents’ travel. | |
| − | [53,65,69] | |||||
| Landscape | + | [14] | ||||
| − | [15,55,56,58,60,63,74] | |||||
| ? | [16] | |||||
| Urban pattern | Patch shape complexity | Area-weighted mean shape index (AWMSI) Area-weighted mean patch fractal dimension (AWMPFD) Perimeter-to-area fractal dimension (PAFRAC) Mean perimeter–area ratio (PARA_MN) Landscape shape index (LSI) Edge density (ED) | Regional | + | [37,41,44,47,48,52,72,75,76,77,78,79,80,81] | The complexity of urban patch morphology has negative effects on economic development and residents’ daily activities. |
| − | [82] | |||||
| Landscape | + | [83] | ||||
| Patch compactness | Patch cohesion Index (PCI) Aggregation index (AI) Normalized compactness index (NCI) Compactness index (CI) Compactness ratio (CR) Number of patches (NP) Patch density (PD) Euclidean nearest neighbor distance (ENN_MN) Patch relative density (PRD) SPLIT index (SPLIT)Landscape separation index Landscape division index (DIVISION) Commuting distance The distance to the city center Percentage of like adjacencies (PLADJ) | Regional | + | [82,84,85] | Compact urban form generally has positive effects on economic development, but a highly compact urban form adversely affects economic development and residents’ physical and mental health. | |
| − | [37,39,41,45,48,51,52,53,67,75,76,77,78,79,81,86,87,88,89,90,91,92] | |||||
| * | [47,80,93,94] | |||||
| ? | [44,72,95] | |||||
| Landscape | − | [14,55,56,59,83,96,97] | ||||
| ? | [15,98] | |||||
| Population density | Urban population density Urban residential density (RD) Employment densityResidential density | Regional | + | [41,49,68,69,70,99,100] | Urban population density generally has a positive impact on economic development, but a very high population density adversely affects the urban economy and residents’ physical and mental health. | |
| − | [36,42,43,51,52,65,66,67,71,80,84,85,88,90,92,101,102,103,104,105,106,107] | |||||
| * | [40,47,72,108] | |||||
| ? | [73] | |||||
| Landscape | + | [61,64,109] | ||||
| − | [14,55,74] | |||||
| * | [16,96,110] | |||||
| ? | [15] | |||||
| Urban structure | Polycentric structure | Morphological polycentricity Functional polycentricity Polycentricity index | Regional | + | [88,111] | A polycentric structure is conducive to green economic development and facilitates residents’ commuting. However, a higher number of centers does not necessarily improve economic development. |
| − | [84,102,112,113,114] | |||||
| / | [87] | |||||
| ? | [86,91,115] | |||||
| Landscape | − | [116] | ||||
| Monocentric structure | Largest path index (LPI) Buffer compactness index (BCI) | Regional | + | [47,75] | ||
| ? | [48] | |||||
| Landscape | + | [83] |
| Theme | Indicator | Metrics | Scale | Impact on Carbon Sinks | Article | Impact on the Green Space Ecosystem Service Sustainability |
|---|---|---|---|---|---|---|
| Vegetation community | Landscape richness | Shannon diversity Index (SHDI) Habitat diversity Homogeneity Biological diversity (species diversity, functional diversity, and functional dominance) Tree neighborhood diversity Tree diversity Species richness | Regional | + | [118,128,135,136,137,138] | The landscape richness, biodiversity, and biomass are higher in green spaces; therefore, these ecosystems should be protected. |
| Landscape | + | [123,126,129,139,140,141,142,143,144,145,146,147,148,149] | ||||
| / | [124,125,150] | |||||
| Green space pattern | Patch compactness | Patch cohesion index (COHESION) Aggregation index (AI) Vegetation landscape connectivity (VLC) Number of patches (NP)/number of fragments (NF)/patch number (N) Patch density (PD) Mean nearest neighbor distance in a few miles (ENN_MN) Patch relative density (PRD) Landscape separation index (DIVISION) Mean forest patch size/mean patch area (AREA_MN) Area-weighted mean contiguity index Distance to forest edge (m) | Regional | + | [128,151,152,153,154,155,156,157,158,159] | Highly connected green patches indicate high ecosystem diversity. The decrease in the number of fragmented patches is the result of management. |
| − | [160] | |||||
| / | [161] | |||||
| Landscape | + | [119,162,163,164,165] | ||||
| − | [123,166,167,168] | |||||
| Stand density | Tree density (TD) The number of trees and shrubs per hectare Planting density Stem density | Regional | + | [118,128,169] | Within a certain range, the higher the tree density the greater the biomass. Reasonable, high-density planting maintains the woodland ecosystem’s health. | |
| * | [170] | |||||
| Landscape | + | [122,124,125,129,140,163,171,172,173,174] | ||||
| / | [121] | |||||
| * | [144,175] | |||||
| Patch shape complexity | Average perimeter area ratio (PARA_MN) Landscape shape index (LSI) Edge density (ED) Shape index mean value (SHAPE_MN) Edge effect | Regional | + | [160,161,176] | A larger area of forest land with an irregular perimeter is exposed to external disturbances. This may result in the growth of marginal vegetation due to high temperatures but is not conducive to ecosystem stability. | |
| − | [130,151,152,153,155,159,177] | |||||
| Landscape | + | [168,178,179] | ||||
| − | [119,164,180,181,182] | |||||
| / | [183] |
| Group | Theme | Indicator | Metrics | Scale | Impact on Carbon Sinks | Articles | Impacts on Human Well-Being and Green Space Ecosystem Service Sustainability |
|---|---|---|---|---|---|---|---|
| Topological relationship between green space and urban areas | Adjacency | Green space–urban edge effect | Edge fragmentation Landscape shape index (LSI) Edge effect The gradient effect of urbanization | Landscape | + | [184,185] | Forests provide green products for residents. However, fragmentation caused by urbanization changes the growth conditions of forests. Although a fragmented forest edge can increase productivity under certain conditions, the heat stress at the forest edge can exceed a threshold, adversely affecting the green space ecosystem. |
| − | [186,187,188] | ||||||
| * | [166] | ||||||
| Separation | Carbon sequestration difference between urban and rural green spaces | Distance between the green space and the city Natural forests and urban forests | Regional | The carbon sink capacity is higher outside of the city | [189] | Urban forests can provide more ecological services to residents, but urbanization and fragmentation of green spaces have a more adverse impact on humans in urban areas than those in rural areas. | |
| Landscape | The carbon sink capacity is higher in the city | [34,122,166,185,190] | |||||
| The carbon sink capacity is higher outside the city | [119,123,124,125,171,173,186,191,192,193,194,195] | ||||||
| Inclusion | Cooling effect of green spaces on the city | Green cover Grass irrigation cover Shading coefficient Vegetation layout Vegetation aggregation Green index (quantity + structure) | Landscape | + | [33,196,197,198,199,200] | The cooling effect of urban forests reduces the urban heat island effect, improves the microclimate, and positively impacts the physical and mental health of residents. It reduces the heat stress response of plants; however, it results in an ecosystem that is fragile due to the size of the green space. |
Disclaimer/Publisher’s Note: The statements, opinions and data contained in all publications are solely those of the individual author(s) and contributor(s) and not of MDPI and/or the editor(s). MDPI and/or the editor(s) disclaim responsibility for any injury to people or property resulting from any ideas, methods, instructions or products referred to in the content. |
© 2024 by the authors. Licensee MDPI, Basel, Switzerland. This article is an open access article distributed under the terms and conditions of the Creative Commons Attribution (CC BY) license (https://creativecommons.org/licenses/by/4.0/).
Share and Cite
Liu, Y.; Fan, C.; Xue, D. A Review of the Effects of Urban and Green Space Forms on the Carbon Budget Using a Landscape Sustainability Framework. Sustainability 2024, 16, 1870. https://doi.org/10.3390/su16051870
Liu Y, Fan C, Xue D. A Review of the Effects of Urban and Green Space Forms on the Carbon Budget Using a Landscape Sustainability Framework. Sustainability. 2024; 16(5):1870. https://doi.org/10.3390/su16051870
Chicago/Turabian StyleLiu, Yuxin, Chenjing Fan, and Dongdong Xue. 2024. "A Review of the Effects of Urban and Green Space Forms on the Carbon Budget Using a Landscape Sustainability Framework" Sustainability 16, no. 5: 1870. https://doi.org/10.3390/su16051870
APA StyleLiu, Y., Fan, C., & Xue, D. (2024). A Review of the Effects of Urban and Green Space Forms on the Carbon Budget Using a Landscape Sustainability Framework. Sustainability, 16(5), 1870. https://doi.org/10.3390/su16051870