Abstract
The need to rapidly reduce greenhouse gases (GHGs) has accelerated the adoption of circular economy (CE) practices. However, this has proved challenging for small and medium enterprises (SMEs), who lack the financial, organizational, and informational capabilities to adopt circular business models. This paper highlights some of the SMEs’ challenges in adopting CE practices. It focuses on the need to calculate their carbon footprint (CF) by drawing on the literature examining the effect of information technologies (IT) on adopting CE strategies. This study aims to present a CF calculation tool used to calculate the CF of SMEs. The tool’s design is based on the Life Cycle Assessment (LCA) methodology, which assesses the environmental impact of a particular service or product over the different stages of its life cycle. The tool was tested in a small cheese factory in northern Greece, an SME representative of the country’s average SME. The production process was mapped, a GHG inventory was created, and the total emissions related to the production of a specific product were estimated. Our results show that adopting such CF calculation tools can have various implications regarding the organizational structure of SMEs, leading to cost reductions and reducing potential environmental impacts. The final aim is to test this tool at a large scale.
1. Introduction
Since the industrial revolution, the concentration of greenhouse gases (GHGs) in the atmosphere has gradually increased beyond Earth’s absorbing capacity, leading to global warming and anthropogenic climate change. In March 2023, the Intergovernmental Panel on Climate Change (IPCC) finalized its Sixth Assessment Report, stating that global warming will likely exceed 1.5 °C during this century. Natural ecosystems and human populations are already experiencing the negative impacts of climate change, which, unless mitigated, could lead to further environmental, social, and economic implications [1,2,3,4,5]. Moreover, if global warming is to be limited to 1.5 °C, significant GHG reductions must be achieved during this decade [1,5,6,7,8].
This transition towards a low-carbon future has been widely examined in light of the broad concept of sustainable development, which, since its initial definition in 1987 by the Brundtland Commission [9], has evolved and been adopted in various social, environmental, economic, and technological frameworks [10,11,12]. In this context, the circular economy (CE) model has emerged as the newest approach towards addressing sustainability goals, among which improving environmental quality is of utmost importance [13]. Tracing back to the work of Kenneth Boulding [14] and later to that of Pearce and Turner [15], CE has been extensively studied in business [16,17,18,19,20], academic [13,21,22,23,24,25,26,27], and policy contexts [28,29,30,31,32,33,34,35,36].
Although the link between CE and climate change has not been extensively examined in the academic literature, adopting CE strategies is generally considered to have a positive effect on the reduction of GHGs [37,38,39,40,41,42,43]. The Ellen MacArthur Foundation defines CE as “an industrial system that is restorative or regenerative by intention and design”. This system promotes renewable energy, phases out toxic chemicals, encourages product reuse, and eliminates waste production [44]. Consequently, CE strategies can reduce GHGs by improving industrial production processes that minimize waste production and energy consumption [37,38,39,40,41], promoting eco-innovation and product eco-design [38,40,41], and utilizing renewable energy [37,39,40,41]. So far, international research has examined specific themes regarding the relationship between CE and climate change. Among these, the most important are (1) the implementation of CE business models in industry [38,39,40,41], (2) the adoption of different approaches to waste management according to the different life stages of a product/service [39,40,41], (3) the transformation of the current energy systems through the adoption of renewable energy [37,39,40,41], and (4) the implementation of closed-loop supply chains [40,41,42]. Moreover, specific sectors such as construction [40,41,43,45,46], transportation [41,47,48], and agriculture [40,41,49] have been more carefully examined.
The core principles of CE, the 4R framework (reduce, reuse, recycle, and recover), and the systems perspective framework (micro, meso, and macro) [13] have been used as a basis for developing different methodologies for achieving the aim of sustainable development [50,51,52,53,54,55]. One example of such a methodology is product and service life-cycle assessment (LCA) [50,51,52,53,54,55]. A product’s LCA is based on the use of methodologies that assess the environmental impact of a particular service or product over the different stages of its life cycle. From acquiring the materials used in the production of the product to producing, distributing, and storing the product itself until its use and final disposal, each step focuses on inputs and outputs in the form of materials, energy, and waste [56,57,58,59]. This paper concentrates on a particular environmental impact category of a product’s LCA: climate change.
The need to limit climate change demands that businesses reduce their GHG emissions or carbon footprint (CF). Therefore, calculating the CF has emerged as a new business process necessary for setting GHG emission reduction goals, assessing performance towards these goals, and eventually reducing GHG emissions. The most common types of CFs are corporate CFs, which are calculated based on the GHG emissions produced at the company level [60], and product CFs, which are calculated based on the GHGs emitted during the life cycle of a specific product [56]. Therefore, a product’s CF can be used to assess the impact of a product’s life cycle on climate change and consequently form the basis for assessing CE strategies.
This study focuses on small and medium enterprises (SMEs) and the rationale behind calculating the CF of their products. Between 2021 and 2022, SMEs accounted for 99.8% of all enterprises in the non-financial business sector in the EU-27 [61,62], while approximately 93.5% of these enterprises were micro-SMEs, i.e., SMEs that employ fewer than ten staff [61,62]. Although data are scarce, it has been estimated that the average SME enterprise emits approximately 75 tons of greenhouse gas (GHG) emissions, which is very little compared to the 22,345 tons of GHG emissions for the average large enterprise [61]. However, due to the large number of SMEs in the overall enterprise population, their share of total annual emissions is 63.3% of all GHG emissions in the enterprise population [61]. Consequently, significant GHG reductions are necessary globally if global warming is to be limited to a global 1.5 °C, which cannot be achieved unless SMEs also reduce their GHG emissions.
As discussed above, adopting CE strategies can contribute to reducing GHGs, and the LCA methodology can be used to assess such strategies. However, SMEs’ financial, organizational, and informational capabilities are often limited. Therefore, they must assess their CE strategies to limit potential resource waste. CF can be used as a primary metric for assessing the climate change impact of different CE strategies. For this reason, SMEs need to calculate and manage their CF at the company and product level. This paper highlights some of the SMEs’ challenges in adopting CE practices. It focuses on the need to use CF calculation tools by drawing on the literature examining the effect of information technologies (IT) on adopting CE strategies.
We recommend some basic features that a CF calculation tool should have to be easily adopted by SMEs. Finally, we present a tool developed for calculating the product CF of SMEs and test this tool in a small cheese factory in northern Greece. This study is part of a project funded by the Hellenic Ministry of Development and Investments and the European structural and investment funds. The aim of the project was to create a system for collecting and analyzing data for calculating the CF in SMEs. The following sections provide a framework for analyzing SMEs’ barriers to adopting CE strategies based on previous academic research. Then, we review the basic IT systems that, according to international research, can accelerate the transition towards CE. The description of the CF calculation tool follows along with a small case study. Finally, we discuss how the tool can help SMEs overcome adoption barriers regarding CE strategies.
1.1. Small and Medium Enterprises (SMEs) and Circular Economy (CE)
Although large corporations often receive the most public attention regarding their environmental performance, SMEs have also been receiving increased pressure to improve their environmental performance. International research has extensively examined this relationship, i.e., between the adoption of green strategies, environmental performance, and corporate performance [63,64,65,66,67,68]. However, most of the same research has also highlighted the internal and external barriers that make SMEs hesitant about adopting environmental strategies. According to the European Union’s latest annual report on European SMEs, more than two-thirds of SMEs had adopted some resource-efficiency-related strategy, with minimizing waste and saving energy and materials being the most common strategies adopted [61]. However, in most cases, SMEs were restricted to implementing sporadic activities and did not attempt to completely re-design their products and processes [61].
Exploring the dynamic relationship between CE and SMEs, especially in the EU context [69,70,71,72,73,74,75,76,77,78,79,80,81,82], has received extensive attention among academics, while there is a substantial body of literature devoted to mapping the barriers that companies face in adopting CE strategies [83,84,85,86,87,88,89,90,91,92,93,94,95,96,97,98]. These barriers can be arranged into two broad categories based on a company’s level of influence, i.e., internal and external. Internal barriers are inherent to a company’s business practices and values, and external are those associated with stakeholders and are beyond the direct influence of the company. Based on our literature review, internal barriers can be classified as financial/economic, technological, organizational, informational, and cultural. At the same time, external barriers can also be classified as institutional/regulatory, supply-chain-related, and cultural. A summary of these barriers and the respective literature is presented in Table 1.

Table 1.
Barriers to the adoption of CE strategies.
One of the aims of this study is to provide a rationale for SMEs to calculate the CF of their products systematically. For this, we draw on the literature examining the barriers SMEs face in adopting CE strategies and elaborate on how calculating the CF of products can address some of these barriers. Although studies have yet to examine the benefits of calculating the CF of various activities, such as energy production [99,100], food production and farming [101,102], waste reduction [103], and packaging [104], they need to address specific products Moreover, studies have yet to examine how specific CE barriers can be addressed by calculating the CF of products. CF is a significant indicator of both sustainability and circularity. Companies need to be able to measure it to assess the CE strategies they have adopted.
From the standpoint of sustainability, a substantial body of literature has critically examined the limits of CE regarding the transformation of current business models [26,105,106,107,108,109]. This is particularly important for climate change because many CE strategies require additional energy and material resources, which produce emissions, making the interplay between climate change and circularity rather complex [105,107,109]. Calculating the CF at the product level breaks a product’s lifecycle into different stages, from procurement of the raw materials used in the production stage to the final disposal after its use, while mapping the energy inputs and material outputs at each stage. Therefore, it can highlight potential CE strategies that can lead to emission reductions by providing a detailed assessment of the different flows of energy and materials at each lifecycle stage.
Regarding SMEs and the barriers they face in adopting CE strategies, calculating the CF of products can mitigate some of the significant internal barriers. Since CE strategies often require large capital investments, the fact that SMEs have limited capital or financial resources discourages them from implementing CE strategies, especially when those strategies do not guarantee an increased rate of return. As explained above, the CF of products is a significant indicator of circularity, especially when calculated at a level that allows for the direct comparison of similar products/services. Additionally, since emissions are associated with energy and material consumption, a CE strategy that reduces the CF of a product is more likely to reduce the consumption of energy and raw materials and, consequently, the production costs. Therefore, calculating a product’s CF and estimating how it changes when a CE strategy is implemented can provide a rough assessment of whether investing in the particular strategy will pay off.
Moreover, calculating the CF of products can help SMEs overcome the organizational and informational barriers associated with adopting CE strategies. Calculating a product’s CF requires a clear definition of the GHG inventory boundaries and processes attributed to the product’s lifecycle that is analyzed [56]. Therefore, it indirectly maps the organizational and operational boundaries of the company that produces the product, thus allowing for a better understanding of its organizational structure. This could help SMEs choose CE strategies that do not challenge their current organizational structure or allow for better integration of CE strategies into their core business processes. Furthermore, calculating a product’s CF before adopting CE strategies could enhance management support and reduce the administrative burden of implementing CE strategies. Weak management support is often attributed to the lack of information and knowledge regarding the benefits of CE strategies and the increased administrative burden that results from changes in the current business structure [38]. However, since a product’s CF analysis provides detailed information regarding all lifecycle stages, it can reduce uncertainty and allow for a better understanding of the benefits of CE.
Finally, regarding the external barriers to adopting CE strategies, calculating a product’s CF allows for a better assessment of suppliers and business partners. Since calculating the CF of a product is based on the LCM methodology, it incorporates the climate change impact of the procurement of raw materials or semi-final products used in the production process [56]. Information related to the CF of raw materials and other inputs, as well as information related to the transportation of the above, can help SMEs assess suppliers and business partners that are necessary for the implementation of CE strategies. However, information regarding the climate change practices of suppliers or partners is only sometimes available. Therefore, collecting data to assess suppliers and partners requires additional resources and could eventually increase the administrative burden of potential CE strategies.
Addressing the internal and external barriers to adopting CE strategies has proven particularly troublesome for SMEs, so they must utilize innovative IT technologies. In the following section, we elaborate on the role of IT technologies in implementing CE strategies. In the above context, we also examine the development and adoption of CF calculation programs. We conclude by pointing out some basic features that a CF program should have in order to be easily adopted by SMEs.
1.2. Information Technology (IT) and Circular Economy (CE)
The role of information technology (IT) in accelerating the deployment of circular economy (CE) business models [110,111,112,113] and sustainability [114] has been extensively examined in academic research [111]. The so-called “Industry 4.0” technologies, such as the Internet of Things (IoT), cloud computing, big data, artificial intelligence (AI), cyber-physical systems (CPS), blockchain, augmented and virtual reality (AR and VR), additive manufacturing (3D printing) and 5G, have been examined as enabling technologies that could help the transition from linear to circular business models. A review of the above technologies and their supportive research is presented in Table 2. Some of these studies provide a general description of the relationship between CE and Industry 4.0 technologies [110,111,112,113,115], while others focus on specific technologies [116,117,118,119,120] and specific aspects of CE, such as sustainable supply chain management [116,117,119], sustainable product management [121,122], sustainable manufacturing [117,122], and remanufacturing [123].
Table 2.
IT systems in CE.
However, those technologies often require digital maturity and organizational and operational capabilities that many companies, especially SMEs, do not often possess [132,133,134,135]. Among the significant challenges SMEs face in adopting Industry 4.0 technologies are limited financial resources, limited technical knowledge and technology awareness, and organizational resistance [132,133,134,135]. Therefore, in order to be successfully adopted by SMEs, they must be perceived as highly beneficial to their core business activities [133] and be able to be implemented at a low cost [135], preferably by exploiting existing resources [135]. Moreover, they should allow for the following [134,135]:
- Integration of IoT systems for better supply chain management and data documentation.
- Optimization of the production process.
- Traceability would allow for increased control over the production process and limit errors.
- Data collection, processing, and information visualization would help SMEs utilize relevant information.
Although calculating the carbon footprint (CF) at the company or product level is not the same as adopting CE business models, utilizing information best is as important in CF calculation as in any CE strategy. Consequently, Industry 4.0 technologies can also be used in the CF calculation. The CF calculation tool developed and presented in the following section can be classified as cloud computing technology since it is a web-based application that allows remote access to business processes and facilitates user interaction and information sharing of all manufacturing resources and processes [93,97]. Moreover, its design can incorporate IoT features such as recording data in real-time, e.g., from electricity consumption meters.
Currently, there are several carbon footprint calculation tools available in the market. Some of them are best suited for calculating household emissions, such as the Cool Climate calculator, the WWF footprint calculator, and the UN carbon footprint calculator. In contrast, others are more suitable for calculating a business’s carbon footprint, such as the EPA Simplified GHG Emissions Calculator (EPA Center for Corporate Climate Leadership, www2.epa.gov/climateleadership, 1200 Pennsylvania Ave., NW (Mail Code 6202A), Washington, DC 20460, USA), Terrapass Business Calculator (Terrapass, https://terrapass.co.uk/carbon-footprint-calculator), and CarbonTrust (The Carbon Trust, Level 5, Arbor, 255 Blackfriars Road, London, SE1 9AX, U.K., https://www.carbontrust.com/our-work-and-impact/guides-reports-and-tools/sme-carbon-footprint-calculator). Additionally, some tools are designed for specific sectors, such as the CoolFarm (The Cool Farm, 87b Westgate, Grantham, Lincolnshire, NG31 6LE England, https://app.coolfarmtool.org/account/login/?next=/) tool for the farming sector or the Green Key carbon calculation tool (Also known as the “Hotel Carbon Measurement Initiative” (HMCI) tool developed by the Sustainable Hospitality Alliance (SHA), a registered charity in England and Wales (1188731), Company limited by guarantee (12373950) https://www.greenkey.global/carbon-calculation-tool-2) tool for the tourism sector. Moreover, some of these tools are targeted mainly at households or businesses in specific countries, such as the EPA Simplified GHG Emissions Calculator and Terrapass, which are targeted mainly at a US audience. In contrast, the WWF and the CarbonTrust footprint calculator target UK residents and enterprises, respectively. Additionally, several LCA software tools, such as GaBi (The GaBi Software has been renamed as “Sphera LCA” modelling and reporting software, Sphera, Chicago, IL, USA, https://sphera.com/product-sustainability-software/), SimaPro (SimaPro, PRé Sustainability, Stationsplein 121, 3818 LE Amersfoort, The Netherlands, https://simapro.com/business/), and Umberto (Umberto Software, iPoint-systems gmbh, Ludwig-Erhard-Str. 58, 72760, Reutlingen–Germany, https://www.ifu.com/product-carbon-footprint/), are suitable for LCA analysis.
Regarding the carbon footprint of SMEs, some tools have been customized to the needs of SMEs, such as the SME Carbon Footprint Calculator by CarbonTrust, which has been designed for UK-based SMEs, and the Terrapass calculator, which can be customed for small businesses but is also targeted for a US audience. Regarding LCA analysis, commonly used tools, such as GaBi, SimaPro, and Umberto, are targeted at larger businesses and generally require skilled personnel who have to be trained in order to use them. Moreover, they are often not cloud-based, which limits their flexibility. On the other hand, the fact that databases often back them allows for mapping complex life-cycle models and multiple scenario analysis, which is impossible with tools such as the one presented in this paper. Nevertheless, SMEs often do not require such complex analysis. Most importantly, they lack the technical expertise to operate such tools, the organizational resources to implement such LCA analysis, and most importantly, the financial resources to afford such tools. Finally, for SMEs that are not based in English-speaking countries, the fact that all carbon footprint tools are in English can also pose a limitation because the terminology used in these tools requires an advanced knowledge level of the English language, which should not be taken for granted for the personnel employed in SMEs.
The tool presented in this study aims to address some of the issues described above. In the following sections, we present the methods and materials used in developing the CF calculation tool and the tool itself.
2. Materials and Methods
The LCA methodology has been used to analyze and evaluate circular business models [50,51,52]. Recent studies that include both LCA evaluation and circular assessment have been conducted in manufacturing [51,55,136,137,138,139,140], farming and livestock raising [54,141,142], and built environment [53]. The product CF methodology presented in this paper follows the LCA methodology, which examines all the stages of a product’s life cycle, from the extraction of raw materials, the processing and transformation process, the distribution of the final product, its use, and final disposal. This study is based on the LCA methodology provided by the GHG Protocol [56], the ISO 14040 [57], ISO 14044 [143], and ISO 14067 [144] standards, and the BSI/DEFRA/Carbon Trust PAS 2050 standard [59].
A carbon footprint consists of the flow of services, materials, and energy that become the product, create it, and transport it through its life cycle. These include the raw materials, the processes that create the product, the materials used to improve its quality, and the energy used to move, create, and store the product. The LCA stages that were used as a basis for developing the CF calculation tool presented in this study are the five essential stages of a product’s life cycle as defined by the Greenhouse Gas Protocol: material acquisition and pre-processing, production, distribution and storage, use, and end-of-life. These interconnected stages make up the life cycle of a product and provide a helpful way of organizing processes, collecting data, and calculating the CF of a product.
An LCA can be conducted at different levels. The cradle-to-grave LCA examines a product’s life cycle, from acquiring the raw materials used in the production process to its final disposal. At the same time, the cradle-to-gate LCA stops at the point where the product is at the “factory gate”, ready to be shipped either for final consumption or as input to another life cycle. Finally, the cradle-to-cradle LCA, considered the most complete, focuses on the product’s life cycle as well as on the recycling stage. The LCA methodology used in the study follows the cradle-to-gate perspective. We chose this LCA type because it can be easily applied to the average SME. As discussed above, SMEs often have limited financial and organizational resources. Therefore, calculating emissions related to processes not directly controlled by them, especially those that occur after the product has left the “factory gate”, can be quite troublesome and sometimes non-applicable.
For this reason, we did not include modules to map the stages of using and disposing of the final product. The only stage that was implemented, which takes place after the final product has left the factory gate, is the distribution stage. This module can be used by SMEs that can acquire data related to the distribution of their products.
The product CF calculation tool was designed based on the needs of SMEs in order to help them.
- Map their business processes according to the LCA method
- Calculate the product CF
- Gain a better insight into the carbon impact of their business
- Identify carbon-intensive procedures in their business cycle
In the following sections, we describe the tool developed along with a small case study in which the tool was applied. First, we present our case study and then proceed with the description of the tool.
2.1. Case Study
In this paper, we present the case of a small cheese manufacturing factory in northern Greece that produces a type of semihard to hard, elastic cheese that is served grilled (similar to the “halloumi” cheese). This type of cheese is popular in restaurants because it can be easily cooked and can accompany various dishes due to its light taste. During production, whey is produced as a by-product, which is sold to an external partner as biofuel. At the time of the research, the enterprise employed 12 staff, and its annual turnover was less than €2 million, which classifies the company to the micro-SME category (a strict classification would put the enterprise in the small SME category due to the number of employees, which should be under 10, but we believe that this particular enterprise should be classified as a micro-SME, mainly due to its annual turnover and the fact that it is very close to the employee limit) [145]. We deliberately chose a micro-SME because, as mentioned in the latest 2023 SME Country Fact Sheet, the Greek SME landscape has a higher share of microenterprises than the EU average. Moreover, according to the same report, more people are employed in micro-SMEs compared to the EU (46.6% against 29.4% in the EU) [145]. Therefore, this particular enterprise is representative of the average Greek SME enterprise.
The environmental impacts of the production of dairy products have been extensively examined in the academic literature, with research focusing on the production of various dairy products such as milk [146,147,148,149,150,151,152], butter [146,147], cheese [146,148,152,153,154,155,156,157,158,159,160,161], and yogurt [147,150,162]. Most studies have highlighted the fact that raw milk is responsible for the majority of GHG emissions related to the production of dairy products [146,148,149,151,153,154,155,156,157,158,159] since its production results in GHGs emitted from animal enteric fermentation, manure management, and land use. Further sources contributing to the CF of dairy products can be traced in the dairy processing phase [146,153,154,158,160] and are mainly related to energy consumption.
The tool that is presented in this study does not provide estimates of the carbon footprint of raw milk; therefore, in order to estimate the carbon footprint based on the cradle-to-gate methodology, we will use an estimate of the carbon footprint of milk based on the research of Laca et al. [160]. We will use the estimated 1.22 kg CO2eq per kg of fat and protein-corrected milk obtained by semi-confinement dairy farm systems in northern Spain. Since the company that manufactures the product that we study (cheese) is stationed in northern Greece, and its suppliers are also stationed in the same area, this estimate of the carbon footprint of milk is appropriate for our analysis. The production process of the product is presented in Figure 1.

Figure 1.
The production process of cheese.
2.2. Data Collection
The emission factors used in calculating the CF of the respected product were based on the guidelines and data provided by the IPCC [163] and the EEA [164]. The emission factors used to calculate emissions from electricity consumption were based on the values annually announced for each energy supplier by the “Administrator of Renewable Energy Sources and Guarantees of Origin”, the organization responsible for managing the renewable energy sources of the Greek national interconnected electricity system.
Regarding the product’s production process, a dataset including the time of each production stage, the inputs and outputs, the equipment used, and their respective energy consumption was compiled based on the company’s HACCPC (Hazard Analysis and Critical Control Points) certification, which includes an analytical description of the product’s production process. Finally, the calculation of the carbon footprint of the particular batch, which is presented in the following section, real-time data were collected, in addition to those included in the database above. Real-time data included the number of inputs and outputs of each production stage.
3. Tool’s Description and Results
The main interface of the tool consists of four basic modules:
- The dashboard, which provides an overview of the company’s emissions at the corporate level
- The company, where the user can map the company’s structure by adding different departments (facilities), equipment used in those departments, and company-owned vehicles.
- The QMS (abbreviation for Quality Management System) allows the user to design the production process; create an inventory of materials (raw materials, semi-ready products, and final products), suppliers, customers, and distributors; and manage orders, receipts, and storage of the materials.
- The ENV is where the user can manage any energy-related information, such as adding power sources and their respective emission factors and keeping a record of energy-related bills.
The mapping of the business processes begins with defining the facilities that will be included in the analysis. Each facility can be divided into different zones (e.g., production sites, offices, parking lots). This categorization facilitates the calculation of the carbon footprint of products, as it makes it possible to separate the processes that are directly attributed to the production of the product from those that are not, a prerequisite required by the GHG Protocol Carbon Footprint Standard. Our case study separates the main facility into two zones: the PRODUCTION FACILITY and the OFFICES (Figure 2).
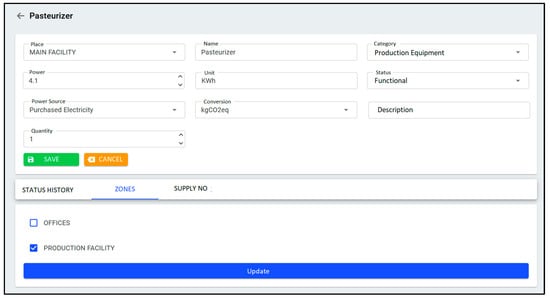
Figure 2.
Data recorded for production equipment (pasteurizer).
The next step is to create an equipment inventory containing all the equipment used in the production process. For each type of equipment, the following information is required: the name of the equipment, its categorization (whether it is used in the production process or at the offices), its power source and the respective measurement unit, its status (whether it is functional, under maintenance or malfunctioning), its power source (in our case, all the equipment in the production process are powered by electricity, provided by a power supplier) and the desired conversion method (one can choose to calculate CO2 equivalents, kg of CO2, CH4, N2O). Figure 2 shows the data recorded for a pasteurizer used in the production facility, and Figure 3 shows all the equipment used in the production process.
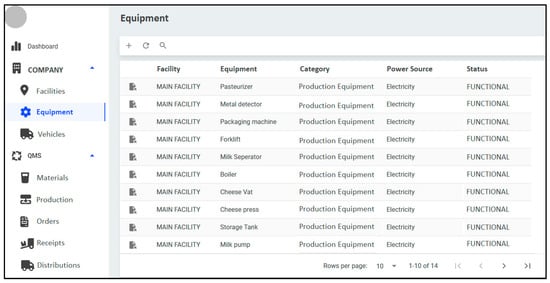
Figure 3.
Equipment participating in the production process.
The application can be designed to accept any conversion method since the emission factors used in calculating the desired output are also treated as a separate process that the user can create. For example, the company that manufactures the product owns a large truck that is powered by diesel. The truck is categorized as a EURO 6 heavy-duty vehicle (Figure 4). Figure 5 provides a snapshot of how the emission factor related to this particular vehicle is implemented. The user can create the respective power source (i.e., diesel) and link it to any conversion she/he wishes (i.e., kgCO2/km for a EURO 6 heavy-duty vehicle).
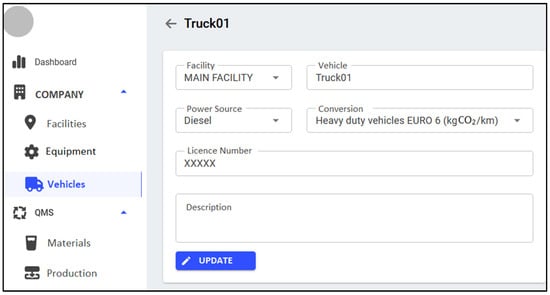
Figure 4.
Adding a company-owned vehicle.
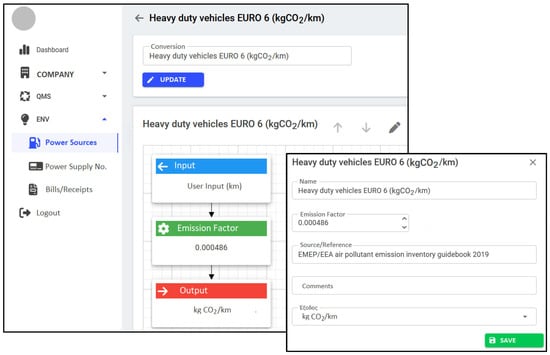
Figure 5.
Adding emission factors.
Consequently, when the user enters data regarding the distance traveled with this particular vehicle, the tool automatically calculates the emissions related to this particular travel distance. The same procedure is followed when the user enters data on the vehicles that suppliers or distributors own. Each vehicle can be identified by its unique license plate number, which makes it easy for the user to enter data related to the receipt of materials.
Creating the materials inventory is another essential stage in mapping the business process (Figure 6). The materials inventory contains all materials used in the production process: final, raw, semi-ready, and by-products.
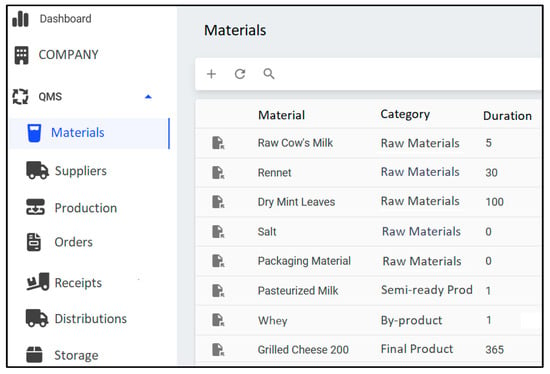
Figure 6.
List of recorded materials.
When the user creates a production line, the materials are used as input or output of the different production stages. For example, when the user creates a production line for cheese, he creates the different production stages. For each stage, he enters the respective inputs (raw materials, semi-ready products), the production equipment, and the output of this process. In Figure 7, the coagulation stage of cheese production is presented.
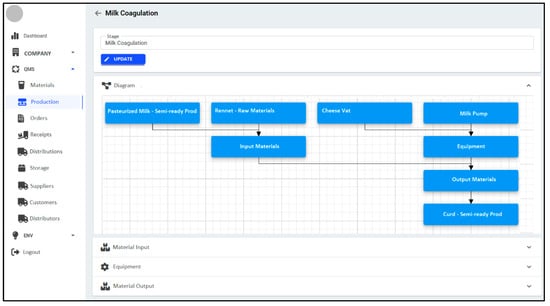
Figure 7.
The coagulation stage of cheese production.
After creating the production line, the user can enter data related to different production numbers (which can be identified via their LOT number). For example, a production with the lot number 10002 is presented in Figure 8.
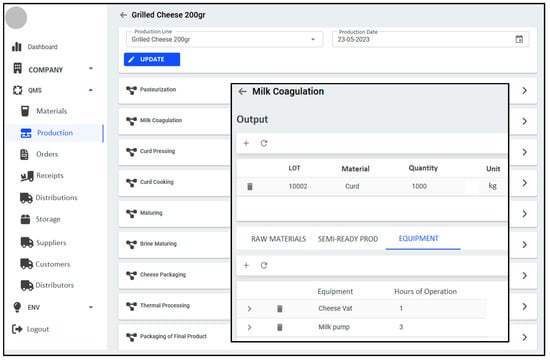
Figure 8.
An overview of the production line.
For each production stage, the user enters the output material (final product, by-product, or semi-ready product), its quantity, and unit of measurement. Then, he enters the production equipment and the respective hours of operation, the raw materials, and the semi-ready products of previous stages. In this way, emissions related to energy consumption are allocated to each production stage. Figure 9 shows the total emissions related to the specific product LOT number as well as the emissions/kg of the final product. Emissions related to the operation of each type of equipment are available, as well as emissions related to company, supplier, and distributor vehicles. Each batch of products can be identified by its specific LOT number and unique QR code, which is automatically generated for each LOT number.
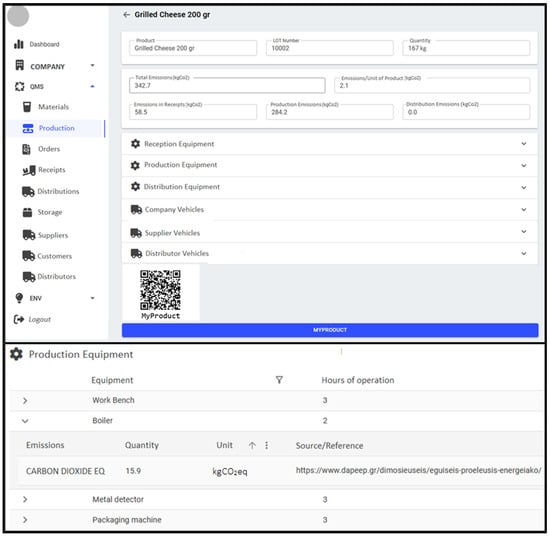
Figure 9.
An overview of the emissions related to a batch of products.
The results presented in Figure 9 show that 342.7 kg of CO2 was emitted during the production of 167 kg of the final product. These emissions include the transportation of raw materials and the storage of raw milk before processing. They do not include emissions related to refrigerants, heating and cooling of premises, and packaging; for the production of 167 kg of cheese, 1350 kg of raw milk was used, which corresponds to approximately 1647 kg CO2eq based on the research of Laca et al. [160]. Therefore, the total emissions related to the production of this batch of cheese are 1989.7 kg CO2eq, or 11.91 kg CO2eq/kg of product. This estimate is similar to the results of other studies, which provide estimates of the carbon footprint of cheese production ranging between 10.2 and 16.9 [151,152,154,157,158].
4. Discussion
Drawing on the literature examining the barriers SMEs face in adopting CE strategies, we designed a CF calculation tool considering the financial, technological, organizational, informational, and cultural barriers that may emerge when SMEs try to create an emissions inventory and calculate their product CF. Regarding the financial and technological barriers, we argued that SMEs often lack the economic and technological capabilities to adopt CE practices. Therefore, it is essential that those practices can be adopted at a low cost and fully exploit the company’s current resources, thus minimizing the need for extensive investments. The tool that was developed is a web-based application; it requires minimal financial resources to adopt. Moreover, its design is user-friendly and does not require specialized technical skills.
In addressing the organizational, informational, and cultural barriers towards the adoption of the tool, because most of the SMEs lack specialized knowledge regarding carbon footprint calculation methodologies, we deliberately avoided using terminology such as scope 1, 2, 3, direct/indirect emissions, purchased energy, organizational/operational boundaries, which are used in most carbon accounting standards. One of our aims in developing this tool was to minimize the need for users to be accustomed to the process of identifying and categorizing emission sources because that would require additional training for the user to be able to use the tool, and in our opinion, would discourage the adoption of the tool.
Additionally, we organized the tool based on mainstream operations, i.e., orders, distribution, customers, and suppliers, since most SMEs are accustomed to them. The users have to add some additional information (type of vehicle) when processing mainstream data, such as orders and receipts, which increases the administrative burden to some degree but does not require mapping emission sources separately from mainstream operations, which would considerably raise the administrative cost. The fact that this is a web application allows for multiple users to have access to the tool. Therefore, each user can record data according to his/her area of expertise. For example, personnel directly involved in the production process can enter data needed for mapping the production equipment, and data related to the distribution of products can be entered by personnel who manage distributions. This procedure facilitates data collection and shares the administrative burden among all participants. Also, we organized data entry based on the product’s production stages, allowing users to monitor emissions related to each stage, identify hotspots, and thus optimize the production procedure. However, a necessary condition for this procedure is for all participants to be willing to share this additional burden. Therefore, overcoming the cultural barriers is still a matter that needs to be addressed.
Regarding the technological features the tool should have to be successfully incorporated into core business activities, integration, traceability, and data management are all achieved. The system developed allows for integrating IoT devices, such as energy or temperature meters. Additionally, it offers traceability both at the production stage, using a unique LOT number assigned in each product batch, and at the reception of the inputs stage since it allows the mapping of suppliers and their respective vehicles. Regarding data collection and processing, the application allows for data mapping and visualization of the production process at each stage, making it easier for the user to extract relevant information. Finally, this tool was developed to address the needs of Greek SMEs; therefore, in its commercial form, it is in Greek, not in English, as presented in this paper, which overcomes potential limitations regarding the English language skills necessary for using other CF calculation tools.
As discussed in the literature review section, overcoming the internal organizational barriers regarding adopting CE practices is essential in successfully implementing these practices. Among those, incompatibility with the company’s current organizational structure often increases the administrative burden of CE practices and reduces their potential positive effects on its environmental performance. Calculating the CF of an SME can form a basis for assessing the various CE practices in terms of environmental impact, operational changes, and cost implications. Regarding the operational changes that are most likely to be implemented by SMEs, these include restructuring an SME’s processes according to the life-cycle stages required by the LCA methodology, which could potentially increase the organizational burden of a company. That is why, in developing this tool, we decided not to follow the strict categorization of the stages described by GHG protocol and to allow for a more flexible organization of the processes implemented in the tool. The protocol also notes that the company may organize the stages better to reflect the life cycle of its particular product. For example, a company may want to split one stage into multiple stages (such as separating distribution from storage) or use a term that better describes the stages’ processes.
In terms of cost implications and potential environmental impact for SMEs, the fact that the tool allows for a detailed mapping of a company’s life-cycle stages allows for a better understanding of the environmental impacts of each stage and how the emissions related to each stage are allocated between the equipment that is used in each stage. Therefore, it allows for comparing different alternatives regarding adopting specific technologies and their impact on the environment, particularly on energy consumption and carbon emissions. Moreover, since, most times, reducing energy consumption also results in cost reduction, the CF calculation tool can be used to map alternatives regarding reducing production costs, energy consumption, and carbon emissions.
5. Conclusions
This research aimed to develop a CF calculation tool that can be adjusted to the needs of SMEs. The beta version presented in this paper was used to map a small cheese factory’s production process and calculate the CF of one of its products. The development of this tool can contribute to advancing the calculation of CF in SMEs in the following manner. First, it allows for a complete mapping of the LCA stages of a particular product or service according to the structure of their current processes. Second, specialized knowledge regarding the boundaries and the scopes of carbon reporting is not necessary when using the specific tool; its design is more aligned with daily business processes, such as the reception of raw material, production, storage, etc. Finally, it allows for comparisons between different production processes since emissions are allocated to each stage and the equipment used in the particular stage, making it easier for managers to identify energy consumption hotspots.
This version has several limitations that are to be addressed at a later stage of the project. First, it does not provide a process for the fugitive emissions related to the use of refrigerants to be included in the product’s emission inventory. Second, it does not consider emissions related to the production of raw materials, the consumption of the final product, and its disposal. Regarding the production of raw materials, a process should be implemented that would allow the user to enter emission factors related to the production of specific materials based on the results of international research. Emissions related to the consumption and disposal of the final product should also be incorporated into the tool based on preestablished consumption patterns. These elements will be added in the second phase of the project. Future research should focus on testing the CF calculation tool at a large scale and gathering data related to the usability of the tool. Moreover, a comparative analysis of other existing CF calculation tools should be conducted.
Our research has several implications. Regarding policymaking, specific standards for calculating the CF in SMEs should be designed, and the adoption of CF calculation tools should be promoted. Research programs that develop tools appropriate for all SMEs and tools for specific sectors of particular interest to each country, such as the dairy or tourist sectors, should also be funded. Business associations should facilitate collaboration between SMEs and program developers, reducing information gaps and allowing for more appropriate development of calculation tools. Finally, developers should design tools that can integrate IoT technologies, directly import data from devices such as sensors or meters, and have simplified user interfaces with more graphic elements that do not require specialized knowledge.
6. Patents
The software presented in this paper, “Kwattum”, is owned by Kloni Paraskevi SP, Agia Paraskevi P.O. Box 609, P.C. 57001, Thermi, Thessaloniki, Greece.
Author Contributions
Conceptualization, I.E. and E.A.; methodology, E.A.; formal analysis, E.A.; writing—original draft preparation, E.A.; writing—review and editing, I.E. and E.A.; supervision, I.E. All authors have read and agreed to the published version of the manuscript.
Funding
This research received no external funding.
Institutional Review Board Statement
Not applicable.
Informed Consent Statement
Not applicable.
Data Availability Statement
Restrictions apply to the availability of these data. Data were obtained from Kloni Paraskevi and are available from the authors with the permission of Kloni Paraskevi.
Conflicts of Interest
The authors declare no conflicts of interest.
References
- IPCC. AR6 Synthesis Report: Climate Change 2023; IPCC: Geneva, Switzerland, 2023; Available online: https://www.ipcc.ch/report/sixth-assessment-report-cycle/ (accessed on 10 December 2023).
- Hoegh-Guldberg, O.; Jacob, D.; Taylor, M.; Guillén Bolaños, T.; Bindi, M.; Brown, S.; Camilloni, I.A.; Diedhiou, A.; Djalante, R.; Ebi, K.; et al. The Human Imperative of Stabilizing Global Climate Change at 1.5 °C. Science 2019, 365, eaaw6974. [Google Scholar] [CrossRef] [PubMed]
- Arneth, A.; Shin, Y.-J.; Leadley, P.; Rondinini, C.; Bukvareva, E.; Kolb, M.; Midgley, G.F.; Oberdorff, T.; Palomo, I.; Saito, O. Post-2020 Biodiversity Targets Need to Embrace Climate Change. Proc. Natl. Acad. Sci. USA 2020, 117, 30882–30891. [Google Scholar] [CrossRef] [PubMed]
- European Food Safety Authority (EFSA); Maggiore, A.; Afonso, A.; Barrucci, F.; Sanctis, G.D. Climate Change as a Driver of Emerging Risks for Food and Feed Safety, Plant, Animal Health and Nutritional Quality. EFSA Support. Publ. 2020, 17, 1881E. [Google Scholar] [CrossRef]
- Moriarty, P.; Honnery, D. The Risk of Catastrophic Climate Change: Future Energy Implications. Futures 2021, 128, 102728. [Google Scholar] [CrossRef]
- Meinshausen, M.; Lewis, J.; McGlade, C.; Gütschow, J.; Nicholls, Z.; Burdon, R.; Cozzi, L.; Hackmann, B. Realization of Paris Agreement Pledges May Limit Warming Just below 2 °C. Nature 2022, 604, 304–309. [Google Scholar] [CrossRef] [PubMed]
- Höhne, N.; Gidden, M.J.; den Elzen, M.; Hans, F.; Fyson, C.; Geiges, A.; Jeffery, M.L.; Gonzales-Zuñiga, S.; Mooldijk, S.; Hare, W.; et al. Wave of Net Zero Emission Targets Opens Window to Meeting the Paris Agreement. Nat. Clim. Chang. 2021, 11, 820–822. [Google Scholar] [CrossRef]
- Matthews, H.D.; Wynes, S. Current Global Efforts Are Insufficient to Limit Warming to 1.5 °C. Science 2022, 376, 1404–1409. [Google Scholar] [CrossRef]
- Brundtland, G.H. Our Common Future—Call for Action. Environ. Conserv. 1987, 14, 291–294. [Google Scholar] [CrossRef]
- Hajian, M.; Jangchi Kashani, S. 1—Evolution of the Concept of Sustainability. From Brundtland Report to Sustainable Development Goals. In Sustainable Resource Management; Hussain, C.M., Velasco-Muñoz, J.F., Eds.; Elsevier: Amsterdam, The Netherlands, 2021; pp. 1–24. [Google Scholar] [CrossRef]
- Mondini, G. Sustainability Assessment: From Brundtland Report to Sustainable Development Goals. Valori Valutazioni 2019, 23, 129–137. [Google Scholar]
- Schaltegger, S.; Wagner, M. Sustainable Entrepreneurship and Sustainability Innovation: Categories and Interactions. Bus. Strategy Environ. 2011, 20, 222–237. [Google Scholar] [CrossRef]
- Kirchherr, J.; Reike, D.; Hekkert, M. Conceptualizing the Circular Economy: An Analysis of 114 Definitions. Resour. Conserv. Recycl. 2017, 127, 221–232. [Google Scholar] [CrossRef]
- Boulding, K. The Economics of the Coming Spaceship Earth. In Environmental Quality in a Growing Economy; Jarrett, H., Ed.; Johns Hopkins University Press: Baltimore, MD, USA, 1966. [Google Scholar]
- Pearce, D.W.; Turner, P.K. The Economics of Natural Resources and the Environment; Harvester Wheatsheaf: Hemel Hempstead, UK, 1990. [Google Scholar]
- Lacy, P.; Keeble, J.; McNamara, R.; Rutqvist, J.; Haglund, T.; Cui, M.; Cooper, A.; Pettersson, C.; Kevin, E.; Buddemeier, P. Circular Advantage: Innovative Business Models and Technologies to Create Value in a World without Limits to Growth; Accenture: Chicago, IL, USA, 2014; Volume 24. [Google Scholar]
- Steinberg, G.; Rodysill, J. How Closing the Supply Chain Loop Opens the Door to Long-Term Value. 2021. Available online: https://www.ey.com/en_gl/consulting/how-closing-the-supply-chain-loop-opens-the-door-to-long-term-value (accessed on 18 December 2023).
- Gartner. 3 Supply Chain Strategies to Accelerate Circular Economy Outcomes. 2021. Available online: https://www.gartner.com/smarterwithgartner/3-supply-chain-strategies-to-accelerate-circular-economy-outcomes (accessed on 15 October 2023).
- Hannon, E.; Magnin-Mullez, C.; Vanthournot, H. The Circular Economy: Moving from Theory to Practice. 2016. Available online: https://www.mckinsey.com/capabilities/sustainability/our-insights/the-circular-economy-moving-from-theory-to-practice (accessed on 15 October 2023).
- Ellen MacArthur Foundation and McKinsey & Company. Towards the Circular Economy: Accelerating the Scale-Up Across Global Supply Chains; World Economic Forum: Geneva, Switzerland, 2014; Available online: https://ellenmacarthurfoundation.org/towards-the-circular-economy-vol-3-accelerating-the-scale-up-across-global (accessed on 15 October 2023).
- Geissdoerfer, M.; Savaget, P.; Bocken, N.M.P.; Hultink, E.J. The Circular Economy—A New Sustainability Paradigm? J. Clean. Prod. 2017, 143, 757–768. [Google Scholar] [CrossRef]
- Ghisellini, P.; Cialani, C.; Ulgiati, S. A Review on Circular Economy: The Expected Transition to a Balanced Interplay of Environmental and Economic Systems. J. Clean. Prod. 2016, 114, 11–32. [Google Scholar] [CrossRef]
- Lewandowski, M. Designing the Business Models for Circular Economy—Towards the Conceptual Framework. Sustainability 2016, 8, 43. [Google Scholar] [CrossRef]
- Nußholz, J.L.K. Circular Business Models: Defining a Concept and Framing an Emerging Research Field. Sustainability 2017, 9, 1810. [Google Scholar] [CrossRef]
- Lieder, M.; Rashid, A. Towards Circular Economy Implementation: A Comprehensive Review in Context of Manufacturing Industry. J. Clean. Prod. 2016, 115, 36–51. [Google Scholar] [CrossRef]
- Murray, A.; Skene, K.; Haynes, K. The Circular Economy: An Interdisciplinary Exploration of the Concept and Application in a Global Context. J. Bus. Ethics 2017, 140, 369–380. [Google Scholar] [CrossRef]
- Blomsma, F.; Brennan, G. The Emergence of Circular Economy: A New Framing Around Prolonging Resource Productivity: The Emergence of Circular Economy. J. Ind. Ecol. 2017, 21, 603–614. [Google Scholar] [CrossRef]
- de Melo, T.A.C.; de Oliveira, M.A.; de Sousa, S.R.G.; Vieira, R.K.; Amaral, T.S. Circular Economy Public Policies: A Systematic Literature Review. Procedia Comput. Sci. 2022, 204, 652–662. [Google Scholar] [CrossRef]
- Su, B.; Heshmati, A.; Geng, Y.; Yu, X. A Review of the Circular Economy in China: Moving from Rhetoric to Implementation. J. Clean. Prod. 2013, 42, 215–227. [Google Scholar] [CrossRef]
- McDowall, W.; Geng, Y.; Huang, B.; Barteková, E.; Bleischwitz, R.; Türkeli, S.; Kemp, R.; Doménech, T. Circular Economy Policies in China and Europe. J. Ind. Ecol. 2017, 21, 651–661. [Google Scholar] [CrossRef]
- Mhatre, P.; Panchal, R.; Singh, A.; Bibyan, S. A Systematic Literature Review on the Circular Economy Initiatives in the European Union. Sustain. Prod. Consum. 2021, 26, 187–202. [Google Scholar] [CrossRef]
- Arsova, S.; Genovese, A.; Ketikidis, P.H.; Alberich, J.P.; Solomon, A. Implementing Regional Circular Economy Policies: A Proposed Living Constellation of Stakeholders. Sustainability 2021, 13, 4916. [Google Scholar] [CrossRef]
- Avdiushchenko, A.; Zając, P. Circular Economy Indicators as a Supporting Tool for European Regional Development Policies. Sustainability 2019, 11, 3025. [Google Scholar] [CrossRef]
- Camilleri, M.A. European Environment Policy for the Circular Economy: Implications for Business and Industry Stakeholders. Sustain. Dev. 2020, 28, 1804–1812. [Google Scholar] [CrossRef]
- Ignatyeva, M.; Yurak, V.; Dushin, A.; Strovsky, V.; Zavyalov, S.; Malyshev, A.; Karimova, P. How Far Away Are World Economies from Circularity: Assessing the Capacity of Circular Economy Policy Packages in the Operation of Raw Materials and Industrial Wastes. Sustainability 2021, 13, 4394. [Google Scholar] [CrossRef]
- Ikiz Kaya, D.; Pintossi, N.; Dane, G. An Empirical Analysis of Driving Factors and Policy Enablers of Heritage Adaptive Reuse within the Circular Economy Framework. Sustainability 2021, 13, 2479. [Google Scholar] [CrossRef]
- Hailemariam, A.; Erdiaw-Kwasie, M.O. Towards a Circular Economy: Implications for Emission Reduction and Environmental Sustainability. Bus. Strategy Environ. 2023, 32, 1951–1965. [Google Scholar] [CrossRef]
- Khanna, M.; Gusmerotti, N.M.; Frey, M. The Relevance of the Circular Economy for Climate Change: An Exploration through the Theory of Change Approach. Sustainability 2022, 14, 3991. [Google Scholar] [CrossRef]
- Cantzler, J.; Creutzig, F.; Ayargarnchanakul, E.; Javaid, A.; Wong, L.; Haas, W. Saving Resources and the Climate? A Systematic Review of the Circular Economy and Its Mitigation Potential. Environ. Res. Lett. 2020, 15, 123001. [Google Scholar] [CrossRef]
- Ellen MacArthur Foundation. Completing the Picture. 2019. How the Circular Economy Tackles Climate Change. Available online: https://www.ellenmacarthurfoundation.org/publications/completing-the-picture-climate-change (accessed on 11 August 2023).
- Yang, M.; Chen, L.; Wang, J.; Msigwa, G.; Osman, A.I.; Fawzy, S.; Rooney, D.W.; Yap, P.-S. Circular Economy Strategies for Combating Climate Change and Other Environmental Issues. Environ. Chem. Lett. 2023, 21, 55–80. [Google Scholar] [CrossRef]
- Atabaki, M.S.; Mohammadi, M.; Naderi, B. New Robust Optimization Models for Closed-Loop Supply Chain of Durable Products: Towards a Circular Economy. Comput. Ind. Eng. 2020, 146, 106520. [Google Scholar] [CrossRef]
- Çimen, Ö. Construction and Built Environment in Circular Economy: A Comprehensive Literature Review. J. Clean. Prod. 2021, 305, 127180. [Google Scholar] [CrossRef]
- Ellen MacArthur Foundation. Towards the Circular Economy Vol. 1: An Economic and Business Rationale for an Accelerated Transition. Available online: https://www.ellenmacarthurfoundation.org/towards-the-circular-economy-vol-1-an-economic-and-business-rationale-for-an (accessed on 2 January 2024).
- Orsini, F.; Marrone, P. Approaches for a Low-Carbon Production of Building Materials: A Review. J. Clean. Prod. 2019, 241, 118380. [Google Scholar] [CrossRef]
- Gallego-Schmid, A.; Chen, H.-M.; Sharmina, M.; Mendoza, J.M.F. Links between Circular Economy and Climate Change Mitigation in the Built Environment. J. Clean. Prod. 2020, 260, 121115. [Google Scholar] [CrossRef]
- De Abreu, V.H.S.; Da Costa, M.G.; Da Costa, V.X.; De Assis, T.F.; Santos, A.S.; D’Agosto, M.d.A. The Role of the Circular Economy in Road Transport to Mitigate Climate Change and Reduce Resource Depletion. Sustainability 2022, 14, 8951. [Google Scholar] [CrossRef]
- Chen, T.D.; Kockelman, K.M. Carsharing’s Lifecycle Impacts on Energy Use and Greenhouse Gas Emissions. Transp. Res. Part. D Transp. Environ. 2016, 47, 276–284. [Google Scholar] [CrossRef]
- Esposito, B.; Sessa, M.R.; Sica, D.; Malandrino, O. Towards Circular Economy in the Agri-Food Sector. A Systematic Literature Review. Sustainability 2020, 12, 7401. [Google Scholar] [CrossRef]
- Peña, C.; Civit, B.; Gallego-Schmid, A.; Druckman, A.; Pires, A.C.-; Weidema, B.; Mieras, E.; Wang, F.; Fava, J.; Canals, L.M.I.; et al. Using Life Cycle Assessment to Achieve a Circular Economy. Int. J. Life Cycle Assess. 2021, 26, 215–220. [Google Scholar] [CrossRef]
- Bjørnbet, M.M.; Vildåsen, S.S. Life Cycle Assessment to Ensure Sustainability of Circular Business Models in Manufacturing. Sustainability 2021, 13, 11014. [Google Scholar] [CrossRef]
- Rigamonti, L.; Mancini, E. Life Cycle Assessment and Circularity Indicators. Int. J. Life Cycle Assess. 2021, 26, 1937–1942. [Google Scholar] [CrossRef]
- Saadé, M.; Erradhouani, B.; Pawlak, S.; Appendino, F.; Peuportier, B.; Roux, C. Combining Circular and LCA Indicators for the Early Design of Urban Projects. Int. J. Life Cycle Assess. 2022, 27, 1–19. [Google Scholar] [CrossRef]
- Stillitano, T.; Spada, E.; Iofrida, N.; Falcone, G.; De Luca, A.I. Sustainable Agri-Food Processes and Circular Economy Pathways in a Life Cycle Perspective: State of the Art of Applicative Research. Sustainability 2021, 13, 2472. [Google Scholar] [CrossRef]
- Wrålsen, B.; O’Born, R. Use of Life Cycle Assessment to Evaluate Circular Economy Business Models in the Case of Li-Ion Battery Remanufacturing. Int. J. Life Cycle Assess. 2023, 28, 554–565. [Google Scholar] [CrossRef]
- The GHG Protocol. Product Standard. 2011. Available online: https://ghgprotocol.org/product-standard (accessed on 15 October 2023).
- ISO 14040; Environmental Management—Life Cycle Assessment—Principles and Framework. ISO: Geneva, Switzerland, 2006.
- UNEP. Global Guidance Principles for Life Cycle Assessment Databases: A Basis for Greener Processes and Products: ‘Shonan Guidance Principles’; UNEP/SETAC Life Cycle Initiative; UNEP: Nairobi, Kenya, 2011. [Google Scholar]
- PAS 2050:2011; BSI. Specification for Assessing the Life Cycle Greenhouse Gas Emissions of Goods and Services. British Standards Institute: London, UK. Available online: https://www.en-standard.eu/pas-2050-2011-specification-for-the-assessment-of-the-life-cycle-greenhouse-gas-emissions-of-goods-and-services/ (accessed on 15 October 2023).
- The GHG Protocol. Corporate Standard. 2004. Available online: https://ghgprotocol.org/corporate-standard (accessed on 15 October 2023).
- Gorgels, S.; Priem, M.; Blagoeva, T.; Martinelle, A.; Milanesi, G. Annual Report on European SMEs 2021/2022: SMEs and Environmental Sustainability: Background Document; Publications Office of the European Union: Luxembourg, 2022. [Google Scholar]
- Katsinis, A.; Di Bella, L.; Laguera Gonzalez, J.; De Pedraza Garcia, P. SME Performance Review; Publications Office of the European Union: Luxembourg, 2023. [Google Scholar] [CrossRef]
- Dangelico, R.M.; Pontrandolfo, P. Being ‘Green and Competitive’: The Impact of Environmental Actions and Collaborations on Firm Performance. Bus. Strategy Environ. 2015, 24, 413–430. [Google Scholar] [CrossRef]
- Revell, A.; Stokes, D.; Chen, H. Small Businesses and the Environment: Turning over a New Leaf? Bus. Strategy Environ. 2010, 19, 273–288. [Google Scholar] [CrossRef]
- Lucas, M.T. Understanding Environmental Management Practices: Integrating Views from Strategic Management and Ecological Economics. Bus. Strategy Environ. 2010, 19, 543–556. [Google Scholar] [CrossRef]
- Brammer, S.; Hoejmose, S.; Marchant, K. Environmental Management in SMEs in the UK: Practices, Pressures and Perceived Benefits. Bus. Strategy Environ. 2012, 21, 423–434. [Google Scholar] [CrossRef]
- Leonidou, L.C.; Christodoulides, P.; Kyrgidou, L.P.; Palihawadana, D. Internal Drivers and Performance Consequences of Small Firm Green Business Strategy: The Moderating Role of External Forces. J. Bus. Ethics 2017, 140, 585–606. [Google Scholar] [CrossRef]
- Madueno, J.H.; Jorge, M.L.; Conesa, I.M.; Martínez-Martínez, D. Relationship between Corporate Social Responsibility and Competitive Performance in Spanish SMEs: Empirical Evidence from a Stakeholders’ Perspective. BRQ Bus. Res. Q. 2016, 19, 55–72. [Google Scholar] [CrossRef]
- Zamfir, A.-M.; Mocanu, C.; Grigorescu, A. Circular Economy and Decision Models among European SMEs. Sustainability 2017, 9, 1507. [Google Scholar] [CrossRef]
- Oncioiu, I.; Căpuşneanu, S.; Türkeș, M.C.; Topor, D.I.; Constantin, D.-M.O.; Marin-Pantelescu, A.; Ștefan Hint, M. The Sustainability of Romanian SMEs and Their Involvement in the Circular Economy. Sustainability 2018, 10, 2761. [Google Scholar] [CrossRef]
- Barón, A.; de Castro, R.; Giménez, G. Circular Economy Practices among Industrial EMAS-Registered SMEs in Spain. Sustainability 2020, 12, 9011. [Google Scholar] [CrossRef]
- Dey, P.K.; Malesios, C.; De, D.; Budhwar, P.; Chowdhury, S.; Cheffi, W. Circular Economy to Enhance Sustainability of Small and Medium-Sized Enterprises. Bus. Strategy Environ. 2020, 29, 2145–2169. [Google Scholar] [CrossRef]
- Dey, P.K.; Malesios, C.; Chowdhury, S.; Saha, K.; Budhwar, P.; De, D. Adoption of Circular Economy Practices in Small and Medium-Sized Enterprises: Evidence from Europe. Int. J. Prod. Econ. 2022, 248, 108496. [Google Scholar] [CrossRef]
- Prieto-Sandoval, V.; Jaca, C.; Santos, J.; Baumgartner, R.J.; Ormazabal, M. Key Strategies, Resources, and Capabilities for Implementing Circular Economy in Industrial Small and Medium Enterprises. Corp. Soc. Responsib. Environ. Manag. 2019, 26, 1473–1484. [Google Scholar] [CrossRef]
- Mura, M.; Longo, M.; Zanni, S. Circular Economy in Italian SMEs: A Multi-Method Study. J. Clean. Prod. 2020, 245, 118821. [Google Scholar] [CrossRef]
- Bassi, F.; Dias, J.G. The Use of Circular Economy Practices in SMEs across the EU. Resour. Conserv. Recycl. 2019, 146, 523–533. [Google Scholar] [CrossRef]
- Bassi, F.; Guidolin, M. Resource Efficiency and Circular Economy in European SMEs: Investigating the Role of Green Jobs and Skills. Sustainability 2021, 13, 12136. [Google Scholar] [CrossRef]
- Carissimi, M.C.; Creazza, A.; Fontanella Pisa, M.; Urbinati, A. Circular Economy Practices Enabling Circular Supply Chains: An Empirical Analysis of 100 SMEs in Italy. Resour. Conserv. Recycl. 2023, 198, 107–126. [Google Scholar] [CrossRef]
- Gennari, F. The Transition towards a Circular Economy. A Framework for SMEs. J. Manag. Gov. 2023, 27, 1423–1457. [Google Scholar] [CrossRef]
- Ren, Q.; Albrecht, J. Toward Circular Economy: The Impact of Policy Instruments on Circular Economy Innovation for European Small Medium Enterprises. Ecol. Econ. 2023, 207, 107761. [Google Scholar] [CrossRef]
- Sá, M.M.; Oliveira-Silva, C.; Cunha, M.P.; Gonçalves, A.; Diez, J.; Méndez-Tovar, I.; Izquierdo, E.C. Integration of the Circular Economy Paradigm in Companies from the Northwest of the Iberian Peninsula. Sustainability 2022, 14, 7940. [Google Scholar] [CrossRef]
- Negri, M.; Neri, A.; Cagno, E.; Monfardini, G. Circular Economy Performance Measurement in Manufacturing Firms: A Systematic Literature Review with Insights for Small and Medium Enterprises and New Adopters. Sustainability 2021, 13, 9049. [Google Scholar] [CrossRef]
- Rizos, V.; Behrens, A.; Van der Gaast, W.; Hofman, E.; Ioannou, A.; Kafyeke, T.; Flamos, A.; Rinaldi, R.; Papadelis, S.; Hirschnitz-Garbers, M.; et al. Implementation of Circular Economy Business Models by Small and Medium-Sized Enterprises (SMEs): Barriers and Enablers. Sustainability 2016, 8, 1212. [Google Scholar] [CrossRef]
- de Jesus, A.; Mendonça, S. Lost in Transition? Drivers and Barriers in the Eco-Innovation Road to the Circular Economy. Ecol. Econ. 2018, 145, 75–89. [Google Scholar] [CrossRef]
- Ritzén, S.; Sandström, G.Ö. Barriers to the Circular Economy—Integration of Perspectives and Domains. Procedia CIRP 2017, 64, 7–12. [Google Scholar] [CrossRef]
- Hina, M.; Chauhan, C.; Kaur, P.; Kraus, S.; Dhir, A. Drivers and Barriers of Circular Economy Business Models: Where We Are Now, and Where We Are Heading. J. Clean. Prod. 2022, 333, 130049. [Google Scholar] [CrossRef]
- Hart, J.; Adams, K.; Giesekam, J.; Tingley, D.D.; Pomponi, F. Barriers and Drivers in a Circular Economy: The Case of the Built Environment. Procedia CIRP 2019, 80, 619–624. [Google Scholar] [CrossRef]
- García-Quevedo, J.; Jové-Llopis, E.; Martínez-Ros, E. Barriers to the Circular Economy in European Small and Medium-Sized Firms. Bus. Strategy Environ. 2020, 29, 2450–2464. [Google Scholar] [CrossRef]
- Ormazabal, M.; Prieto-Sandoval, V.; Puga-Leal, R.; Jaca, C. Circular Economy in Spanish SMEs: Challenges and Opportunities. J. Clean. Prod. 2018, 185, 157–167. [Google Scholar] [CrossRef]
- Tura, N.; Hanski, J.; Ahola, T.; Ståhle, M.; Piiparinen, S.; Valkokari, P. Unlocking Circular Business: A Framework of Barriers and Drivers. J. Clean. Prod. 2019, 212, 90–98. [Google Scholar] [CrossRef]
- Govindan, K.; Hasanagic, M. A Systematic Review on Drivers, Barriers, and Practices towards Circular Economy: A Supply Chain Perspective. Int. J. Prod. Res. 2018, 56, 278–311. [Google Scholar] [CrossRef]
- Vermunt, D.A.; Negro, S.O.; Verweij, P.A.; Kuppens, D.V.; Hekkert, M.P. Exploring Barriers to Implementing Different Circular Business Models. J. Clean. Prod. 2019, 222, 891–902. [Google Scholar] [CrossRef]
- Sarja, M.; Onkila, T.; Mäkelä, M. A Systematic Literature Review of the Transition to the Circular Economy in Business Organizations: Obstacles, Catalysts and Ambivalences. J. Clean. Prod. 2021, 286, 125492. [Google Scholar] [CrossRef]
- Adams, K.T.; Osmani, M.; Thorpe, T.; Thornback, J. Circular Economy in Construction: Current Awareness, Challenges and Enablers. Proc. Inst. Civ. Eng.—Waste Resour. Manag. 2017, 170, 15–24. [Google Scholar] [CrossRef]
- Kirchherr, J.; Piscicelli, L.; Bour, R.; Kostense-Smit, E.; Muller, J.; Huibrechtse-Truijens, A.; Hekkert, M. Barriers to the Circular Economy: Evidence from the European Union (EU). Ecol. Econ. 2018, 150, 264–272. [Google Scholar] [CrossRef]
- Cantú, A.; Aguiñaga, E.; Scheel, C. Learning from Failure and Success: The Challenges for Circular Economy Implementation in SMEs in an Emerging Economy. Sustainability 2021, 13, 1529. [Google Scholar] [CrossRef]
- Garcés-Ayerbe, C.; Rivera-Torres, P.; Suárez-Perales, I.; Leyva-de la Hiz, D.I. Is It Possible to Change from a Linear to a Circular Economy? An Overview of Opportunities and Barriers for European Small and Medium-Sized Enterprise Companies. Int. J. Environ. Res. Public Health 2019, 16, 851. [Google Scholar] [CrossRef]
- Tan, J.; Tan, F.J.; Ramakrishna, S. Transitioning to a Circular Economy: A Systematic Review of Its Drivers and Barriers. Sustainability 2022, 14, 1757. [Google Scholar] [CrossRef]
- Diez-Cañamero, B.; Mendoza, J.M.F. Circular Economy Performance and Carbon Footprint of Wind Turbine Blade Waste Management Alternatives. Waste Manag. 2023, 164, 94–105. [Google Scholar] [CrossRef]
- Wang, N.; Guo, Z.; Meng, F.; Wang, H.; Yin, J.; Liu, Y. The Circular Economy and Carbon Footprint: A Systematic Accounting for Typical Coal-Fuelled Power Industrial Parks. J. Clean. Prod. 2019, 229, 1262–1273. [Google Scholar] [CrossRef]
- Esquerre-Botton, S.; Alvarez-Risco, A.; Leclercq-Machado, L.; de las Mercedes Anderson-Seminario, M.; Del-Aguila-Arcentales, S. Food Loss Reduction and Carbon Footprint Practices Worldwide: A Benchmarking Approach of Circular Economy. In Circular Economy: Impact on Carbon and Water Footprint; Alvarez-Risco, A., Muthu, S.S., Del-Aguila-Arcentales, S., Eds.; Environmental Footprints and Eco-Design of Products and Processes; Springer: Singapore, 2022; pp. 161–179. [Google Scholar] [CrossRef]
- Xue, Y.; Luan, W.; Wang, H.; Yang, Y. Environmental and Economic Benefits of Carbon Emission Reduction in Animal Husbandry via the Circular Economy: Case Study of Pig Farming in Liaoning, China. J. Clean. Prod. 2019, 238, 117968. [Google Scholar] [CrossRef]
- Gómez-Prado, R.; Alvarez-Risco, A.; Sánchez-Palomino, J.; de las Mercedes Anderson-Seminario, M.; Del-Aguila-Arcentales, S. Circular Economy for Waste Reduction and Carbon Footprint. In Circular Economy: Impact on Carbon and Water Footprint; Alvarez-Risco, A., Muthu, S.S., Del-Aguila-Arcentales, S., Eds.; Environmental Footprints and Eco-Design of Products and Processes; Springer: Singapore, 2022; pp. 139–159. [Google Scholar] [CrossRef]
- Castillo-Benancio, S.; Alvarez-Risco, A.; Esquerre-Botton, S.; Leclercq-Machado, L.; Calle-Nole, M.; Morales-Ríos, F.; de las Mercedes Anderson-Seminario, M.; Del-Aguila-Arcentales, S. Circular Economy for Packaging and Carbon Footprint. In Circular Economy: Impact on Carbon and Water Footprint; Alvarez-Risco, A., Muthu, S.S., Del-Aguila-Arcentales, S., Eds.; Environmental Footprints and Eco-Design of Products and Processes; Springer: Singapore, 2022; pp. 115–138. [Google Scholar] [CrossRef]
- Corvellec, H.; Stowell, A.F.; Johansson, N. Critiques of the Circular Economy. J. Ind. Ecol. 2022, 26, 421–432. [Google Scholar] [CrossRef]
- Dzhengiz, T.; Miller, E.M.; Ovaska, J.-P.; Patala, S. Unpacking the Circular Economy: A Problematizing Review. Int. J. Manag. Rev. 2023, 25, 270–296. [Google Scholar] [CrossRef]
- Calisto Friant, M.; Vermeulen, W.J.V.; Salomone, R. A Typology of Circular Economy Discourses: Navigating the Diverse Visions of a Contested Paradigm. Resour. Conserv. Recycl. 2020, 161, 104917. [Google Scholar] [CrossRef]
- Korhonen, J.; Honkasalo, A.; Seppälä, J. Circular Economy: The Concept and Its Limitations. Ecol. Econ. 2018, 143, 37–46. [Google Scholar] [CrossRef]
- Skene, K.R. Circles, Spirals, Pyramids and Cubes: Why the Circular Economy Cannot Work. Sustain. Sci. 2018, 13, 479–492. [Google Scholar] [CrossRef]
- Rosa, P.; Sassanelli, C.; Urbinati, A.; Chiaroni, D.; Terzi, S. Assessing Relations between Circular Economy and Industry 4.0: A Systematic Literature Review. Int. J. Prod. Res. 2020, 58, 1662–1687. [Google Scholar] [CrossRef]
- Pagoropoulos, A.; Pigosso, D.C.A.; McAloone, T.C. The Emergent Role of Digital Technologies in the Circular Economy: A Review. Procedia CIRP 2017, 64, 19–24. [Google Scholar] [CrossRef]
- Demestichas, K.; Daskalakis, E. Information and Communication Technology Solutions for the Circular Economy. Sustainability 2020, 12, 7272. [Google Scholar] [CrossRef]
- Laskurain-Iturbe, I.; Arana-Landín, G.; Landeta-Manzano, B.; Uriarte-Gallastegi, N. Exploring the Influence of Industry 4.0 Technologies on the Circular Economy. J. Clean. Prod. 2021, 321, 128944. [Google Scholar] [CrossRef]
- Bressanelli, G.; Saccani, N.; Perona, M.; Baccanelli, I. Towards Circular Economy in the Household Appliance Industry: An Overview of Cases. Resources 2020, 9, 128. [Google Scholar] [CrossRef]
- Beltrami, M.; Sonntag, G.; Sarkis, J.; Sartor, M. Industry 4.0 and Sustainability: Towards Conceptualization and Theory. J. Clean. Prod. 2021, 312, 127733. [Google Scholar] [CrossRef]
- Mastos, T.D.; Nizamis, A.; Vafeiadis, T.; Alexopoulos, N.; Ntinas, C.; Gkortzis, D.; Papadopoulos, A.; Ioannidis, D.; Tzovaras, D. Industry 4.0 Sustainable Supply Chains: An Application of an IoT Enabled Scrap Metal Management Solution. J. Clean. Prod. 2020, 269, 122377. [Google Scholar] [CrossRef]
- Bag, S.; Pretorius, J.H.C. Relationships between Industry 4.0, Sustainable Manufacturing and Circular Economy: Proposal of a Research Framework. Int. J. Organ. Anal. 2020, 30, 864–898. [Google Scholar] [CrossRef]
- Jabbour, C.J.C.; de Sousa Jabbour, A.B.L.; Sarkis, J.; Godinho Filho, M. Unlocking the Circular Economy through New Business Models Based on Large-Scale Data: An Integrative Framework and Research Agenda. Technol. Forecast. Soc. Chang. 2019, 144, 546–552. [Google Scholar] [CrossRef]
- Rocca, R.; Rosa, P.; Sassanelli, C.; Fumagalli, L.; Terzi, S. Integrating Virtual Reality and Digital Twin in Circular Economy Practices: A Laboratory Application Case. Sustainability 2020, 12, 2286. [Google Scholar] [CrossRef]
- Watanabe, E.H.; da Silva, R.M.; Junqueira, F.; dos Santos Filho, D.J.; Miyagi, P.E. An Emerging Industrial Business Model Considering Sustainability Evaluation and Using Cyber Physical System Technology and Modelling Techniques. IFAC-Paper 2016, 49, 135–140. [Google Scholar] [CrossRef]
- Rusch, M.; Schöggl, J.-P.; Baumgartner, R.J. Application of Digital Technologies for Sustainable Product Management in a Circular Economy: A Review. Bus. Strategy Environ. 2023, 32, 1159–1174. [Google Scholar] [CrossRef]
- Turner, C.; Oyekan, J.; Garn, W.; Duggan, C.; Abdou, K. Industry 5.0 and the Circular Economy: Utilizing LCA with Intelligent Products. Sustainability 2022, 14, 14847. [Google Scholar] [CrossRef]
- Kerin, M.; Pham, D.T. A Review of Emerging Industry 4.0 Technologies in Remanufacturing. J. Clean. Prod. 2019, 237, 117805. [Google Scholar] [CrossRef]
- Lopes de Sousa Jabbour, A.B.; Jabbour, C.J.C.; Godinho Filho, M.; Roubaud, D. Industry 4.0 and the Circular Economy: A Proposed Research Agenda and Original Roadmap for Sustainable Operations. Ann. Oper. Res. 2018, 270, 273–286. [Google Scholar] [CrossRef]
- Tavera Romero, C.A.; Castro, D.F.; Ortiz, J.H.; Khalaf, O.I.; Vargas, M.A. Synergy between Circular Economy and Industry 4.0: A Literature Review. Sustainability 2021, 13, 4331. [Google Scholar] [CrossRef]
- Awan, U.; Sroufe, R.; Shahbaz, M. Industry 4.0 and the Circular Economy: A Literature Review and Recommendations for Future Research. Bus. Strategy Environ. 2021, 30, 2038–2060. [Google Scholar] [CrossRef]
- Mboli, J.S.; Thakker, D.; Mishra, J.L. An Internet of Things-Enabled Decision Support System for Circular Economy Business Model. Softw. Pract. Exp. 2022, 52, 772–787. [Google Scholar] [CrossRef]
- Miaoudakis, A.; Fysarakis, K.; Petroulakis, N.; Alexaki, S.; Alexandirs, G.; Ioannidis, S.; Spanoudakis, G.; Katos, V.; Verikoukis, C. Pairing a Circular Economy and the 5G-Enabled Internet of Things: Creating a Class of ?Looping Smart Assets? IEEE Veh. Technol. Mag. 2020, 15, 20–31. [Google Scholar] [CrossRef]
- Patwa, N.; Sivarajah, U.; Seetharaman, A.; Sarkar, S.; Maiti, K.; Hingorani, K. Towards a Circular Economy: An Emerging Economies Context. J. Bus. Res. 2021, 122, 725–735. [Google Scholar] [CrossRef]
- Ranta, V.; Aarikka-Stenroos, L.; Väisänen, J.-M. Digital Technologies Catalyzing Business Model Innovation for Circular Economy—Multiple Case Study. Resour. Conserv. Recycl. 2021, 164, 105155. [Google Scholar] [CrossRef]
- Kumar, N.M.; Chopra, S.S. Leveraging Blockchain and Smart Contract Technologies to Overcome Circular Economy Implementation Challenges. Sustainability 2022, 14, 9492. [Google Scholar] [CrossRef]
- Orzes, G.; Rauch, E.; Bednar, S.; Poklemba, R. Industry 4.0 Implementation Barriers in Small and Medium Sized Enterprises: A Focus Group Study. In Proceedings of the 2018 IEEE International Conference on Industrial Engineering and Engineering Management (IEEM), Bangkok, Thailand, 16–19 December 2018; pp. 1348–1352. [Google Scholar] [CrossRef]
- Masood, T.; Sonntag, P. Industry 4.0: Adoption Challenges and Benefits for SMEs. Comput. Ind. 2020, 121, 103261. [Google Scholar] [CrossRef]
- Horváth, D.; Szabó, R.Z. Driving Forces and Barriers of Industry 4.0: Do Multinational and Small and Medium-Sized Companies Have Equal Opportunities? Technol. Forecast. Soc. Chang. 2019, 146, 119–132. [Google Scholar] [CrossRef]
- Grooss, O.F.; Presser, M.; Tambo, T. Surround Yourself with Your Betters: Recommendations for Adopting Industry 4.0 Technologies in SMEs. Digit. Bus. 2022, 2, 100046. [Google Scholar] [CrossRef]
- Bracquené, E.; Dewulf, W.; Duflou, J.R. Measuring the Performance of More Circular Complex Product Supply Chains. Resour. Conserv. Recycl. 2020, 154, 104608. [Google Scholar] [CrossRef]
- Glogic, E.; Sonnemann, G.; Young, S.B. Environmental Trade-Offs of Downcycling in Circular Economy: Combining Life Cycle Assessment and Material Circularity Indicator to Inform Circularity Strategies for Alkaline Batteries. Sustainability 2021, 13, 1040. [Google Scholar] [CrossRef]
- Lonca, G.; Muggéo, R.; Imbeault-Tétreault, H.; Bernard, S.; Margni, M. Does Material Circularity Rhyme with Environmental Efficiency? Case Studies on Used Tires. J. Clean. Prod. 2018, 183, 424–435. [Google Scholar] [CrossRef]
- Pauer, E.; Wohner, B.; Heinrich, V.; Tacker, M. Assessing the Environmental Sustainability of Food Packaging: An Extended Life Cycle Assessment Including Packaging-Related Food Losses and Waste and Circularity Assessment. Sustainability 2019, 11, 925. [Google Scholar] [CrossRef]
- Mantalovas, K.; Di Mino, G. Integrating Circularity in the Sustainability Assessment of Asphalt Mixtures. Sustainability 2020, 12, 594. [Google Scholar] [CrossRef]
- Møller, H.; Lyng, K.-A.; Röös, E.; Samsonstuen, S.; Olsen, H.F. Circularity Indicators and Added Value to Traditional LCA Impact Categories: Example of Pig Production. Int. J. Life Cycle Assess. 2023. [Google Scholar] [CrossRef]
- Stanchev, P.; Vasilaki, V.; Egas, D.; Colon, J.; Ponsá, S.; Katsou, E. Multilevel Environmental Assessment of the Anaerobic Treatment of Dairy Processing Effluents in the Context of Circular Economy. J. Clean. Prod. 2020, 261, 121139. [Google Scholar] [CrossRef]
- ISO 14044; Environmental Management—Life Cycle Assessment—Requirements and Guidelines. ISO: Geneva, Switzerland, 2006. Available online: https://www.iso.org/standard/38498.html (accessed on 18 February 2024).
- ISO 14067; Greenhouse Gases—Carbon Footprint of Products—Requirements and Guidelines for Quantification. ISO: Geneva, Switzerland, 2018. Available online: https://www.iso.org/standard/71206.html (accessed on 18 February 2024).
- Di Bella, L.; Katsinis, A.; Laguera Gonzalez, J.; Odenthal, L.; Hell, M.; Lozar, B. Annual Report on European SMEs 2022/2023; Publications Office of the European Union: Luxembourg, 2023. [Google Scholar] [CrossRef]
- Djekic, I.; Miocinovic, J.; Tomasevic, I.; Smigic, N.; Tomic, N. Environmental Lifecycle Assessment of Various Dairy Products. J. Clean. Prod. 2014, 68, 64–72. [Google Scholar] [CrossRef]
- Mahath, C.S.; Mophin Kani, K.; Dubey, B. Gate-to-Gate Environmental Impacts of Dairy Processing Products in Thiruvananthapuram, India. Resour. Conserv. Recycl. 2019, 141, 40–53. [Google Scholar] [CrossRef]
- Egas, D.; Ponsá, S.; Colon, J. CalcPEFDairy: A Product Environmental Footprint Compliant Tool for a Tailored Assessment of Raw Milk and Dairy Products. J. Environ. Manag. 2020, 260, 110049. [Google Scholar] [CrossRef]
- Clune, S.; Crossin, E.; Verghese, K. Systematic Review of Greenhouse Gas Emissions for Different Fresh Food Categories. J. Clean. Prod. 2017, 140, 766–783. [Google Scholar] [CrossRef]
- González-García, S.; Hospido, A.; Moreira, M.T.; Feijoo, G.; Arroja, L. Environmental Life Cycle Assessment of a Galician Cheese: San Simon Da Costa. J. Clean. Prod. 2013, 52, 253–262. [Google Scholar] [CrossRef]
- Dalla Riva, A.; Burek, J.; Kim, D.; Thoma, G.; Cassandro, M.; De Marchi, M. Environmental Life Cycle Assessment of Italian Mozzarella Cheese: Hotspots and Improvement Opportunities. J. Dairy Sci. 2017, 100, 7933–7952. [Google Scholar] [CrossRef] [PubMed]
- Capper, J.L.; Cady, R.A. A Comparison of the Environmental Impact of Jersey Compared with Holstein Milk for Cheese Production1. J. Dairy Sci. 2012, 95, 165–176. [Google Scholar] [CrossRef] [PubMed]
- Finnegan, W.; Yan, M.; Holden, N.M.; Goggins, J. A Review of Environmental Life Cycle Assessment Studies Examining Cheese Production. Int. J. Life Cycle Assess. 2018, 23, 1773–1787. [Google Scholar] [CrossRef]
- Kim, D.; Thoma, G.; Nutter, D.; Milani, F.; Ulrich, R.; Norris, G. Life Cycle Assessment of Cheese and Whey Production in the USA. Int. J. Life Cycle Assess. 2013, 18, 1019–1035. [Google Scholar] [CrossRef]
- Palmieri, N.; Forleo, M.B.; Salimei, E. Environmental Impacts of a Dairy Cheese Chain Including Whey Feeding: An Italian Case Study. J. Clean. Prod. 2017, 140, 881–889. [Google Scholar] [CrossRef]
- Canellada, F.; Laca, A.; Laca, A.; Díaz, M. Environmental Impact of Cheese Production: A Case Study of a Small-Scale Factory in Southern Europe and Global Overview of Carbon Footprint. Sci. Total Environ. 2018, 635, 167–177. [Google Scholar] [CrossRef]
- Bava, L.; Bacenetti, J.; Gislon, G.; Pellegrino, L.; D’Incecco, P.; Sandrucci, A.; Tamburini, A.; Fiala, M.; Zucali, M. Impact Assessment of Traditional Food Manufacturing: The Case of Grana Padano Cheese. Sci. Total Environ. 2018, 626, 1200–1209. [Google Scholar] [CrossRef]
- Santos, H.C.M.; Maranduba, H.L.; de Almeida Neto, J.A.; Rodrigues, L.B. Life Cycle Assessment of Cheese Production Process in a Small-Sized Dairy Industry in Brazil. Environ. Sci. Pollut. Res. 2017, 24, 3470–3482. [Google Scholar] [CrossRef]
- van Middelaar, C.E.; Berentsen, P.B.M.; Dolman, M.A.; de Boer, I.J.M. Eco-Efficiency in the Production Chain of Dutch Semi-Hard Cheese. Livest. Sci. 2011, 139, 91–99. [Google Scholar] [CrossRef]
- Laca, A.; Gómez, N.; Laca, A.; Díaz, M. Overview on GHG Emissions of Raw Milk Production and a Comparison of Milk and Cheese Carbon Footprints of Two Different Systems from Northern Spain. Environ. Sci. Pollut. Res. 2020, 27, 1650–1666. [Google Scholar] [CrossRef] [PubMed]
- Kristensen, T.; Søegaard, K.; Eriksen, J.; Mogensen, L. Carbon Footprint of Cheese Produced on Milk from Holstein and Jersey Cows Fed Hay Differing in Herb Content. J. Clean. Prod. 2015, 101, 229–237. [Google Scholar] [CrossRef]
- González-García, S.; Castanheira, É.G.; Dias, A.C.; Arroja, L. Environmental Life Cycle Assessment of a Dairy Product: The Yoghurt. Int. J. Life Cycle Assess. 2013, 18, 796–811. [Google Scholar] [CrossRef]
- IPCC-TFI. Available online: https://www.ipcc-nggip.iges.or.jp/public/2006gl/index.html (accessed on 22 May 2023).
- EMEP/EEA Air Pollutant Emission Inventory Guidebook 2019—European Environment Agency. Available online: https://www.eea.europa.eu/publications/emep-eea-guidebook-2019 (accessed on 22 May 2023).
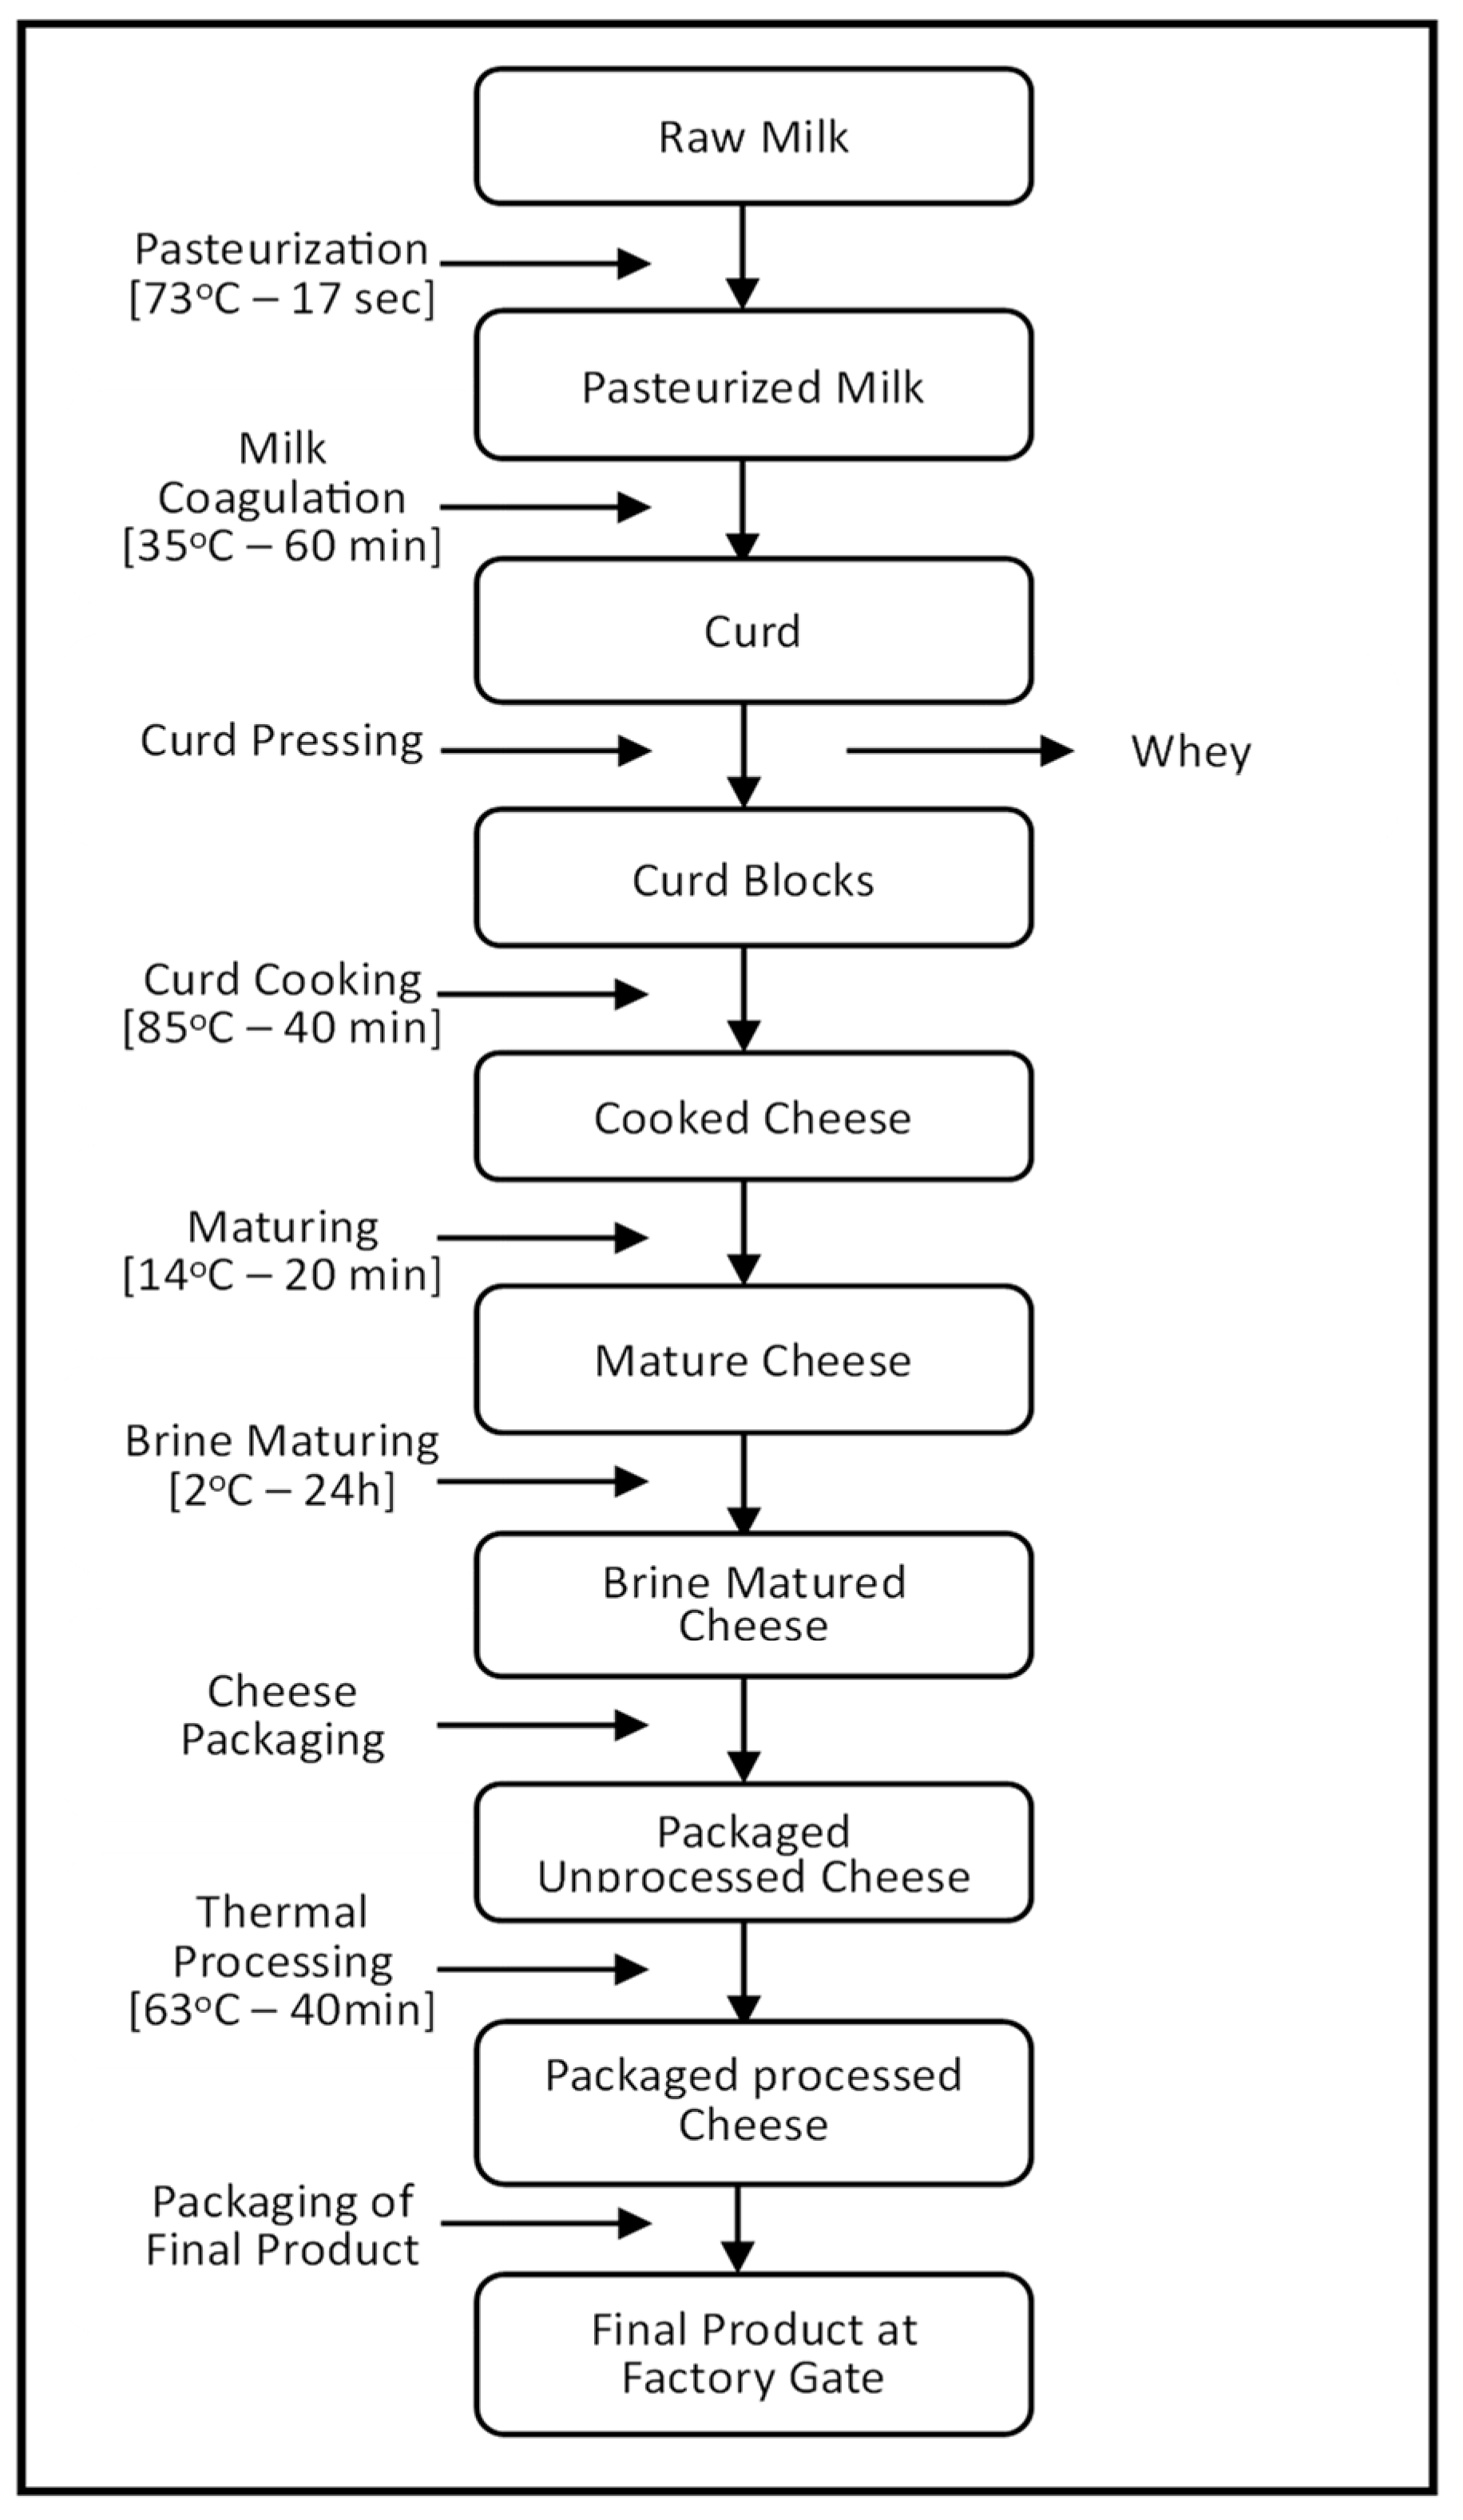
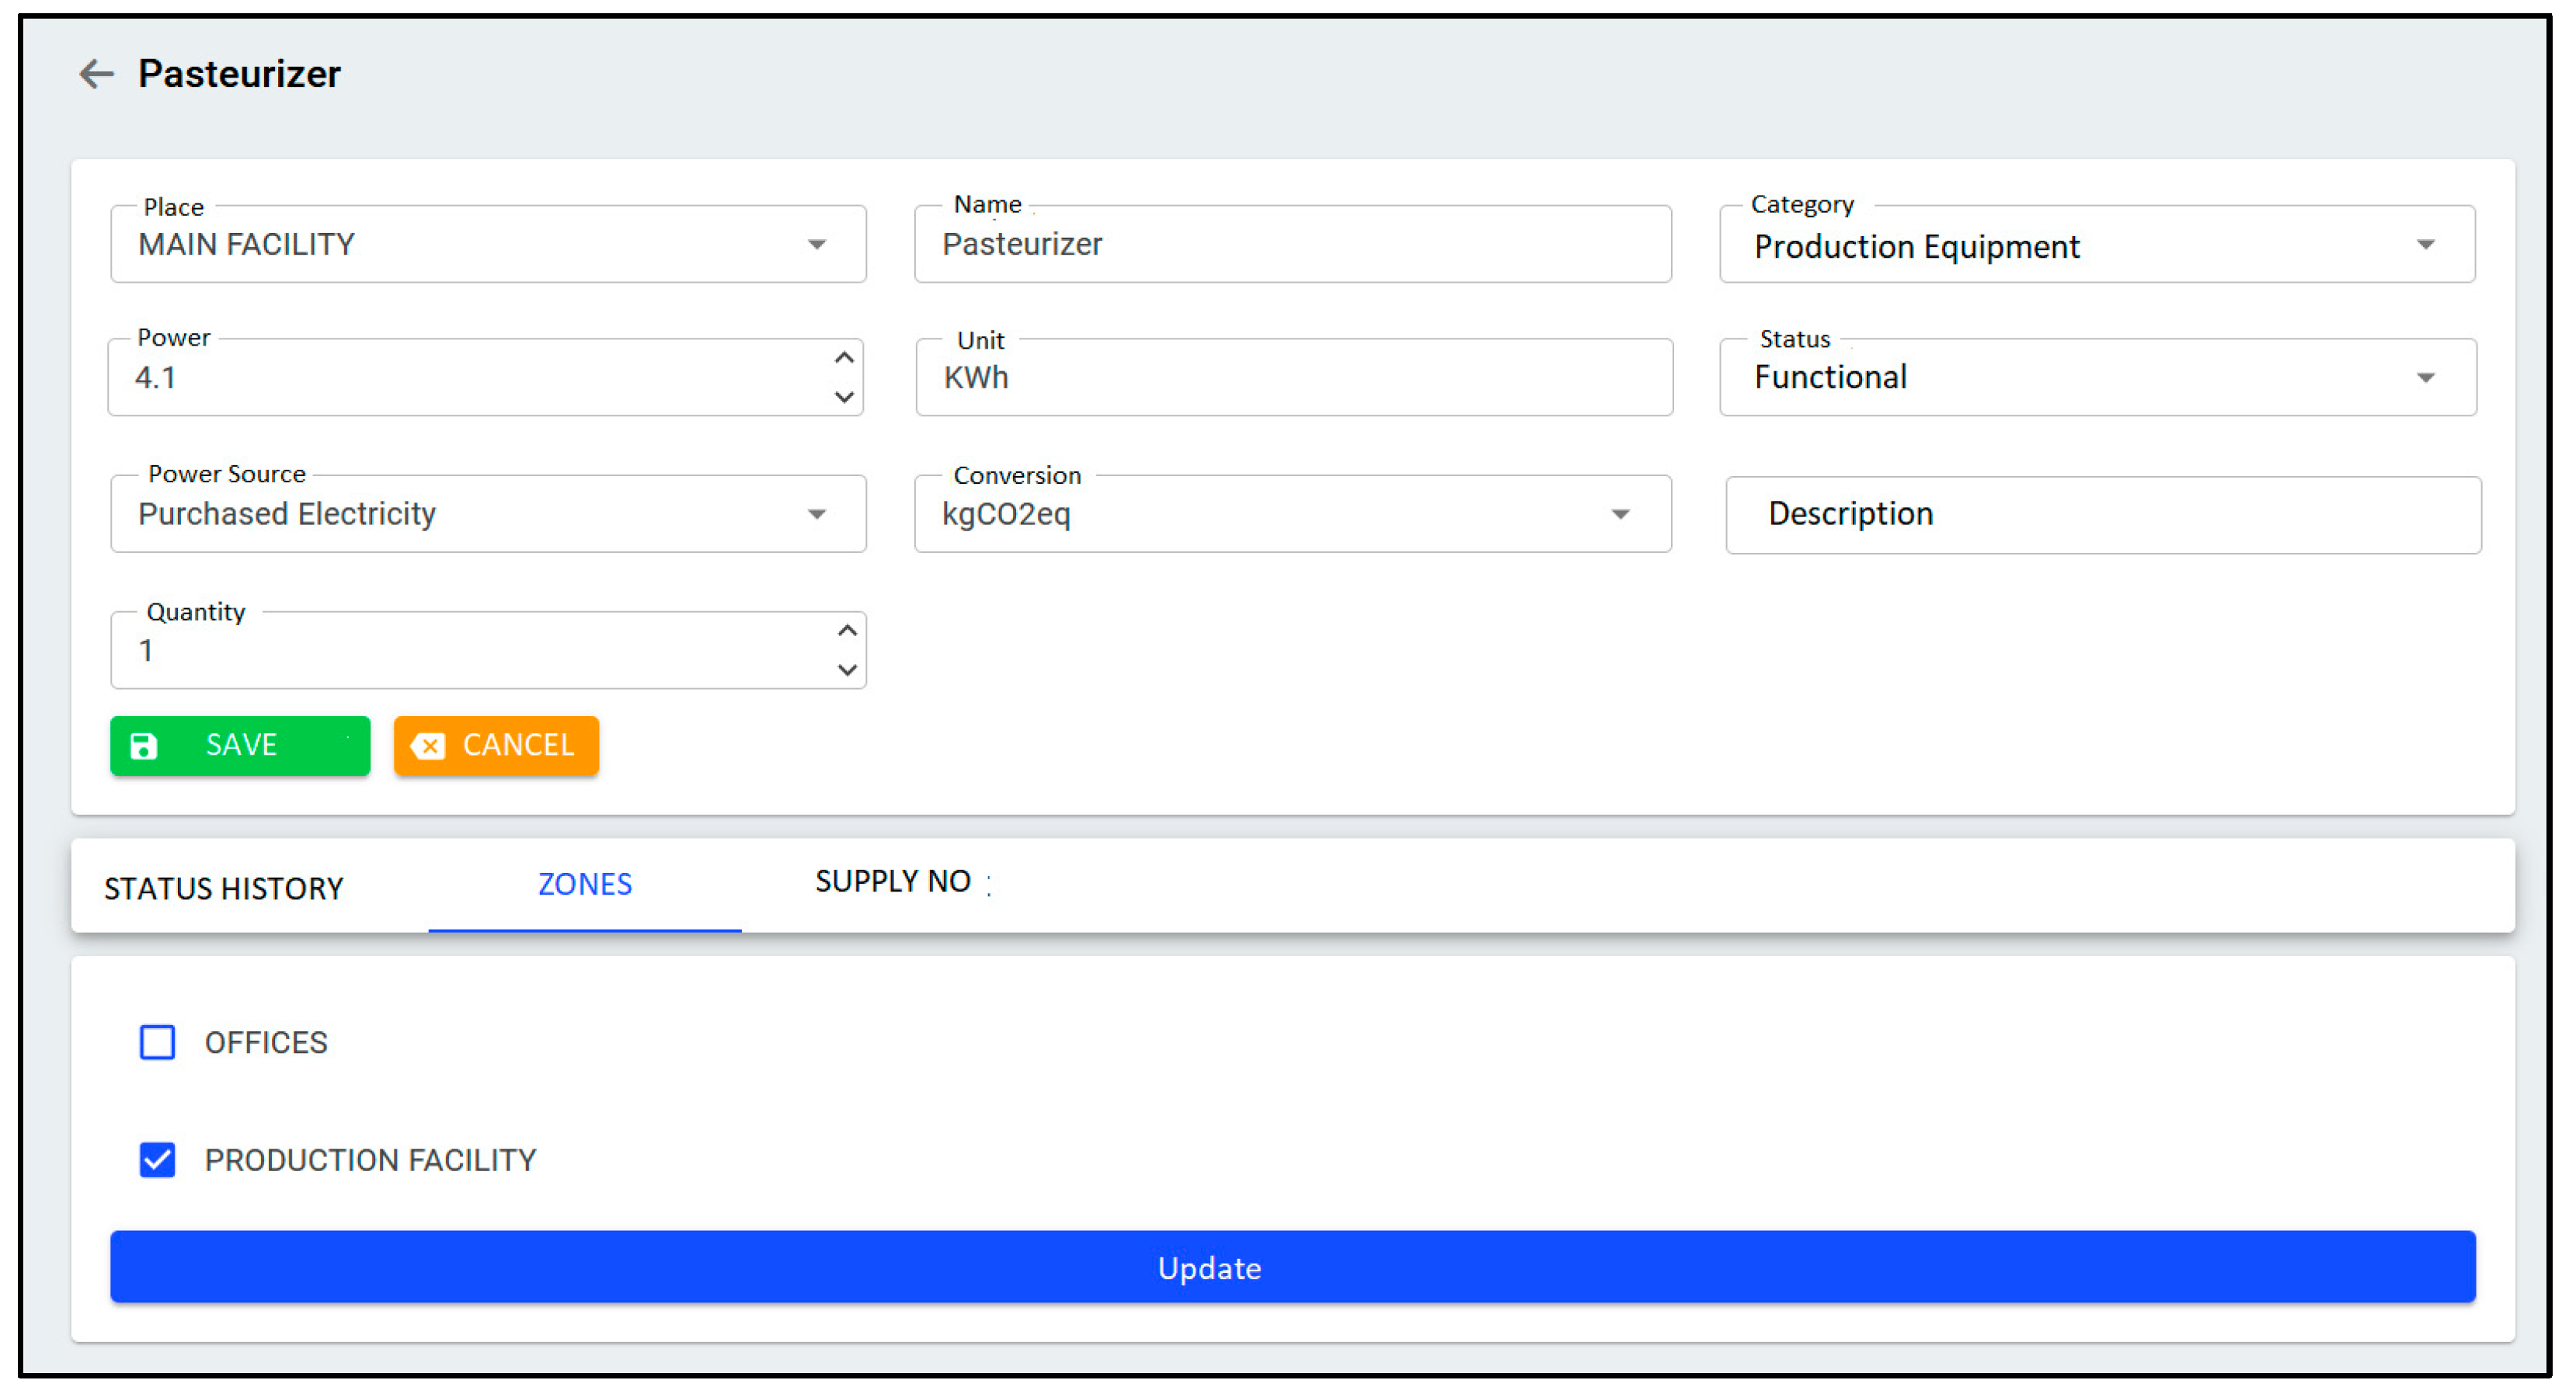
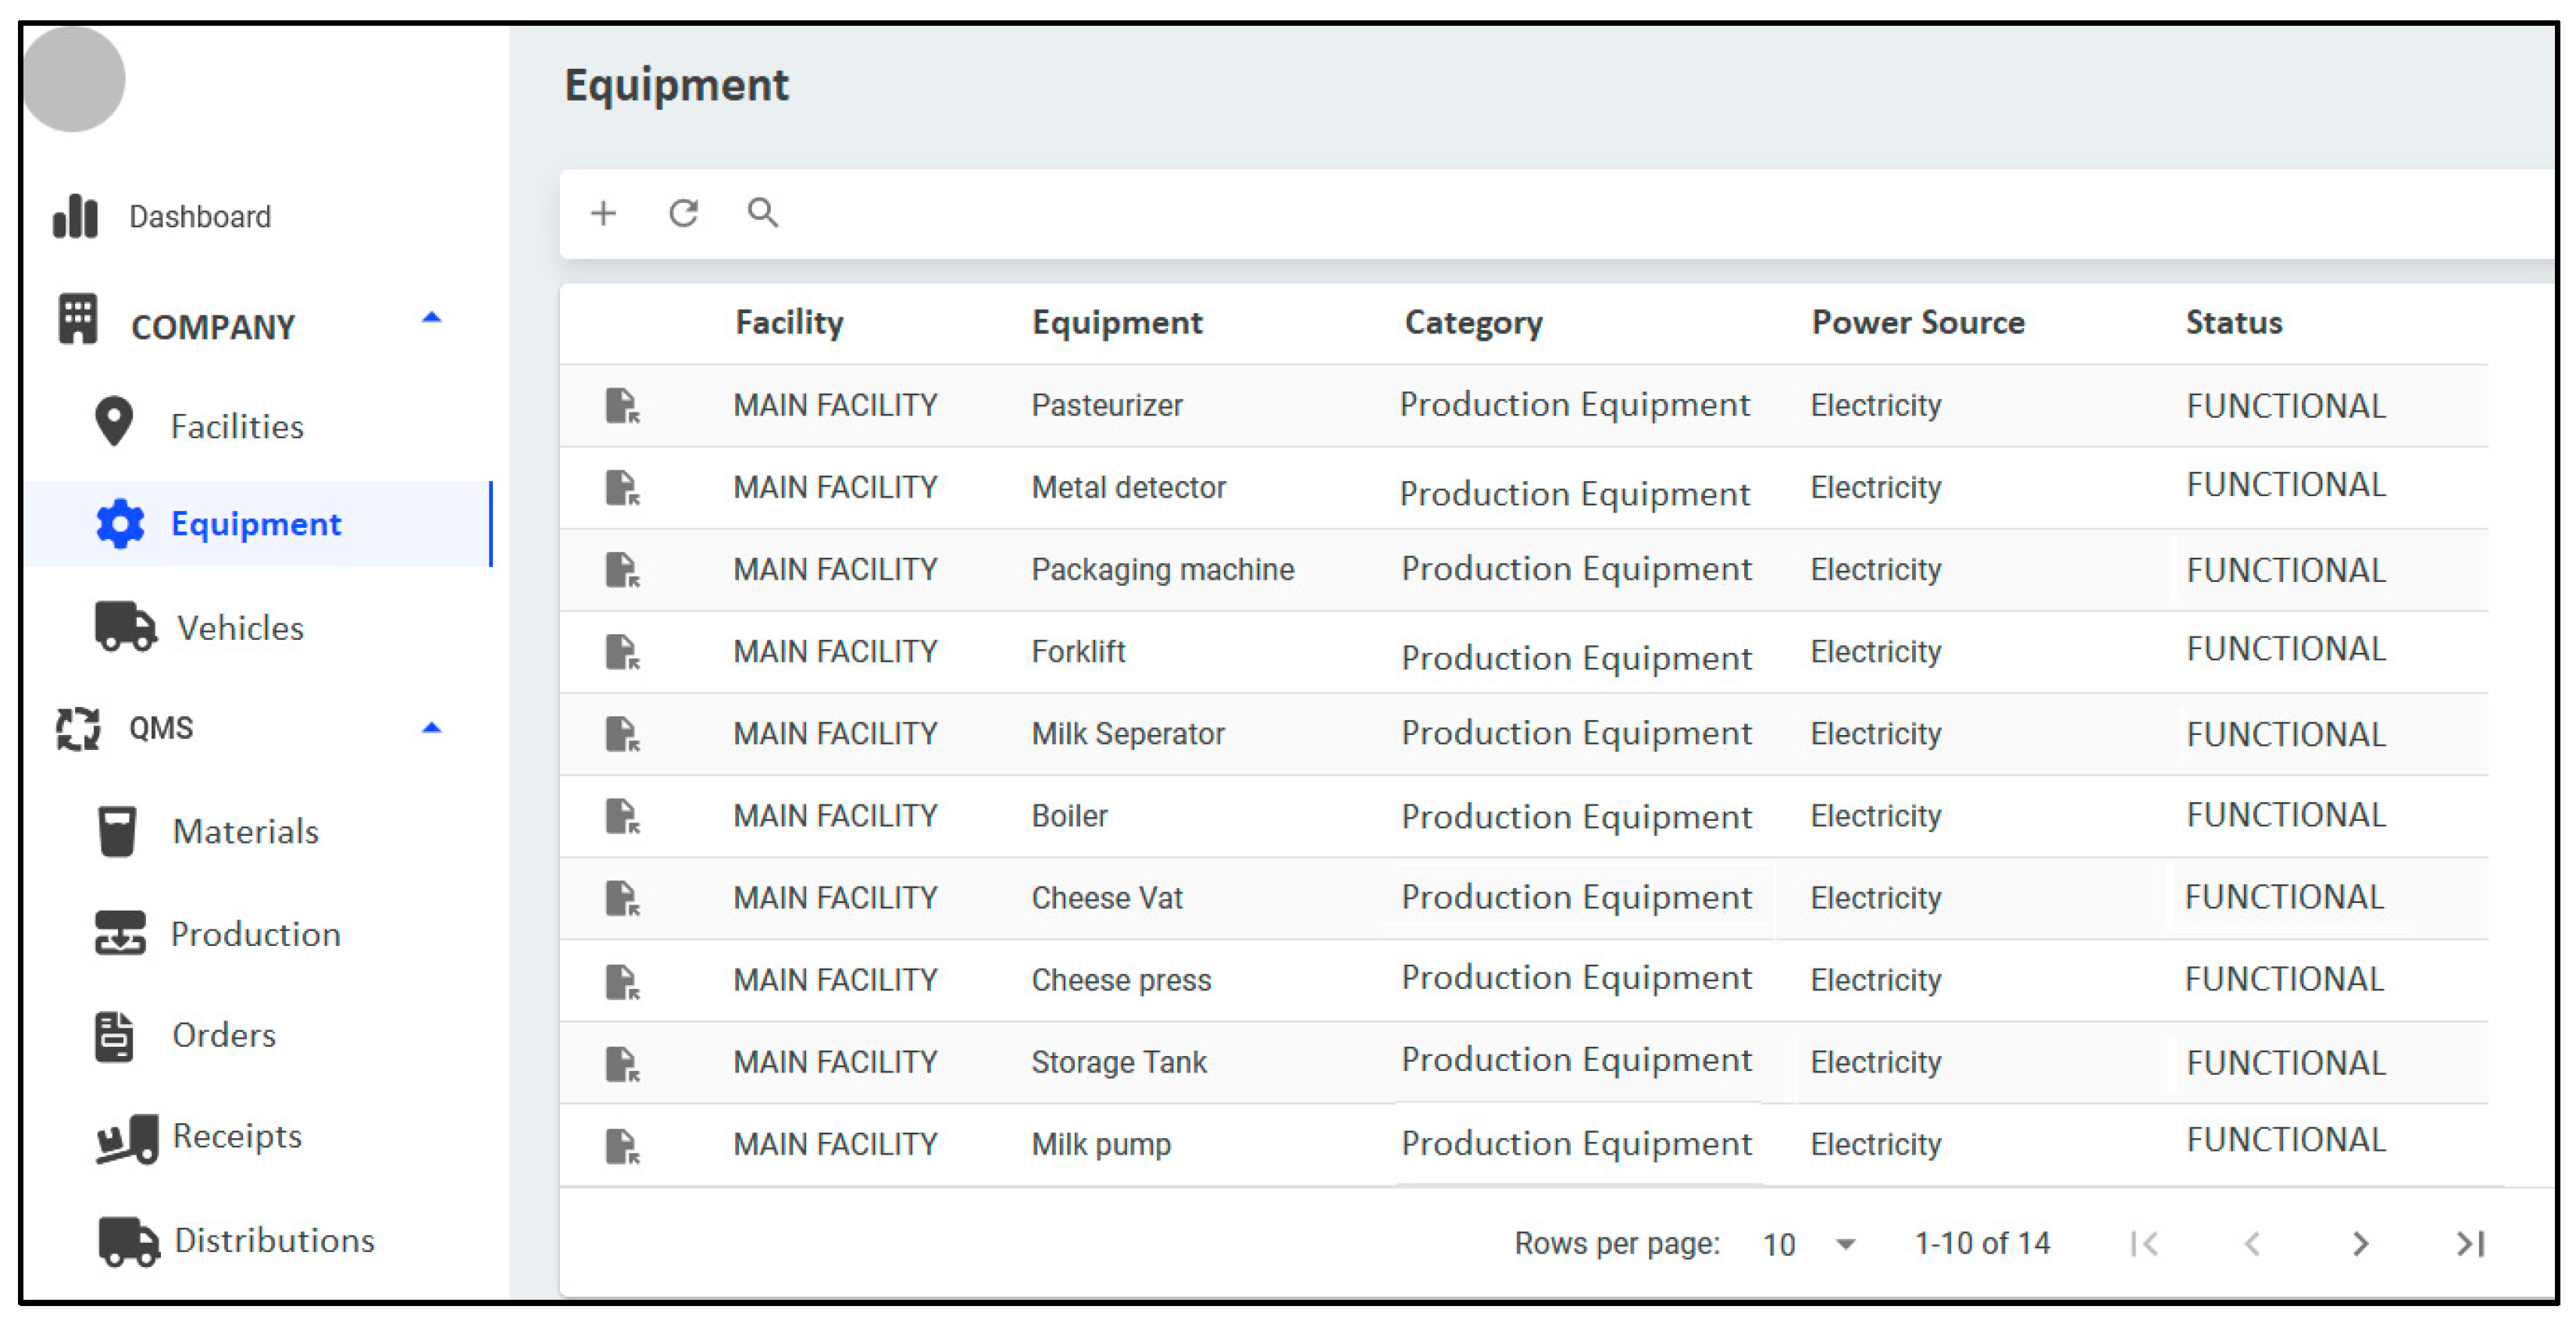
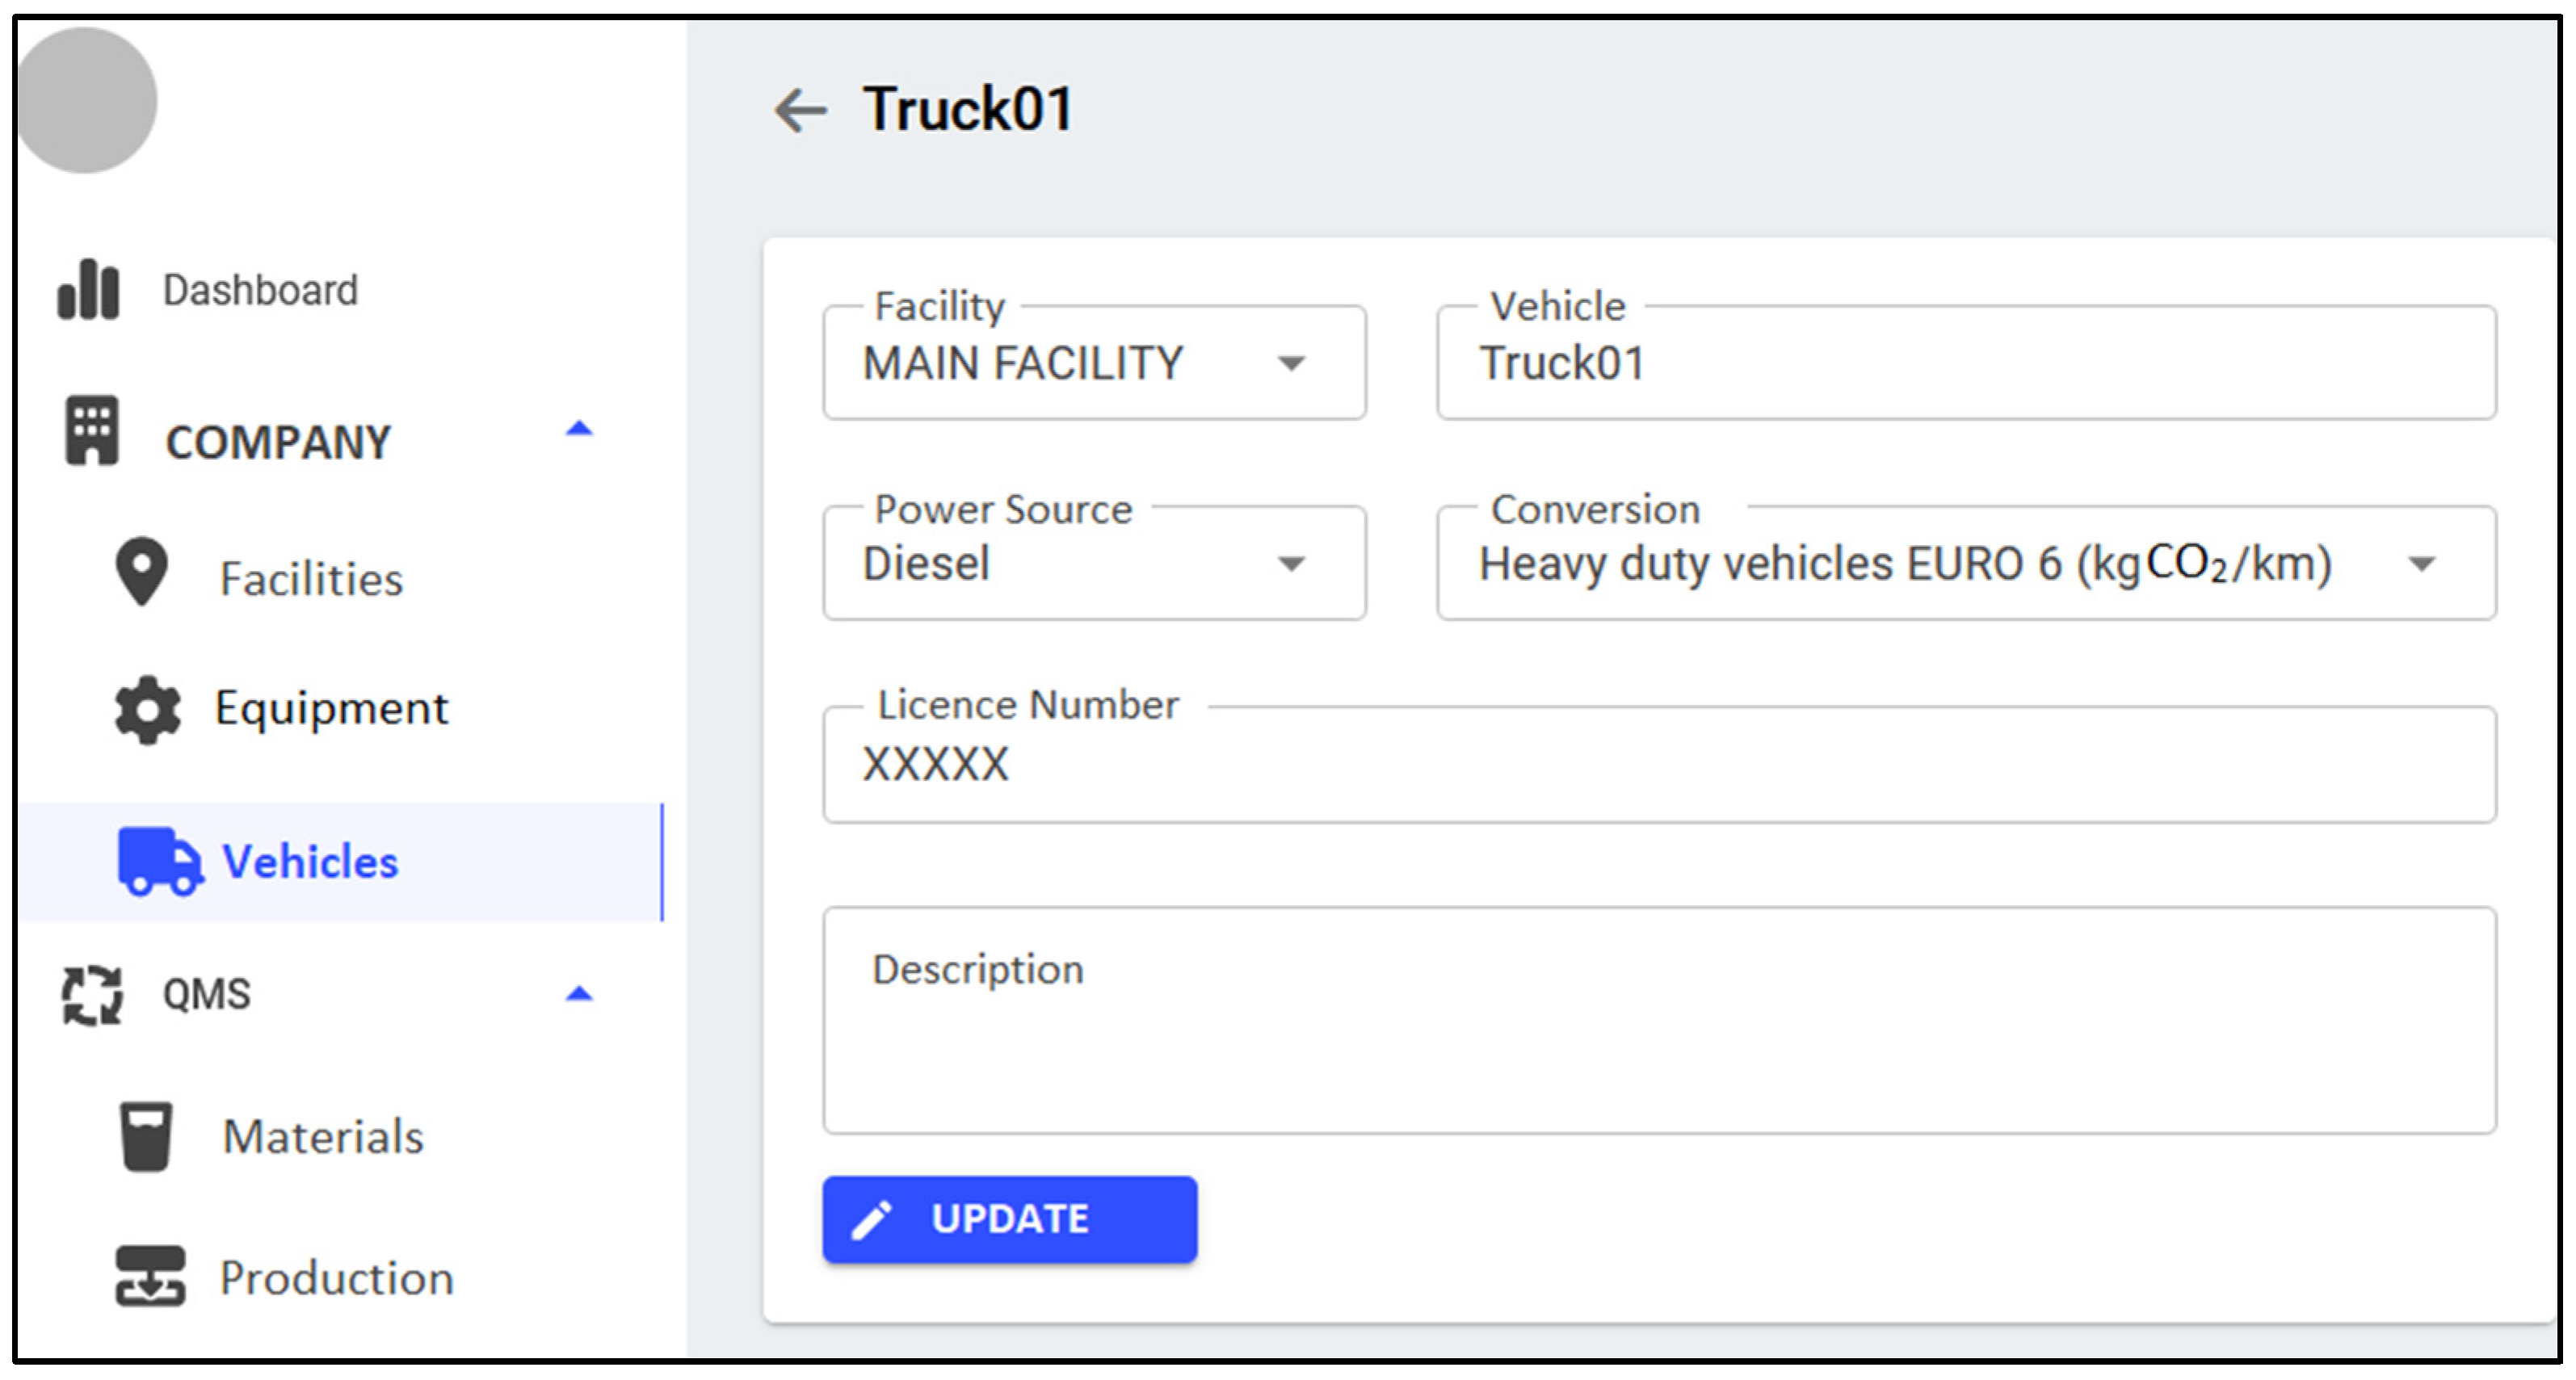

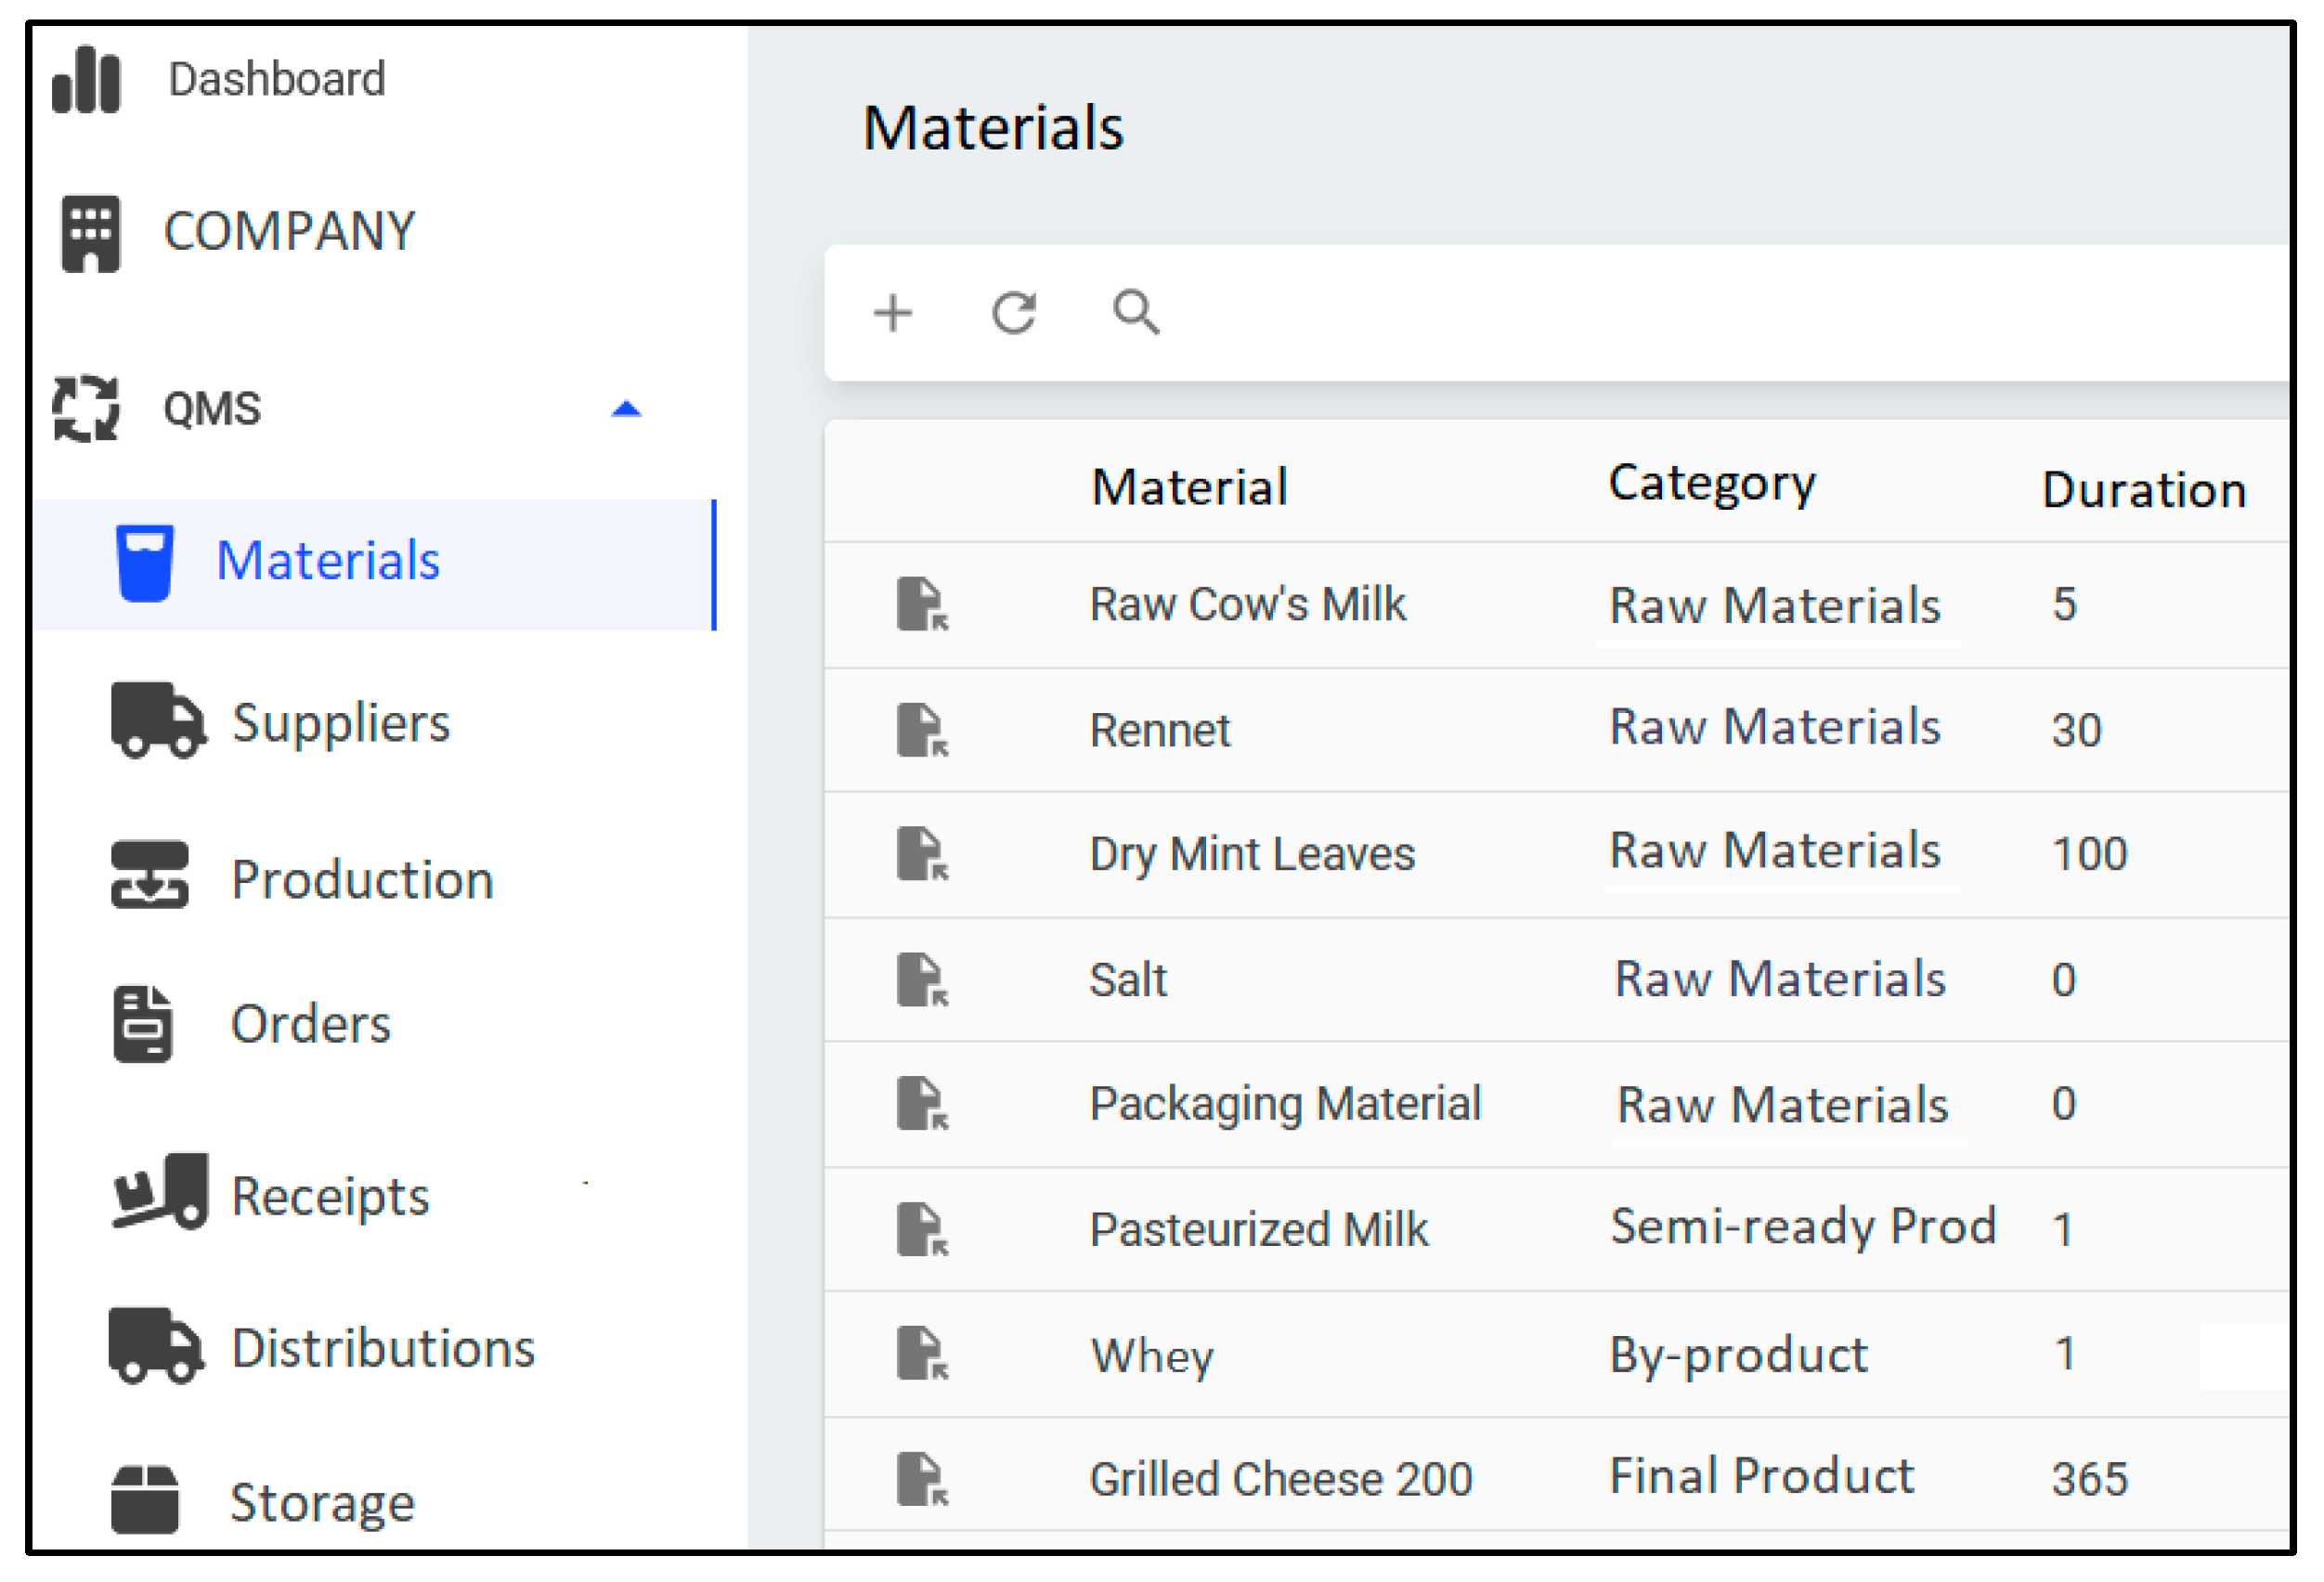
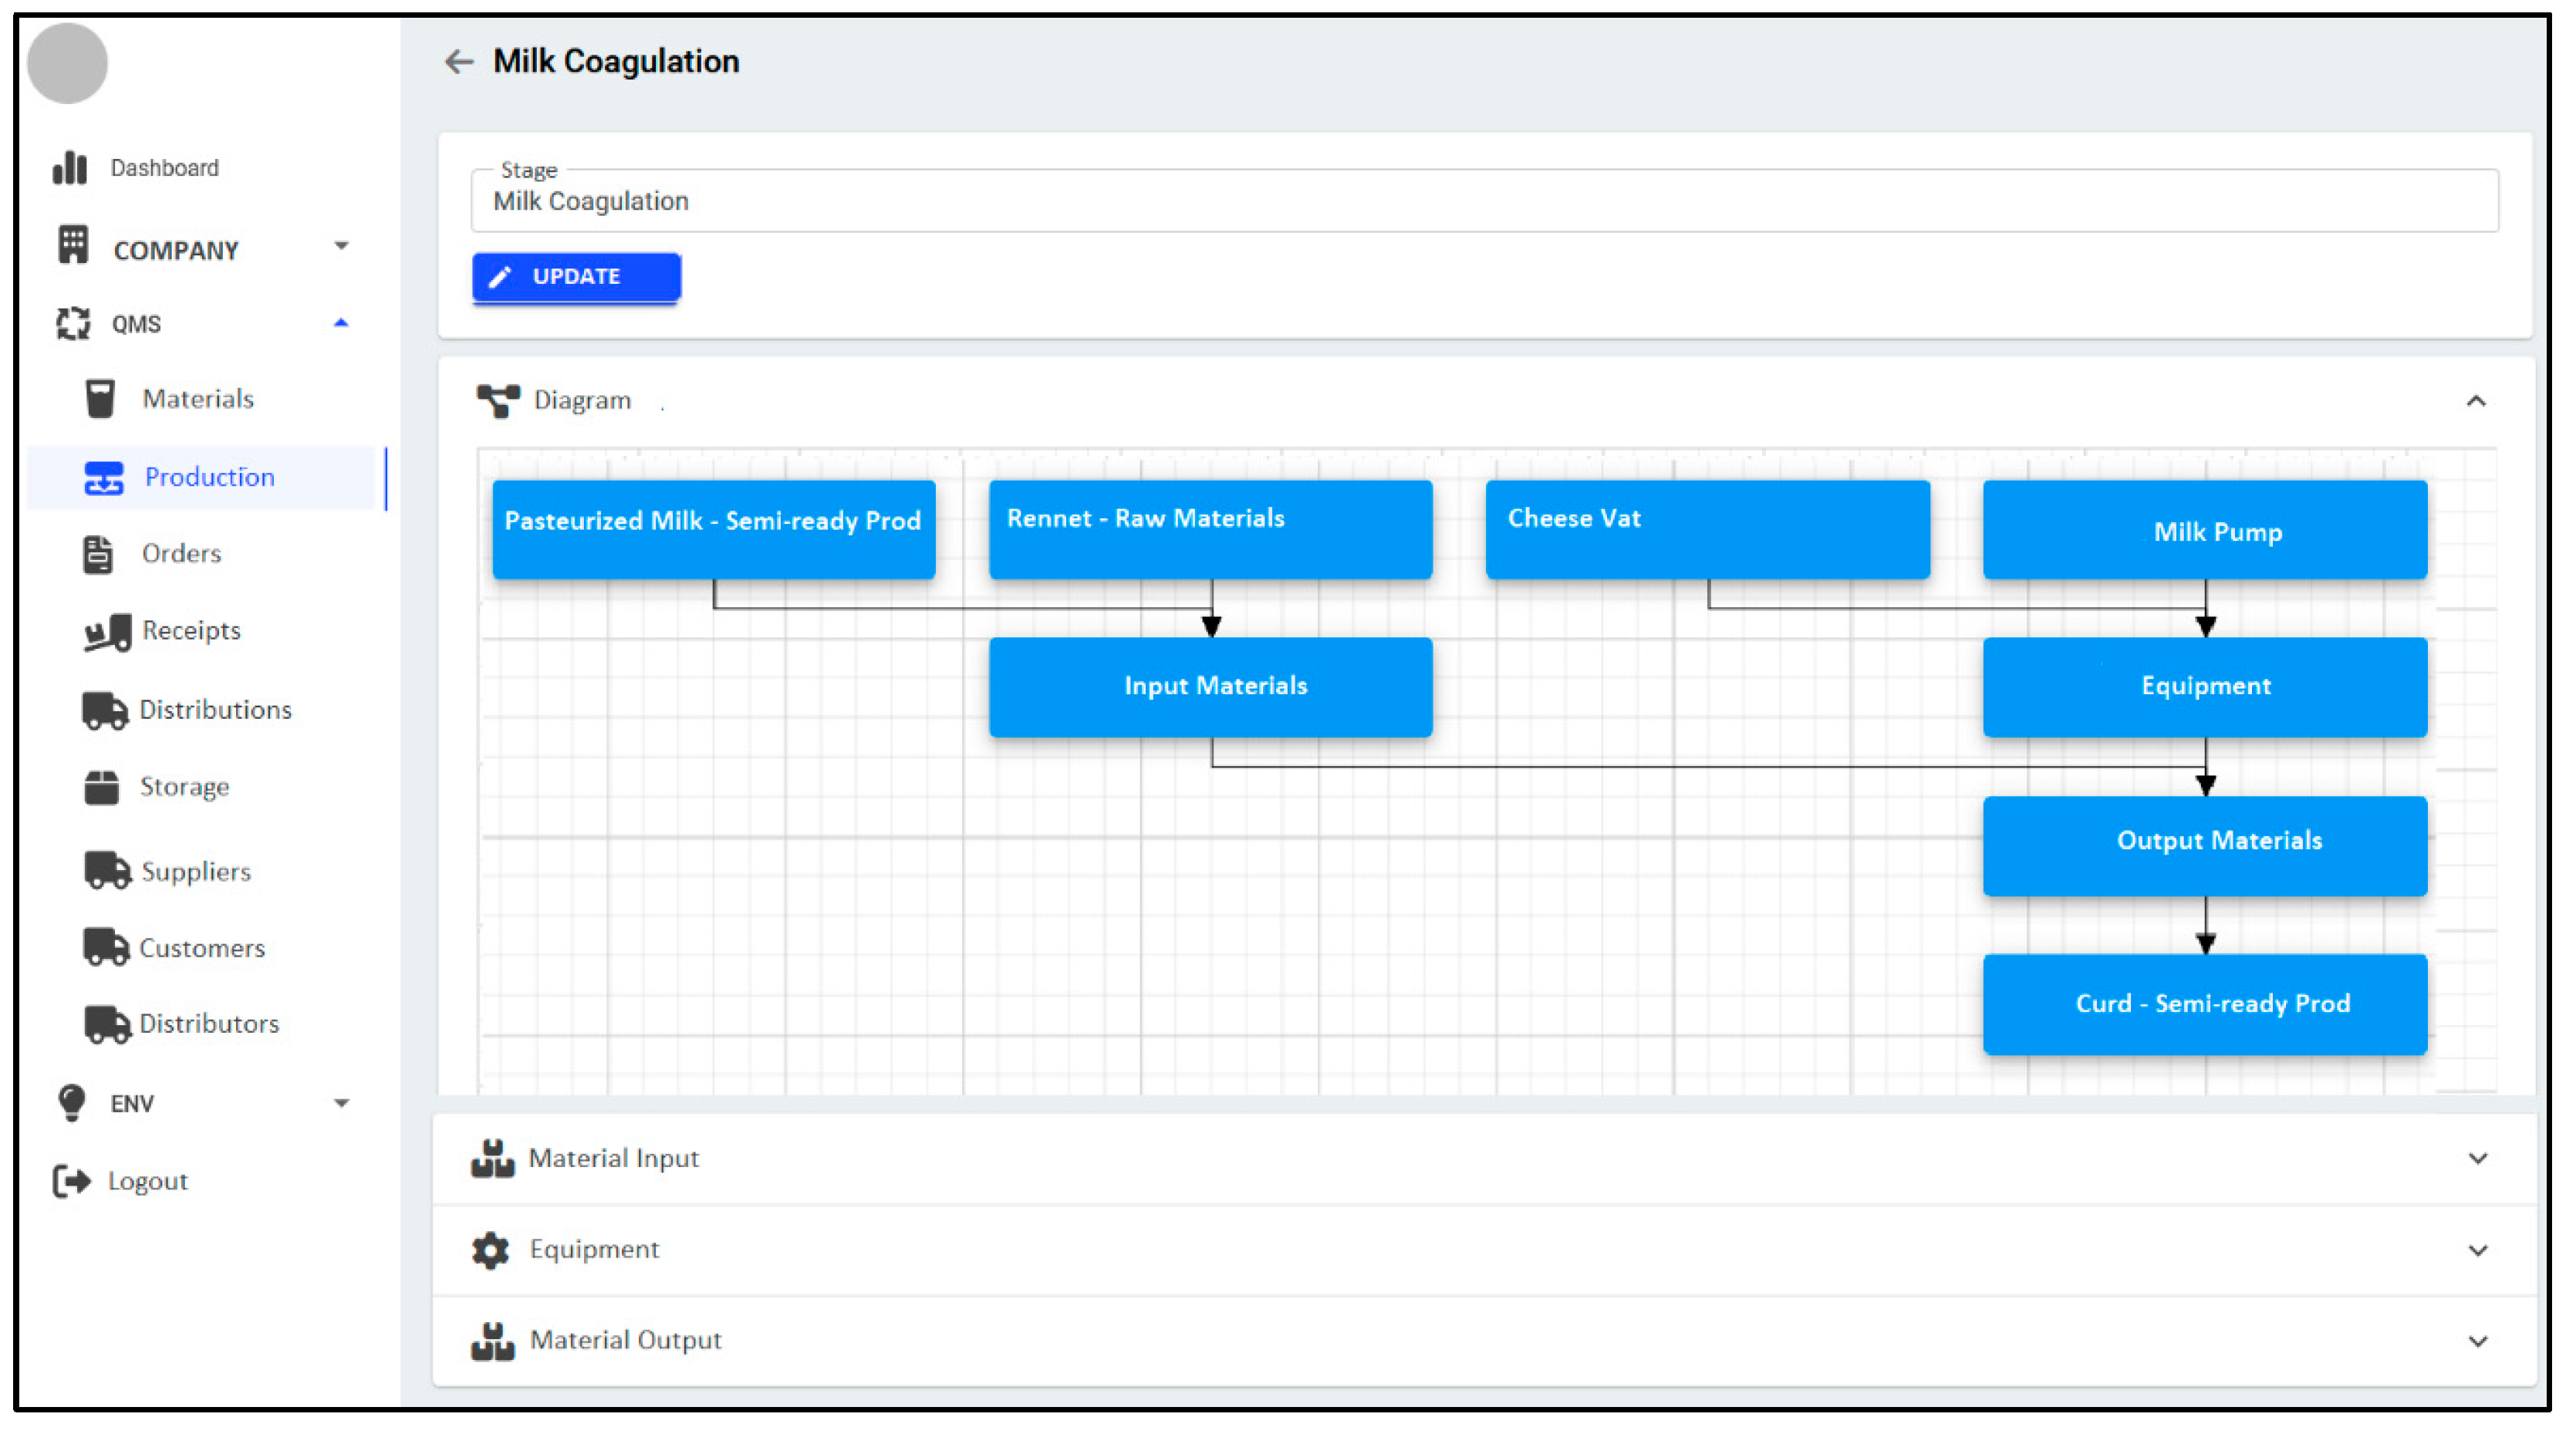
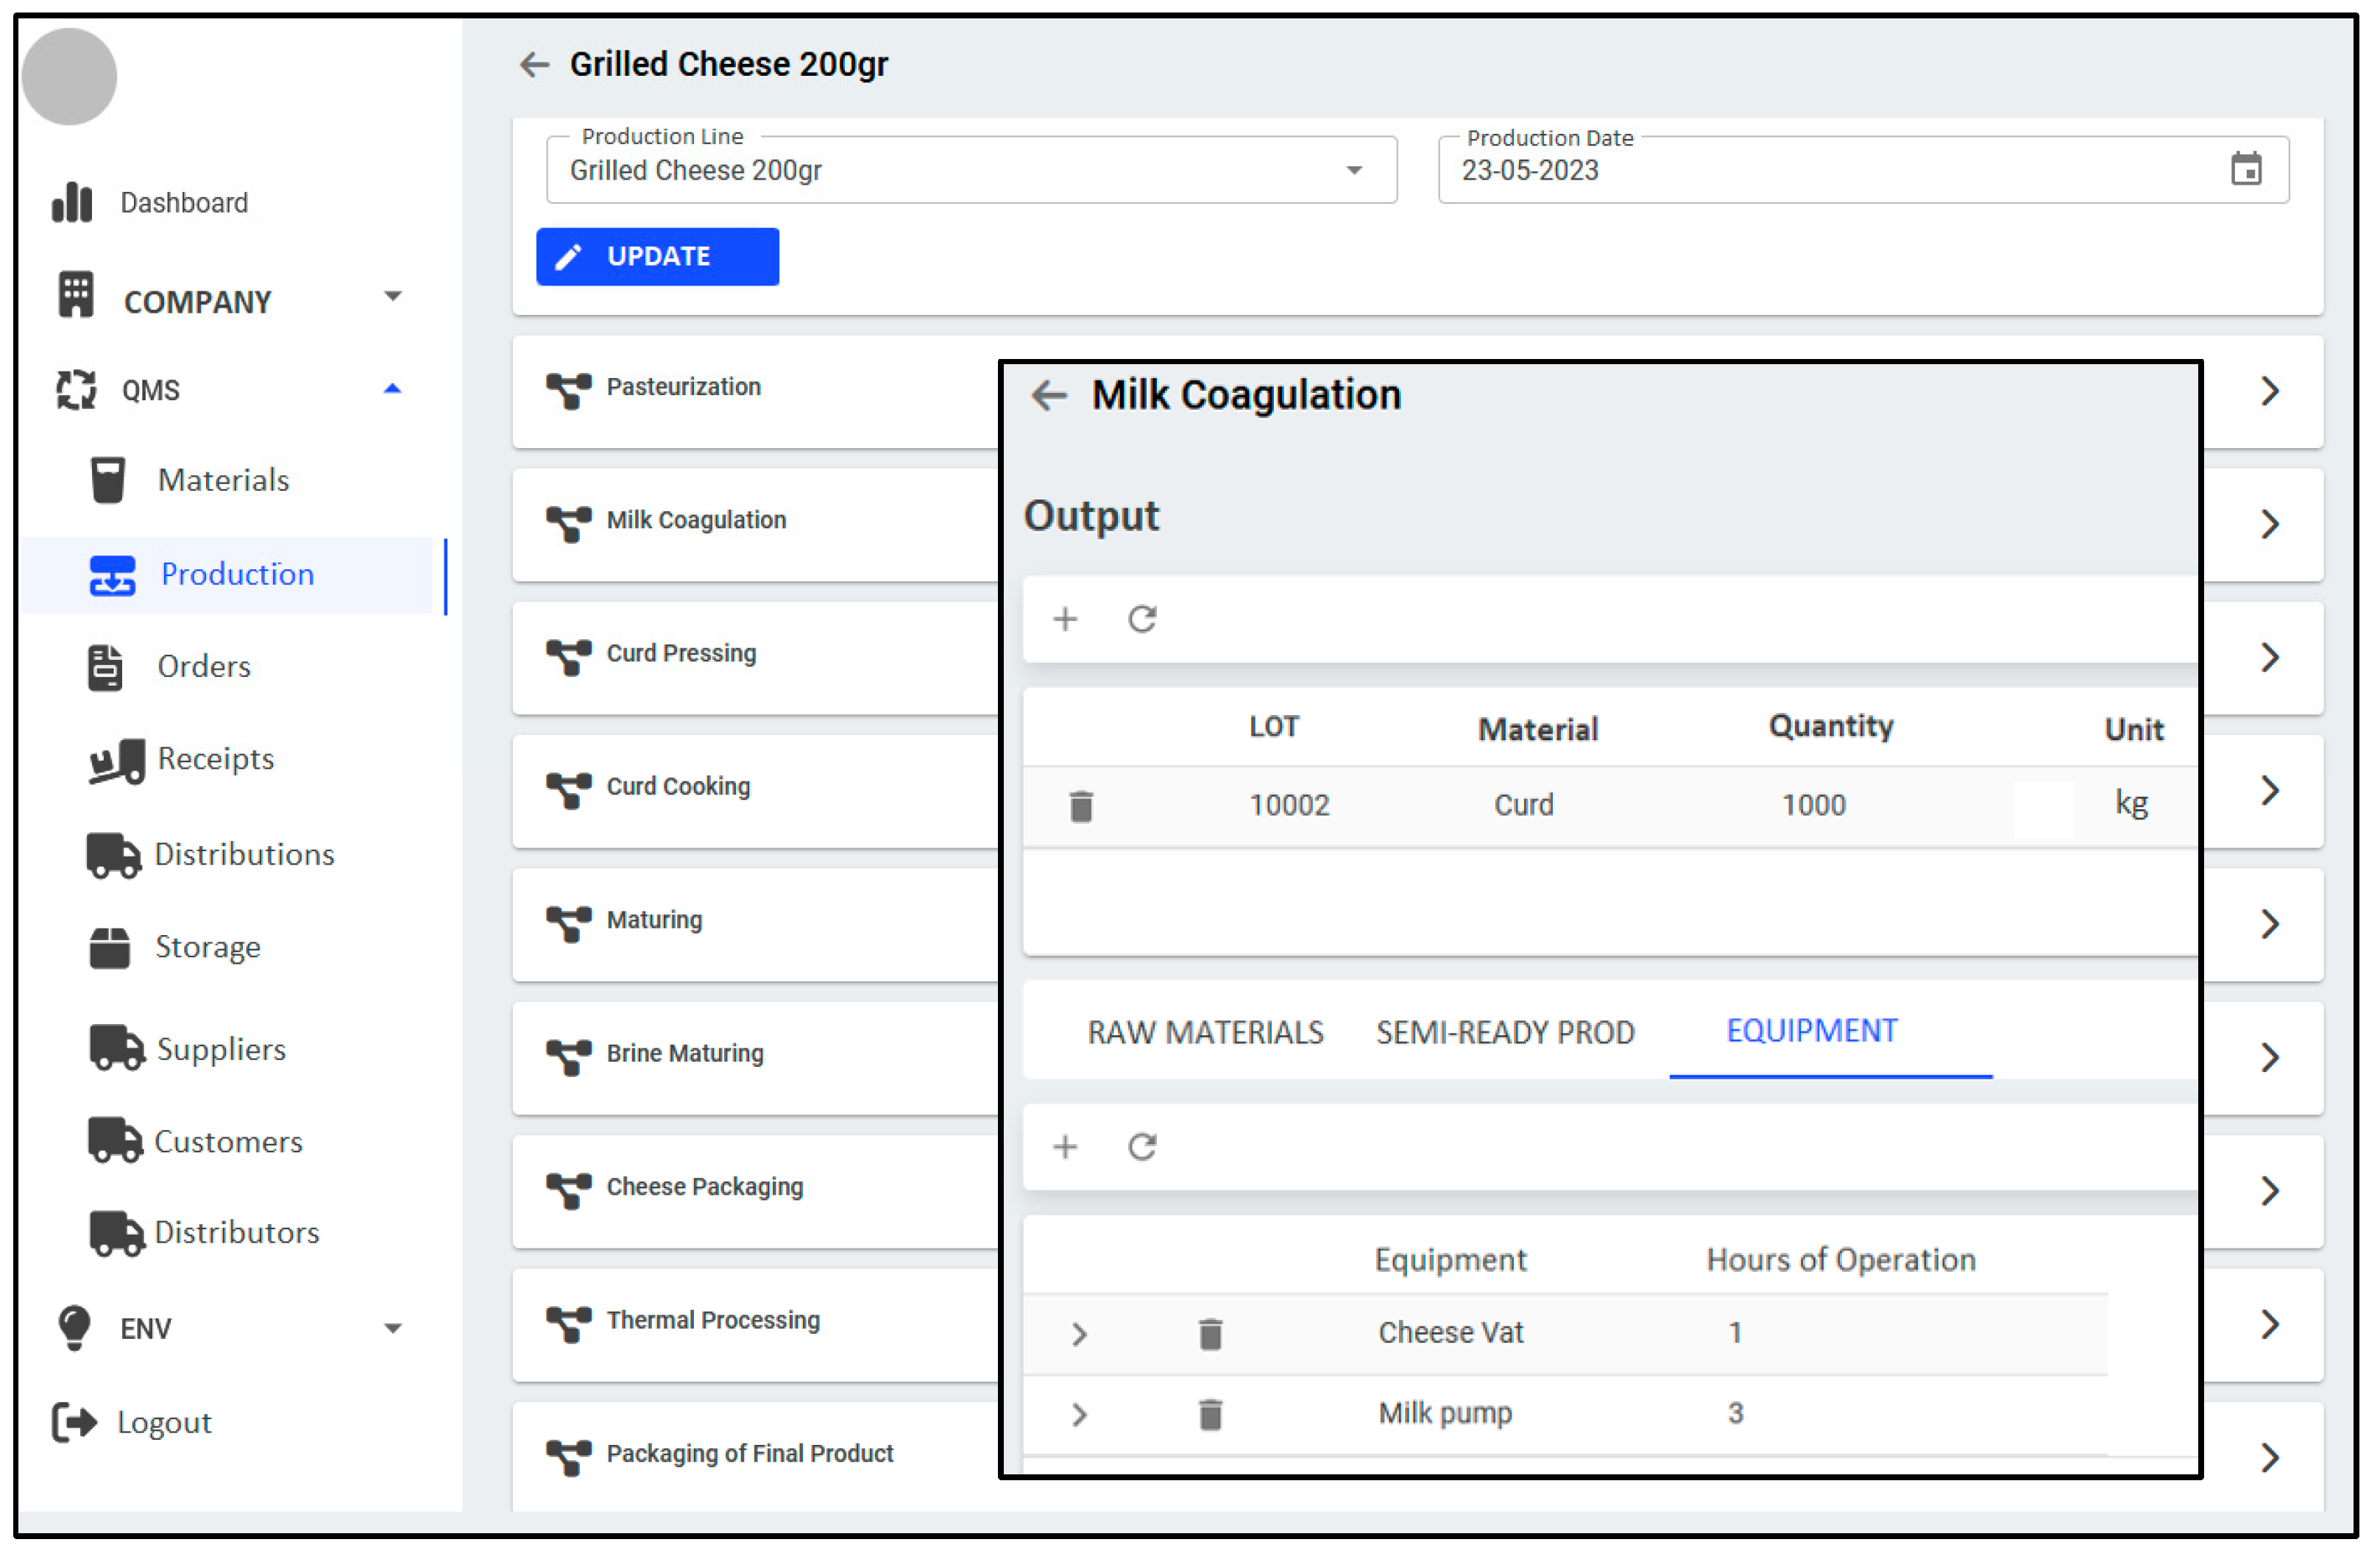

Disclaimer/Publisher’s Note: The statements, opinions and data contained in all publications are solely those of the individual author(s) and contributor(s) and not of MDPI and/or the editor(s). MDPI and/or the editor(s) disclaim responsibility for any injury to people or property resulting from any ideas, methods, instructions or products referred to in the content. |
© 2024 by the authors. Licensee MDPI, Basel, Switzerland. This article is an open access article distributed under the terms and conditions of the Creative Commons Attribution (CC BY) license (https://creativecommons.org/licenses/by/4.0/).