Article

Spatial Downscaling of ERA5 Reanalysis Air Temperature Data Based on Stacking Ensemble Learning

1
College of Geography and Environmental Science, Northwest Normal University, Lanzhou 730070, China
2
College of Civil Engineering, Lanzhou Jiaotong University, Lanzhou 730070, China
*
Author to whom correspondence should be addressed.
Sustainability 2024, 16(5), 1934; https://doi.org/10.3390/su16051934
Submission received: 21 December 2023 / Revised: 13 February 2024 / Accepted: 21 February 2024 / Published: 27 February 2024

Abstract

:
High-resolution air temperature distribution data are of crucial significance for studying climate change and agriculture in the Yellow River Basin. Obtaining accurate and high-resolution air temperature data has been a persistent challenge in research. This study selected the Yellow River Basin as its research area and assessed multiple variables, including the land surface temperature (LST), Normalized Difference Vegetation Index (NDVI), Digital Elevation Model (DEM), slope, aspect, longitude, and latitude. We constructed three downscaling models, namely, ET, XGBoost, and LightGBM, and applied a stacking ensemble learning algorithm to integrate these three models. Through this approach, ERA5-Land reanalysis air temperature data were successfully downscaled from a spatial resolution of 0.1° to 1 km, and the downscaled results were validated using observed data from meteorological stations. The results indicate that the stacking ensemble model significantly outperforms the three independent machine learning models. The integrated model, combined with the selected set of multiple variables, provides a feasible approach for downsizing ERA5 air temperature data. The stacking ensemble model not only effectively enhances the spatial resolution of ERA5 reanalysis air temperature data but also improves downscaled results to a certain extent. The downscaled air temperature data exhibit richer spatial texture information, better revealing spatial variations in air temperature within the same land class. This research outcome provides robust technical support for obtaining high-resolution air temperature data in meteorologically sparse or topographically complex regions, contributing significantly to climate, ecosystem, and sustainable development research.

1. Introduction

Air temperature is the most significant and direct manifestation of climate change, serving as a key parameter for studying climate change, hydrology, ecological environment changes, and disaster risks [1,2]. In recent years, the continuous rise in air temperatures has led to an increase in the intensity and frequency of extreme weather events such as heatwaves and severe droughts [3,4]. Climate warming accelerates the reduction in surface water, leading to an increased severity of agricultural droughts and potential changes in the growth cycle, yield, and quality of crops [5,6]. In regions with complex topography and significant elevation differences, conducting research in fields such as geography and ecology requires high spatial resolution air temperature distribution data [7,8]. Therefore, obtaining refined high spatial resolution air temperature data has been a focal and challenging issue for scholars.
The Yellow River Basin is a crucial component of China’s ecological security strategy. It falls within the category of climate-sensitive and ecologically vulnerable areas. Against the backdrop of climate change, the air temperature in the Yellow River Basin has been consistently rising. The region is experiencing an increase in the intensity and frequency of extreme weather events, leading to a heightened occurrence of natural disasters. This trend has adverse implications for the social and economic sustainable development of the provinces within the basin [9,10]. Currently, the primary approaches for obtaining high-resolution air temperature data involve spatial interpolation of air temperature measurements from meteorological stations and downscaling of low-resolution air temperature data [11,12]. Conventional methods of interpolating measured air temperature data from meteorological stations heavily rely on the distribution of these stations. Due to the non-uniform distribution of stations and the sparse presence of stations in some areas, relying solely on spatial interpolation of meteorological station air temperature data cannot yield accurate high-resolution spatial distribution results.
Reanalysis air temperature data are assimilated from meteorological station data, numerical weather forecasts, and satellite remote sensing data. They possess characteristics of a long time span and extensive coverage, effectively addressing the uneven spatial distribution of air temperature observation data [13,14,15,16]. Current reanalysis datasets include NCEP/NCAR from the National Centers for Environmental Prediction and ERA-Interim, ERA-40, and ERA5 from the European Centre for Medium-Range Weather Forecasts (ECMWF) [17,18,19]. ERA5, the fifth-generation reanalysis dataset released by ECMWF, includes ERA5-Land, which focuses on the land component, with improved temporal resolution of 1 h and spatial resolution of 0.1° [20]. In recent years, ERA5 air temperature data have been widely applied in various studies. For instance, Zou et al. analyzed the performance of ERA5 air temperature data for a southeastern coastal urban agglomeration, validating the data with meteorological station observations and finding overall satisfactory performance [21]. Tang et al. simulated Manas River runoff using the ERA5 dataset [22]. However, the low resolution of ERA5 reanalysis air temperature data limits its application in studies of some complex terrain regions. Therefore, how to perform downscaling on ERA5 data has become one of the focal areas of research.
Common spatial downscaling methods include dynamic downscaling and statistical downscaling. Dynamic downscaling primarily utilizes the results of low-resolution global climate models as boundary conditions, applying regional climate models for simulation and prediction to obtain high-resolution regional climate characteristics. Although dynamic downscaling is widely used, it has drawbacks such as high computational requirements and significant simulation errors [23,24]. Statistical downscaling primarily involves calculating statistical relationships between large-scale climate variables and local climate variables to downscale the data. Statistical downscaling is characterized by its advantages of low computational requirements and ease of operation [25], making it a primary method for improving the spatial resolution of meteorological data. Currently, commonly used statistical downscaling methods include linear interpolation, multiple linear regression, and machine learning methods. Early statistical downscaling models mainly relied on the linear relationships between meteorological elements and single factors. For example, Kustas et al. [26] established a linear relationship between the normalized vegetation index and low-resolution land surface temperatures, applied to high-resolution normalized vegetation index and land surface temperature data. However, models based on a single factor are not suitable for regions with complex topography. To address this issue, researchers have incorporated land use/land cover data emphasizing surface types and data highlighting topographic changes, such as elevation, slope, and aspect, to conduct downscaling studies for complex terrain. Zhu et al. [27] used a geographically weighted regression method to establish the relationship between land surface temperature and NDVI, DEM, slope, latitude, and longitude, downsizing 1 km resolution MODIS land surface temperature data to 100 m. Although traditional statistical regression methods have achieved certain effectiveness in downscaling research, there are limitations due to the complex non-linear relationships between meteorological elements and topographic factors as well as land surface types. Research has found that machine learning models, compared to traditional models, possess better learning capabilities for complex nonlinear relationships, can effectively handle large amounts of high-dimensional data, and can achieve higher accuracy in downscaling results [28]. Therefore, many scholars use machine learning models to downscale low-resolution air temperature data. For instance, Jing et al. [29] employed a regression tree model to downscale NCEP/NCAR reanalysis data and conducted validation, obtaining monthly average air temperature data with a resolution of 1 km. Li et al. [30] used various machine learning methods to downscale 2 m air temperature grid data and validated the results using observed air temperature data, revealing higher accuracy in the downscaled data compared to the original data. Wang et al. [31] conducted air temperature downscaling in the greater Tokyo area based on the regression relationship between air temperature and DEM, land use/land cover, utilizing the random forest algorithm. Yu et al. [32] employed a downscaling model combining thin plate spline functions and random forest algorithms to downscale ERA5 reanalysis air temperature data.
The ERA5 air temperature reanalysis data have a relatively low resolution, making then unsuitable for direct use in regions with significant topographic differences and sparse meteorological station distribution. Therefore, this study utilizes ERA5 air temperature data from 2003 to 2020, selecting land surface temperature, NDVI, elevation, slope, aspect, longitude, and latitude as variable factors. Three machine learning algorithms, LightGBM, XGBoost, and Extreme Random Trees (ET), are applied to downscale ERA5 reanalysis air temperature data for the Yellow River Basin. The stacking ensemble learning method is then employed to integrate the three models. This approach aims to select the best downscaling model to reduce the resolution of ERA5 reanalysis air temperature data from 0.1° to 1 km for the period from 2003 to 2020. The downscaled results are validated for accuracy using ground-truth measurements from meteorological stations in the study area.

2. Materials and Methods
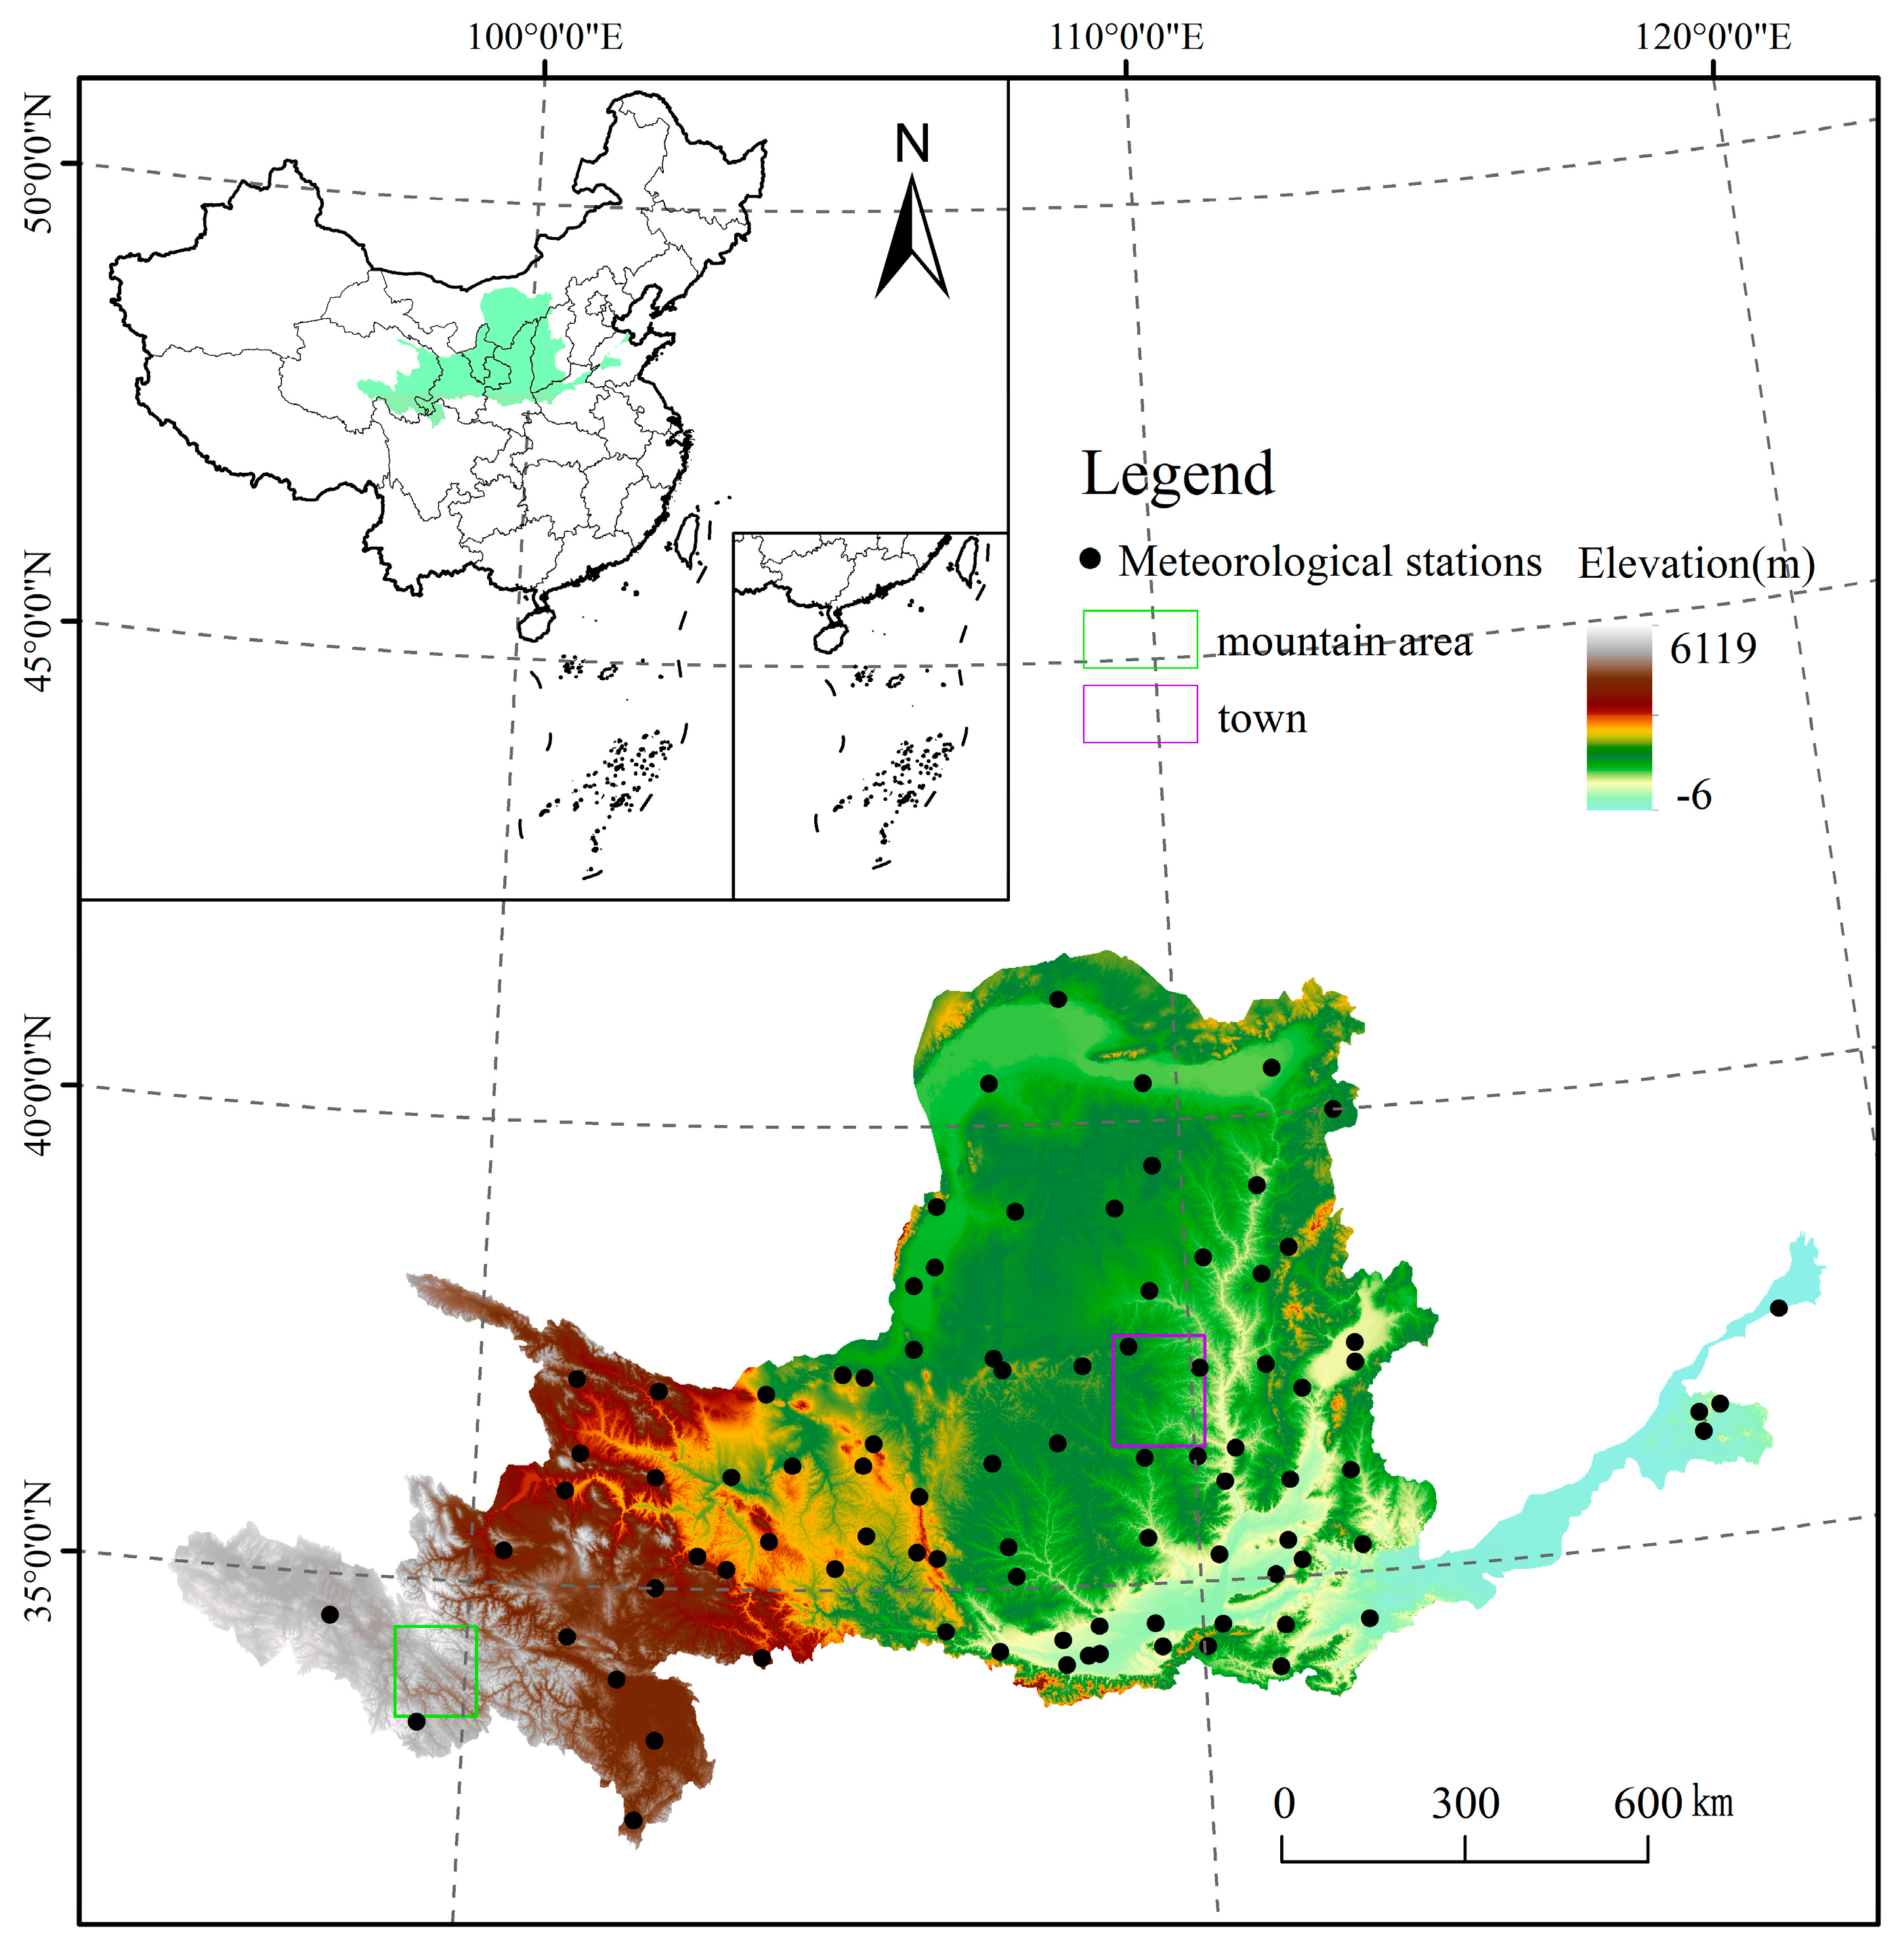
2.1. Study Area

The Yellow River Basin serves as an ecological corridor connecting the Qinghai-Tibet Plateau, Loess Plateau, and North China Plain, holding a crucial position in China’s socio-economic sustainable development and ecological security. Located in northern China (Figure 1), it spans approximately 32° to 42° N latitude and 96° to 119° E longitude. Flowing through nine provinces—Qinghai, Sichuan, Gansu, Ningxia, Inner Mongolia, Shaanxi, Shanxi, Henan, and Shandong—the Yellow River has a total length of about 5464 km and a drainage area of approximately 795,000 km2. The topography and landforms in the basin exhibit significant variations, generally characterized by a west-high to east-low pattern, forming three major terraces across the Qinghai-Tibet Plateau, Hetao Plain, and Ordos Plateau as well as the Loess Plateau and the North China Plain. The Yellow River Basin experiences diverse climate conditions, including arid, semi-arid, and semi-humid continental monsoons. Summers are characterized by high temperatures and abundant rainfall, while winters are cold and dry. The soils in the region consist of various types, such as alpine soil, arid soil, and semi-leached soil. Natural vegetation includes alpine meadows, grasslands, and deciduous forests. The temperature fluctuates significantly, decreasing from south to north and from east to west. The annual average temperature is around 7 °C, and the annual average precipitation is 440 mm, with 70% of the total precipitation occurring in the summer.

2.2. Data Sources and Preprocessing

(1)
ERA5-Land reanalysis air temperature data
ERA5, as the latest generation of reanalysis data, is a dataset suitable for climate research funded by the European Union and executed by the European Centre for Medium-Range Weather Forecasts (ECMWF) under the Copernicus Climate Change Service (C3S). In comparison to its predecessor, ERA-Interim, ERA5 exhibits significant improvements in both temporal and spatial resolutions. ERA5-Land is generated by replaying the land component of ECMWF ERA5 reanalysis at a resolution of 0.1 °. The data are sourced from the European Centre for Medium-Range Weather Forecasts (https://cds.climate.copernicus.eu/; accessed on 6 September 2023). The downloaded ERA5-Land reanalysis air temperature data are are presented in the form of monthly average.NC format images. Using Python 3.7 and ArcGIS 10.4.1 software, these files can be converted to .tif format and subjected to preprocessing steps such as projection transformation and unit conversion.
(2)
Meteorological station data
Meteorological station air temperature data are sourced from the National Meteorological Data Sharing Platform. The data comprise station coordinates latitude, longitude, elevation, and daily air temperature at the site. There are a total of 89 stations within the study area. The data are processed to derive monthly average values, which are then utilized for credibility testing of ERA5 reanalysis air temperature data and accuracy verification of downscaling results.
(3)
MODIS data
MODIS remote sensing data are obtained from the NASA official website. The MODIS land surface temperature (LST) data include daytime data acquired at 10:30 and nighttime data acquired at 22:30 from the MOD11A2 product as well as early morning data acquired at 1:30 and daytime data acquired at 1:30 from the MYD11A2 product. The LST data have a spatial resolution of 1 km and are an 8-day composite product. Normalized Difference Vegetation Index (NDVI) data are a 30-day composite product with a resolution of 1 km. MODIS data are in .hdf format images. Initially, the MODIS Reprojection Tool (MRT, https://lpdaac.usgs.gov/tools/) software is used for tasks such as band extraction, stitching, projection conversion, and format conversion, resulting in four types of raster data for land surface temperature (LST) and the normalized vegetation index (NDVI). Based on this, then, Python was used for outlier removal and unit conversion. The 8-day composite LST data are then synthesized into monthly values using the mean synthesis method. The MODIS monthly land surface temperature (LST) and NDVI (Normalized Difference Vegetation Index) data have sporadic missing values for some months. We used ArcGIS to fill in the missing values, and the filling effect is shown in Figure 2.
(4)
DEM data
Digital Elevation Model (DEM) data are sourced from the Resource and Environmental Science Data Center (http://www.resdc.cn/), with a spatial resolution of 1 km. The DEM data are utilized to compute terrain factors such as slope and aspect at a 1 km resolution. These terrain factors serve as input components in downsizing the analysis of air temperature data.

2.3. Research Methods

Space downscaling research requires the incorporation of high-resolution information to construct trend surfaces, establish a relationship model between air temperature and trend surfaces, and assume that this relationship model does not change with variations in spatial scale. The main factors influencing the spatial distribution of air temperature include macro-geographical conditions such as latitude and altitude, local topographic factors such as slope and aspect as well as underlying surface properties such as vegetation cover and land surface temperature. Therefore, this paper introduces 1 km land surface temperature (LST) data, Normalized Difference Vegetation Index (NDVI) data, Digital Elevation Model (DEM) data, and geographical location data using machine learning methods to downscale the 0.1° ERA5 reanalysis air temperature data from 2003 to 2020 to a 1 km resolution. The specific process is as follows: First, the ERA5-Land reanalysis air temperature data, four types of land surface temperature data, NDVI data, DEM data, and latitude-longitude data as well as slope and aspect data are subjected to data cleaning and processing to generate sample data for model training and testing. Next, based on the sample data and machine learning methods, the ERA5-Land reanalysis air temperature downscaling model is trained and tested. Eighty percent of the sample data are used to train the downscaling model, and the remaining 20% are used to test the performance of the downscaling model. Finally, the validation period data are input into the model to obtain the downscaled air temperature results at a 1 km resolution for each machine learning model and the stacking ensemble model. The downscaled results are then validated for accuracy using observed air temperature data from monitoring stations.

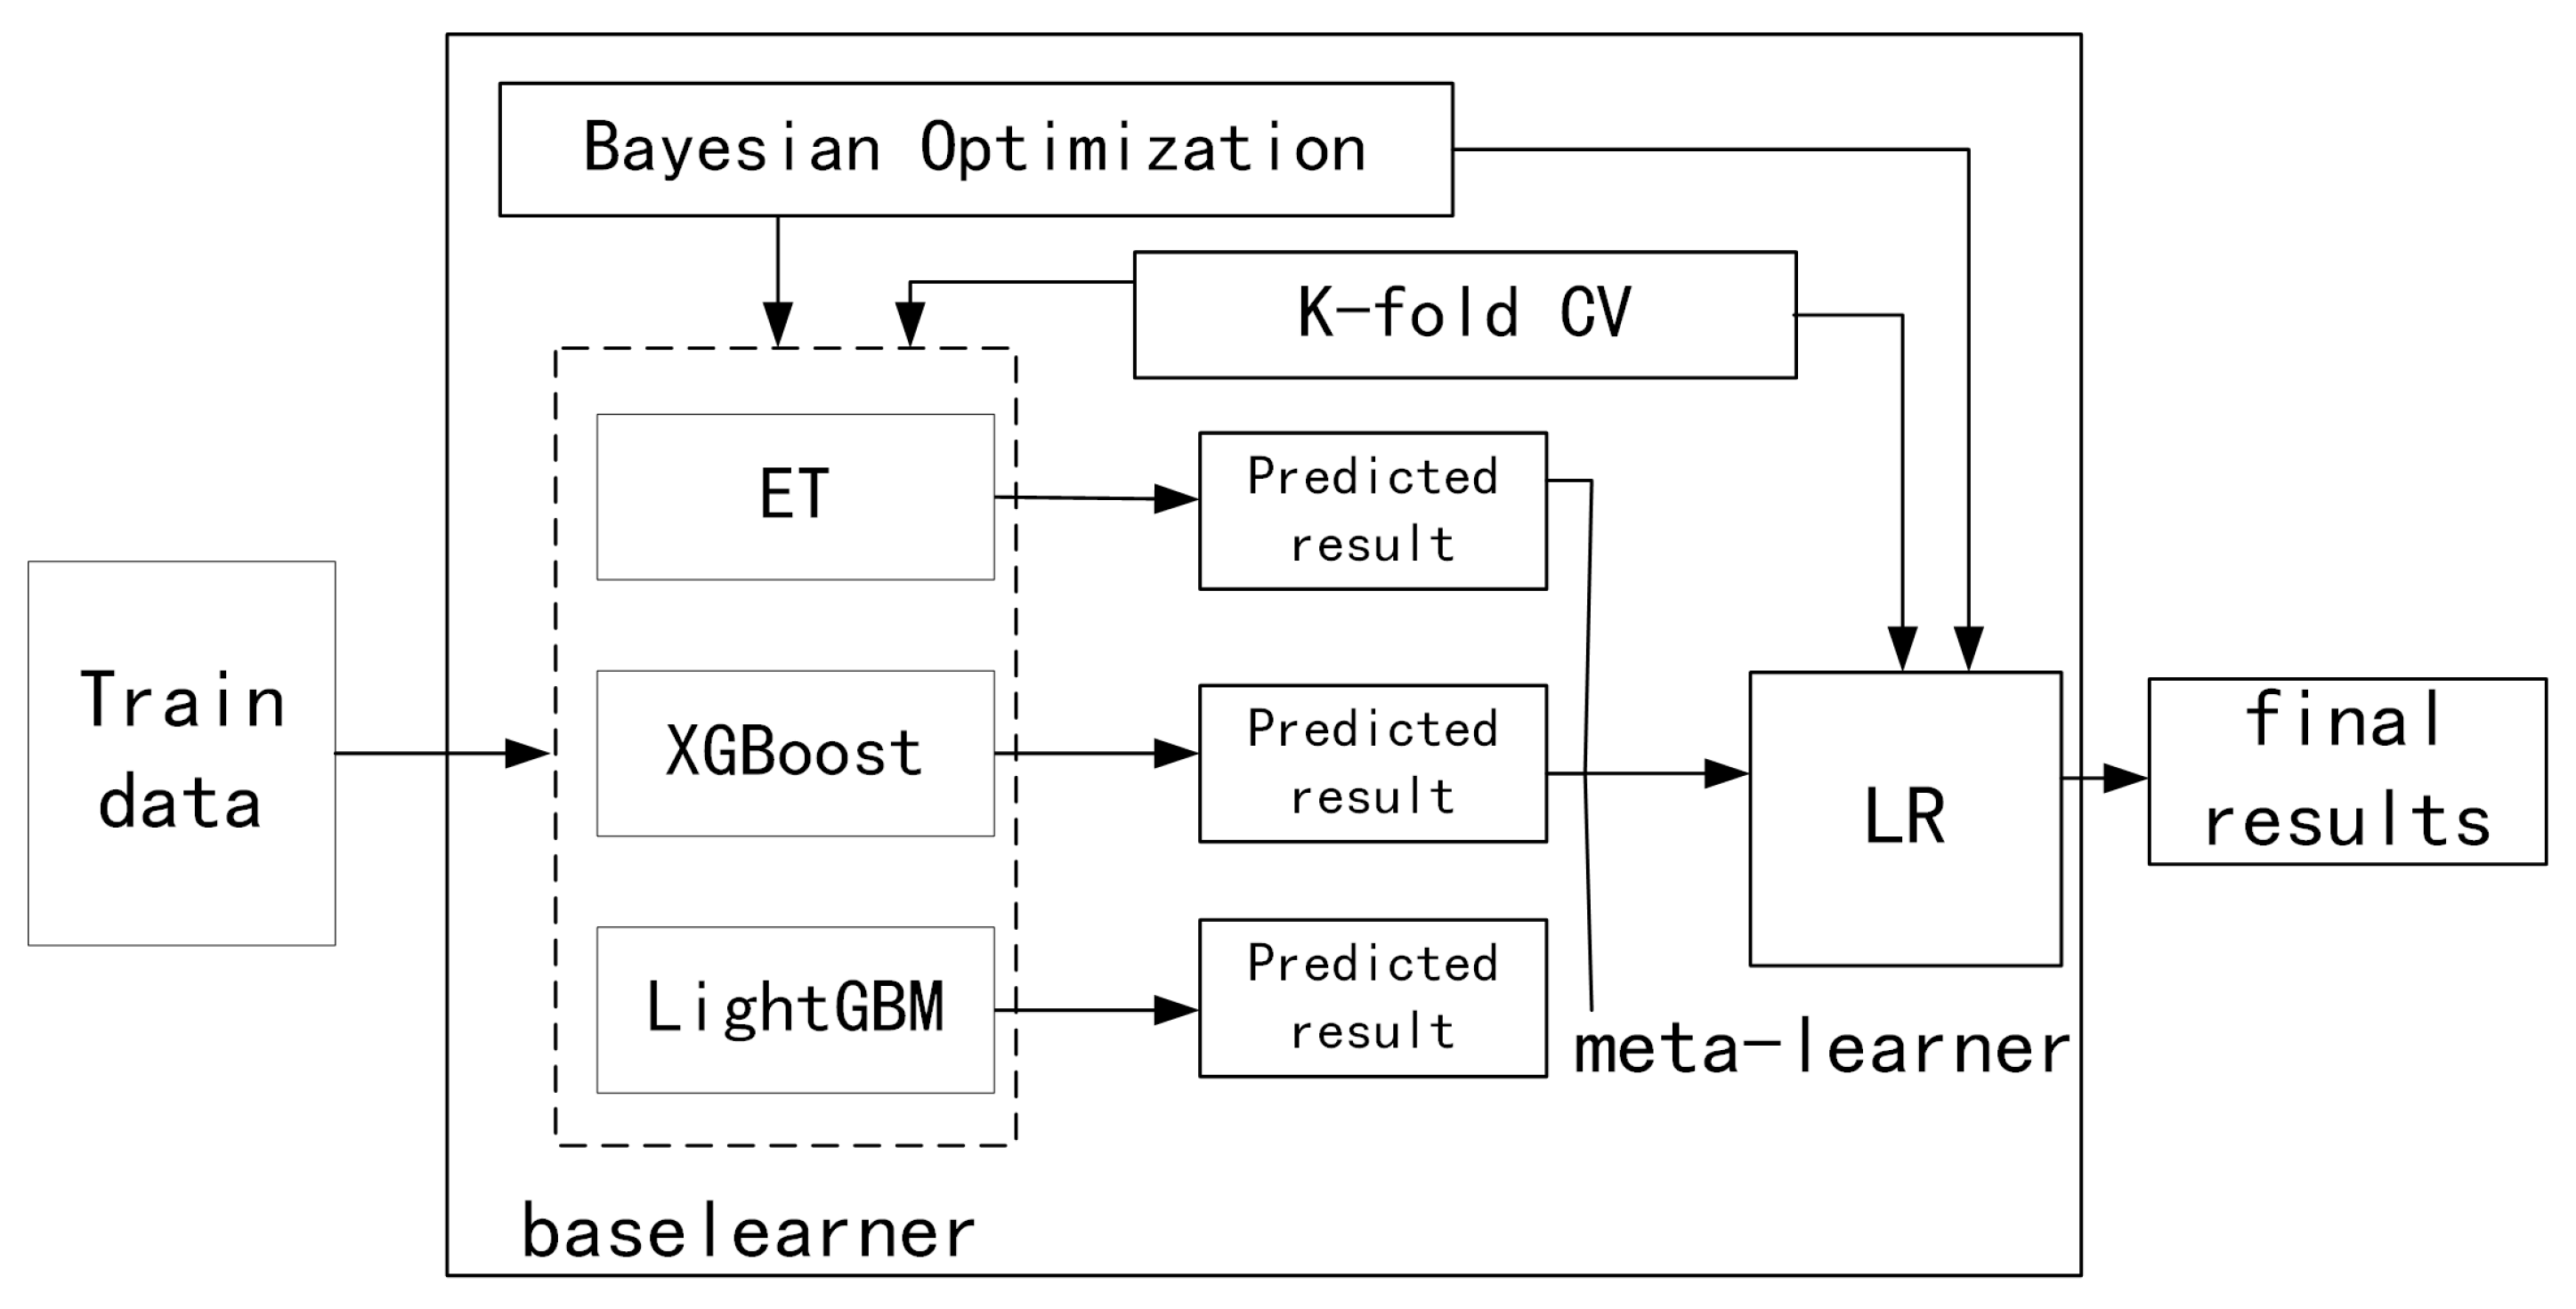
2.3.1. Stacking Ensemble Learning

(1)
Stacking ensemble learning principles
Stacking is a hierarchical ensemble modeling method proposed by Wolpert in 1992, as illustrated in Figure 3. The fundamental idea of stacking ensemble learning is to first train the base learners on the original data to obtain corresponding prediction results. Subsequently, these prediction results from multiple models are assembled into new data samples and input into a meta-learner for fitting [33,34]. The predictive performance of the stacking ensemble model is typically superior to that of individual models. The selection of base learners usually emphasizes accuracy, while the choice of meta-learner aims to further prevent overfitting of the stacking ensemble model [35].
(2)
Building a stacking ensemble learning framework
When constructing the stacking ensemble learning framework in this study, three base learners were selected for the first layer: Extreme Random Trees (ET), XGBoost, and LightGBM. The ET model is an extension of the random forest model, constructing multiple random trees and averaging their predictions to enhance model performance. Unlike random forests, extreme random trees obtain split values completely at random, thereby branching regression trees, and each regression tree in extreme random trees uses all training samples [36]. LightGBM constructs multiple weak learners and combines them into a powerful model. Additionally, LightGBM utilizes a histogram algorithm to accelerate the training process [37]. XGBoost is a machine learning algorithm based on the gradient boosting framework. Its training process involves optimizing an objective function composed of a loss function and a regularization term. The loss function measures the degree of error in model predictions, while the regularization term controls the model’s complexity to prevent overfitting [38]. To further enhance the model’s generalization ability, K-fold CV is introduced in the first layer to reduce the risk of model overfitting. The second layer’s meta-learner is chosen as the Linear Regressor model to avoid overfitting in the ensemble model.

2.3.2. Bayesian Optimization

Bayesian optimization is a black-box optimization method. Its principle is to fit a probability model to capture the relationship between hyperparameter combinations and the corresponding model performance. This model is then used to select the best hyperparameter settings, compute the next hyperparameter combination, update the model with the computed results, and iteratively reduce the error. Gaussian process models dynamically adjust the search direction of the hyperparameter space through Bayesian updates, thereby improving the efficiency of the search. Gaussian-based Bayesian optimization dynamically adjusts the search direction of the hyperparameter space through Bayesian updates, thereby improving the efficiency of the search. It can handle different types of hyperparameter spaces, including continuous, discrete, and even mixed types of hyperparameters. Therefore, this paper utilizes Gaussian-based Bayesian optimization to optimize the model’s hyperparameters [39].

2.3.3. Using K-Fold CV for Model Accuracy Validation

K-fold CV is a widely used technique in machine learning for assessing the performance and generalization ability of a model. This study employs a K-fold (K = 10) cross-validation method for precision calculation. The approach involves randomly dividing the entire sample into 10 equally sized subsamples. Subsequently, one subset is retained from the ten subsamples to validate the ET model established by the other nine subsamples. This validation process is repeated ten times until each subset has been utilized as a test sample. The overall precision is the average of precision values obtained for all ten subsamples [40].

2.3.4. Evaluation Methods

This study employed three statistical evaluation metrics, namely, the coefficient of determination (R2), mean absolute error (MAE), and root mean square error (RMSE), to assess the accuracy of the downscaling method and its effectiveness on ERA5 reanalysis air temperature data. The calculation formulas are as follows:
R 2 = ( i = 1 N ( Y i Y ¯ ) ( O i O ¯ ) ) 2 i = 1 N ( Y i Y ¯ ) 2 i = 1 N ( O i O ¯ ) 2
M A E = 1 N i = 1 N ( | Y i O i | )
R M S E = 1 N i = 1 N ( Y i O i ) 2
In the formulas: N represents the total number of samples; Oi corresponds to the observed value; and Y ¯ and   O   ¯ are the mean values of the grid values and observed values, respectively.

2.3.5. Correlation Analysis

The correlation coefficient reflects the trend of change between two variables. A correlation coefficient between 0 and 1 indicates a similar trend in both variables, while a coefficient between −1 and 0 indicates an opposite trend. The larger the absolute value of the correlation coefficient, the greater the correlation between the two variables. The Pearson correlation coefficient is used to measure the linear relationship between two variables. The formula is as follows:
ρ ( x , y ) = i = 1 n ( x i x ¯ o ) ( y i y ¯ o ) i = 1 n ( x i x ¯ 0 ) 2 i = 1 n ( y i y ¯ o ) 2
xi represents the various variables influencing temperature, yi represents the actual measured temperature, and x ¯ o and y ¯ o are the means of variables influencing the temperature and actual temperature values, respectively.

3. Results

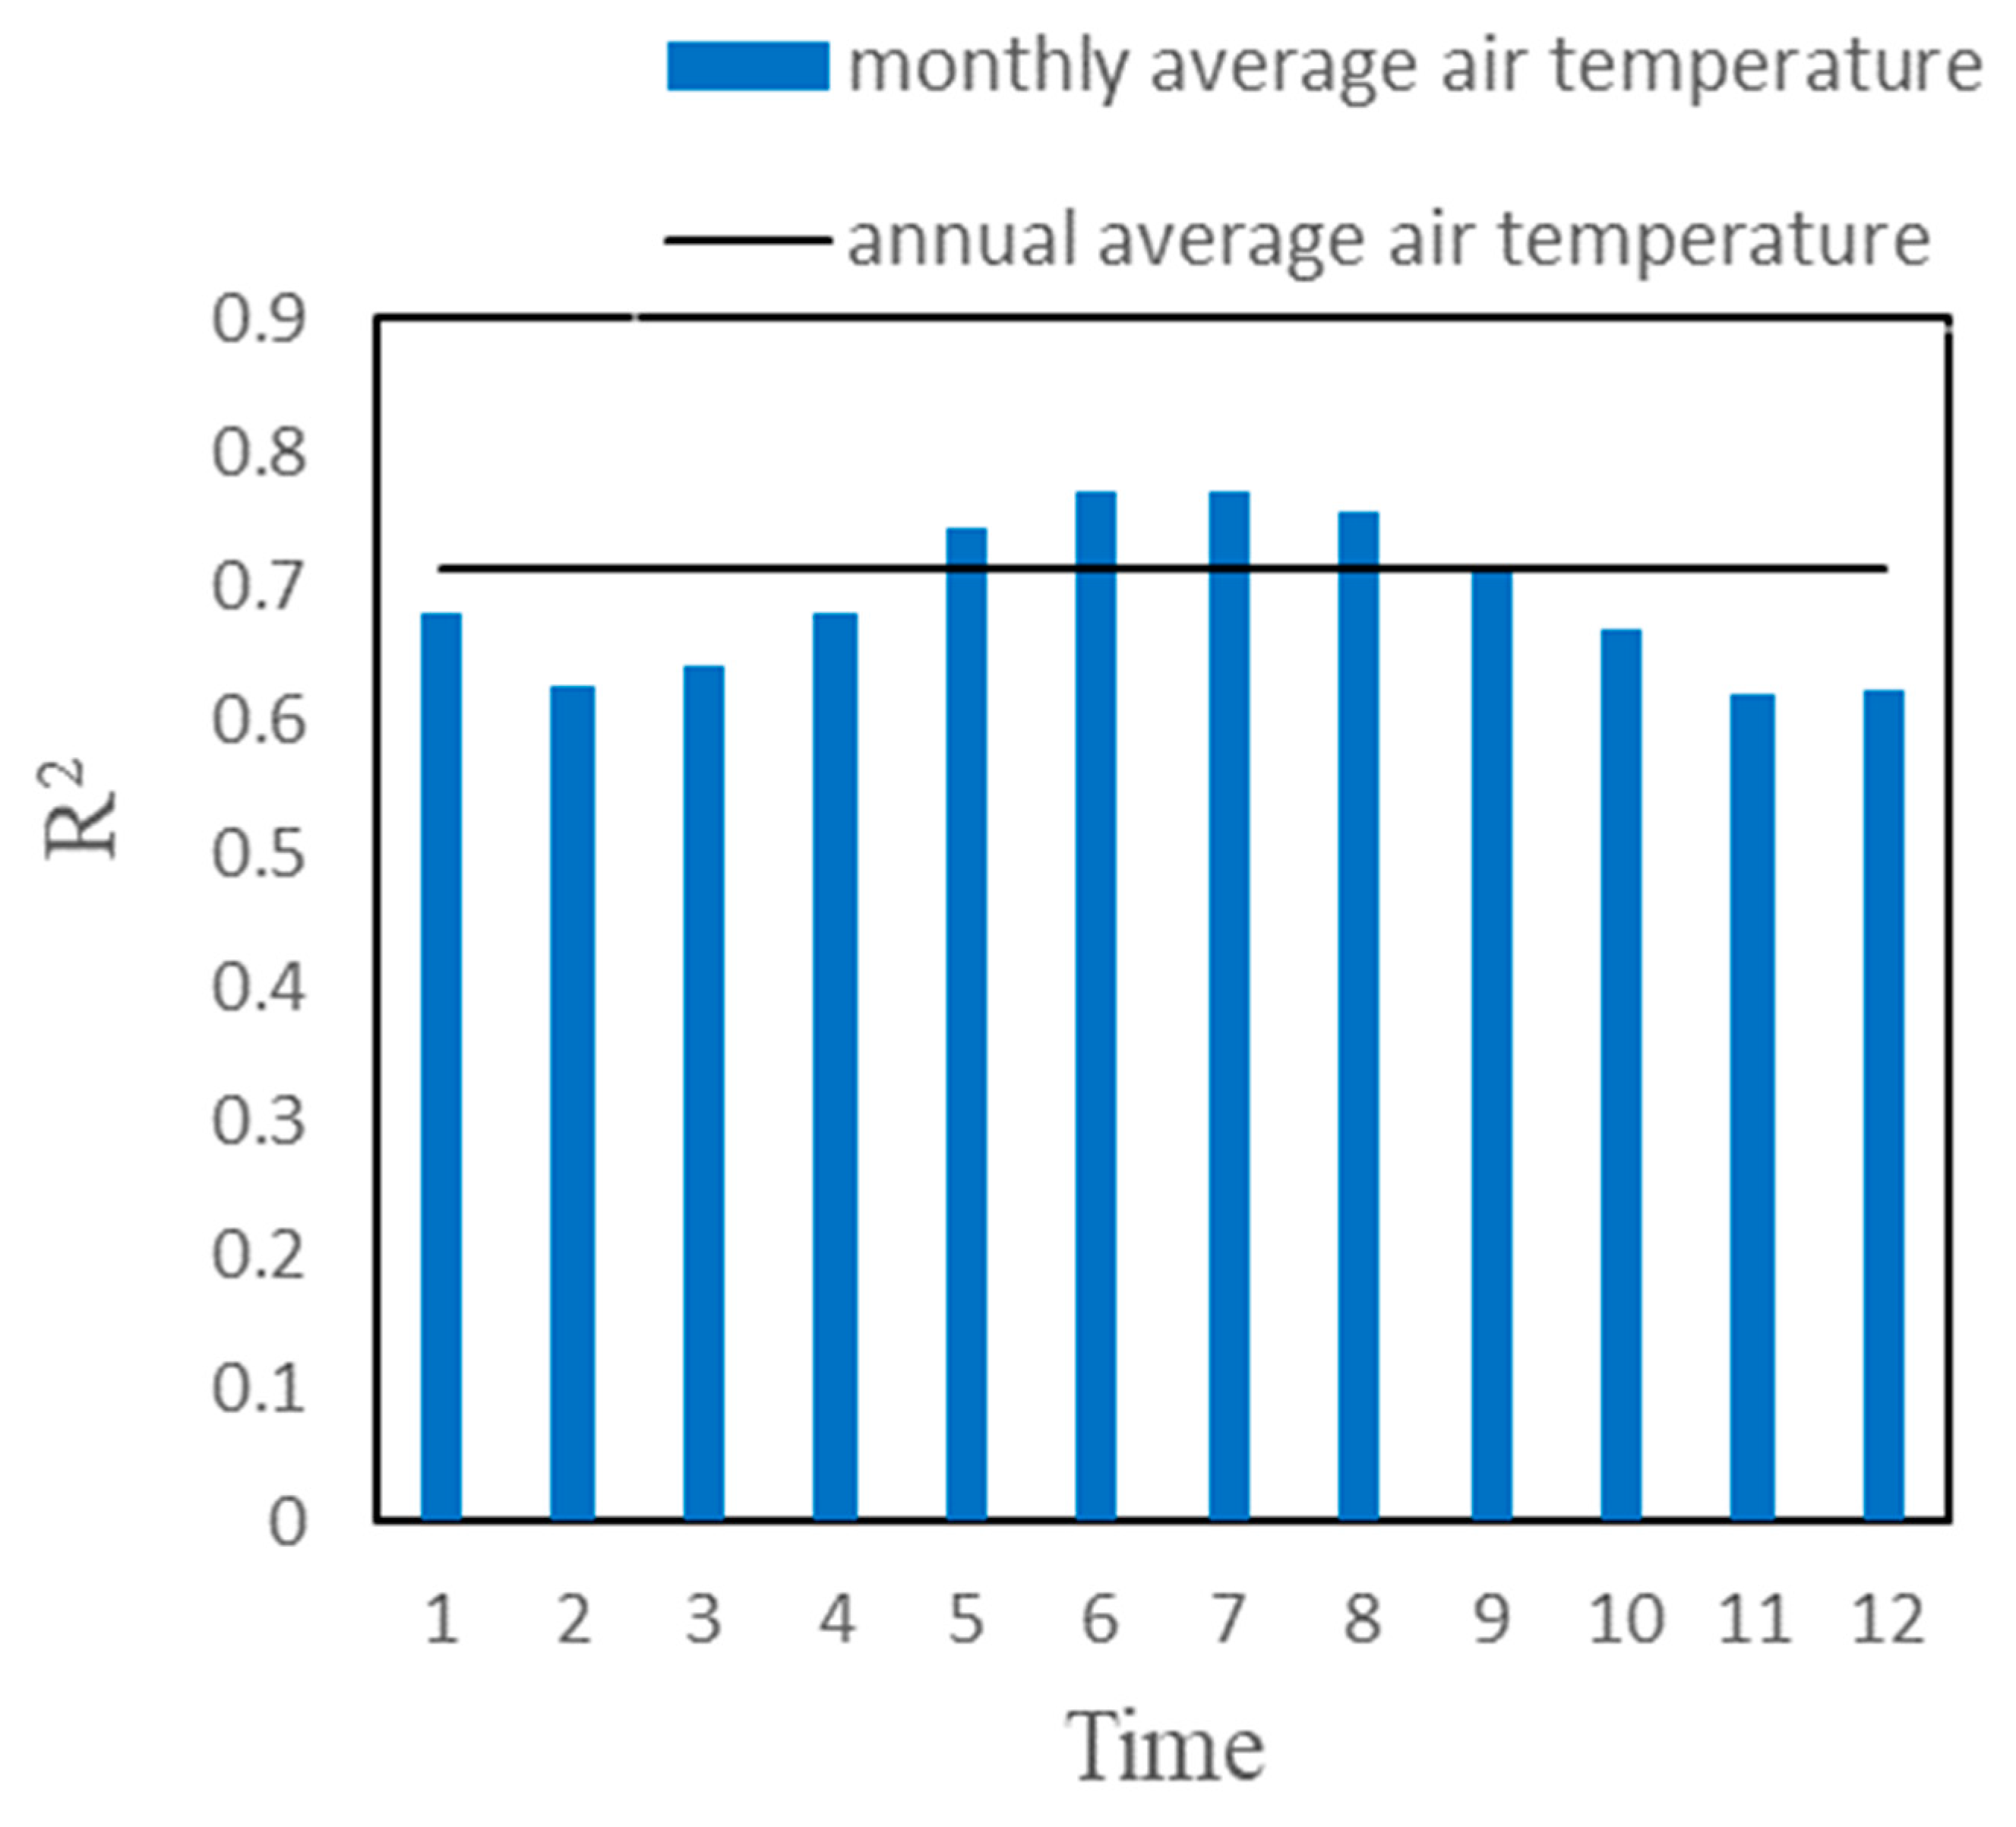
3.1. ERA5-Land Reanalysis Air Temperature Data Accuracy Analysis

Before downscaling the ERA5-Land reanalysis air temperature data, it is necessary to conduct a detailed analysis of its applicability in the study area. In this study, the observed data from meteorological stations were compared with the corresponding ERA5-Land reanalysis air temperature data at monthly and annual time scales. The correlation coefficient (R2), mean absolute error (MAE), and root mean square error (RMSE) were calculated for both data sets. The results are presented in Table 1. From monthly to annual time scales, the correlation between ERA5 reanalysis air temperature data and observed air temperatures at meteorological stations gradually increased, while errors decreased. At the annual scale, a strong correlation (0.71) was observed between ERA5-Land reanalysis air temperature data and station air temperatures. At the monthly scale, the average correlation for the 12 months was 0.69, showing consistently strong correlations throughout the year (see Figure 4). In analyzing individual months, the correlation exhibited an increasing-decreasing trend, with the most significant correlation occurring in June to August. Overall, ERA5-Land reanalysis air temperature data demonstrated good applicability in the Yellow River Basin. This analysis provides a reliable foundation for subsequent downscaling studies and emphasizes the changing characteristics of correlation at different time scales.

3.2. Variable Selection

Land surface temperature (LST) is a critical indicator in Earth meteorology and climate research. According to the energy transfer theorem, solar radiation penetrates through cloud layers to reach the Earth’s surface, where it is absorbed, leading to an increase in land surface temperature. The warming of the surface also results in the emission of long-wave radiation. The lower atmosphere has a strong absorption capacity for long-wave radiation, absorbing energy and causing an increase in air temperature. While there exists a strong correlation between land surface temperature and near-surface air temperature, their physical meanings differ. Relying solely on the linear relationship between land surface temperature and near-surface air temperature for temperature estimation results in poor accuracy. In this study, both daytime and nighttime land surface temperatures are selected as independent variables for the temperature downscaling model to reflect the influence of daytime and nighttime surface parameters on average temperature. Factors affecting near-surface temperature include macroscopic geographical conditions such as altitude and latitude as well as local terrain factors like slope and aspect. Surface properties like NDVI also play a role.
In summary, this study utilizes 10 variables as independent factors, including land surface temperature at four time points, longitude, latitude, altitude, slope, aspect, and normalized difference vegetation index (NDVI), as detailed in Table 2.
The correlation coefficients between ERA5-Land reanalysis temperature data and the 10 independent variables at a resolution of 0.1° are shown in Figure 5. In the Yellow River Basin, surface temperature at four time points and longitude exhibit a clear positive correlation with temperature, while elevation shows a strong negative correlation. However, NDVI, slope, aspect, and latitude display non-significant correlations with temperature. This suggests that an increase in surface temperature leads to a rise in temperature, while an increase in elevation results in a temperature decrease. Regarding NDVI, it exhibits a strong correlation with temperature in winter but a weaker correlation in summer, hence presenting an overall less significant relationship.

3.3. Model Performance Evaluation

This study utilized the ET algorithm, XGBoost algorithm, and LightGBM algorithm to construct downscaling models for ERA5 reanalysis air temperature data. These three models were then integrated using the stacking ensemble learning method. To assess the model performance, three statistical metrics, namely, the coefficient of determination (R2), mean absolute error (MAE), and root mean square error (RMSE), were selected for comparison. The specific results are presented in Table 3. During the 10-fold cross-validation on the training set, ET, XGBoost, LightGBM, and the Stacking ensemble model exhibited strong fitting capabilities with average scores of 0.985, 0.983, 0.981, and 0.986, respectively. Subsequently, on the test set, the performance of the four downscaling models ranked from best to worst as follows: stacking ensemble learning, ET, XGBoost, and LightGBM. Specifically, the stacking ensemble model achieved an R2 of 0.987, MAE of 0.741, and RMSE of 1.215 on the test set, demonstrating robust generalization capabilities. Based on this analysis, the stacking ensemble model exhibited superior performance in downscaling ERA5 reanalysis air temperature data, making it the selected model for air temperature downscaling in this study.

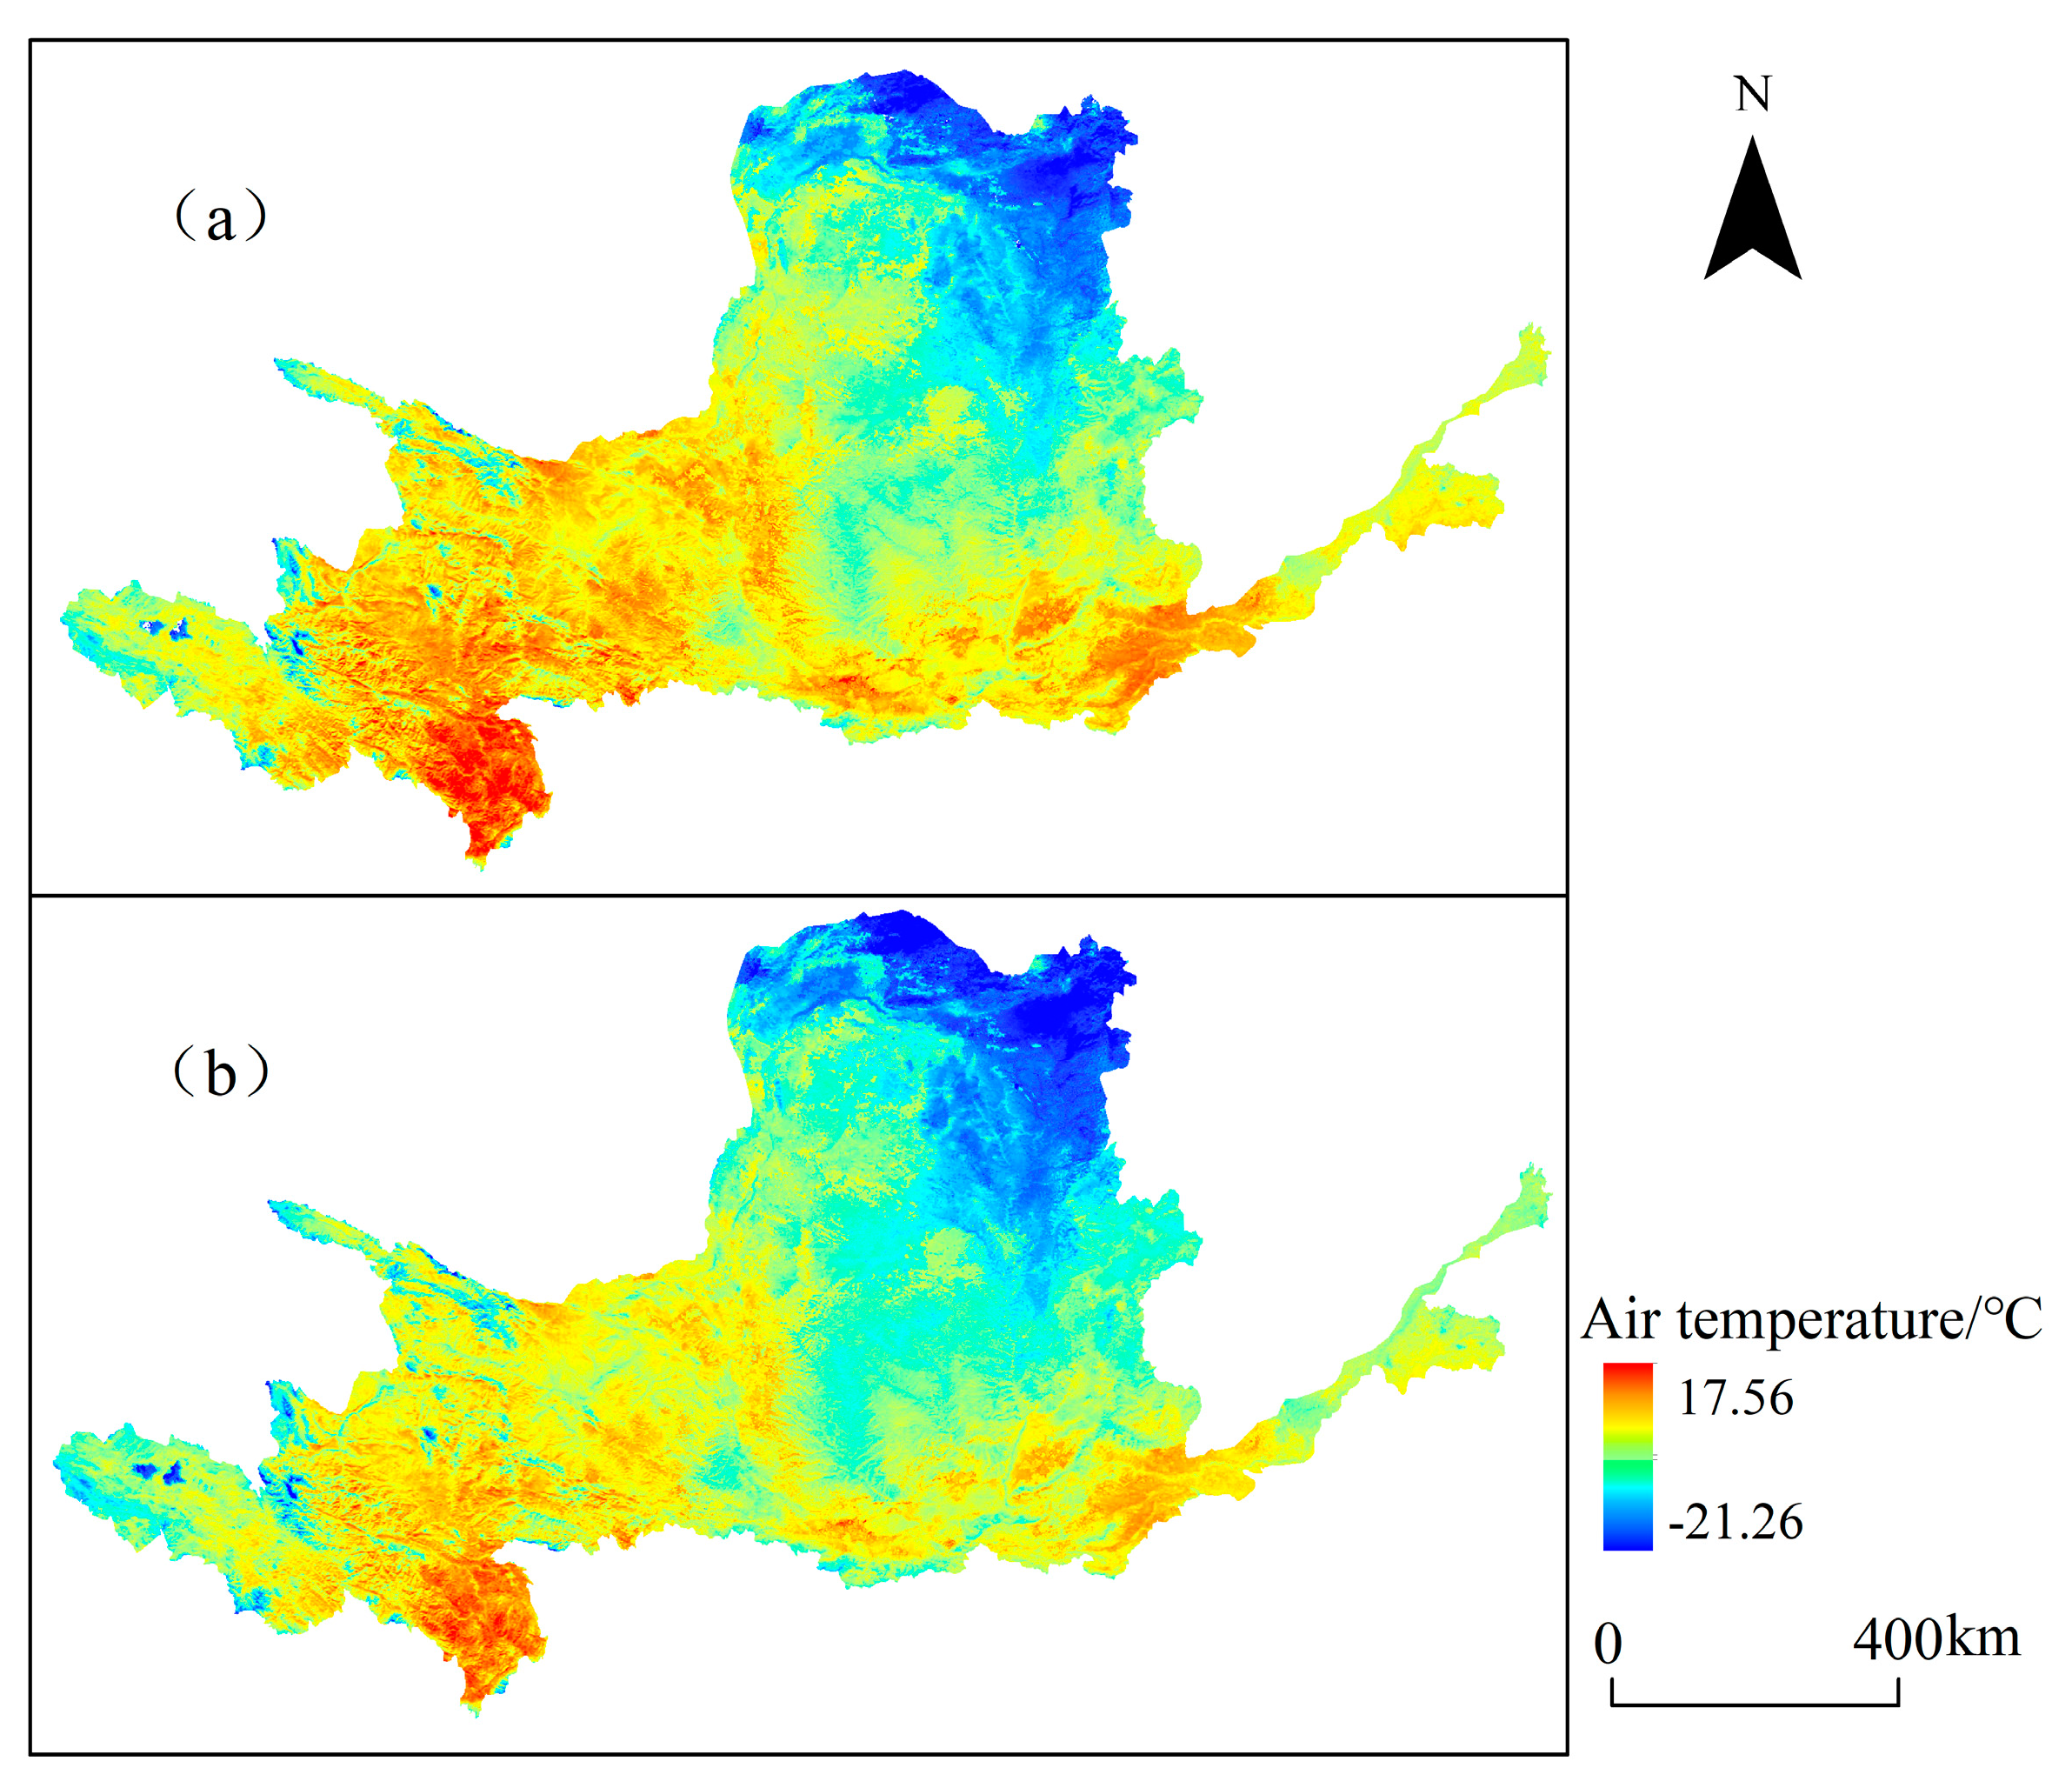
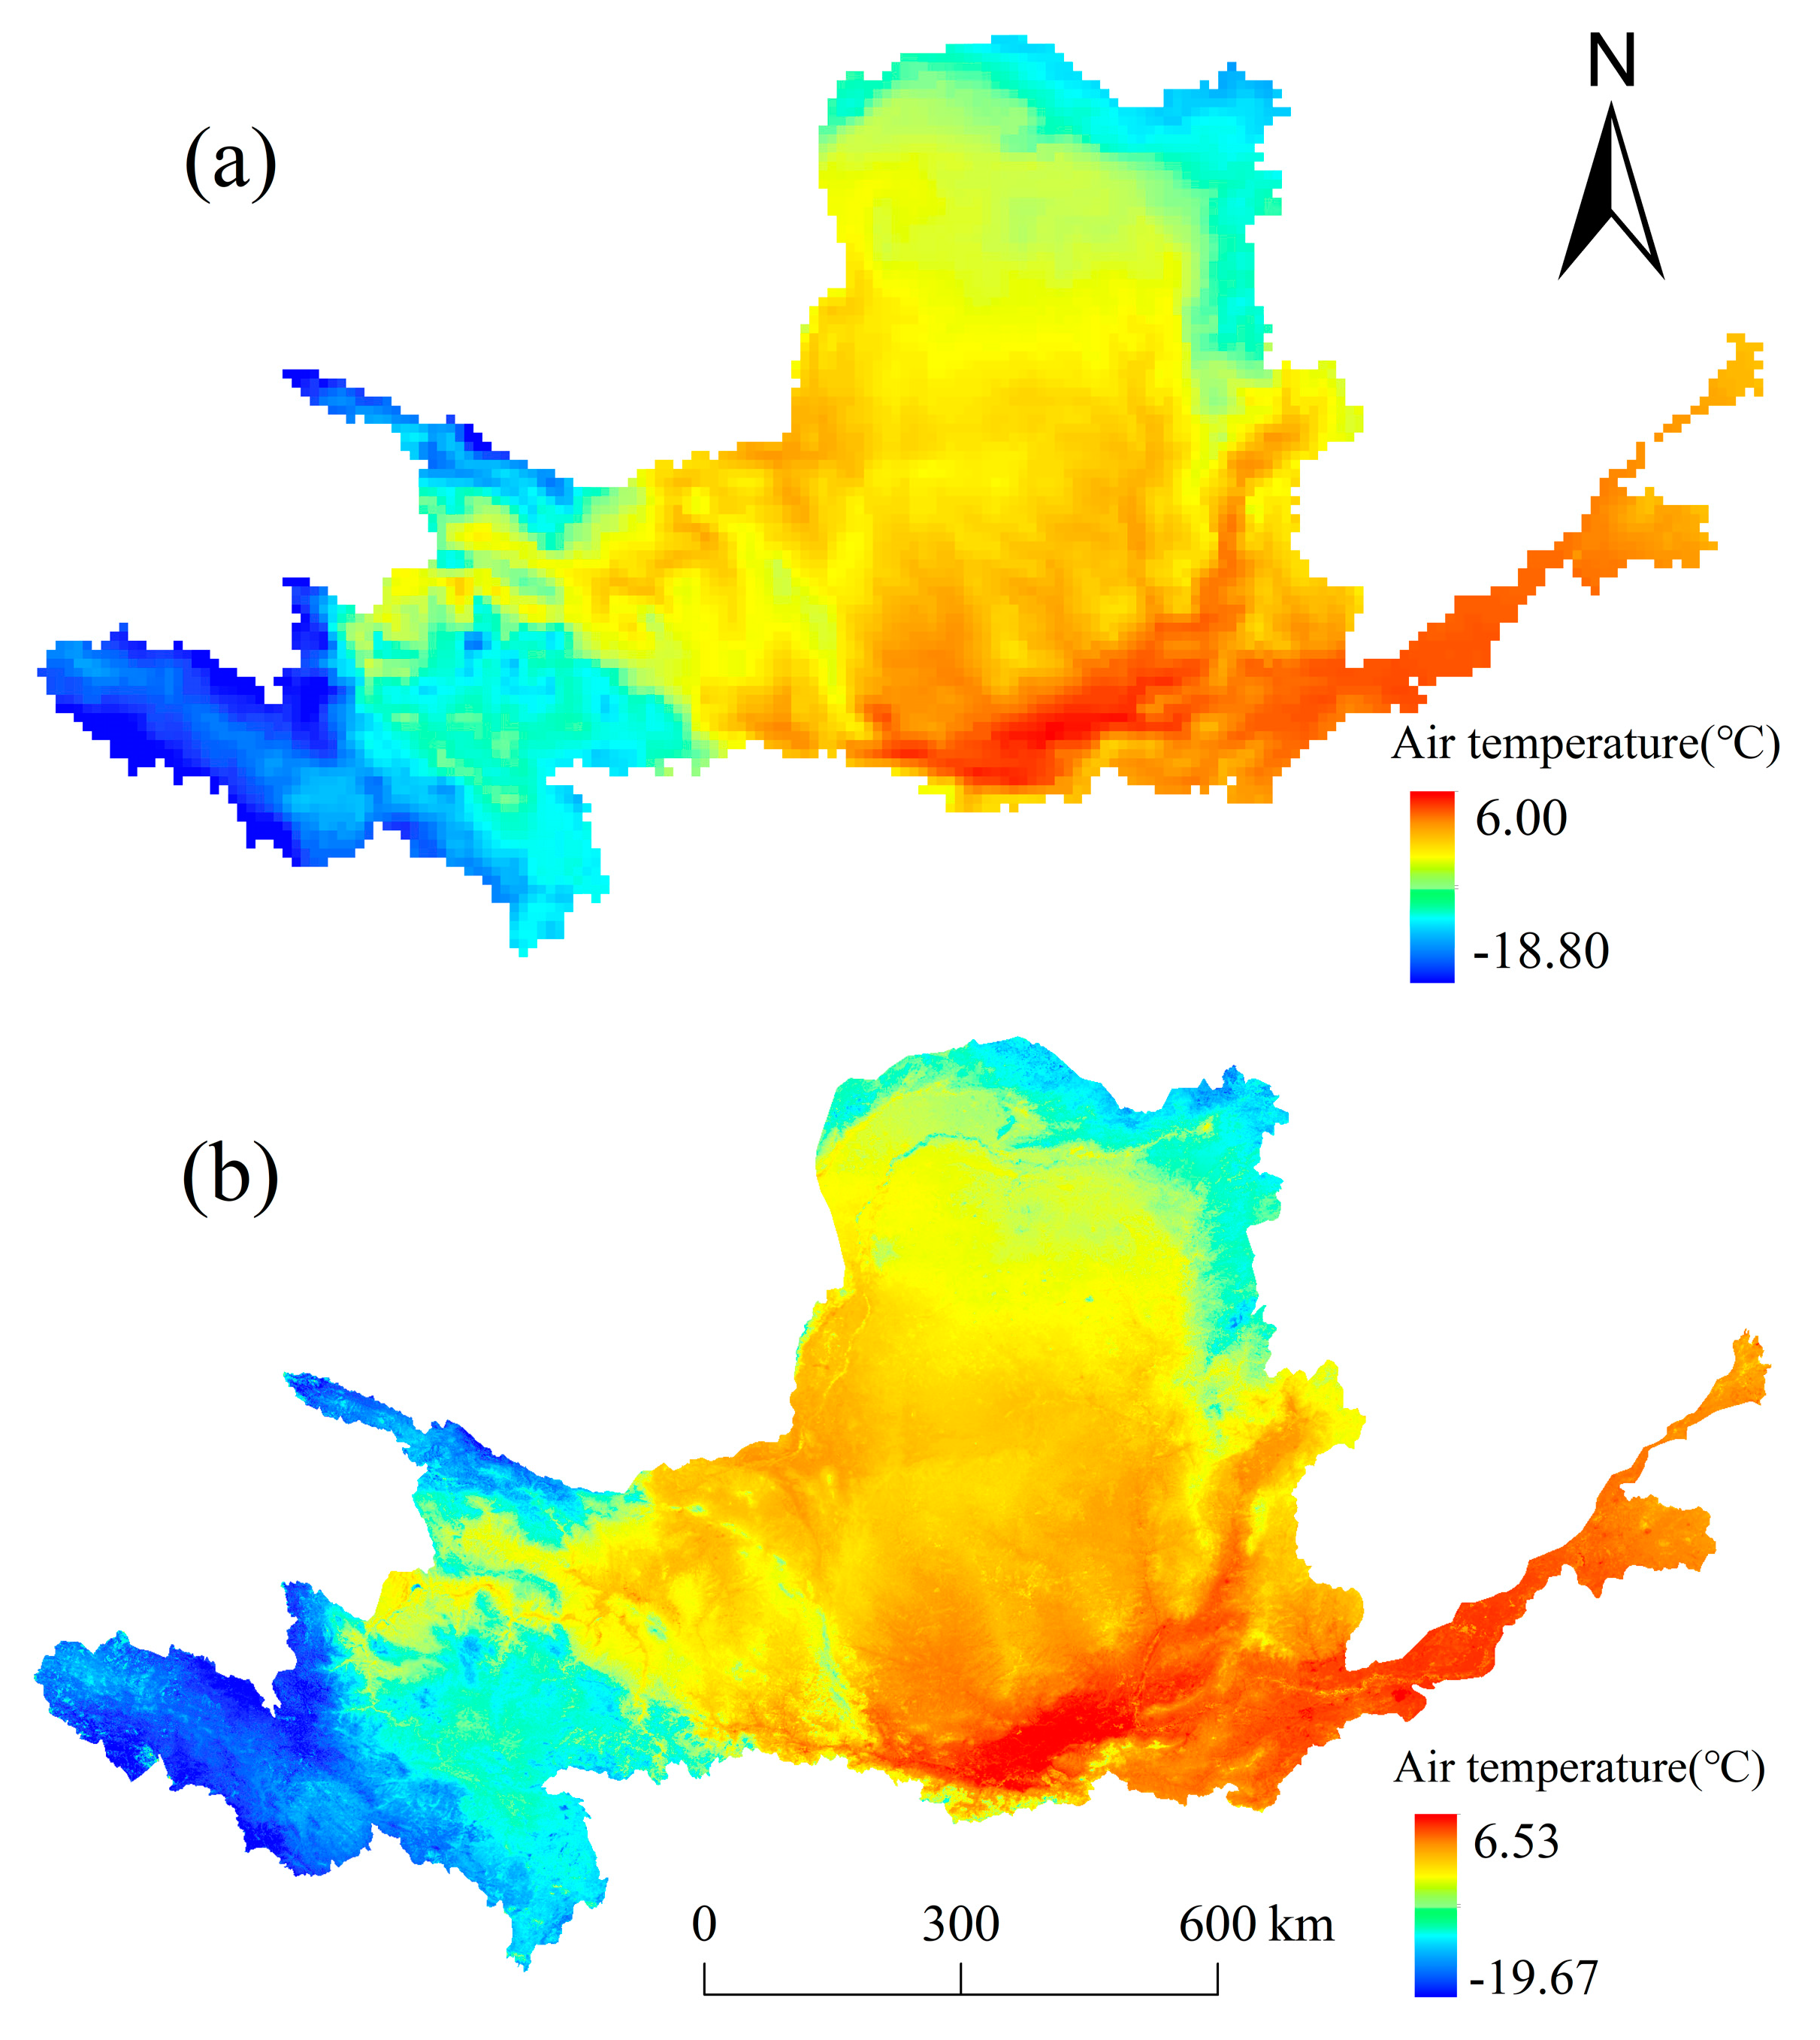
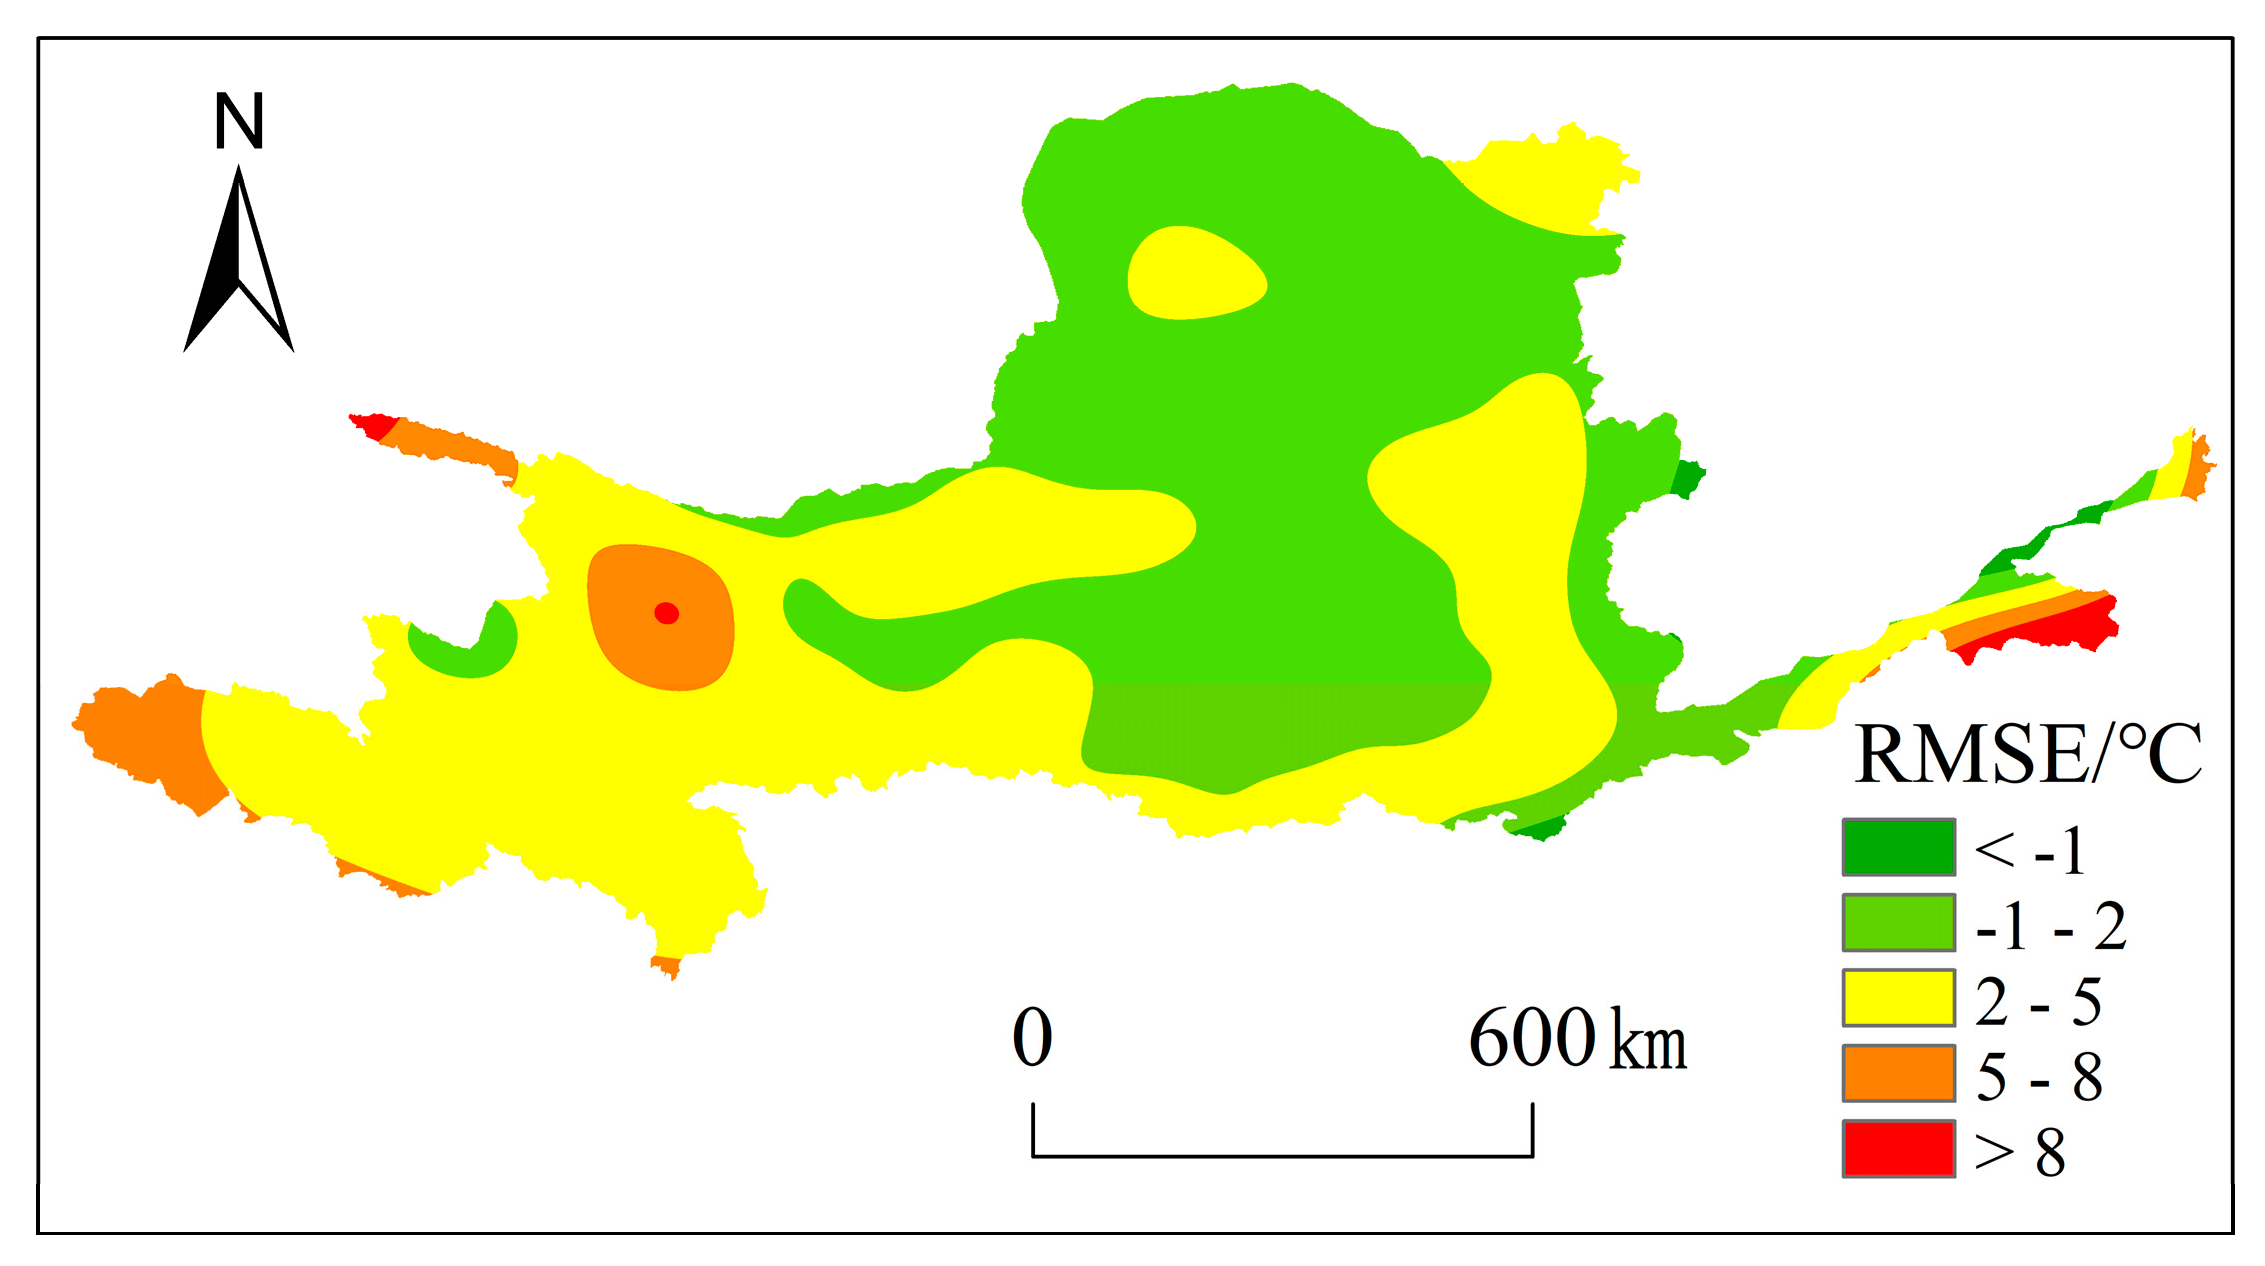
3.4. Analysis of Stacking Ensemble Model Downscaling Results

To assess the downscaling performance of the stacking ensemble method on reanalysis air temperature data, these data were downscaled from 0.1° to 1 km using the stacking ensemble model. The average absolute error (MAE) and root mean square error (RMSE) of the downscaled air temperature data were computed before and after downscaling, using observed air temperature data from meteorological stations within the Yellow River basin. The results, as shown in Table 4, indicate a notable reduction in MAE and RMSE after downscaling compared to the original reanalysis air temperature. This suggests that the use of the stacking ensemble model for downscaling air temperature data for the Yellow River basin not only enhances the spatial resolution of the data but also improves the accuracy to some extent. This improvement allows for a more comprehensive representation of the spatial patterns of air temperature distribution in the Yellow River basin.
In conclusion, utilizing the stacking ensemble model for spatial downscaling of reanalysis air temperature data holds significant meaning. This study employed stacking ensemble learning to downscale monthly mean air temperature data from reanalysis spanning the years 2003–2020. Visualizing the reanalysis air temperature data for February 2003 and the downscaled air temperature data using ArcGIS, as depicted in Figure 6, the stacking ensemble model successfully achieved downsizing effects on the original air temperature data, markedly enhancing the spatial details and textures of the air temperature data. The downscaled air temperature data maintain a good spatial distribution consistency with the reanalysis air temperature data. Specifically, the stacking ensemble learning algorithm can effectively extract more spatial texture information on air temperature, objectively reflecting the actual distribution of air temperatures and revealing spatial differences in air temperature within the same land type and between different land types. Furthermore, the downscaled air temperature data exhibit distinct spatial distribution characteristics in the southwest and northeast regions of the Yellow River Basin, with lower air temperatures in the southwest and higher air temperatures in the northeast. In areas with significant terrain variation, the spatial distribution texture of the downscaled air temperature data shows higher similarity to the terrain texture. At the same time, the downscaled air temperatures are slightly overestimated in low-altitude areas and slightly underestimated in high-altitude areas, demonstrating the characteristic of gradually decreasing air temperatures with increasing altitude.
To demonstrate the visual effects of the stacking ensemble downscaling model more clearly, this study selected two typical land types, mountains and urban areas, from the air temperature data in February 2003 for a detailed analysis of the downscaled air temperature data (refer to Figure 7). In the figure, (a) and (b), respectively, illustrate the air temperature detail texture maps for mountainous and urban land types. From Figure 7, it can be observed that, in both types of land areas, the stacking ensemble model significantly enhances the spatial resolution of reanalysis air temperature data. The model more finely depicts the spatial texture information within the mountainous and urban areas. Additionally, the spatial differences in air temperature after downsizing in mountainous and urban areas exhibit high consistency with the original images. This detailed analysis further validates the superiority of the stacking ensemble model in improving the expression of air temperature data details. The downscaled air temperature data not only better reflect the spatial differences between land types but also more accurately reveal the air temperature distribution characteristics in various regions. This provides researchers with a clearer and more accurate data foundation, facilitating a deeper understanding of air temperature patterns in mountainous and urban areas.
Using air temperature data from 89 meteorological stations in the Yellow River Basin as validation data, we calculated the root mean square error (RMSE) of the downscaling results from 2003 to 2020. Subsequently, we interpolated the spatial distribution of errors across the study area (Figure 8). By comparing the errors in the downscaling results and the correlation between ERA5 reanalysis temperatures and observed temperatures, we analyzed the potential reasons for the discrepancies (Figure 9). From Figure 8, it is observed that the spatial distribution characteristics of errors are not prominent and that there is no clear regularity in relation to the variations in topography. As indicated in Figure 9, there is a certain correlation between the correlation of reanalysis air temperature data and observed air temperatures and the errors in the downscaling results. The higher the correlation at a given station is, the more reliable the reanalysis data at that location, leading to smaller errors in the downscaling results. Based on this observation, the accuracy of ERA5-Land reanalysis data is identified as the primary influencing factor for the magnitude of errors in the downscaling results.
The inherent errors in remote sensing data, DEM data, and meteorological station data as well as errors introduced during the calculation of parameters, model construction, and downscaling processes collectively contribute to the resulting errors. Additionally, the air temperatures at meteorological stations and downscaled air temperatures represent different spatial scales, with the former reflecting air temperatures at specific locations and the latter representing air temperatures in 1 km resolution grid cells. This disparity in spatial scales becomes one of the sources of error.

4. Discussion

Climate warming is altering terrestrial hydrology and ecosystems; thus, obtaining high-resolution gridded air temperature data is crucial for studying agriculture, ecological environments, and the social and economic sustainable development of provinces within the Yellow River Basin. The purpose of this study is to assess the effectiveness of a stacking ensemble model based on remote sensing data for downscaling reanalysis air temperature data. The experimental results of downscaling reanalysis air temperature data in the Yellow River Basin region demonstrate the effectiveness of this approach.

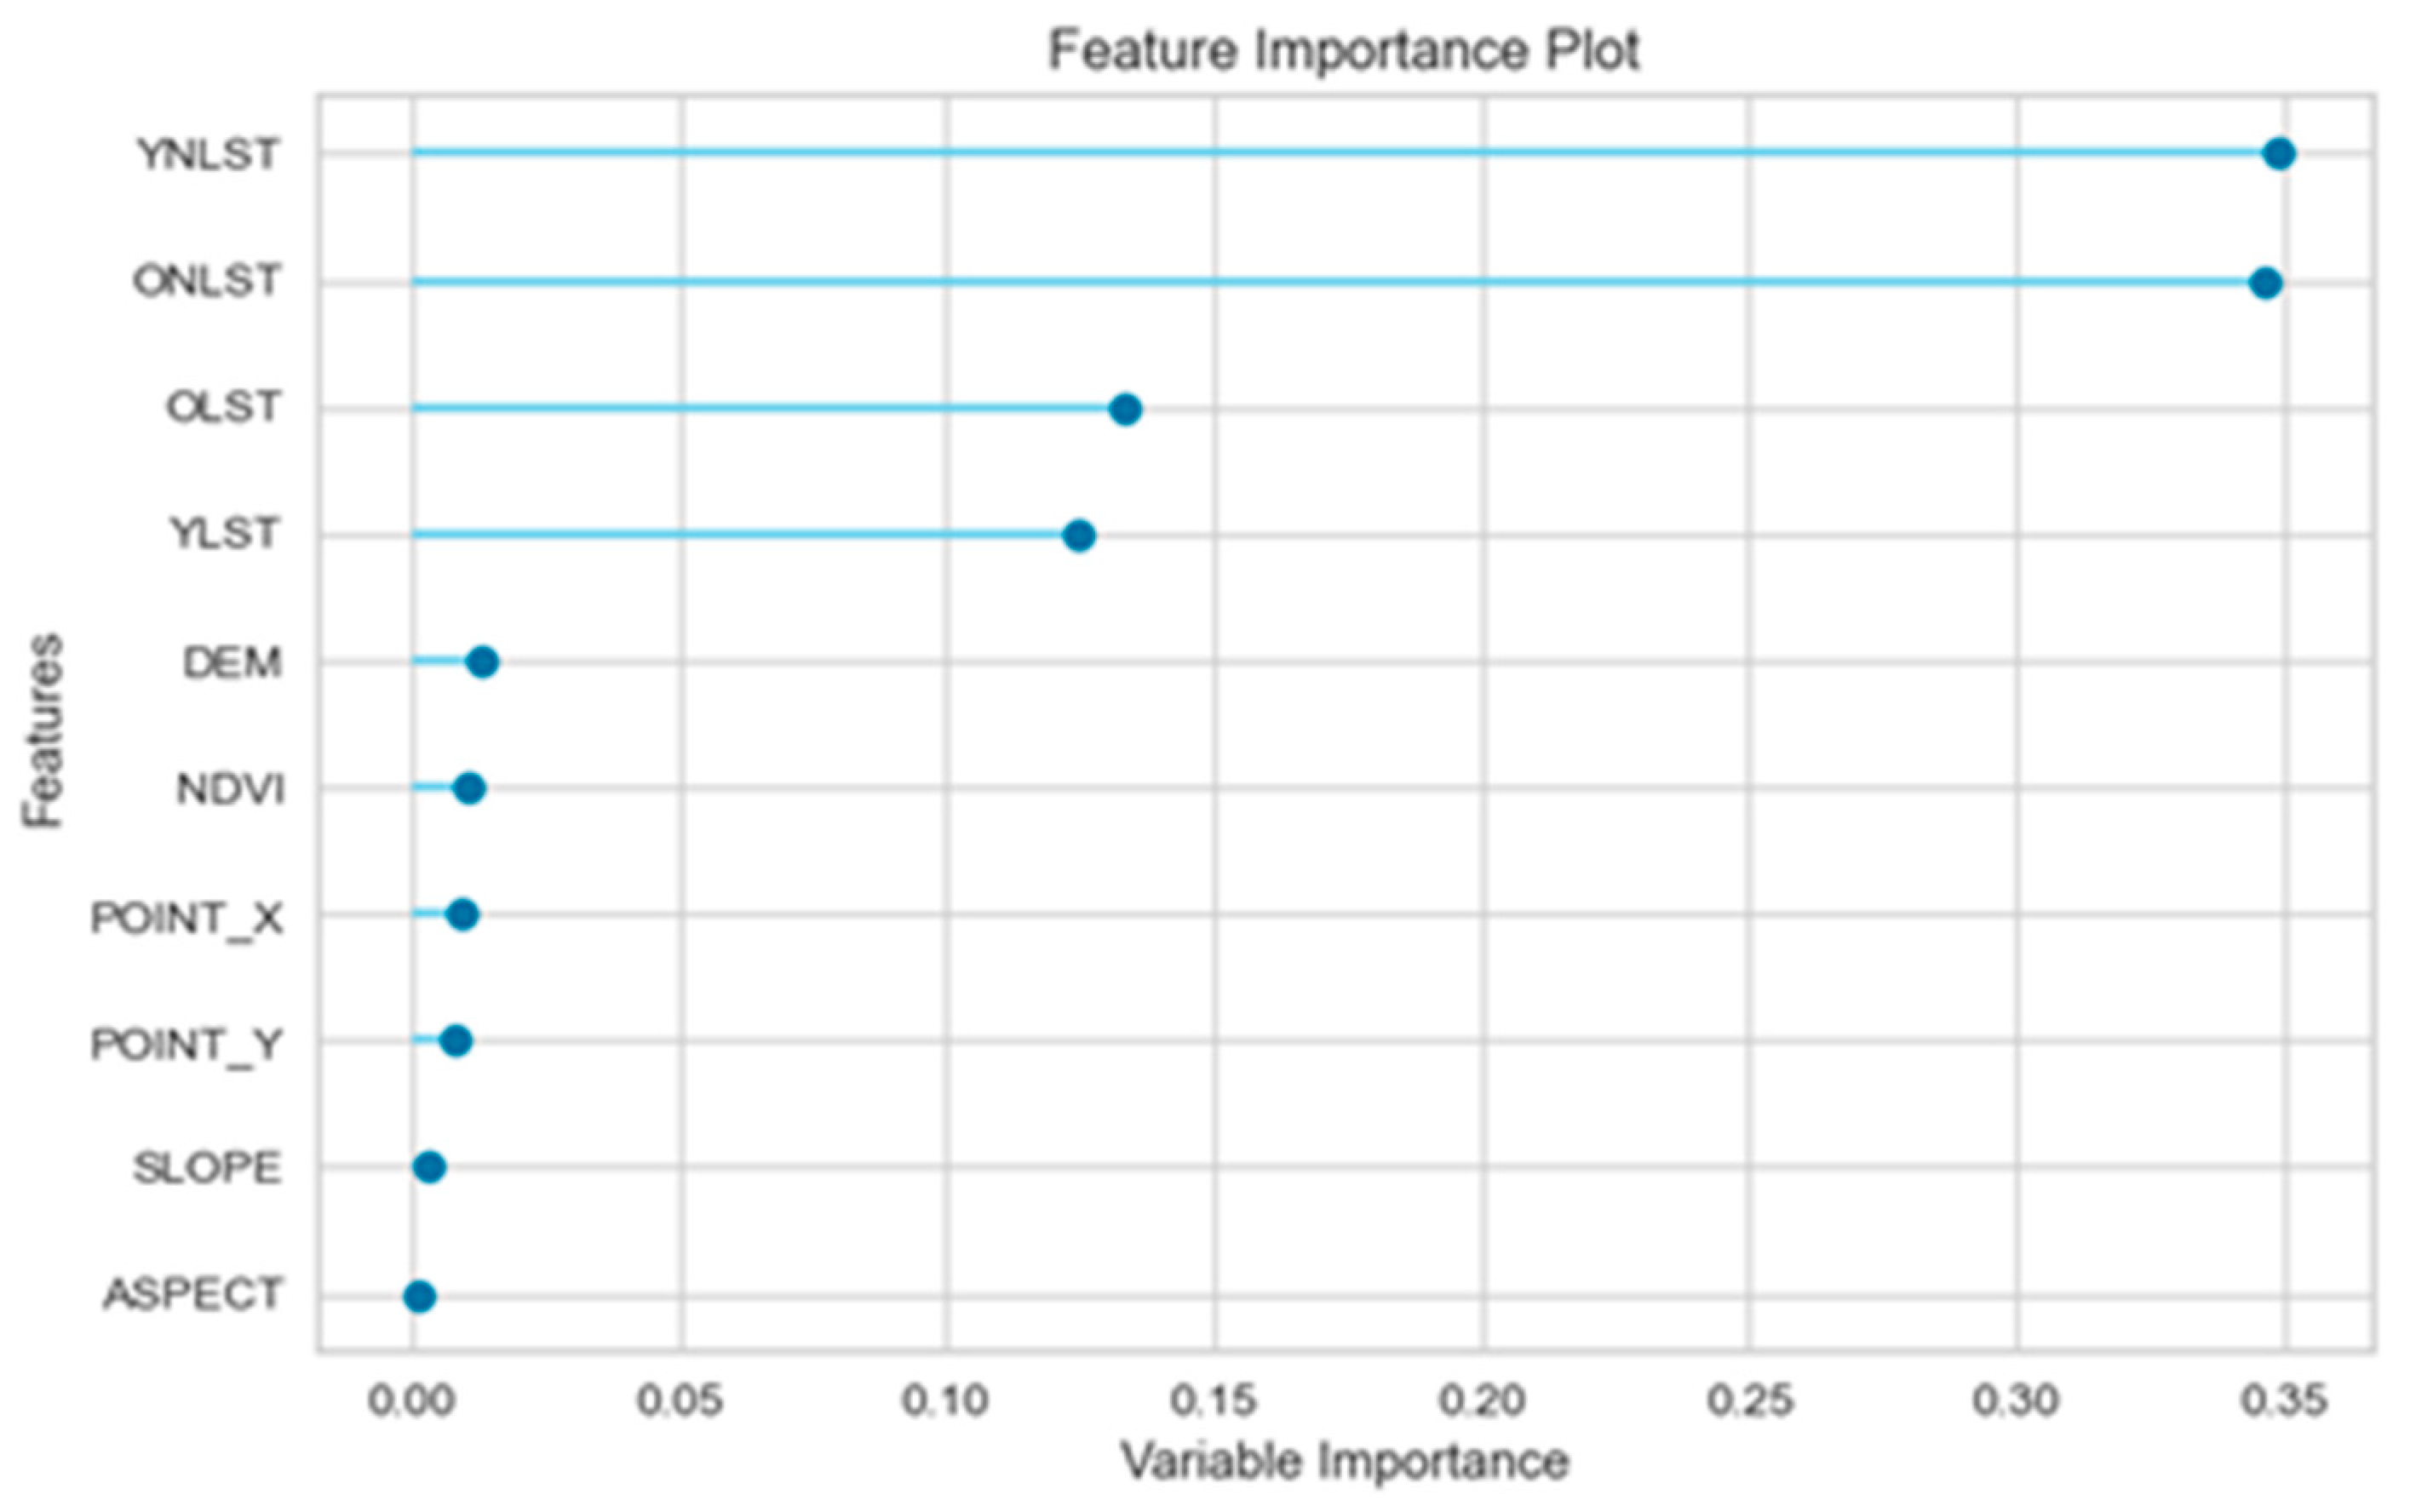
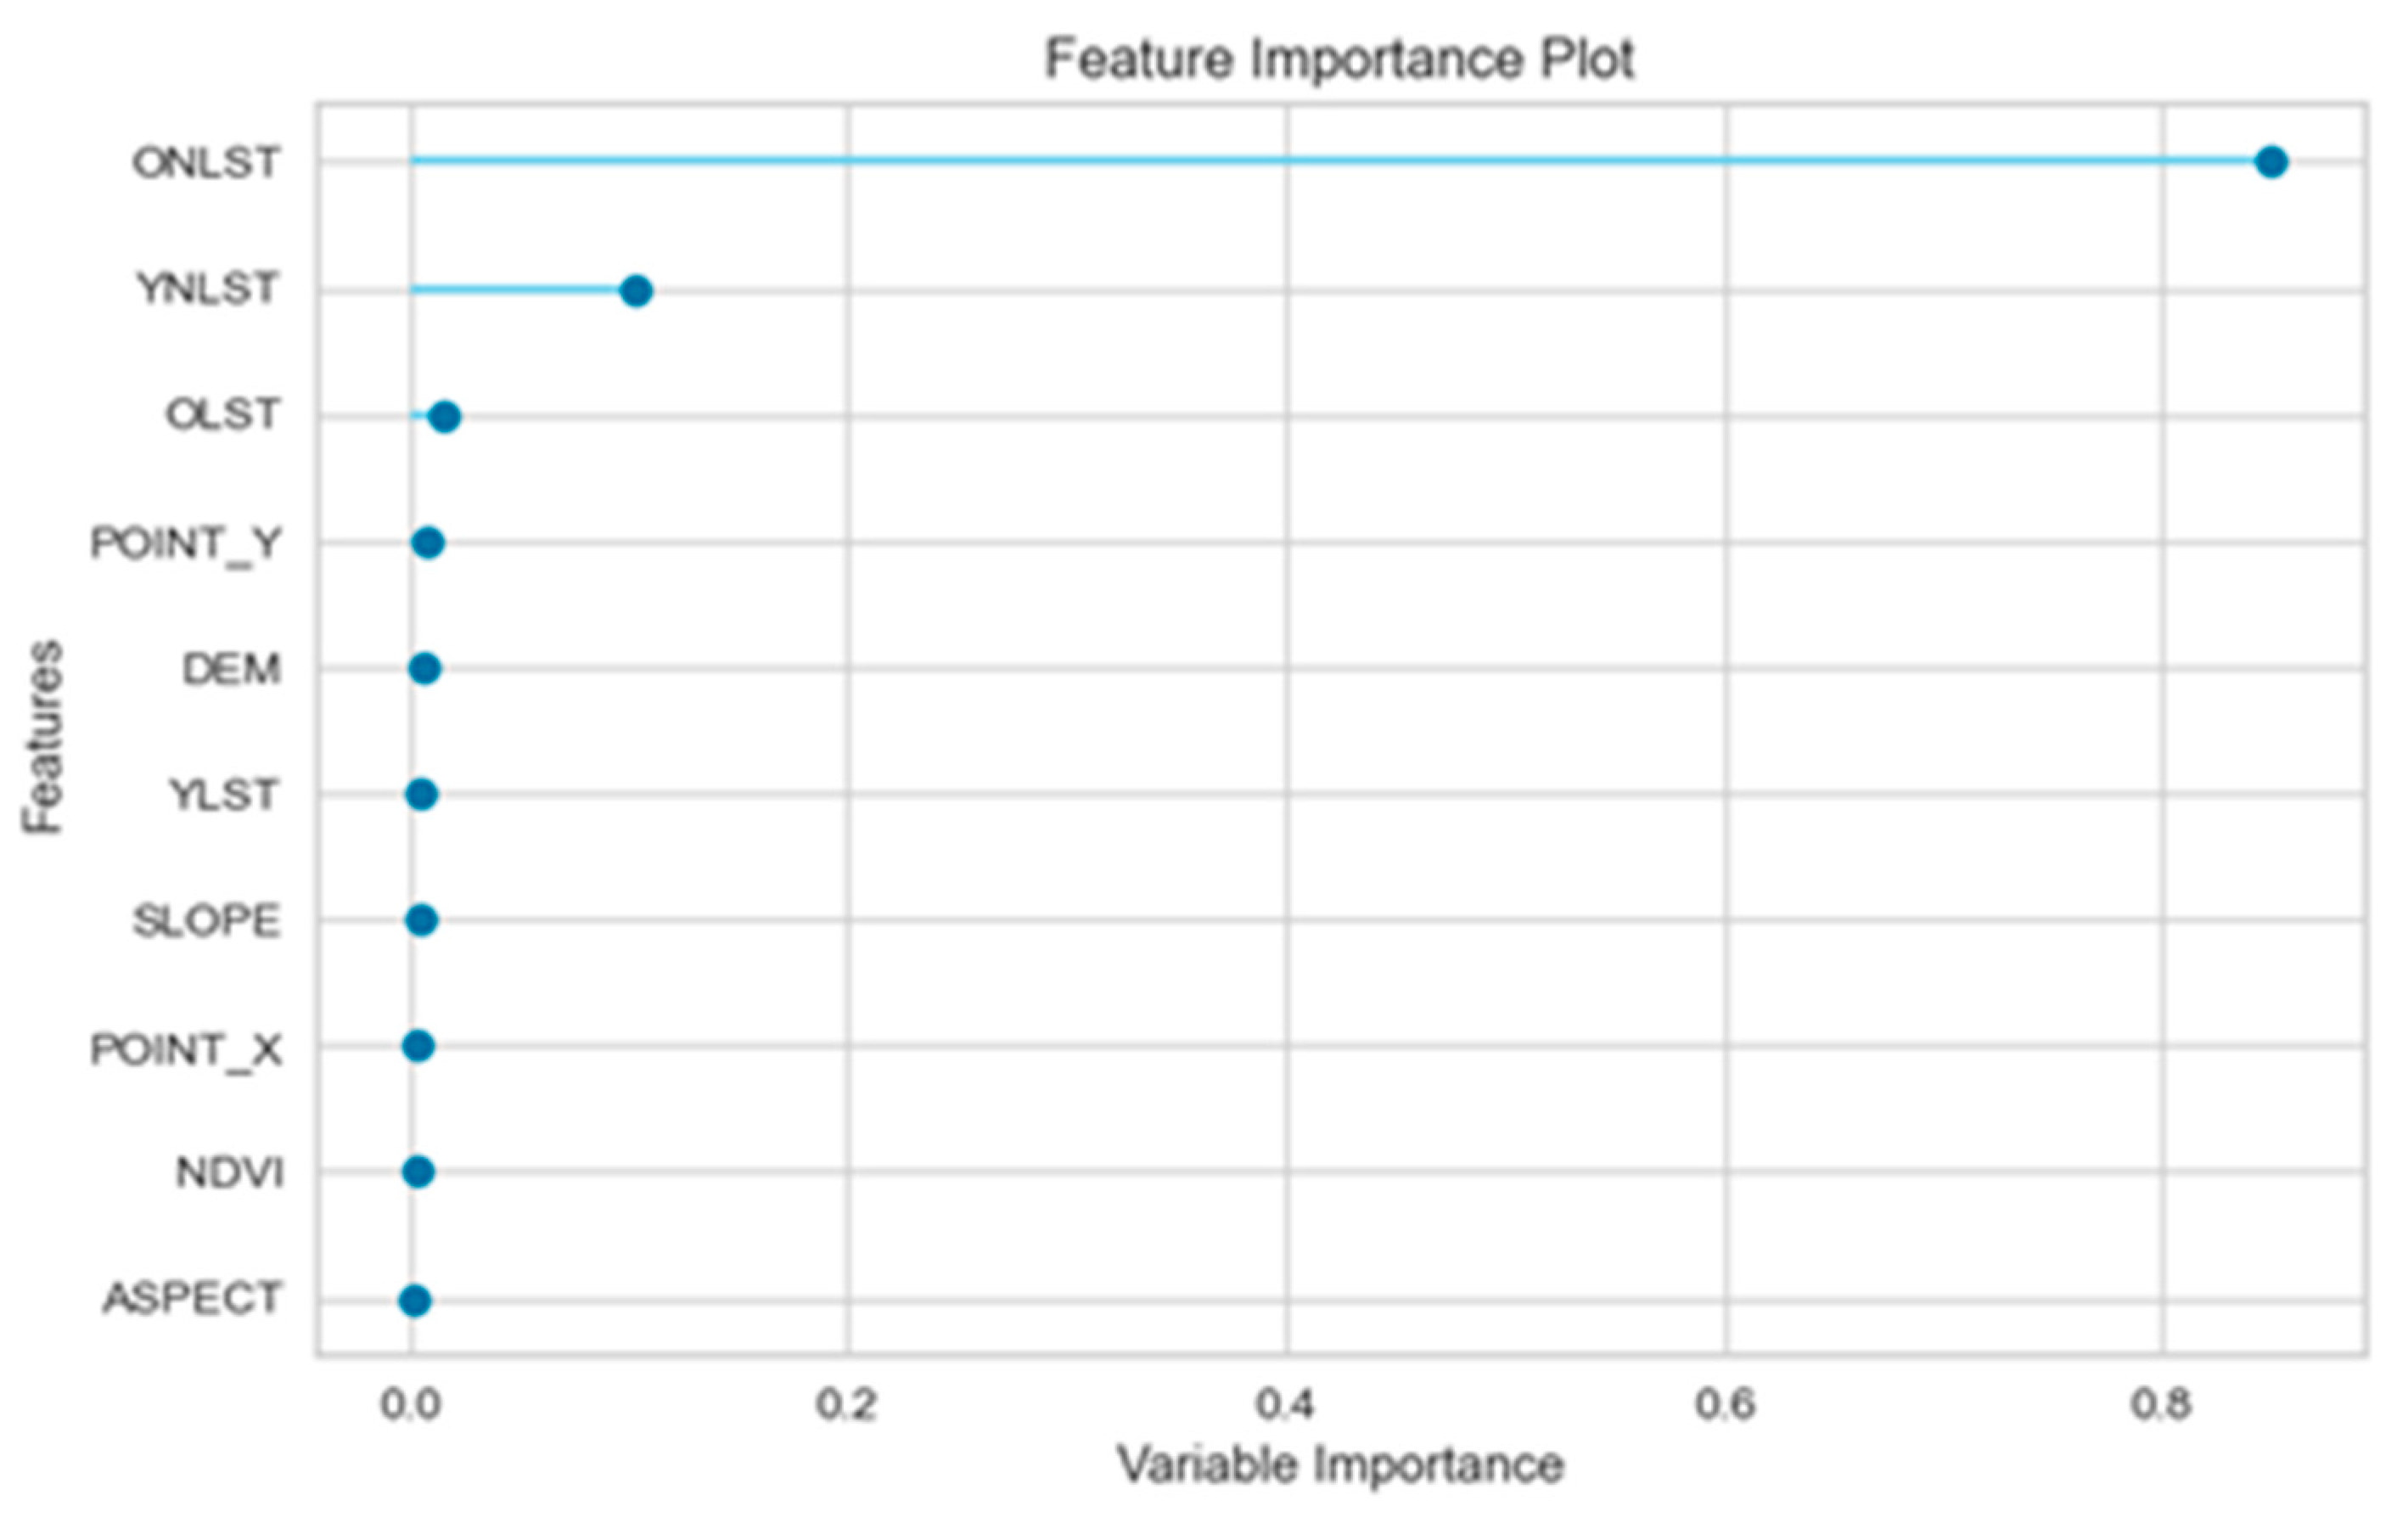
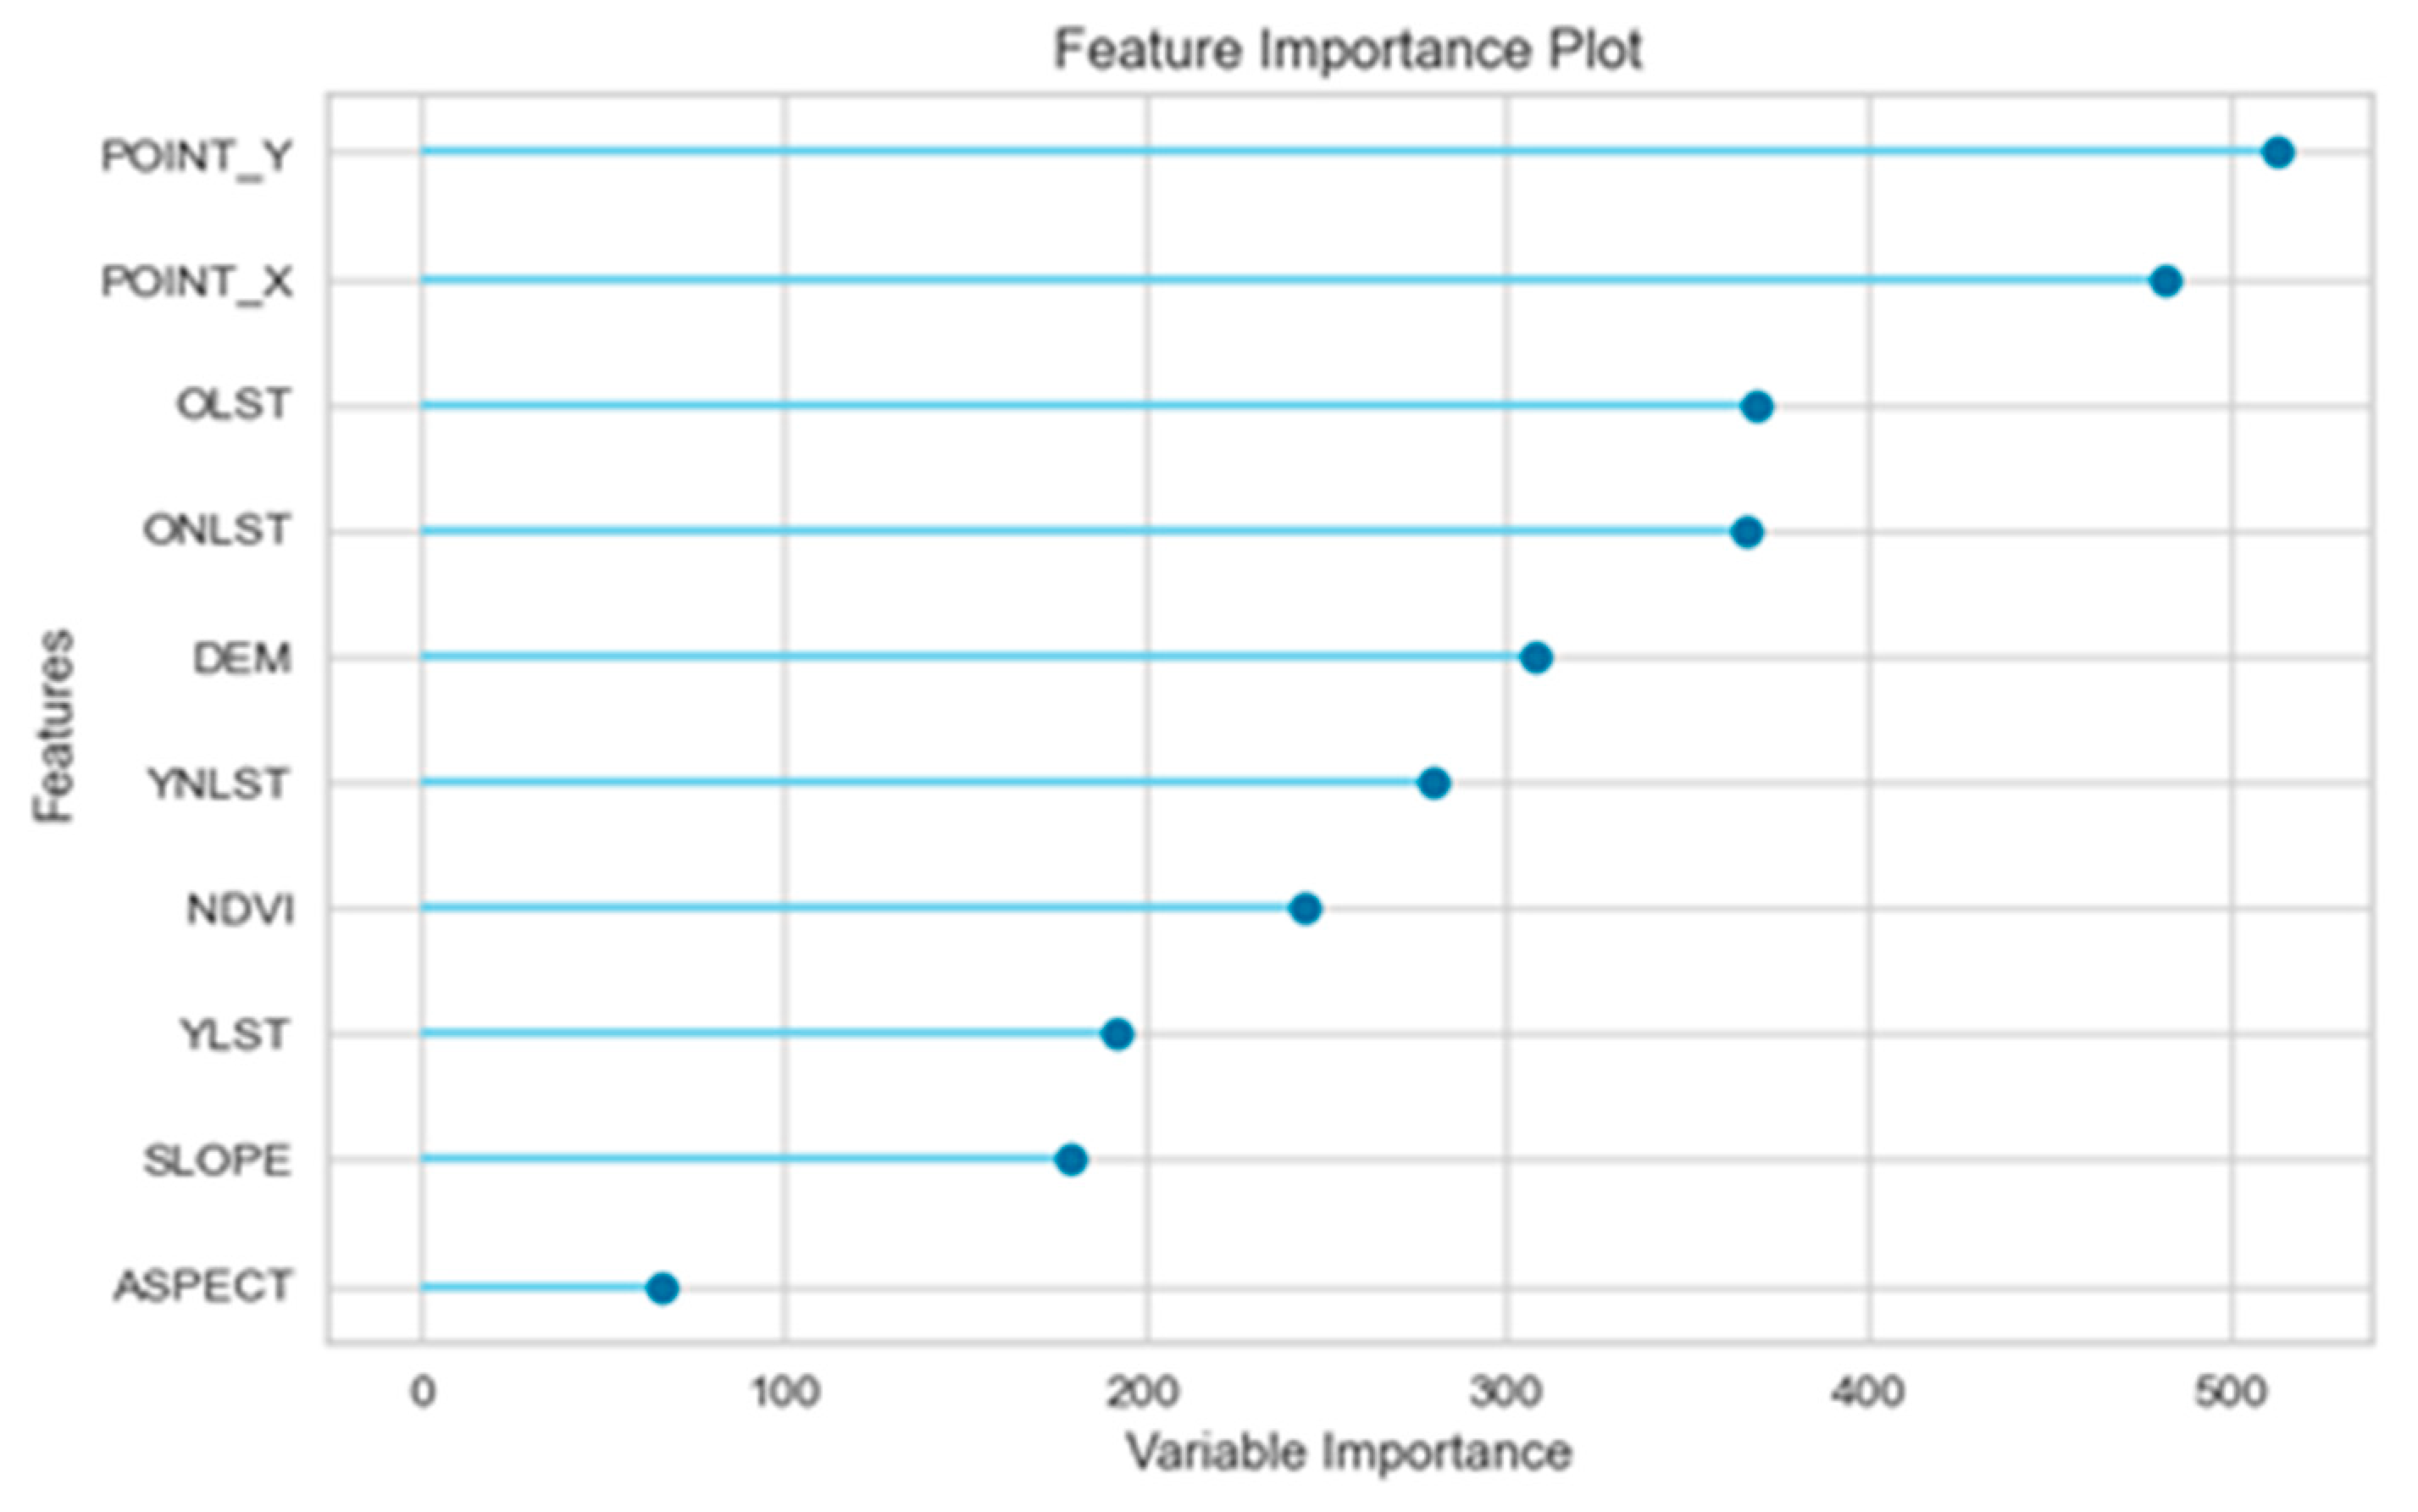
4.1. Variable Importance

By ranking the importance of variables involved in model training, significant variables influencing the downscaling results can be identified. The importance of variables to some extent reflects their impact on the dependent variable. Since the performance of stacking ensemble models depends on the selection of base learners and variable selection is crucial to the performance of these base learner models, we conducted separate analyses on the variable importance of ET (Extra Trees), XGBoost, and LightGBM models. The variable importance of the ET model is shown in Figure 10, indicating that nighttime land surface temperature (YNLST, ONLST) and daytime land surface temperature (YLST, NLST) are crucial in the modeling process and significantly impact the air temperature. Previous studies have found a strong positive correlation between land surface temperature and air temperature, where areas with higher land surface temperatures also tend to have higher air temperatures [41,42]. Additionally, variables such as NDVI, elevation, aspect, slope, latitude, and longitude have a relatively smaller impact on air temperature. The variable importance of the XGBoost model (Figure 11) is similar to that of the ET model. The variable importance of the LightGBM model is shown in Figure 12, where latitude and longitude have a significant impact on air temperature. As latitude increases, there is a decreasing trend in air temperature. DEM is also important for the establishment of the LightGBM model, consistent with the principles of environmental lapse rate, where air temperature decreases with increasing elevation [43,44]. NDVI is also relatively important in the construction of the LightGBM model, and previous research has shown a certain negative correlation between NDVI and air temperature [45]. Overall, different variables in each model demonstrate a certain level of importance.

4.2. The Limitation of This Study

Although ERA5-Land data provide high-resolution meteorological variables globally, they may still fail to capture some local features at a finer scale. The downscaling process might not effectively compensate for the information gaps at the local scale, thereby affecting the model’s performance. The stacking ensemble model, while demonstrating overall good performance, is complex and comes with a high computational cost. This complexity may limit the feasibility of the model to some extent and reduce its interpretability.
In the validation of the downscaling results, current remote sensing data cannot provide accurate air temperature data for precise validation of the downscaled results. Therefore, we rely on observed air temperature data from meteorological stations for accuracy validation. However, the meteorological stations in the Yellow River Basin are limited and unevenly distributed. While densely distributed meteorological stations in plains areas can provide some validation data, mountainous regions with high elevations lack meteorological stations, making it challenging to validate the accuracy of downscaled results in these areas. Furthermore, during the establishment of the downscaling model using reanalysis air temperature data, this study only considered macro-geographical conditions and local topographical factors. The influence of variables such as wind direction and wind speed on the downscaled air temperature results was not taken into account. These factors will be considered in future research efforts.

5. Conclusions

In this study, an air temperature downscaling method is proposed to obtain high-resolution temperature data. The Yellow River Basin is chosen as the study area. Based on maintaining the regression relationships between dependent and independent variables invariant at different scales, ET, XGBoost, and LightGBM models are established and integrated using stacking ensemble learning. The accuracy of the models is evaluated through 10-fold cross-validation. Subsequently, ERA5-Land reanalysis temperature data are downscaled to obtain high-resolution monthly average temperature data from 2003 to 2020. Finally, the downscaled results are assessed using measured temperature data from meteorological stations.
Research findings indicate that: (1) The stacking downscaling method for ERA5-Land reanalysis air temperature data, based on LST, DEM, NDVI, slope, aspect, latitude, and longitude, successfully reduces the air temperature spatial resolution of the Yellow River Basin data from 0.1° to 1 km. The analysis of model accuracy shows that the stacking ensemble model, after 10-fold cross-validation, outperforms the ET, XGBoost, and LightGBM models, effectively reducing the uncertainty of individual machine learning models. (2) The downscaled air temperatures exhibit richer spatial details and texture information, reflecting the actual distribution of air temperatures in the Yellow River Basin. In regions with significant topographic variations, the spatial distribution of downscaled air temperatures shows high similarity to the terrain texture. (3) Comparison between the measured air temperatures and the downscaled air temperatures reveals improved accuracy of the downscaled air temperatures compared to the original air temperatures.
In summary, the proposed stacking ensemble model and selected independent variables can effectively downscale low-resolution air temperature data for the Yellow River Basin from 2003 to 2020, particularly in highly heterogeneous regions. This study provides a feasible method for improving the spatial resolution of air temperature data. It holds significant practical implications for understanding air temperature distribution and related changes in the Yellow River Basin. Furthermore, the research findings serve as important reference points for exploring climate change, sustainable agriculture development, vegetation, and the social and economic sustainability of provinces within the basin.

Author Contributions

Data curation, Y.Z.; Software, Y.Z.; Writing original draft, Y.Z.; Conceptualization, J.L.; Methodology, J.L.; Supervision, D.L. All authors have read and agreed to the published version of the manuscript.

Funding

This study was funded by the National Natural Science Foundation of China project with grant number 42161058.

Data Availability Statement

The new data created in this study are available on request.

Conflicts of Interest

The authors declare no conflicts of interest.

References

  1. Suggitt, A.; Wilson, R.; Isaac, N.; Beale, C.; Auffret, A.; August, T.; Bennie, J.; Crick, H.; Duffield, S.; Fox, R.; et al. Extinction risk from climate change is r-educed by microclimatic buffering. Nat. Clim. Chang. 2018, 8, 713–717. [Google Scholar] [CrossRef]
  2. Nieto, H.; Sandholt, I.; Aguado, I.; Chuvieco, E.; Stisen, S. Air temperature estimation with MSG-SEVIRI data: Calibration and validation of the TVX algorithm for the Iberian Peninsula. Remote Sens. Environ. 2011, 115, 107–116. [Google Scholar] [CrossRef]
  3. Chen, S.; Chen, W.; Wu, R.; Yu, B.; Song, L. Performance of the IPCC AR6 models in simulating the relation of the western North Pacific subtropical high to the spring northern tropical Atlantic SST. Int. J. Climatol. 2020, 41, 725. [Google Scholar] [CrossRef]
  4. Howarth, C.; Viner, D. Integrating adaptation practice in assessments of climate change science: The case of IPCC Working Group II reports. Environ. Sci. Policy 2022, 135, 1–5. [Google Scholar] [CrossRef]
  5. Ma, S.; Zhang, S.; Wang, N.; Huang, C.; Wang, X. Prolonged duration and increased severity of agricultural droughts during 1978 to 2016 detected by ESA CCI SM in the humid Yunnan Province, Southwest China. Catena 2021, 198, 105036. [Google Scholar] [CrossRef]
  6. Liu, Y.; Chen, Q.; Ge, Q.; Dai, J.; Qin, Y.; Dai, L.; Zou, X.; Chen, J. Modelling the impacts of climate change and crop management on phenological trends of spring and winter wheat in China. Agric. For. Meteorol. 2018, 248, 518–526. [Google Scholar] [CrossRef]
  7. Gerlitz, L. Using fuzzified regression trees for statistical downscaling and regionalization of near surface tempera tures in complex terrain: A case study from Khumbu Hi mal. Theor. Appl. Climatol. 2015, 122, 337–352. [Google Scholar] [CrossRef]
  8. Vittorio, A.; Miller, N. Evaluating a modified point-based method to downscale cell-based climate variable data to high-resolution grids. Theor. Appl. Climatol. 2013, 112, 495–519. [Google Scholar] [CrossRef]
  9. Wang, Y.; Tan, D.; Han, L.; Li, D.; Wang, X.; Lu, G.; Lin, J. A Review of Climate Change Research in the Yellow River Basin. J. Desert Res. 2021, 41, 235–246. [Google Scholar]
  10. Zhang, L.; Huang, J.; Liang, J.; Yu, H.; Guan, X.; Ma, J.; Shen, Y.; Deng, J.; Huang, N.; Meng, X.; et al. Impacts of Climate Change on the Yellow River Basin and Countermeasures. Sci. Technol. Rev. 2020, 38, 42–51. [Google Scholar]
  11. Dirksen, M.; Knap, W.; Steeneveld, G.; Holtslag, A.; Tank, A. Downscaling daily air temperature measurements in the Nether lands. Theor. Appl. Climatol. 2020, 142, 751–767. [Google Scholar] [CrossRef]
  12. Tang, G.; Ali, B.; Ma, Z.; Di, L.; Hong, L. Downscaling of ERA-interim temperature in the contiguous United States and its implications for rain–snow partitioning. J. Hydrometeorol. 2018, 19, 1215–1233. [Google Scholar] [CrossRef]
  13. Wang, S.; Xu, T.; Nie, W.; Zhen, Z. Evaluation of Precipitable Water Vapor from Five Reanalysis Products with Ground-Based GNSS Observations. Remote Sens. 2020, 12, 1817. [Google Scholar] [CrossRef]
  14. Guo, Y.; Zhang, S.; Yan, J.; Chen, Z.; Ruan, X. A comparison of atmospheric temperature over China between adiosonde observations and multiple reanalysis datasets. Acta Meteorol. Sin. 2016, 74, 71–284. [Google Scholar]
  15. Wang, T.; Wu, T.; Li, R.; Xie, C.; Zou, D.; Qin, Y.; Yu, W.; Wang, W. Evaluation of Monthly Air Temperature from Two Reanalysis Datasets in Mongolia. Plateau Meoteorology 2016, 35, 651–661. [Google Scholar]
  16. Kumar, A.; Yadav, J.; Mohan, R. Seasonal sea-ice variability and its trend in the Weddell Sea sector of West Antarctica. Environ. Res. Lett. 2021, 16, 24–46. [Google Scholar] [CrossRef]
  17. Ding, M.; Du, J.; Xiao, T. Applicability of the four reanalysis temperature data in Chang Tang Nature Reserve. J. Glaciol. Geocryol. 2020, 42, 1046–1056. [Google Scholar]
  18. Zhang, L.; Yu, Y.; Su, L.; Hao, T.; Zheng, H. Effects of Land Use Change on Air Temperature of Heilongjiang Province in 1960–2010. Sci. Geogr. Sin. 2017, 37, 952–959. [Google Scholar]
  19. Hersbach, H.; Bell, B.; Berrisford, P.; Hirahara, S.; Thepaut, J. The ERA5 global reanalysis. Q. J. R. Meteorol. Soc. 2020, 146, 1999–2049. [Google Scholar] [CrossRef]
  20. Miao, W.; Liu, S.; Zhu, Y.; Duan, S.; Han, F. Spatio-temporal differentiation and altitude dependence of temperature and precipitation in Meili Snow Mountains. Clim. Chang. Res. 2022, 18, 328–342. [Google Scholar]
  21. Zou, J.; Lu, N.; Jiang, H.; Qin, J.; Yao, L.; Xin, Y.; Su, F. Performance of air temperature from ERA5-Land reanalysis in coastal urban agglomeration of Southeast China. Sci. Total Environ. 2022, 828, 154459. [Google Scholar] [CrossRef]
  22. Tang, H.; Wang, X.; Chen, F.; Jiang, L.; He, C.; Long, A. Simulation of Manas River runoff based on ERA5-Land dataset. Earth Sci. Front. 2022, 29, 271–283. [Google Scholar]
  23. Zhang, H.; Gao, Y. Projected Changes of Precipitation over the Qinghai-Tibetan Plateau Based on Dynamical Downscaling. Plateau Meteorol. 2020, 39, 477–485. [Google Scholar]
  24. Xu, Z.; Han, Y.; Yang, Z. Dynamical downscaling of regional climate: A review of methods and limitations. Sci. China Earth Sci. 2019, 62, 365–375. [Google Scholar] [CrossRef]
  25. Shu, J.; Jiang, X.; Huang, X.; Wu, Q. Statistical Downscaling Modeling Analysis of Summer Precipitation in Southwest China. Plateau Meteorol. 2019, 38, 349–358. [Google Scholar]
  26. Kustas, W.; Norman, J.; Anderson, M.; French, A. Estimating subpixel surface temperatures and energy fluxes from the vegetation index-radiometric temperature relationship. Remote Sens. Environ. 2003, 85, 429–440. [Google Scholar] [CrossRef]
  27. Zhu, X.; Song, X.; Leng, P.; Hu, R. Research on Downscaling of Land Surface Temperature using Multi-Scale Geographic Weighted Regression. J. Remote Sens. 2021, 25, 1749–1766. [Google Scholar]
  28. Gong, Y.; Ma, S.; Liu, W. A comparative study of machine learning and statistical models in climate downscaling in the Shiyang River Basin. J. Desert Res. 2022, 42, 196–210. [Google Scholar]
  29. Jing, W.; Feng, M.; Yang, Y. A Statistical Downscaling Approach of NCEP/NCAR Reanalysis Temperature Data. J. Geo-Inf. Sci. 2013, 15, 819–828. [Google Scholar] [CrossRef]
  30. Li, X.; Yuan, Z.; Deng, W.; Yang, L.; Zhou, X.; Hu, L. Spatial downscaling methods for the 2-meter air temperature grid data based on multiple machine learning models. Remote Sens. Nat. Resour. 2023, 35, 57–65. [Google Scholar]
  31. Wang, R.; Gao, W.; Peng, W. Spatial downscaling method for air temperature through the correlation between land use/land cover and microclimate: A case study of the Greater Tokyo Area, Japan. Urban Clim. 2021, 40, 101003. [Google Scholar] [CrossRef]
  32. Yu, F.; Zhu, S.; Zhang, G.; Zhu, J.; Zhang, N.; Xu, Y. A Downscaling Method for Land Surface Air Temperature of ERA5 Reanalysis Dataset under Complex Terrain Conditions in Mountainous Areas. J. Geo-Inf. Sci. 2022, 24, 750–765. [Google Scholar]
  33. Wolpert, D. Stacked generalization. Neural Netw. 1992, 5, 241–259. [Google Scholar] [CrossRef]
  34. Sikora, R.; Al-Laymoun, O. A Modified Stacking Ensemble Machine Learning Algorithm Using Genetic Algorithms; Springer: New Delhi, India, 2017. [Google Scholar]
  35. Wang, R.; Bao, T.; Li, Y.; Song, B.; Xiang, Z. Combination Prediction Model for Dam Deformation Based on Multi-Factor Fusion and Stacking Ensemble Learning. J. Hydraul. Eng. 2023, 54, 497–506. [Google Scholar]
  36. Gall, J.; Yao, A.; Razavi, N.; Van Gool, L.; Lempitsky, V. Hough Forests for Object Detection, Tracking, and Action Recognition. IEEE Trans. Pattern Anal. Mach. Intell. 2011, 33, 2188–2202. [Google Scholar] [CrossRef]
  37. Liu, X.; Huang, W.; Jiang, Y.; Guo, R.; Huang, Y.; Song, Q.; Yang, Y. Research on Classification and Recognition of Severe Convective Weather Based on the LightGBM Algorithm. Plateau Meteorol. 2021, 40, 909–918. [Google Scholar]
  38. Xue, D. Reconstruction of All-Weather Daytime and Nighttime MODIS Aqua-Terra Land Surface Temperature Products Using an XGBoost Approach. Remote Sens. 2021, 13, 4723. [Google Scholar]
  39. Brochu, E.; Cora, V.; Freitas, N. A Tutorial on Bayesian Optimization of Expensive Cost Functions, with Application to Active User Modeling and Hierarchical Reinforcement Learning. Comput. Sci. 2010. [Google Scholar] [CrossRef]
  40. Wu, Y. Assessment of machine learning classifiers for global lake ice cover mapping from MODIS TOA reflectance data. Remote Sens. Environ. 2021, 253, 112206. [Google Scholar] [CrossRef]
  41. Davis, P. Estimation of shelter temperature from operational satellite sounder data. Clim. Appl. Meteorol. 1983, 22, 369–376. [Google Scholar] [CrossRef]
  42. Vogt, J.; Viau, A.; France, P. Mapping regional air temperature fields using satellite-derived surface skin temperatures. Int. J. Climatol. 1997, 17, 1559–1579. [Google Scholar] [CrossRef]
  43. Jing, J.; Liu, J.; Qin, C.; Mioa, Y.; Zhu, A. Near-surface air temperature lapse rates and seasonal and type differences in China. Prog. Geogr. 2016, 35, 1538–1548. [Google Scholar]
  44. Lookingbill, T.; Urban, D. Spatial estimation of air temperature differences for landscape-scale studies in montane environments. Agric. For. Meteorol. 2003, 114, 141–151. [Google Scholar] [CrossRef]
  45. Huang, H.; Xu, H.; Lin, T.; Xia, G. Spatiotemporal Variation Characteristics of Normalized Vegetation Index in Altay Region of Xinjiang from 2001 to 2020 and Its Response to Climate Change. Acta Ecol. Sin. 2022, 42, 2798–2809. [Google Scholar]
Figure 1. Study area and distribution of meteorological stations.
Sustainability 16 01934 g001
Figure 2. Comparison of Aqua satellite LST data before and after filling in missing values for January 2003; (a) is before filling in the gaps, and (b) is after filling in the gaps.
Sustainability 16 01934 g002
Figure 3. Stacking model architecture diagram.
Sustainability 16 01934 g003
Figure 4. The correlation between ERA5-Land reanalysis air temperature data at different time scales and measured air temperature data.
Sustainability 16 01934 g004
Figure 5. The monthly correlation between temperature and independent variables such as surface temperature.
Sustainability 16 01934 g005
Figure 6. Yelow River Basin air temperature spatial distribution before and after February 2003 downscaling. (a) Spatial distribution of temperature before downscaling, and (b) spatial distribution of temperature after downscaling.
Sustainability 16 01934 g006
Figure 7. Comparison of air temperature details before and after downscaling in the Yellow River Basin in February 2003.
Sustainability 16 01934 g007
Figure 8. Spatial distribution of station errors in downscaling results.
Sustainability 16 01934 g008
Figure 9. Analysis of station errors in downscaling results.
Sustainability 16 01934 g009
Figure 10. The variable importance of the ET model.
Sustainability 16 01934 g010
Figure 11. The variable importance of the XGBoost model.
Sustainability 16 01934 g011
Figure 12. The variable importance of the LightGBM model.
Sustainability 16 01934 g012
Table 1. Reanalysis air temperature accuracy on different time scales.
IndicatorMonthly Average Air TemperatureAnnual Average Air Temperature
R20.690.71
MAE2.071.89
RMSE2.952.72
Table 2. Description of variables in this article.
Variable TypesVariable AbbreviationVariable Description
Independent variableYLSTAqua satellite (1:30 PM) surface land temperature
YNLSTAqua satellite (1:30 AM) surface land temperature
OLSTAqua satellite (1:30 AM) surface land temperature
ONLSTAqua satellite (1:30 AM) surface land temperature
POINT_Xlongitude
POINT_Ylatitude
DEMaltitude
SLOPEslope
ASPECTaspect
NDVINormalized Difference Vegetation Index
Table 3. Machine learning model performance.
AlgorithmTrain SetTest Set
R2MAERMSER2MAERMSE
Stacking0.9860.7611.2740.9870.7411.215
ET0.9850.7731.3060.9870.7551.248
XGBoost0.9830.9111.4160.9840.8991.360
LightGBM0.9811.0101.4990.9820.9981.455
Table 4. Accuracy comparison before and after downscaling.
DataMAERMSE
0.1° Reanalyzed air temperature1.8552.524
Downscaled 1 km air temperature1.8102.519
Disclaimer/Publisher’s Note: The statements, opinions and data contained in all publications are solely those of the individual author(s) and contributor(s) and not of MDPI and/or the editor(s). MDPI and/or the editor(s) disclaim responsibility for any injury to people or property resulting from any ideas, methods, instructions or products referred to in the content.

