Article

Evolving a Methodology for Assessing Pesticide Pressure on Water Bodies under Data Scarce Conditions: A Case Study on the Marmara Basin in Türkiye

1
Department of Environmental Engineering, Çorlu Faculty of Engineering, Namık Kemal University, Tekirdağ 59860, Türkiye
2
Halil Rifat Pasa Mah., Hergun Sok. No: 3/2, Istanbul 34384, Türkiye
3
General Directorate of Water Management, Ministry of Agriculture and Forestry of TR, Bestepe, Sogutozu Cd. No: 14, Ankara 06560, Türkiye
4
Department of Environmental Engineering, Faculty of Civil Engineering, İstanbul Technical University, Istanbul 34469, Türkiye
*
Author to whom correspondence should be addressed.
Sustainability 2024, 16(5), 2086; https://doi.org/10.3390/su16052086
Submission received: 6 January 2024 / Revised: 19 February 2024 / Accepted: 29 February 2024 / Published: 2 March 2024
(This article belongs to the Section Sustainable Water Management)

Abstract

:
In this study, current pesticide use was determined on the basis of active substances (ASs) in each water body in the Marmara Basin, which is the most crowded region of Türkiye and where agriculture is intensive. The risks of detected pesticide ASs were then categorized in terms of usage amount, water body monitoring results, and hazardous characteristics. At the same time, a system was proposed for determining pesticide use on an AS basis, based on the product planted in districts that do not have detailed information on AS use. Finally, a methodology for assessing pesticide pressure on water bodies was developed by utilizing pesticide risk based on the determined AS types under data scarcity conditions. The topic undertaken is current and extremely important in the era of food safety, and is related to growing pressure on water, on one hand, and human health and quality of food products, on the other. Data based on ASs are hard to record and store, particularly in developing countries; therefore, a data inventory was initially realized in the study as an essential step towards an assessment procedure. The easy-to-use pesticide pressure determination methodology was developed and applied to the Marmara Basin of Türkiye, ensuring compliance with the Water framework Directive (WFD) and EU Green Deal. Constraints experienced during the application of the developed methodology are put forth with the intention of providing utilizable information to those international scientists who will be interested in practicing it in the future. Therefore, transposition of the methodology to other basins in different countries will be possible. According to 2021 data, 0.04–8.83 kg/ha pesticide and 173 pesticide active substances were used in the basin. ASs were prioritized over four criteria based on the amount of use, hazardous properties, and monitoring results. Consequently, 52 active substances were determined and included in the risk group. Taking these criteria into consideration, all the 276 agricultural water bodies in the basin were revealed to be under pesticide pressure.

1. Introduction

Pesticides make a significant contribution to food supply security, especially when used in sufficient quantity and quality for agricultural production [1]. However, the negative effects of these agricultural chemicals on both ecosystem and human health have become an important research topic in recent years [2,3]. This agricultural control method, performing faster and leading to more economical results, continues to be a significant aspect due to its discrepancies like unconscious use, deficiencies in the collection of application data, and lack of a comprehensive measurement of residues, especially in developing countries where data scarcity is an outstanding problem. Plant Protection Products (PPPs) contain chemicals, microorganisms, and semi-chemical phyto-pharmaceutical ASs that have general or specific effects on organisms. The formulations of these substances have been determined, and standards have been established by relevant institutions and commissions at national, regional, and global scales. Regulations on pesticides are set with the information obtained from the evaluation of their acute/chronic toxicity and carcinogenic potential. The effects of doses of ASs used in agriculture on the environment and health have been evaluated in previous studies [4]. Exposure to various types of pesticides, especially in the aquatic ecosystem, is known to have toxicological effects on fish and other aquatic organisms [5,6].
It is known that approximately 99.9% of applied pesticides are transported to non-target areas by evaporation, spray drift, surface runoff, degradation, adsorption, and leaching processes, and only 0.1% of applied pesticides reach the intended target pest [7,8]. Precipitation and agricultural irrigation transport pesticides from the areas where they are applied to receiving water bodies (WBs) [9,10]. These pesticides can accumulate in invertebrates and fish, join the food chain, and be passed on to birds, mammals, and even humans. Therefore, their effects on aquatic ecosystems have received widespread attention [11,12]. Studies indicate that the transportation mechanism should be considered together with both the soil and pesticide properties. Scientists have already reported that [13] some pesticide species presented a higher risk of leaching and accumulation, and correlations were observed between accumulation of pesticides and physicochemical properties of soil. Thus, pesticides also threaten groundwater bodies due to the hydraulic link of surface and groundwater WBs. In a study conducted in Switzerland, pesticide residues were found even in soils where pesticide application had not been reported in the last 10–15 years [14]. In addition, depending on the characteristics of the soil and the ASs, pesticides that pass into groundwater through infiltration necessitate the measurement, evaluation, and modeling of seepage potential. As such, these pesticides have been the subject of many studies [15,16,17]. This includes pesticide types that are generally considered as non-persistent or moderately persistent.
Controlled practices have been implemented with strict regulations, especially in developed countries, due to the potential harmful effects of pesticides. The EU has adopted stringent systems regarding permits and controls for the use of pesticides. EU Directive 2009/128/EC on the Sustainable Use of Pesticides (SUD) aims to reduce the risks and impacts of pesticide use on human health and the environment [18,19]. On the other hand, the European Green Deal (GD) presented by the European Commission (EC) in 2019 acts as a tool that reveals a roadmap for a new, sustainable, and inclusive growth strategy, aiming to make Europe the first carbon-neutral continent by 2050. One of the seven strategies within the GD is the “Farm-to-Fork—F2F” strategy [20]. In addition to protecting the ecosystem, this strategy includes many comprehensive goals such as reducing dependence on pesticides and antimicrobials in the food production sector [21,22].
The EC has meanwhile approved a new regulation to reduce the use and risks of chemical pesticides by 2030. These regulations aim to overhaul existing rules on the sustainable use of pesticides and bring them in line with the targets set in the biodiversity and Farm-to-Fork strategies from the EU GD perspective [23]. Thus, the new legislation urges the Member States to comply with the sustainable pesticide use principles, to keep accurate data on pesticide use and sales, to recognize the transport and transformation mechanisms of pesticides along with pesticide application, and to detect the presence of pesticides in various environments, especially water and soil, through establishing and conducting monitoring studies.
Pesticide use per agricultural area and per capita and agricultural production are checked at the national scale, and the data collected from countries are published by the FAO. According to the FAO’s 2021 data, total pesticide use in agriculture reached 3.5 million tons of ASs in 2021 at the global scale. This value increased by 4% compared to 2020. The worldwide average values of pesticide application per agricultural area were 2.26 kg/ha and 0.45 kg/person per capita. Application per cropland area varied widely among the top pesticide users, from 10.9 kg/ha in Brazil to 0.8 kg/ha in the Russian Federation [24].
According to the FAO’s 2021 data, the average amount of pesticide used in Türkiye was 2.26 kg/ha, and pesticide use per capita was 0.62 kg/person [25]. The main problem for Türkiye is that pesticide use reached high values in some regions, and there are many missing data on ASs [26]. According to Turkish Statistical Institute (TURKSTAT) 2021 data, the total cultivated agricultural area in the country was 20,413,000 hectares. The amount of pesticide used was 52,965,000 kg [27], leading to a unit pesticide use of 2.59 kg/ha for 2021. These values are based on the total amount of pesticides used. Distinctions between ASs, like banned or restricted substances, were not made. The most commonly used pesticide groups in Türkiye in 2021 were fungicides (38%), herbicides (27%), and insecticides (23%) [26].
With pesticide data, hotspots and periods can be identified, and measures can be taken to minimize the use of these chemicals while guaranteeing food safety. Such work can easily be managed in developed countries compared to developing countries, where, despite the existence of regulations, data scarcity causes scientists to develop some attainable methodologies to assess pesticide pressure on WBs. As such, addressing measures will be more easily realized, and the well-being of the water ecosystems will be secured [28,29,30]. Sustainable agriculture that directly aligns with Goal 2 (Zero Hunger) of the Sustainable Development Goals (SDGs) is also interconnected with Goal 6 (Clean Water and Sanitation), Goal 12 (Responsible Consumption and Production), and Goal 14 (Life Below Water) regarding pesticide use in agriculture, making it pivotal for overall development. In that sense, this study aims to serve for the benefit of the mentioned SDGs [31] regarding the assessment of pesticide pressure on WBs.
To achieve this unique purpose, a methodology for assessing pesticide pressure on WBs was developed in this study, and a sample application was carried out on the Marmara Basin in Türkiye, representing a basin of a developing country that experiences data scarcity conditions. In this context, field data and the amount and types of pesticides used on the basis of AS per unit time and per unit agricultural land were determined for the basin that also covers Istanbul Metropolis, which is ranked among the most crowded metropolises of the world according to UN 2021 data [32]. The calculated data were evaluated based on ASs and usage amounts. Besides presenting the current pesticide use inventory in the basin, pesticide monitoring studies in WBs carried out in the basin from past to present were also evaluated. Pesticide pressure criteria were then determined, and finally the assessment of pesticide pressure on WBs was addressed based on risk categorization. It is thought that the data inventory, calculation of ASs, and risk categorization steps of the methodology will act as a guide to evaluate pesticide data and its corresponding aspects in other developing countries and regions facing data scarcity.

2. Materials and Methods
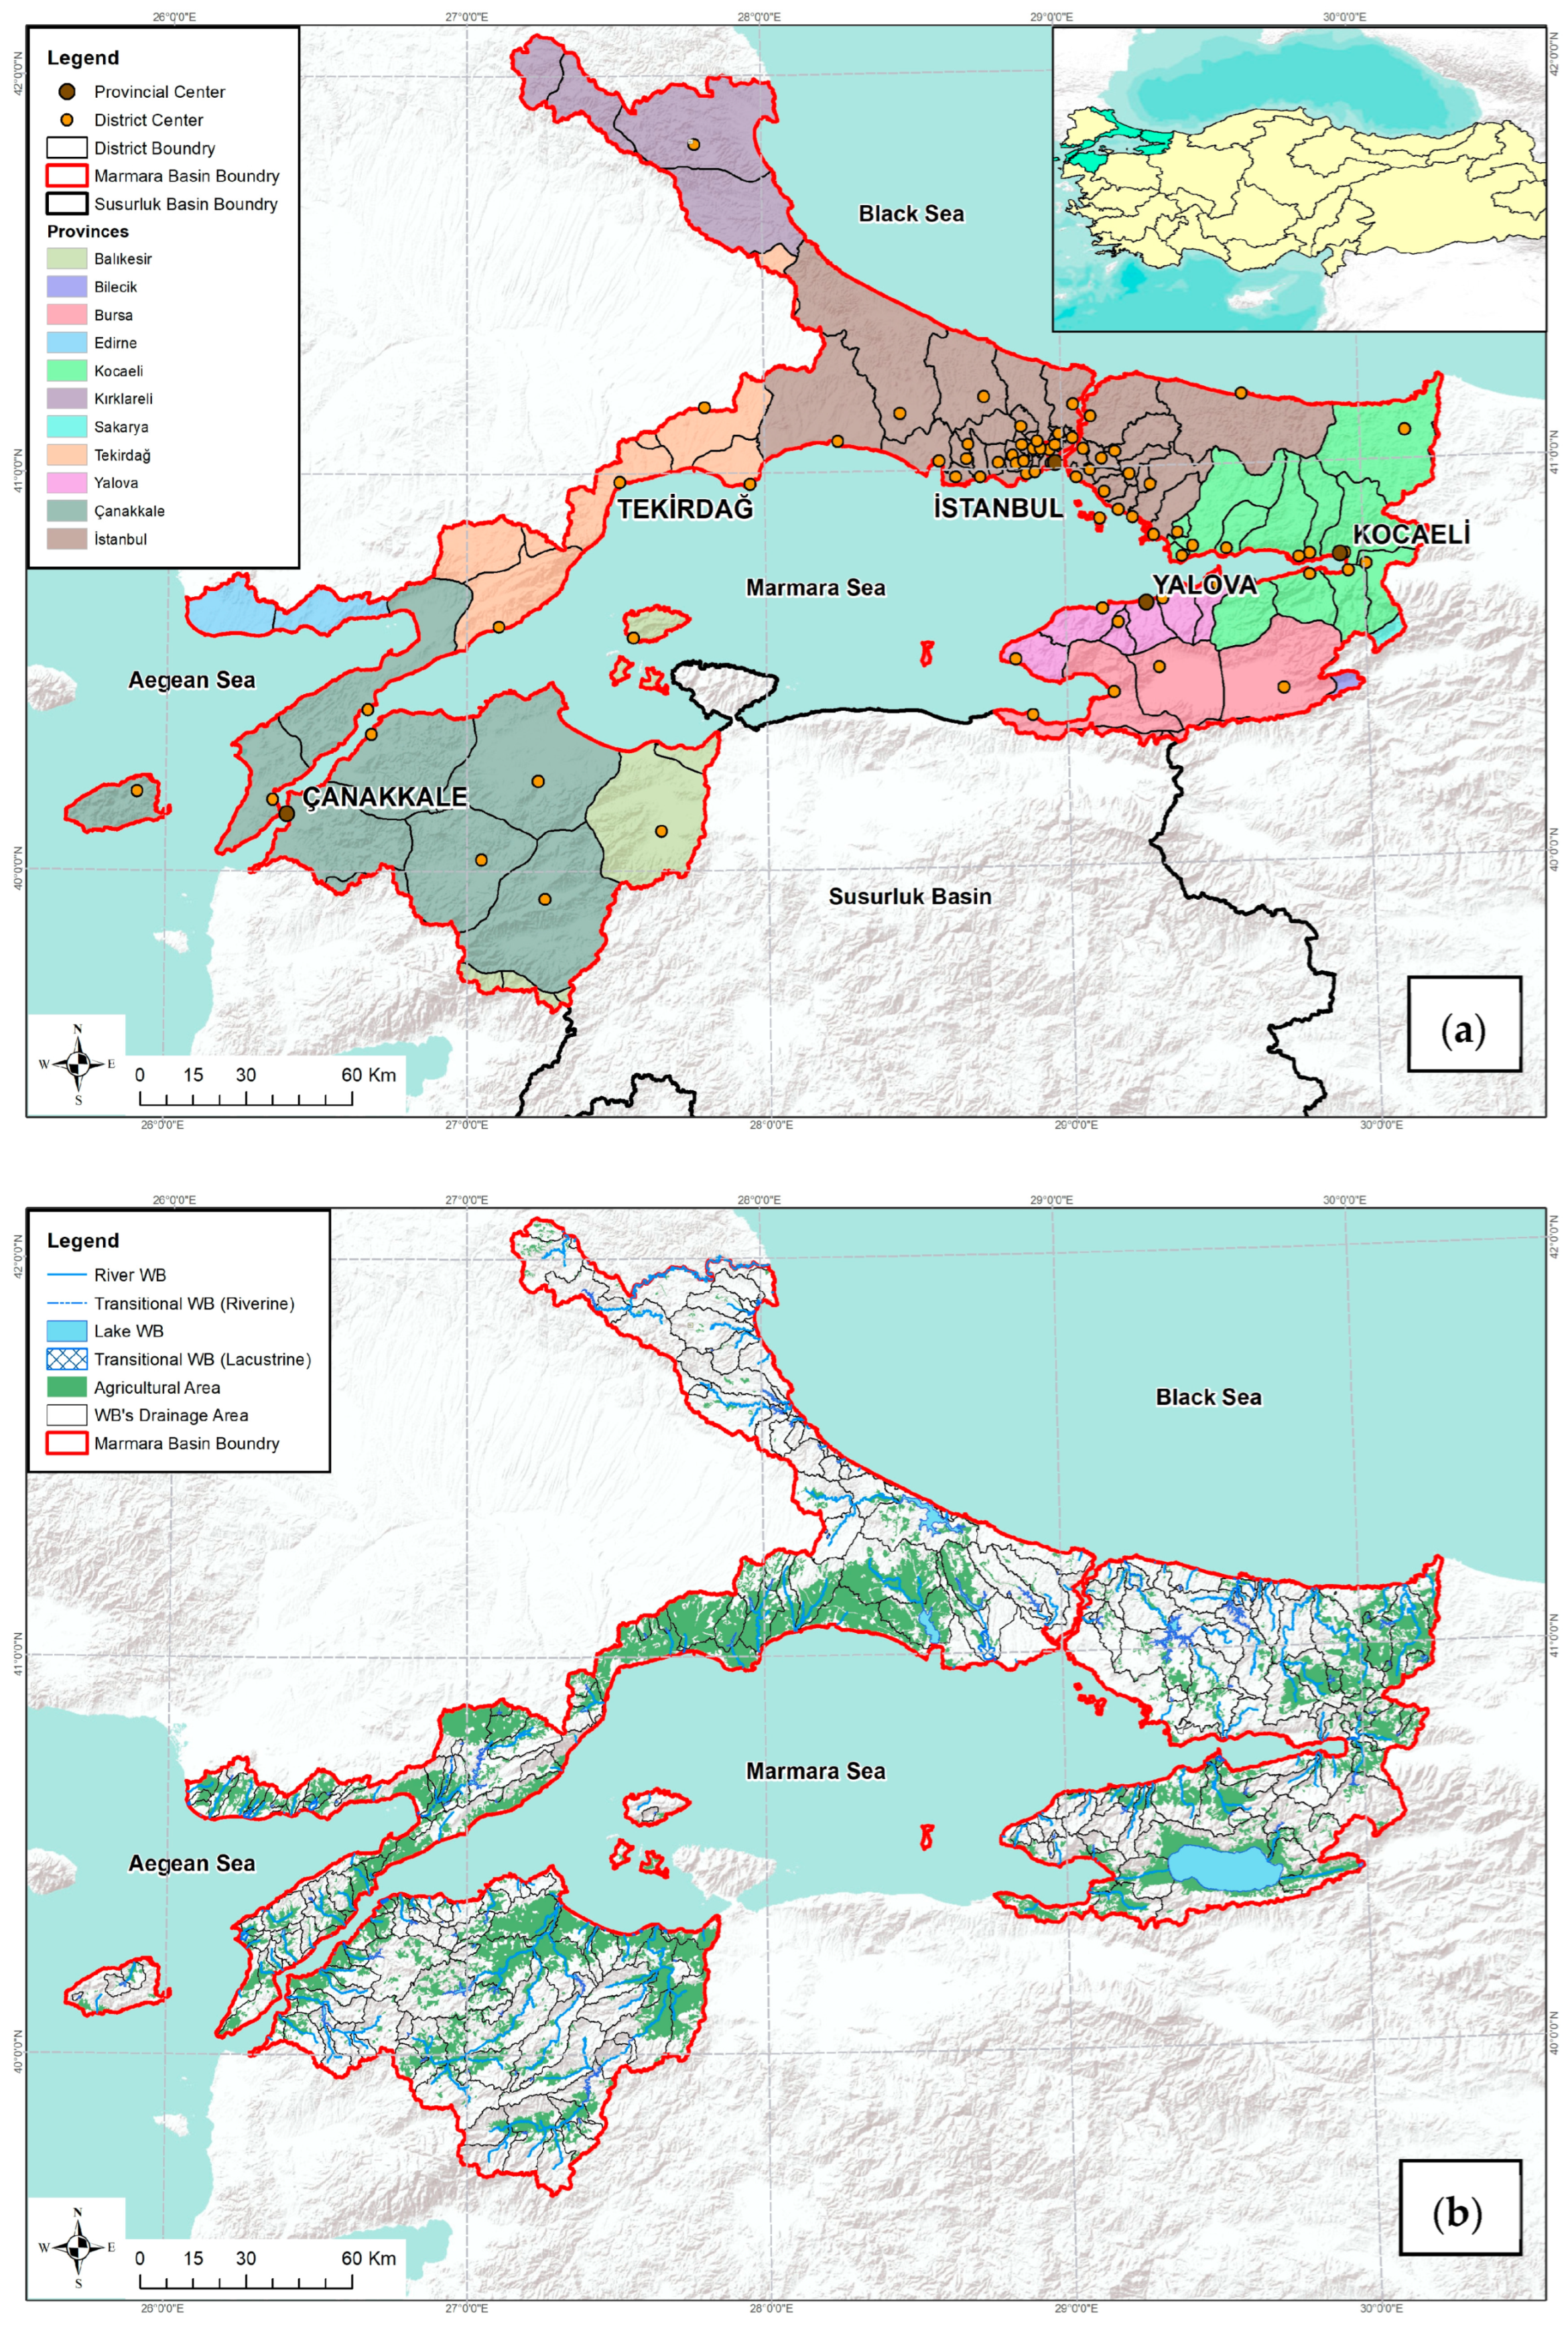
2.1. Study Area

The Marmara Basin, located in the Northwest of Türkiye, covers the entire area around the Marmara Sea excluding the Susurluk River Basin with a surface area of approximately 23,500 km2. There are 92 districts belonging to a total of 11 provinces within the basin. Istanbul Province constitutes a significant part of the basin population (81%), where 19,470,655 inhabitants live as of 2021 [33]. The geographical location of the basin together with the provincial and district boundaries are shown in Figure 1a.
The two provinces that are located in the basin are Istanbul and Kocaeli, with the highest population density of 3062 and 576 people per km2, respectively. Other provinces located in the basin include Yalova, with 350 people per km2; Tekirdağ, with 181 people per km2; and Çanakkale, with 56 people per km2 [33]. The Marmara Basin is facing several sources of pollution, including urban and industrial discharges in addition to agricultural pollutants. In total, 15% of the WBs in the basin are under pressure from industrial discharges, while 31% are under pressure from urban discharges [34].
The surface water potential of the basin has been determined to be 7441.51 hm3 annually by the basin’s Master Plan of 2014–2018 [35]. The majority of the water is allocated for domestic needs (approximately 55%) due to the area’s high population. The agricultural sector and the other water-dependent sectors share the rest of the water in the basin. In order to meet the water demand, inter-basin water transfers are also realized. Surface WBs of the basin are determined in accordance with the Water Framework Directive (WFD) Guidance Document No. 2 [36] and are classified as natural, highly modified, and artificial WBs. A total of 60% of the total 341 surface WBs in the basin are rivers, 25% are lakes, and 10% are transitional and 4% are coastal bodies. Of these, 57% are natural, 40% are highly modified, and 3% are classified as artificial. A monitoring study held in the basin in 2021 determined water quality conditions within the scope of WFD, covering only 45% of the WBs. According to the results, only 27% of the monitored WBs were defined as ecologically in “good status” and 41% as chemically in “good status”. Some priority substances such as benzo(a)pyrene, dichlorvos, dicofol, cadmium, lead, nickel, perfluorooctane sulfonic acid (PFOS) and its derivatives, and terbutryn did not achieve Environmental Quality Standards (EQSs) in WBs [34].
The Marmara Basin is divided into 4 distinct sections based on its geological structure which are separated by the Dardanelles and the Bosphorus (Istanbul Strait). These are Northern Marmara (Thrace–Istanbul Side), Eastern Marmara Istanbul (Istanbul Anatolian Side–Kocaeli), Eastern Marmara (Bursa–Iznik), and Southern Marmara (Çanakkale–Biga). A total of 82 groundwater bodies were identified in the basin. The recharge and abstraction values of these bodies were calculated to be 452.59 hm3/year and 334.92 hm3/year, respectively [35].
The district-based total agricultural area of the basin was determined using the CORINE Land Cover Dataset (land use categories coded as CORINE 211, 212, 213, 221, 222, 223, 241, 242, and 244) and agricultural land irrigation data compiled by the State Hydraulic Works (DSI) under the Ministry of Agriculture and Forestry. Accordingly, there exist 689,979 ha of agricultural land, corresponding to approximately 29% of the basin area. Excluding coastal WBs, approximately 85% of the terrestrial WBs (276 WBs) contain agricultural areas. In total, 40% of the privately owned agricultural land in the basin is under 10 hectares (ha), 45% is between 10 and 50 ha, and 14% has an area over 50 ha [27]. As such, most of the farms are small or medium-sized. Figure 1b illustrates agricultural areas and WBs in the basin.
There are a total of 114,914 livestock breeding facilities in the basin, which house a total of 595,264 bovine, 1,199,849 ovine, and 9,514,171 poultry animals. In terms of the number of facilities, 85% of them are small facilities with fewer than 9 bovines. There are only 23 facilities that have over 300 bovines. A similar situation exists for ovine facilities, where 86% of the facilities have fewer than 9 animals, and the number of facilities with more than 300 ovine animals is 267 [27].
A total of 155 different plant species are grown in the Marmara Basin. The main crops planted in agricultural areas are cereals like wheat, sunflower seeds for oil production, barley, table olives, corn (silage), oat, paddy, canola, and rapeseed. Minor crops are devoted to some vegetables and fruits [27].

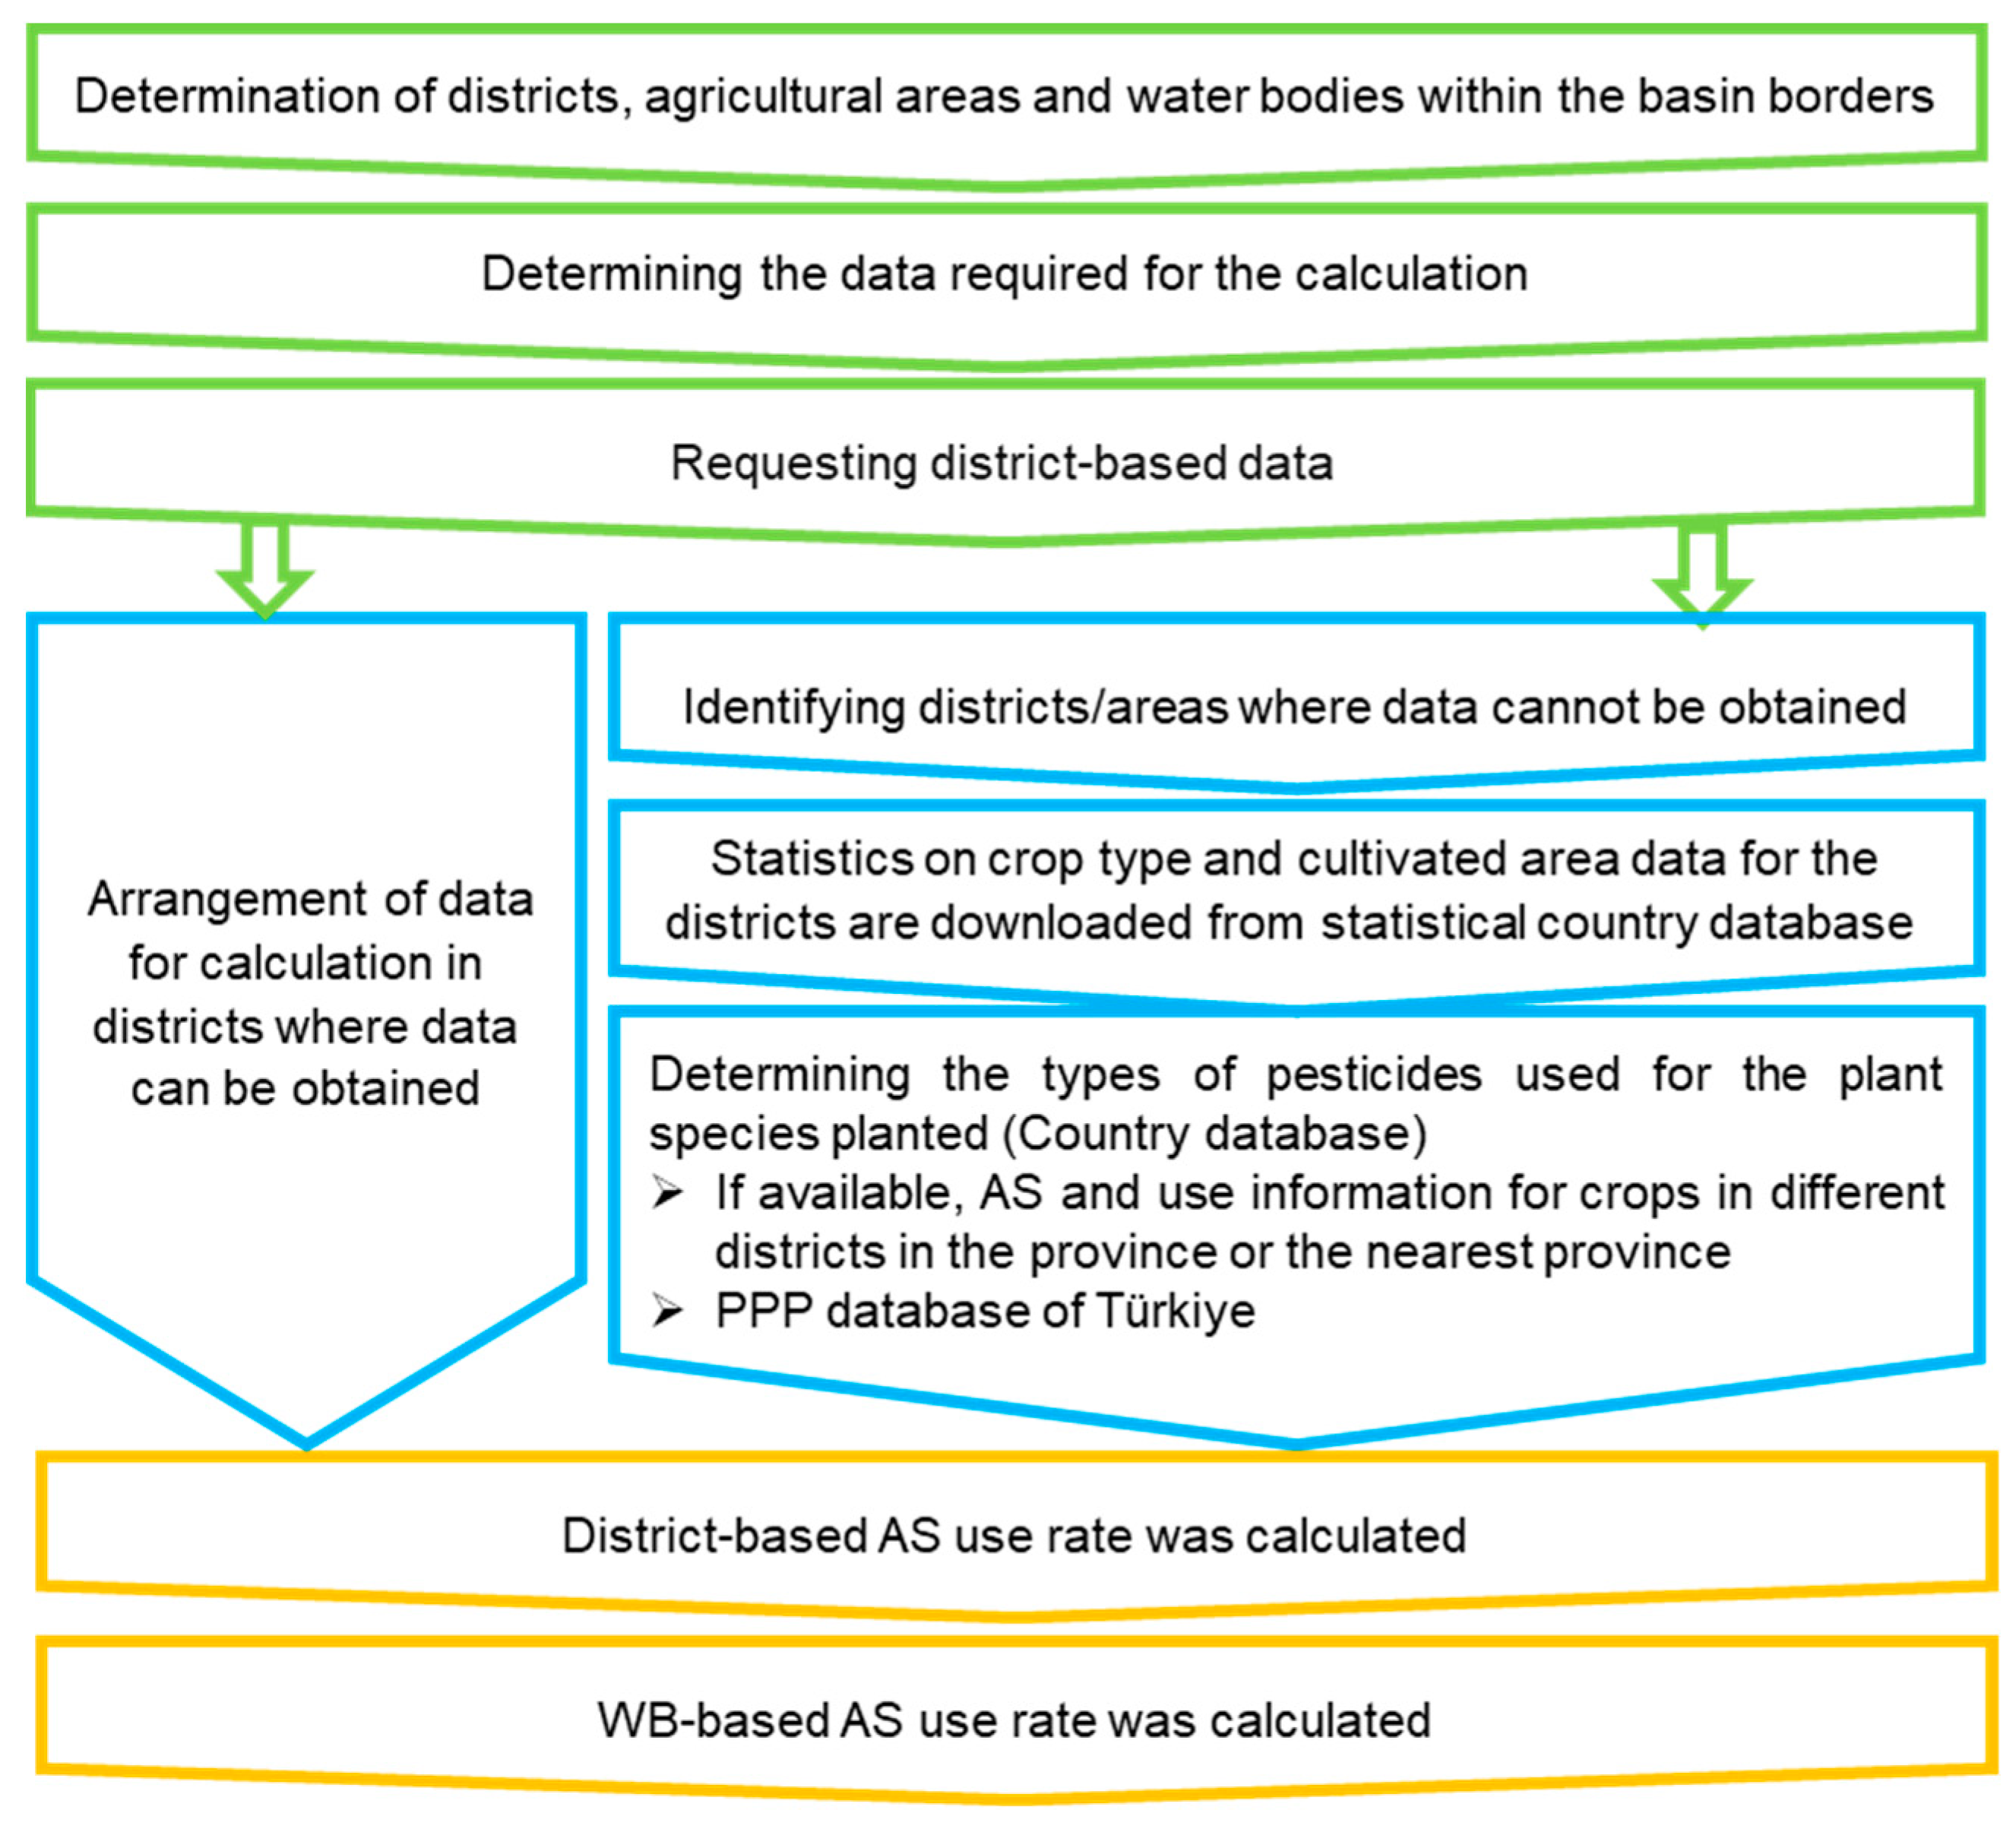
2.2. Calculation of Pesticide Use in the Basin

Data on pesticide use are mainly kept by the Ministry of Agriculture and relevant provincial/district directorates. However, most of these stored data relate only to pesticide groups (insecticides, herbicides, etc.) and not ASs. For this reason, the scheme given in Figure 2 was followed to determine the AS amounts used in the WBs.
Accordingly, corresponding data listed below were requested from agricultural provincial/district directorates and pesticide dealers from all districts within the basin through field surveys in order to obtain AS data used in the basin.
  • Province, district name;
  • Crop type;
  • Disease/pest name;
  • Pesticide application frequency;
  • Pesticide application period;
  • Pesticide applied area;
  • Pesticide application dose.
Some of the information gathered was on an AS basis, and these data were used directly. However, for districts without AS data, a different data collection and calculation method was used. As such, usage amounts were calculated in two different ways for districts with pesticide AS information and for districts without pesticide AS information.
For districts with AS information, the type of the crops cultivated, ASs used, frequency of application, dosage of use, and pesticide applied areas were organized per district.
For districts where AS information could not be obtained on the basis of agricultural land, data on product type and cultivation area were obtained from the statistical data publicly shared by Türkiye. After determining the plant species, pesticide use data from different districts in the same/different province, if available, were used to evaluate the AS information for each product.

2.2.1. Calculating the Amount of Pesticide Use on the Basis of Districts

Based on the compiled data, the district-based AS use rate was calculated by Equation (1) [37]:
A S u s e d = D × F × A × n
where
D: Application dose of AS (ml/ha or g/ha);
F: Fraction of AS in the formulation (%);
A: Cultivated area where AS was applied in the district (ha);
n: Annual frequency of application of the AS;
ASused: Annual AS used in each district (kg/year).
With the calculation, AS usage information on a district basis was calculated as kg/year. An example calculation for 3 provinces is given in Table 1. This process was repeated for all provinces and districts within the basin. Then, the same types of AS usage for different plant patterns were collected on a district basis.

2.2.2. Calculating the Annual AS Application Based on WBs

Calculated AS values represent the total agricultural use in the district. At the last stage, corresponding values were converted to the water body (WB) scale according to the share of agricultural area per district. Therefore,
  • The district-based total agricultural area of each WB was determined using the CORINE Land Cover Dataset and agricultural land irrigation data.
  • AS used in each WB was calculated by Equation (2):
A S u s e d W B = a = 1 x b = 1 y A g r   w b a A g r   t o t a l a × A S u s e d a b
where
ASusedWB: Total AS used in the WB;
Agr wba: Agricultural area remaining in the WB in the district;
Agr totala: Total agricultural area of the district;
ASusedab: “b” AS used in WB “a”;
x: Number of districts in WB;
y: Number of ASs used in the district.
  • Finally, for WBs containing agricultural land belonging to more than one district, the total use in each WB was obtained by adding up the number of ASs belonging to the agricultural land in each district.

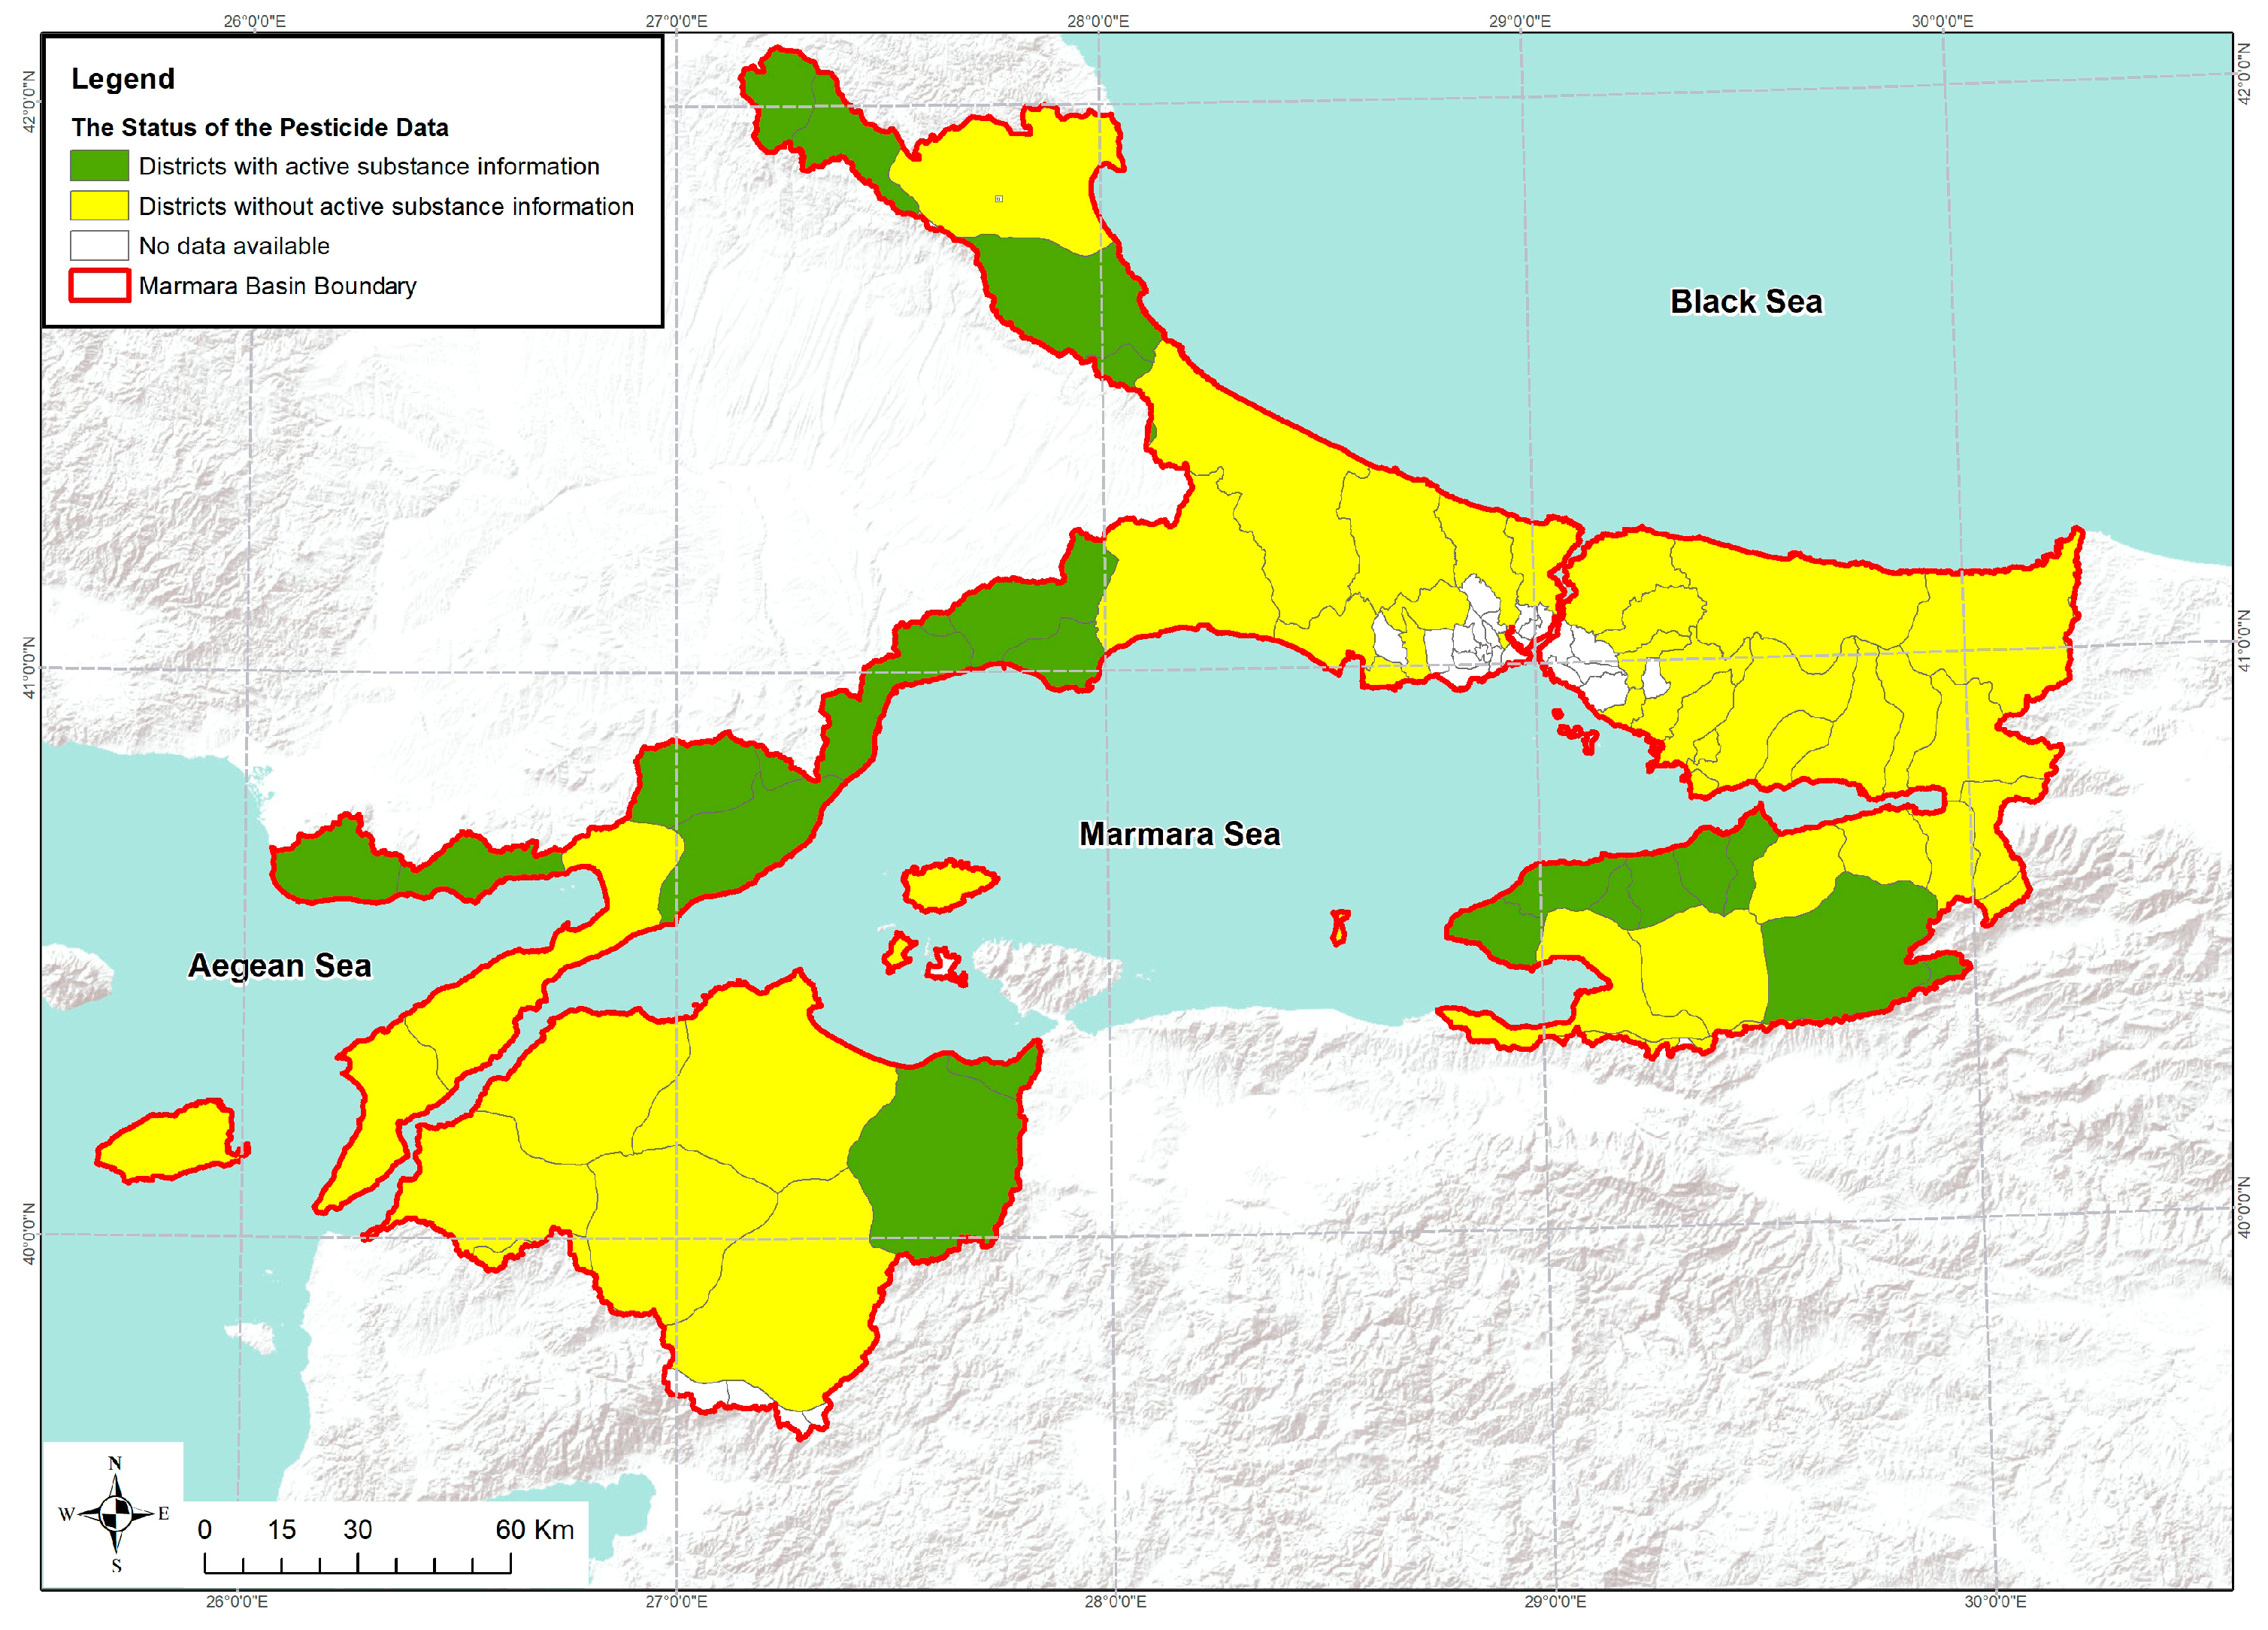
2.2.3. Constraints of the Developed Methodology

Some assumptions were made during data compilation for calculation, and, therefore, the method has some limitations as summarized below:
  • While determining the usage amount, field data based on dealers’ data were used, and in cases where these data were not available, statistical data were used indicating that information regarding on-site application could not be obtained.
  • The dosage of all pesticides was converted to mass units.
  • The difference between “cultivated area” and “treated area” was not considered.
  • The type of device with which pesticide was applied was not considered (ground spray, aerial application, etc.).
  • Among the chemicals used, only those used as pesticides were considered. Other PPPs (plant growth regulators, disinfectants, etc.) were not available.
  • Contamination from storage was not considered.
  • Application differences like horticulture, greenhouse, and cultivation of exotic species were not considered.
  • A single pesticide was used for crop types with low cultivation.
  • In pesticide types with more than one AS in their formulation, the ratio was assumed to be half if not specifically stated.
  • Buffer zones were not considered.
  • Inter-application timing and evaporation differences between seasonal applications were not considered.
  • “Before planting” or “after harvest” applications were not considered.

3. Results Coupled with Assessments for Pesticide Pressure Determination

3.1. Calculation Results

In Türkiye, data on pesticide use are mainly kept by the provincial/district directorates of the Ministry of Agriculture and Forestry (MoAF). Accordingly, corresponding data were requested from related directorates and pesticide dealers from all districts within the basin through field surveys for the year of 2021.
Information requested from the relevant institutions in the Marmara Basin was provided on the basis of ASs, but data were provided on the basis of pesticide groups in some districts as AS data were not kept. Figure 3 shows the pesticide data supply status on the basis of provinces and districts within the basin. As can be seen, data on ASs could only be collected for 33% of the total agricultural area of the basin.
Data on crop types planted in agricultural lands of Türkiye and the area where they are planted are stored by the Turkish Statistical Institute (TURKSTAT) and shared publicly [27]. For districts where AS information per agricultural area could not be obtained, data on the type of product planted and the cultivation area for 2021 were downloaded from this database. After the identification of plant types, to assess the AS information in each product, pesticide use data in a different district in the same/different province were utilized if available.
The PPP Database Mobile Application was used for areas where there were no data for the relevant plant types in the nearby regions. The PPP database is an open-access application released in 2016 that contains ASs, formulation, and use information (recommended application dose, time between the last spraying, etc.) of licensed PPPs [38].
In the data inventory carried out in 70 districts within the basin and agricultural areas, direct field data were used in 22 districts, and the approach based on TURKSTAT crop type data was used in 48 districts.
According to the results, total pesticide use in all agricultural areas within the basin is 1,043,783 kg-L/year. Calculations were performed for 276 of the 326 WBs, excluding the coastal WBs in the Marmara Basin. On an AS basis, pesticide use varied in the range of 0.04–8.83 kg/ha. The distribution of pesticide use in WBs is given in Figure 4. Average use was 1.16 kg/ha, which is below Türkiye’s average (2.59 kg/ha) given by TURKSTAT [27]. AS use exceeded this value in 32 of the WBs in the basin.
The data inventory and calculations designate that 173 types of ASs were used in all the agricultural areas of the basin. AS type and use along with CAS numbers are presented in Table S1 in the Supplementary Materials. Figure 5 addresses 36 pesticides with usage above 5 tons/year that account for 93% of the pesticide use in the basin. Accordingly, the most used pesticides in the basin are deltamethrin, prochloraz and aclonifen.

3.2. Assessment Based on AS Types

3.2.1. Prohibited Pesticides

In order for a pesticide to be used in agricultural activities in Türkiye, it must be licensed by meeting the legislative requirements of the Licensing Legislation [39]. The regulations have been harmonized with the EU in terms of licensing criteria, and the licensing requirement must be fulfilled within the EU or G8 countries. Changes in the world and especially EU regulations, non-renewal of the license, and country requirements may lead to a complete ban on the use of a pesticide [40]. Pesticides banned are recorded in a list that is regularly updated [39].
It was determined that 15 of the existing pesticides included in the “List of Prohibited Technical Substances for Which Import, Production and Production Has Been Suspended-2022” were used in 98 water resources within the basin. Information on the banned pesticides found to be used is given in Table 2. As can be seen, 11 of these pesticides were banned at the end of 2021 and in 2022. However, it can be seen that four types of pesticides are still used even though they were banned in the past.

3.2.2. EU Risk Categorization

According to the Farm-to-Fork (F2F) strategy of the EU GD, two specific targets have been proposed regarding pesticides [41,42]. These targets aim (i) to reduce the use and risk of chemical pesticides by 50% and (ii) to reduce the use of more hazardous pesticides by 50% by 2030. Use and risk data will be determined using statistical data on the quantities and hazardous properties of the pesticides sold on the market and used in each Member State [43]. All of the ASs, whether they are low risk ASs, candidates for substitution, or other ASs, are listed in different part of related regulations [44].
“Harmonized Risk Indicators” were created to measure the progress made in achieving these targets at the Union level, allowing Member States to manage and report risks arising from pesticide use at the national level. The Commission calculates risk indicators using statistics and relevant data on PPPs collected in accordance with the legislation to estimate trends. The risk indicators in question are calculated by combining the statistics on the quantities of pesticide ASs (Harmonized Risk Indicator 1) and number of authorizations guaranteed (Harmonized Risk Indicator 2) [45]. To determine these risk indicators and follow the relevant targets, all pesticides released by the EU are divided into seven categories and four groups [45]. This classification is updated every year. The definitions of the relevant groups are given in Supplementary Materials Table S2.
Therefore, the number and quantity values of pesticides among those detected to be used in the basin, divided into groups according to EU risk categorization, are given in Table 3. As seen, 113 of the 173 types of pesticides belong to Group 2, and 20 of them are ASs in groups 3F and 4G, whose approval has not been finalized according to the EU risk categorization.

3.3. Assessment Based on Pesticide Measurements in WBs

There are few studies in the literature on pesticide levels in WBs and soil in the Marmara Basin. Organochlorine pesticide types such as α-endosulfan, β-endosulfan, methoxychlor, α-BHC, Gama-BHC, β-HCH, DDT were found in the matrices [46,47,48,49,50,51], in various surface WBs of the basin, sediment, fish, etc. However, no updated study has been carried out specifically on the presence of current pesticides in WBs. In a study on pesticides in soil, the AS types investigated were ranked as chlorantraniliprole > imidacloprid > pyridaben > clothianidin > indoxacarb [52]. All these AS types referred to were among those that have been determined within this study. Monitoring studies have been conducted on the surface waters of different basins in various projects directed in Türkiye. Within a monitoring project regarding drinking water resources in the basin, 43 pesticides were detected among 138 parameters analyzed. According to the average of monthly measurement results of 2021, the most frequently detected AS was cypermethrin. It is one of the most commonly used ASs and was calculated within the scope of this study [53].
The National Surface Water Quality Regulation [54] currently in force in Türkiye, which is in parallel with the EU WFD, is used to evaluate and discuss the monitoring results attained through the determination of surface water quality studies. Possible pollutants that may be present in surface WBs as a result of urban, industrial, and agricultural activities were investigated, and 250 specific pollutants and 45 priority substances (PSs) and the water quality criteria of these substances were transferred to the national legislation. As such, PSs are defined as “substances and substance groups that pose a significant risk to the aquatic environment for the assessment of the chemical status in surface WBs” and are considered in determining the chemical status of WBs within the context of the regulation. PSs include 26 types of pesticide ASs, as well as heavy metals and organics [55]. Within the Water Quality Monitoring Project in the Marmara Basin, monitoring studies were carried out in WBs in the May 2020–April 2021 period, and PSs that exceeded the environmental quality standards (EQSs) were determined in each water mass. Hence, two of the PSs exceeding the EQS value in different WBs in the basin were pesticides (cypermethrin and aclonifen) [55]. In this study, it was determined that both of these ASs are still used in the basin.
The transportation mechanism of pesticides starting from the applied point and ending in WBs is a complex process. There are many factors that cause the complexity of this process like the constant occurrence of pollution, its widespread application to land, surface runoff, hydro-morphological characteristics, soil structure, pesticide application configuration and timing (pre-rain/sunny weather, etc.) of application, and the physical properties of the pesticide type together with its chemical properties [56,57,58,59,60]. Along with the last pesticide application, old deposits of adsorbed pesticides on riverbanks or stream sediments, especially in long-term and in intensively used agricultural basins, can also constitute a source of pollutants [61,62,63].
On the other hand, treated or direct domestic/urban WWTP inputs to WBs also create a pesticide input. However, while monitoring is carried out in line with WFD in WBs, a good situation regarding pesticide pollution may be the case based on some studies, and on the contrary, some other studies expose the negative ecological effects of pesticides in surface waters. The most important reason for this inconsistency is that a sampling strategy (analyte spectrum, sampling timing, site selection) has not yet been designed to reflect current pesticide use as referred to in [64]. In Türkiye, it is not possible to measure all of the pesticide types whose current use has been detected in monitoring studies on WBs. Due to these reasons, monitoring studies and calculation results have not been directly compared on the basis of WBs in the basin.

3.4. Pesticide Pressure Determination

ASs detected as used in the basin were evaluated in terms of various subjects as referred to in the above section. Which types of 173 ASs detected were riskier for the basin and which should be considered in monitoring studies were determined by means of the criteria stated below.
AS with high usage in the basin: Even if the ASs used in agricultural areas are not in the banned or hazardous group, when used in high amounts, they cause significant organic load in soil and water environments and negatively affect the ecological balance. Currently, the aim of the F2F strategy is to reduce the risk arising from the use of chemical pesticides, regardless of their hazardous properties [20,43]. Accordingly, ASs with a usage amount of over 10 tons/year were evaluated as a risk group for the basin. There are 29 types of ASs in the basin whose use is >10 tons/year.
Prohibited pesticides in Türkiye: 15 of the ASs were revealed to be used in the basin during the calculation period, and these were included in the risk group.
Hazardous pesticides according to EU Risk categorization: 20 of the ASs in the 3F and 4G groups, whose approval has not been finalized according to the EU risk categorization, have been identified as used in the basin. These are included in the AS types in the risk group.
Priority Substances (PSs): According to National Surface Water Quality Regulation [54], chemicals in the PS group are those that pose a risk to the aquatic environment, and some of them are still used as pesticide ASs. Among the 45 chemicals determined to be PSs, the use of two active substances was determined in the basin (cypermethrin and aclonifen), and these two substances were included in the risk group.
Considering these criteria, a total of 52 pesticides were prioritized and included in the risk group. These ASs and corresponding prioritization criteria are shown in Figure 6. WSs in which at least one of the ASs meeting these criteria were used were evaluated as “under pesticide pressure”. All criteria and related WB numbers are given in Table 4. Accordingly, all the WBs in the basin that are agricultural areas are categorized (276 WBs) as under pesticide pressure.
Inappropriate use of pesticide ASs is a problem not only for food safety and agricultural economy but also for all receiving environments like WBs. In this study, the methodology proposed focuses on pesticide risk assessment from the perspective of basin management. By adding current AS use in addition to old pesticides with known persistent properties in water quality monitoring studies, the aim is to establish a realistic basis for monitoring pesticide pollution in surface and groundwater bodies and determining the measures to be taken to reduce pollution.

4. Conclusions

An easy-to-use methodology for assessing pesticide pressure on WBs under data scarce conditions was generated and applied in the selected basin of Türkiye as a typical example, and it can be transposed to other countries that has agricultural land and difficulty in assessing pesticides. It is certainly worth raising and continuing this topic because despite a number of legal regulations, also of an international nature, this problem is becoming increasingly serious. The specific scientific contribution of research, given that the topic is current and that there are already many papers in this field, was to highlight the applicability of the methodology developed to the academic community and to introduce it through a stepwise calculation pathway for pesticide pressure determination coupled with assumptions made and assessments considered. Application of the methodology has put forth the limitations experienced, and these are referred to in the manuscript with the intention of providing utilizable information to scientists who will be interested in practicing it in the future.
Four assessment criteria were used for determining pesticide pressure in the study. Each criterion has a different perspective; one relies on a higher pesticide usage amount, the other refers to the consumption of prohibited pesticides, another considers the risk categorization generated by the EU, while the last one refers to ASs used listed on the national priority substance list. The overall findings are illustrated in terms of number of ASs used and number of WBs in which these ASs are consumed. Among the 276 WBs bearing agricultural land, all were found to be using pesticides exceeding 10 tons/year. In that sense, all these WBs were considered to be under pesticide pressure. A total of 98 WBs (35% of all WBs) were detected to contain prohibited pesticides, 109 WBs (39%) were threatened by hazardous pesticides, and 203 WBs (74%) were contained ASs listed in the national priority substance list. As such, the four criteria address the use of pesticides from different perspectives, and assessments investigate various aspects of the use of pesticides.
As a concluding remark, it can be stated that the methodology developed coupled with the route followed in this study aims to highlight the importance of determining the ASs used in a basin so as to cope with the overuse/misuse/unconscious of pesticides that would in turn threaten both the soil and water media.

Supplementary Materials

The following supporting information can be downloaded at: https://www.mdpi.com/article/10.3390/su16052086/s1, Table S1: Pesticide types and amounts used in the Marmara Basin; Table S2: EU Pesticide Risk Categorization.

Author Contributions

Conceptualization, A.H. and A.T.; methodology, A.H. and E.G.; data curation, A.H., E.G., Y.K. and A.T.; writing—original draft preparation, A.H.; writing—review and editing, A.T., Y.K. and A.H.; visualization, E.G.; supervision, A.T.; project administration, A.H., A.T. and E.G. All authors have read and agreed to the published version of the manuscript.

Funding

This research received no external funding.

Institutional Review Board Statement

Not applicable.

Informed Consent Statement

Not applicable.

Data Availability Statement

Data are not accessible due to privacy and ethical restrictions.

Acknowledgments

The authors extend thanks to the ongoing Project named as Technical Assistance on Preparation of River Basin Management Plants for Six Basins (EuropeAid/134/D/SER/TR)561 (2021–2025) through which the field surveys on pesticides were realized in the districts of the Marmara Basin.

Conflicts of Interest

Author Yakup Karaaslan was employed by the company “Ministry of Agriculture and Forestry of Türkiye, General Directorate of Water Management”. Author Emine Girgin is a freelance engineer currently acting as Marmara Basin Leader in the 6RBMP Project directed by the Ministry of Agriculture and Forestry of Türkiye. The remaining authors declare that the research was conducted in the absence of any commercial or financial relationships that could be construed as potential conflicts of interest.

References

  1. UC Davis. “What is Sustainable Agriculture?” Sustainable Agriculture Research and Education Program. UC Agriculture and Natural Resources. 2021. Available online: https://sarep.ucdavis.edu/sustainable-ag (accessed on 3 July 2023).
  2. Tang, F.H.M.; Lenzen, M.; McBratney, A.; Maggi, F. Risk of pesticide pollution at the global scale. Nat. Geosci. 2021, 14, 206. [Google Scholar] [CrossRef]
  3. Sharma, A.; Kumar, V.; Shahzad, B.; Tanveer, M.; Sidhu, G.P.S.; Handa, N.; Kohli, S.K.; Yadav, P.; Bali, A.S.; Parihar, R.D.; et al. Worldwide pesticide usage and its impacts on ecosystem. SN Appl. Sci. 2019, 1, 1446. [Google Scholar] [CrossRef]
  4. Ramsingh, D. The Assessment of the Chronic Toxicity and Carcinogenicity of Pesticides. In Hayes’ Handbook of Pesticide Toxicology; Academic Press: Cambridge, MA, USA, 2010; Chapter 14. [Google Scholar]
  5. Wang, R.; Yuan, Y.; Yen, H.; Grieneisen, M.; Arnold, J.; Wang, D.; Wanf, C.; Zhang, M. A review of pesticide fate and transport simulation at watershed level using SWAT: Current status and research concerns. Sci. Total Environ. 2019, 669, 512–526. [Google Scholar] [CrossRef] [PubMed]
  6. Rajan, D.K.; Mohan, K.; Rajarajeswaran, J.; Divya, D.; Thanigaivel, S.; Zhang, S. Toxic effects of organophosphate pesticide monocrotophos in aquatic organisms: A review of challenges, regulations and future perspectives. Environ. Res. 2024, 244, 117947. [Google Scholar] [CrossRef] [PubMed]
  7. Vickneswaran, M.; Carolan, J.C.; Saunders, M.; White, B. Establishing the extent of pesticide contamination in Irish agricultural soils. Heliyon 2023, 9, e19416. [Google Scholar] [CrossRef] [PubMed]
  8. Robinson, C.; Portier, C.J.; Čavoški, A.; Mesnage, R.; Roger, A.; Clausing, P.; Whaley, P.; Muilerman, H.; Lyssimachou, A. Achieving a high level of protection from pesticides in Europe: Problems with the current risk assessment procedure and solutions. Eur. J. Risk Regul. 2020, 11, 450–480. [Google Scholar] [CrossRef]
  9. De Souza, R.M.; Seibert, D.; Quesada, H.B.; Bassetti, F.; Fagundes-Klen, M.R.; Bergamasco, R. Occurrence, impacts and general aspects of pesticides in surface water: A review. Process Saf. Environ. Prot. 2020, 135, 22–37. [Google Scholar] [CrossRef]
  10. Kvakkestad, V.; Sundbye, A.; Gwynn, R.; Klingen, I. Authorization of microbial plant protection products in the Scandinavian countries: A comparative analysis. Environ. Sci. Policy 2020, 106, 115–124. [Google Scholar] [CrossRef]
  11. Cui, J.; Tian, S.; Gu, Y.; Wu, X.; Wang, L.; Wang, J.; Chen, X.; Meng, Z. Toxicity effects of pesticides based on zebrafish (Danio rerio) models: Advances and perspectives. Chemosphere 2023, 340, 139825. [Google Scholar] [CrossRef]
  12. Tan, H.; Zhang, H.; Wu, C.; Wang, C.; Li, Q. Pesticides in surface waters of tropical river basins draining areas with rice-vegetable rotations in Hainan, China: Occurrence, relation to environmental factors, and risk assessment. Environ. Pollut. 2021, 283, 117100. [Google Scholar] [CrossRef]
  13. Zuo, W.; Zhao, Y.; Qi, P.; Zhang, C.; Zhao, X.; Wu, S.; An, X.; Liu, X.; Cheng, X.; Yu, Y.; et al. Current-use pesticides monitoring and ecological risk assessment in vegetable soils at the provincial scale. Environ. Res. 2024, 246, 118023. [Google Scholar] [CrossRef] [PubMed]
  14. Riedo, J.; Wachter, D.; Gubler, A.; Wettstein, F.E.; Meuli, R.G.; Bucheli, T.D. Pesticide residues in agricultural soils in light of their on-farm application history. Environ. Pollut. 2023, 331, 121892. [Google Scholar] [CrossRef]
  15. Khezami, F.; Gomez-Navarro, O.; Barbieri, M.V.; Khiari, N.; Chkirbene, A.; Chiron, S.; Khadhar, S.; Perez, S. Occurrence of contaminants of emerging concern and pesticides and relative risk assessment in Tunisian groundwater. Sci. Total Environ. 2024, 906, 167319. [Google Scholar] [CrossRef] [PubMed]
  16. Pérez-Indoval, R.; Rodrigo-Ilarri, J.; Cassiraga, E.; Rodrigo-Clavero, M. PWC-based evaluation of groundwater pesticide pollution in the Júcar. Sci. Total Environ. 2022, 847, 157386. [Google Scholar] [CrossRef]
  17. Dugan, S.T.; Muhammetoglu, A.; Uslu, A. A combined approach for the estimation of groundwater leaching potential and environmental impacts of pesticides for agricultural lands. Sci. Total Environ. 2023, 901, 165892. [Google Scholar] [CrossRef]
  18. Directive 2009/128/EC of the European Parliament and of the Council of 21 October 2009 Establishing a Framework for Community Action to Achieve the Sustainable Use of Pesticides (SUD). European Commission, Communication from the Commission: The European Green Deal (COM No. 640). Available online: https://www.europarl.europa.eu/RegData/etudes/STUD/2018/627113/EPRS_STU(2018)627113_EN.pdf (accessed on 15 December 2023).
  19. Lykogianni, M.; Bempelou, E.; Karamaouna, F.; Aliferis, K.A. Do pesticides promote or hinder sustainability in agriculture? The challenge of sustainable use of pesticides in modern agriculture. Sci. Total Environ. 2021, 795, 148625. [Google Scholar] [CrossRef]
  20. EU Green Deal, Farm to Fork. Farm to Fork Strategy for a Fair, Healthy and Environmentally-Friendly Food System; COM No. 381; EU Green Deal, European Union: Brussels, Belgium, 2020; Available online: https://food.ec.europa.eu/system/files/2020-05/f2f_action-plan_2020_strategy-info_en.pdf (accessed on 3 July 2023).
  21. EC Food Safety. Pesticides. 2023. Available online: https://food.ec.europa.eu/plants/pesticides_en (accessed on 3 July 2023).
  22. Maris, G.; Flouros, F. The Green Deal, National energy and climate plans in Europe: Member States’ compliance and strategies. Adm. Sci. 2021, 11, 75. [Google Scholar] [CrossRef]
  23. EU Trends. 2023. Available online: https://food.ec.europa.eu/plants/pesticides/sustainable-use-pesticides/farm-fork-targets-progress/eu-trends_en (accessed on 3 August 2023).
  24. FAOSTATPesticides Use 2023 in: F.A.O. Rome. Available online: http://www.fao.org/faostat/en/#data/RP (accessed on 3 November 2023).
  25. FAO. Country Profiles, Türkiye, 2021 Data. Available online: https://www.fao.org/countryprofiles/index/en/?iso3=TUR (accessed on 3 November 2023).
  26. Ozercan, B.; Taşçı, R. Investigation of Pesticide Use in Türkiye in Terms of Provinces, Regions and Pesticide Groups. Agric. Eng. 2022, 375, 75–88. (In Turkish) [Google Scholar]
  27. TURKSTAT National Crop Production Statistics. 2022. Available online: https://data.tuik.gov.tr/Kategori/GetKategori?p=tarim-111&dil=1 (accessed on 20 September 2023).
  28. Zou, Y.; Cheng, Q.; Jin, H.; Pu, X. Evaluation of green agricultural development and its influencing factors under the framework of sustainable development goals: Case study of Lincang City, an underdeveloped mountainous region of China. Sustainability 2023, 15, 11918. [Google Scholar] [CrossRef]
  29. Silva, V.; Yang, X.; Fleskens, L.; Ritsema, C.; Geissen, V. Environmental and human health at risk–scenarios to achieve the Farm to Fork 50% pesticide reduction goals. Environ. Int. 2022, 165, 107296. [Google Scholar] [CrossRef]
  30. Helepciuc, F.E.; Todor, A. Evaluating the effectiveness of the EU’s approach to the sustainable use of pesticides. PLoS ONE 2021, 16, e0256719. [Google Scholar] [CrossRef] [PubMed]
  31. United Nations (UN). Sustainable Development Goals. 2022. Available online: https://unfoundation.org/what-we-do/issues/sustainable-development-goals/?gclid¼Cj0KCQiAybaRBhDtARIsAIEG3kkW29u5_zyJ3IUK2q742KNw373HdI3Gk9TdDkN3qAGXHydRq56H0OMaAlQyEALw_wcB (accessed on 23 August 2023).
  32. The 20 Largest Cities in the World: 2021 Edition. Available online: www.archdaily.com (accessed on 23 September 2023).
  33. TURKSTAT Population Data for 2021. Available online: https://data.tuik.gov.tr/Bulten/Index?p=Adrese-Dayali-Nufus-Kayit-Sistemi-Sonuclari-2021-45500 (accessed on 23 August 2023).
  34. Project on Digitizing of Water Resources; Preparation of Monitoring Programs by Performing Typology, Water Bodies and Risk Assessment Studies, DGWM, 2021, General Directorate of Water Management, Ministry of Agriculture and Forestry of Republic of Türkiye. Available online: https://usbs.tarimorman.gov.tr/portal/en/turkish-national-water-information-system--trnwis-phase-iii-123-news (accessed on 5 December 2023).
  35. Marmara Basin (Southern Section) Master Plan, General Directorate of State Hydraulic Works (DSI), 2018, Ankara. Available online: https://www.yukselproje.com.tr/en/projects/marmara-basin-master-plan. (accessed on 10 December 2023).
  36. Guidance Document. Common Implementation Strategy for the Water framework Directive (2000/60/EC) Guidance Document No 2, Identification of Water Bodies, Produced by Working Group on Water Bodies. 2003. Available online: https://circabc.europa.eu/sd/a/655e3e31-3b5d-4053-be19-15bd22b15ba9/Guidance%20No%202%20-%20Identification%20of%20water%20bodies.pdf (accessed on 23 September 2023).
  37. EUROSTAT Methodologies and Working Papers, 2008. A Common Methodology for the Collection of Pesticide Usage Statistics within Agriculture and Horticulture. ISSN 1977-0375. Available online: https://ec.europa.eu/eurostat/documents/3859598/5902633/KS-RA-08-010-EN.PDF (accessed on 30 November 2023).
  38. National Plant Protection Products (PPP) Database. 2023. Available online: https://bku.tarimorman.gov.tr/ (accessed on 20 October 2023).
  39. National Regulation on Regulation on Licensing of Plant Protection Products, Official Gazette Dated 12.09.2009 and Numbered: 27347. Available online: https://www.resmigazete.gov.tr/eskiler/2009/09/20090912-4.htm (accessed on 30 November 2023). (In Turkish)
  40. Ayyıldız, N.; Emekçi, M.; Ferizli, A.G. An historical overview of pesticides authorization in Turkey. Turk. Entomol. Bull. 2018, 8, 35–50. (In Turkish) [Google Scholar]
  41. EC. Farm to Fork Strategy. 2022. Available online: https://ec.europa.eu/food/horizontaltopics/farm-fork-strategy_en. (accessed on 20 October 2023).
  42. EC. EU Pesticides Database. 2022. Available online: https://ec.europa.eu/food/plants/pesticides/eu-pesticides-database_en. (accessed on 20 October 2023).
  43. EC. Sustainable Use of Pesticides. 2022. Available online: https://ec.europa.eu/food/plants/pesticides/sustainable-use-pesticides_en. (accessed on 20 October 2023).
  44. Proposal for a Regulation of the European Parliament and of the Council on the Sustainable Use of Plant Protection Products and Amending, Regulation (EU) 2021/2115. Explanatory Memorandum, Brussels, 22.6.2022 COM, 2022, 305 Final 2022/0196 (COD). Available online: https://eur-lex.europa.eu/legal-content/EN/TXT/PDF/?uri=CELEX:52022PC0305 (accessed on 15 December 2023).
  45. EUROSTAT. Methodology for Calculating Harmonised Risk Indicators for Pesticides under Directive 2009/128/EC, 2021 Edition, Manuals and Guidelines. Available online: https://ec.europa.eu/eurostat/documents/3859598/12727554/KS-GQ-21-008-EN.pdf/d3b02348-3277-a1cd-e7cf-e8ae4367257d?t=1619684530876 (accessed on 20 October 2023).
  46. Coelhan, M.; Strohmeier, J.; Barlas, H. Organochlorine levels in edible fish from the Marmara Sea, Turkey. Environ. Int. 2006, 32, 775–780. [Google Scholar] [CrossRef] [PubMed]
  47. Oğuz, B. Effect of Pesticide Accumulation on Growth in Blue-Green Algae, Program of Basic Sciences of Fisheries. Master’s Thesis, Graduate School of Natural and Applied Sciences, İstanbul University, Istanbul, Türkiye, June 2009. Available online: http://nek.istanbul.edu.tr:4444/ekos/TEZ/44957.pdf (accessed on 20 December 2023). (In Turkish).
  48. Yıldırım, İ.; Özcan, H. Determination of pesticide residues in water and soil resources of Troia (Troy). Fresenius Environ. Bull. 2007, 16, 63–70. [Google Scholar]
  49. Kaya, H. Investigation of Pesticide and Domestic Pollution in Atikhisar Dam and Sarıçay. Master’s Thesis, Department of Fisheries, Institute of Science and Technology, Çanakkale Onsekiz Mart University, Çanakkale, Türkiye, 2007. Available online: https://tez.yok.gov.tr/UlusalTezMerkezi/tezDetay.jsp?id=JX3kiqD1btgtEvuo-xpiBw&no=nuZwCFIoMJ0inAOsVXHtKw (accessed on 20 December 2023). (In Turkish).
  50. Güzel, B.; Canlı, O.; Aslan, E. Spatial distribution, source identification and ecological risk assessment of POPs and heavy metals in lake sediments of Istanbul, Turkey. Mar. Pollut. Bull. 2022, 175, 113172. [Google Scholar] [CrossRef] [PubMed]
  51. Top, Z.N.; Tiryaki, O.; Polat, B. Monitoring and environmental risk assessment of agricultural fungicide and insecticides in water, sediment from Kumkale Plain, Çanakkale-Turkey. J. Environ. Sci. Health Part B 2023, 58, 304–315. [Google Scholar] [CrossRef] [PubMed]
  52. Polat, B.; Tiryaki, O. Determination of insecticide residues in soils from Troia agricultural fields by the QuEChERS method. Turk. J. Entomol. 2022, 46, 251–261. [Google Scholar] [CrossRef]
  53. Technical Assistance for Assessment of Drinking Water Resources and Treatment Plants in Turkey (2016–2017). General Directorate of Water Management, Ministry of Agriculture and Forestry of Republic of Türkiye. Available online: https://www.stantec.com/tr/projects/drinking-water-resources-and-treatment-plants-assessment (accessed on 10 December 2023). (In Turkish).
  54. National Regulation on Surface Water Quality, Official Gazette dated 30.11.2012 and Numbered: 28483. Final Amendment on 01.02.2023 with Reference no 32091. Available online: https://www.mevzuat.gov.tr/File/GeneratePdf?mevzuatNo=19392&mevzuatTur=KurumVeKurulusYonetmeligi&mevzuatTertip=5 (accessed on 10 December 2023). (In Turkish)
  55. Water Quality Monitoring and DSI Capacity Development project in the Marmara Basin, State Hydraulic Works (DSI), Up-to-Date Monitoring Programme Outputs (2020–2021), Ministry of Agriculture and Forestry of Republic of Türkiye. Available online: https://www.tarimorman.gov.tr/SYGM/Belgeler/havza%20tan%C4%B1t%C4%B1m%2023.03.2023/t%C3%BCrk%C3%A7e/Marmara%20Havzas%C4%B1%20Tan%C4%B1t%C4%B1m.pdf (accessed on 10 December 2023). (In Turkish)
  56. Bieroza, M.Z.; Bol, R.; Glendell, M. What is the deal with the Green Deal: Will the new strategy help to improve European freshwater quality beyond the Water Framework Directive? Sci. Total Environ. 2021, 791, 148080. [Google Scholar] [CrossRef]
  57. Rice, P.J.; Rice, P.J.; Arthur, E.L.; Barefoot, A.C. Advances in Pesticide Environmental Fate and Exposure Assessments. ACS Agric. Sci. Technol. 2007, 55, 5367–5376. [Google Scholar] [CrossRef]
  58. Gao, J.; Zhou, H.; Pan, G.; Wang, J.; Chen, B. Factors Influencing the Persistence of Organochlorine Pesticides in Surface Soil from the Region around the Hongze Lake, China. Sci. Total Environ. 2013, 443, 7–13. [Google Scholar] [CrossRef]
  59. Carazo-Rojas, E.; Pérez-Rojas, G.; Pérez-Villanueva, M.; Chinchilla-Soto, C.; Chin-Pampillo, J.S.; Aguilar-Mora, P.; Alpízar-Marín, M.; Masís-Mora, M.; Rodríguez-Rodríguez, C.E.; Vryzas, Z. Pesticide monitoring and ecotoxicological risk assessment in surface water bodies and sediments of a tropical agro-ecosystem. Environ. Pollut. 2018, 241, 800–809. [Google Scholar] [CrossRef] [PubMed]
  60. Van Meter, K.J.; Basu, N.B. Time lags in watershed-scale nutrient transport: An exploration of dominant controls. Environ. Res. Lett. 2017, 12, 084017. [Google Scholar] [CrossRef]
  61. Bol, R.; Gruau, G.; Mellander, P.; Dupas, R.; Bechmann, M.; Skarbøvik, E.; Bieroza, M.; Djodjic, F.; Glendell, M.; Jordan, P.; et al. Challenges of reducing phosphorus-based water eutrophication in the agricultural landscapes of Northwest Europe. Front. Mar. Sci. 2018, 5, 276. [Google Scholar] [CrossRef]
  62. Haygarth, P.M.; Jarvie, H.P.; Powers, S.M.; Sharpley, A.N.; Elser, J.J.; Shen, J.; Peterson, H.M.; Chan, N.-I.; Howden, N.J.K.; Burt, T.; et al. Sustainable phosphorus management and the need for a long-term perspective: The legacy hypothesis. Environ. Sci. Technol. 2014, 48, 8417–8419. [Google Scholar] [CrossRef]
  63. Powers, S.M.; Bruulsema, T.W.; Burt, T.P.; Chan, N.I.; Elser, J.J.; Haygarth, P.M.; Howden, N.J.K.; Jarvie, H.P.; Lyu, Y.; Peterson, H.M.; et al. Long-term accumulation and transport of anthropogenic phosphorus in three river basins. Nat. Geosci. 2016, 9, 353–356. [Google Scholar] [CrossRef]
  64. Weisner, O.; Arle, J.; Liebmann, L.; Link, M.; Schafer, R.B.; Schneeweiss, A.; Schreiner, V.C.; Vormeier, P.; Liess, M. Three reasons why the Water Framework Directive (WFD) fails to identify pesticide risks. Water Res. 2022, 208, 117848. [Google Scholar] [CrossRef] [PubMed]
Figure 1. (a) Geographical location of the basin and residential areas, (b) agricultural areas and WBs of the basin.
Sustainability 16 02086 g001
Figure 2. Data inventory scheme for calculation of pesticide AS use.
Sustainability 16 02086 g002
Figure 3. AS data supply status in the Marmara Basin.
Sustainability 16 02086 g003
Figure 4. Pesticide use in WBs of the basin.
Sustainability 16 02086 g004
Figure 5. Types and number of ASs used in the basin.
Sustainability 16 02086 g005
Figure 6. Prioritized ASs in the basin (based on 2021 AS data).
Sustainability 16 02086 g006
Table 1. Sample calculation for three provinces.
ProvinceDistrictCrop TypePesticidenA
(ha)
D
(g/ha)
F
(%)
ASused (kg/year)Data Source *
BilecikX1PeachEmamectin Benzoate 434.720000.056.94FS
BilecikX1Kidney BeanMancozeb345.710,0000.81096.8FS
BilecikX1AppleThiophanate Methyl23.730000.715.4FS
EdirneY1Wheat-BarleyEpoxiconazole 14000200018000FS
EdirneY2PaddyTrifloxystrobin 18002000.580FS
BursaZ1GrapeEmamectin Benzoate32100016TD
ÇanakkaleZ1FigDeltamethrin 1131250116.3TD
ÇanakkaleZ2AppleCypermethrin 237.215001111.6TD
ÇanakkaleZ3PearCypermethrin22264.5150016793.5TD
* FS: field study data; TD: TUIK data.
Table 2. Prohibited ASs detected as used.
Active Substances (ASs)CAS No.Date of Prohibition
Chlorothalonil1897-45-631 December 2021
Chlorpyrifos Methyl5598-13-031 December 2021
Cyfluthrin68359-37-530 September 2021
Fenpropimorph67564-91-431 December 2020
Flumetsulam98967-40-931 December 2011
Flusilazole85509-19-930 June 2022
Mancozeb8018-01-731 December 2022
Metolachlor51218-45-231 August 2011
Molinate2212-67-130 September 2021
Novaluron116714-46-630 June 2022
Oxadiazon19666-30-931 December 2022
Propiconazole60207-90-131 December 2020
Tepraloxydim149979-41-930 June 2022
Thiacloprid111988-49-930 June 2022
Triasulfuron82097-50-531 December 2021
Table 3. Numbers and amount of ASs used in the Marmara Basin according to EU Risk categorization.
EU ClassificationNumber of ASs UsedAmount of Annual ASs Used (kg)Number of WBs in Which ASs Are Used
GroupCategory
Group 1A-
B-
Group 2C254727
D113517,199197
Group 3E38473,810223
F539,75444
Group 4G1512,47327
Total1731,043,783
Table 4. Assessment criteria and pesticide pressure.
Assessment Criteria of Pesticide PressureFound to Meet the Criteria
Number of ASsNumber of WBs Where They Are Used
Pesticides used at a rate of >10 tons/year29276
Prohibited pesticides in Türkiye1598
Hazardous groups according to the EU Risk CategorizationGroup 3F557
Group 4G1252
ASs used that are on the priority substance list2203
Total52276
Disclaimer/Publisher’s Note: The statements, opinions and data contained in all publications are solely those of the individual author(s) and contributor(s) and not of MDPI and/or the editor(s). MDPI and/or the editor(s) disclaim responsibility for any injury to people or property resulting from any ideas, methods, instructions or products referred to in the content.

