Review

Building Stock Models for Embodied Carbon Emissions—A Review of a Nascent Field

1
School of Architecture, University of Notre Dame, Notre Dame, IN 46556, USA
2
Department of Civil and Environmental Engineering and Earth Sciences, College of Engineering, University of Notre Dame, Notre Dame, IN 46556, USA
*
Author to whom correspondence should be addressed.
Sustainability 2024, 16(5), 2089; https://doi.org/10.3390/su16052089
Submission received: 20 January 2024 / Revised: 10 February 2024 / Accepted: 29 February 2024 / Published: 2 March 2024
(This article belongs to the Special Issue Carbon Economics: Pathways towards Carbon Neutrality)

Abstract

:
Building stock modeling emerges as a critical tool in the strategic reduction of embodied carbon emissions, which is pivotal in reshaping the evolving construction sector. This review provides an overall view of modern methodologies in building stock modeling, homing in on the nuances of embodied carbon analysis in construction. Examining 23 seminal papers, our study delineates two primary modeling paradigms—top-down and bottom-up—each further compartmentalized into five innovative methods. This study points out the challenges of data scarcity and computational demands, advocating for methodological advancements that promise to refine the precision of building stock models. A groundbreaking trend in recent research is the incorporation of machine learning algorithms, which have demonstrated remarkable capacity, improving stock classification accuracy by 25% and urban material quantification by 40%. Furthermore, the application of remote sensing has revolutionized data acquisition, enhancing data richness by a factor of five. This review offers a critical examination of current practices and charts a course toward an environmentally prudent future. It underscores the transformative impact of building stock modeling in driving ecological stewardship in the construction industry, positioning it as a cornerstone in the quest for sustainability and its significant contribution toward the grand vision of an eco-efficient built environment.

1. Introduction

In the coming decade, to achieve carbon neutrality by 2030, a substantial 70% of total new building-related carbon emissions will originate from material production, transport, and construction, which are components of embodied carbon [1]. Meanwhile, at present, the required quantities of several metals and minerals that are commonly used in the built environment have exceeded available reserves in their natural state. Harnessing an existing building stock as a resource for future city construction could serve a dual purpose: first, it would offer valuable local materials; second, utilizing the embodied carbon stock could potentially help mitigate up to 50% of emissions within the industry [1]. The first step in using an existing building stock as a vast reserve of embodied carbon (materials and building components) is to adopt a comprehensive and quantitative approach to assessing embodied carbon in the building stock and predicting future changes in the building stock. This comprehensive assessment of existing building stock can provide a foundation for making informed decisions to achieve carbon neutrality [2].
Traditionally, building stock models have played a crucial role in analyzing the energy efficiency and operational-energy-related greenhouse gas emissions of buildings and infrastructure [3]. These models serve versatile purposes: target verification, feasibility assessments, strategic and operative energy planning, and impact analyses [4]. They can be applied to both existing building stocks and future scenarios, making them instrumental in evaluating the implications of various development options, such as renovation, new construction, and demolition. While building stock models have primarily been applied to operational energy modeling, particularly in the residential and commercial sectors, extensive research has led to the development of multiple methods and techniques for examining, understanding, and predicting operational energy consumption [5,6,7]. However, it is worth noting that the focus of building stock model research has primarily revolved around its application in operational energy analysis. With the relatively recent emergence of embodied energy and carbon assessments as a distinct field of study, researchers have adapted existing building stock models initially designed for operational energy analysis to address this evolving domain.
In recent years, many integrated building stock models have emerged to assess embodied carbon emissions within built environments [7,8]. These models exhibit significant variations in terms of data sources, input processes, calculation methods, aggregation levels, and model accuracy and resolution. Moreover, they encompass a wide range of social–technical assumptions related to building stock dynamics, influencing the types of results and scenarios they can effectively evaluate [9]. However, despite the growing importance of embodied carbon assessments, there has been a notable absence of a comprehensive review focusing on building stock model approaches, methods, advantages, and disadvantages in this context. This article aims to fill this gap by thoroughly reviewing building stock models employed in embodied carbon studies. This article is organized into several key sections. First, it presents a detailed examination of two distinct building stock model approaches, bottom-up and top-down, both geared toward quantifying and mapping embodied carbon within large-scale building stocks (Section 3). It further delves into a discussion of the subtypes within each category and the strengths and weaknesses of different model approaches, with a particular focus on two critical aspects: data sources and model accuracy and efficiency (Section 4). In the subsequent section, emerging techniques are explored with respect to challenges and future trends in building stock models, emphasizing their integration with machine learning algorithms. Additionally, the limitations and contributions of this review (Section 5) are outlined. Finally, this article discusses next steps and the utility of building stock models for policymakers (Section 6).

2. Methodology

This review exclusively considered papers that addressed building stocks on a broad scale, encompassing urban to transnational levels, and offered assessments related to embodied carbon and/or environmental impact. The literature review was carried out using scientific papers sourced from both Web of Science and Google Scholar. Our search criteria included the terms “building stock model”, “environmental impact”, “embodied carbon”, and “embodied energy”. A series of filtering steps were implemented in an initial pool of over 100 papers to narrow our focus to papers that concentrated on large-scale modeling while excluding review articles. Ultimately, a curated set of 23 representative papers were selected for a comprehensive comparative analysis. This selection was based on criteria such as study comprehensiveness, the provision of results, and the type of paper. The chosen studies span the past fifteen years, covering 2008 to 2023. You can refer to Table 1 for a list of these selected papers.

3. Overview of Results

As illustrated in Figure 1, the earliest publication was found in 2009; since then, there has been a steady increase in the number of the research publications on this topic.
Based on the principles and methods of modeling, building stock models can be divided into two categories: the top-down method and the bottom-up method [9,10,11]. Top-down approaches involve summarizing entire building stocks using macroeconomic or other statistical data (e.g., material flow) at an aggregated level for a given geographic region (e.g., city or country) and time. The aggregated building data can then be divided into sections (e.g., single-family building sections) according to building’s function or spatial proximity [8]. In contrast, bottom-up approaches assess the performance of specific components within a building stock, such as individual buildings, particular materials, or technologies, and then extend these findings to the stock level [12]. By utilizing disaggregation, a bottom-up approach can offer significantly greater resolution in representing the specific conditions of individual buildings, resulting in a more accurate assessment of embodied carbon.
As illustrated in Figure 2, the top-down approach can be further divided into computationally based and statistically based models. Both approaches rely on statistical correlations between historical aggregated data and socio-economic factors, such as population or economic growth, to illustrate links between the building sector and carbon emissions [8]. Both models can predict a building stock’s macroeconomic performance and embodied carbon’s impact on different development scenarios over time. The National Energy System (NEMS) (EIA 2009) is one of the most well-known top-down statistically based models. The distinction of the computationally based model its use and integration of computational power. The recent development of machine learning techniques has increased interest in computationally based models (refer to Section 5.1 for more information on machine learning techniques).
Bottom-up approaches initially compute the embodied carbon and environmental impacts of individual buildings or clusters of buildings. Subsequently, these representative models are employed to project regional or national embodied carbon and environmental impact through various weighting methodologies (e.g., by using the percentage of floor space, building types, etc.). The bottom-up approach can be divided into physics-based, statistically based, and computationally based models (refer to Figure 2). The main difference between top-down and bottom-up statistically based models are their data sources, and the same is true for the differences between top-down and bottom-up computationally based models (refer to Section 4). Physics-based models use the archetype approach and the building-by-building approach.
Table 1 lists the identified studies by model approach and method. The majority of the literature, 17 out of 23 studies, employed bottom-up approaches. Among these bottom-up approaches, the physics-based model was the most prevalent, with six studies using it, followed by statistically based models (five studies), and computationally based models (four studies). Two studies utilized hybrid methods combining physics-based and statistically based approaches.

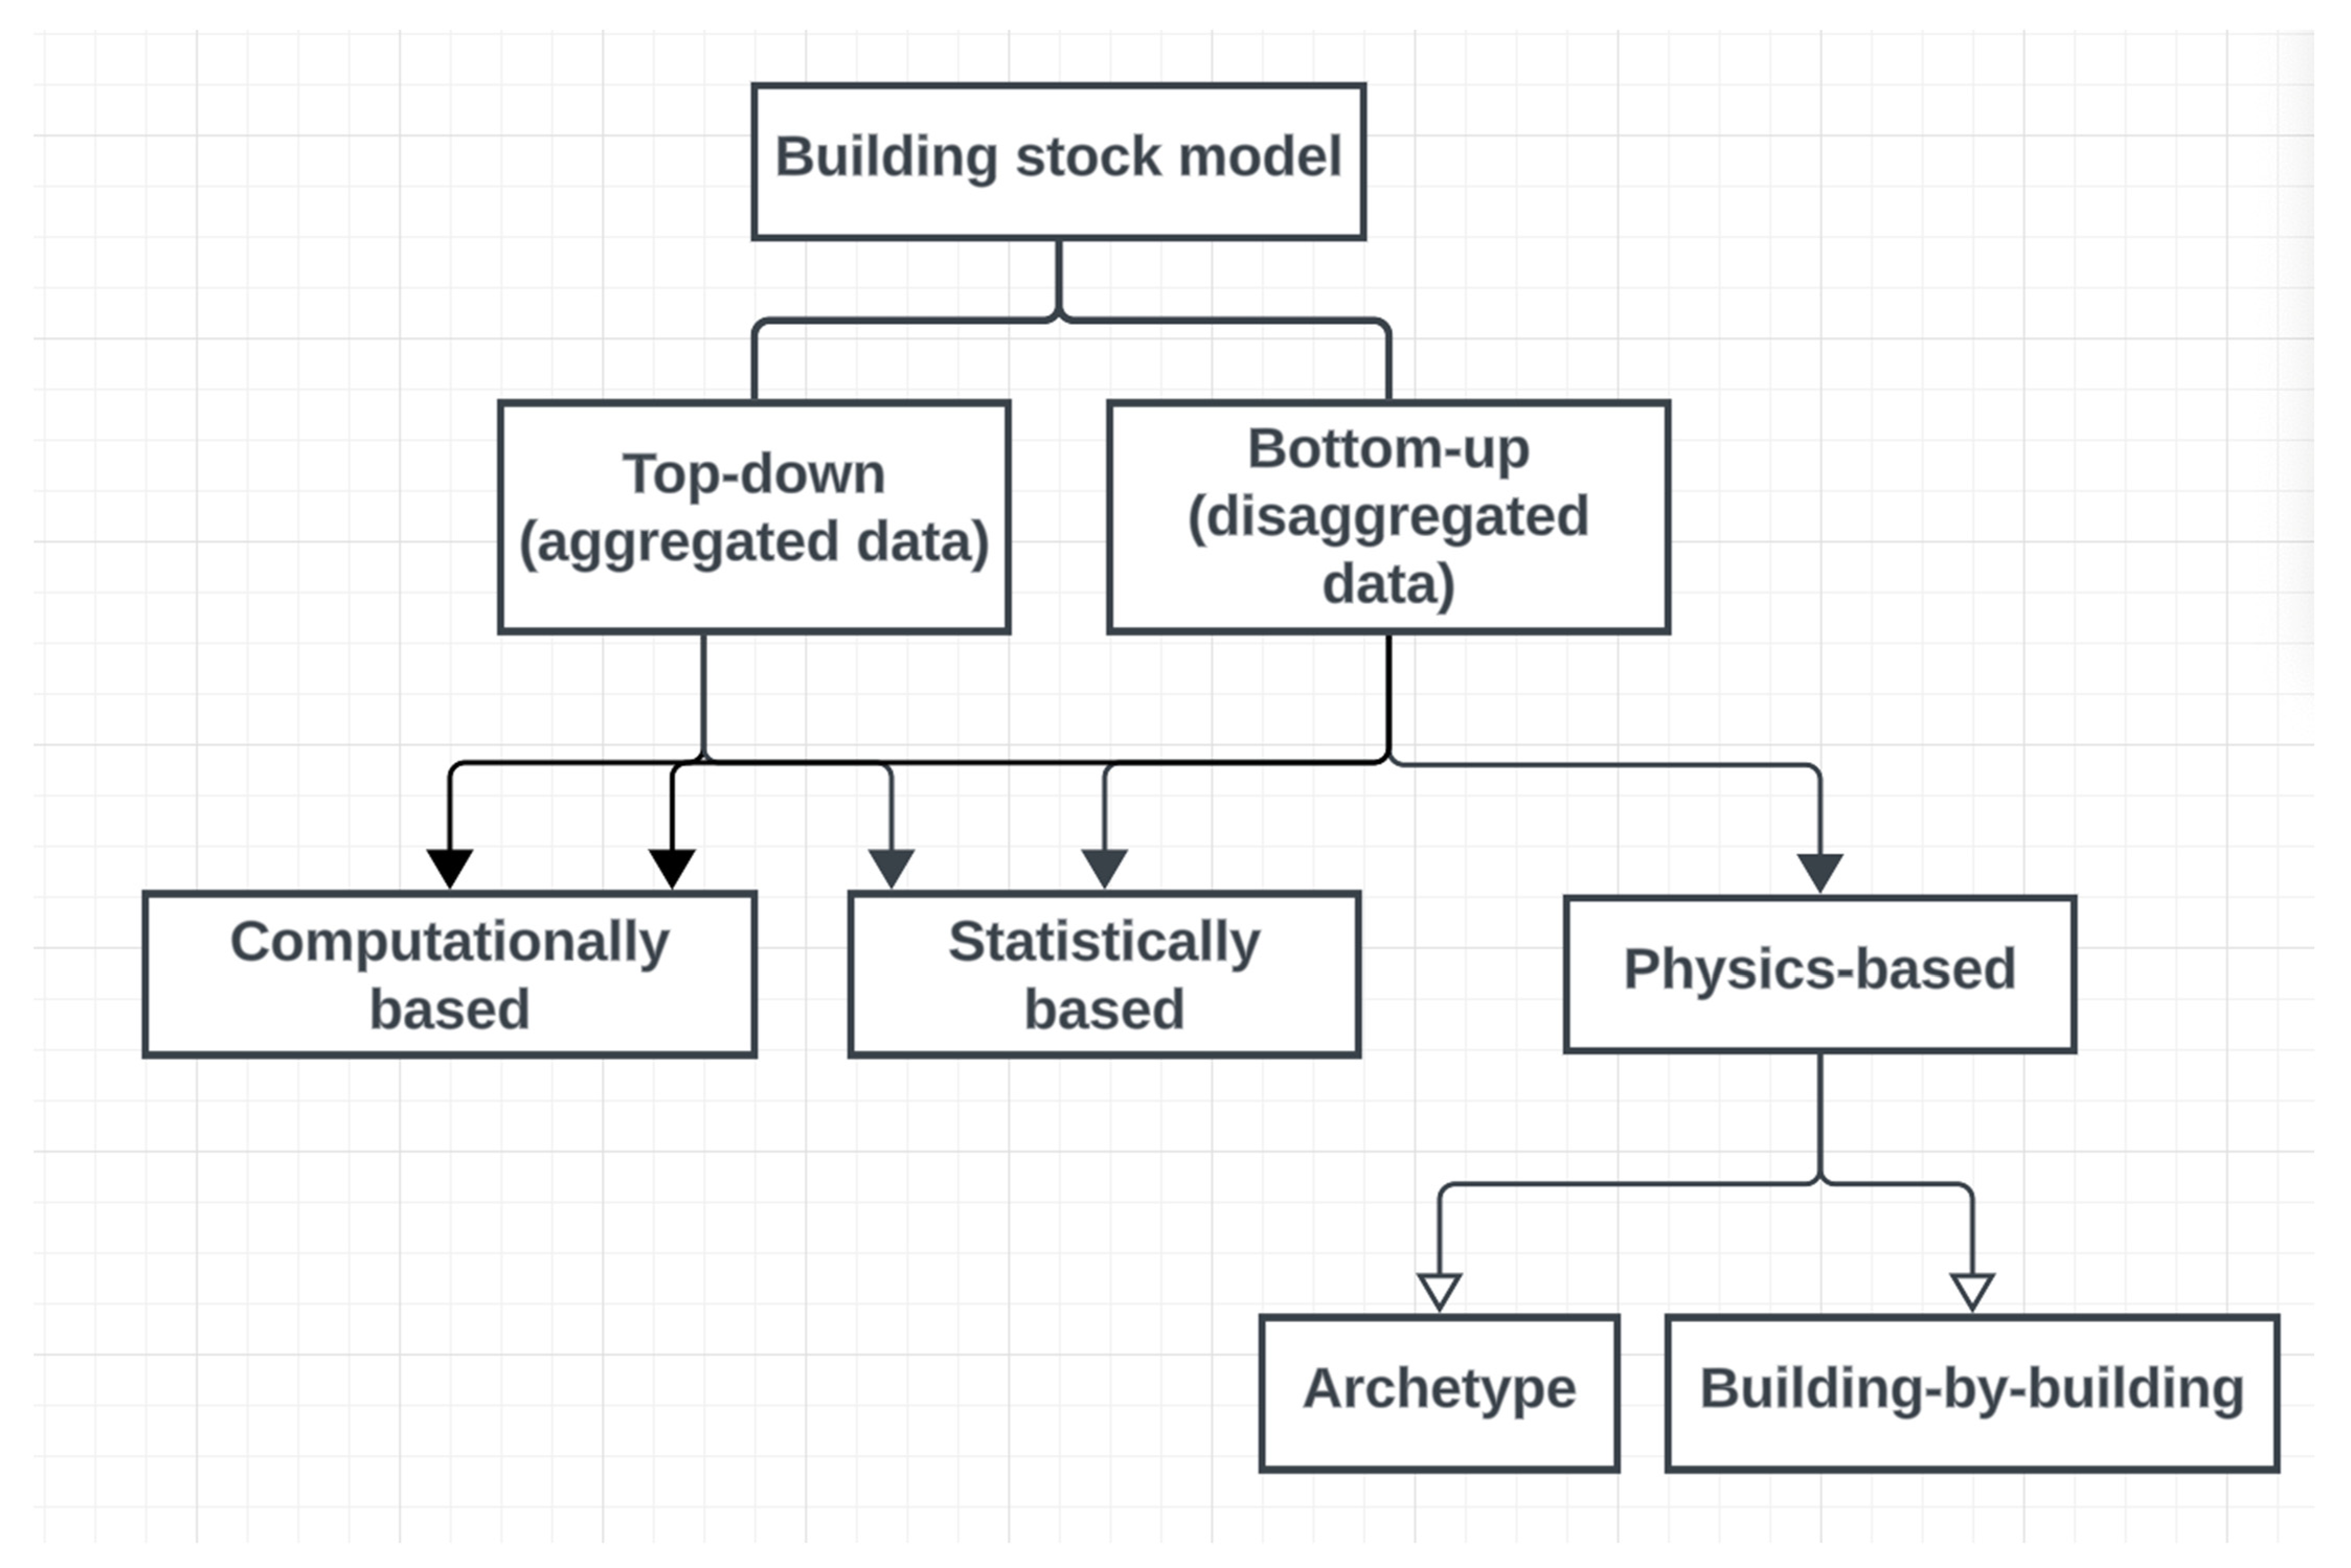
3.1. Top-Down Approach

The top-down approach utilizes the life cycle analysis input–output method to explore the interaction between material flow and the broader economy. This approach involves considering material intensity, which measures the amount of construction materials required per unit, typically expressed as kg per gross floor space (kg/m2) or per gross building volume (kg/m3) [13]. The analysis focuses on common building materials such as steel, concrete, wood, brick, and masonry [14]. Material flow analysis, also known as material flow accounting, is employed to estimate the movement of building materials within a defined system across various spatial and temporal scales, particularly in the construction materials domain, with a specific focus on buildings [15].

3.1.1. Statistically Based Models

The earliest publication employing a top-down statistical model to examine rural and urban housing dynamics in China was an early publication in which a research team comprising members from China, the Netherlands, and Norway expanded a pre-existing dynamic material flow analysis model [16]. This enhanced model was created to analyze the demand for iron and steel and assess the availability of scrap from the housing sector, encompassing a time frame from 1900 to 2100. The outcomes of this analysis indicated a marked reduction in steel demand for new housing construction in the ensuing decades (post 2010), attributed to the anticipated increase in the lifespan of residential buildings. However, this trend also posed challenges in terms of excess steel production capacity. Subsequently, other researchers adopted the same method and modeling approach developed in this early study. In other cases, researchers estimated the material demand and environmental impact of buildings in China spanning the years 1950 to 2050 using this method, and the results also revealed a substantial decline in material demand and carbon emissions stemming from the construction of new buildings in the forthcoming years [17]. Nevertheless, contrary to these predictions, new housing construction in China continued its growth trajectory post 2010, consequently leading to increased building material demand and associated carbon emissions [18]. These disparities underscore the embedded uncertainties and inaccuracies within results generated by the top-down statistical model, a topic to be explored more deeply in Section 4.
Around the same time, Ref. [14] created a new top-down framework to assess the embodied carbon of a building stock and the operational carbon of a building stock along with transportation carbon; together, those two comprise the in-use stocks defined in the European Standard Accounts [19]. To illustrate how the dimensions, lifespan, and physical characteristics of in-use stocks influence energy and material flow, and to validate the suggested framework, the research team conducted three case studies at different scales and with different focuses. The first case was passenger car production in China, and the third case investigated direct emissions from coking and electricity generation associated with the global steel industry. The second case examined embodied carbon emissions from building construction, operation, and the demolition of a residential building stock in Norway. However, this article did not specify its data source or calculation techniques [14].
Research on this topic experienced a gap until 2020, when multiple research teams renewed their focus. For instance, Zhou and colleagues introduced a probabilistic model aimed at predicting the trajectory of embodied energy in a residential building stock in China [20]. This model incorporates five key components: forecasting new construction, defining material intensity distributions, estimating energy intensity trajectories, accounting for building construction and demolition, and factoring in material transportation. To handle uncertainties in these inputs, Monte Carlo simulations were employed, resulting in a probabilistic distribution of annual embodied energy for new construction. The study’s findings suggest that the embodied energy from the building stock is expected to peak around 2027 [20]. The accuracy of this prediction is yet to be verified by actual data.
It is worth noting that the research team emphasized a significant limitation in the realm of evidence-based policymaking: the need for more comprehensive data. They stressed the importance of moving beyond existing statistics, which primarily focus on annual new construction. Instead, they strongly advocated for expanding data collection efforts to encompass the overall size of a city’s building stock. By establishing a comprehensive and transparent database, decision makers can access essential evidence to formulate effective energy and climate policies related to buildings. They certainly correctly pointed out that the limitations of their top-down statistically based model were directly related to the aggregated data and their source [20].

3.1.2. Computationally Based Models

Computationally based models also use aggregated data and material flow analyses to estimate embodied carbon emissions. In contrast to statistically based models, computationally based models use algorithms to process data and draw conclusions; computationally based models rely on mathematical equations, simulations, and algorithms to simulate complex systems or processes rather than solely relying on mathematical processes as statistically based models do. Because of their computational power, computationally based models may use limited empirical data for validation or calibration. In contrast, statistically based models heavily rely on observed (historical) data for analysis and prediction. Since the computationally based method is very new, only one publication was identified. Arhaet and team estimated the embodied carbon emissions of building structural systems in the United States [13]. They built two computational models: building stock and material intensity models. First, the dynamic stock-driven model was fine-tuned based on a previous model created by the same team to estimate future floor spaces [21]. It was then inserted into a material intensity model for each type of structural system to compute the building stock level flow of structural materials and embodied carbon emissions. The stock-driven model uses the open dynamic material system model, a framework for modeling stocks and flows from an industrial ecology perspective [22]. Based on the analysis results, they suggested extending the lifespan of existing buildings and reducing the per-capita floor space demand to decrease the embodied carbon from building stocks.

3.2. Bottom-Up Approach

Bottom-up models are typically used in the engineering field and are based on representative buildings. An individual representative building’s performance is assessed and then extrapolated to represent an entire building stock using weighting coefficients. For instance, in previous studies, a representational single-family house was used to present an entire segment of single-family housing stock in the United States [23], China [24] and Australia [25]. Data inputted into bottom-up models include building footprints, building characteristics (e.g., height, construction type, etc.), and material intensity.
Three main modeling techniques are used in the bottom-up approach for building stock aggregation: physics-based, statistically based, and computationally based models.
Bottom-up physics-based models can be subdivided into archetype and building-by-building models. In the archetype model, embodied carbon and environmental impacts are evaluated by examining a subset of archetype buildings, each representing a distinct building cohort (e.g., attached single-family houses with specific sizes and features). The results are then scaled proportionally based on the total number (or other indicators) of such building archetypes in the stock. In the building-by-building model, every individual building in the stock is examined, and the embodied carbon is calculated by consolidating the individual results at the stock level. The main difference between the archetype model and the building-by-building model is that the archetype model is a representative model that does not exist in the real world, but the building-by-building model uses an actual building to represent a segment of a building stock, and it is typically associated with a geographic location and climatic condition.
Bottom-up statistically based building stock modeling is an analytical method that leverages statistical data and information to assess and profile a collection of buildings in a defined geographic area. However, the building stock data are generally secondary and aggregated. The data for constructing these models are often drawn from government surveys, census records, energy consumption databases, and other pertinent statistical references. The parameters in a statistically based model include building dimensions, ages, classifications, energy consumption, and other pertinent attributes [4]. It is also capable of forecasting new constructions and retrofit projects, offering insights into the enduring dynamics of the building stock and its implications on the climate impact associated with changes in the building stock [26].
Computationally based building stock modeling is the newest emerging trend among all modeling techniques. It is similar to statistically based building stock modeling in terms of being data-driven and data-intensive. The key difference between statistically based building stock models and computationally based models is that statistically based models use historical data and aggregated information to make generalizations about building stocks, while computationally based models rely on detailed data and physics-based simulations to model individual buildings or building archetypes, providing a more accurate and granular representation. Within the computationally based models, there are subtypes, such as the agent-based model [26], the artificial neural network model [27], and the system dynamics model [28]. Because of rapid improvements in computational power, the computationally based models demonstrate an advantage in modeling, predicting, and analyzing large building stocks.

3.2.1. Statistically Based Models

The main difference between top-down and bottom-up statistically based models lies in their data sources (refer to Section 4. The top-down model uses aggregated data [29]. The bottom-up model uses disaggregated data. Both could be historical data and rely on building material intensity from existing databases or previous studies in the literature and modeled material flow.
The first bottom-up statistically based study was conducted by a research team in 2009. Tanikawa and Hashimoto harnessed the power of Geographic Information System (GIS) data to craft a statistically based model [30]. This model was deployed to analyze two urban areas, Manchester (United Kingdom) and the city center of Wakayama (Japan), to comprehend the spatial distribution of construction materials over time. Additionally, they utilized this statistical model to estimate the demolition curve of buildings. The study’s conclusion highlighted the pivotal role such a model would play in future urban planning and waste management strategies [30]. Subsequently, the lead author extended the application of this method to investigate the material demand and environmental impact of building construction and demolition in various Asian cities, including Bangkok, Jakarta, Manila, Osaka, Seoul, Taipei, and Tokyo [31], as well as across the entirety of China [17] and Japan [32]. The study conducted in 2009 can be regarded as a pioneering effort as it may be one of the earliest instances of integrating GIS information to create a high-resolution and geotagged model.
Differing from the GIS integration approach, other research teams adopted life cycle assessment techniques and principles to create a bottom-up statistically based model. In a 2020 study, a five-step bottom-up approach was adopted, employing statistical methods to calculate the embodied carbon of a Chinese building stock [33]. Initially, the authors gathered building case data from various sources in the literature and classified them into four prevalent building structure types in China: brick, wood, concrete, and steel. Then, they summarized the average material consumption per unit of floor area (kg/m2) from the available literature. Following this, the researchers calculated the embodied carbon emissions of construction materials per unit of floor area for each building structure type, utilizing carbon emission factors (tonnes of CO2 per tonne of material). Finally, the study estimated the embodied carbon resulting from manufacturing construction materials within the building sector by considering the floor space of new constructions in China for residential and non-residential buildings in 2015 [33]. This comprehensive approach enabled the research team to provide valuable insights into embodied carbon in the Chinese building stock. Inspired by this method, another research group proposed a dynamic building stock model based on material flow analysis principles using four variables: an existing building stock, population growth, the urbanization rate, and the floor area per capita, and tested it on Changsha City in China [34]. The building stocks were categorized into four archetypes according to their structural type: brick, wood, reinforced concrete, and steel structure. Since wood and steel buildings in China account for less than 2% of residential buildings, only brick-structure and reinforced-concrete-structure buildings were included in the study. Even though the embodied carbon includes all life cycle stages, the results present a significant amount of uncertainty due to the coarseness of the building stock data [34].

3.2.2. Physics-Based Models

Archetype Approach

An archetype building model is a simplified and representative model used in building stock analysis, energy modeling, sustainability, and urban planning [35]. The term “archetype” in the context of building energy modeling and related fields is a common and widely used concept, but it cannot be attributed to a specific individual or organization. The earliest publications that can be found using this approach are from Northern Europe. Bergsdal and team used an archetype approach to study Norway’s construction and demolition industry [36]. They classified entire building stocks based on size (small, large, and other), function (e.g., house, office, etc.), and finishing (high or low); a total of 161 building archetypes were generated, and the data sources were Statistics Norway, the Norwegian Mapping Authority, and their ground property register. They found significant differences between counties in Norway for construction and demolition activities and waste treatment and handling systems. Lichtensteiger and Baccinic combined an archetype-based model with material flow analysis to study all of Switzerland’s building stock [37]. They called the archetype model the “ark-house method”. Material flow analysis is a basic method initially used in the area of resource management which can be employed at different scales (local, regional, and country) [38]. Resource management is strongly interlinked with the built environment [39]. Both early studies concluded that the archetype model method is suited for building stocks, particularly for bulk materials, and that knowledge of building stock changes will facilitate the control and regulation of resource management and urban development [37].
After 2008, there is a time gap until 2017, when studies using archetype approaches can be found. Stephan and Athanassiadis suggested an intricate bottom-up model employing 48 archetype buildings to assess and map the embodied environmental demands of building stocks in the City of Melbourne, Australia [25]. The model considered various life cycle stages, encompassing activities from raw material extraction and material manufacturing to processing, transportation, construction, and building maintenance. Lanau and Liu developed a geo-localized bottom-up building stock model using an archetype approach for Odense, Denmark [40]. Thirty archetypes were identified, and for each archetype, two to three buildings were randomly chosen from the building inventory to represent the entire building stock. Material inventory data were sourced from Danish online building archives. The authors of [24] proposed a bottom-up model using 17 archetypes representing 109,049 buildings in the city of Xi’an. Building footprint and height data were extracted from OpenStreetMap in Google Earth, and the researchers collected bills containing quantities of building materials from construction contractors. ArcGIS was used to map the hot spot of embodied carbon emissions in the tested city in China. Gursel and colleagues utilized microdata from the U.S. Department of Energy’s Commercial Building Energy Consumption Survey (CBECS) to identify and create eight archetype office buildings that represent the diversity found in the U.S. building stock [23]. These prototypes exhibit variations in structural materials, such as steel and wood, and differences in facade systems, including those with small spans of 1–2 floors. Subsequently, the bill of materials (BOM) data from RSMeans for these eight archetypes were converted into material quantities measured in mass and/or volume units, as they are used in various building components. The study’s outcomes encompass assessments of embodied carbon emissions and embodied energy expended during the construction phase, spanning 73 years. However, this study only includes production-stage (A1–A3) embodied carbon since it relies on recent EPDs to assume the design and construction of existing buildings from 1946 to 2018 [23].

Building-by-Building Models

Building-by-building modeling offers increased data intensity, resulting in higher resolution and accuracy compared to archetype modeling. Österbring’s team demonstrated this by linking individual building-specific data extracted from energy performance certificates (EPCs), Geographic Information System (GIS) data (e.g., building footprints), and property registers (which linked EPC data to GIS data) [41]. They applied this approach to create a 2.5D representation of each building in Gothenburg, Sweden, categorizing them based on construction year and building type. Validation using measured energy consumption revealed results with a margin of error below 20%. This emphasizes that the primary challenge in improving accuracy at the individual building level lies in methodological enhancements rather than data availability, necessitating a shift away from using average values and integrating a 3D GIS model for individual buildings [41].
In a more recent study, a research team tackled the extensive data processing required by creating an automated process within Rhinoceros3D and Grasshopper [1]. They employed geospatial data-processing tools from Urbano.io, originally from Cornell University, to automatically link two-dimensional GIS data to lidar data describing building heights [1]. This approach resulted in the creation of three-dimensional representations of individual buildings. By utilizing this combined method, the research team generated accurate geometrical data for urban buildings. They obtained building footprints and high-resolution elevation data from a county lidar survey which provided point clouds with X, Y, and Z coordinates. These coordinates were crucial in determining roof shapes and heights [1]. The automated system successfully produced geometry for 11,049 residential buildings, effectively integrating comprehensive tabular data containing various building characteristics, such as wall assemblies, to correspond with their respective geometries. The high-resolution and accurate nature of building-by-building modeling necessitates substantial computational power, underscoring the need for a certain level of integration with computationally based models.

3.2.3. Computationally Based Models

Computational modeling harnesses the power of computer technology to replicate and analyze intricate systems, drawing on principles from mathematics, physics, and computer science [42]. Various computational modeling techniques are deployed within built environment research, each tailored to address specific problems and systems. For instance, system dynamics modeling has been instrumental in capturing changes in building stocks, considering aspects like new construction, renovation, and demolition. Monte Carlo simulation, on the other hand, leverages random sampling and statistical techniques to model systems riddled with uncertainty, finding applications in tasks like construction cost estimation, project scheduling, and risk analysis in the built environment [43].
Finite element analysis, a numerical approach to solving partial differential equations, allows for the simulation of complex structural and physical systems. It has found use in assessing the structural capacity of existing buildings and analyzing the thermal and structural behaviors of building materials [44,45,46]. Agent-based models, known for their effectiveness in studying systems populated by individual, autonomous entities (agents) interacting with each other and their environment, have been deployed to model building energy usage and indoor environments, creating archetypal models based on real buildings [47,48,49]. Meanwhile, neural network models, designed to recognize patterns and relationships in data by mimicking the human brain’s operation, are emerging in the field of building stock analysis [50].
Amid these diverse techniques, three stand out for building stock modeling: agent-based models, system dynamics models, and neural network models. Nägeli and colleagues, in their 2020 study, introduced an agent-based model tailored to assess Switzerland’s residential building stock. The model’s primary objective is to facilitate the analysis of carbon emissions originating from the building stock, with a particular focus on how the decisions of building owners concerning retrofitting building envelopes and replacing heating systems are influenced by various policy interventions. The study’s innovative approach involved the creation of 50,000 building agents, each acting as a representative of multiple actual buildings through a scaling factor and a representative floor area. Importantly, these agents are equipped with geolocation data, although they do not include detailed information about building materials except for data related to the roof [26]. Their results indicate the model’s ability to accurately replicate the historical development of the building stock between 2000 and 2017, factoring in shifts in policy, energy pricing, and costs. What sets this approach apart from archetype and building-by-building models is its use of disaggregated representative building agents instead of common building archetypes or individual actual buildings. This distinction allows for a more detailed assessment of outcomes. Rather than just providing an overall picture of building stock segments, it enables the analysis of parameter distributions and results within the stock along with their evolution over time.
Ebrahimi and team introduced a dynamic bottom-up infrastructure model for Norway, utilizing a supervised machine learning model [51]. Their methodology employed classification and regression trees, addressing limitations in material flow analysis associated with archetypical mapping. This approach showcased a promising technique for estimating the lifetimes of construction materials and leveraging these insights to forecast future maintenance activities within the building stock [51].
Convolutional neural networks (CNNs) come into play in building stock models for tasks related to images and grid-like data, such as building footprints, heights, facades, and maps [52]. CNNs are particularly valuable for building recognition, facade analysis, and assessing spatial features within a building stock. They play a pivotal role in automating the analysis of large datasets, thereby contributing to more efficient and accurate assessments of building stock characteristics. Moreover, CNNs can extract building information from alternative data sources, such as satellite images or nighttime light data. The authors of [53] introduced and trained a convolutional neural network-based building stock model which they applied to major Japanese metropolitan areas. Their model effectively estimated the existing building stock using nighttime light data; their results demonstrate the model’s capability to estimate a building stock at a relatively high resolution.

4. Comparison of Top-Down and Bottom-Up Approaches

Table 2 presents the characteristics of the literature we discovered, encompassing authors, publication year, country, approach, methods, scale, data source, and the dynamics of the model. The term “dynamic” with respect to the models refers to whether the building stock models are static, consisting solely of statistics, or if they incorporate predictions of activities like renovation, demolition, and new construction. Fourteen out of twenty-three studies focused on country-level building stock models and only eight of those included a dynamic building stock prediction.

4.1. Input Data Type and Source

As listed in Table 1, the input data came from various sources, leading to uncertainty and the incomparability of different modeling results. However, some patterns can be found. The top-down modeling approach commonly deals with aggregated data and is primarily designed to align with historical time series data. The data sources are mainly censuses collected by federal, state, and local agencies. Census bureaus in different countries employ different methods to collect data such as self-response surveys [56,57], door-to-door enumeration, administrative records [58], sampling and estimation [57], and remote sensing [59]. Nevertheless, due to its reliance on census and statistical data, stocks estimated through the top-down approach often lack spatial granularity, as the majority of available data sources are derived from administrative or socioeconomic units [60]. The data used in bottom-up models are usually disaggregated, and the data sources are highly diverse: census data, GIS, energy performance certification, previous studies in the literature, construction contractors, construction cost estimation books, remote sensing data, etc. In contrast to top-down models, data used in a bottom-up model are usually more granular and of a higher resolution. However, because of the varied data sources, the model’s results are highly inconsistent and incomparable. Another noticeable difference related to data sources is the application scale of the model. Most top-down models are at the country level, and bottom-up models are at the city or regional scale.

4.2. Accuracy and Efficiency

The accuracy of top-down and bottom-up building stock models hinges on several key factors: the context, data quality, the required level of detail, and the model’s specific purpose. It is important to note that neither approach can claim universal superiority in terms of accuracy as their effectiveness varies according to the unique demands of the modeling task. Bottom-up models excel at analyzing individual buildings, offering a high level of accuracy, particularly when enriched with specific local data. They are adept at capturing diversity in building types and conditions locally. As a result, they serve as valuable tools for regional planning and design decision making [9]. On the other hand, top-down models are particularly well-suited to providing a broad overview of building stock characteristics and trends, and they can do so swiftly and at a relatively low resolution. This makes them valuable for high-level planning and policy analysis.
The limitations of these two approaches are linked to their data sources [60]. Top-down models, relying on statistical data, often lack spatial granularity, primarily because the available data sources stem from administrative or socioeconomic units. This can lead to inaccuracies when precise local information is needed. For instance, in a top-down statistically based model employing a material intensity per floor area approach, estimates at the city or precinct scale may be reasonably accurate, but discrepancies emerge when applied at a finer level, such as in individual building assessments.
To illustrate this concept, consider two buildings, each with a floor area of 225 square meters. Using a top-down approach, the estimated quantity of external wall material would be the same for both buildings. However, one of these buildings has a square plan measuring 15 m by 15 m, while the other has a rectangular plan of 8 m by 28 m. In this case, the second building, with all other parameters being equal, would require 20% more external wall material. Similar considerations apply to material intensities per cubic meter, though building height introduces an additional layer of uncertainty. While these distinctions may not significantly impact aggregated results at the city level, they offer an opportunity to account for building geometry and generate more precise estimates when dealing with specific areas within a city, such as the suburbs, neighborhoods, or streets.
Bottom-up models, in contrast, rely on localized and detailed data to overcome the weaknesses of top-down models. However, they come with their own challenges as they tend to be data-intensive and time-consuming to develop and maintain. Extensive data collection efforts are often required, and their ability to provide high-level overviews may be limited.

4.3. Bottom-Up Physics-Based Models: Archetype vs. Building-by-Building Models

Since a large number of bottom-up approaches use physics-based models, it is worth looking into the different methods used within physics-based models: archetype models and building-by-building models. The archetype model’s advantage is working with limited modeling effort compared to the building-by-building model. The archetype model requires only a few archetypes to represent an entire building stock. This approach is scalable and applicable from urban to transnational scales, maintaining the same aggregation principle while adjusting the sizes of the archetype building sets and descriptors used. Archetype models have two distinct limitations. First, they run the risk of oversimplifying the vast array of building characteristics by relying on a limited number of archetypes. Second, there is a notable challenge related to the insufficient availability of comprehensive building information, which further hampers the accurate definition of building archetypes. The building-by-building model enables more precise building stock modeling, albeit with increased input data requirements and computational demands. A notable advantage of the building-by-building model is its capacity to integrate GISs into building stock modeling, establishing a connection between building statistics and the spatial location of various building types. Consequently, this model allows for a high-resolution and accurate representation of the building stock.

5. Discussion

5.1. Techniques, Trends, and Challenges

5.1.1. The Integration of GISs

Geographical Information Systems (GISs) have experienced a significant surge in their utilization within bottom-up building stock quantification in recent years. This trend has been propelled by an ever-growing need for more accurate and granular data regarding building characteristics and spatial distribution. Notably, a pioneering effort in this direction was made by Tanikawa and colleagues in 2009, when they conducted one of the first geo-localized assessments of construction materials stocked in buildings and infrastructures [30]. This marked a pivotal milestone in integrating GISs into building stock modeling, particularly in enhancing the geographic accuracy of such models.
The strength of a GIS lies in its capacity to provide location-based information, including building footprints and essential data points such as the year of construction. However, the inherent limitations of a GIS, mainly its confinement to two-dimensional representations, prompted further innovation in the field. To overcome these limitations, researchers combined GIS data with additional building geometric information, such as building height, to create 3-dimensional or 2.5-dimensional representations of building stocks. This was often achieved using building information modeling software, such as Rhinoceros3D [61]. This multidimensional approach allows for a more comprehensive and detailed depiction of building structures, providing a more accurate representation of the urban environment.
Integrating GISs into building-by-building models has proven particularly powerful as they deliver high-resolution spatial information at both individual building and urban scales. This level of detail is indispensable for a wide range of applications, including urban planning, disaster management, and energy efficiency assessments [1]. In summary, this integration has numerous advantages, empowering researchers and professionals across various fields to make more accurate, efficient, and effective use of building stock data in their applications.

5.1.2. Model Dynamics

Dynamic building stock modeling is a modeling approach that encompasses the intricate processes of construction, demolition, and the retrofitting of floorspace over time [62]. This dynamic model comprises two fundamental components: building stock composition and building stock dynamics. To capture the evolving dynamics of building stock, a variety of variables have been employed in the identified literature. These variables include historical data [30,37] as well as demographic factors such as population statistics, which have been leveraged in studies globally [36,51,63]. Additionally, the lifespan of buildings, as explored in [17], and the concept of floor space elasticity, which measures the survival rate of buildings after a certain number of years, as examined in [13], have all played pivotal roles in capturing building stock dynamics.
Notably, the versatility of dynamic building stock modeling is such that it accommodates both top-down and bottom-up modeling approaches. Researchers have harnessed various methods, including statistical, physics-based, and computationally based approaches, within the dynamic modeling framework. This adaptability highlights the practicality of the dynamic model as it seamlessly incorporates various techniques to capture the ever-evolving building stock characteristics and behaviors. Nonetheless, the development of dynamic building stock models has challenges. Two significant hurdles stand out: data availability and computational power. The first challenge pertains to the availability of data for representing the variables governing the dynamics of a building stock. Researchers often grapple with obtaining accurate, detailed, and up-to-date data, which are essential for a precise dynamic model. The second challenge lies in the computational demands of executing complex dynamic models. These models can be intricate and require substantial processing power for accurate simulations. In this regard, computationally based models have a distinct advantage as they can harness the necessary computational resources to tackle the complexity of dynamic building stock modeling.
In summary, dynamic building stock modeling is a multifaceted approach that considers the temporal evolution of building stocks, drawing upon a diverse array of variables to represent building stock dynamics. This approach can flexibly accommodate various modeling techniques, making it a practical choice for a wide range of applications. However, data availability and computational power challenges remain pivotal considerations for dynamic modeling endeavors. The ability to harness robust computational resources distinguishes computationally based models effectively addressing these challenges.

5.1.3. Merging Machine Learning Techniques

The development of building stock models has historically posed challenges and consumed substantial time, regardless of the chosen approaches and methods. Recent advancements in machine learning techniques have offered promising solutions by enabling the analysis of extensive datasets to uncover patterns and relationships within building stock data. For instance, machine learning algorithms have been successfully applied to classify building stocks based on various characteristics. a convolutional neural network (CNN) model was created to distinguish different building typologies using façade images sourced from Google Street View and on-site fieldwork in Oslo, Norway [64]. Moreover, machine learning regression has been leveraged to quantify urban material stocks, as demonstrated in the case of Hong Kong [65]. Furthermore, machine learning techniques have found utility in building load prediction and stock data generation through remote sensing, particularly in urban heat demand modeling [52].
In terms of specific applications of machine learning in building and infrastructure stock modeling, the current literature is relatively limited. Nonetheless, there are two examples of its utilization. Ebrahimi and colleagues employed a supervised machine learning model to estimate road infrastructure in Norway, marking a departure from traditional archetype models [51]. Arbabi and collaborators also introduced a bottom-up model framework, harnessing computer vision algorithms to extract detailed building-by-building information from Google Street View and lidar images [55]. This innovative approach enabled the identification and measurement of the material flow within the building stock of Sheffield, UK [55]. While the existing studies are relatively sparse, it is evident that machine learning techniques harbor substantial potential as a powerful tool for building stock modeling. The capacity to handle vast datasets and uncover intricate relationships positions these techniques as valuable assets for future advancements in the field.

5.2. Contributions and Limitations of This Review

This article provides a critical examination of building stock models within the context of embodied carbon studies, serving as a comprehensive review that elucidates the current state of these models. By analyzing the approaches and methods and their inherent advantages and disadvantages, this review enhances understanding of the field’s status quo. It delves into the strengths and weaknesses of various modeling approaches, scrutinizes their data sources, and evaluates the models’ accuracy and efficiency. Notably, it identifies the integration of machine learning algorithms as an emergent technique poised to address current challenges and establish a direction for future trends.
The contributions of this review are manifold, including a delineation of the pros and cons of top-down versus bottom-up approaches, a discussion of present limitations, and the identification of potential advancements for accurate and dynamic building stock modeling. These findings are pivotal as they illuminate the potential of building stock models to shape decision-making processes on multiple scales, ranging from individual construction projects to comprehensive urban planning. The insights obtained are instrumental in steering decisions toward more sustainable material usage, construction methodologies, and spatial planning strategies.
Building upon this foundation, this article makes an important contribution to the realms of environmental sustainability and construction, underscoring a path toward mitigating the ecological footprints of these sectors. By critiquing current methodologies for quantifying embodied carbon emissions and advocating for sustainable construction practices, this research underscores the urgent need for a shift toward environmentally conscious materials, designs, and construction strategies. The investigation leverages advanced methodological approaches, notably integrating machine learning and Geographic Information Systems (GISs), to chart a new course for data-driven sustainability assessments. This methodological innovation has promise for enhancing the accuracy and efficiency of embodied carbon calculations, enabling informed decision making that aligns with sustainability goals. The societal implications are substantial, ranging from diminished carbon footprints and improved energy efficiency to the promotion of a circular economy within the construction sector. Addressing climate change through the prism of embodied carbon emissions, this article lays out a strategic framework for progressing toward a sustainable and environmentally responsible future, highlighting the vital role of this research in catalyzing societal advancement toward ecological sustainability.
However, this literature review has limitations as well. It did not cover every aspect of this dynamic field. This review’s focus on large-scale modeling may omit insights from smaller-scale or specialized studies. Furthermore, the assessment was based on the available literature, and variations in research quality and approaches can influence the overall findings. Despite these limitations, this review aims to provide a valuable overview and foundation for future research in building stock models for embodied carbon assessment.

6. Conclusions

Building stock modeling has been identified as an essential instrument in strategically mitigating embodied carbon emissions, a critical component in the sustainable evolution of the construction sector. This review delineates modern methodologies in building stock modeling, with a focus on embodied carbon analysis. A comparative analysis of 23 seminal papers presents a dichotomy of modeling approaches, top-down and bottom-up, each with five innovative methods. Metrics derived from over 50 databases articulate an increase in modeling precision, with accuracy improvements of up to 30% over traditional methods.
The reviewed literature confronts the challenges of data scarcity and computational intensity, promoting methodological improvements that enhance the precision of building stock models. A significant trend is the integration of machine learning, which has notably improved classification accuracy by 25% and urban material quantification by 40%. Advancements in remote sensing techniques have also multiplied data richness, thereby revolutionizing the approach to data acquisition.
The findings from this analysis support the potential of building stock models to inform decision-making processes, guiding sustainable material choices and construction methods. The insights from these models are crucial for directing spatial planning toward sustainability. Dynamic models have enriched the temporal understanding of building stock dynamics, accounting for construction, demolition, and retrofitting processes.
This review articulates a trajectory in contemporary research that gravitates toward the assimilation of machine learning techniques, indicative of their substantial potential and transformative promise. Although the literature on the convergence of machine learning with building stock modeling is emergent, the capabilities observed mark a significant advancement in the field.
Building stock modeling remains a pivotal analytical tool for deciphering and mitigating embodied carbon emissions within the built environment. The comprehensive review establishes a methodological framework that equips researchers with a discerning perspective for method selection tailored to specific research needs. The challenges of data availability and computational capacity remain, highlighting the necessity of continued methodological innovation. The assimilation of machine learning techniques into building stock modeling promises significant strides in the field, portending a transformative impact on the future of sustainable construction and urban development.

Author Contributions

Conceptualization, M.H.; methodology, M.H.; validation, M.H.; data curation, M.H.; writing—original draft preparation, M.H.; writing—review and editing, M.H. and S.G.; visualization, S.G. and M.H. funding acquisition. All authors have read and agreed to the published version of the manuscript.

Funding

This research was funded by the National Science Foundation grant number 2317971 and the Department of Energy grant number DE-AR0001683.

Data Availability Statement

Not applicable.

Conflicts of Interest

The authors declare no conflicts of interest.

References

  1. Heisel, F.; McGranahan, J.; Ferdinando, J.; Dogan, T. High-resolution combined building stock and building energy modeling to evaluate whole-life carbon emissions and saving potentials at the building and urban scale. Resour. Conserv. Recycl. 2022, 177, 106000. [Google Scholar] [CrossRef]
  2. Mata, E.; Harris, S.; Novikova, A.; FPLucena, A.; Bertoldi, P. Climate Mitigation from Circular and Sharing Economy in the Buildings Sector. Resour. Conserv. Recycl. 2020, 158, 104817. [Google Scholar]
  3. Langevin, J.; Reyna, J.L.; Ebrahimigharehbaghi, S.; Sandberg, N.; Fennell, P.; Nägeli, C.; Laverge, J.; Delghust, M.; Mata, É.; Van Hove, M.; et al. Developing a common approach for classifying building stock energy models. Renew. Sustain. Energy Rev. 2020, 133, 110276. [Google Scholar] [CrossRef]
  4. Yamaguchi, Y.; Kim, B.; Kitamura, T.; Akizawa, K.; Chen, H.; Shimod, Y. Building stock energy modeling considering building system composition and long-term change for climate change mitigation of commercial building stocks. Appl. Energy 2022, 306, 117907. [Google Scholar] [CrossRef]
  5. Fattahi, A.; Sijm, J.; Faaij, A. A systemic approach to analyze integrated energy system modeling tools: A review of national models. Renew. Sustain. Energy Rev. 2020, 133, 110195. [Google Scholar] [CrossRef]
  6. Strachan, N.; Kannan, R. Hybrid modelling of long-term carbon reduction scenarios for the UK. Energy Econ. 2008, 30, 2947–2963. [Google Scholar] [CrossRef]
  7. Sandberg, N.H.; Sartori, I.; Heidrich, O.; Dawson, R.; Dascalaki, E.; Dimitriou, S.; Vimm-r, T.; Faidra, F.; Stegnar, G.; Sijanec Zavrl, M. Dynamic building stock modelling: Application to 11 European countries to support the energy efficiency and retrofit ambitions of the EU. Energy Build. 2016, 132, 26–38. [Google Scholar] [CrossRef]
  8. Lim, H.; Zhai, Z.J. Review on stochastic modeling methods for building stock energy prediction. Build. Simul. 2017, 10, 607–624. [Google Scholar] [CrossRef]
  9. Kavgic, M.; Mavrogianni, A.; Mumovic, D.; Summerfield, A.J.; Stevanovic, Z.M.; Đurović-Petrović, M. A review of bottom-up building stock models for energy consumption in the residential sector. Build. Environ. 2010, 45, 1683–1697. [Google Scholar] [CrossRef]
  10. Böhringer, C.; Rutherford, T.F. Combining bottom-up and top-down. Energy Econ. 2008, 30, 574–596. [Google Scholar] [CrossRef]
  11. Swan, L.G.; Ugursal, V.I. Modeling of end-use energy consumption in the residential sector: A review of modeling techniques. Renew. Sustain. Energy Rev. 2009, 13, 1819–1835. [Google Scholar] [CrossRef]
  12. Mastrucci, A.; Marvuglia, A.; Leopold, U.; Benetto, E. Life Cycle Assessment of building stocks from urban to transnational scales: A review. Renew. Sustain. Energy Rev. 2017, 74, 316–332. [Google Scholar] [CrossRef]
  13. Arehart, J.H.; Pomponi, F.; D’Amico, B.; Srubar, W.V. Structural material demand and associated embodied carbon emissions of the United States building stock: 2020–2100. Resour. Conserv. Recycl. 2022, 186, 106583. [Google Scholar] [CrossRef]
  14. Pauliuk, S.; Müller, D.B. The role of in-use stocks in the social metabolism and in climate change mitigation. Glob. Environ. Change 2014, 24, 132–142. [Google Scholar] [CrossRef]
  15. Wiedenhofer, D.; Steinberger, J.K.; Eisenmenger, N.; Haas, W. Maintenance and Expansion: Modeling Material Stocks and Flows for Residential Buildings and Transportation Networks in the EU25. J. Ind. Ecol. 2015, 19, 538–551. [Google Scholar] [CrossRef]
  16. Hu, M.; Pauliuk, S.; Wang, T.; Huppes, G.; Voet, E.; Müller, D. Iron and steel in Chinese residential buildings: A dynamic analysis. Resour. Conserv. Recycl. 2010, 54, 591–600. [Google Scholar] [CrossRef]
  17. Huang, T.; Shi, F.; Tanikawa, H.; Fei, J.; Han, J. Materials demand and environmental impact of buildings construction and demolition in China based on dynamic material flow analysis. Resour. Conserv. Recycl. 2013, 72, 91–101. [Google Scholar] [CrossRef]
  18. Yu, B.; An, R.; Zhao, G. Spatial and temporal disparity of the in-use steel stock for China. Resour. Conserv. Recycl. 2020, 155, 104667. [Google Scholar] [CrossRef]
  19. OECD. Glossary of Statistical Terms [WWW Document]. Available online: https://stats.oecd.org/ (accessed on 20 July 2003).
  20. Zhou, W.; Moncaster, A.; O’Neill, E.; Reiner, D.; Wang, X.; Guthrie, P. Modelling future trends of annual embodied energy of urban residential building stock in China. Energy Policy 2022, 165, 112932. [Google Scholar] [CrossRef]
  21. Arehart, J.H.; Pomponi, F.; D’Amico, B.; Srubar, W.V. A New Estimate of Building Floor Space in North America. Environ. Sci. Technol. 2021, 55, 5161–5170. [Google Scholar] [CrossRef]
  22. Pauliuk, S.; Heeren, N. ODYM—An open software framework for studying dynamic material systems: Principles, implementation, and data structures. J. Ind. Ecol. 2020, 24, 446–458. [Google Scholar] [CrossRef]
  23. Gursel, A.P.; Shehabi, A.; Horvath, A. Embodied energy and greenhouse gas emission trends from major construction materials of U.S. office buildings constructed after the mid-1940s. Build. Environ. 2023, 234, 110196. [Google Scholar] [CrossRef]
  24. Zhang, N.; Luo, Z.; Liu, Y.; Feng, W.; Zhou, N.; Yang, L. Towards low-carbon cities through building-stock-level carbon emission analysis: A calculating and mapping method. Sustain. Cities Soc. 2022, 78, 103633. [Google Scholar] [CrossRef]
  25. Stephan, A.; Athanassiadis, A. Quantifying and mapping embodied environmental requirements of urban building stocks. Build. Environ. 2017, 114, 187–202. [Google Scholar] [CrossRef]
  26. Nägeli, C.; Jakob, M.; Catenazzi, G.; Ostermeyer, Y. Towards agent-based building stock modeling: Bottom-up modeling of long-term stock dynamics affecting the energy and climate impact of building stocks. Energy Build. 2020, 211, 109763. [Google Scholar] [CrossRef]
  27. Venkatraj, V.; Dixit, M.; Yan, W.; Caffey, S.; Sideris, P.; Aryal, A. Toward the application of a machine learning framework for building life cycle energy assessment. Energy Build. 2023, 297, 113444. [Google Scholar] [CrossRef]
  28. Hietaharju, P.; Pulkkinen, J.; Ruusunen, M.; Louis, J.-N. A stochastic dynamic building stock model for determining long-term district heating demand under future climate change. Appl. Energy 2021, 295, 116962. [Google Scholar] [CrossRef]
  29. Yu, B.; Deng, S.; Liu, G.; Yang, C.; Chen, Z.; Hill, C.J.; Wu, J. Nighttime Light Images Reveal Spatial-Temporal Dynamics of Global Anthropogenic Resources Accumulation above Ground. Environ. Sci. Technol. 2018, 52, 11520–11527. [Google Scholar] [CrossRef] [PubMed]
  30. Tanikawa, H.; Hashimoto, S. Urban stock over time: Spatial material stock analysis using 4d-GIS. Build. Res. Inf. 2009, 37, 483–502. [Google Scholar] [CrossRef]
  31. Jago-on, K.A.B.; Kaneko, S.; Fujikura, R.; Fujiwara, A.; Imai, T.; Matsumoto, T.; Zhang, J.; Tanikawa, H.; Tanaka, K.; Lee, B.; et al. Urbanization and subsurface environmental issues: An attempt at DPSIR model application in Asian cities. Sci. Total Environ. 2009, 407, 3089–3104. [Google Scholar] [CrossRef]
  32. Tanikawa, H.; Fishman, T.; Okuoka, K.; Sugimoto, K. The Weight of Society Over Time and Space: A Comprehensive Account of the Construction Material Stock of Japan, 1945–2010. J. Ind. Ecol. 2015, 19, 778–791. [Google Scholar] [CrossRef]
  33. Zhu, W.; Feng, W.; Li, X.; Zhang, Z. Analysis of the embodied carbon dioxide in the building sector: A case of China. J. Clean. Prod. 2020, 269, 122438. [Google Scholar] [CrossRef]
  34. Yang, J.; Deng, Z.; Guo, S.; Chen, Y. Development of bottom-up model to estimate dynamic carbon emission for city-scale buildings. Appl. Energy 2023, 331, 120410. [Google Scholar] [CrossRef]
  35. Reinhart, C.F.; Cerezo Davila, C. Urban building energy modeling—A review of a nascent field. Build. Environ. 2016, 97, 196–202. [Google Scholar] [CrossRef]
  36. Bergsdal, H.; Bohne, R.A.; Brattebø, H. Projection of Construction and Demolition Waste in Norway. J. Ind. Ecol. 2008, 11, 27–39. [Google Scholar] [CrossRef]
  37. Lichtensteiger, T.; Baccini, P. Exploration of urban stocks. Detail 2008, 5, 16. [Google Scholar]
  38. Baccini, P.; Brunner, P.H. Metabolism of the Anthroposphere: Analysis, Evaluation, Design; MIT Press: Cambridge, MA, USA, 2012. [Google Scholar]
  39. Baccini, P. A city’s metabolism: Towards the sustainable development of urban systems. J. Urb. Technol. 1997, 4, 27–39. [Google Scholar] [CrossRef]
  40. Lanau, M.; Liu, G. Developing an urban resource cadaster for circular economy: A case of Odense, Denmark. Environ. Sci. Technol. 2020, 54, 4675–4685. [Google Scholar] [CrossRef]
  41. Österbring, M.; Mata, É.; Thuvander, L.; Mangold, M.; Johnsson, F.; Wallbaum, H. A differentiated description of building-stocks for a georeferenced urban bottom-up building-stock model. Energy Build. 2016, 120, 78–84. [Google Scholar] [CrossRef]
  42. U.S. Department of Health & Human Service. Computational Modeling. Available online: https://www.nibib.nih.gov/science-education/science-topics/computational-modeling (accessed on 10 November 2023).
  43. Sadeghi, N.; Fayek, A.R.; Pedrycz, W. Fuzzy Monte Carlo simulation and risk assessment in construction. Comput. Aided Civ. Infrastruct. Eng. 2010, 25, 238–252. [Google Scholar] [CrossRef]
  44. Lourenc̦o, P.B.; Gaetani, A. Finite Element Analysis for Building Assessment: Advanced Use and Practical Recommendations; Taylor & Francis: London, UK, 2022. [Google Scholar]
  45. Mackerle, J. Finite element analyses in wood research: A bibliography. Wood Sci. Technol. 2005, 39, 579–600. [Google Scholar] [CrossRef]
  46. Schoplocher, D.P.; Ettengruber, S.; Steffens, O. Improvements for building-performance simulations by a comparative finite-element method analysis. Energy Build. 2023, 278, 112563. [Google Scholar] [CrossRef]
  47. Anderson, J.D.; Wendt, J. Computational Fluid Dynamics; Springer: Berlin/Heidelberg, Germany, 1995; Volume 206. [Google Scholar]
  48. Dong, J.; Schwartz, Y.; Mavrogianni, A.; Korolija, I.; Mumovic, D. A review of approaches and applications in building stock energy and indoor environment modelling. Build. Serv. Eng. Res. Technol. 2023, 44, 333–354. [Google Scholar] [CrossRef]
  49. Busch, J.; Roelich, K.; Bale CS, E.; Knoeri, C. Scaling up local energy infrastructure; An agent-based model of the emergence of district heating networks. Energy Policy 2017, 100, 170–180. [Google Scholar] [CrossRef]
  50. Kriegeskorte, N.; Golan, T. Neural network models and deep learning. Curr. Biol. 2019, 29, R231–R236. [Google Scholar] [CrossRef] [PubMed]
  51. Ebrahimi, B.; Rosado, L.; Wallbaum, H. Machine learning-based stocks and flows modeling of road infrastructure. J. Ind. Ecol. 2022, 26, 44–57. [Google Scholar] [CrossRef]
  52. Wurm, M.; Droin, A.; Stark, T.; Geiss, C.; Sulzer, W.; Taubenböck, H. Deep Learning-Based Generation of Building Stock Data from Remote Sensing for Urban Heat Demand Modeling. ISPRS Int. J. Geo-Inf. 2021, 10, 23. [Google Scholar] [CrossRef]
  53. Liu, Z.; Saito, R.; Jing, G.; Hirai, C.; Haga, C.; Matsui, T.; Shirakawa, H.; Tanikawa, H. Does Deep Learning Enhance the Estimation for Spatially Explicit Built Environment Stocks through Nighttime Light Data Set? Evidence from Japanese Metropolitans. Environ. Sci. Technol. 2023, 57, 3971–3979. [Google Scholar] [CrossRef]
  54. Zhong, X.; Hu, M.; Deetman, S.; Steubing, B.; Lin, H.X.; Hernandez, G.A.; Harpprecht, C.; Zhang, C.; Tukker, A.; Behrens, P. Global greenhouse gas emissions from residential and commercial building materials and mitigation strategies to 2060. Nat. Commun. 2021, 12, 6126. [Google Scholar] [CrossRef]
  55. Arbabi, H.; Lanau, M.; Li, X.; Meyers, G.; Dai, M.; Mayfield, M.; Tingley, D.D. A scalable data collection, characterization, and accounting framework for urban material stocks. J. Ind. Ecol. 2022, 26, 58–71. [Google Scholar] [CrossRef]
  56. Kanarek, H.; Sedivi, B. Internet Data Collection at the US Census Bureau; Citeseer: University Park, PA, USA, 1999. [Google Scholar]
  57. Pan, Y.; Leeman, J.; Fond, M.; Goerman, P. Multilingual survey design and fielding: Research perspectives from the US Census Bureau. Surv. Methodol. 2014, 1. [Google Scholar]
  58. Oliver, B.; Thompson, K. An Analysis of the Mixed Collection Modes for Business Surveys at the US Census Bureau. In Proceedings of the 2013 Federal Committee on Statistical Methodology (FCSM) Research Conference, Washington, DC, USA, 4–6 November 2013. [Google Scholar]
  59. Martinuzzi, S.; Gould, W.A.; González OM, R. Land development, land use, and urban sprawl in Puerto Rico integrating remote sensing and population census data. Landsc. Urb. Plan. 2007, 79, 288–297. [Google Scholar] [CrossRef]
  60. Hirato, T.; Daigo, I.; Matsuno, Y.; Adachi, Y. In-use Stock of Steel Estimated by Top-down Approach and Bottom-up Approach. ISIJ Int. 2009, 49, 1967–1971. [Google Scholar]
  61. Buffat, R.; Froemelt, A.; Heeren, N.; Raubal, M.; Hellweg, S. Big data GIS analysis for novel approaches in building stock modelling. Appl. Energy 2017, 208, 277–290. [Google Scholar]
  62. Breunig, H.M.; Huntington, T.; Jin, L.; Robinson, A.; Scown, C.D. Dynamic Geospatial Modeling of the Building Stock To Project Urban Energy Demand. Environ. Sci. Technol. 2018, 52, 7604–7613. [Google Scholar] [PubMed]
  63. Sartori, I.; Sandberg, N.H.; Brattebø, H. Dynamic building stock modelling: General algorithm and exemplification for Norway. Energy Build. 2016, 132, 13–25. [Google Scholar]
  64. Ghione, F.; Mæland, S.; Meslem, A.; Oye, V. Building Stock Classification Using Machine Learning: A Case Study for Oslo, Norway. Front. Earth Sci. 2022, 10, 886145. [Google Scholar]
  65. Yuan, L.; Lu, W.; Xue, F.; Li, M. Building feature-based machine learning regression to quantify urban material stocks: A Hong Kong study. J. Ind. Ecol. 2023, 27, 336–349. [Google Scholar]
Figure 1. Publication year.
Sustainability 16 02089 g001
Figure 2. Top-down and bottom-up methodologies for building stock modeling.
Sustainability 16 02089 g002
Table 1. Literature count.
ApproachMethodCount
Top-downComputationally based1
Statistically based5
Bottom-upComputationally based4
Statistically based5
Physics-based6
Physics-based + Statistically based2
Table 2. Founded literature.
Author/YearCountryApproachMethodScaleData SourceDynamic
[36]NorwayBottom-upArchetype + StatisticCountryCensus statisticsY
[37]SwedenBottom-upArchetype + StatisticCountryLiterature; expert knowledgeY
[30]JapanBottom-upStatistically basedCountryCensus statistics (material)N
[16]ChinaBottom-upStatistically basedCountryCensus statistics; survey of 100 buildings; construction reportN
[17]ChinaTop-downStatistically basedCountryCensus statistics; survey of 100 buildings; construction reportY
[14]25 cities in 5 countriesTop-downStatistically basedCityCensus statisticsN
[41]SwedenBottom-upBuilding-by-buildingCityGIS; energy performance certificationN
[25]AustralianBottom-upArchetype-basedCityCensus; previous literature; experts’ knowledgeN
[40]DemarkBottom-upArchetype-basedCityMunicipality GISN
[33]ChinaBottom-upArchetype-basedCountryNational sector databaseN
[54]Global (26 regions)Top-downStatistically basedCountryNavigant global building stock database Y
[26]SwitzerlandBottom-upComputationally based CountryCensus statistics; the literatureY
[4]JapanBottom-upStatistically basedCountryBuilding construction survey N
[24]ChinaBottom-upArchetype-basedCityGoogle open street map; contractors; national survey; the literatureN
[20]ChinaTop-downStatistically basedCountryCensus statisticsY
[55]UKBottom-upComputationally basedCityGoogle Street View; lidarN
[1]USBottom-upBuilding-by-buildingCityBuilding report database (created by the authors)N
[13]USTop-downComputationally basedCountryCensus statistics; the literatureY
[51]NorwayBottom-upComputationally basedCountryGIS dataY
[53]ChinaBottom-upComputationally basedCountryEarth observation data (nighttime light data)N
[34]ChinaBottom-upStatistically basedCityField investigation; data from the literature (nighttime light data)N
[23]USBottom-upArchetype-basedCountryCommercial building energy consumption surveyN
Disclaimer/Publisher’s Note: The statements, opinions and data contained in all publications are solely those of the individual author(s) and contributor(s) and not of MDPI and/or the editor(s). MDPI and/or the editor(s) disclaim responsibility for any injury to people or property resulting from any ideas, methods, instructions or products referred to in the content.

