Article

The Response of Carbon Storage to Multi-Objective Land Use/Cover Spatial Optimization and Vulnerability Assessment

1
School of Environment and Spatial Informatics, China University of Mining and Technology, Xuzhou 221116, China
2
Jiangxi Vocational College of Industry & Engineering, Pingxiang 337099, China
*
Author to whom correspondence should be addressed.
These authors contributed equally to this work.
Sustainability 2024, 16(6), 2235; https://doi.org/10.3390/su16062235
Submission received: 25 January 2024 / Revised: 27 February 2024 / Accepted: 4 March 2024 / Published: 7 March 2024

Abstract

:
The dynamic changes in land use/cover (LULC) significantly influence carbon storage, and assessing the vulnerability of carbon storage services in different basins is crucial for a comprehensive understanding of the impacts of human activities on ecosystems. The objective of this study is to propose a framework for optimizing LULC, simulating carbon storage, and assessing vulnerability by integrating the MOP, PLUS, and InVEST models. The results show that forests play a crucial role in enhancing carbon storage services in the Yangtze River Basin (YRB). Carbon storage in the upper reaches of the YRB is on the rise, counteracting the decrease in carbon storage caused by the expansion of built-up land. However, in the middle and lower reaches of the YRB, LULC has a negative impact on ecosystem carbon storage services. Under natural development scenarios, carbon storage is projected to decrease by 68.84 × 10⁶ tons, leading to increased vulnerability of ecosystem carbon storage services. Under the scenario of ecological and economic balance, carbon storage is expected to increase by 97 × 106 tons. In the future, while restricting built-up land expansion, emphasis should be placed on expanding forest areas to more effectively enhance ecosystem services in basins.

1. Introduction

Carbon exchanges between terrestrial ecosystems and the atmosphere, particularly carbon dioxide (CO2), have a large influence on the global and regional climate systems [1]. Atmospheric CO2 from conversion processes in terrestrial ecosystems ranks only second to fossil fuel burning due to the terrestrial ecosystem pattern change and the related transformation between carbon source and sink that is caused by urbanization [2,3]. In addition, land use/cover (LULC) change has been identified as one of the main driver factors for the degradation of terrestrial ecosystem services and a key indicator closely linked to the socio-economic development process [4]. As a result of rapid socio-economic development, the LULC landscape pattern in the world has undergone significant transformations [5]. For example, 75% of the LULC had been changed, and more than 60% of terrestrial ecosystem services functions had been degraded in the world over the past few decades [6]. In addition, carbon storage reduction in the terrestrial ecosystem was more than 279 × 106 tons due to LULC dynamics from 1980 to 2010 in China [7]. As global population growth, climate change, and economic development increase, the LULC change stress on carbon storage and the vulnerability of ecosystem services (e.g., susceptibility, sensitivity, and recovery potential) will become more pronounced [8]. Therefore, it is desirable to find an accurate assessment of the relationship between LULC dynamics and carbon storage in areas of different spatial–temporal scales, which is a crucial issue for understanding the processes of complex carbon sinks.
Currently, many studies have paid attention to searching for the carbon storage mechanism through field sampling and model simulation approaches, including terrestrial ecosystem models, biogeochemical cycling, and century models [9,10,11]. Field sampling has a major advantage in terms of data accuracy with spatial underrepresentation, which makes it suitable for small-scale precision studies to explore the responding mechanism of single LULC-induced carbon storage dynamics in different natural environments [12]. The model simulation approach could effectively quantify the evolutionary mechanisms of specific vegetation types and the impacts on carbon storage changes on large scales, but these models require more methodological parameters, and the multi-type carbon stock simulation accuracy needs to be improved [7]. To solve the above problems, the Integrated Valuation of Ecosystem Services and Tradeoffs (InVEST) model with global or regional carbon density distributions of various vegetation and soil types as an input is an effective tool to link with LULC changes for ecosystem carbon storage analysis [13]. Meanwhile, many scholars have integrated the InVEST model and LULC optimization methods, such as conversion of LULC at small regional extent (CLUE-S), cellular automata and the Markov model (CA-Markov), and system dynamics and the future LULC simulation (SD-FLUS) model, to evaluate carbon storage in various ecosystems under different socio-economic climate change scenarios [14,15]. For example, Jiang et al. [16] analyzed the potential spatial patterns of carbon storage expansion, where the CLUE-S and the InVEST models were integrated within a general framework. Zhao et al. [17] advanced an CA-Markov-based InVEST model to analyze the interaction relationship between ecological engineering and carbon storage in semi-arid regions. Yang et al. [18] proposed a hierarchical framework with SD, FLUS, and a carbon stock evaluation model to predict the impact of LULC change on carbon stocks. However, with respect to complex processes (e.g., accurate image area calculations, precise scene setting parameters, and multi-driven factors) and competing objectives (e.g., economic development, ecological conservation and ecosystem services, and carbon storage maximization), the above methods could not accurately obtain LULC patterns under different scenarios in the future [19,20]. Meanwhile, the image classification tends to produce large deviations between LULC datasets and the real-life situation, which leads to more uncertain information in the related assessment results [21].
Multi-objective programming (MOP) has advantages in solving contradictory goals in complicated optimization systems, particularly in combination with macroeconomic strategies [22], and patch-generating LULC simulation (PLUS) was developed on the basis of the FLUS model, which can better reveal the causative factors of various LULC changes and discover patch-level LULC changes under conditions in the future. In addition, most current studies focus on single ecosystems, such as forest, grassland, or cropland ecosystems at national, regional, and urban scales, to analyze carbon storage change, and that ignores the nature–human interaction effect on the spatial–temporal characteristics of carbon stock in an entire ecosystem within a contiguous space (e.g., watershed basin scale) [23,24,25,26,27]. Meanwhile, few studies have paid attention to the influence of LULC changes on carbon storage and their impact on ecological carbon storage service vulnerability.
The Yangtze River Basin (YRB) is a hotspot for biodiversity conservation and a priority area for ecological and environmental protection in China [28]. Beginning in 2000, the state launched a series of projects in the YRB, including returning farmland to forest and protecting natural forest resources, which have significantly increased the area of forests in the basin and enhanced their carbon sequestration capacity [29]. The 14th Five-Year Plan (2021–2025) is China’s first five-year plan after the announcement of its goals for carbon emissions peak by 2030 and carbon neutrality by 2060, and various provinces in the YRB have begun to optimize the layout of green and low-carbon development regions [30]. Meanwhile, the different regions of the YRB have complex integrated ecosystems composed of different natures and human elements [31]. However, rapid urbanization has put tremendous pressure on the ecological environment of the YRB [32]. Currently, research on carbon storage in the YRB mainly focuses on the spatio-temporal variations of forest and vegetation carbon storage [33]. For example, Kong et al. [34] employed remote sensing data from 1993 to 2012 to simulate the spatiotemporal distribution of aboveground forest carbon storage in the YRB; Jia [35] assessed the distribution patterns and dynamic variations of forest vegetation carbon storage in the YRB from 1989 to 2008. There are still knowledge gaps regarding the carbon storage changes of the entire YRB, the characteristics of carbon storage in different basins, and future LULC optimization.
Therefore, the objective of this study is to propose a LULC optimization–carbon storage simulation–vulnerability assessment framework integrated with MOP, PLUS, and InVEST models for accurate searching of the relationship between LULC dynamics and carbon storage on spatial–temporal scales under a watershed scale. The high-precision LULC imagery, carbon density, and natural and socioeconomic data were incorporated into the framework with a 90 m grid through mechanically learned supervised classification and spatial data integration and processing methods. The YRB, with its intense LULC dynamics, the most complete ecosystem elements, and the strongest impacts of human activities in China, was taken as the study area. The natural development scenario (NDS) and ecological and economic balance scenario (EEB) were designed to analyze carbon storage change trends and its service vulnerability from 2020 to 2030. The results could effectively provide a scientific basis and reference for decision making on LULC management in the YRB and the realization of the “double carbon” goal.

2. Materials and Methods

2.1. Study Area

YRB, as the third largest basin in the world, is located at 24°30′–35°45′ N and 90°33′–122°25′ E and covers 19 provinces and autonomous regions with approximately 1.8 million km2 that accounts for 18.8% of China’s terrestrial area (Figure 1). The YRB has more than 35.5% of the national population and accounted for more than 46.4% of the gross domestic product (GDP) in China during 2020 [36]. The basin has various complex ecosystems due to significant elevation differences across multiple climatic zones (subtropical, tropical monsoon, and highland mountain). The abundance of water, land, minerals, forests, and multiple climate zones has contributed to improving regional carbon storage capacity. Due to human activity, the LULC within the basin has changed dramatically. In addition, as the steady construction process of the Yangtze River Economic Belt continues, the economic structure, population size, and LULC types in the YRB will undergo a greater change in the future that could further affect regional ecosystem carbon storage. This study examines the period from 1985 to 2020, which covers most of the era of China’s reform and opening up. During this time, China experienced several major historical events, including the construction of the Three Gorges Dam, the implementation of the “Great Protection of the Yangtze River,” urbanization, and other processes. These events had a profound impact on the environmental, economic, and social aspects of the YRB, providing a good way to reflect the changes in LULC, carbon storage, and other factors. Therefore, in-depth analysis and prediction of LULC change types and the related ecosystem carbon storage are of great significance in assessing the vulnerability in terms of regional high-quality development.

2.2. Data Sources and Data Processing

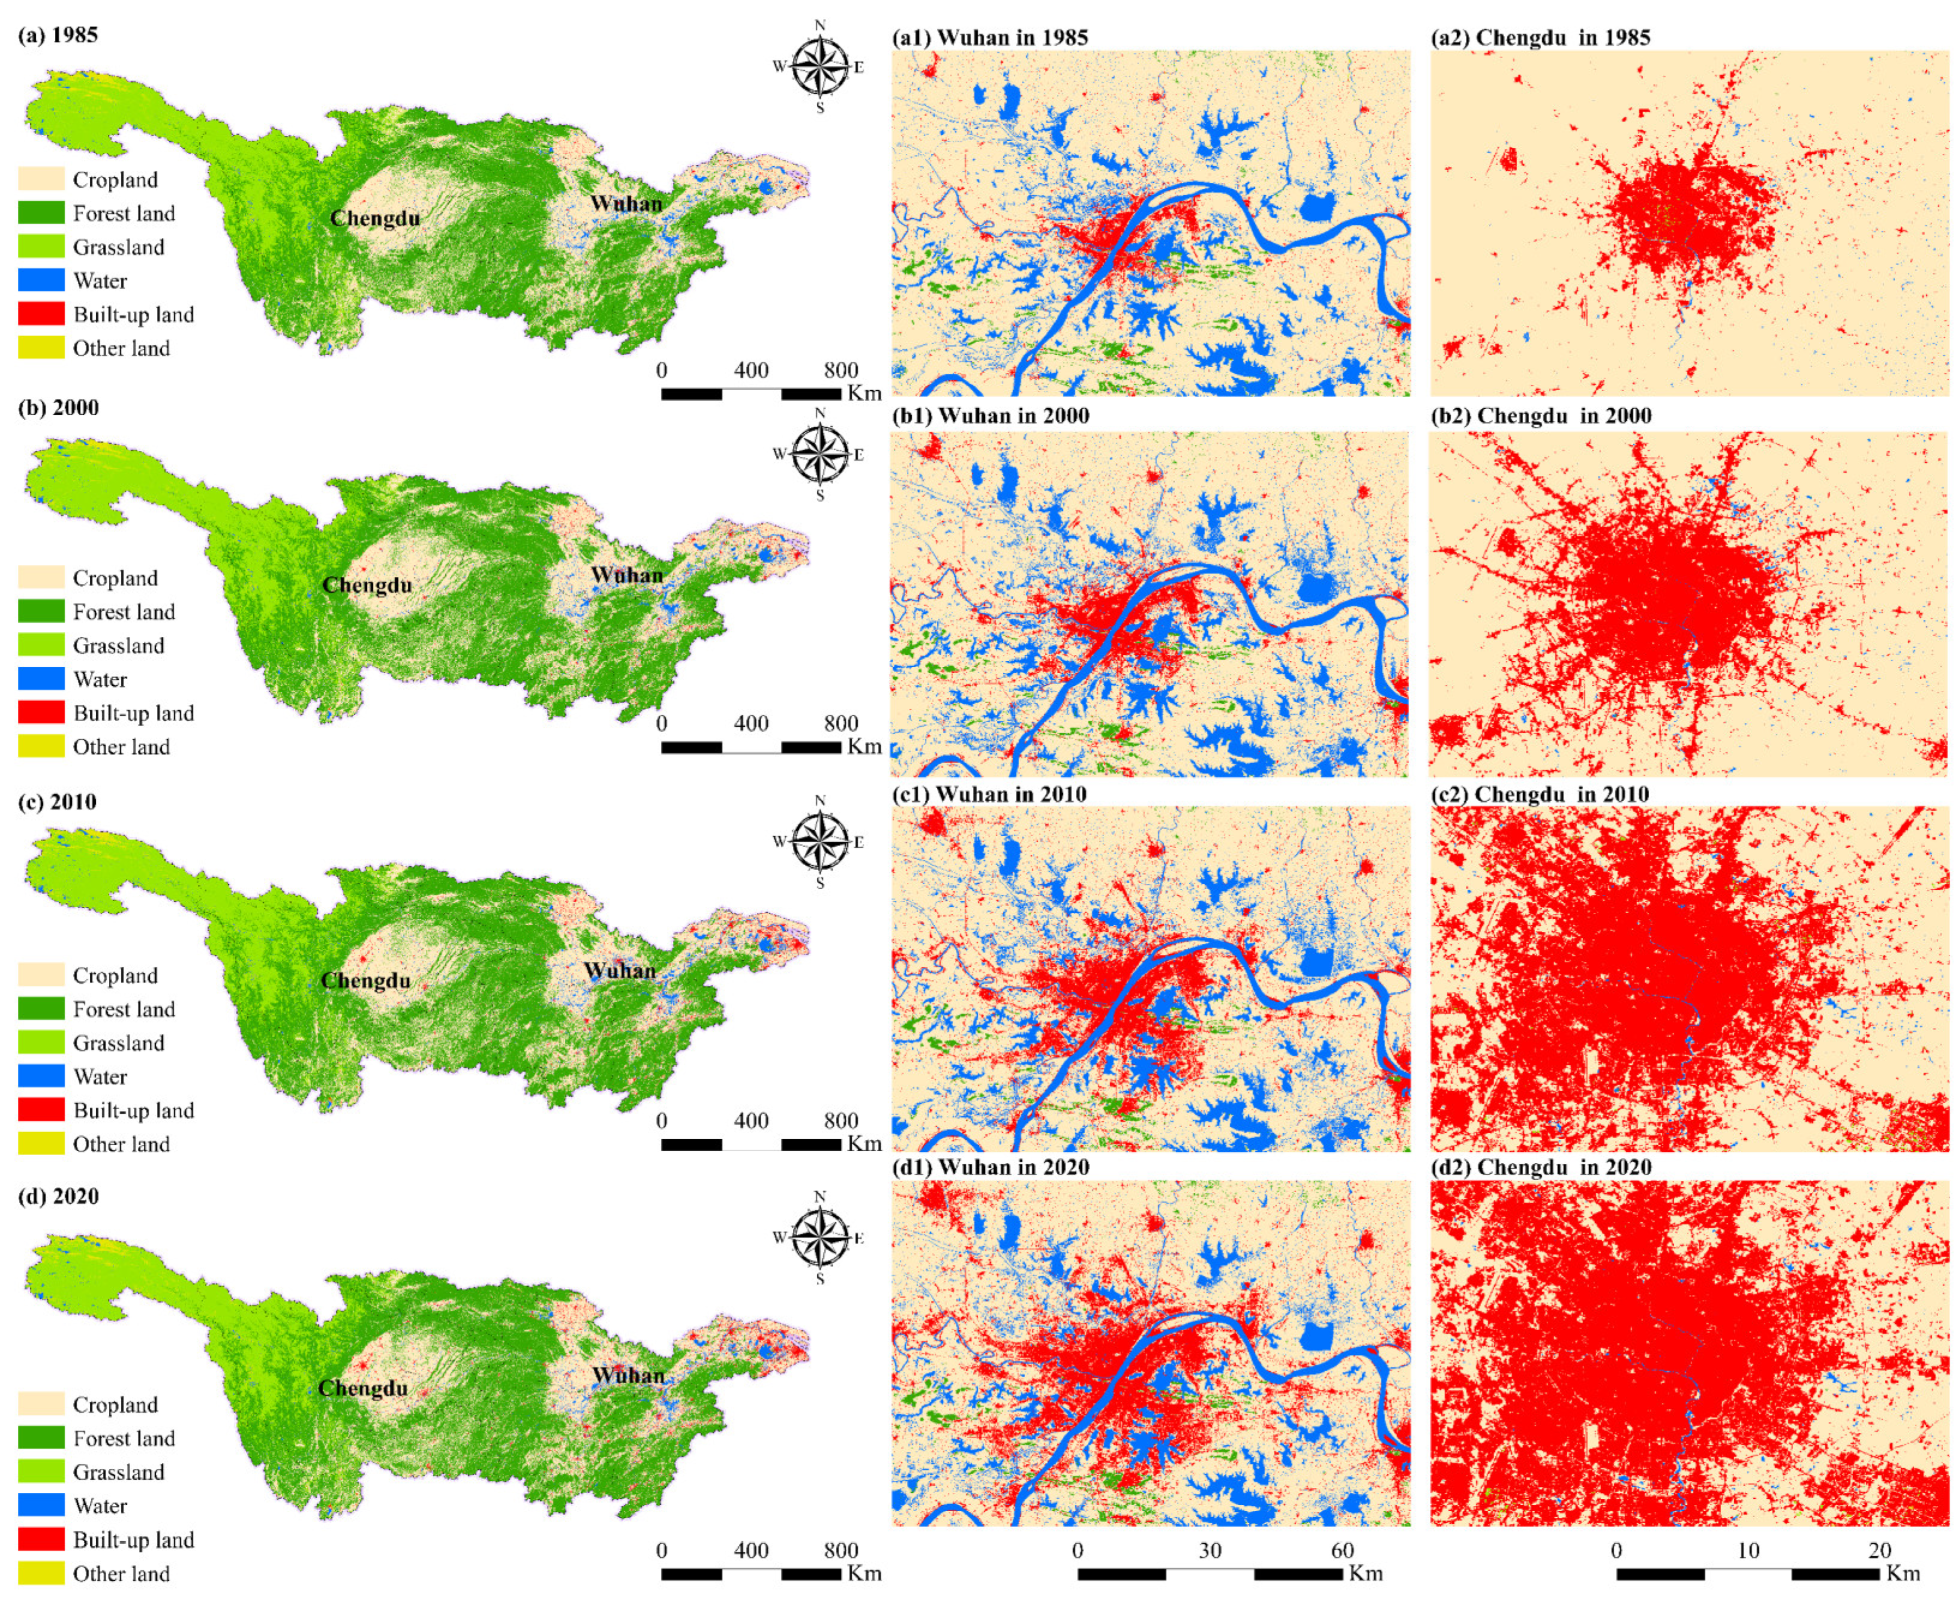
The datasets for the potential carbon storage losses and ecosystem carbon storage vulnerability analysis were grouped into four categories, namely, land, limiting conversion, natural climate, and socio-economic data. These datasets are described in detail below. First, LULC was generated from 1985 to 2020 through Landsat image remote sensing data (https://www.resdc.cn, accessed on 19 April 2023) with a time interval of 5 years. According to the specification of the remote sensing survey of land resources stipulated by the Ministry of Land and Resources, LULC was reclassified into six categories (Table 1), i.e., cropland, forest, grassland, water, built-up land, and other categories (Figure 1).
We evaluated the carbon density by reviewing and drawing on the results of previous research on the known carbon density. Among them, the measured carbon density results of the urban agglomeration in YRB were used as a starting point, and the relationship model between carbon density, temperature, and precipitation was utilized to correct the carbon density values [37]. The carbon density was altered using the formula methods detailed in [38,39], providing the final carbon density values for different types of LULC in each subregion of the study area (Table 2).
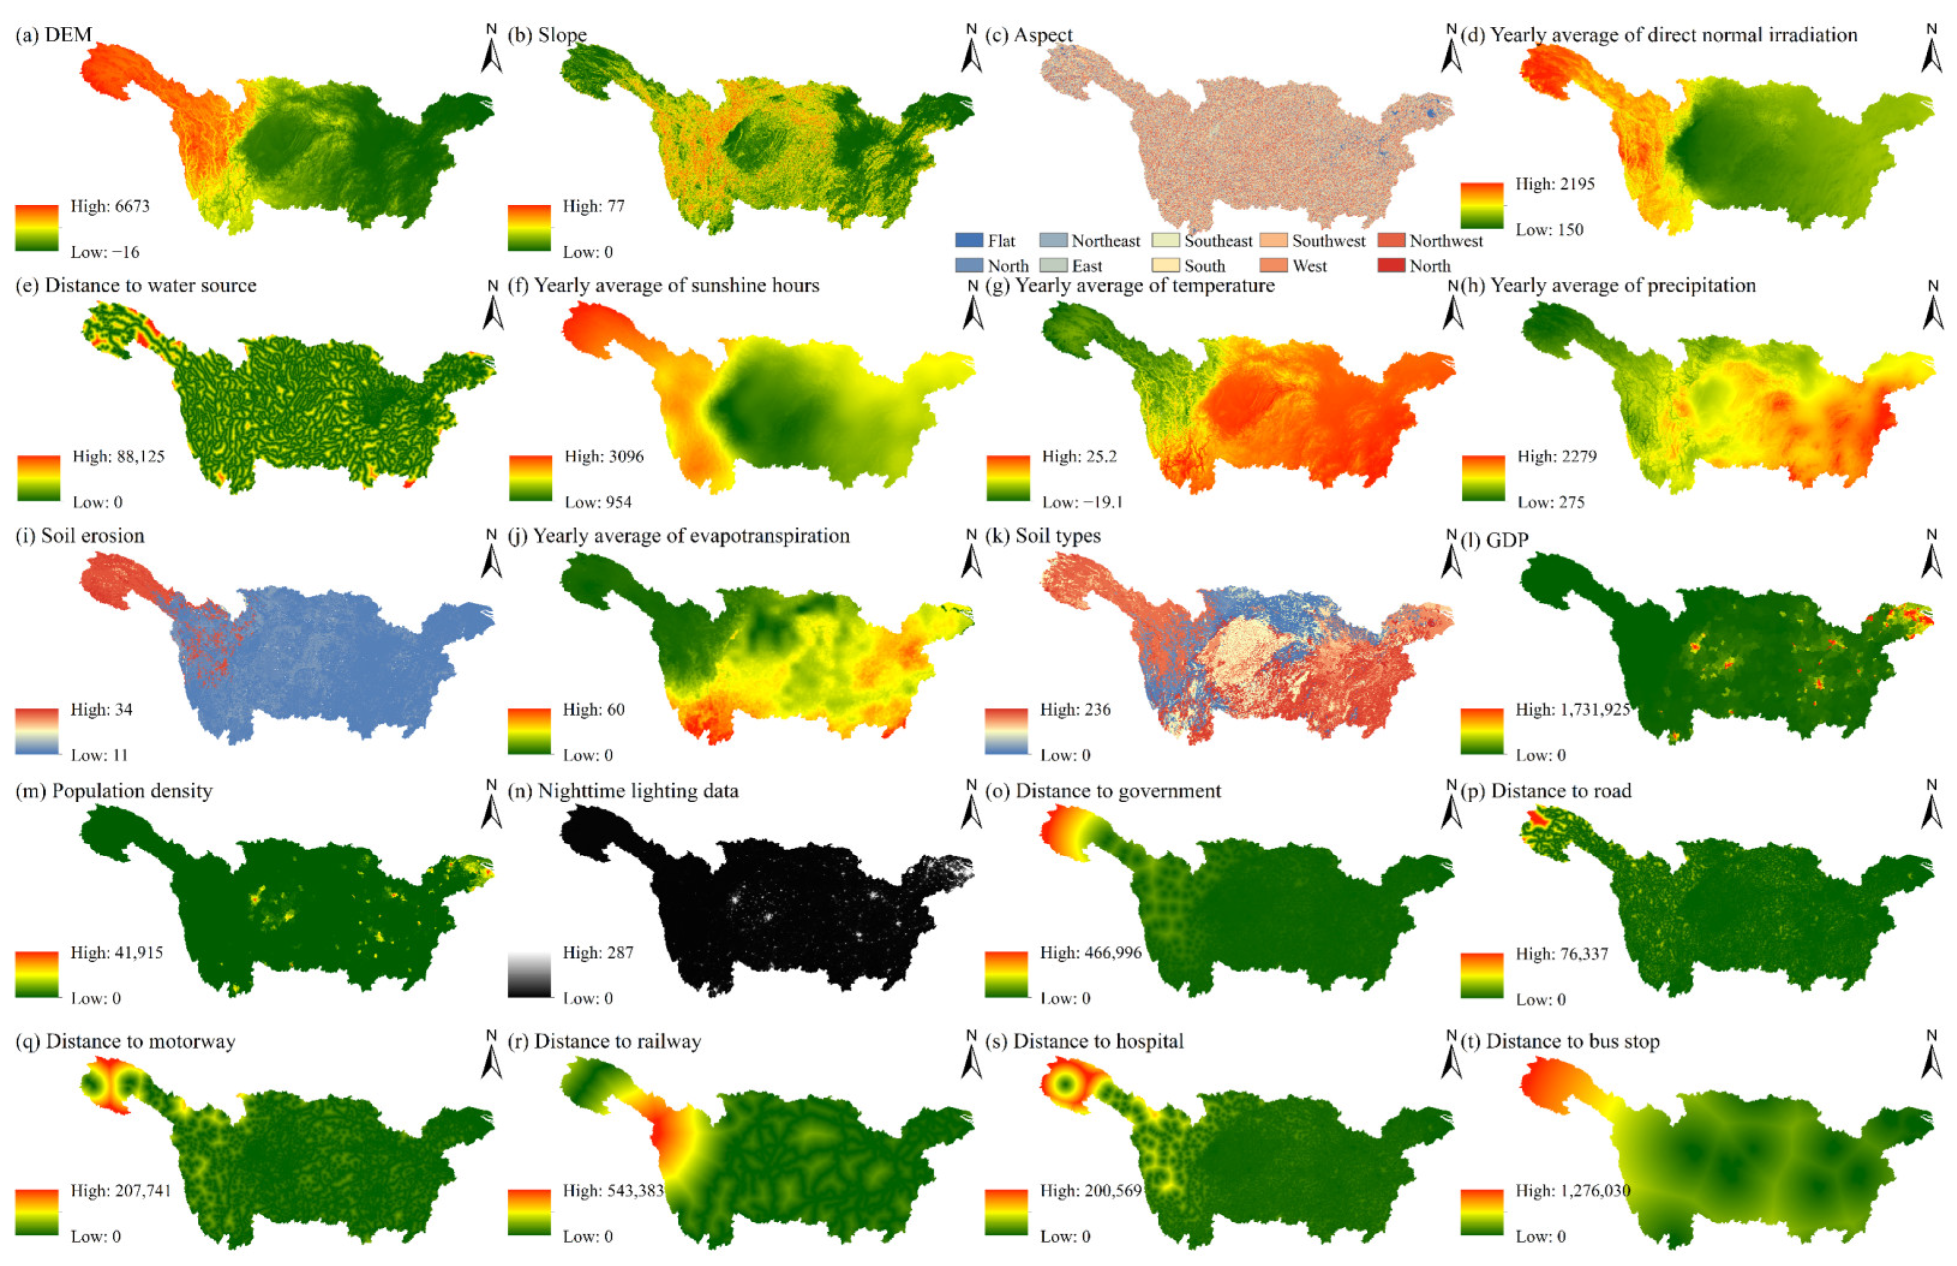
Moreover, digital elevation model (DEM) data sourced from the Shuttle Radar Topography Mission (http://srtm.csi.cgiar.org/, accessed on 21 April 2023) were utilized to generate slope and aspect data. Climate-related factors such as temperature and precipitation, as well as socio-economic variables including GDP and population data, were obtained from the RESDC (https://www.resdc.cn/, accessed on 19 April 2023). Geographic data, including general roads, expressways, railways, and bus stops, were acquired from OpenStreetMap (OSM, https://www.openstreetmap.org/, accessed on 19 April 2023) and analyzed using the Euclidean distance method. All the data were projected by the uniform Krasovsky_1940_Albers projection and resampled to a 30 × 30 m resolution. Table 3 reports the sources and pre-processing steps for the data. Based on the previous studies and the available data, the twenty natural and social–economic factors (Figure 2) were selected as driving factors of LULC changes [40].

2.3. LULC Optimization–Carbon Storage Simulation–Vulnerability Assessment Framework

In this study, a LULC optimization, carbon storage simulation, and vulnerability assessment framework were proposed and integrated with MOP, PLUS, and InVEST models. The MOP method was used to obtain a reasonable and optimal LULC distribution by genetic algorithm with different ecological and economic objectives and multiple LULC area constraints. Furthermore, the future expansion of LULC patches can be generated by the PLUS model through the CA model and the random forest classification method based on economy, climate, and landscape data, and that is a significant input for the InVEST model. The InVEST model as an effective tool for carbon storage analysis was advanced to search for the relationship between ecosystem carbon storage and LULC changes based on carbon pools, current and future LULC data in YRB, and the vulnerability of carbon storage services that is reflected by the LULC intensity and ecosystem carbon storage (Figure 3). The framework of this research includes three main research components:
(i)
Calculation of historical LULC and simulation of carbon storage. Based on the LULC data and carbon density data from 1985, 1990, 2000, 2010, and 2020, the InVEST model was used to analyze the changes in carbon storage in the YRB from 1985 to 2020.
(ii)
Prediction of future LULC distribution and simulation of carbon storage. Based on the LULC data from 2010 and 2020 and 22 given factors (natural and socio-economic factors), the MOP-PLUS model was used to conduct an optimization study on LULC expansion in the YRB. Subsequently, based on carbon density data, the InVEST model was employed to analyze the changes in carbon storage in the YRB.
(iii)
Ecosystem carbon storage service vulnerability assessment. The vulnerability of ecosystem carbon storage services in the YRB was assessed using the PII based on LULC change and carbon storage change.
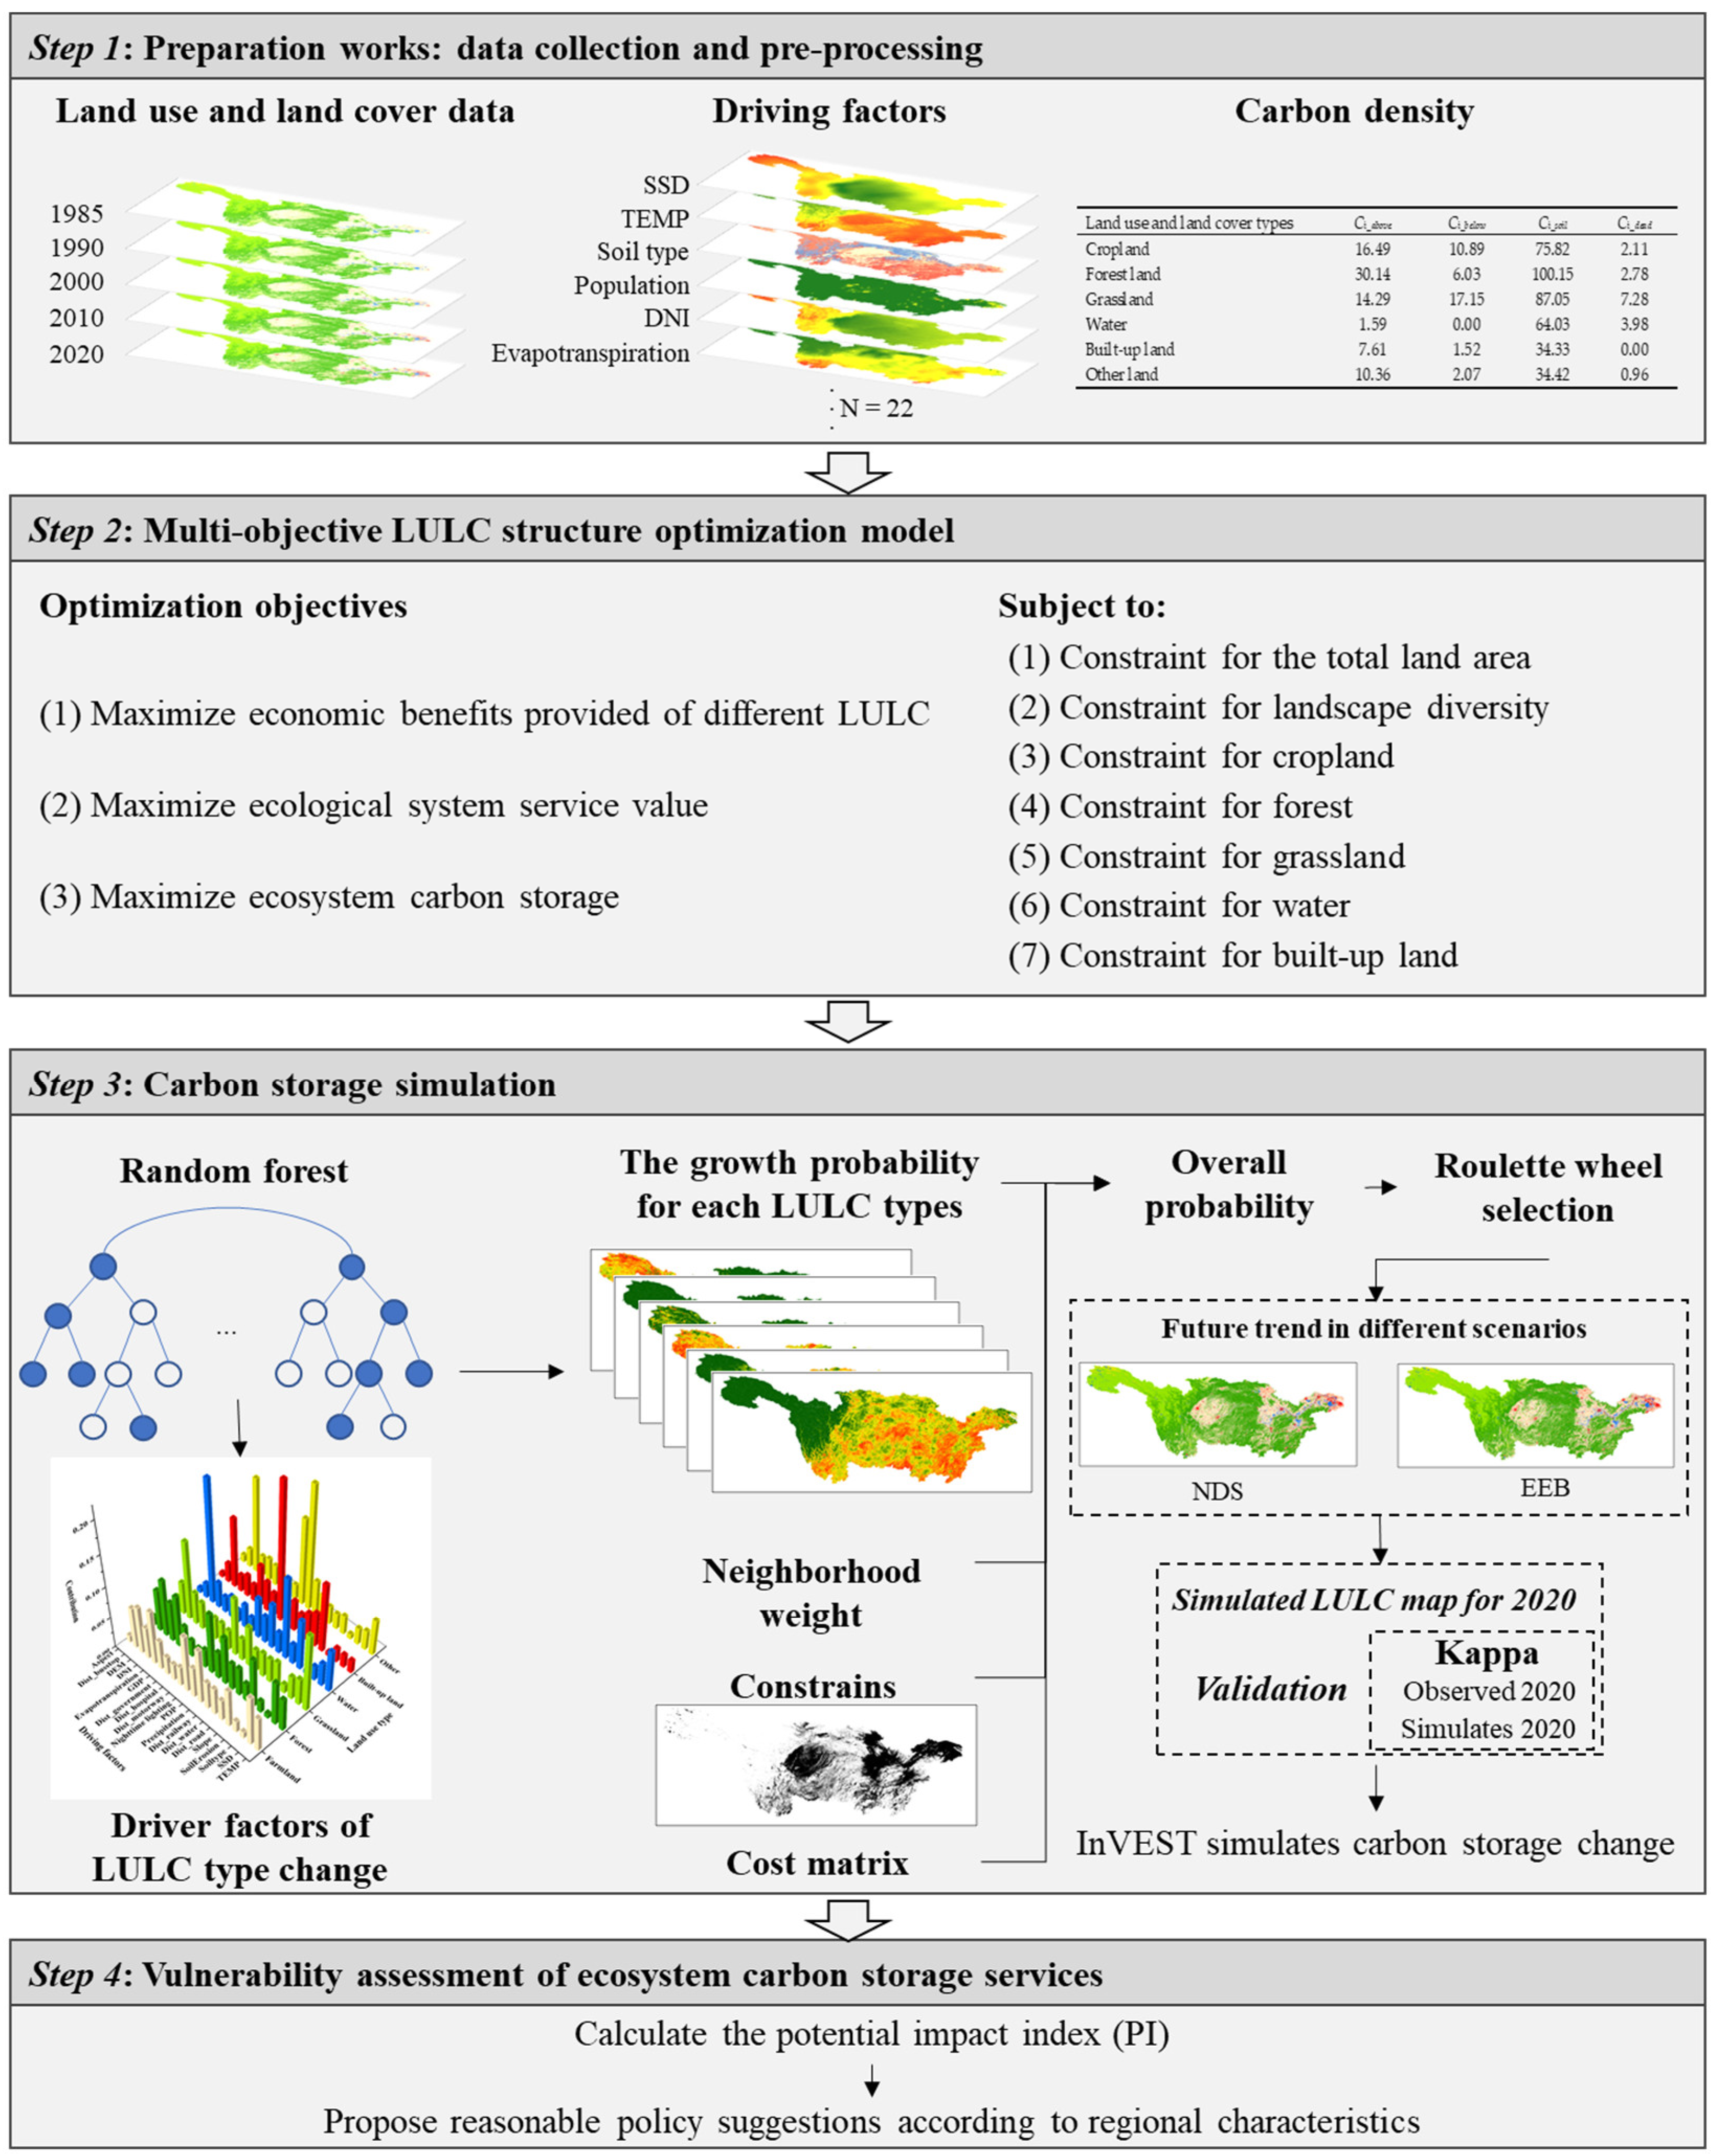
Figure 3. Flowchart of the methodology in the YRB.
Sustainability 16 02235 g003

2.4. Multi-Objective LULC Structure Optimization Model

Considering the goal of carbon peaking by 2030 and the task of carbon neutrality by 2060 in China, the future social–economic development in YRB will be faced with the problem of maximizing the carbon sequestration capacity that would be in connection with LULC reformation, economic development, and ecological protection. Therefore, a multi-objective LULC structure optimization model for balancing the environment and economic development with the goal of maximizing carbon storage can be expressed as follows:
(1)
Maximize the economic benefits provided by different LULCs as follows:
f 1 ( x ) = max j = 1 n c j x j
where f1(x) is economic benefit; cj represents economic benefit per unit area; and xj is the area of different LULC types (j = 1, 2, 3, 4, 5, and 6 denotes cropland, forest, grassland, water, built-up land, and other land, respectively).
(2)
Maximize ecological system service value as follows:
f 2 ( x ) = max j = 1 n d j x j
where f2(x) is the ecological ecosystem service value and dj represents the ESV per unit area.
(3)
Maximize ecosystem carbon storage as follows:
f 3 ( x ) = max j = 1 6 C j _ v a l u e ( x j x j 0 )
where f3(x) denotes the maximization of ecosystem carbon storage; Cj_value denotes the total carbon intensity of the j-th LULC types; and xj0 is the initial class j LULC area.
Subject to:
(1)
Constraint for the total land area: the sum of the area of each LULC type should equal the total area:
j = 1 6 x j = j = 1 6 x j 0 S A
where SA is the total study area.
(2)
Constraints for landscape diversity: grassland and other land are frequently reclaimed for forest or built-up land development. In order to maintain the diversity of the landscape and to allow space for urban development, it is assumed that grassland and other land will make up at least 1% of the total LULC area.
x 3 + x 6 1 % S A
(3)
Constraint for cropland: cropland area should be equal to or greater than the average decline in the historical LULC data and less than or equal to the largest area during the planning period:
x 10 ( 1 v ¯ 1 ) x 1 max ( x 1 t )
where v ¯ 1 represents the average rate of change in the area of cropland; x10 is the initial cropland area; and x1t represents the historical cropland area at time t.
(4)
Constraint for forests: the share of forest cover is calculated on the basis of the “ecological green equivalent”, i.e., the “amount of green” that ensures homogenous photosynthesis and provides quantitative forest ecological functions. In the land system, the LULC types that would satisfy the green equivalent include cropland, forest, and grassland, and the forest area should exceed the natural development scenario:
μ 1 x 1 + μ 2 x 2 + μ 3 x 3 P N D x 2
where μ 1 denotes the cropland green equivalent coefficient; μ 2 is the forest green equivalent coefficient; μ 3 represents the grassland green equivalent coefficient; and PND denotes the forest area coefficient under the natural development projection.
(5)
Constraint for grassland: a large amount of grassland has been converted into built-up land and water bodies since the 1990s. Here, the maximum value based on historical data is used as the upper limit of grassland area:
x 3 max ( x 3 t )
where x3t represents the historical grassland area at time t.
(6)
Constraint for water: over the past few decades, large water areas have been used for built-up land and crop production. Therefore, in order to enhance water resource protection, the decreasing trend in watershed area would decelerate as follows:
x 4 e ( 1 v ¯ 4 ) x 4 x 4 e ( 1 + v ¯ 4 )
where v ¯ 4 represents the mean rate of water area change.
(7)
Constraint for built-up land: based on the current growth trend, the built-up area in the future is expected to exceed the current area and is projected to be the current area plus the average increase during the planning period:
x 5 e x 5 x 5 e ( 1 + v ¯ 5 )
where v ¯ 5 represents the mean rate of built-up land area change.

2.5. InVEST Simulates Carbon Storage Change

The InVEST model is employed for the assessment of various ecosystem service functions and considers several types of carbon pools, i.e., above-ground biomass, below-ground biomass, soil, and dead organic matter [41]. The present landscape carbon storage, or those across a certain time period, can be determined by LULC types and carbon density. The model does not account for volatile carbon in aboveground carbon reservoirs, such as grasslands and short-term crops, due to their limited, rapid renewal, or high stability. The equations for carbon storage assessment for various LULC types in a given area are expressed as follows:
C j _ t o t = C j _ a b o v e + C j _ b e l o w + C j _ s o i l + C j _ d e a d
C t o t a l = i = 1 n ( C j _ t o t A i )
where Cj_tot denotes the total carbon intensity for different LULC types (t/hm2); Cj_above is the aboveground biomass, namely the carbon storage of all live plant material above the soil (e.g., trunks, twigs, and foliage) (t/hm2); Cj_below is the belowground biomass that contains all of the living root parts of the plant (t/hm2); Cj_soil represents the amount of carbon stored in the soil that contains all of the minerals and organic soils, as well as organic carbon (t/hm2); Cj_dead is the amount of carbon stored in non-living organic matter, such as litter and dead trees (t/hm2); Ctotal denotes the total carbon storage (t/hm2); Ai denotes the area of the j-th LULC type (hm2); and n represents the number of LULC types.

2.6. PLUS Simulates Future LULC Dynamics

The PLUS model integrates a land expansion analysis strategy (LEAS) and cellular automata through multiple random seeds (CARS). The LEAS module is designed to extract and sample the extended case of LULC changes at two different times. The random forest classification algorithm is utilized to derive the probability of change for various LULC types, along with the contribution rates of the drivers [42]:
P i , k d ( x ) = n = 1 M I ( h n ( x ) = d ) M
where P i , k d is the final growth probability of LULC type k in cell I; I(∙) is the indicative function of the decision tree set; hn(x) is the prediction type of the n-th decision tree for vector x; and M is the total count of decision trees.
Additionally, an innovative multi-type stochastic patch seeding mechanism was added based on threshold descent.
O P i , k d ( x ) = P i , k d = 1 ( r μ k ) D k t P i , k d = 1 Ω i , k t D k t
where P i , k d = 1 is the growth probability surface of the LULC type; r is a random value between 0 and 1; and μk is the threshold for generating new LULC patches by the user-determined LULC type r.

2.7. Vulnerability Assessment of Ecosystem Carbon Storage Services

The IPCC report indicates that vulnerability is a function of exposure, sensitivity, and adaptive capacity, referring to the degree to which a system is susceptible to or unable to cope with the adverse effects of climate change [43]. Schroter et al. [44] subsequently proposed a starting point vulnerability assessment method that incorporates changes in LULC ratio, expanding the concept of vulnerability. Based on Schroter’s starting point vulnerability assessment method and Metzger et al.’s potential impact index (PII), a dimensionless measure of LULC change on ecosystem vulnerability [45] is proposed. The specific calculation formula is as follows:
P I I = C e C o C o ÷ L e L o L o
P I I = L o ( C e C o ) C o ( L e L o )
L t = 100 l = 1 n ( D t l P t l )
where PII is the potential impact index; Ct is the carbon storage in year t; o is the initial year; e is the end year; Lt is the LULC intensity in year t; Dtl is the LULC intensity classification index for level l; and Ptl is the proportion of area in LULC types. In this study, the Dtl index was categorized into four levels: 1 for other land, 2 for forests, grassland, and water, 3 for cropland, and 4 for built-up land [46].

2.8. Scenario Design

In order to analyze LULC distribution and carbon storage change under different social–economic and ecological conditions in the future, two scenarios were designed and named NDS and EEB. The EEB scenario is to search for a reasonable LULC development strategy for balancing a number of goals (e.g., economic benefit, ecosystem services, and carbon storage), and that can be obtained from the proposed multi-objective LULC structure optimization model. Compared with the EEB scenario, the NDS scenario was established on the assumption of LULC change under a natural development condition without any constraints in the future. A Markov chain model was advanced to calculate the LULC area during the NDS scenario based on the LULC probability matrix from 2010 to 2020, and the related key variables can be expressed as follows:
S N D S = f 4 ( x )
f 4 ( x ) = S ( t , t + 1 ) = P i j S ( t )
P = P i j = P 11 P 1 j P i 1 P i j
where f4(x) is the probability of transitioning from one LULC into another LULC; S(t) is the system status at time of t; S(t+1) is the system status at time of t + 1; and Pij is the transition probability matrix.

3. Results

3.1. Impact of LULC on Carbon Storage from 1985 to 2020

3.1.1. Dynamics of LULC Changes from 1985 to 2020

In terms of distribution, due to different terrain and climate in the YRB, the main LULC types from 1985 to 2020 were forests, croplands, and grasslands (Figure 4). Forests dominated, accounting for 46.99% of the whole study site in 2020 (Table 4). The average growth rate from 1985 to 2020 was 0.1%. They are mainly distributed in the first step, particularly within the eastern region of Ganzi Tibetan Autonomous Prefecture, including the Sanduoli Mountains, Daxue Mountains, and areas north of the Qinling Mountains. The new forest areas are mainly located across the northern, southern, and southeastern regions of the YRB. Cropland is the second-largest ecosystem in the YRB, comprising 28.76% of the basin zone in 2020. It was concentrated in the Sichuan Basin in the second step, the Yunnan–Guizhou Plateau, and the middle and lower reaches of the YRB in the third step. Cropland in the second step was mainly dry land, and paddy fields were principally located in the third step. Between 1985 and 2020, cropland decreased by 2.12% due to the need for land expansion in forests, water, and built-up land, and the decrease was mainly concentrated in the upper and middle reaches of the YRB. Grassland comprised 18.34% of the YRB area, mainly distributed in the Qinghai–Tibet and Yunnan–Guizhou Plateaus, with a decrease of 1.33% from 1985 to 2020. The most significant change in the ecosystem was the expansion of built-up land, which increased by 459.29% from 1985 to 2020 and grew steadily year by year. It is mainly distributed in the third step, particularly near provincial capital cities in the middle and lower reaches of the YRB. Cities on both sides of the rivers are densely populated, except for the upper reaches of the Jinsha River Basin.
In terms of transition characteristics, LULC type mainly changed between cropland, forest, grassland, and built-up land during 1985–2020 (Table 5). LULC change between cropland and forest is most obvious, accounting for 76.70% of the total changes during the 35-year period. Of the total area converted, cropland was the biggest contributor at 47.94%, implying a net decrease in crop cultivation. The main conversion of LULC was forest and built-up land, which agrees with the afforestation and urbanization at the study site. The forest area was enhanced by 39.91%, with the main source of the area being cropland (83.16% of the net increase). The total increase in the built-up areas amounted to 14%, which was 33.64 times more than the total decrease in the area, mainly from cropland and forests. The conversion of grassland and forest is balanced, with each compromising approximately 24% of the study site zone.

3.1.2. Driver Factors of LULC-Type Change

The provincial capital cities in the YRB are among the areas experiencing the most rapid urban and economic development, with highly clustered anthropogenic activities. Observing the LULC structural characteristics, significant dynamic changes have occurred in built-up land and cropland areas. Therefore, these large-scale land changes reflect increased human activity. Using the LEAS module, the impact of different drivers on the growth of LULC types can be observed in Figure 5. Simulation results show that six factors mainly drive forest expansion. The influencing values from large to small are altitude, nighttime light, evapotranspiration, slope, precipitation (with a decline from the southeast to northwest), SSD, etc. Flat terrain, fertile soil, abundant land resources, and favorable hydrothermal properties in the middle and lower reaches of the YRB make it a crucial agricultural zone and a major source of commodity grain production in China [47]. Nighttime light, precipitation, evapotranspiration, SSD, and altitude mainly promote cropland’s decline. The expansion of grasslands is mainly driven by transportation, precipitation, and nighttime light. DEM and precipitation are the main causes of water body expansion. Most of the abundant water resources are located in the top-most river reaches (above Yichang, Hubei Province), traversing the first and second steps with a vertical drop exceeding 6000 m. DEM, nighttime light, and slope mainly drive built-up land expansion. In particular, cities in the middle and lower reaches have dense populations and rapid economic development and are crucial industrial and agricultural bases in China. The largest influence on built-up land is human activity, followed by DEM, which contributes more than 0.17. At the same time, socio-economic factors such as proximity to urban centers, population density, and GDP are driving the continued expansion of built-up land outward.

3.1.3. Carbon Storage Dynamics from 1985 to 2020

This study did not directly measure the carbon storage in the YRB, and the large area of the research site made it impossible to verify the results for each individual region. Therefore, we selected three areas within the study region and employed the method proposed by Shen et al. [48] to validate the model simulation results using the relative error. Based on this, we determined that the relative errors for soil organic carbon storage in the Dongting Lake Basin, Pingxiang, and Hunan were 2.93%, 1.78%, and 1.97%, respectively (Table 6). These findings indicate that the InVEST-predicted carbon storage effectively reflects the true carbon storage across the entire region.
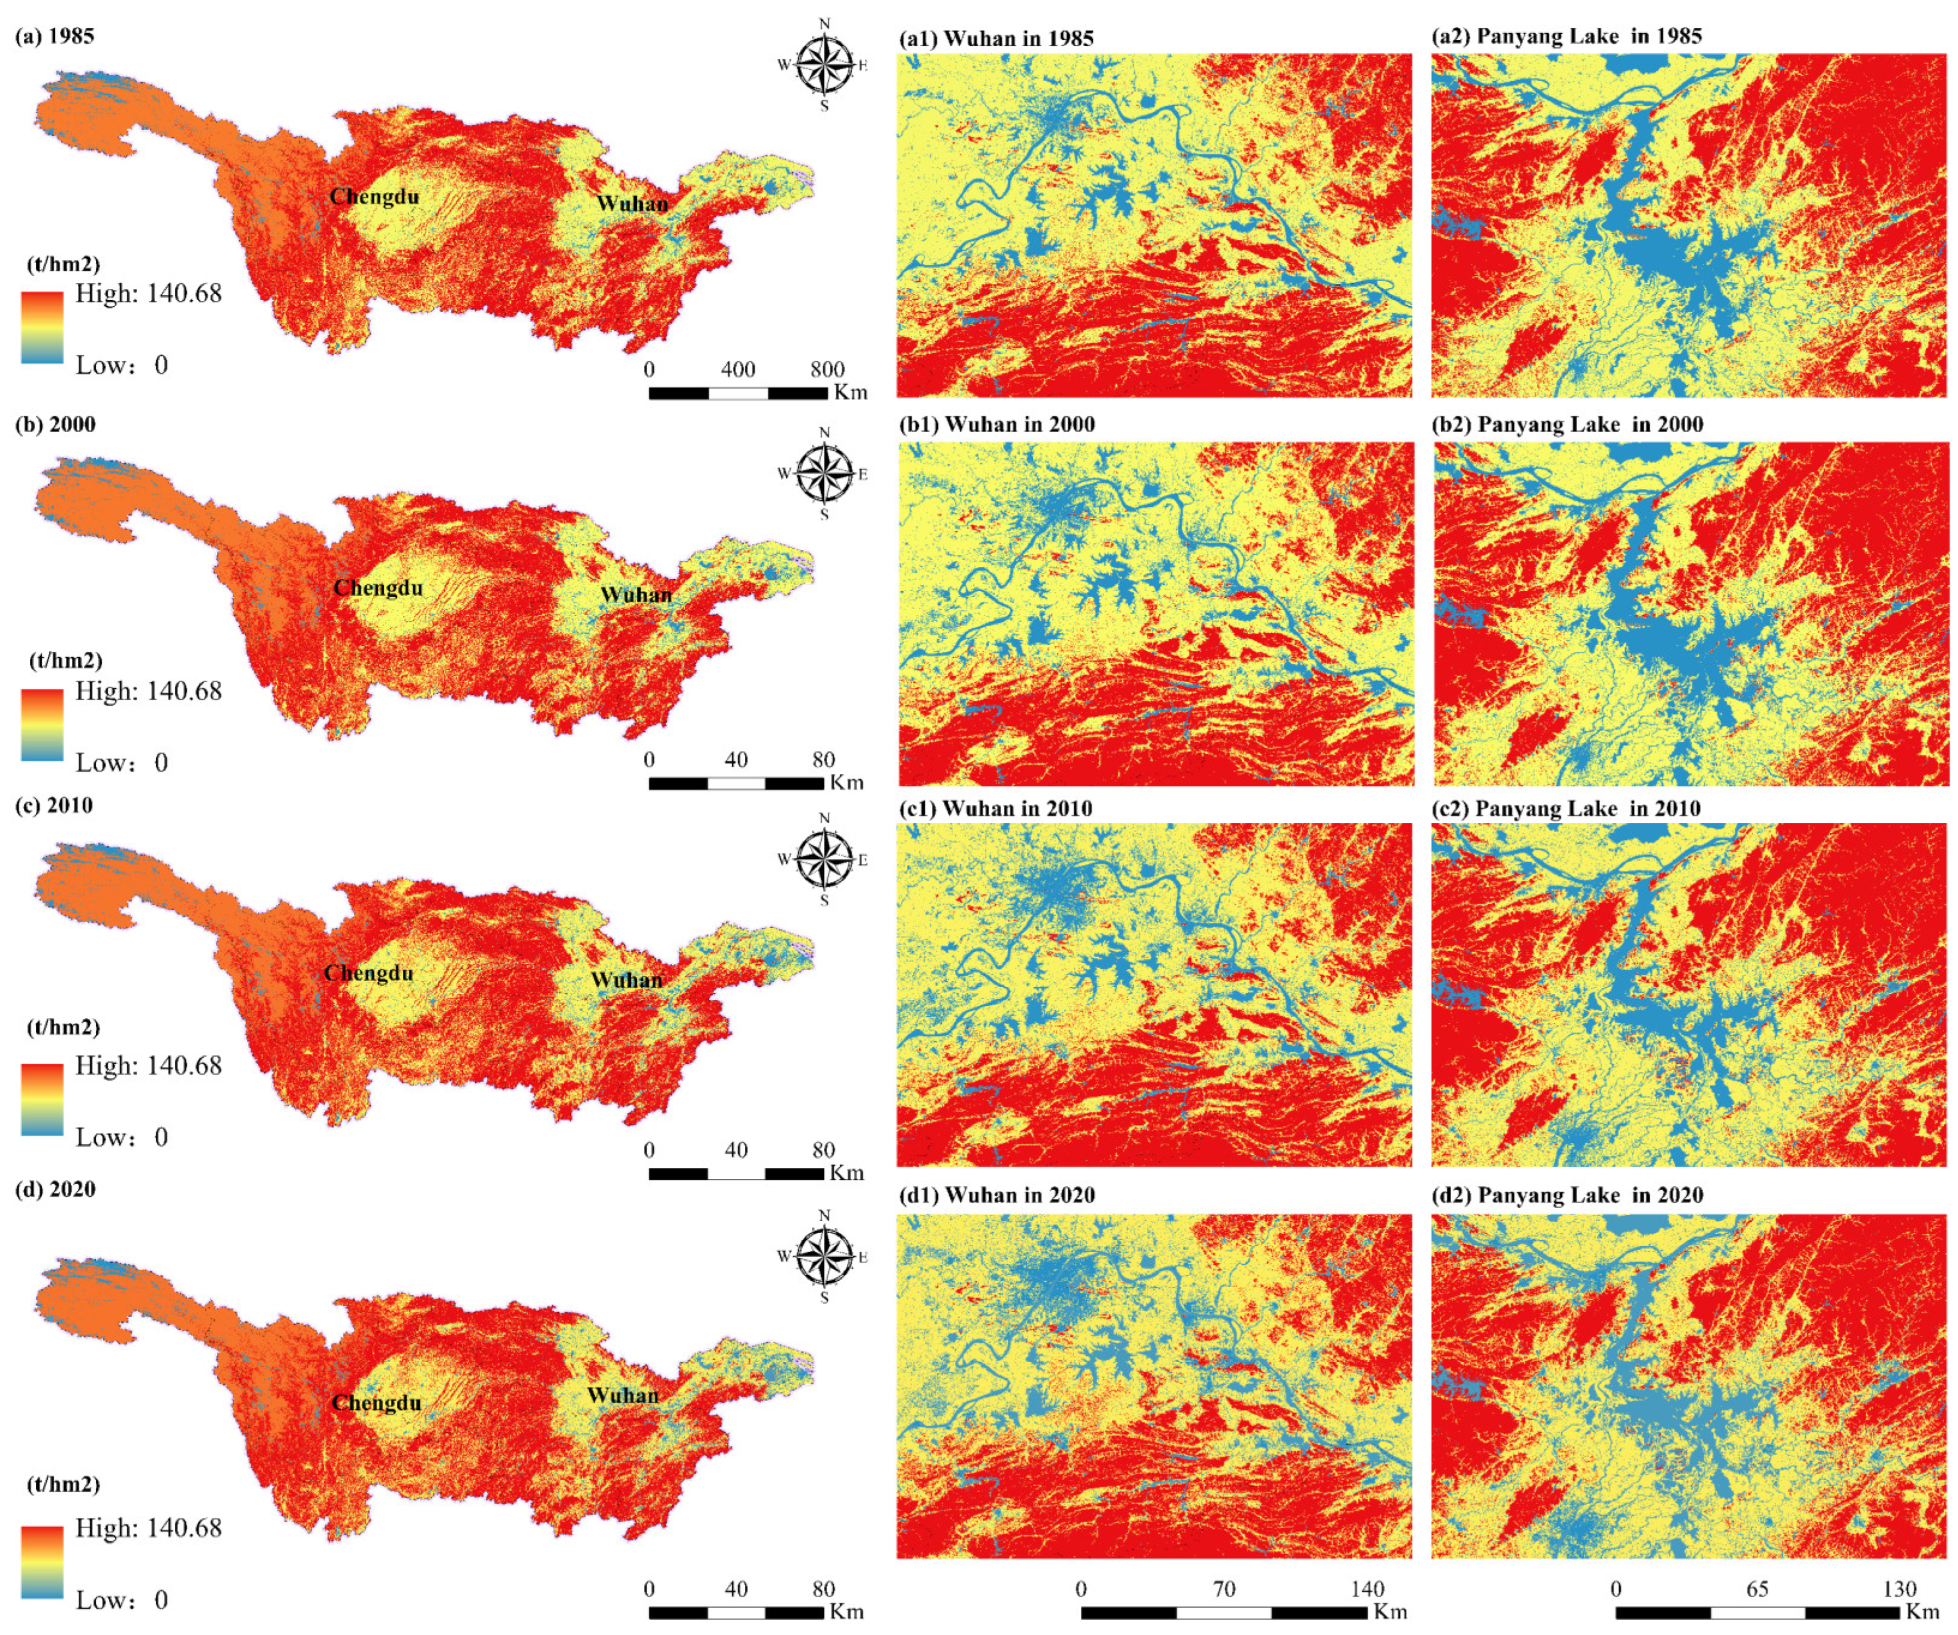
Figure 6 shows the spatial distribution and spatial quantity of carbon storage from 1985 to 2020, calculated using InVEST. The carbon storage exhibits a spatial pattern of high-low-high-low from west to east, with significant spatial heterogeneity. Table 5 shows that the entire ecosystem carbon stocks in the YRB between 1985 and 2020 were 22.105, 22.120, 22.081, 22.014, and 21.927 (unit: 109 t), respectively. The average carbon density is 122.880, 122.965, 122.749, 122.373, and 121.893 (unit: t/hm2), showing a trend of gradual increase followed by a rapid decline. From 1985 to 2020, carbon storage and average carbon density decreased by 0.178 × 10⁹ t and 0.99 t/hm2, respectively.
Fast economic growth, industrialization, and urban expansion have accelerated the demand for land, leading to the advancement of high carbon-density land and increasing carbon emissions. From 1985 to 2020, 25% of built-up land areas presented an upward pattern in carbon storage, while the remaining cities showed a declining trend. The transition in LULC primarily involves shifting from high to low-carbon-intensity land, which includes transformations from cropland to built-up land and from forest to grassland. The changes in carbon storage losses are mainly concentrated in Shanghai Province, Jiangsu Province (Suzhou, Nanjing, and Wuxi), and Jiangxi Province (Yichun and Ji’an). Table 7 shows the decrease in carbon storage from 1985 to 2020 for all three carbon reservoirs decreased. Among them, soil organic carbon exhibited the most significant reduction, with an accumulated loss of 0.106 × 10⁹ t, accounting for 59.55% of the entire reduction of carbon storage. Between 1985 and 2020, the aboveground carbon storage increased, with a cumulative increase of 0.007 × 10⁹ t, while underground carbon storage exhibited a reduction of 0.006 × 10⁹ t.
From 1985 to 2020, the areas of cropland and grassland exhibited a decreasing trend, resulting in a decline in their carbon storage by 0.4 × 10⁹ t and 0.3 × 10⁹ t, respectively. The carbon storage in forests, water bodies, and built-up land increased by 0.036, 0.002, and 0.14 × 10⁹ t, respectively. The order of contribution of various LULC changes to the total soil carbon pool remained unchanged: forest land > cropland > grassland > water bodies > built-up land > other land. The extent of coverage of cropland, forests, and grasslands and the stability of soil carbon storage in them are critical for maintaining the overall strength of local soil carbon storage. From 1985 to 2020, the combined contribution to the total carbon pool remains consistently above 97%. However, the most significant change in the structure of the soil carbon pool is the dramatic reduction in cropland and grassland, which decreased by 1.62% and 1.21%, respectively. This has led to a notable decrease in the proportion of the soil carbon pool relative to the total soil carbon pool.
The significant reduction in high carbon density LULC types inevitably impacts the overall regional carbon storage quantity. From 1985 to 2020, the carbon storage in the upper reaches of the YRB increased by 0.005 × 10⁹ t, and the substantial increase in carbon stock in forest land (0.422 × 10⁹ t) offsets the loss of carbon storage transferred into built-up land. Carbon storage in the upper reaches of the YRB show a trend of increasing and then slowing down. The western region has relatively slower urban development, lower land development intensity, more ecological land such as forests and grasslands, and relatively higher regional carbon storage. Compared with the lower reaches of the YRB, the middle reaches of the YRB have the most serious loss of carbon storage of about 0.102 × 10⁹ t, and the carbon storage of forest land decreased by 0.061 × 10⁹ t. The decrease of carbon storage in the lower reaches of the YRB is mainly due to the large-scale reduction of cropland. Cities in the middle and lower reaches of the YRB have a higher development intensity, dense population, higher demand for housing, and a higher proportion of housing, with the development rate of some cities exceeding 30%. The above analysis shows that the main reason for the decline of cropland and grassland is the intensification of human activities.

3.2. Assessment of Carbon Storage Characterization

3.2.1. LULC Future Scenario Simulation

A comparison was conducted between the actual and predicted LULC data for the same year (2020). The results were validated using the widely accepted Kappa Index of Agreement [52]. Statistical outcomes are considered accurate and satisfactory when the coefficient is above 0.80 [53]. In this study, the prediction accuracy result is 0.897, which demonstrates that PLUS is reliable in forecasting the LULC distribution in the future YRB region, with highly precise predictions that are satisfactory.
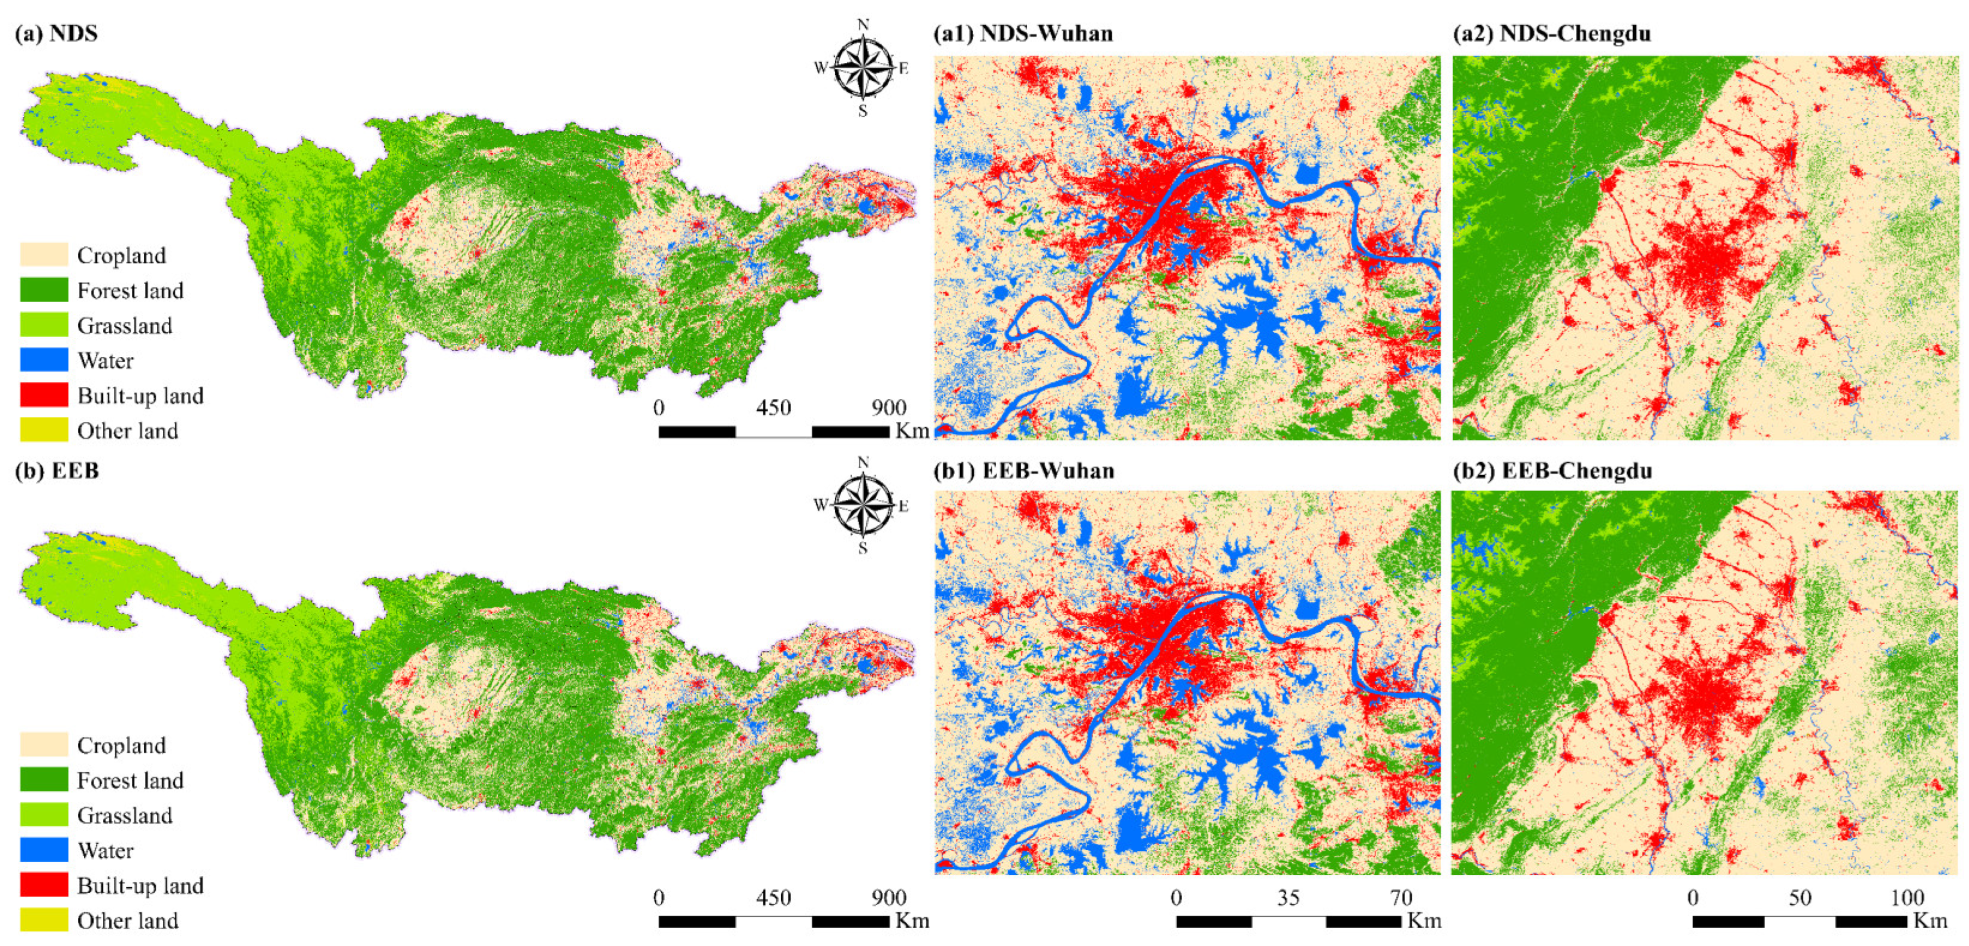
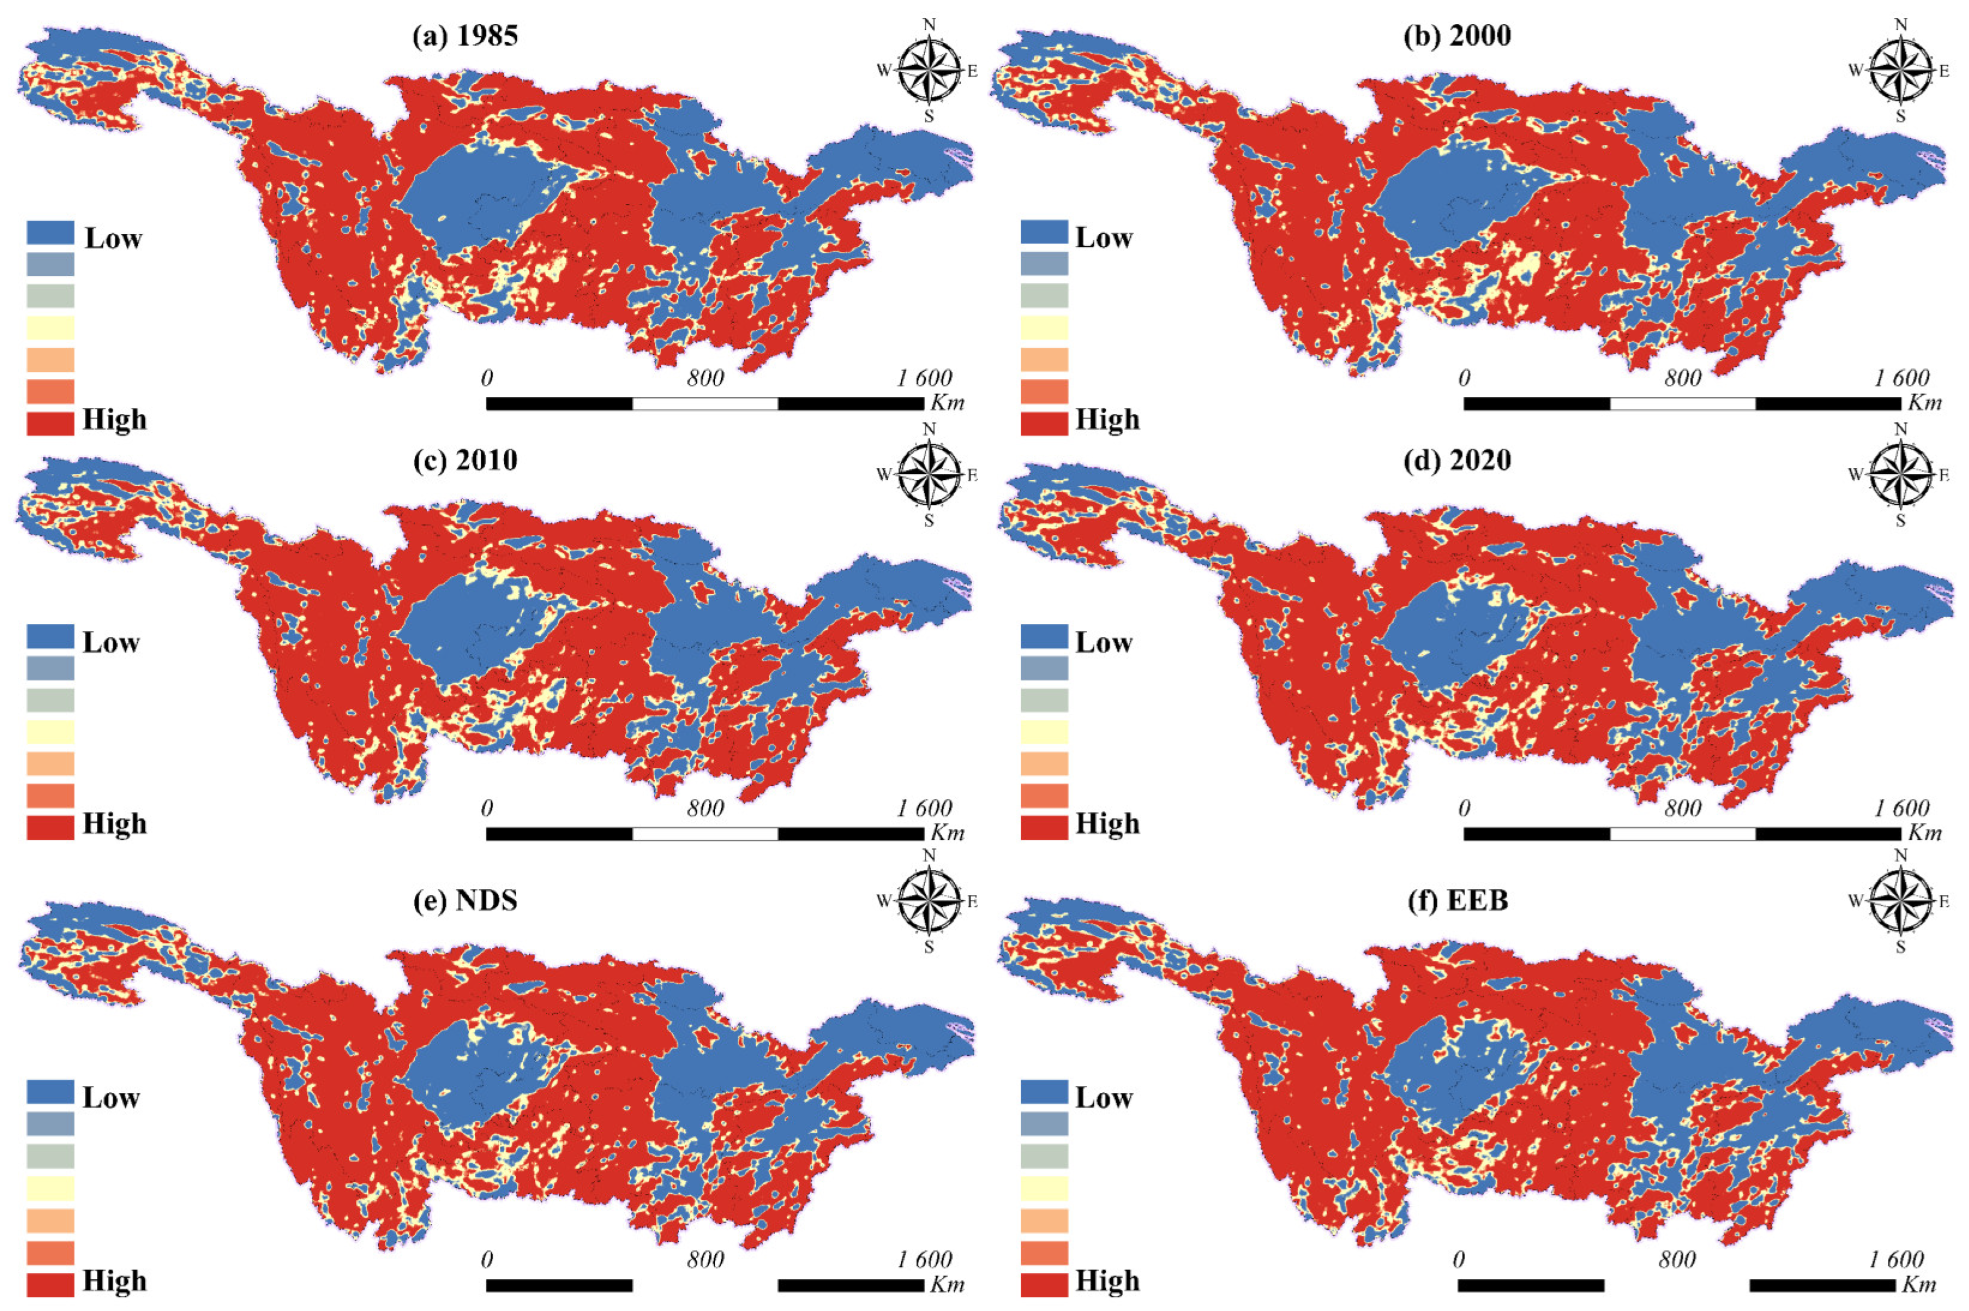
We adopted the 2020 LULC data for the PLUS model to predict future LULC data across two scenarios. The MOP model was used to estimate the area of the individual LULC types for the different cases by integrating socio-economic-ecological impacts (Table 8). Compared with 2020, LULC conversion under the NDS scenario was mainly distributed among forest, cropland, grassland, water, and built-up land. Among them, the increase in forest and built-up land mainly comes from cropland, accounting for about 75.8% and 97.49% of the increase in forest land and built-up land, respectively (Figure 7). Grassland is mainly converted into water and forest land, accounting for about 89.84% and 24.2% of the increase in water and forest land, respectively. The LULC conversion in the EEB scenario occurs mainly between forest land, cropland, water, built-up land, and other land. In this scenario, economic and ecological benefits are developed in balance. The forest, water, and cropland areas increased the most. The forest area increased by 0.66%, water areas increased by 8.95%, and built-up land increased by 10.94%. Compared with NDS, LULC structures under EEB tend to limit the carbon footprint rather than exacerbate the depletion of ecological resources.
Analyzing various watersheds under the NDS scenario reveals that the reduction in cropland and grassland area follows a pattern of being more prominent in the upper reaches of the YRB, followed by the middle reaches, and least prominent in the lower reaches. Contrastingly, the upper reaches of the YRB experience the most substantial increase in the area of forest land. The surge in built-up land area was primarily concentrated in the lower reaches of the YRB. In the context of the EEB scenario, there is a notable expansion of forest land, primarily in the upper reaches of the YRB. Meanwhile, the augmented areas in the middle and lower reaches of the YRB are characterized by an increase in cropland and built-up land, respectively.

3.2.2. Carbon Storage Dynamics from 2020 to 2030

Under the NDS and EEB scenarios, carbon reserves are 21.858 and 22.024 (unit: 109 t), respectively. The average carbon density was 121.5069 and 122.4297 (unit: t/hm2), respectively. The spatial distribution pattern will still be high-low-high-low from west to east (Figure 8). From 2020 to 2030, carbon storage will continue to change (Table 9), with an accumulated consumption of 67 × 106 t under NDS. The carbon storage of all four reservoirs will exhibit a declining trend. Above-ground, underground, soil, and dead organic matter carbon storage will decrease by 3, 20, 66, and 6 × 10⁶ t, respectively. In the EEB scenario, the cumulative increase is 97 × 106 t. Above-ground, below-ground, soil carbon stocks, and dead organic matter carbon storage will increase by 13, 7, 74, and 3 × 10⁶ t, respectively. These results demonstrate that implementing ecological preservation measures will influence the formation of carbon sinks in the YRB and alleviate carbon sink consumption, achieving maximum carbon neutrality. Under ecological conservation policy constraints, the carbon sequestration capacity in EEB is higher than in NDS.
In the NDS scenario, the carbon stock in the YRB exhibits a consistent decline from 2020 to 2030, with a total reduction of 0.983 × 10⁹ t. The expansion of forest land area increased to 0.539 × 10⁹ t in carbon storage. However, the ongoing reduction in cropland and grassland areas contributed to a decline in carbon storage by 1.190 × 10⁹ t and 0.976 × 10⁹ t, respectively. The overall carbon storage is primarily influenced by the deceleration in the expansion of forest land, the swift growth of built-up land areas, and the notable reduction in the extent of cropland and grassland. Under the EEB scenario, the carbon stock in the YRB increased by 0.944 × 10⁹ t. The primary contributors to the increase in carbon storage were the expansion of forest land and cropland areas, contributing 0.915 and 0.558 × 10⁹ t, respectively. The reduction in the area of other land and grassland by 0.895 and 0.007 × 10⁹ t, respectively, served as the main factors driving carbon emissions.

3.2.3. Spatial Autocorrelation Assessment of Carbon Storage

Global autocorrelation analysis of carbon storage can validate spatial clustering and dispersion. Looking at the spatial autocorrelation results in Table 10, Moran’s I for global autocorrelation during each period is consistently greater than 0. This indicates that the carbon stored within the YRB ecosystems exhibits clustering, with neighboring regions influencing each other. Over the study period from 1985 to 2030, Moran’s I index shows a continuous increase, implying a strengthening trend in the spatial clustering effect of carbon storage.
To comprehensively investigate the spatial clustering of the carbon stored within the ecosystems of the YRB and provide a better explanation of urban agglomerations, the local Getis-Ord Gi* method was employed. Local statistical data were sorted in descending order using the natural break method. In Figure 9, the carbon storage in watershed ecosystems exhibits pronounced hot and cold spot effects. The distribution of carbon storage hotspots is relatively scattered, with no significant variations in the distribution of high- and low-carbon storage. Hotspots of carbon stocks are observed in the YRB upper reaches, specifically in Sichuan Province (Garze Tibetan Autonomous Prefecture, Aba Tibetan and Qiang Autonomous Prefecture, Liangshan Yi Autonomous Prefecture, Lijiang City), Hubei Province (Enshi Tujia and Miao Autonomous Prefecture), and Hunan Province (Zhangjiajie, Xiangxi Tujia, and Miao Autonomous Prefecture). On the other hand, carbon storage cold spots are concentrated and stable, primarily situated in the middle and lower reaches of the YRB. These are predominantly located within the Sichuan Basin lower part of the YRB and in Anhui, Jiangsu, and Shanghai provinces. Notably, from 1985 to 2020, Sichuan Province and Chongqing Province witnessed a significant increase in carbon storage with an expanding accumulation range.

3.3. Vulnerability Analysis of Ecosystem Carbon Storage Services

From the analysis of the potential impact index of vulnerability to ecosystem carbon storage services, the LULC intensity of the entire YRB shows an upward trend from 1985 to 2020, with an accelerated rate of increase (Figure 10 and Table 11). LULC intensity in the middle and lower reaches of the YRB shows an upward trend, with LULC intensity in the lower reaches of the YRB rising at the fastest rate. A large amount of cropland is converted to built-up land, which becomes the main reason for the rise in LULC intensity. Cropland with a lower LULC index decreased significantly during this period, and the built-up land area with the highest LULC index expanded more. Therefore, LULC intensity showed a rising trend due to the regional ecological environment. Differently, the LULC intensity in the upper reaches of the YRB shows a rising and then declining trend, with cropland with a higher LULC index decreasing significantly during this period and forest area with the lowest LULC index expanding more. Although the LULC index for built-up land was higher, the proportion of built-up land expansion was much lower than the proportion of cropland reduction and forest land expansion.
In the 2030 projection scenario, the NDS scenario shows an increase in LULC intensity of 0.33 from 2020 to 2030 and a decrease in carbon storage of 70 × 106 t. LULC increases due to a large decrease in grassland area, which has the lowest LULC intensity, and a large increase in built-up land. Vulnerabilities decreased slightly from 2020 to 2030. The PI value is negative, indicating that LULC still has a negative impact on carbon storage services. In the upper, middle, and lower reaches of the YRB, vulnerability decreases, but the upper reaches of the YRB have a positive impact on carbon storage services. The EEB scenario shows that the LULC intensity is strengthened by 0.647 and the carbon storage is increased by 97 × 106 t. The LULC intensity is increased due to the significant decrease in the area of the other land with the lowest LULC intensity and a significant increase in the area of forest, built-up land, and water. Vulnerability increased slightly from 2010 to 2020. Positive PI values indicate that LULC has a positive impact on carbon storage services. The impact has increased across all parts of the YRB.

4. Discussion

4.1. Contributions of Drivers to Changes in LULC

LULC conversions typically arise from the intricate interplay of socioeconomic and natural factors. The most significant factor influencing forest dynamics is the DEM, surpassing a magnitude of 0.12, followed by precipitation. The geomorphology of the YRB is dominated by mountains and hills, accounting for 84.7% of the total basin area, while plains and lakes occupy smaller proportions, approximately 11.3% and 4.7%, respectively. The terrain varies greatly in relief [54]. Du et al. [55] have also demonstrated that geomorphology is a primary factor affecting forests. Anthropogenic activities (e.g., nighttime lighting) also had a significant effect on forest growth, with the same conclusions as Li et al. [56]. Research by Fan et al. [57] indicates that in areas with weaker human activity intensity, there is a higher likelihood of forest area expansion. The primary factors contributing to the expansion of cropland were identified as the economy and precipitation, aligning with the findings of Chen et al. [58]. Figure 5 shows that NLD contributes more than 0.10 to grassland expansion. Jiang et al. [59] demonstrated that human activities have contributed to the mitigation of grassland degradation. The most significant impact on water and other land increases is attributed to DEM, which is consistent with the findings of Sliva et al. [60]. Human activities (e.g., nighttime lighting) were identified as the foremost contributor to the significant impact on built-up land, with DEM closely following, contributing more than 0.17. Wu et al. [61] also emphasized the significance of socio-economic factors in influencing the expansion of the built-up land area. Overall, LULC change in the YRB is influenced by the interplay of natural and socio-economic factors. Among these, DEM and human activities (e.g., nighttime lighting) have high contributions to LULC across all LULC types, indicating that topography plays a crucial role in shaping LULC in the YRB.

4.2. Response of Carbon Storage to LULC

Due to the differences in carbon density among various LULC types, changes in LULC types will inevitably lead to variations in terrestrial carbon storage. Existing research indicates that forests, as the largest carbon pool in terrestrial ecosystems, possess the highest carbon storage among all LULC types [62]. This conclusion has been validated in the other regions using similar methods. For example, Keith et al. [63] point out that forests have the highest biomass carbon density in the world. The destruction of forest ecosystems will result in a substantial decrease in terrestrial carbon storage [64]. The carbon density of cropland and grassland is second only to that of forestland [65]. The carbon density of built-up land and other lands is the lowest [66]. Ecological projects can significantly enhance terrestrial carbon storage services [67]. Since 1998, a substantial area of cropland and grassland in the YRB has undergone conversion to forest land, particularly in the upper reaches. This transformation was notably pronounced during the ten years following the implementation of the ‘returning cropland to forests’ project and the ‘ecological protection forests’ project in 2000, resulting in a significant increase in forested areas [68]. The notable increase in forest carbon storage in the YRB after 2000 is attributed to the implementation of ecological projects. These projects emerge as key drivers of ecosystem change in the YRB.
From 1985 to 2020, the area of cropland converted into forest reached 7.75 × 10³ km2, accounting for 29.88% of the total expansion of forestland (Table 5), resulting in a net increase of 0.10 × 10⁹ t in carbon storage. The acceleration of social and economic development, industrialization, and urbanization will induce more land to be converted into built-up land, leading to a decline in regional carbon storage and an increase in carbon emissions [69]. Since the reform and opening up, provinces and cities in the YRB have actively promoted urbanization. Currently, there are three major urban agglomerations—the Yangtze River Delta, the Middle Yangtze River, and the Sichuan–Chongqing region—as well as several strong regional central cities. These urban clusters and cities play a crucial role in driving economic growth, promoting innovation, and improving the living standards of people in the region [70]. Therefore, the conversion of high-carbon-density forest, cropland, and grassland to low-carbon-density built-up land leads to a decline in regional carbon density and a weakening of the carbon storage service function of regional ecosystems [71]. In particular, the decline in carbon storage in the middle reaches of the YRB is particularly prominent, with a decrease of 0.10 × 10⁹ t. This conclusion is consistent with the findings of Kong et al. [72]. From 1985 to 2020, the area of cropland, forest, grassland, and water bodies converted to built-up land in the YRB accounted for 92.61%, 5.68%, 0.90%, and 0.63% of the total expansion of built-up, respectively (Table 5).
Given China’s commitment to achieving its ambitious goal of a carbon peak by 2030 [73], it is imperative to examine the response of carbon storage in the YRB to LULC changes by 2030. According to the NDS scenario, the total carbon storage in the YRB is projected to decrease by 67 × 106 t by 2030 (Table 9). Socio-economic development and the large-scale migration of agricultural populations to cities have driven urban economic growth and accelerated the urbanization process. However, the expansion of city sizes and the encroachment on arable land, if continued at the current pace, will lead to the deterioration of the carbon storage service function of the YRB ecosystem [55]. The above results are consistent with previous studies. For example, when Du et al. [55] investigated the response of future carbon storage to LULC changes, they found that under normal development trends, the continuous expansion of built-up land and the continuous reduction of cropland led to a significant decline in carbon storage in the region. This is because the carbon sequestration capacity of built-up land is much lower than that of cropland. By employing a multi-objective algorithm, we can strike a balance between economic development, ecological protection, and carbon storage maximization, thereby enhancing the restoration of the ecological environment in the YRB. This approach helps mitigate the vulnerability of the ecological carbon storage in the basin and is expected to increase carbon storage by 97 × 106 t. In the EEB scenario, our goal is to protect the ecological environment while focusing on economic development, striving to achieve a harmonious balance between the two. At this time, the areas of high-carbon-density cropland, forest land, and grassland have increased, the upward trend in built-up land area has slowed down, and other types of land have decreased significantly. This result is supported by the conclusions from Wei et al.’s [74] study on the response of carbon storage to multi-scenario LULC changes.

4.3. Ecosystem Service Vulnerability

From 1985 to 2020, the vulnerability of ecosystem carbon storage services in the YRB exhibited potential negative impacts, with a tendency towards increased vulnerability. In the middle and lower reaches of the YRB, the intensity of LULC has been on an upward trend, with the most significant increase of 9.677 observed in the lower reaches of the YRB, which is dominated by cropland. During this period, large areas of low-intensity LULC land, including cropland (14.88%), water (2.74%), and forest land (0.96%), have been converted into high-intensity LULC built-up land, which is the primary reason for the increase in LULC intensity. Simultaneously, the conversion of high-carbon-density land types (forest and cropland) into low-carbon-density land types (built-up land) has led to a decrease in ecosystem carbon storage service capacity, indicating that LULC still has a negative impact on the ecosystem carbon storage services in the lower reaches of the YRB. Zheng et al. [75], Fu et al. [76], and Song et al. [77] have independently emphasized the significant improvement in urban LULC intensity and the significant expansion of construction areas in the lower reaches of the YRB, including the areas of Shanghai Municipality, Jiangsu Province, and Anhui Province, respectively, following the implementation of the reform and opening up policy. Cai et al. [78] have also demonstrated a continuous decline in carbon storage in the Yangtze River Delta region from 1995 to 2020. In the middle reaches of the YRB, which are dominated by forest land, the area of low-intensity LULC forest land continuously decreased from 1985 to 2020, with 0.96% and 0.34% being converted into high-intensity LULC cropland and built-up land, respectively. The conversion of low-intensity LULC cropland into high-intensity LULC built-up land accounted for 0.34%, becoming the primary reason for the increase in the LULC intensity index. Simultaneously, the continuous decline of high-carbon-density land types (forest land, cropland, and grassland), with a total decrease of 95.21% being converted into built-up land, has led to a reduction in ecosystem carbon storage service capacity, indicating that LULC still has a negative impact on the ecosystem carbon storage services in the middle reaches of the YRB. He et al. [79], Zhou et al. [80], and Liu et al. [81] have highlighted the damage to forest land and cropland areas in regions such as Hubei Province and Dongting Lake in the middle reaches of the YRB, resulting in large-scale conversions of land into built-up land. In contrast to the middle and lower reaches of the YRB, the upper reaches, which are dominated by grassland, have experienced a positive impact of LULC on ecosystem carbon storage services from 1985 to 2020. This can primarily be attributed to the continuous decline of high-intensity LULC cropland, with 4.79% being converted into low-intensity LULC forest land. Additionally, 2.47% of cropland was transformed into high-intensity LULC-built-up land. The increase in forest land area was 4.64 times that of built-up land. Simultaneously, the continuous increase in high-carbon-density forest land has led to an enhancement of ecosystem carbon storage service capacity, indicating that LULC has a positive impact on ecosystem carbon storage services in the upper reaches of the YRB. Li et al. [82] have demonstrated that from 2000 to 2014, both the forest coverage rate at the basin level and the township level in Yunnan Province, which is located in the upper reaches of the YRB, have increased. The implementation of the policy of returning farmland to forests played a crucial role in this scenario, contributing to the expansion of high-carbon-density forest land. This, in turn, effectively enhanced the carbon storage service function [83,84]. In their study on the impact of LULC change on carbon storage in Kenya, Pellikka et al. [85] similarly observed that the augmentation of high-carbon-density forest land effectively counteracts the carbon storage loss in forest land due to the expansion of low-carbon-density cropland, thereby contributing to an overall increase in regional carbon storage. Nevertheless, the swift pace of industrialization and urbanization has led to a rapid expansion of construction, resulting in a reduction of regional carbon density [86]. Hence, although rapid economic and social development has spurred the swift expansion of construction, it is not the primary driver of the vulnerability in regional carbon storage services. Effective mitigation of the adverse effects of LULC changes on the ecosystem involves coordinating the relationships between different LULCs, safeguarding high-carbon-density forest land, achieving judicious expansion of construction, and integrating comprehensive LULC planning and management.
Similarly, studying the vulnerability of ecosystem services in the YRB for the year 2030 becomes crucial in alignment with China’s objective to achieve ‘peak carbon’ by that year. Under the NDS scenario, the projected impacts of LULC changes on carbon storage services in 2030 remain unfavorable. The PI index of the YRB has decreased to −2.255. The LULC in the upper reaches of the YRB has had a positive impact on the ecosystem’s carbon storage services, whereas the LULC in the middle and lower reaches has had a negative impact. These characteristics are akin to the observed trends in LULC change during the period of 1985–2020. Strengthening comprehensive spatial regulation during the period of 2020–2030, particularly in the context of urbanization, is imperative to optimize the LULC structure [87]. To mitigate the vulnerability of ecosystem services, it is essential to focus on expanding the area of ecological land characterized by high carbon density. Additionally, measures should be implemented to minimize the adverse impacts of expanding construction land for carbon storage. This strategic approach aims to enhance the resilience of ecosystem services in the face of changing LULC patterns. The EEB scenario, which aims to maximize ecological, economic, and carbon storage benefits, has led to substantial increases in high-density forest land, grassland, and cropland in the YRB, accompanied by slow growth in built-up land and a significant decline in other LULCs. As a result, carbon storage has increased, and the vulnerability services of the three sub-basins’ LULC to ecosystem carbon storage have all exhibited positive impacts. This approach seeks to ensure that socio-economic development aligns seamlessly with and fully adapts to the ecological environment, fostering a harmonious coexistence between human activities and the natural surroundings. Therefore, in comparison to the year 2020, there is a notable increase of 97 × 106 t in carbon storage. This signifies a mitigation of vulnerability, a deceleration in the disturbance of the ecosystem’s carbon balance due to LULC changes, and a further enhancement in the service capacity of carbon storage. Such positive developments are conducive to the ecological restoration of the ecologically fragile areas in the YRB.
Therefore, for areas in the middle and lower reaches of the YRB where construction land is rapidly increasing, LULC should be reduced and optimized to improve the efficiency of construction and to promote a shift in urbanization towards intensification. In the future, we will focus on the planning and regulation of land in suburban areas, counties, and other potential areas and adopt construction land consolidation and cropland reclamation to balance the demand for land between urban and rural areas. Promote ecological and environmental protection in the middle and upper reaches of the YRB and other areas according to local measures. The Qinghai–Tibet region in the middle and upper reaches of the YRB, the Yunnan–Guizhou Plateau region, the Shaanxi–Gansu region, and the Degree Plain should pay attention to the ecological management of grassland landscapes to prevent their fragmentation from further intensifying. For areas with high urbanization and industrialization, industrial LULC planning should be continuously improved, new development of industrial land should be reasonably controlled, and industrial land remediation should be promoted according to local conditions.

4.4. Limitations and Future Perspective

This paper presents a methodology for assessing and predicting carbon storage and vulnerability in basin areas, but limitations remain due to the extensive study sites and large differences in carbon density records. In this study, the carbon density is held constant in InVEST. However, it is essential to acknowledge that actual carbon density values can vary over time due to environmental factors. Therefore, in this study, the coefficients were corrected according to the assessment method applicable to the Chinese basin, with reference to the process and results of previous researchers, and the area weighting of different areas was used. In addition, this study also considered the impact of future strategies and socio-economic themes, and corrected the LULC change coefficients to improve their accuracy. However, we employed MOP-PLUS to predict future changes in each type of LULC, and this prediction proved to be highly accurate [45]. However, uncertainties still exist. With economic growth and improvements in society, people will be more willing and able to pay for ecosystem services. Therefore, estimated future carbon storage and vulnerability should contain more information and better reflect socio-economic and ecological trade-offs.

5. Conclusions

This study proposes a comprehensive framework for LULC optimization, carbon storage simulation, and vulnerability assessment that is integrated with MOP, PLUS, and InVEST models. This integration enables the quantitative elucidation of the impact of LULC on carbon storage and the in-depth analysis of the vulnerability of ecosystem carbon storage services. This approach is crucial for enhancing our understanding and protection of the carbon cycle while ensuring the ecological security of regional terrestrial ecosystems. The main conclusions are as follows: The enlargement of forest areas has effectively compensated for 50% of the carbon storage loss caused by changes in LULC. However, significant differences exist in the carbon storage and vulnerability characteristics of each sub-basin. In the upper reaches of the YRB, the increase in forest area has led to a corresponding increase in carbon storage, resulting in a positive impact of LULC on ecosystem carbon storage services. In contrast, the substantial reduction in forest and cropland, along with the rapid increase in built-up land in the middle and lower reaches of the YRB, have led to a decrease in carbon storage and an increase in LULC intensity, resulting in a negative impact of LULC on ecosystem carbon storage services. This phenomenon is particularly prominent in the lower reaches of the YRB.
In the NDS scenario, the conversion of a large amount of cropland into built-up land has led to a slowdown in forest expansion, resulting in a predicted decrease of 67 × 106 tons in carbon storage, accompanied by a slight increase in the vulnerability of carbon storage services in the YRB. In contrast, under the EEB scenario, there is a significant increase in the area of cropland, forests, and grasslands, a slowdown in the expansion of built-up land, and an upward trend in carbon storage. LULC exerts a positive impact on ecosystem carbon storage services. This comparison highlights that the adoption of ecological protection measures can effectively mitigate the LULC changes and dynamic changes in carbon storage caused by human activities, thereby enhancing the carbon sequestration capacity of terrestrial ecosystems. To promote sustainable development in the middle and lower reaches of the YRB, it is crucial to vigorously implement terrestrial ecological protection measures to slow down the expansion of built-up land, particularly around megacities and developing cities. Meanwhile, the upper reaches of the YRB should focus on protecting the existing ecological environment to ensure the ecological security and sustainable development of the entire basin. In this process, selecting appropriate development models based on regional characteristics is essential for achieving comprehensive and coordinated economic, social, and ecological development.

Author Contributions

All authors contributed to the manuscript. Conceptualization, Y.J. and Z.Y.; methodology, Y.J.; software, Z.Y. and B.O.; validation, Y.J. and B.O.; formal analysis, Y.J.; investigation, Y.J. and B.O.; resources, Y.J. and B.O.; data curation, Y.J.; writing—original draft, Y.J. and Z.Y.; writing—review and editing, Y.J., Z.Y. and B.O.; supervision Z.Y. and B.O.; project administration, Z.Y. and Y.J.; funding acquisition, Z.Y. and B.O. All authors have read and agreed to the published version of the manuscript.

Funding

This study was financially supported by the National Natural Science Foundation of China (41971370), the Fundamental Research Funds for the Central Universities (2023XSCX045), the Graduate Innovation Program of China University of Mining and Technology (2023WLKXJ163), the Postgraduate Research and Practice Innovation Program of Jiangsu Province (KYCX23_2751), the China Scholarship Fund ((2023) 49), and the 2022 Annual Science and Technology Research Project of Jiangxi Provincial Education Department (GJJ2206615). The authors are also grateful for the valuable comments of anonymous reviewers and editors, which helped greatly to improve the manuscript.

Institutional Review Board Statement

Not applicable.

Informed Consent Statement

Not applicable.

Data Availability Statement

No data were used for the research described in this article.

Acknowledgments

We would like to thank the anonymous reviewers for their helpful and valuable comments and suggestions.

Conflicts of Interest

The authors declare no conflicts of interest.

References

  1. Atwood, T.B.; Connolly, R.M.; Almahasheer, H.; Carnell, P.E.; Duarte, C.M.; Ewers Lewis, C.J.; Irigoien, X.; Kelleway, J.J.; Lavery, P.S.; Macreadie, P.I.; et al. Global patterns in mangrove soil carbon stocks and losses. Nat. Clim. Change 2017, 7, 523–528. [Google Scholar] [CrossRef]
  2. Lal, R. Sequestration of atmospheric CO2 in global carbon pools. Energy Environ. Sci. 2008, 1, 86–100. [Google Scholar] [CrossRef]
  3. Deng, J.S.; Wang, K.; Hong, Y.; Qi, J.G. Spatio-temporal dynamics and evolution of land use change and landscape pattern in response to rapid urbanization. Landsc. Urban Plan. 2009, 92, 187–198. [Google Scholar] [CrossRef]
  4. Pereira, P. Ecosystem services in a changing environment. Sci. Total Environ. 2020, 702, 135008. [Google Scholar] [CrossRef] [PubMed]
  5. Xystrakis, F.; Psarras, T.; Koutsias, N. A process-based land use/land cover change assessment on a mountainous area of Greece during 1945–2009, Signs of socio-economic drivers. Sci. Total Environ. 2017, 587, 360–370. [Google Scholar] [CrossRef] [PubMed]
  6. Gomes, E.; Inácio, M.; Bogdzevič, K.; Kalinauskas, M.; Karnauskaitė, D.; Pereira, P. Future land-use changes and its impacts on terrestrial ecosystem services: A review. Sci. Total Environ. 2021, 781, 146716. [Google Scholar] [CrossRef] [PubMed]
  7. Zhu, L.; Song, R.; Sun, S.; Li, Y.; Hu, K. Land use/land cover change and its impact on ecosystem carbon storage in coastal areas of China from 1980 to 2050. Ecol. Indic. 2022, 142, 109178. [Google Scholar] [CrossRef]
  8. Dampha, N.K. Change detection (1985–2020): Projections on land-use land cover, carbon storage, sequestration, and valuation in Southwestern Gambia. Sustain. Environ. 2021, 7, 1875556. [Google Scholar] [CrossRef]
  9. Ren, Y.; Wei, X.; Wei, X.; Pan, J.; Xie, P.; Song, X.; Peng, D.; Zhao, J. Relationship between vegetation carbon storage and urbanization: A case study of Xiamen, China. For. Ecol. Manag. 2011, 261, 1214–1223. [Google Scholar] [CrossRef]
  10. Sohl, T.L.; Sleeter, B.M.; Zhu, Z.; Sayler, K.L.; Bennett, S.; Bouchard, M.; Reker, R.; Hawbaker, T.; Wein, A.; Liu, S.; et al. A land-use and land-cover modeling strategy to support a national assessment of carbon stocks and fluxes. Appl. Geogr. 2012, 34, 111–124. [Google Scholar] [CrossRef]
  11. Eslamdoust, J.; Sohrabi, H. Carbon storage in biomass, litter, and soil of different native and introduced fast-growing tree plantations in the South Caspian Sea. J. For. Res. 2018, 29, 449–457. [Google Scholar] [CrossRef]
  12. Zhong, H.S.; Wang, H.; Deng, Y.H.; Chen, M.C.; Peng, L.C.; Luo, Y.H.; Qin, J.; Wu, D.; Ding, X.; Hu, Y.; et al. Quantum computational advantage using photons. Science 2020, 370, 1460–1463. [Google Scholar] [CrossRef] [PubMed]
  13. Delphin, S.; Escobedo, F.J.; Abd-Elrahman, A.; Cropper, W.P. Urbanization as a land use change driver of forest ecosystem services. Land Use Policy 2016, 54, 188–199. [Google Scholar] [CrossRef]
  14. He, C.; Zhang, D.; Huang, Q.; Zhao, Y. Assessing the potential impacts of urban expansion on regional carbon storage by linking the LUSD-urban and InVEST models. Environ. Model. Softw. 2016, 75, 44–58. [Google Scholar] [CrossRef]
  15. Babbar, D.; Areendran, G.; Sahana, M.; Sarma, K.; Raj, K.; Sivadas, A. Assessment and prediction of carbon sequestration using Markov chain and InVEST model in Sariska Tiger Reserve, India. J. Clean. Prod. 2021, 278, 123333. [Google Scholar] [CrossRef]
  16. Jiang, W.; Deng, Y.; Tang, Z.; Lei, X.; Chen, Z. Modelling the potential impacts of urban ecosystem changes on carbon storage under different scenarios by linking the CLUE-S and the InVEST models. Ecol. Model. 2017, 345, 30–40. [Google Scholar] [CrossRef]
  17. Zhao, M.; He, Z.; Du, J.; Chen, L.; Lin, P.; Fang, S. Assessing the effects of ecological engineering on carbon storage by linking the CA-Markov and InVEST models. Ecol. Indic. 2019, 98, 29–38. [Google Scholar] [CrossRef]
  18. Yang, H.; Huang, J.; Liu, D. Linking climate change and socioeconomic development to urban land use simulation: Analysis of their concurrent effects on carbon storage. Appl. Geogr. 2020, 115, 102135. [Google Scholar] [CrossRef]
  19. Gong, J.; Liu, D.; Zhang, J.; Xie, Y.; Cao, E.; Li, H. Tradeoffs/synergies of multiple ecosystem services based on land use simulation in a mountain-basin area, western China. Ecol. Indic. 2019, 99, 283–293. [Google Scholar] [CrossRef]
  20. Wang, X.; Shen, Y.; Su, C. Spatial-temporal evolution and driving factors of carbon emission efficiency of cities in the Yellow River Basin. Energy Rep. 2023, 9, 1065–1070. [Google Scholar] [CrossRef]
  21. Sun, W.; Ding, X.; Su, J.; Mu, X.; Zhang, Y.; Gao, P.; Zhao, G. Land use and cover changes on the Loess Plateau: A comparison of six global or national land use and cover datasets. Land Use Policy 2022, 119, 106165. [Google Scholar] [CrossRef]
  22. Adhami, M.; Sadeghi, S.H.; Sheikhmohammady, M. Making competent land use policy using a co-management framework. Land Use Policy 2018, 72, 171–180. [Google Scholar] [CrossRef]
  23. Ghorbanian, A.; Kakooei, M.; Amani, M.; Mahdavi, S.; Mohammadzadeh, A.; Hasanlou, M. Improved land cover map of Iran using Sentinel imagery within Google Earth Engine and a novel automatic workflow for land cover classification using migrated training samples. ISPRS J. Photogramm. Remote Sens. 2020, 167, 276–288. [Google Scholar] [CrossRef]
  24. Seidl, R.; Schelhaas, M.J.; Rammer, W.; Verkerk, P.J. Increasing forest disturbances in Europe and their impact on carbon storage. Nat. Clim. Change 2014, 4, 806–810. [Google Scholar] [CrossRef] [PubMed]
  25. Hungate, B.A.; Barbier, E.B.; Ando, A.W.; Marks, S.P.; Reich, P.B.; Van Gestel, N.; Tilman, D.; Knops, J.M.; Hooper, D.U.; Butterfield, B.J.; et al. The economic value of grassland species for carbon storage. Sci. Adv. 2017, 3, e1601880. [Google Scholar] [CrossRef] [PubMed]
  26. Jerray, A.; Rumpel, C.; Le Roux, X.; Massad, R.S.; Chabbi, A. N2O emissions from cropland and grassland management systems are determined by soil organic matter quality and soil physical parameters rather than carbon stock and denitrifier abundances. Soil Biol. Biochem. 2024, 190, 109274. [Google Scholar] [CrossRef]
  27. Moges, D.M.; Bhat, H.G. Integration of geospatial technologies with RUSLE for analysis of land use/cover change impact on soil erosion: Case study in Rib watershed, north-western highland Ethiopia. Environ. Earth Sci. 2017, 76, 1–4. [Google Scholar] [CrossRef]
  28. Gao, Y.; Jia, J.; Lu, Y.; Sun, X.; Wen, X.; He, N.; Yang, T. Progress in watershed geography in the Yangtze River Basin and the affiliated ecological security perspective in the past 20 years, China. J. Geogr. Sci. 2020, 30, 867–880. [Google Scholar] [CrossRef]
  29. Li, Z.; Sun, X.; Huang, Z.; Zhang, X.; Wang, Z.; Li, S.; Zheng, W.; Zhai, B. Changes in nutrient balance, environmental effects, and green development after returning farmland to forests: A case study in Ningxia, China. Sci. Total Environ. 2020, 735, 139370. [Google Scholar] [CrossRef]
  30. Myllyvirta, L.; Zhang, S.; Shen, X.; Bi, Y. Political Economy of Climate and Clean Energy in China; Heinrich Böll Foundation: Berlin, Germany, 2020; 38p, Available online: https://reglobal.org/wp-content/uploads/2021/02/Political-Economy-of-Climate-and-Clean-Energy-in-China.pdf (accessed on 19 June 2023).
  31. Pan, Z.; Gao, G.; Fu, B.; Liu, S.; Wang, J.; He, J.; Liu, D. Exploring the historical and future spatial interaction relationship between urbanization and ecosystem services in the Yangtze River Basin, China. J. Clean. Prod. 2023, 428, 139401. [Google Scholar] [CrossRef]
  32. Yang, Y.; Lu, H.; Liang, D.; Chen, Y.; Tian, P.; Xia, J.; Wang, H.; Lei, X. Ecological sustainability and its driving factor of urban agglomerations in the Yangtze River Economic Belt based on three-dimensional ecological footprint analysis. J. Clean. Prod. 2022, 330, 129802. [Google Scholar] [CrossRef]
  33. Ye, X.C.; Liu, F.H.; Zhang, Z.X.; Xu, C.Y.; Liu, J. Spatio-temporal variations of vegetation carbon use efficiency and potential driving meteorological factors in the Yangtze River Basin. J. Mt. Sci. 2020, 17, 1959–1973. [Google Scholar] [CrossRef]
  34. Kong, R.; Zhang, Z.; Zhang, F.; Tian, J.; Zhu, B.; Zhu, M.; Wang, Y. Spatial and temporal dynamics of forest carbon storage and its driving factors in the Yangtze River Basin. Res. Soil Water Conserv. 2020, 27, 60–66. [Google Scholar] [CrossRef]
  35. Jia, S. Carbon storage distribution and its dynamic changes of forest vegetation in Yangtze River Basin based on continuous forest resources inventory. J. Ecol. Rural. Environ. 2018, 34, 997–1002. [Google Scholar]
  36. Xie, T.; Wang, M.; Jiang, R.; Li, L.; Chen, X.; Sarvajayakesavalu, S.; Chen, W. Comparative study on anthropogenic impacts on soil PAHs: Accumulation and source apportionment in tourist and industrial cities in Hebei Province, China. Sci. Total Environ. 2024, 912, 168435. [Google Scholar] [CrossRef] [PubMed]
  37. Alam, S.A.; Starr, M.; Clark, B.J. Tree biomass and soil organic carbon densities across the Sudanese woodland savannah: A regional carbon sequestration study. J. Arid. Environ. 2013, 89, 67–76. [Google Scholar] [CrossRef]
  38. Giardina, C.P.; Ryan, M.G. Evidence that decomposition rates of organic carbon in mineral soil do not vary with temperature. Nature 2000, 404, 858–861. [Google Scholar] [CrossRef]
  39. Chen, G.S.; Yang, Y.S.; Xie, J.S.; Du, Z.; Zhang, J. Total belowground carbon allocation in China’s forests. Acta Ecol. Sin. 2007, 27, 5148–5157. Available online: http://refhub.elsevier.com/S1470-160X(21)01164-X/h0020 (accessed on 19 June 2023).
  40. Li, X.; Fu, J.; Jiang, D.; Lin, G.; Cao, C. Land use optimization in Ningbo City with a coupled GA and PLUS model. J. Clean. Prod. 2022, 375, 134004. [Google Scholar] [CrossRef]
  41. Luo, C.; Fang, Z.; Liu, J.; Han, F.; Wu, Y.; Bing, H.; Zhao, P. Root carbon and soil temperature may be key drivers of below-ground biomass in grassland following prescribed fires in autumn and spring. J. Environ. Manag. 2024, 349, 119337. [Google Scholar] [CrossRef]
  42. Liang, X.; Guan, Q.; Clarke, K.C.; Liu, S.; Wang, B.; Yao, Y. Understanding the drivers of sustainable land expansion using a patch-generating land use simulation (PLUS) model: A case study in Wuhan, China. Comput. Environ. Urban Syst. 2021, 85, 101569. [Google Scholar] [CrossRef]
  43. IPCC. Impacts, adaptation and vulnerability. In Part A: Global and Sectoral Aspects; Contribution of Working Group II to the Fifth Assessment Report of the Intergovernmental Panel on Climate Change; IPCC: Geneva, Switzerland, 2014; p. 1132. [Google Scholar]
  44. Schröter, D.; Cramer, W.; Leemans, R.; Prentice, I.C.; Araújo, M.B.; Arnell, N.W.; Bondeau, A.; Bugmann, H.; Carter, T.R.; Gracia, C.A.; et al. Ecosystem service supply and vulnerability to global change in Europe. Science 2005, 310, 1333–1337. [Google Scholar] [CrossRef] [PubMed]
  45. Metzger, M.J.; Rounsevell, M.D.; Acosta-Michlik, L.; Leemans, R.; Schröter, D. The vulnerability of ecosystem services to land use change. Agric. Ecosyst. Environ. 2006, 114, 69–85. [Google Scholar] [CrossRef]
  46. Peng, H.; Xia, H.; Shi, Q.; Tang, Z.; Chen, H. Monitoring of wetland cover changes in protected areas to trade-offs between ecological conservation and food security: A case study from the Dongting Lake, China. Ecol. Inform. 2023, 78, 102338. [Google Scholar] [CrossRef]
  47. Wang, X.; Shi, S.; Zhao, X.; Hu, Z.; Hou, M.; Xu, L. Detecting spatially non-stationary between vegetation and related factors in the Yellow River Basin from 1986 to 2021 using multiscale geographically weighted regression based on Landsat. Remote Sens. 2022, 14, 6276. [Google Scholar] [CrossRef]
  48. Shen, Q.; Chen, Q.; Tang, B.S.; Yeung, S.; Hu, Y.; Cheung, G. A system dynamics model for the sustainable land use planning and development. Habitat Int. 2009, 33, 15–25. [Google Scholar] [CrossRef]
  49. Zhao, J.; Liu, S.; Wang, Z.; Gao, H.; Feng, S.; Wei, B.; Hou, Z.; Xiao, F.; Jing, L.; Liao, X. The Impact of Land Use and Landscape Pattern on Ecosystem Services in the Dongting Lake Region, China. Remote Sens. 2023, 15, 2228. [Google Scholar] [CrossRef]
  50. Hu, J.X.; Le, X.W.; Xu, Y. Estimating terrestrial eco-system carbon stock changes caused by multi-scenarios land-use changes based on the FLUS model: A case study of Pingxiang, Jiangxi. Res. Soil Water Conserv. 2024, 31, 299–309. [Google Scholar]
  51. Zhu, J.; Hu, X.; Xu, W.; Shi, J.; Huang, Y.; Yan, B. Regional Carbon Stock Response to Land Use Structure Change and Multi-Scenario Prediction: A Case Study of Hunan Province, China. Sustainability 2023, 15, 12178. [Google Scholar] [CrossRef]
  52. Foody, G.M. Explaining the unsuitability of the kappa coefficient in the assessment and comparison of the accuracy of thematic maps obtained by image classification. Remote Sens. Environ. 2020, 239, 111630. [Google Scholar] [CrossRef]
  53. Viera, A.J.; Garrett, J.M. Understanding interobserver agreement: The kappa statistic. Fam. Med. 2005, 37, 360–363. Available online: http://www1.cs.columbia.edu/~julia/courses/CS6998/Interrater_agreement.Kappa_statistic.pdf (accessed on 11 July 2023). [PubMed]
  54. Zhang, J.C.; DeAngelis, D.L.; Zhuang, J.Y. Theory and Practice of Soil Loss Control in Eastern China; Springer Science & Business Media: Berlin/Heidelberg, Germany, 2011. [Google Scholar]
  55. Du, S.; Zhou, Z.; Huang, D.; Zhang, F.; Deng, F.; Yang, Y. The Response of Carbon Stocks to Land Use/Cover Change and a Vulnerability Multi-Scenario Analysis of the Karst Region in Southern China Based on PLUS-InVEST. Forests 2023, 14, 2307. [Google Scholar] [CrossRef]
  56. Li, C.; Managi, S. Inappropriate nighttime light reduces living comfort. Environ. Pollut. 2023, 334, 122173. [Google Scholar] [CrossRef] [PubMed]
  57. Fan, L.; Cai, T.; Wen, Q.; Han, J.; Wang, S.; Wang, J.; Yin, C. Scenario simulation of land use change and carbon storage response in Henan Province, China: 1990–2050. Ecol. Indic. 2023, 154, 110660. [Google Scholar] [CrossRef]
  58. Chen, S.; Yao, S. Identifying the drivers of land expansion and evaluating multi-scenario simulation of land use: A case study of Mashan County, China. Ecol. Inform. 2023, 77, 102201. [Google Scholar] [CrossRef]
  59. Jiang, P.; Chen, D.; Xiao, J.; Liu, D.; Zhang, X.; Yang, X.; Ai, G. Climate and anthropogenic influences on the spatiotemporal change in degraded grassland in China. Environ. Eng. Sci. 2021, 38, 1065–1077. [Google Scholar] [CrossRef]
  60. Sliva, L.; Williams, D.D. Buffer zone versus whole catchment approaches to studying land use impact on river water quality. Water Res. 2001, 35, 3462–3472. [Google Scholar] [CrossRef]
  61. Wu, J.; Luo, J.; Zhang, H.; Qin, S.; Yu, M. Projections of land use change and habitat quality assessment by coupling climate change and development patterns. Sci. Total Environ. 2022, 847, 157491. [Google Scholar] [CrossRef]
  62. Phat, N.K.; Knorr, W.; Kim, S. Appropriate measures for conservation of terrestrial carbon stocks—Analysis of trends of forest management in Southeast Asia. For. Ecol. Manag. 2004, 191, 283–299. [Google Scholar] [CrossRef]
  63. Keith, H.; Mackey, B.G.; Lindenmayer, D.B. Re-evaluation of forest biomass carbon stocks and lessons from the world’s most carbon-dense forests. Proc. Natl. Acad. Sci. USA 2009, 106, 11635–11640. [Google Scholar] [CrossRef]
  64. Watson, J.E.M.; Evans, T.; Venter, O.; Williams, B.; Tulloch, A.; Stewart, C.; Thompson, I.; Ray, J.C.; Murray, K.; Salazar, A.; et al. The exceptional value of intact forest ecosystems. Nat. Ecol. Evol. 2018, 2, 599–610. [Google Scholar] [CrossRef] [PubMed]
  65. Koga, N.; Shimoda, S.; Shirato, Y.; Kusaba, T.; Shima, T.; Niimi, H.; Yamane, T.; Wakabayashi, K.; Niwa, K.; Kohyama, K.; et al. Assessing changes in soil carbon stocks after land use conversion from forest land to agricultural land in Japan. Geoderma 2020, 377, 114487. [Google Scholar] [CrossRef]
  66. Robinson, D.T.; Zhang, J.; MacDonald, D.; Samson, C. Estimating Settlement carbon stock and density using an inventory approach and quantifying their variation by land use and parcel size. Urban For. Urban Green. 2023, 82, 127878. [Google Scholar] [CrossRef]
  67. Tong, X.; Brandt, M.; Yue, Y.; Horion, S.; Wang, K.; Keersmaecker, W.D.; Tian, F.; Schurgers, G.; Xiao, X.; Luo, Y.; et al. Increased vegetation growth and carbon stock in China karst via ecological engineering. Nat. Sustain. 2018, 1, 44–50. [Google Scholar] [CrossRef]
  68. Qiu, S.; Peng, J.; Zheng, H.; Xu, Z.; Meersmans, J. How can massive ecological restoration programs interplay with social-ecological systems? A review of research in the South China karst region. Sci. Total Environ. 2022, 807, 150723. [Google Scholar] [CrossRef]
  69. Zhu, E.; Deng, J.; Zhou, M.; Gan, M.; Jiang, R.; Wang, K.; Shahtahmassebi, A. Carbon emissions induced by land-use and land-cover change from 1970 to 2010 in Zhejiang, China. Sci. Total Environ. 2019, 646, 930–939. [Google Scholar] [CrossRef] [PubMed]
  70. Gao, Y.; Wang, Z.; Xu, F. Geospatial characteristics and the application of land use functions in the Yangtze River Economic Belt, China: Perspectives on provinces and urban agglomerations. Ecol. Indic. 2023, 155, 110969. [Google Scholar] [CrossRef]
  71. Wang, Y.; Liang, D.; Wang, J.; Zhang, Y.; Chen, F.; Ma, X. An analysis of regional carbon stock response under land use structure change and multi-scenario prediction, a case study of Hefei, China. Ecol. Indic. 2023, 151, 110293. [Google Scholar] [CrossRef]
  72. Kong, R.; Zhang, Z.; Zhang, F.; Tian, J.; Chang, J.; Jiang, S.; Zhu, B.; Chen, X. Increasing carbon storage in subtropical forests over the Yangtze River basin and its relations to the major ecological projects. Sci. Total Environ. 2020, 709, 136163. [Google Scholar] [CrossRef]
  73. Fang, K.; Tang, Y.; Zhang, Q.; Song, J.; Wen, Q.; Sun, H.; Ji, C.; Xu, A. Will China peak its energy-related carbon emissions by 2030? Lessons from 30 Chinese provinces. Appl. Energy 2019, 255, 113852. [Google Scholar] [CrossRef]
  74. Yang, Q.; Guo, S.; Yuan, W.H.; Shen, Q.; Chen, Y.Q.; Wang, X.H.; Wu, T.H.; Chen, Z.M.; Alsaedi, A.; Hayat, T. Energy-dominated carbon metabolism: A case study of Hubei province, China. Ecol. Inform. 2015, 26, 85–92. [Google Scholar] [CrossRef]
  75. Zheng, H.; Zhuo, Y.; Xu, Z.; Wu, C.; Huang, J.; Fu, Q. Measuring and characterizing land use mix patterns of China’s megacities: A case study of Shanghai. Growth Change 2021, 52, 2509–2539. [Google Scholar] [CrossRef]
  76. Fu, Y.; Zhou, T.; Yao, Y.; Qiu, A.; Wei, F.; Liu, J.; Liu, T. Evaluating efficiency and order of urban land use structure: An empirical study of cities in Jiangsu, China. J. Clean. Prod. 2021, 283, 124638. [Google Scholar] [CrossRef]
  77. Song, R.; Li, X. Urban Human Settlement Vulnerability Evolution and Mechanisms: The Case of Anhui Province, China. Land 2023, 12, 994. [Google Scholar] [CrossRef]
  78. Cai, W.; Peng, W. Exploring spatiotemporal variation of carbon storage driven by land use policy in the Yangtze River Delta Region. Land 2021, 10, 1120. [Google Scholar] [CrossRef]
  79. He, N.; Zhou, Y.; Wang, L.; Li, Q.; Zuo, Q.; Liu, J. Spatiotemporal differentiation and the coupling analysis of ecosystem service value with land use change in Hubei Province, China. Ecol. Indic. 2022, 145, 109693. [Google Scholar] [CrossRef]
  80. Zhou, Y.; Li, X.; Liu, Y. Cultivated land protection and rational use in China. Land Use Policy 2021, 106, 105454. [Google Scholar] [CrossRef]
  81. Liu, C.; Deng, C.; Li, Z.; Liu, Y. Response characteristics of Soil Erosion to Spatial Conflict in the Production-Living-Ecological Space and Their Drivingmechanism: A Case Study of Dongting Lake Basin in China. Land 2022, 11, 1794. [Google Scholar] [CrossRef]
  82. Li, W.; Wang, W.; Chen, J.; Zhang, Z. Assessing effects of the Returning Farmland to Forest Program on vegetation cover changes at multiple spatial scales: The case of northwest Yunnan, China. J. Environ. Manag. 2022, 304, 114303. [Google Scholar] [CrossRef]
  83. Hou, W.; Gao, J.; Wu, S.; Dai, E. Interannual variations in growing-season NDVI and its correlation with climate variables in the southwestern karst region of China. Remote Sens. 2015, 7, 11105–11124. [Google Scholar] [CrossRef]
  84. Zhang, M.; Wang, K.; Liu, H.; Zhang, C.; Yue, Y.; Qi, X. Effect of ecological engineering projects on ecosystem services in a karst region: A case study of northwest Guangxi, China. J. Clean. Prod. 2018, 183, 831–842. [Google Scholar] [CrossRef]
  85. Pellikka, P.K.; Heikinheimo, V.; Hietanen, J.; Schäfer, E.; Siljander, M.; Heiskanen, J. Impact of land cover change on aboveground carbon stocks in Afromontane landscape in Kenya. Appl. Geogr. 2018, 94, 178–189. [Google Scholar] [CrossRef]
  86. Li, Z.T.; Li, M.; Xia, B.C. Spatio-temporal dynamics of ecological security pattern of the Pearl River Delta urban agglomeration based on LUCC simulation. Ecol. Indic. 2020, 114, 106319. [Google Scholar] [CrossRef]
  87. Li, L.; Song, Y.; Wei, X.; Dong, J. Exploring the impacts of urban growth on carbon storage under integrated spatial regulation: A case study of Wuhan, China. Ecol. Indic. 2020, 111, 106064. [Google Scholar] [CrossRef]
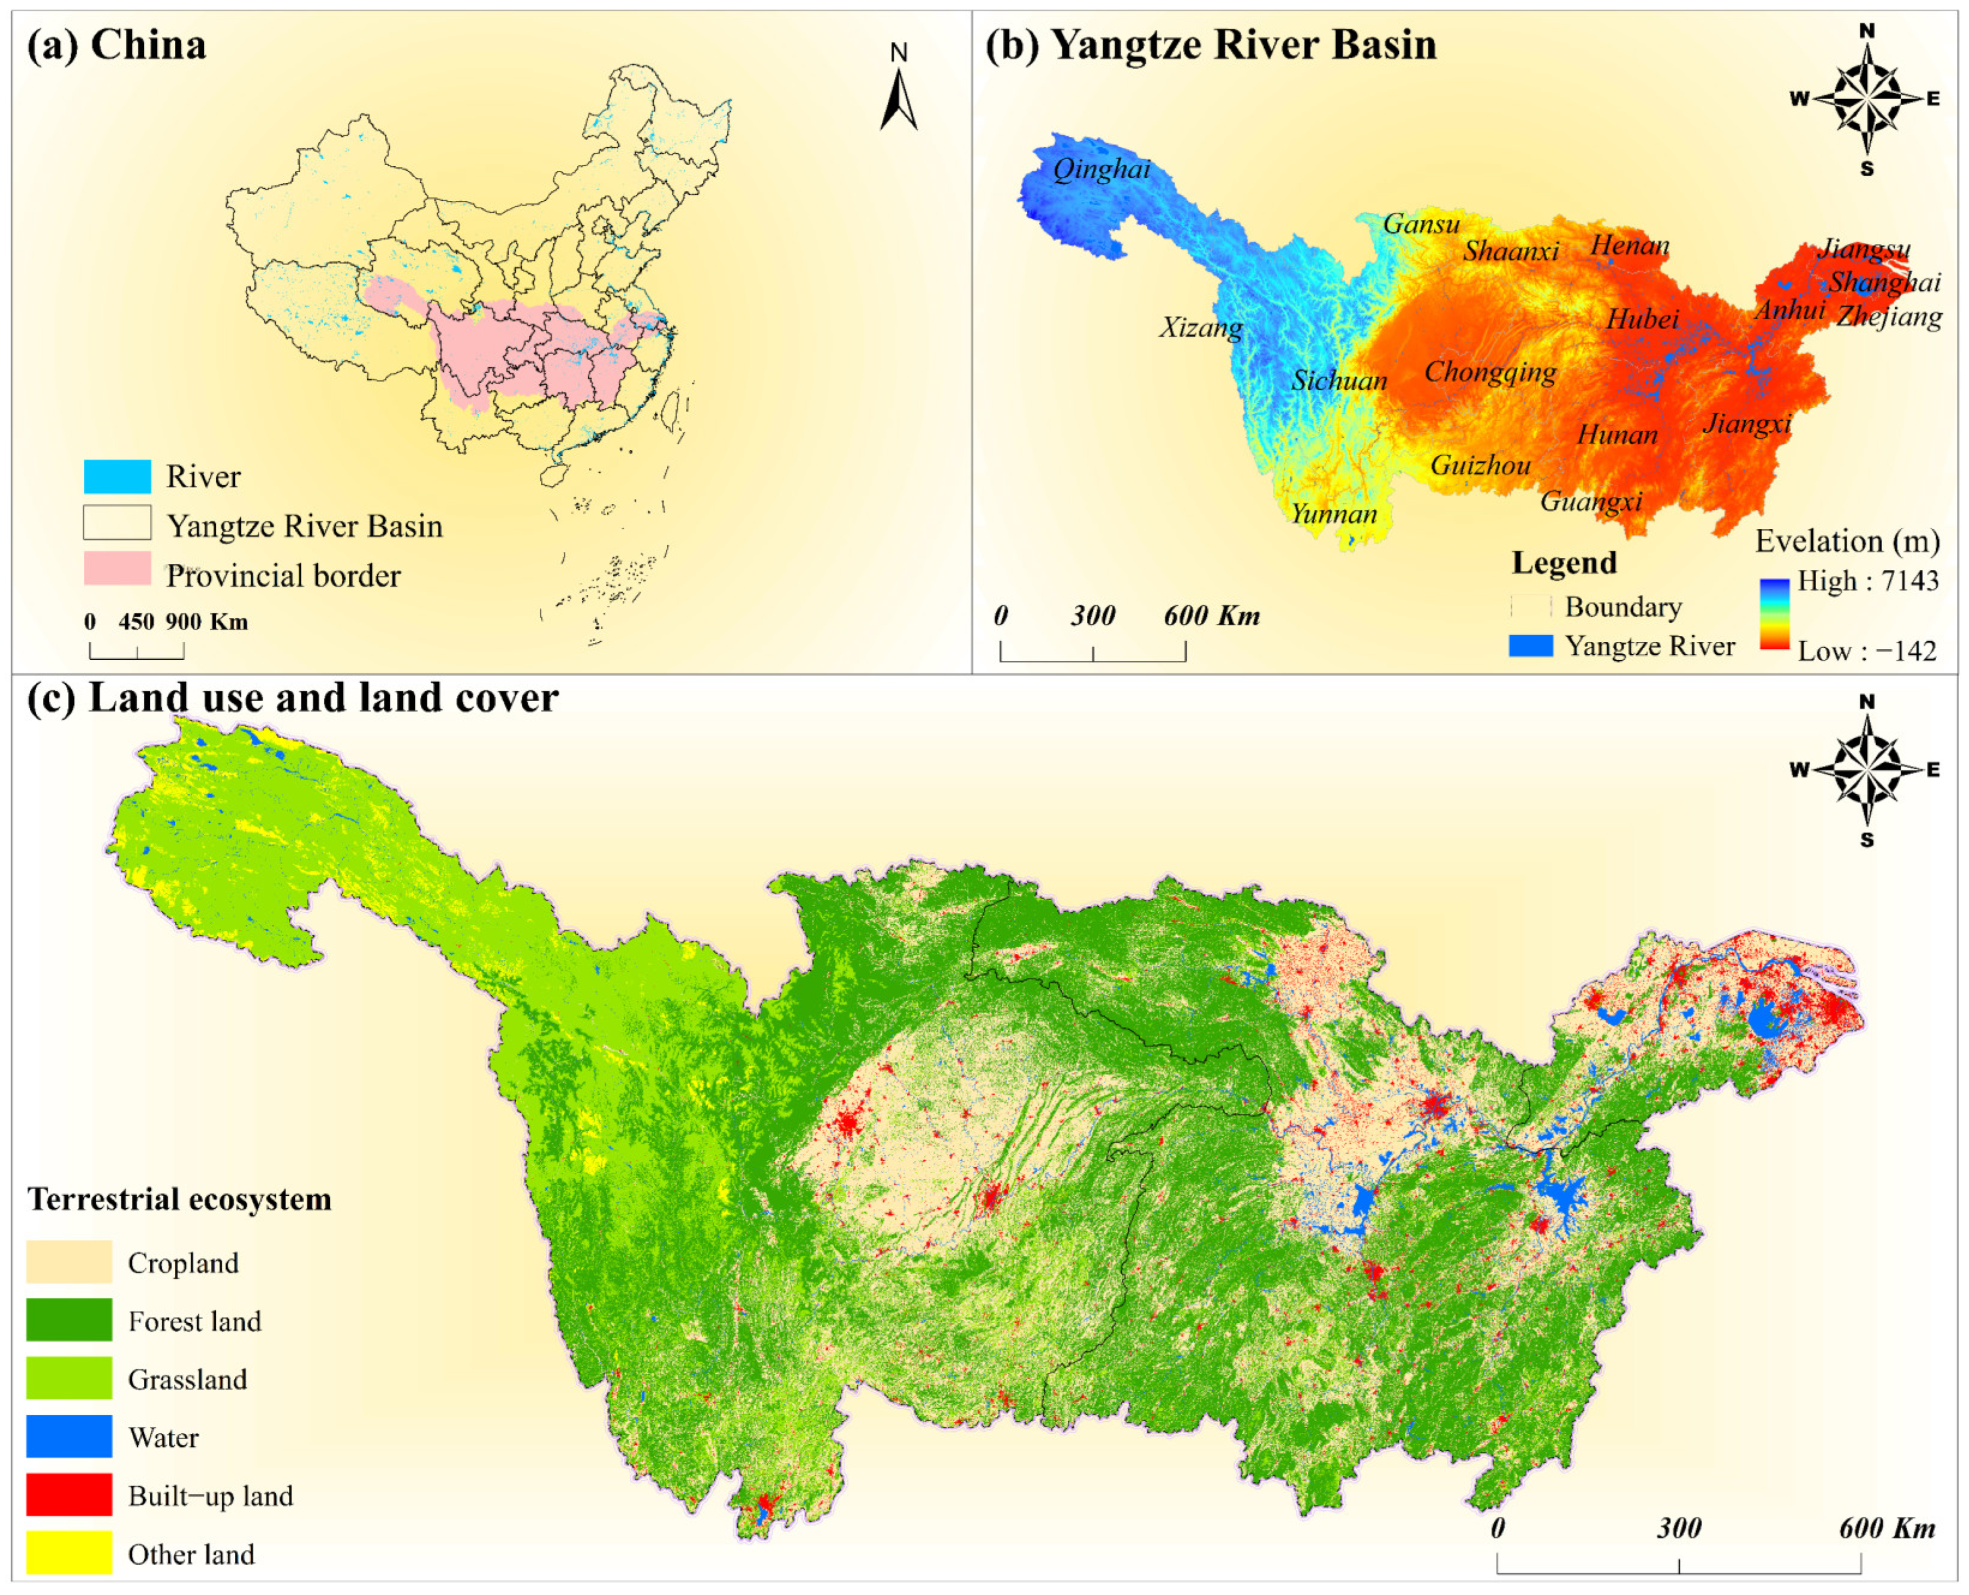
Figure 1. Geographic location and terrestrial ecosystem types in the YRB. (a) Location of the YRB in China; (b) elevation; and (c) distribution of LULC classifications.
Sustainability 16 02235 g001
Figure 2. Twenty drivers of future LULC predictions.
Sustainability 16 02235 g002
Figure 4. Distribution of each LULC type in the YRB between 1985 and 2020. Note: (a1d1) and (a2d2) show the changes in the area of different LULC types in the region.
Sustainability 16 02235 g004
Figure 5. Histogram of influencing factors for LULC.
Sustainability 16 02235 g005
Figure 6. Spatial distribution of carbon storage in the YRB between 1985 and 2020.
Sustainability 16 02235 g006
Figure 7. Distribution of each LULC type in the YRB in 2030. Note: Figure (a1,b1) and (a2,b2) show the changes in the area of different LULC types in the region.
Sustainability 16 02235 g007
Figure 8. Spatial distribution of carbon storage under different scenarios in 2030. Note: Figure (a1,b1) and (a2,b2) show the changes in the area of different carbon storages in the region.
Sustainability 16 02235 g008
Figure 9. Location of carbon storage hot and cold spots across the YRB from 1985 to 2030.
Sustainability 16 02235 g009
Figure 10. Spatial trends of the ecosystem carbon storage vulnerability index from 1985 to 2030.
Sustainability 16 02235 g010
Table 1. Correspondence between LULC classifications.
LEVEL 1 ClassLevel 2 Class (Number + Type)
LULC ClassificationLULC Classification of Resource and Environmental Science Data Center (RESDC)
1CroplandPaddy fields, dryland, etc.
2Forest landWoodland, shrubland, open woodland, other woodland, etc.
3GrasslandHigh coverage grassland, medium coverage grassland, etc.
4WaterGraff, lake, permanent glaciers and snowfields, tidal flats, bottomland, etc.
5Built-up landUrban land, rural residential areas, etc.
6Other landSandy, gobi, salt marshes, swamp, bare land, and bare rock texture are some of the landscape features, etc.
Table 2. Carbon density of each type of LULC (t hm−2).
LULC TypesCi_aboveCi_belowCi_soilCi_dead
Cropland16.4910.8975.822.11
Forest land30.146.03100.152.78
Grassland14.2917.1587.057.28
Water1.590.0064.033.98
Built-up land7.611.5234.330.00
Other land10.362.0734.420.96
Note: Ci_above denotes aboveground biomass, namely the carbon storage of all live plant material above the soil (e.g., trunks, twigs, and foliage); Ci_below is the belowground biomass, including the living root parts of the plant; Ci_soil is the amount of carbon stored in the soil, including mineral and organic soils, as well as organic carbon; and Ci_dead is the amount of carbon stored in non-living organic matter, such as litter and dead trees.
Table 3. Data access methods and websites.
Data TypeCategoryTimeResolutionData Source and Processing
Nature
climate
factors
DEM201530 mCGIAR-CSI http://srtm.csi.cgiar.org/, accessed on 21 April 2023
Slope °Based on DEM extraction
Aspect Based on DEM extraction
Yearly average direct normal
irradiation
1999–2018kWh/m2https://www.resdc.cn/, accessed on 11 April 2023
(Soil types are divided into 12 soil orders (e.g., luvisols, semi-luvisols, calcic horizons, etc.), 61 soil groups (yellow cinnamon soil, black soil, chernozem, etc.), and 237 soil subgroups (including arid solonchak, and volcanic ash soil).), accessed on 21 April 2023
Yearly average sunshine hours2021–2022Hour
Yearly average temperature1994–2018
Yearly average precipitation1960–2020mm
Yearly average
evapotranspiration
1990–2021mm
Soil types1990s1 km
Soil emission types1995t/(km2 × a)
Distance to water source2021mOpenStreetMap (OSM), https://www.openstreetmap.org/, accessed on 19 April 2023
Socio-
economic
factors
Population density2020person/km2https://www.resdc.cn/, accessed on 19 April 2023
Nighttime lighting data20201 km
GDP2020ten thousand yuan/km2
Distance to government2021mOSM, accessed on 19 April 2023
ArcGIS (Euclidean distance)
Distance to road
Distance to motorway
Distance to railway
Distance to hospital
Distance to bus stop
Restrict
conversion
Waterbody2020km2https://www.gscloud.cn, accessed on 19 April 2023
Impervious surface2020
Cropland land2020
Table 4. The quantity of six types of LULC from 1985 to 2020.
LULC (km2)CroplandForest LandGrasslandWaterBuilt-Up LandOther Land
1985555.47 × 103819.26 × 103353.79 × 10336.70 × 10312.74 × 10320.90 × 103
1990549.85 × 103821.46 × 103357.07 × 10337.85 × 10314.00 × 10318.64 × 103
2000543.00 × 103829.27 × 103348.05 × 10339.15 × 10321.43 × 10317.97 × 103
2010530.11 × 103837.94 × 103338.56 × 10341.80 × 10331.95 × 10318.50 × 103
2020517.40 × 103845.22 × 103329.85 × 10339.45 × 10344.34 × 10322.61 × 103
Table 5. The area of LULC transfer from 1985 to 2020.
1985–2020 (km2)CroplandForest LandGrasslandWaterBuilt-Up LandOther Land
Cropland443.84 × 10368.88 × 1036.48 × 1036.78 × 10329.41 × 10316.95
Forest land611.25 × 103752.36 × 103–3.76 × 1030.22 × 1031.79 × 1033.36
Grassland7.98 × 10323.64 × 103313.96 × 1030.98 × 1030.28 × 1036.94 × 103
Water4.23 × 1030.34 × 1030.28 × 10329.67 × 1031.02 × 1031.14 × 103
Built-up land0.14 × 1032.721.330.82 × 10311.77 × 1030.26
Other land14.849.775.35 × 1030.96 × 10355.2814.52 × 103
Table 6. Carbon storage using InVEST versus those determined from field data.
AreaCarbon StorageRelative Error (RE)References
Results Simulated by the
InVEST Model
Results Calculated by Another
Carbon Density Method
Dongting Lake Basin3.16 × 109 t (2020)3.07 × 10⁹ t (2020)2.93%Zhou et al. [49]
Pingxiang5.13 × 107 t (2020)5.04 × 10⁷ t (2020)1.78%Hu et al. [50]
Hunan2.14 × 109 t (2020)2.10 × 10⁹ t (2020)1.97%Zhu et al. [51]
Table 7. Variations in carbon storage in the YRB during 1985–2030.
YearAbove-Ground
Carbon Storage
(109 t)
Below-Ground
Carbon Storage
(109 t)
Soil Organic
Carbon Storage
(109 t)
Dead Organic
Matter Carbon
Storage (109 t)
Total Carbon Storage
(109 t)
Carbon
Intensity
(t·hm−2)
19853.9281.71215.8470.61822.105122.89
19903.9291.71315.8570.62122.120122.97
20003.9331.69415.8380.61622.081122.76
20103.9341.67115.7990.61022.014122.38
20203.9351.65015.7410.60121.927121.91
Table 8. Input area for each LULC type under NDS and EEB in the PLUS model.
LULC (km2)YRB NDSYRB EEBYRB_U NDSYRB_U EEBYRB_M NDSYRB_M EEBYRB_L NDSYRB_L EEB
Cropland506.1 × 103522.7 × 103230.4 × 103231.6 × 103213.3 × 103228.0 × 10362.4 × 10363.1 × 103
Forest land849.1 × 103851.8 × 103480.6 × 103497.0 × 103338.2 × 103323.6 × 10330.2 × 10331.0× 103
Grassland322.1 × 103329.8 × 103321.8 × 103329.4 × 1033.5 × 103384.466.47.41
Water37.8 × 10342.1 × 10313.4 × 10311.8 × 10318.4 × 10319.2 × 10310.8 × 10311.1 × 103
Built-up land56.2 × 10348.7 × 10310.6 × 1039.9 × 10321.8 × 10320.8 × 10319.0 × 10318.0 × 103
Other land27.7 × 1033.9 × 10327.6 × 1033.8 × 10347.5432.3813.4013.39
Table 9. Variations in carbon storage under the NDS and EEB scenarios in 2030.
YearAbove-Ground Carbon Storage
(109 t)
Below-Ground Carbon Storage
(109 t)
Soil Organic Carbon Storage
(109 t)
Dead Organic Matter Carbon Storage (109 t)Total Carbon Storage
(109 t)
Carbon Intensity
(t·hm−2)
NDS3.9321.63015.6750.59521.858121.507
EEB3.9481.65715.8150.60422.024122.423
Table 10. Moran’s I determined from the stored carbon across the YRB between 1985 and 2030.
19851990200020102020NDSEEB
Moran’s I0.650.660.650.660.670.670.67
P0000000
Z4648.714700.054694.704760.094772.344829.714826.87
Table 11. Carbon storage service vulnerability to LULC.
YearC (109 t)C-U (109 t)C-M (109 t)C-L (109 t)LaLa-ULa-MLa-LTimePIPI-UPI-MPI-L
198522.1113.487.281.35231.133221.902239.997270.014/////
199022.1213.507.291.33231.087222.002239.640271.1811985–1990−2.2733.292−0.923−5.945
200022.0813.517.261.31231.569222.142240.453272.0941990–2000−0.8671.175−1.213−1.818
201022.0113.507.231.28231.993221.869241.72274.6112000–2010−1.7310.602−0.784−2.459
202021.9313.497.181.26232.434221.174243.284279.6912010–2020−1.9120.236−1.069−1.139
NDS21.8613.477.171.22232.763216.962243.391282.0032020-NDS−2.2550.078−3.167−3.840
EEB22.0213.567.191.27233.081222.852245.534280.4142020-EEB0.6680.6840.1513.070
Disclaimer/Publisher’s Note: The statements, opinions and data contained in all publications are solely those of the individual author(s) and contributor(s) and not of MDPI and/or the editor(s). MDPI and/or the editor(s) disclaim responsibility for any injury to people or property resulting from any ideas, methods, instructions or products referred to in the content.