


Predicting Construction Company Insolvent Failure: A Scientometric Analysis and Qualitative Review of Research Trends

Abstract
:1. Introduction
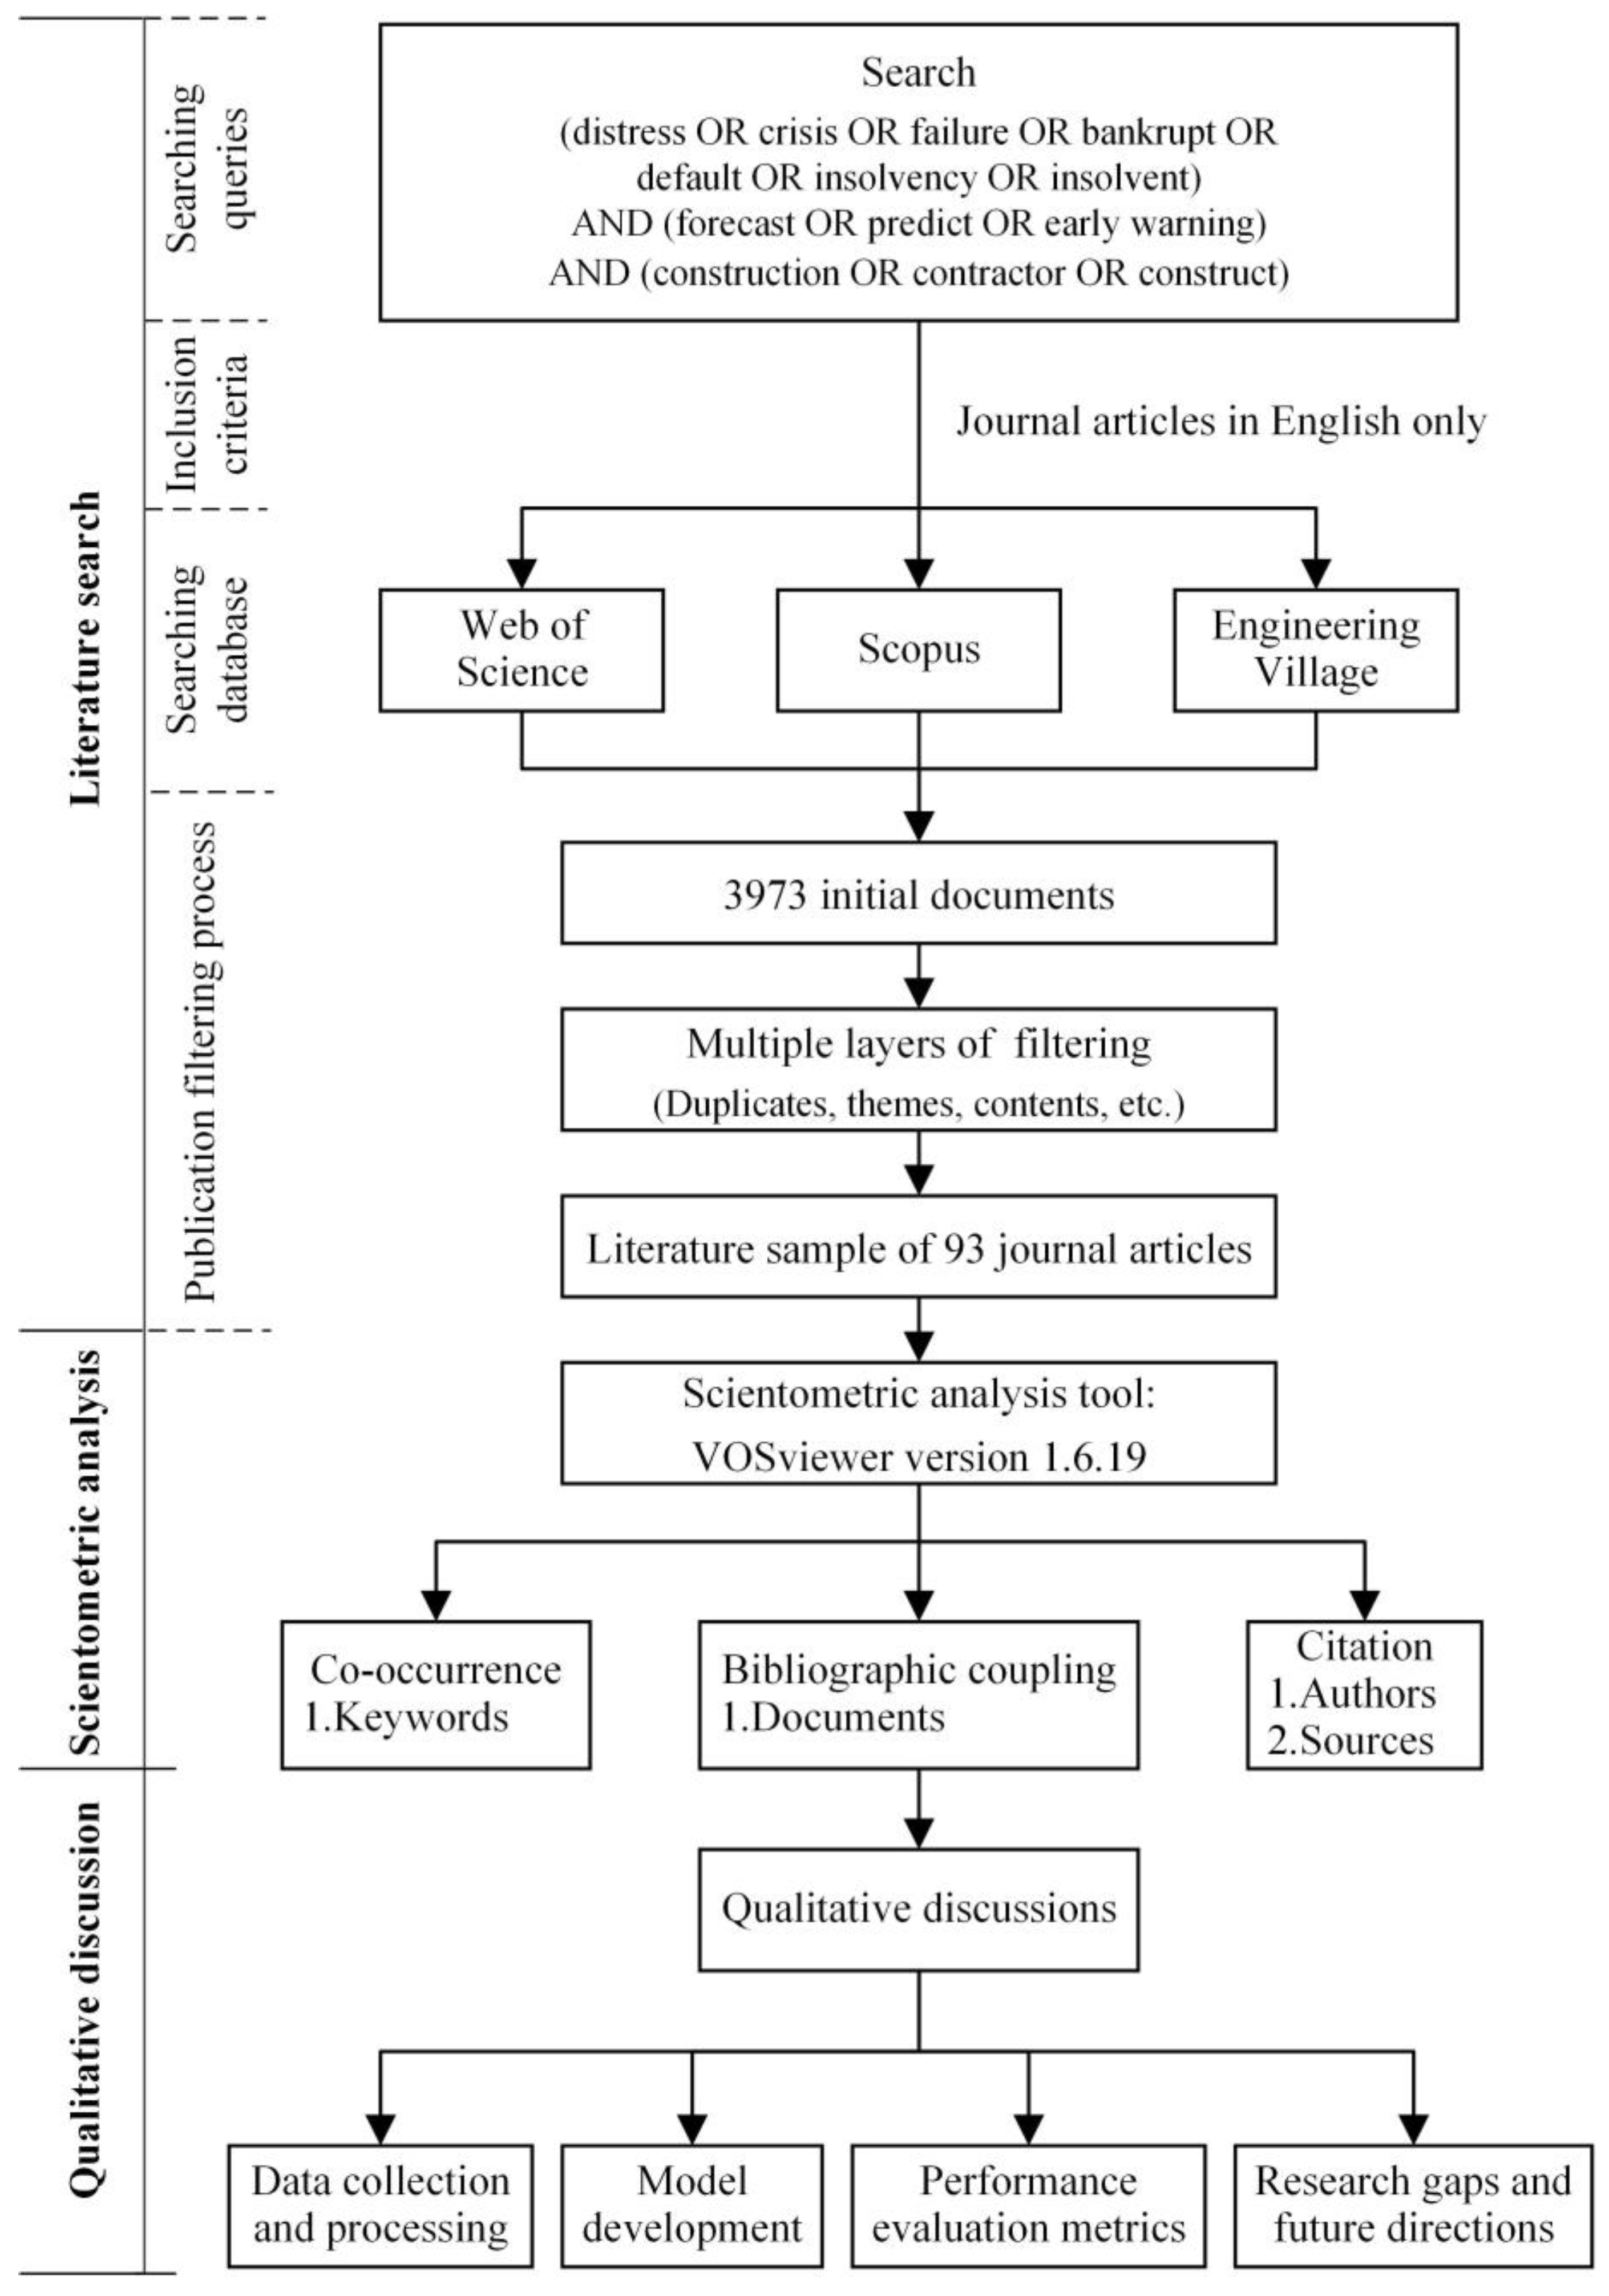
2. Research Methods
2.1. Literature Search
2.2. Scientometric Analysis
2.3. Qualitative Discussion
3. Results
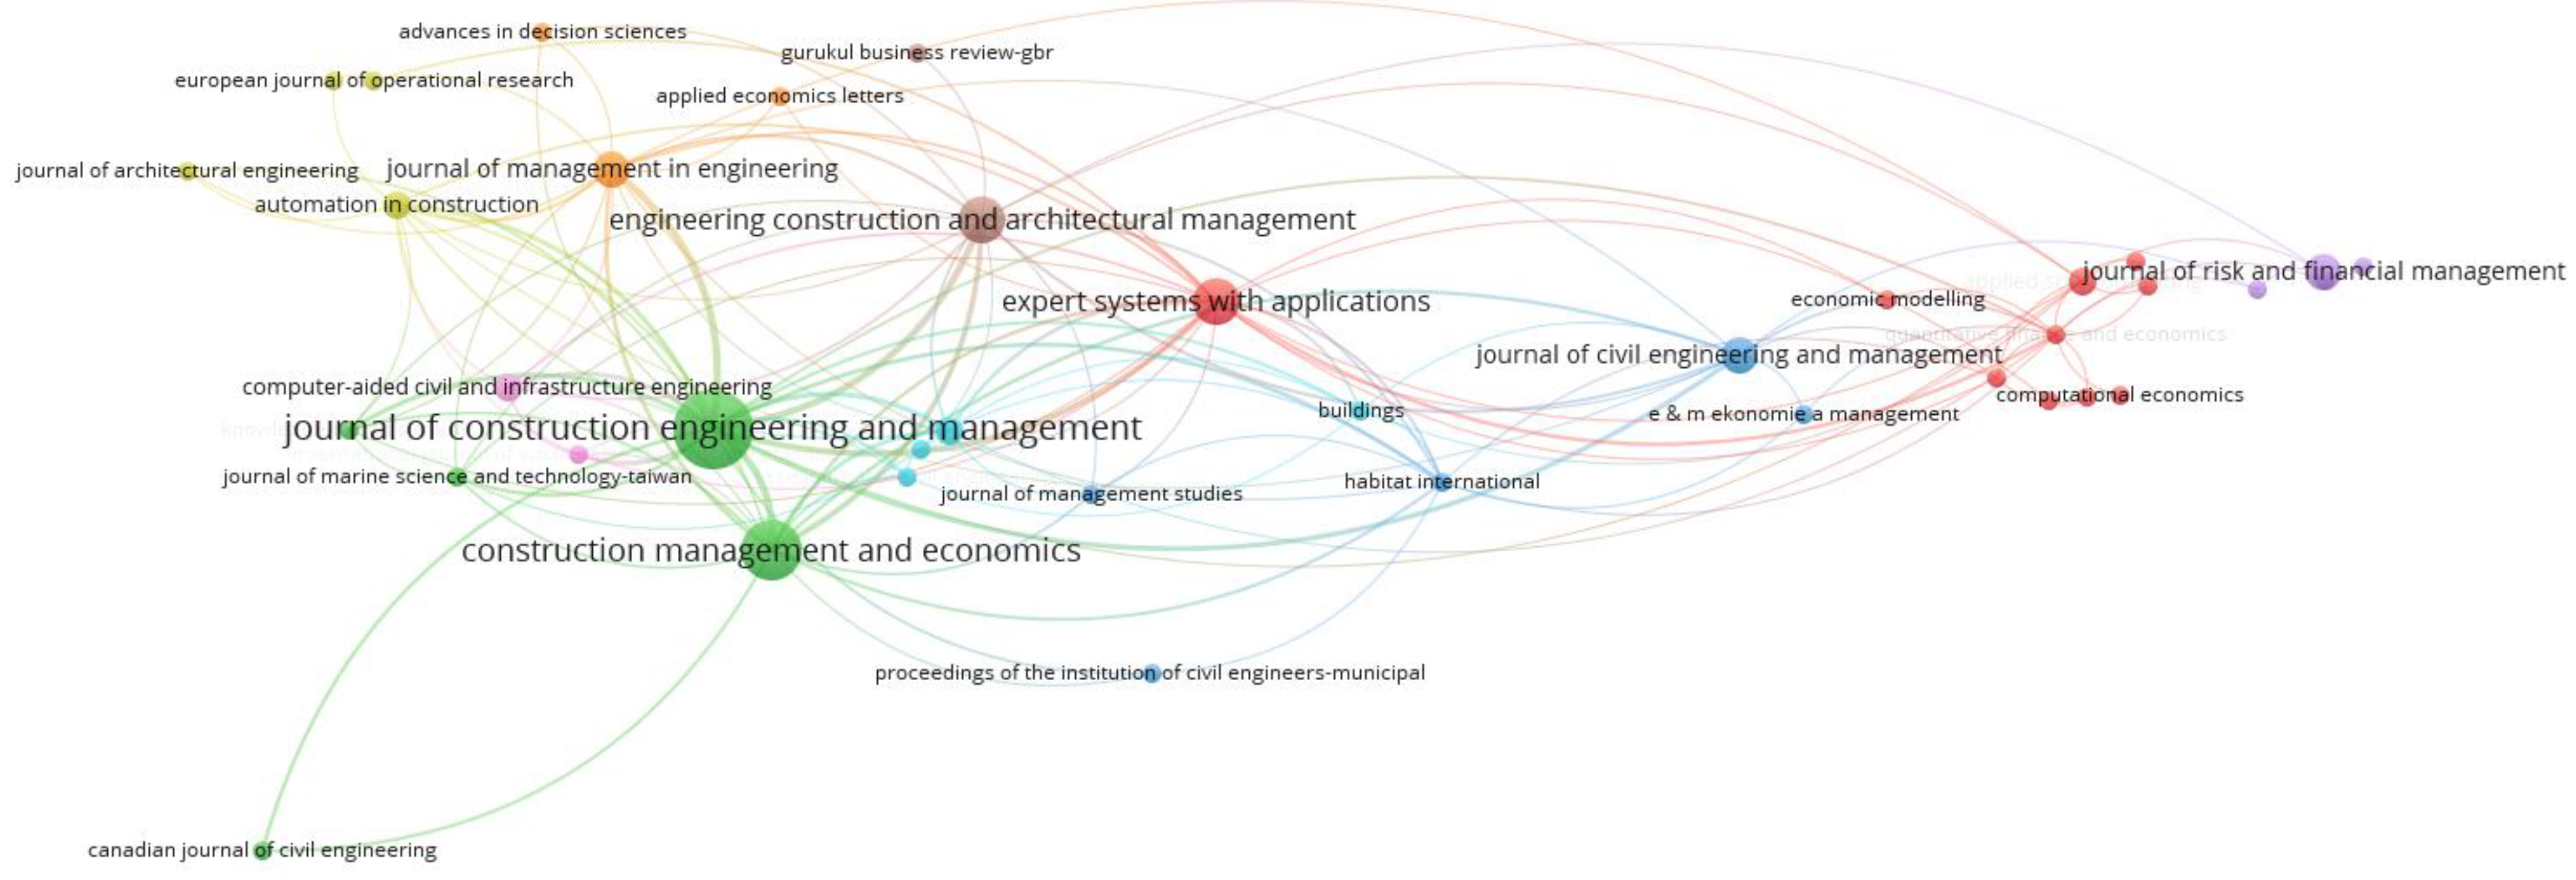
3.1. Chronological Trend and Journal Source Analysis
3.2. Researchers, Keyword, and Document Analysis
4. Qualitative Discussion
4.1. Data Collection and Processing
4.1.1. Sample Determination
4.1.2. Variable Selection
4.1.3. Data Processing
4.2. Predictive Models
4.2.1. Statistical Models
4.2.2. Artificial Intelligence Models
4.3. Performance Evaluation Metrics
4.3.1. Threshold Metrics
4.3.2. Area under the ROC Curve
4.3.3. Other Metrics
4.4. Research Gaps and Future Directions
4.4.1. Selecting a Broader Data Sample
4.4.2. Incorporating More Heterogeneous Variables
4.4.3. Balancing Model Predictability and Interpretability
4.4.4. Quantifying the Causality and Intercorrelation of Variables
5. Conclusions
Author Contributions
Funding
Data Availability Statement
Conflicts of Interest
References
- Robinson, G.; Leonard, J.; Whittington, T. Future of construction. In A Global Forecast for Construction to 2030; Oxford Economics: London, UK, 2021. [Google Scholar]
- Choi, H.; Son, H.; Kim, C. Predicting financial distress of contractors in the construction industry using ensemble learning. Expert Syst. Appl. 2018, 110, 1–10. [Google Scholar] [CrossRef]
- Tserng, H.P.; Lin, G.-F.; Tsai, L.K.; Chen, P.-C. An enforced support vector machine model for construction contractor default prediction. Autom. Constr. 2011, 20, 1242–1249. [Google Scholar] [CrossRef]
- Tserng, H.P.; Liao, H.-H.; Jaselskis, E.J.; Tsai, L.K.; Chen, P.-C. Predicting construction contractor default with barrier option model. J. Constr. Eng. Manag. 2012, 138, 621–630. [Google Scholar] [CrossRef]
- Tsang, Y.K.; Abdelmageed, S.; Zayed, T. Development of a contractor failure prediction model using analytic network process. J. Arch. Eng. 2021, 27, 04021006. [Google Scholar] [CrossRef]
- Cheng, M.-Y.; Hoang, N.-D. Evaluating contractor financial status using a hybrid fuzzy instance based classifier: Case study in the construction industry. IEEE Trans. Eng. Manag. 2015, 62, 184–192. [Google Scholar] [CrossRef]
- Horta, I.; Camanho, A. Company failure prediction in the construction industry. Expert Syst. Appl. 2013, 40, 6253–6257. [Google Scholar] [CrossRef]
- Tserng, H.P.; Liao, H.-H.; Tsai, L.K.; Chen, P.-C. Predicting construction contractor default with option-based credit models—models’ performance and comparison with financial ratio models. J. Constr. Eng. Manag. 2011, 137, 412–420. [Google Scholar] [CrossRef]
- Yeh, C.-C.; Chi, D.-J.; Hsu, M.-F. A hybrid approach of DEA, rough set and support vector machines for business failure prediction. Expert Syst. Appl. 2010, 37, 1535–1541. [Google Scholar] [CrossRef]
- Mason, R.J.; Harris, F.C. Predicting company failure in the construction industry. Proc. Inst. Civ. Eng. 1979, 66, 301–330. [Google Scholar]
- Kangari, R.; Farid, F.; Elgharib, H.M. Financial performance analysis for construction industry. J. Constr. Eng. Manag. 1992, 118, 349–361. [Google Scholar] [CrossRef]
- Hall, G. Factors distinguishing survivors from failures amongst small firms in the UK construction sector. J. Manag. Stud. 1994, 31, 737–760. [Google Scholar] [CrossRef]
- Jang, Y.; Jeong, I.; Cho, Y.K. Identifying impact of variables in deep learning models on bankruptcy prediction of construction contractors. Eng. Constr. Arch. Manag. 2021, 28, 3282–3298. [Google Scholar] [CrossRef]
- Edum-Fotwe, F.; Price, A.; Thorpe, A. A review of financial ratio tools for predicting contractor insolvency. Constr. Manag. Econ. 1996, 14, 189–198. [Google Scholar] [CrossRef]
- Wong, J.M.; Ng, T.S.T. Company failure in the construction industry: A critical review and a future research agenda. In Proceedings of the 24th FIG International Congress: Facing the Challenges—Building the Capacity, Sydney, Australia, 11–16 April 2010. [Google Scholar]
- Alaka, H.A.; Oyedele, L.O.; Owolabi, H.A.; Ajayi, S.O.; Bilal, M.; Akinade, O.O. Methodological approach of construction business failure prediction studies: A review. Constr. Manag. Econ. 2016, 34, 808–842. [Google Scholar] [CrossRef]
- Alaka, H.A.; Oyedele, L.O.; Owolabi, H.A.; Bilal, M.; Ajayi, S.O.; Akinade, O.O. Insolvency of small civil engineering firms: Critical strategic factors. J. Prof. Issues Eng. Educ. Pr. 2017, 143, 04016026. [Google Scholar] [CrossRef]
- Assaad, R.; El-Adaway, I.H. Enhancing the knowledge of construction business failure: A social network analysis approach. J. Constr. Eng. Manag. 2020, 146, 04020052. [Google Scholar] [CrossRef]
- Felizardo, K.R.; Salleh, N.; Martins, R.M.; Mendes, E.; MacDonell, S.G.; Maldonado, J.C. Using visual text mining to support the study selection activity in systematic literature reviews. In Proceedings of the 2011 International Symposium on Empirical Software Engineering and Measurement, Banff, AB, Canada, 22–23 September 2011; IEEE: Piscataway, NJ, USA, 2011; pp. 77–86. [Google Scholar]
- Keim, D.A. Information visualization and visual data mining. IEEE Trans. Vis. Comput. Graph. 2002, 8, 1–8. [Google Scholar] [CrossRef]
- Wang, J.; Chen, J.; Hu, Y. A science mapping approach based review of model predictive control for smart building operation management. J. Civ. Eng. Manag. 2022, 28, 661–679. [Google Scholar] [CrossRef]
- Jin, R.; Zou, P.X.; Piroozfar, P.; Wood, H.; Yang, Y.; Yan, L.; Han, Y. A science mapping approach based review of construction safety research. Saf. Sci. 2019, 113, 285–297. [Google Scholar] [CrossRef]
- Sepasgozar, S.; Karimi, R.; Farahzadi, L.; Moezzi, F.; Shirowzhan, S.; Ebrahimzadeh, S.M.; Hui, F.; Aye, L. A Systematic content review of artificial intelligence and the internet of things applications in smart home. Appl. Sci. 2020, 10, 3074. [Google Scholar] [CrossRef]
- Kim, H.; Choi, H.; Kang, H.; An, J.; Yeom, S.; Hong, T. A systematic review of the smart energy conservation system: From smart homes to sustainable smart cities. Renew. Sustain. Energy Rev. 2021, 140, 110755. [Google Scholar] [CrossRef]
- Kuizinienė, D.; Krilavičius, T.; Damaševičius, R.; Maskeliūnas, R. Systematic review of financial distress identification using artificial intelligence methods. Appl. Artif. Intell. 2022, 36, 2138124. [Google Scholar] [CrossRef]
- Veganzones, D.; Severin, E. Corporate failure prediction models in the twenty-first century: A review. Eur. Bus. Rev. 2021, 33, 204–226. [Google Scholar] [CrossRef]
- Shi, Y.; Li, X. A bibliometric study on intelligent techniques of bankruptcy prediction for corporate firms. Heliyon 2019, 5, e02997. [Google Scholar] [CrossRef] [PubMed]
- Wang, J.; Ashuri, B. Predicting ENR Construction cost index using machine-learning algorithms. Int. J. Constr. Educ. Res. 2017, 13, 47–63. [Google Scholar] [CrossRef]
- Assaad, R.; El-Adaway, I.H.; Abotaleb, I.S. Predicting project performance in the construction industry. J. Constr. Eng. Manag. 2020, 146, 04020030. [Google Scholar] [CrossRef]
- Li, S.; Zheng, W.; Xu, T.; Wang, Y. Artificial neural network model for predicting the local compression capacity of stirrups-confined concrete. Structures 2022, 41, 943–956. [Google Scholar] [CrossRef]
- Chen, C. Science Mapping: A Systematic Review of the Literature. J. Data Inf. Sci. 2017, 2, 1–40. [Google Scholar] [CrossRef]
- Van Eck, N.J.; Waltman, L. Software survey: VOSviewer, a computer program for bibliometric mapping. Scientometrics 2010, 84, 523–538. [Google Scholar] [CrossRef]
- Waltman, L.; van Eck, N.J.; Noyons, E.C.M. A unified approach to mapping and clustering of bibliometric networks. J. Informetr. 2010, 4, 629–635. [Google Scholar] [CrossRef]
- Van Eck, N.J.; Waltman, L. Visualizing bibliometric networks. In Measuring Scholarly Impact; Springer: Cham, Switzerland, 2014; pp. 285–320. [Google Scholar]
- Waltman, L.; Van Eck, N.J. A smart local moving algorithm for large-scale modularity-based community detection. Eur. Phys. J. B 2013, 86, 1–14. [Google Scholar] [CrossRef]
- Lee, S.; Choi, W.S. A multi-industry bankruptcy prediction model using back-propagation neural network and multivariate discriminant analysis. Expert Syst. Appl. 2013, 40, 2941–2946. [Google Scholar] [CrossRef]
- Heo, J.; Yang, J.Y. AdaBoost based bankruptcy forecasting of Korean construction companies. Appl. Soft Comput. 2014, 24, 494–499. [Google Scholar] [CrossRef]
- Kapliński, O. Usefulness and credibility of scoring methods in construction industry. J. Civ. Eng. Manag. 2008, 14, 21–28. [Google Scholar] [CrossRef]
- Altman, E.I.; Marco, G.; Varetto, F. Corporate distress diagnosis: Comparisons using linear discriminant analysis and neural networks (the Italian experience). J. Bank. Financ. 1994, 18, 505–529. [Google Scholar] [CrossRef]
- Kangari, R. Business failure in construction industry. J. Constr. Eng. Manag. 1988, 114, 172–190. [Google Scholar] [CrossRef]
- Kale, S.; Arditi, D. Business failures: Liabilities of newness, adolescence, and smallness. J. Constr. Eng. Manag. 1998, 124, 458–464. [Google Scholar] [CrossRef]
- Russell, J.S.; Jaselskis, E.J. Predicting construction contractor failure prior to contract award. J. Constr. Eng. Manag. 1992, 118, 791–811. [Google Scholar] [CrossRef]
- Russell, J.S.; Zhai, H. Predicting Contractor failure using stochastic dynamics of economic and financial variables. J. Constr. Eng. Manag. 1996, 122, 183–191. [Google Scholar] [CrossRef]
- Lam, K.C.; Palaneeswaran, E.; Yu, C.-Y. A support vector machine model for contractor prequalification. Autom. Constr. 2009, 18, 321–329. [Google Scholar] [CrossRef]
- Chen, J.-H. Developing SFNN models to predict financial distress of construction companies. Expert Syst. Appl. 2012, 39, 823–827. [Google Scholar] [CrossRef]
- Sueyoshi, T.; Goto, M. DEA–DA for bankruptcy-based performance assessment: Misclassification analysis of Japanese construction industry. Eur. J. Oper. Res. 2009, 199, 576–594. [Google Scholar] [CrossRef]
- Sánchez-Lasheras, F.; de Andrés, J.; Lorca, P.; Juez, F.J.d.C. A hybrid device for the solution of sampling bias problems in the forecasting of firms’ bankruptcy. Expert Syst. Appl. 2012, 39, 7512–7523. [Google Scholar] [CrossRef]
- Dikmen, I.; Birgonul, M.T.; Ozorhon, B.; Sapci, N.E. Using analytic network process to assess business failure risks of construction firms. Eng. Constr. Arch. Manag. 2010, 17, 369–386. [Google Scholar] [CrossRef]
- Ng, S.T.; Wong, J.M.; Zhang, J. Applying Z-score model to distinguish insolvent construction companies in China. Habitat Int. 2011, 35, 599–607. [Google Scholar] [CrossRef]
- Zoričák, M.; Gnip, P.; Drotár, P.; Gazda, V. Bankruptcy prediction for small- and medium-sized companies using severely imbalanced datasets. Econ. Model. 2020, 84, 165–176. [Google Scholar] [CrossRef]
- Tian, S.; Yu, Y.; Zhou, M. data sample selection issues for bankruptcy prediction. Risk Hazards Crisis Public Policy 2015, 6, 91–116. [Google Scholar] [CrossRef]
- Chen, F.; Hope, O.-K.; Li, Q.; Wang, X. Financial reporting quality and investment efficiency of private firms in emerging markets. Account. Rev. 2011, 86, 1255–1288. [Google Scholar] [CrossRef]
- Scott, J. The probability of bankruptcy: A comparison of empirical predictions and theoretical models. J. Bank. Financ. 1981, 5, 317–344. [Google Scholar] [CrossRef]
- Becchetti, L.; Sierra, J. Bankruptcy risk and productive efficiency in manufacturing firms. J. Bank. Financ. 2003, 27, 2099–2120. [Google Scholar] [CrossRef]
- I Altman, E.; Saunders, A. Credit risk measurement: Developments over the last 20 years. J. Bank. Financ. 1997, 21, 1721–1742. [Google Scholar] [CrossRef]
- Appiah, K.O.; Chizema, A.; Arthur, J. Predicting corporate failure: A systematic literature review of methodological issues. Int. J. Law Manag. 2015, 57, 461–485. [Google Scholar] [CrossRef]
- Kaski, S.; Sinkkonen, J.; Peltonen, J. Bankruptcy analysis with self-organizing maps in learning metrics. IEEE Trans. Neural Netw. 2001, 12, 936–947. [Google Scholar] [CrossRef] [PubMed]
- Chauhan, N.; Ravi, V.; Chandra, D.K. Differential evolution trained wavelet neural networks: Application to bankruptcy prediction in banks. Expert Syst. Appl. 2009, 36, 7659–7665. [Google Scholar] [CrossRef]
- Micha, B. Analysis of business failures in France. J. Bank. Financ. 1984, 8, 281–291. [Google Scholar] [CrossRef]
- Beaver, W.H. Financial ratios as predictors of failure. J. Account. Res. 1966, 4, 71–111. [Google Scholar] [CrossRef]
- Agarwal, V.; Taffler, R. Comparing the performance of market-based and accounting-based bankruptcy prediction models. J. Bank. Financ. 2008, 32, 1541–1551. [Google Scholar] [CrossRef]
- Balcaen, S.; Ooghe, H. 35 years of studies on business failure: An overview of the classic statistical methodologies and their related problems. Br. Account. Rev. 2006, 38, 63–93. [Google Scholar] [CrossRef]
- Murray, G.D. A cautionary note on selection of variables in discriminant analysis. J. R. Stat. Soc. Ser. C Appl. Stat. 1977, 26, 246–250. [Google Scholar] [CrossRef]
- Thanh-Long, N.; Hong-Chuong, L. A back propagation neural network model with the synthetic minority over-sampling technique for construction company bankruptcy prediction. Int. J. Sustain. Constr. Eng. Technol. 2022, 13, 68–79. [Google Scholar] [CrossRef]
- Khanzadi, M.; Eshtehardian, E.; Esfahani, M.M. Cash flow forecasting with risk consideration using bayesian belief networks (BBNS). J. Civ. Eng. Manag. 2017, 23, 1045–1059. [Google Scholar] [CrossRef]
- Sousa, A.; Braga, A.; Cunha, J. Impact of macroeconomic indicators on bankruptcy prediction models: Case of the Portuguese construction sector. Math. Biosci. Eng. 2022, 6, 405–432. [Google Scholar] [CrossRef]
- Pestov, V. Is the k-NN classifier in high dimensions affected by the curse of dimensionality? Comput. Math. Appl. 2013, 65, 1427–1437. [Google Scholar] [CrossRef]
- Tsai, C.-F.; Hsiao, Y.-C. Combining multiple feature selection methods for stock prediction: Union, intersection, and multi-intersection approaches. Decis. Support Syst. 2010, 50, 258–269. [Google Scholar] [CrossRef]
- Costa, M.; Lisboa, I.; Gameiro, A. Is the Financial report quality important in the default prediction? SME Portuguese construction sector evidence. Risks 2022, 10, 98. [Google Scholar] [CrossRef]
- Bolón-Canedo, V.; Sánchez-Maroño, N.; Alonso-Betanzos, A. Feature Selection for High-Dimensional Data; Springer International Publishing: Cham, Switzerland, 2015. [Google Scholar]
- Li, Y.; Li, T.; Liu, H. Recent advances in feature selection and its applications. Knowl. Inf. Syst. 2017, 53, 551–577. [Google Scholar] [CrossRef]
- Khaire, U.M.; Dhanalakshmi, R. Stability of feature selection algorithm: A review. J. King Saud Univ.-Comput. Inf. Sci. 2022, 34, 1060–1073. [Google Scholar] [CrossRef]
- Skogsvik, K.; Skogsvik, S. On the choice based sample bias in probabilistic bankruptcy prediction. Investig. Manag. Financ. Innov. 2013, 10, 29–37. [Google Scholar]
- Fernández, A.; del Jesus, M.J.; Herrera, F. On the 2-tuples based genetic tuning performance for fuzzy rule based classification systems in imbalanced data-sets. Inf. Sci. 2010, 180, 1268–1291. [Google Scholar] [CrossRef]
- Veganzones, D.; Séverin, E. An investigation of bankruptcy prediction in imbalanced datasets. Decis. Support Syst. 2018, 112, 111–124. [Google Scholar] [CrossRef]
- Seiffert, C.; Khoshgoftaar, T.M.; Van Hulse, J.; Napolitano, A. RUSBoost: A hybrid approach to alleviating class imbalance. IEEE Trans. Syst. Man Cybern. Part A Syst. Hum. 2009, 40, 185–197. [Google Scholar] [CrossRef]
- Chawla, N.V.; Bowyer, K.W.; Hall, L.O.; Kegelmeyer, W.P. SMOTE: Synthetic minority over-sampling technique. J. Artif. Intell. Res. 2002, 16, 321–357. [Google Scholar] [CrossRef]
- Liu, A.Y.C. The Effect of Oversampling and Undersampling on Classifying Imbalanced Text Datasets. Ph.D. Thesis, University of Texas at Austin, Austin, TX, USA, 2004. [Google Scholar]
- Jang, Y.; Jeong, I.-B.; Cho, Y.K.; Ahn, Y. Predicting business failure of construction contractors using long short-term memory recurrent neural network. J. Constr. Eng. Manag. 2019, 145, 04019067. [Google Scholar] [CrossRef]
- Jang, Y.; Jeong, I.; Cho, Y.K. Business failure prediction of construction contractors using a lstm rnn with accounting, construction market, and macroeconomic variables. J. Manag. Eng. 2020, 36, 04019039. [Google Scholar] [CrossRef]
- Drummond, C.; Holte, R.C. C4. 5, class imbalance, and cost sensitivity: Why under-sampling beats over-sampling. In Proceedings of the Workshop on Learning from Imbalanced Datasets II, Washington, DC, USA, 21 August 2003; Volume 11, pp. 1–8. [Google Scholar]
- Kaur, P.; Gosain, A. Comparing the behavior of oversampling and undersampling approach of class imbalance learning by combining class imbalance problem with noise. In ICT Based Innovations; Springer: Singapore, 2018; pp. 23–30. [Google Scholar] [CrossRef]
- Mohammed, R.; Rawashdeh, J.; Abdullah, M. Machine learning with oversampling and undersampling techniques: Overview study and experimental results. In Proceedings of the 2020 11th International Conference on Information and Communication Systems (ICICS), Irbid, Jordan, 7–9 April 2020; IEEE: Piscataway, NJ, USA, 2020; pp. 243–248. [Google Scholar]
- Alexakis, P. ‘Altman Ζ-score model’ and prediction of business failures. Int. J. Monet. Econ. Financ. 2008, 1, 329. [Google Scholar] [CrossRef]
- Chan, J.K.; Tam, C.M.; Cheung, R.K. Construction firms at the crossroads in Hong Kong: Going insolvency or seeking opportunity. Eng. Constr. Archit. Manag. 2005, 12, 111–124. [Google Scholar] [CrossRef]
- Pompe, P.P.; Feelders, A.J. Using machine learning, neural networks, and statistics to predict corporate bankruptcy. Comput.–Aided Civ. Infrastruct. Eng. 1997, 12, 267–276. [Google Scholar] [CrossRef]
- Marcinkevičius, R.; Kanapickienė, R. Bankruptcy prediction in the sector of construction in Lithuania. Procedia Soc. Behav. Sci. 2014, 156, 553–557. [Google Scholar] [CrossRef]
- Kanapickiene, R.; Marcinkevičius, R. Possibilities to apply classical bankruptcy prediction models in the construction sector in Lithuania. Econ. Manag. 2014, 19, 317–332. [Google Scholar] [CrossRef]
- Karas, M.; Režňáková, M. Building a bankruptcy prediction model: Could information about past development increase model accuracy? Pol. J. Manag. Stud. 2018, 17, 116–130. [Google Scholar] [CrossRef]
- Alaka, H.; Oyedele, L.; Owolabi, H.; Akinade, O.; Bilal, M.; Ajayi, S. A big data analytics approach for construction firms failure prediction models. IEEE Trans. Eng. Manag. 2018, 66, 689–698. [Google Scholar] [CrossRef]
- Abidali, A.F.; Harris, F. A methodology for predicting company failure in the construction industry. Constr. Manag. Econ. 1995, 13, 189–196. [Google Scholar] [CrossRef]
- Langford, D.; Iyagba, R.; Komba, D.M. Prediction of solvency in construction companies. Constr. Manag. Econ. 1993, 11, 317–325. [Google Scholar] [CrossRef]
- Makeeva, E.; Neretina, E. The prediction of bankruptcy in a construction industry of Russian Federation. J. Mod. Account. Audit. 2013, 9, 256. [Google Scholar]
- Fadel, H. The predictive power of financial ratios in the british construction industrY. J. Bus. Financ. Account. 1977, 4, 339–352. [Google Scholar] [CrossRef]
- Tserng, H.P.; Chen, P.-C.; Huang, W.-H.; Lei, M.C.; Tran, Q.H. Prediction of default probability for construction firms using the logit model. J. Civ. Eng. Manag. 2014, 20, 247–255. [Google Scholar] [CrossRef]
- Adeleye, T.; Huang, M.; Huang, Z.; Sun, L. Predicting loss for large construction companies. J. Constr. Eng. Manag. 2013, 139, 1224–1236. [Google Scholar] [CrossRef]
- Muscettola, M. Probability of default estimation for construction firms. Int. Bus. Res. 2014, 7, 153. [Google Scholar] [CrossRef]
- Altman, E.I. Financial ratios, discriminant analysis and the prediction of corporate bankruptcy. J. Financ. 1968, 23, 589–609. [Google Scholar] [CrossRef]
- Dhamnetiya, D.; Goel, M.K.; Jha, R.P.; Shalini, S.; Bhattacharyya, K. How to perform discriminant analysis in medical research? Explained with Illustrations. J. Lab. Physicians 2022, 14, 511–520. [Google Scholar] [CrossRef]
- Cramer, D. Advanced Quantitative Data Analysis; McGraw-Hill Education: London, UK, 2003. [Google Scholar]
- Ohlson, J.A. Financial ratios and the probabilistic prediction of bankruptcy. J. Account. Res. 1980, 18, 109. [Google Scholar] [CrossRef]
- Jackson, R.H.; Wood, A. The performance of insolvency prediction and credit risk models in the UK: A comparative study. Br. Account. Rev. 2013, 45, 183–202. [Google Scholar] [CrossRef]
- Büyüköztürk, Ş.; Çokluk-Bökeoğlu, Ö. Discriminant function analysis: Concept and application. Eurasian J. Educ. Res. 2008, 33, 73–92. [Google Scholar]
- Uyanık, G.K.; Güler, N. A study on multiple linear regression analysis. Procedia Soc. Behav. Sci. 2013, 106, 234–240. [Google Scholar] [CrossRef]
- Keramati, A.; Yousefi, N. A proposed classification of data mining techniques in credit scoring. In Proceedings of the International Conference on Industrial Engineering and Operations Management, Kuala Lumpur, Malaysia, 22–24 January 2011. [Google Scholar]
- Jing, Z.; Fang, Y. Predicting US bank failures: A comparison of logit and data mining models. J. Forecast. 2018, 37, 235–256. [Google Scholar] [CrossRef]
- Al-Sobiei, O.S.; Arditi, D.; Polat, G. Predicting the risk of contractor default in Saudi Arabia utilizing artificial neural network (ANN) and genetic algorithm (GA) techniques. Constr. Manag. Econ. 2005, 23, 423–430. [Google Scholar] [CrossRef]
- Alaka, H.A.; Oyedele, L.O.; Owolabi, H.A.; Bilal, M.; Ajayi, S.O.; Akinade, O.O. A framework for big data analytics approach to failure prediction of construction firms. Appl. Comput. Inform. 2018, 16, 207–222. [Google Scholar] [CrossRef]
- Tserng, H.P.; Ngo, T.L.; Chen, P.C.; Tran, L.Q. A grey system theory-based default prediction model for construction firms. Comput. Civ. Infrastruct. Eng. 2015, 30, 120–134. [Google Scholar] [CrossRef]
- Karas, M.; Režňáková, M. The stability of bankruptcy predictors in the construction and manufacturing industries at various times before bankruptcy. Econ. Manag. 2017, 20, 116–133. [Google Scholar] [CrossRef]
- Karas, M.; Režňáková, M. Predicting the bankruptcy of construction companies: A cart-based model. Eng. Econ. 2017, 28, 145–154. [Google Scholar] [CrossRef]
- Pastor-Vega, D.; Fernández-Miguélez, S.M.; Diéguez-Soto, J.; Fernández-Gámez, M.A. A multi-class model to predict the result of the legal insolvency proceedings. J. Sci. Ind. Res. 2019, 78, 742–745. [Google Scholar]
- Balina, R.; Idasz-Balina, M.; Achsani, N.A. Predicting insolvency of the construction companies in the creditworthiness assessment process—Empirical evidence from Poland. J. Risk Financ. Manag. 2021, 14, 453. [Google Scholar] [CrossRef]
- Karminsky, A.; Burekhin, R. Comparative analysis of methods for forecasting bankruptcies of Russian construction companies. Бизнес-инфoрматика 2019, 13, 52–66. [Google Scholar] [CrossRef]
- Jeong, J.; Kim, C. Comparison of machine learning approaches for medium-to-long-term financial distress predictions in the construction industry. Buildings 2022, 12, 1759. [Google Scholar] [CrossRef]
- Chen, J.-H.; Su, M.-C.; Badjie, B.A. Exploring and weighting features for financially distressed construction companies using swarm inspired projection algorithm. Adv. Eng. Inform. 2016, 30, 376–389. [Google Scholar] [CrossRef]
- Sun, J.; Liao, B.; Li, H. AdaBoost and bagging ensemble approaches with neural network as base learner for financial distress prediction of chinese construction and real estate companies. Recent Pat. Comput. Sci. 2013, 6, 47–59. [Google Scholar] [CrossRef]
- Sun, J.; Li, H.; Huang, Q.H.; He, K.Y. Predicting financial distress and corporate failure: A review from the state-of-the-art definitions, modeling, sampling, and featuring approaches. Knowl.-Based Syst. 2014, 57, 41–56. [Google Scholar] [CrossRef]
- Kim, H.; Kim, H.; Moon, H.; Ahn, H. A weight-adjusted voting algorithm for ensembles of classifiers. J. Korean Stat. Soc. 2011, 40, 437–449. [Google Scholar] [CrossRef]
- Breiman, L. Bagging predictors. Mach. Learn. 1996, 24, 123–140. [Google Scholar] [CrossRef]
- Li, Q.-F.; Song, Z.-M. High-performance concrete strength prediction based on ensemble learning. Constr. Build. Mater. 2022, 324, 126694. [Google Scholar] [CrossRef]
- Mienye, I.D.; Obaido, G.; Aruleba, K.; Dada, O.A. Enhanced prediction of chronic kidney disease using feature selection and boosted classifiers. In Proceedings of the Intelligent Systems Design and Applications: 21st International Conference on Intelligent Systems Design and Applications (ISDA 2021), Online, 13–15 December 2021; Springer International Publishing: Cham, Switzerland, 2021; pp. 527–537. [Google Scholar]
- Rojarath, A.; Songpan, W. Probability-weighted voting ensemble learning for classification model. J. Adv. Inf. Technol. 2020, 11, 217–227. [Google Scholar] [CrossRef]
- Liang, M.; Chang, T.; An, B.; Duan, X.; Du, L.; Wang, X.; Miao, J.; Xu, L.; Gao, X.; Zhang, L.; et al. A stacking ensemble learning framework for genomic prediction. Front. Genet. 2021, 12, 600040. [Google Scholar] [CrossRef]
- Jing, J.; Yan, W.; Deng, X. A hybrid model to estimate corporate default probabilities in China based on zero-price probability model and long short-term memory. Appl. Econ. Lett. 2021, 28, 413–420. [Google Scholar] [CrossRef]
- Tang, X.; Li, S.; Tan, M.; Shi, W. Incorporating textual and management factors into financial distress prediction: A comparative study of machine learning methods. J. Forecast. 2020, 39, 769–787. [Google Scholar] [CrossRef]
- Yang, Y.; Lv, H.; Chen, N. A Survey on ensemble learning under the era of deep learning. Artif. Intell. Rev. 2023, 56, 5545–5589. [Google Scholar] [CrossRef]
- Caruana, R.; Niculescu-Mizil, A. Data mining in metric space: An empirical analysis of supervised learning performance criteria. In Proceedings of the tenth ACM SIGKDD international conference on Knowledge discovery and data mining, Washington, DC, USA, 24–27 August 2003; pp. 69–78. [Google Scholar]
- Chen, N.; Chen, A.; Ribeiro, B. Towards tangible benefits of corporate failure prediction with business sector: A comparative study. Intell. Decis. Technol. 2016, 10, 431–442. [Google Scholar] [CrossRef]
- Lucanera, J.P.; Fabregat-Aibar, L.; Scherger, V.; Vigier, H. Can the SOM analysis predict business failure using capital structure theory? Evidence from the subprime crisis in spain. Axioms 2020, 9, 46. [Google Scholar] [CrossRef]
- Giriūniene, G.; Giriūnas, L.; Morkunas, M.; Brucaite, L. A comparison on leading methodologies for bankruptcy prediction: The case of the construction sector in Lithuania. Economies 2019, 7, 82. [Google Scholar] [CrossRef]
- Awad, A.; Fayek, A.R. Contractor default prediction model for surety bonding. Can. J. Civ. Eng. 2012, 39, 1027–1042. [Google Scholar] [CrossRef]
- Awad, A.; Fayek, A.R. Adaptive learning of contractor default prediction model for surety bonding. J. Constr. Eng. Manag. 2013, 139, 694–704. [Google Scholar] [CrossRef]
- Rybárová, D.; Majdúchová, H.; Štetka, P.; Luščíková, D. Reliability and accuracy of alternative default prediction models: Evidence from slovakia. Int. J. Financ. Stud. 2021, 9, 65. [Google Scholar] [CrossRef]
- Tinoco, M.H.; Wilson, N. Financial distress and bankruptcy prediction among listed companies using accounting, market and macroeconomic variables. Int. Rev. Financ. Anal. 2013, 30, 394–419. [Google Scholar] [CrossRef]
- Kumar, P.R.; Ravi, V. Bankruptcy prediction in banks and firms via statistical and intelligent techniques—A review. Eur. J. Oper. Res. 2007, 180, 1–28. [Google Scholar] [CrossRef]
- Huang, J.; Ling, C. Using AUC and accuracy in evaluating learning algorithms. IEEE Trans. Knowl. Data Eng. 2005, 17, 299–310. [Google Scholar] [CrossRef]
- Bal, J.; Cheung, Y.; Wu, H.-C. Entropy for business failure prediction: An improved prediction model for the construction industry. Adv. Decis. Sci. 2013, 2013, 1–14. [Google Scholar] [CrossRef]
- Acosta-González, E.; Fernández-Rodríguez, F.; Ganga, H. Predicting corporate financial failure using macroeconomic variables and accounting data. Comput. Econ. 2019, 53, 227–257. [Google Scholar] [CrossRef]
- Chen, H.L. Model for predicting financial performance of development and construction corporations. J. Constr. Eng. Manag. 2009, 135, 1190–1200. [Google Scholar] [CrossRef]


| Journal Source | Number of Publications | Total Citations | Average Publication Year | Average Citations | Normalized Citations | Average Normalized Citations |
|---|---|---|---|---|---|---|
| Journal of Construction Engineering and Management | 13 | 420 | 2004 | 32.31 | 11.67 | 0.90 |
| Construction Management and Economics | 8 | 70 | 2003 | 8.75 | 7.13 | 0.89 |
| Engineering Construction and Architectural Management | 5 | 68 | 2010 | 13.60 | 5.32 | 1.06 |
| Expert Systems with Applications | 5 | 240 | 2014 | 48.00 | 14.18 | 2.84 |
| Journal of Civil Engineering and Management | 3 | 89 | 2013 | 29.67 | 4.27 | 1.42 |
| Journal of Management in Engineering | 3 | 40 | 2017 | 13.33 | 3.97 | 1.32 |
| Journal of Risk and Financial Management | 3 | 13 | 2021 | 4.33 | 2.52 | 0.84 |
| Researcher Name | Number of Publications | Total Citations | Average Publication Year | Average Citations | Normalized Citations | Average Normalized Citations |
|---|---|---|---|---|---|---|
| H.P. Tserng | 8 | 141 | 2013 | 17.63 | 7.11 | 0.89 |
| D. Arditi | 6 | 138 | 2002 | 23.00 | 6.18 | 1.03 |
| P.C. Chen | 7 | 137 | 2013 | 19.57 | 6.65 | 0.95 |
| R. Kangari | 2 | 123 | 1990 | 61.50 | 2.03 | 1.02 |
| J. Russell | 3 | 100 | 1996 | 33.33 | 2.97 | 0.99 |
| S. Lee | 2 | 96 | 2015 | 48.00 | 6.13 | 3.07 |
| L.K. Tsai | 4 | 90 | 2012 | 22.50 | 3.62 | 0.91 |
| S. Kale | 3 | 62 | 1999 | 20.67 | 3 | 1.00 |
| Article | Title | Total Citations | Normalized Citations |
|---|---|---|---|
| Altman et al. [39] | Corporate distress diagnosis: Comparisons using linear discriminant analysis and neural networks (the Italian experience) | 440 | 1.87 |
| Lee and Choi [36] | A multi-industry bankruptcy prediction model using a back-propagation neural network and multivariate discriminant analysis | 87 | 4.33 |
| Kangari [40] | Business failure in the construction industry | 67 | 1 |
| Kale and Arditi [41] | Business failures: Liabilities of newness, adolescence, and smallness | 62 | 1 |
| Lam et al. [44] | A support vector machine model for contractor prequalification | 60 | 1.74 |
| Heo and Yang [37] | AdaBoost-based bankruptcy forecasting of Korean construction companies | 56 | 3.89 |
| Kangari et al. [11] | Financial performance analysis for the construction industry | 56 | 1 |
| Russell and Jaselskis [42] | Predicting construction contractor failure prior to contract award | 53 | 1 |
| Kapliński [38] | Usefulness and credibility of scoring methods in the construction industry | 52 | 1.65 |
| Tserng et al. [3] | An enforced support vector machine model for construction contractor default prediction | 47 | 1.76 |
| Russell and Zhai [43] | Predicting contractor failure using stochastic dynamics of economic and financial variables | 47 | 1 |
| Sueyoshi and Goto [46] | DEA–DA for bankruptcy-based performance assessment: Misclassification analysis of Japanese construction industry | 45 | 1.30 |
| Sánchez-Lasheras et al. [47] | A hybrid device for the solution of sampling bias problems in the forecasting of firms’ bankruptcy | 44 | 2.04 |
| Dikmen et al. [48] | Using analytic network process to assess business failure risks of construction firms | 42 | 1.58 |
| Horta and Camanho [7] | Company failure prediction in the construction industry | 41 | 2.04 |
| Ng et al. [49] | Applying the Z-score model to distinguish insolvent construction companies in China | 39 | 1.46 |
| Choi et al. [2] | Predicting financial distress of contractors in the construction industry using ensemble learning | 39 | 4.43 |
| Hall [12] | Factors distinguishing survivors from failures amongst small firms in the UK construction sector | 30 | 0.13 |
| Chen [45] | Developing SFNN models to predict the financial distress of construction companies | 29 | 1.34 |
| Zoričák et al. [50] | Bankruptcy prediction for small- and medium-sized companies using severely imbalanced datasets | 29 | 2.04 |
| Type | Variable Name | Variable Description | Occurrence |
|---|---|---|---|
| Liquidity | Current ratio | Current assets/current liabilities | 40 |
| Working capital to total assets | (Current assets − current liabilities)/total assets | 37 | |
| Quick ratio | (Current assets − inventory)/current liabilities | 22 | |
| Debt to net worth | Total liabilities/(total assets + total liabilities) | 17 | |
| Current assets to net assets | Current assets/(total assets − current liabilities) | 14 | |
| Fixed assets to total assets | Fixed assets/total assets | 9 | |
| Current liabilities to total assets | Current liabilities/total assets | 9 | |
| Current assets to total assets | Current assets/total assets | 6 | |
| Leverage | Debt ratio | Total liabilities/total assets | 26 |
| Debt to equity ratio | Total liabilities/total shareholders’ equity | 22 | |
| Times interest earned | Earnings before interest and taxes/interest expense | 20 | |
| Retained earnings to sales | (Beginning period retained earnings + net income − cash dividends − stock dividends)/sales | 14 | |
| Retained earnings to total assets | (Beginning period retained earnings + net income − cash dividends − stock dividends)/total assets | 12 | |
| Activity | Total assets turnover | Net sales/average total assets | 40 |
| Accounts receivable turnover | Net sales/average account receivables | 22 | |
| Working capital turnover | Net sales/(current assets − current liabilities) | 20 | |
| Equity turnover | Net sales/average shareholders’ equity | 13 | |
| Inventory turnover | Net sales/average inventory | 13 | |
| Fixed asset turnover | Net sales/average fixed assets | 13 | |
| Accounts payable turnover | Net sales/average account payables | 12 | |
| Current assets turnover | Net sales/average current assets | 7 | |
| Profitability | Return on assets | Net income/average total assets | 42 |
| Return on equity | Net income/shareholders’ equity | 31 | |
| Return on sales | Net profit/net sales | 25 | |
| Earnings before interest and taxes to total assets | Earnings before interest and taxes/total assets | 12 | |
| Operating profit margin | Operating profit/total income | 11 | |
| EBIT margin | Earnings before interest and taxes/total sales | 8 | |
| Gross margin | Gross profit/total income | 8 | |
| Return on invested capital | (Net income − dividends)/(debt + equity) | 7 | |
| Profits to net working capital | Net profit/(Current assets − current liabilities) | 6 | |
| Sales to net income | Sales/net income | 5 | |
| Cash flow | Cash and cash equivalents to total debts | Cash and cash equivalents/total debts | 7 |
| Cash and cash equivalents to current liabilities | Cash and cash equivalents/current liabilities | 6 | |
| Cash and cash equivalents to total assets | Cash and cash equivalents/total assets | 5 |
| Type | Variable Name | Occurrence |
|---|---|---|
| Company characteristics | Company age | 12 |
| Number of employees | 9 | |
| Academic and professional qualifications of senior management | 7 | |
| Number of senior management personnel | 6 | |
| Credit granted | 5 | |
| Technical competency | 5 | |
| Environmental considerations | 4 | |
| Headquarter geographic location | 3 | |
| Claims history | 3 | |
| Project characteristics | Project value | 6 |
| Project contract value in progress | 4 | |
| Number of projects in progress | 2 | |
| Duration and complexity of project | 2 | |
| Number of past similar projects | 1 | |
| Economic conditions | Interest rates | 11 |
| Gross domestic product | 10 | |
| Consumer price index | 5 | |
| Total number of companies | 5 | |
| Number of employees in the construction industry | 4 | |
| Inflation rate | 4 | |
| Unemployment rate | 3 | |
| Housing starts | 3 | |
| Housing prices | 2 | |
| Construction consumption price index | 2 | |
| Volume of performed construction work | 1 | |
| Stock market | Earnings per share | 7 |
| Index of stock price | 3 | |
| Price to book ratio | 3 | |
| Market to book ratio | 3 |
| Metrics | Formula 1 | Relevant Articles |
|---|---|---|
| Accuracy | [7,13,36,44,45,47,79,87,88,96,97,108,111,112,113,116,117,129,130,131,132,133] | |
| Error rate | [46,69,90,92,93,134] | |
| F-measure | [56,74,79,135] | |
| Geometric mean | [50] |
Disclaimer/Publisher’s Note: The statements, opinions and data contained in all publications are solely those of the individual author(s) and contributor(s) and not of MDPI and/or the editor(s). MDPI and/or the editor(s) disclaim responsibility for any injury to people or property resulting from any ideas, methods, instructions or products referred to in the content. |
© 2024 by the authors. Licensee MDPI, Basel, Switzerland. This article is an open access article distributed under the terms and conditions of the Creative Commons Attribution (CC BY) license (https://creativecommons.org/licenses/by/4.0/).
Share and Cite
Wang, J.; Li, M.; Skitmore, M.; Chen, J. Predicting Construction Company Insolvent Failure: A Scientometric Analysis and Qualitative Review of Research Trends. Sustainability 2024, 16, 2290. https://doi.org/10.3390/su16062290
Wang J, Li M, Skitmore M, Chen J. Predicting Construction Company Insolvent Failure: A Scientometric Analysis and Qualitative Review of Research Trends. Sustainability. 2024; 16(6):2290. https://doi.org/10.3390/su16062290
Chicago/Turabian StyleWang, Jun, Mao Li, Martin Skitmore, and Jianli Chen. 2024. "Predicting Construction Company Insolvent Failure: A Scientometric Analysis and Qualitative Review of Research Trends" Sustainability 16, no. 6: 2290. https://doi.org/10.3390/su16062290