1. Introduction
The agricultural systems of developed countries are open systems [
1]. They are not autonomous, which means that they are highly dependent on external inputs such as fertilizers. Some agricultural systems are close to urban areas, which might be an important source of sewage sludge that may be used as fertilizer. Sewage sludge (SS) is a subproduct of wastewater treatment, and urban organic waste recycling and valorization, based on the principles of circular economy, is an interesting option for the European Union [
2,
3]. The application of SS to soil is an economic-nutrient source, as organic fertilizers may partially or totally replace mineral fertilizers without yield reduction [
4]. Fertilization using sewage sludge might therefore be a practice that could increase sustainability.
In Spain, according to the National Sludge Registry, 1,200,000 dry matter tons of SS are generated annually [
5], of which ca. 80% is suitable for agronomic valorization [
6]. At the national level, 71% of the available SS is applied in agricultural fields [
5]. Sludge provides nutrients and organic matter [
7], although its composition varies depending on the wastewater source and the provided treatment [
8]. Nevertheless, the use of SS is associated with different ecotoxicity risks, for example, pharmaceutical compounds [
9] or antibiotic resistance genes [
10]. Although regulations have been set up to reduce potential impacts, these only restrict the heavy metal contents [
11,
12] and the maximum amount of nitrogen (170 kg N ha
−1) allowed to be applied in nitrate-vulnerable areas [
13]. However, the average sludge N:P ratio is 2.45, while in the maize plant the N:P ratio is 10 [
14], and so if fertilization is carried out according to the maximum allowed sludge nitrogen criterion, the phosphorus in the soil may increase considerably under maize monoculture. For this reason, there is growing interest in a fertilization strategy that follows a sludge phosphorus criterion based on the amount of available soil P rather than the maximum allowed N rate from organic materials. This approach aims to mitigate the risk of P accumulation in the soil and potential P leaching [
15]. It might also contribute to the circular economy [
16] and to the sustainability of agricultural systems as P resources are scarce and phosphate rock is a non-renewable resource [
17].
The use of sludge as a fertilizer has been extensively studied as a nutrient source [
18,
19,
20] and so has the transfer of nutrients to the crop [
21]. Considerably less effort, however, has been invested in describing the impact of sludge applications on soil quality [
22], especially in calcareous soils where heavy metals are more easily immobilized due to their high soil pH. Apart from its chemical properties [
21], soil quality can also be assessed based on its biological and physical properties. Earthworms respond to changes in soil chemistry and agricultural practices, and so their abundance is considered to be a good environmental indicator [
23]. Additionally, variables such as species number are also recognized as reliable indicators of environmental conditions [
4]. Another bioindicator is the oribatid community. Oribatids are one of the main groups of decomposers. In fact, a high correlation exists between soil organic matter and the specific diversity of oribatids [
24,
25,
26,
27]. They are sensitive to soil degradation and have a robust correlation with soil functioning. The latter explains why they are useful for assessing soil status [
24,
28]. Apart from the organic matter content, oribatid communities are modified by other soil properties, including the disturbance level and heavy metal concentration [
29,
30]. Oribatid species can also be negatively affected by the addition of treated SS to soil [
31]. Among the physical soil properties, the characterization of the soil pore system [
32], changes in soil structure features [
33], and aggregate stability are of interest. However, only long-term experiments are able to provide the required precision for aggregate stability studies [
34].
A long-term experiment was developed in an irrigated region in the northeast of Spain where soils are calcareous. The general aim was to analyze the effects of sewage sludge application on the biological and physical soil properties, compared with mineral fertilization. Maize (Zea mays L.) was established annually as a monoculture. The experiment had three fertilizer treatments: sludge applied following the nitrogen criteria (maximum allowed N rate from organic fertilizers), sludge applied following the phosphorus criteria (maximum threshold of Olsen-P soil level not to be exceeded), and mineral fertilization (based on extensionist recommendations in the area). We hypothesized that sludge applied following the phosphorus criterion may be a more agronomic and environmentally sustainable option than the nitrogen criterion when physical and biological soil quality parameters are introduced as indicators, although yields might not be affected in the medium term.
The main objectives of this work were to assess both the changes in the biological soil quality indicators (earthworm abundance, oribatid mite species abundance, and number of individuals for the different identified mite species) and the changes in the physical soil quality indicators (soil porosity and soil aggregate stability) in a maize monoculture following sewage sludge fertilization for a period of 20 years. Furthermore, from the obtained results, the aim includes a recommendation about the best fertilization treatment to apply from the point of view of physical and biological soil quality while sustaining yields.
2. Materials and Methods
2.1. Experimental Site and Experimental Design
The experiment was established in 1996 in La Tallada d’Empordà (Girona, NE Spain) and maintained from then on. The coordinates of the site are 42°05′37″ N, 03°06′39″ E, and the altitude is 17 m a.s.l. The area has a dry Mediterranean climate. The annual average temperature for the period from 1999 to 2018 was 14.9 °C, with high average summer temperatures of 22.6 °C. The annual average precipitation in the same period was 646 mm year−1, with most rain falling during the months of September, October and November. The annual average reference evapotranspiration (FAO Penman–Monteith equation) was 976.9 mm year−1 for the same period. In 2019, annual rainfall and reference evapotranspiration were 549 mm and 1056 mm, respectively. Irrigation is needed for summer crops in the region, and furrow irrigation is widespread in the area. From the 2015 cropping season, the experimental field was under a high-frequency irrigation system (exudation belt lines).
The soil was classified as an Oxyaquic Xerofluvent, and the family particle-size class was coarse-loamy [
35]. The soil was deep (>1.2 m), non-saline, and calcareous without stones. Soil bulk density was 1565 kg m
−3 for the first 0.3 m depth interval. The upper layer (0–0.2 m) had a sandy loam texture, a pH (potentiometry, water 1:2.5;
w:
v) of 8.2, and an electrical conductivity (1:5, 25 °C,
w:
v) of 0.18 dS m
−1. Equivalent calcium carbonate (Bernard’s calcimeter method) was 140 g kg
−1.
The experiment included three fertilization treatments, which were distributed according to a randomized block design with four replicates. The annual treatments included a mineral fertilization treatment as a control (MIN) and two sludge treatments where doses followed a threshold sludge nitrogen criterion (SNC) or a soil threshold phosphorus criterion (SPC). The MIN treatment corresponded to the mineral fertilization followed by farmers in the area. In the 2019 cropping season, 100 kg ha−1 of N, P2O5 and K2O were applied on the 10 April 2019. At topdressing (25 June 2019), they were complemented by 70 kg N ha−1. In the SNC treatment, sludge was also applied on the 10 April 2019 at a rate of 170 kg N ha−1 with a mineral supplementation of 100 kg K2O ha−1. The SPC followed the SNC treatment, but when soil Olsen-P levels exceeded 40–60 mg P kg−1, no sludge was applied the following season, and instead, only minerals N and K were applied as in the MIN treatment. Thus, from 2006 to 2009 and in 2014, no sludge was applied in SPC. In 2019, sludge was applied in the SPC and in the SNC treatments. The plots receiving the sludge application had an area of 41 m2 (9.6 m long and 4.25 m wide). The control plots had an area of 81.6 m2 (9.6 m long and 8.5 m wide).
After the 2018 harvest (10 October 2018), as is customary every year, the maize stalks were chopped and incorporated into the soil through ploughing. Also, after sludge application in March 2019, a disk-plough operation was carried out on all plots included in the experimental field, following the common practice in the area. Sowing was performed on the 12 April 2019 at a density of 80,000 seeds ha
−1. Seeds were treated with the flowable concentrate Sonido (Bayer Crop Science) containing Tiacloprid (400 g L
−1). The maize variety was P1570Y (Pioneer). The preemergence herbicide was Camix 3.5 (4%
w/
v Mesotrione, 40%
w/
v S-metolachlor) from Syngenta. Irrigation began on the 7th June and finished the 16th September. Total applied water was 3936 m
3 ha
−1. Historical average yields were close to 14 Mg ha
−1 and there were no differences between treatments. The 2019 harvest (10 October 2019) had average yields (±standard deviation) of 13,779 (±1209) kg ha
−1. No differences between treatments were observed (
Table A1).
2.2. Field Samplings and Measurements
Every season, before the organic fertilizer application, a sludge sample was taken and analyzed in the laboratory in order to adjust the rate to 170 kg N ha
−1, as it was conducted in March 2019 (
Table 1). Total N was quantified by the Kjeldahl digestion and distillation method [
36] and total carbon by ignition at 550 °C. Heavy metals and P and K in sludges were analyzed from microwave digested samples (UNE-EN 16174:2012) [
37] with aqua regia (3:1,
v:
v, HCl:HNO3), and they were quantified using inductively coupled plasma mass spectrometry (UNE-EN 16171) [
38].
Before the 2019 maize cropping season, the soil was resampled with an auger (composite samples from each treatment) on the 5 October 2018 for a more detailed chemical characterization (
Table 1). Soil samples were immediately transferred to the laboratory in polyethylene bags protected from sunlight. These soil samples were stored at 4 °C until nitrate content was analyzed by ionic chromatography [
39] after nitrate extraction with demineralized water. Afterwards, soil samples were dried at room temperature and ground to 2 mm. Soil pH was determined in aqueous solution using a 1:2.5 (soil:water) ratio, salinity (electrical conductivity, EC) by conductimetry (1:5), oxidizable organic carbon by [
40], available P content by the Olsen method (sodium bicarbonate-extractable P at pH 8.5 [
41], and exchangeable K by extraction with ammonium acetate 1 N (pH = 7) [
42] and determined by atomic absorption spectrophotometry. Soil heavy metals were analyzed following the same procedures used in sludges.
Earthworms were quantified from topsoil samples obtained on the 10 October 2018 (at maize harvest) and on the 3 July 2019 from the four replicates of each treatment. Monoliths (0.2 m long, 0.2 m wide, and 0.2 m deep) were excavated from the surface. A total of 24 monolithic samples were studied. Earthworms were separated from the soil following the sampling protocol proposed by the Spanish standard UNE-ISO-23611-1 [
43]. Earthworms were extracted manually from the monoliths, washed with warm water, stored for 24 h in ethanol (70%) and then fixed with formaldehyde. The extracted individuals were quantified for abundance considering the whole earthworm body, and if it was cut, only the fore part (i.e., with the head) was counted.
Oribatid mite identification was performed in soil samples obtained on the 10 October 2018, 6 March 2019 and 3 July 2019 from three replicates of each treatment. In each replicate, a composite sample was obtained from 3 sampled points, for a total of 36 composite samples studied. Sampling was performed with soil cores (6 cm in diameter) from 0 to 5 cm in soil depth, as oribatids mainly accumulate close to the surface [
44]. They were extracted with a Berlese-Tullgren funnel over a period of 12 days, and they were directly preserved in 70% ethanol. For identification at species level, they were immersed in lactic acid.
Soil porosity and microstructure were characterized from undisturbed soil surface prisms (0.15 m deep, 0.15 m wide and 0.2 m long) excavated on the 3 October 2018 from each replicate (12 prisms). From each prism, a horizontal, thin section (30 µm thick) was obtained following the procedure established by [
45]. The 12 soil sections were scanned, and a central area (43.9 mm high and 81.4 mm wide) was processed with the software ImageJ
® (IJ1.46r) [
46] to obtain digital binary images. These binarized images were used to quantify porosity. Pores with an apparent diameter (APD) < 30 μm were discarded.
Aggregate stability was evaluated from topsoil samples (0–0.15 m depth) obtained on the 3 October 2018 from each replicate of the three treatments (12 samples). Firstly, soil aggregate stability was quantified according to the mean weight diameter (MWD) or the aggregate-size distribution after fast wetting. The MWD was determined following the guidelines provided by [
47] and modifications outlined by [
48]. Secondly, the evaluation of water-stable aggregates (WSA) was performed. The WSA were obtained following the procedure described by [
49] but using dry aggregates, as this allows better evaluation of the slaking disaggregation effect under Mediterranean conditions [
50].
2.3. Statistical Analysis
The absolute abundance of earthworms was assessed using a Generalized Linear Mixed model (GLMM) with a Binomial Negative distribution appropriate for count data and utilizing a square root (sqrt) link function. Overdispersion was scrutinized, and model assumptions were validated through the examination of residual plots. The GLMM incorporated a random intercept for the block-sampling time interaction and treated treatment and sampling time as fixed effects. The statistical analyses were conducted using R (version 3.6.2) with the ‘lme4’ package [
51].
Oribatid abundance was analyzed using PROC MIXED from SAS version 9.4 for Windows (SAS Institute Inc., Cary, USA). A square root transformation was applied to abundance data to make the variation more uniform. The statistical model contained a fixed effect for treatment and sampling time and a block as a random effect. Treatment least squares means were computed using the LSMEAN. Also from SAS, the GLMM procedure was used to analyze differences in the number of mites present and associated with the identified species in each sampling. Only species with more than five individuals present for each treatment and sampling were included in the analysis.
An analysis of variance (ANOVA analysis) was used to test the effect of fertilization treatments on soil porosity, MWD and WSA. Means separation was performed according to the Duncan multiple range test for the α = 0.05 probability level.
3. Results
The soil chemical characterization of the field plots (according to the historical fertilization treatments) and the chemical properties of the sludge applied in 2019 are summarized in
Table 1. Soil parameters reflect some characteristic trends under sludge fertilization: the increase of organic matter, mineral N, total Cu, total Zn and available P.
Earthworm abundance in soil samples showed high variability, and it was neither affected by sampling date or by treatment (
Table A2). Average earthworm abundance (±standard deviation) was 71 (±38) and 35 (±28) individuals m
−2 (in 0.2 m deep) in October 2018 and in July 2019, respectively. In treatments, earthworm abundance average (±standard deviation) was 34 (±38), 69 (±57) and 64 (±89) individuals m
−2 (in 0.2 m soil depth) for MIN, SPC and SNC, respectively.
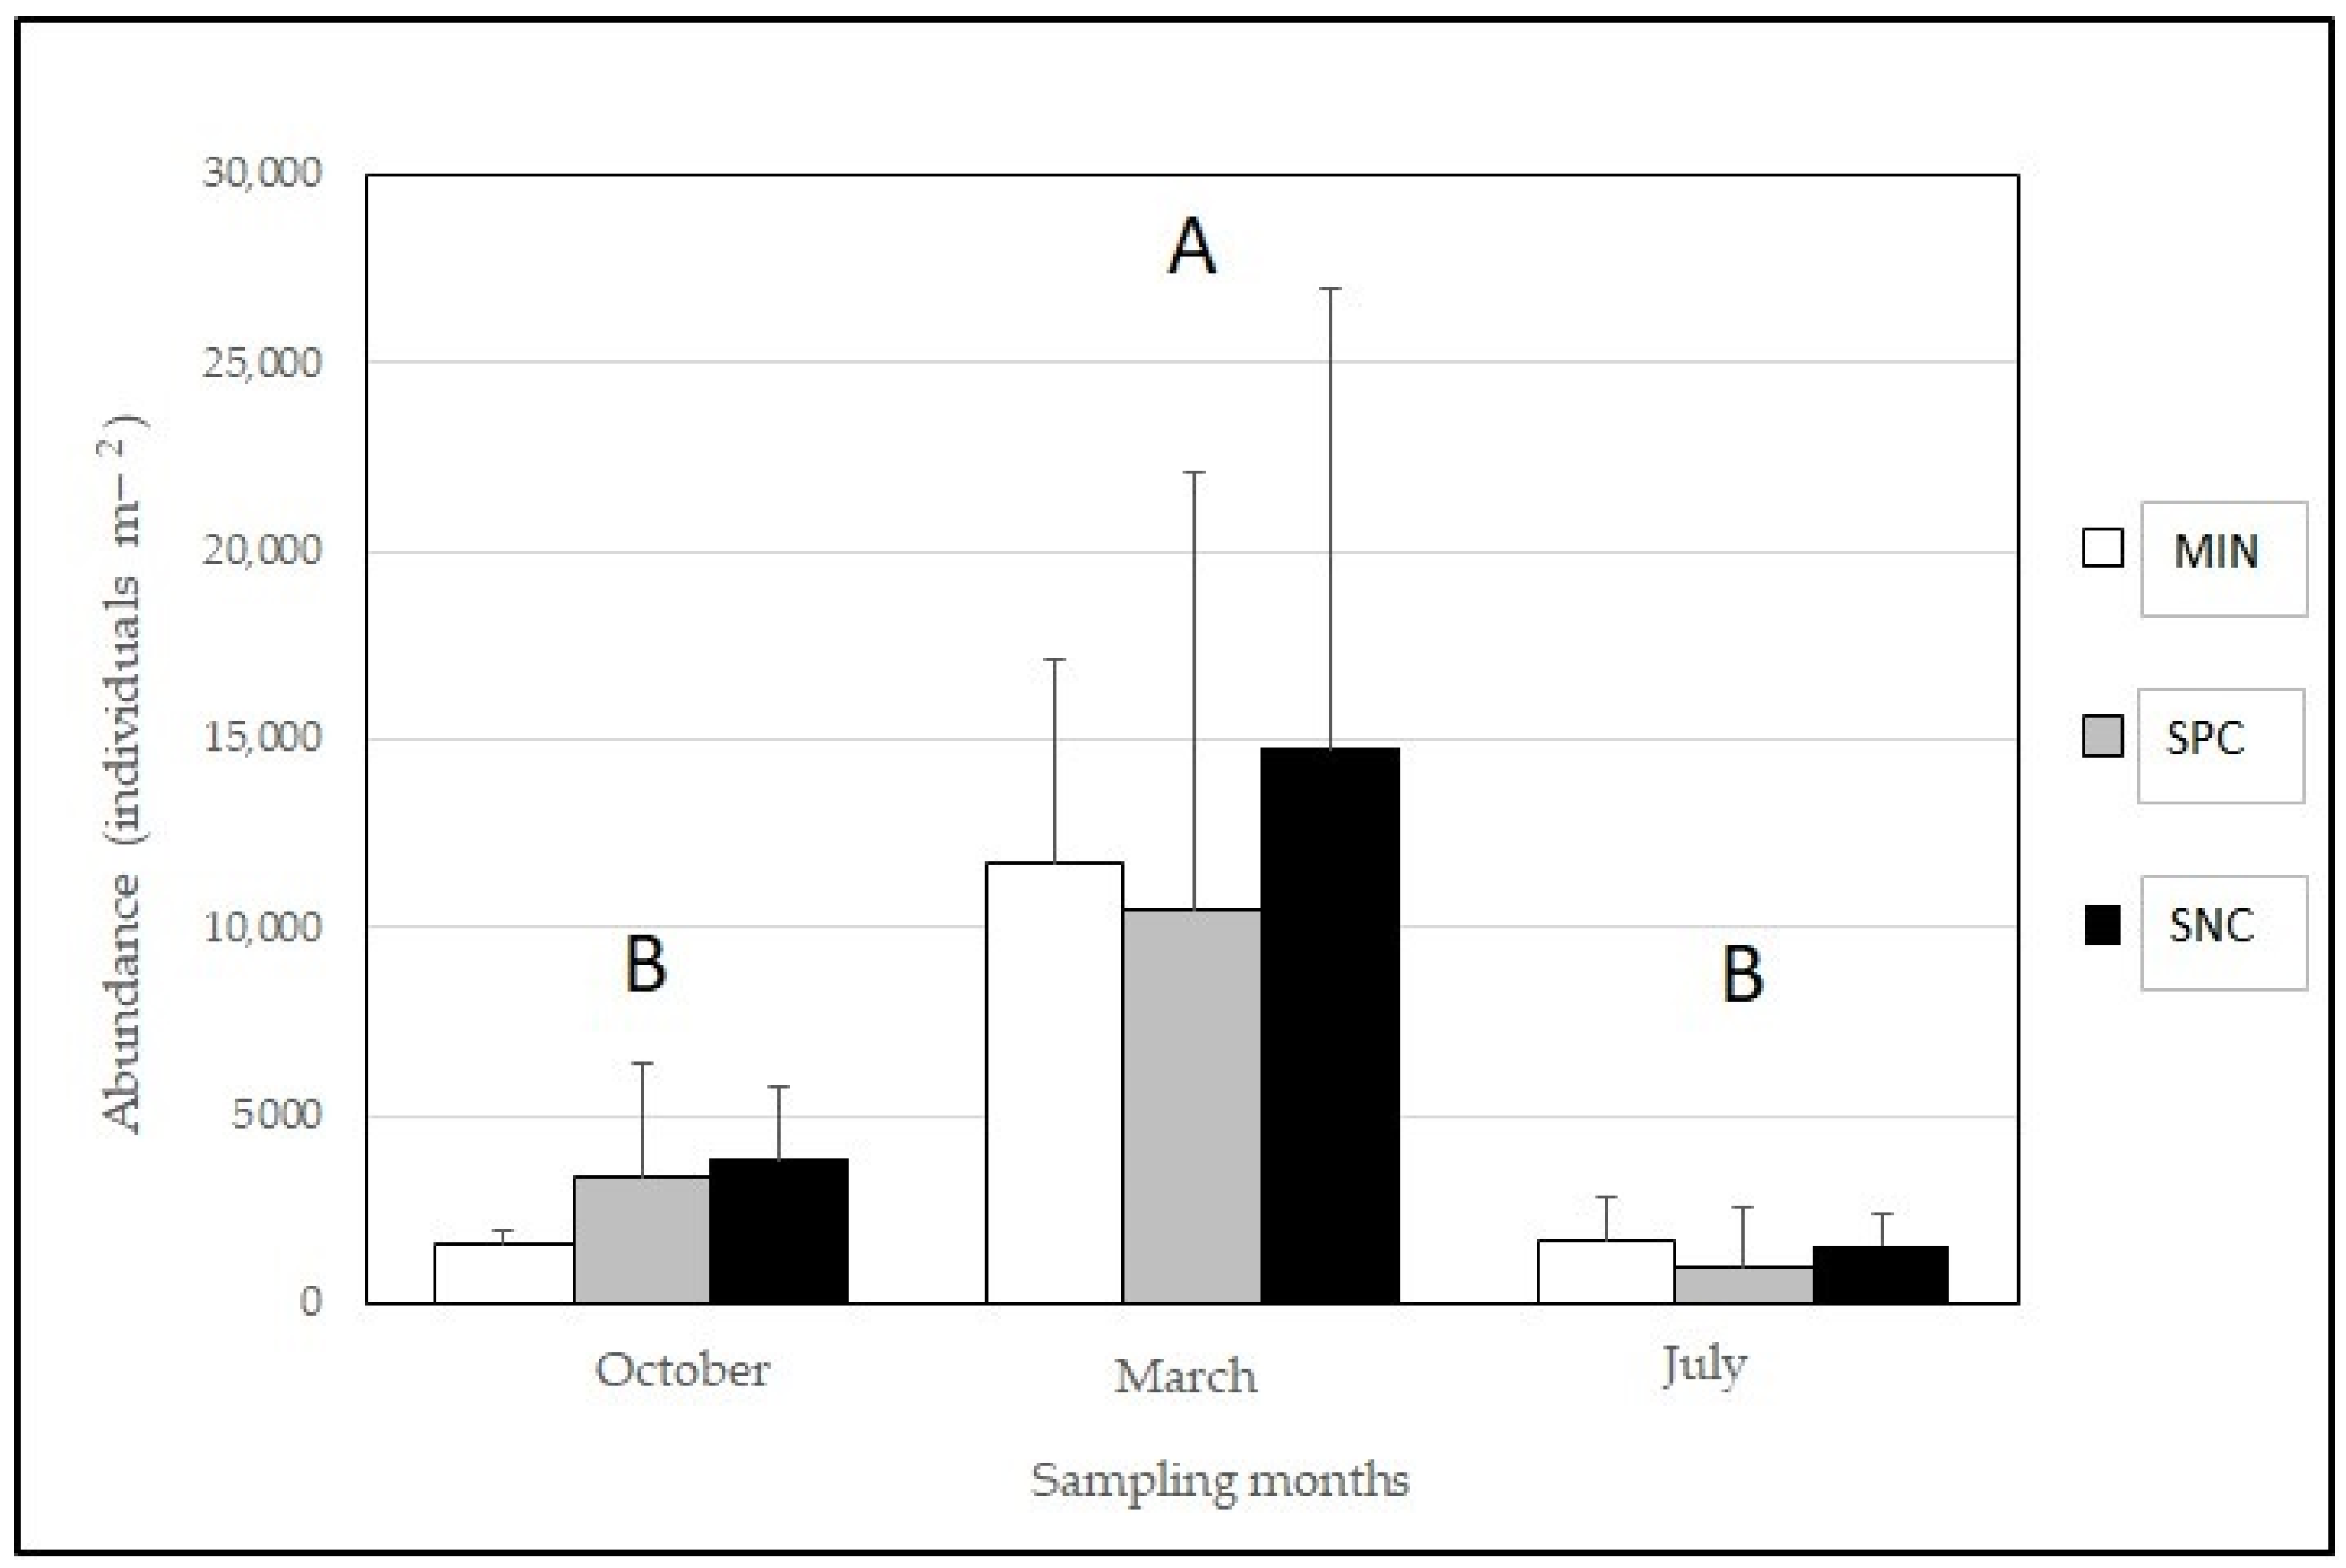
The oribatid abundance varied significantly with time (
Table A3) but without differences between treatments. In March, abundance was significantly higher than in October and July which showed similar values (
Figure 1).
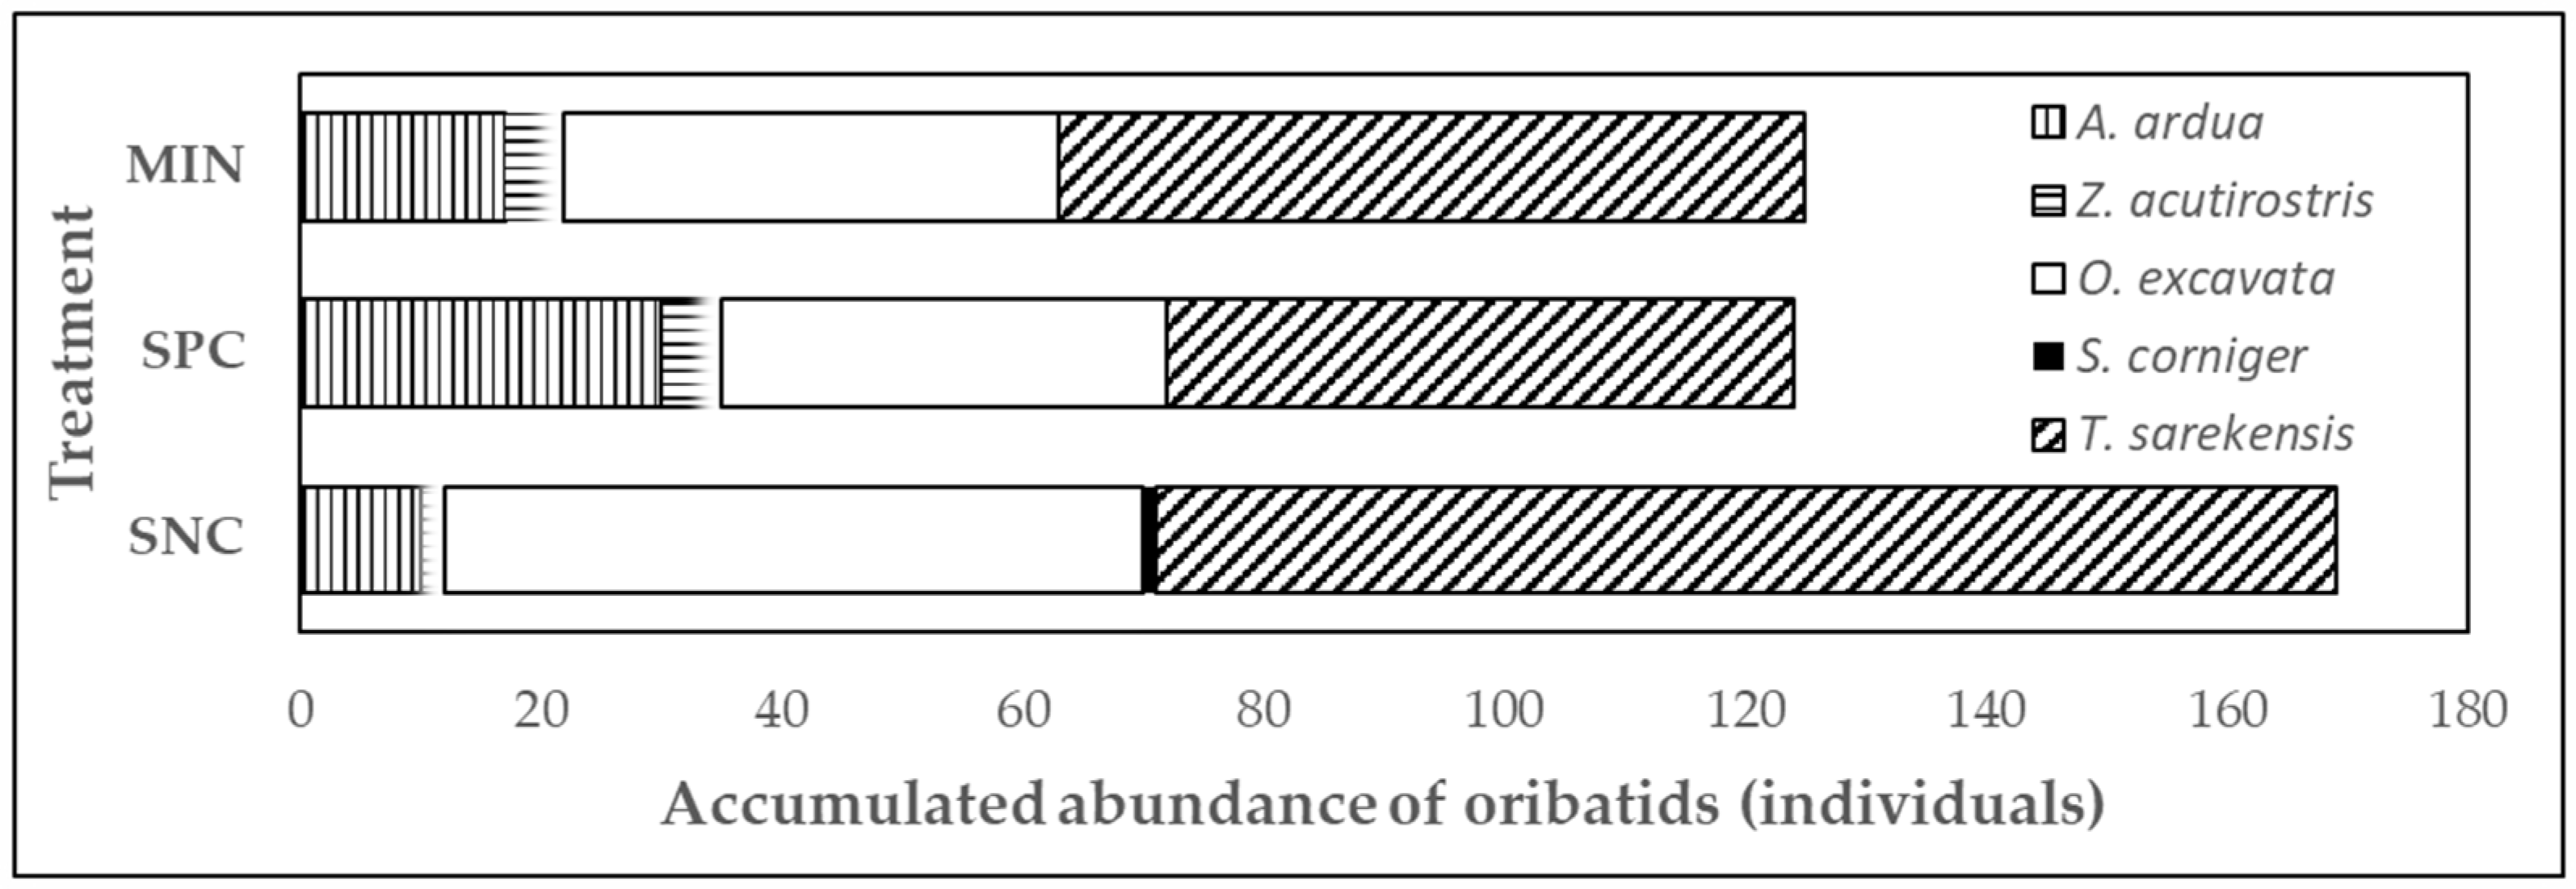
Three main species were identified (
Figure 2):
Acrotritia ardua americana (Ewing, 1909),
Oribatula (Zygoribatula) excavata Berlese, 1916 and
Tectocepheus sarekensis Trägårdh, 1910. Another two species were present:
Scapheremaeus corniger (Berlese, 1908) that can be considered an outsider as only one individual was found, and
Zetomimus (Protozetomimus) acutirostris (Mihelčič, 1957) with less than a total of five individuals present in each treatment and in different samplings.
The presence of the two main species,
O. excavata and
T. sarekensis, varied with time (
Table A4); they followed the total abundance trend (
Figure 1). The highest values were in the March sampling period. There were no differences between the other sampling periods (October and July). The presence of
A. ardua did not show significant differences with time or between treatments. As a result, in March, the presence of
A. ardua was significantly lower than that of
O. excavata and
T. sarekensis (
Table A5). The values in March 2019 were 1336, 4637 and 6013 individuals m
−2 for
A. ardua,
O. excavata and
T. sarekensis, respectively.
In the thin-section analysis, prominent porosity features were observed (
Figure 3).
In thin sections, it was also observed that MIN treatment did not have much pedality, as demonstrated by the fact that it did not develop many aggregates. The structure was massive (with a few cracks between aggregates) with small pores. Some wildlife activity was detected associated with biopores (faunal channels and chambers). Vesicles and cavities were observed as isolated pores. The SPC treatment showed cracks and packing pores between aggregates, which were very irregular. The SNC treatment resulted in greater pedality than SPC, although cracks and packing pores between aggregates were similar to the SPC treatment. However, no differences were found in total meso-macroporosity (>30 µm) (
Table A6). Total porosity in the studied area was 49.5%, 47.0% and 40.3% for MIN, SPC and SNC, respectively.
Micromorphological observations matched with the aggregate stability results. The sludge additions significantly increased MWD and WSA values when compared with the mineral treatment (
Table A7,
Figure 4).
4. Discussion
As maize yields were above 13 Mg ha
−1, the agricultural management of the experimental field can be considered highly productive [
52], regardless of the fertilizer treatment applied. It is noteworthy that high yields are obtained when the annual maximum rate restriction of 170 kg ha
−1 of N from organic origin, which applies in European nitrate vulnerable areas [
53], is respected in SNC and SPC treatments. High yields can also be attained when Olsen-P soil levels are maintained below (
c. half values) the upper soil threshold of 80 mg P kg
−1 established by the Catalan government in Spain [
54].
For loamy soil, the fertility level based on the available P in MIN treatment was acceptable (normal level) [
9]. However, values of available P were very high under sludge treatments [
9], mainly when the SNC criterion was followed. Available K was low in all treatments [
9]. Heavy metal concentrations in the soil were far below the upper Spanish threshold levels [
12,
55]. In sludge, heavy metal concentrations were also below the upper Spanish thresholds [
12,
55].
Earthworm abundance was low. The number of recorded individuals was half that recorded in calcareous soils under cereal rainfed systems, where figures have been shown to oscillate between 100 and 176 individuals m
–2 [
4]. Low soil moisture in October (to allow maize harvester traffic) or high air temperatures in July (average of 24.8 °C with a maximum of 34.6 °C) were conditions that might have constrained earthworm activity [
56]. In fact, the above-mentioned authors indicate that the end of wintertime and the beginning of springtime are the most favorable for earthworm activity. The addition of organic matter is considered to be one of the management aspects that most affects the abundance of earthworms, as organic matter is a source of food for worms and allows population growth [
28]. However, no differences were found between treatments, probably because the average soil organic matter content was low (12–16 g kg
−1,
Table 1). Nevertheless, earthworm activity through bioturbation was visible in soil-thin sections (
Figure 3).
The sampling period with the highest oribatid mite abundance was in March (
Table A3 and
Table A4;
Figure 1), irrespective of the treatment. Variations among sampling dates were expected, given that the overall abundance of oribatid mites is known to fluctuate throughout the year and show a peak related to their reproductive cycle, i.e., from egg deposition to the adult stage [
57]. In March, the average oribatid mite abundance was noteworthy (12,302 individuals m
−2). This figure is double the recorded values from areas with similar rainfall under grassy arable fallows [
58]. Three main oribatid species were found. This result means low diversity. In fact, the density and diversity of oribatids have been shown to decrease as the intensification of agriculture increases [
59,
60]. The presence of the eurytopic species
T. sarekensis is important because
Tectocepheidae are commonly found in cultivated soils and heavily disturbed areas [
61].
Tectocepheus sarekensis and
A. ardua have been identified as suitable indicators for negative agricultural management impacts [
62]. Moreover,
T. sarekensis is also suitable for assessing the degree of ecosystem vulnerability [
30]. Their presence might serve as an early warning for the health of the maize monoculture ecosystem. In this experiment, it is noteworthy that no significant differences were associated with treatments; instead, differences were observed only among sampling dates. This absence of differences between treatments in the presence of
T. sarekensis could indicate the sustainability of the applied rates. Furthermore,
Oribatula (Zygoribatula) excavata usually establishes an abundant community where animal droppings are applied at agronomic rates when N overfertilization is avoided [
63]. No decreasing trend in the abundance of these species at high sludge rates (SNC) was observed, indicating that they were not affected by P overfertilization.
In terms of microstructure, the increased pedality of SNC compared to SPC (
Figure 3) could be interpreted as a saturation effect resulting from the highest sludge rate, which prevented the structure from developing further. Some authors support the idea that the potential benefits of SS for soil structure are limited to their use within a certain dose range [
64]. No significant differences between treatments in terms of the percentage of total porosity (>30 μm) were found. Total porosity includes biopores, cracks and pores between aggregates. Additionally, it should be noted that mesoporosity (apparent pore diameter between 30 and 70 μm) and macroporosity (apparent pore diameter > 70 μm) are linked to soil water drainage. Consequently, the potential movement of water and nutrients due to bypass flow was not significantly altered. The isolated vesicles and pores, predominantly observed in the MIN treatment, are a characteristic of soils with a low organic matter content [
65]. Therefore, sludge applications also contributed to the improvement of this aspect. Furthermore, the circularity observed in some pores in the MIN treatment (
Figure 3) is associated with some fauna channels but not with structure improvement (few cracks between aggregates). In contrast, a greater abundance of rounded aggregates was observed in SNC and SPC compared to MIN (
Figure 3). The addition of sewage sludge, regardless of the dose applied, also resulted in a significant improvement in structural stability evaluated as MWD and WSA, which coincides with previous findings [
66].

 ,
, 