Abstract
In lake aquatic ecosystems, which form the material and energy base of lakes, primary production is critical. The present study addresses the characteristics of primary phytoplankton productivity and its relationship with environmental physicochemical factors in three typical zones (algae-type, transition, and grass-type) of the eutrophic Lake Taihu. Seasonal sampling was conducted, and black–white bottle oxygen measurement was used to determine the primary productivity in different water layers in the lake. The results show obvious temporal and spatial differences in the physicochemical factors and phytoplankton productivity in Lake Taihu. The water column productivity and respiration conformed to the following seasonal descending order, summer > fall > spring > winter, and the following regional descending order, algae-type zone > transition zone > grass-type zone. The seasonal proportions of primary productivity were approximately 40% in the summer, 25% in the fall, 20% in the spring, and less than 15% in the winter. The highest values of water layer productivity and respiration were mainly at a depth of 0.2 m and decreased with the water depth. The percentage of productivity at different water layers was 23% (0 m), 31% (0.2 m), 23% (0.4 m), 11% (0.6 m), 7% (0.8 m), and 5% (1 m). The optical compensation depth for Lake Taihu was about 0.8 times the transparency (SD). Spearman correlation indicated that the temperature (T) and water depth (D) had an obvious impact on productivity in all three lake zones. Multiple stepwise regression suggested that T, D, SD, and chlorophyll-a (Chl-a) can be used to estimate productivity in different seasons/regions. The main influencing factors on phytoplankton productivity are T, D, Chl-a, and SD in the algae-type and transition zones and T, D, and total suspended solids (TSSs) in the grass-type zone.
1. Introduction
Lakes are one of the most important freshwater resources in the world. Grass-type and algae-type lakes represent different stages in the lake succession process, with macrophytes and algae being the primary producers of the two stages, which are mutually inhibited [1,2,3]. Due to the increasing intensity of development and the utilization of resources in lake basins in recent years, a series of ecological and environmental problems have arisen in some lakes [4,5]. For example, eutrophication has become a global environmental problem in lake ecosystems [6]. With the intensification of eutrophication in lakes, grass-type lakes tend to gradually transform into algae-type lakes, which leads to obvious changes in the ecological and physicochemical characteristics of the water body and negatively affects the structure of aquatic plant communities [7,8,9]. In particular, in lakes in which the toxic Microcystis dominates, the production of microcystin will cause a significant deterioration in water quality and harm aquatic organisms [10,11]. Therefore, the protection of lakes is a matter of urgency.
Primary productivity is a fundamental link in the structure and function of aquatic ecosystems and is of great significance in the study of aquatic ecosystems and their environmental characteristics [12,13]. Primary productivity refers to the ability of autotrophic organisms to absorb light energy and synthesize inorganic matter into organic matter per unit of time and space [12,14]. These autotrophic organisms include phytoplankton, epiphytic algae, aquatic vascular plants, and autotrophic bacteria. As the most important primary producer in lakes, phytoplankton forms the basis of the material cycle and energy flow in aquatic ecosystems [15,16]. The level of primary productivity of phytoplankton will determine the stability of the whole ecosystem, and it is of great significance to understand the law of change in primary phytoplankton productivity to recognize the ecological process of lakes [17]. Primary productivity studies can also estimate the potential of fishery production and indicate the level of eutrophication in water bodies. These studies are of significant value when evaluating the quality of the water environment, which can guide aspects such as fishery production and ecological protection [18,19,20].
Lake Taihu is the third largest freshwater lake in China, with an area of 2338 km2, and serves various functions including providing drinking water, fishery, tourism, irrigation, a water highway, and floodwater detention. Due to the yearly increase in the amount of domestic sewage and industrial wastewater released into Lake Taihu, algae in the water body have tended to multiply in large numbers, especially in the summer, and water blooms can be seen almost all over the lake, which directly affect the lives of residents and the development of industries around the lake [21,22]. The water quality of Lake Taihu has slowly become better through a dual process of vigorous treatment and protection in recent years; however, there is a significant gap in the treatment objectives [23].
Despite extensive research regarding phytoplankton primary productivity in this representative large eutrophic lake, only a few comparative studies have been performed on both temporal (four seasons) and spatial (typical algae-type, transition, and grass-type zones) scales. This work investigated the characteristics of phytoplankton productivity in three characterized lake zones of Taihu through a four-season monitoring campaign. The present study outcome could potentially contribute to monitoring and data sustainability and complement algal bloom management efforts in this typical eutrophic lake.
2. Materials and Methods
2.1. Selection of Typical Regions and Setting of Sampling Points
Lake Taihu (30°55′40″–31°32′58″ N, 119°52′32″–120°36′10″ E) contains multiple lake regions (Figure 1), and each region has different environmental characteristics. Three typical regions were selected for the present study based on our pre-investigation [23], namely, Meiliang Bay (algae-type region), Gonghu Bay (transition region), and East Taihu Bay (grass-type region). There is not much difference in the water area between these three regions; their ecological characteristics are shown in Table 1. Three sampling points were set up in each lake region, as shown in Figure 1.
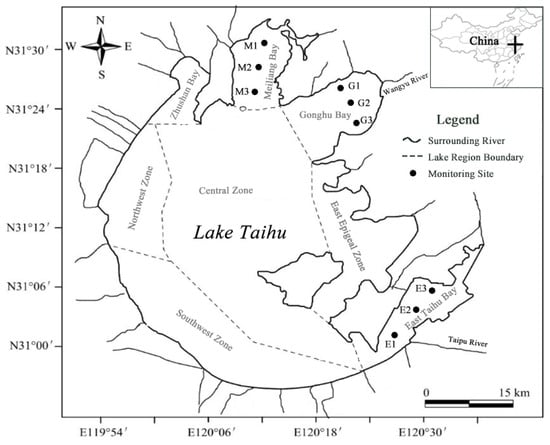
Figure 1.
Sampling sites in the three lake regions of Taihu.

Table 1.
Basic information on the three lake zones [23,24].
2.2. Field Sampling and Laboratory Analysis
Seasonal field sampling was conducted in February (winter), April (spring), July (summer), and October (fall) of 2023. After completing a GPS fix in the field, a Hash Hydrolab HL7 Multi-Parameter Monitor was used to measure dissolved oxygen (DO), temperature (T), chlorophyll-a (Chl-a), and pH. The water depth (D) and transparency (SD) were measured using an SM-5 depth sounder and a Secchi disk, respectively. The turbidity of the water was measured using a Hach 2100Q portable turbidimeter. There is a strong relationship (r = 0.94) between the turbidity values and total suspended solids (TSSs) in Lake Taihu [25]; therefore, the obtained turbidity data (NTU) can be converted into TSS values (mg/L).
Upon completion of the above site monitoring, the surface (0.5 m) water samples were collected into a 500 mL bottle and a 1 L bottle. Lugol’s solution (1%) and formaldehyde (4%) were added immediately to the 1 L bottle, and the samples were transported back to the laboratory for subsequent analysis. The 500 mL water sample was used to determine the total phosphorus (TP) and total nitrogen (TN) via the digestion–ascorbic acid method and sulfate oxidation method, respectively [26]. The 1 L water sample was used for an assay of the algae density (AD); species identification and cell counts were performed under an optical microscope [27]; and the microscope counting method was used for the algae density calculation.
2.3. Black and White Bottle Oxygen Measurement
Black and white bottle oxygen measurement is a traditional method for estimating phytoplankton productivity. To represent the black and white bottles, 250 mL dark brown and clear, wide-mouthed reagent bottles were used, respectively, and the outer cover of the black bottle was tied with a black cloth pocket. Based on the water depth, the black and white bottles were suspended at the surface (0 m) and at 0.2 m, 0.4 m, 0.6 m, 0.8 m, and 1 m underwater, and each layer contained two white bottles, two black bottles, and two primary bottles. The primary bottles were immediately immobilized with dissolved oxygen on-site, while the other 4 bottles were exposed in situ for 24 h and were immediately immobilized after removal.
The Winkler method is an internationally recognized method for determining dissolved oxygen in water [28]. A total of 1 mL of manganese sulfate and 2 mL of alkaline potassium iodide were added to the black and white bottles on-site; sealed and shaken well; and brought back to the laboratory to determine the dissolved oxygen using the iodometric method. At the end of the experiment, productivity and respiration were calculated as follows:
where Pg represents the gross primary productivity; Pn represents the net primary productivity; and R is respiration. IB indicates the dissolved oxygen in the primary bottle; LB represents the dissolved oxygen in the white bottle at the end of exposure; and DB is the dissolved oxygen in the black bottle at the end of exposure. The unit of Pg, Pn, and R is mg O2 L−1 d−1.
Pg = LB − DB
Pn = LB − IB
R = IB − DB
Water column productivity refers to the productivity of a 1 m2 vertical water column. The gross productivity of the water column (GPPc) was calculated using the cumulative arithmetic mean method based on the Pg in each water layer. The water column respiration (Rc) and net productivity (NPPc) were also calculated using this method. Taking GPPc as an example, the calculation equation is as follows:
where Pi represents the Pg of the i-th layer; Di is the depth of the i-th layer; and n is the number of sampling layers (1 ≤ i ≤ n − 1). The unit of GPPc, NPPc, and Rc is g O2 m−2 d−1.
2.4. Data Processing and Analysis
Kruskal–Wallis one-way ANOVA was used to analyze the differences in environmental factors between the algae-type, transition, and grass-type zones of Lake Taihu. The relationship between GPPc and environmental factors was analyzed using Spearman correlation. After standardizing GPPc, the main physicochemical factors affecting GPPc were analyzed using multiple stepwise regression. The above analyses were accomplished using SPSS Statistics 23.0 (IBM, Armonk, NY, USA). Data processing and line graphing were completed using Excel 2019 (Microsoft, Redmond, WA, USA).
3. Results and Discussion
3.1. Seasonal Variations in Environmental Factors in Three Lake Zones
The statistical results of the environmental parameters for different seasons in the Taihu algae-type, transition, and grass-type zones are shown in Table 2. Most of these environmental factors significantly changed in different seasons/regions. The water temperature (T) shows the same pattern in the three lake zones, maintaining around 14 degrees in the winter, rising to over 30 degrees in the summer, and being slightly warmer in the fall than in the spring, in descending order as follows: summer > fall > spring > winter. Chlorophyll-a (Chl-a) and algal density (AD) are closely related to both season and temperature, as summer is the period of algal bloom with peak Chl-a and AD, while winter is the period of low temperatures when both Chl-a and AD reach their lowest levels. Chl-a is significantly higher in the fall than in the spring (p < 0.01), especially in the algae-type and transition zones, where it is about twice as high in the fall as in the spring. However, AD presents the opposite pattern due to the mass death of algal cells that takes place in the fall [29]. Chl-a and AD levels in the three zones differ considerably in the following descending order: algae-type zone > transition zone > grass-type zone.
Table 2.
Seasonal data on physicochemical parameters in three lake zones (mean ± standard deviation, n = 3).
Shallow water environments are more suitable for the growth of macrophytes due to photosynthetic requirements; meanwhile, phytoplankton are more competitive in deep water environments. The water depth (D) of the three types of zones conforms to this pattern, with the descending order being as follows: algae-type zone > transition zone > grass-type zone. D is significantly higher in the wet seasons (summer and fall) than in the dry seasons (winter and spring) (p < 0.01), and the transparency (SD) increases with D, except in Meiliang Bay (algae-type region), where the SD decreases during the wet seasons due to phytoplankton blooms. It is worth noting that the grass-type zone has the highest SD, even though it is the shallowest. Lake Taihu is very shallow (mean depth of 1.9 m), and its main hydrodynamic force is wind waves [25]. The total suspended solid (TSS) levels are, therefore, higher in the winter and spring when the water level is shallower. Except for the algae-type zone, the TSS levels are higher in the summer and fall due to the extensive reproduction of phytoplankton.
Algae photosynthesis in summer and fall consumes carbon dioxide in the water column, which raises the pH level. The dissolved oxygen (DO) is lower in the summer and fall than in the winter and spring because the process of algal decomposition consumes a large amount of DO during the rainy seasons. In addition, the atmospheric reoxygenation process is inhibited by water blooms. DO is abnormally low in the grass-type region in the fall, at only 6.20 mg/L, and the reason for this is the consumption of oxygen through the decay and decomposition of macrophytes [24]. In the summer and fall, algal mortality and decomposition release large amounts of phosphorus into the water column, resulting in increased total phosphorus (TP) levels in the lake [30]. Regarding total nitrogen (TN), high temperatures in the summer promote denitrification, leading to the lowest nitrogen levels (p < 0.01). During spring plowing, the excessive use of fertilizers in adjacent agricultural land can cause a high quantity of nitrogenous materials to migrate to the lake, resulting in high TN content in the spring [23].
3.2. Spatial and Temporal Distribution of Primary Productivity
The seasonal variations in gross primary productivity (GPPc), net primary productivity (NPPc), and respiration (Rc) in the water column in the three zones are presented in Figure 2. The horizontal distribution of GPPc, NPPc, and Rc and the seasonal proportion of GPPc in different regions are shown in Figure 3. It can be seen that GPPc in Meiliang Bay (algae-type zone) varies between 1.50 ± 0.12 and 7.20 ± 0.69 g O2 m−2 d−1, with a mean of 4.41 ± 0.46 g O2 m−2 d−1; in Gonghu Bay (transition zone), it varies between 0.92 ± 0.05 and 5.86 ± 0.68 g O2 m−2 d−1, with a mean of 3.32 ± 0.29 g O2 m−2 d−1; and in East Taihu Bay (grass-type zone), it varies between 0.78 ± 0.10 and 2.42 ± 0.47 g O2 m−2 d−1, with a mean of 1.45 ± 0.16 g O2 m−2 d−1. The highest GPPc values in the three lake zones always appear in the summer, while the lowest values appear in the winter, and GPPc is slightly higher in the fall than in the spring, in descending order as follows: summer > fall > spring > winter.
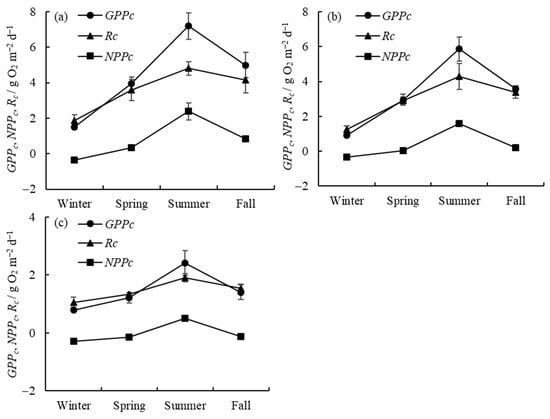
Figure 2.
Seasonal variations in water column productivity and respiration in Meiliang Bay (a), Gonghu Bay (b), and East Taihu Bay (c) (mean ± standard deviation, n = 3).
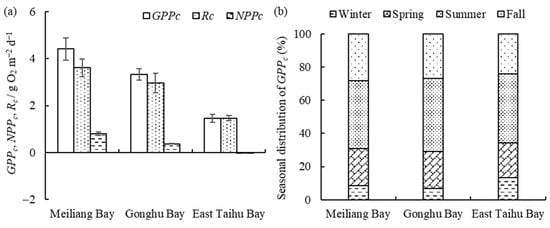
Figure 3.
The horizontal distribution of GPPc, NPPc, and Rc (mean ± standard deviation, n = 3) (a) and seasonal proportion of GPPc (b) in different zones.
Rc and NPPc are largely consistent with GPPc in their temporal trends. In the algae-type zone (Figure 2a), phytoplankton production (GPPc) is higher than respiration (Rc) in the spring, summer, and fall, resulting in positive NPPc values in these seasons. NPPc is negative in the winter due to the weaker phytoplankton photosynthesis at lower water temperatures. The transition zone shows the same trend as the algae-type zone (Figure 2b). However, in the grass-type zone (Figure 2c), where macrophytes are dominant, phytoplankton production (GPPc) is only higher than respiration (Rc) during the summer period.
Water column primary productivity (GPPc) and respiration (Rc) are both highest in Meiliang Bay and lowest in East Taihu Bay (Figure 3a), with a decreasing order as follows: algae-type zone > transition zone > grass-type zone. Overall, GPPc is greater than Rc except in the grass-type zone, where they are essentially equal. NPPc is at a low level as a whole. From Figure 3b, we can observe that the seasonal proportion of GPPc in Lake Taihu varies markedly, but the seasonal proportion does not differ much among different subregions, with approximately 40% in the summer, 25% in the fall, 20% in the spring, and less than 15% in the winter.
3.3. Vertical Distribution of Primary Productivity in Different Zones and Seasons
The vertical distribution of Pg, Pn, and R in the different zones is shown in Figure 4. It is clear that primary productivity is highest in the algae-type zone (Meiliang Bay) and lowest in the grass-type zone (East Taihu Bay) at different vertical depths (Figure 4a). The highest values of Pg and Pn in the three zones were found at a depth of 0.2 m in Meiliang Bay, being 8.55 mg O2 L−1 d−1 and 2.56 mg O2 L−1 d−1, respectively. Pg and R are relatively low and stable in the different layers of East Taihu Bay because this area is generally dominated by macrophytes with less phytoplankton present. Light intensity decreases with water depth, as does Pg (Figure 4a), which is consistent with findings for Dianshan Lake [31]. Most of the highest values of primary productivity were at depths of 0.2 m due to photoinhibition in the surface (0 m) layer [32]. In general, the percentages of Pg at water depths of 0 m, 0.2 m, 0.4 m, 0.6 m, 0.8 m, and 1 m were 23%, 31%, 23%, 11%, 7%, and 5%, respectively. Primary productivity and respiration begin to decrease rapidly when the water depth reaches 0.4 m (Figure 4a,c) because light intensity decreases rapidly at this depth. Combined with the transparency (SD) data in Table 2, the optical compensation depth, i.e., the depth of the water layer with Pn = 0 (Figure 4b), is derived as approximately 0.8 times the transparency for Lake Taihu.
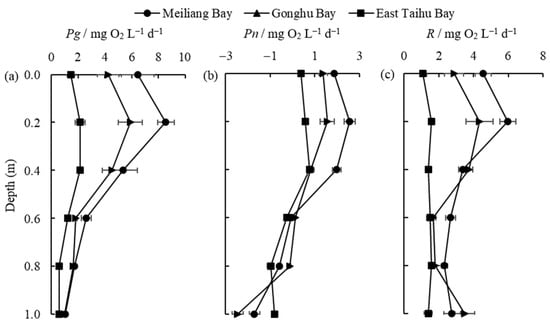
Figure 4.
The vertical distribution of Pg (a), Pn (b), and R (c) (mean ± standard deviation, n = 3) in different regions.
The vertical distribution of Pg, Pn, and R in different seasons is shown in Figure 5. It is obvious from Figure 5a,c that Pg and R in different water layers exhibit a pattern of summer > fall > spring > winter. Surface productivity remains the main contributor to water column productivity in different seasons, and the highest values of Pg in the spring, summer, and fall still appear at a depth of 0.2 m and decrease with water depth, as previously described. In the winter, the temperature is low, and the light intensity is weak, and Pg maintains a small value in each layer and does not change significantly, which is consistent with the findings in some ponds [33]. The respiration (R) did not vary much between water levels, especially in the dry seasons (winter and spring), when the productivity was greater than respiration (i.e., Pn > 0) only at the surface of the water column (0 m and 0.2 m). In the fall, Pn remains positive until the water depth is 0.4 m, while in the summer, it remains positive until a depth of 0.6 m (Figure 5b). This means that, during periods of higher temperatures, there are more layers of water where production is higher than respiration in Lake Taihu. When the water depth reaches a certain level (D > 0.8 m), Pn stops changing in all seasons and stays around −0.3 mg O2 L−1 d−1.
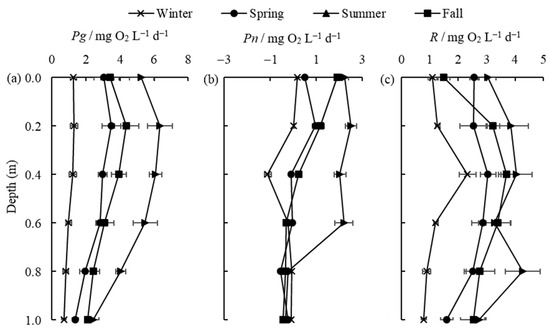
Figure 5.
The vertical distribution of Pg (a), Pn (b), and R (c) (mean ± standard deviation, n = 3) in different seasons.
3.4. Main Influencing Factors on Phytoplankton Productivity in Different Lake Zones
Spearman correlation analysis was used to determine the correlations between GPPc and environmental factors in Meiliang Bay, Gonghu Bay, and East Taihu Bay, and the results are shown in Table 3, Table 4 and Table 5. It can be seen that GPPc had a significant positive correlation with T, Chl-a, and D in Meiliang Bay. In addition, it was also positively correlated with TSSs (Table 3). In Gonghu Bay, GPPc was positively correlated with Chl-a, T, and D (p < 0.01) (Table 4), and in East Taihu Bay, GPPc was positively correlated with T (p < 0.01) and D. In addition, it had a significant negative correlation with TSSs (Table 5).
Table 3.
The correlations between environmental factors in Meiliang Bay (n = 3).
Table 4.
The correlations between environmental factors in Gonghu Bay (n = 3).
Table 5.
The correlations between environmental factors in East Taihu Bay (n = 3).
It is clear from the above that phytoplankton productivity is mainly related to T, D, Chl-a, and TSSs. In particular, temperature (T) and water depth (D) showed a positive correlation with GPPc in all three lake zones. In our previous study [23], it was found that nutrients (TP and TN) are also important influencing factors of GPPc, but here, there is no obvious correlation between nutrients and GPPc. The reason for this is that previous studies have focused on specific periods or seasons, with nutrients having their influence, while the present research included a four-season study at a particular time; thus, those factors that vary significantly with the seasons, such as T and D, had a more obvious impact on GPPc. In addition, Chl-a showed a highly significant correlation with GPPc in Meiliang Bay and Gonghu Bay, while they were not significantly correlated in East Taihu Bay. This is due to the fact that there is only a small amount of phytoplankton in the grass-type zone (East Taihu Bay), resulting in insignificant changes in GPPc with Chl-a [34]. The correlation coefficients of GPPc and Chl-a for the three zones are in decreasing order as follows: Meiliang Bay (0.933) > Gonghu Bay (0.881) > East Taihu Bay (0.636). This implies that the more the zone is dominated by planktonic algae, the greater the correlation between GPPc and Chl-a.
It is worth noting that GPPc and TSSs showed a positive correlation (with a correlation coefficient of 0.708 (p < 0.05)) in the algae-type zone (Table 3), while in the grass-type zone, they had a significant negative correlation (with a correlation coefficient of −0.954 (p < 0.01)) (Table 5). GPPc in the algae-type zone mainly comes from productivity during the wet seasons (summer and fall), when the massive growth and then death of algae lead to an increase in TSSs; thus, GPPc has a positive correlation with TSSs. However, in the grass-type zone with less planktonic algae and a shallower water depth, the increase in TSSs is mainly due to the suspension of bottom sediments caused by wind and wave disturbances [25,35], which reduces the water transparency and the depth of the euphotic zone, thus inhibiting the photosynthesis of algae [36].
Multiple stepwise regression analysis was used to test the main influencing factors on GPPc, and the results are shown in Table 6. T, D, Chl-a, and SD can be used to estimate GPPc in different regions. The regression equation for GPPc in Meiliang Bay is GPPc = 0.839 T + 0.380 SD + 0.329 D—T alone accounts for 80.9% of phytoplankton productivity, and T, SD, and D jointly account for 95.5% of GPPc. The equation in Gonghu Bay is GPPc = 0.916 Chl-a + 0.175 SD, and Chl-a alone accounts for 95.4% of GPPc. In East Taihu Bay, the equation is GPPc = 0.647 T + 0.416 D, accounting for 93.0% of GPPc (R2 = 0.930). In the equation for Meiliang Bay, T and D can be represented by Chl-a because they have a highly significant correlation (p < 0.01), with correlation coefficients of 0.940 (T and Chl-a) and 0.885 (D and Chl-a) (Table 3). Similarly, in the equation for Gonghu Bay, SD can be represented by T (0.831, p < 0.01) (Table 4), and in East Taihu Bay, D can be represented by TSSs (0.892, p < 0.01) (Table 5). Summarizing the above analyses, the main influencing factors on phytoplankton productivity are T, D, Chl-a, and SD in Meiliang Bay and Gonghu Bay and T, D, and TSSs in East Taihu Bay.
Table 6.
Multiple stepwise regression between GPPc and environmental factors.
4. Conclusions
The current work investigated the characteristics of phytoplankton productivity in the algae-type, transition, and grass-type zones of Lake Taihu. Several conclusions can be drawn, as follows:
- Most of the environmental factors significantly changed in different seasons and regions. Chl-a, AD, pH, TP, and SD were significantly higher during the seasons with a higher temperature (T) and greater water depth (D), i.e., summer and fall, while the opposite was true for the other factors. Among them, T, D, Chl-a, and AD exhibited clear spatial variability: algae-type zone > transition zone > grass-type zone.
- Water column productivity (GPPc, NPPc) and respiration (Rc) conformed to the following temporal descending order, summer > fall > spring > winter, and the following spatial descending order, algae-type zone > transition zone > grass-type zone. GPPc was higher than Rc during the spring, summer, and fall in the algae-type and transition zones, whereas this disparity between GPPc and Rc occurred in the grass-type zone only in the summer. The seasonal proportions of GPPc in Lake Taihu were approximately 40% in the summer, 25% in the fall, 20% in the spring, and less than 15% in the winter.
- The highest values of water layer productivity (Pg and Pn) and respiration (R) were found mainly at a depth of 0.2 m and decreased with water depth. The respective percentages of Pg at different layers were 23%, 31%, 23%, 11%, 7%, and 5%. The optical compensation depth for Lake Taihu was approximately 0.8 times the transparency. When the water depth reached 0.8 m, Pn stopped changing in all seasons and was maintained at around −0.3 mg O2 L−1 d−1.
- T, D, Chl-a, and SD can be used to estimate GPPc in different regions. The regression equation for GPPc in Meiliang Bay is GPPc = 0.839 T + 0.380 SD + 0.329 D; the equation in Gonghu Bay is GPPc = 0.916 Chl-a + 0.175 SD; and the equation in East Taihu Bay is GPPc = 0.647 T + 0.416 D. The main influencing factors on phytoplankton productivity are T, D, Chl-a, and SD in Meiliang Bay (algae-type) and Gonghu Bay (transition) and T, D, and TSSs in East Taihu Bay (grass-type).
In effect, some of these findings are generalized, especially with respect to the main factors influencing productivity in different types of lake environments. Therefore, on a global scale, this work can provide a reference for the study of other eutrophic lakes, especially those with similar bathymetry and hydrodynamic conditions to Lake Taihu. In summary, this work is of a certain significance for water managers and policy-makers in terms of monitoring, data, and theoretical support for the management of lake ecological sustainability globally.
Author Contributions
Conceptualization, J.W.; methodology, J.W. and X.J.; software, J.W.; formal analysis, J.W.; investigation, J.W., X.J. and W.H.; writing—original draft preparation, J.W.; writing—review and editing, X.J. and W.H.; supervision, W.H.; project administration, W.H.; funding acquisition, J.W. and W.H. All authors have read and agreed to the published version of the manuscript.
Funding
The research was supported by the Research Project of China Three Gorges Corporation (No. 202103548) and the Research Project of Shanghai Investigation, Design & Research Institute Co., Ltd. (No. 2022QT(831)-004).
Institutional Review Board Statement
Not applicable.
Informed Consent Statement
Not applicable.
Data Availability Statement
The data used to support the findings of this study are available from the corresponding authors upon request.
Conflicts of Interest
The authors declare that this study received funding from Shanghai Investigation, Design & Research Institute Co., Ltd. and China Three Gorges Corporation. The funder had the following involvement with the study: data collection.
References
- Scheffer, M.; Carpenter, S.R. Catastrophic regime shifts in ecosystems: Linking theory to observation. Trends Ecol. Evol. 2003, 18, 648–656. [Google Scholar] [CrossRef]
- Scheffer, M.; van Nes, E.H. Mechanisms for marine regime shifts: Can we use lakes as microcosms for oceans? Prog. Oceanogr. 2004, 60, 303–319. [Google Scholar] [CrossRef]
- Zhao, L.; Wang, M.G.; Liang, Z.Y.; Zhou, Q.C. Identification of regime shifts and their potential drivers in the shallow eutrophic Lake Yilong, Southwest China. Sustainability 2020, 12, 3704. [Google Scholar] [CrossRef]
- Wang, S.R.; Meng, W.; Jin, X.C.; Zheng, B.H.; Zhang, L.; Xi, H.Y. Ecological security problems of the major key lakes in China. Environ. Earth Sci. 2015, 74, 3825–3837. [Google Scholar] [CrossRef]
- Kawamura, S.; Fukushima, T. Residents’ concerns about lake uses and environments: A comparative study of Lakes Kasumigaura, Suwa, and Biwa in Japan. Limnology 2018, 19, 101–113. [Google Scholar] [CrossRef]
- Paerl, H.W.; Huisman, J. Blooms like it hot. Science 2008, 320, 57–58. [Google Scholar] [CrossRef]
- Zhang, S.Y.; Liu, A.F.; Ma, J.M.; Zhou, Q.H.; Xu, D.; Cheng, S.P.; Zhao, Q.A.; Wu, Z.B. Changes in physicochemical and biological factors during regime shifts in a restoration demonstration of macrophytes in a small hypereutrophic Chinese lake. Ecol. Eng. 2010, 36, 1611–1619. [Google Scholar] [CrossRef]
- Yang, R.B.; Fan, X.; Zhao, L.; Yang, K. Identification of major environmental factors driving phytoplankton community succession before and after the regime shift of Erhai Lake, China. Ecol. Indic. 2023, 146, 109875. [Google Scholar] [CrossRef]
- Panigrahi, S.; Mohanty, A.K.; Ramesh, T.; Hussain, K.J.; Samantara, M.K.; Prasad, M.V.R.; Satpathy, K.K. Perturbations and regime shift in an aquatic ecosystem along with adaptation of biota due to climatic extremes. Environ. Eng. Res. 2012, 17, 33–39. [Google Scholar] [CrossRef]
- Liu, X.; Lu, X.H.; Chen, Y.W. The effects of temperature and nutrient ratios on Microcystis blooms in Lake Taihu, China: An 11-year investigation. Harmful Algae 2011, 10, 337–343. [Google Scholar] [CrossRef]
- Chen, L.; Giesy, J.P.; Adamovsky, O.; Svircev, Z.; Meriluoto, J.; Codd, G.A.; Mijovic, B.; Shi, T.; Tuo, X.; Li, S.C.; et al. Challenges of using blooms of Microcystis spp. in animal feeds: A comprehensive review of nutritional, toxicological and microbial health evaluation. Sci. Total Environ. 2021, 764, 142319. [Google Scholar] [CrossRef]
- Behrenfeld, M.J.; O’Malley, R.T.; Siegel, D.A.; McClain, C.R.; Sarmiento, J.L.; Feldman, G.C.; Milligan, A.J.; Falkowski, P.G.; Letelier, R.M.; Boss, E.S. Climate-driven trends in contemporary ocean productivity. Nature 2006, 444, 752–755. [Google Scholar] [CrossRef]
- Niinemets, Ü.; Kahru, A.; Noges, P.; Tuvikene, A.; Vasemägi, A.; Mander, Ü.; Noges, T. Environmental feedbacks in temperate aquatic ecosystems under global change: Why do we need to consider chemical stressors? Reg. Environ. Chang. 2017, 17, 2079–2096. [Google Scholar] [CrossRef]
- Lee, M.; Kim, Y.B.; Park, C.H.; Baek, S.H. Characterization of seasonal phytoplankton pigments and functional types around offshore island in the East/Japan Sea, based on HPLC pigment analysis. Sustainability 2022, 14, 5306. [Google Scholar] [CrossRef]
- Han, M.S.; Furuya, K. Size and species-specific primary productivity and community structure of phytoplankton in Tokyo Bay. J. Plankton Res. 2000, 22, 1221–1235. [Google Scholar] [CrossRef]
- Liu, H.R.; Xie, Y.Y.; Qiu, Y.; Wang, L.; Wang, F.P.; Laws, E.A.; Huang, B.Q. Examining the size-specific photosynthesis-irradiance parameters and relationship with phytoplankton types in a subtropical marginal sea. Ecol. Indic. 2021, 130, 108094. [Google Scholar] [CrossRef]
- Sidik, M.J.; Rashed-Un-Nabi, M.; Hoque, M.A. Distribution of phytoplankton community in relation to environmental parameters in cage culture area of Sepanggar Bay, Sabah, Malaysia. Estuar. Coast Shelf Sci. 2008, 80, 251–260. [Google Scholar] [CrossRef]
- Mazzei, V.; Biber, P. Autotrophic net productivity patterns at four artificial reef sites in the Mississippi Sound. Hydrobiologia 2015, 749, 135–154. [Google Scholar] [CrossRef]
- Yunev, O.; Velikova, V.; Carstensen, J. Reconstructing the trophic history of the Black Sea shelf. Cont. Shelf Res. 2017, 150, 1–9. [Google Scholar] [CrossRef][Green Version]
- Kolding, J.; Zwieten, P.A.M.V. Relative lake level fluctuations and their influence on productivity and resilience in tropical lakes and reservoirs. Fish. Res. 2012, 115, 99–109. [Google Scholar] [CrossRef]
- Liu, L.L.; Dong, Y.C.; Kong, M.; Zhou, J.; Zhao, H.B.; Tang, Z.; Zhang, M.; Wang, Z.P. Insights into the long-term pollution trends and sources contributions in Lake Taihu, China using multi-statistic analyses models. Chemosphere 2020, 242, 125272. [Google Scholar] [CrossRef]
- Yan, L.; Xu, Z.; Hu, Y.J.; Wang, Y.; Zhou, F.; Gao, X.C.; Zhu, Y.H.; Chen, D.X. Cyanobacteria bloom hazard function and preliminary application in lake Taihu, China. Chemosphere 2022, 307, 136122. [Google Scholar] [CrossRef]
- Wei, J.; Ji, X.; Hu, W. Characteristics of phytoplankton production in wet and dry seasons in hyper-eutrophic Lake Taihu, China. Sustainability 2022, 14, 11216. [Google Scholar] [CrossRef]
- Wen, S.; Peng, K.; Gong, Z.; Qin, B.; Cai, Y. Succession of macrozoobenthic communities and its drivers in Meiliang Bay of Lake Taihu during the past 40 years. J. Lake Sci. 2023, 35, 599–609. (In Chinese) [Google Scholar]
- Li, Y.P.; Wei, J.; Gao, X.M.; Chen, D.; Weng, S.L.; Du, W.; Wang, W.C.; Wang, J.W.; Tang, C.Y.; Zhang, S.S. Turbulent bursting and sediment resuspension in hyper-eutrophic Lake Taihu, China. J. Hydrol. 2018, 565, 581–588. [Google Scholar] [CrossRef]
- State Environmental Protection Administration of China. Water and Wastewater Monitoring and Analysis Method, 4th ed.; China Environmental Science Press: Beijing, China, 2002; pp. 243–257. (In Chinese) [Google Scholar]
- Hu, H.J.; Wei, Y.X. The Freshwater Algae of China–Systematics, Taxonomy and Ecology; Science Press: Beijing, China, 2006. (In Chinese) [Google Scholar]
- McNeil, C.L.; D’Asaro, E.A. A calibration equation for oxygen optodes based on physical properties of the sensing foil. Limnol. Oceanogr. Meth. 2014, 12, 139–154. [Google Scholar] [CrossRef]
- Xu, R.C.; Pang, Y.; Hu, Z.B.; Hu, X.Y. The spatiotemporal characteristics of water quality and main controlling factors of algal blooms in Tai Lake, China. Sustainability 2022, 14, 5710. [Google Scholar] [CrossRef]
- Zhu, M.Y.; Zhu, G.W.; Zhao, L.L.; Yao, X.; Zhang, Y.L.; Gao, G.; Qin, B.Q. Influence of algal bloom degradation on nutrient release at the sediment-water interface in Lake Taihu, China. Environ. Sci. Pollut. Res. 2013, 20, 1803–1811. [Google Scholar] [CrossRef] [PubMed]
- Lu, Z.; Wang, L.; Ji, G.; Dai, X.; Xu, L.; Fan, Z.; Xu, H. Control of Dianshan Lake eutrophication based on the primary productivity of silver carp and bighead carp. J. Ecol. 2010, 29, 1365–1370. (In Chinese) [Google Scholar]
- Peng, X.F.; Fawcett, S.E.; van Oostende, N.; Wolf, M.J.; Marconi, D.; Sigman, D.M.; Ward, B.B. Nitrogen uptake and nitrification in the subarctic North Atlantic Ocean. Limnol. Oceanogr. 2018, 63, 1462–1487. [Google Scholar] [CrossRef]
- Zhao, W.; Dong, S.; Zhang, Z.; Shentu, Q. Daily change of primary productivity of phytoplankton in saline-alkaline ponds. J. Appl. Ecol. 2003, 14, 234–236. (In Chinese) [Google Scholar]
- Diao, X.; Huang, C.; He, L.; Meng, R.; Meng, F.; Shu, J.; Yuan, D. Difference in community structure of submerged macrophytes and related influence factors between macrophytic and algal regions of Baiyangdian Lake. Wetl. Sci. 2013, 11, 366–371. (In Chinese) [Google Scholar]
- Jalil, A.; Li, Y.P.; Zhang, K.; Gao, X.M.; Wang, W.C.; Khan, H.O.S.; Pan, B.Z.; Ali, S.; Acharya, K. Wind-induced hydrodynamic changes impact on sediment resuspension for large, shallow Lake Taihu, China. Int. J. Sediment Res. 2019, 34, 205–215. [Google Scholar] [CrossRef]
- Verspagen, J.M.H.; Snelder, E.O.F.M.; Visser, P.M.; Huisman, J.; Mur, L.R.; Ibelings, B.W. Recruitment of benthic Microcystis (Cyanophyceae) to the water column: Internal buoyancy changes or resuspension? J. Phycol. 2004, 40, 260–270. [Google Scholar] [CrossRef]


Disclaimer/Publisher’s Note: The statements, opinions and data contained in all publications are solely those of the individual author(s) and contributor(s) and not of MDPI and/or the editor(s). MDPI and/or the editor(s) disclaim responsibility for any injury to people or property resulting from any ideas, methods, instructions or products referred to in the content. |
© 2024 by the authors. Licensee MDPI, Basel, Switzerland. This article is an open access article distributed under the terms and conditions of the Creative Commons Attribution (CC BY) license (https://creativecommons.org/licenses/by/4.0/).