Article

Assessment of Stormwater Quality in the Context of Traffic Congestion: A Case Study in Egypt

by
Mohamed Elsayed Gabr
1,*,
Amira Mahmoud El Shorbagy
1,2,* and
Hamdy Badee Faheem
3
1
Civil Engineering Department, Higher Institute for Engineering and Technology, Ministry of Higher Education, New Damietta 34517, Egypt
2
Civil Engineering Department, Faculty of Engineering, Minia University, Minia 61111, Egypt
3
Highway and Traffic Engineering, Civil Engineering Department, Faculty of Engineering, Minia University, Minia 61111, Egypt
*
Authors to whom correspondence should be addressed.
Sustainability 2023, 15(18), 13927; https://doi.org/10.3390/su151813927
Submission received: 3 July 2023 / Revised: 24 August 2023 / Accepted: 31 August 2023 / Published: 19 September 2023

Abstract

:
The aim of this study was to investigate the effect of traffic congestion in urbanized areas (parking lots and highways) on stormwater quality. Three separate locations in Egypt’s heavily urbanized and populous Giza Governorate were picked for the purpose of monitoring and evaluating the stormwater quality: Faisal (A), El Dokki (B), and Hadayek El-Ahram (C), with catchment areas of 10,476, 7566, and 9870 m2, and with monthly average daily traffic (MADT) values of 47,950, 20,919, and 27,064 cars, respectively. The physio-chemical and heavy metal stormwater quality parameters of six water samples were investigated and compared with Egypt’s water criteria and the World Health Organization (WHO) guidelines. The water quality index (WQI) and the irrigation water quality indices were used to assess the uses of stormwater. The results showed that the WQI varied from 426 to 929, with an average of (661 ± 168), indicating that the stormwater was contaminated at each location under examination and needed pretreatment in order to be useful. As a result, the allowed stormwater quality standards were exceeded for heavy metals such as Al, Cr, Cd, Fe, and Cu. The indicators of the stormwater quality for irrigation—the total dissolved solids (TDS), sodium adsorption ratio (SAR), soluble sodium percentage (SSP), permeability index (PI), magnesium adsorption ratio (MAR), and Kelley’s ratio (KR)—show excellent stormwater for irrigation, while the total hardness (TH) and residual sodium bicarbonate (RSBC) indicate poor irrigation water quality. It is advised to sweep the streets to remove particle-bound pollution before it reaches storm drain water, and to put in place an adequate stormwater sewerage system to catch rainwater.

1. Introduction

The disparity between water demand and availability in Egypt is widening due to the country’s limited water resources, fast population increase, and climate change [1,2]. Egypt is awaiting the advent of a hazardous situation: a complete absence of water security, as the rest of the world battles resource shortages. From the expansive banks of Upper Egypt to the congested, populated Delta, the Nile has supported growth and development for millennia; civilization in the area was not merely a supplement of water but a direct outcome of it [3]. The Nile is frequently depicted in literature and art, and it may even be heard in Egypt’s national anthems. Egypt has frequently been referred to as “the gift of the Nile”. However, Egypt’s population of over 102 million is currently in danger from both natural and man-made droughts [4]. Egypt has been battling an annual water deficit of almost 7 km3 for the past few years; according to UNICEF (2021) [5] by 2025, the nation would “run out of water” completely.
There is an urgent need to talk about the issue in practical rather than fatalistic terms due to tensions in the south; the quickly rising, contentious Renaissance Dam in Ethiopia; Egypt’s arid environment; and the overwhelming realities of climate change [6]. Over the past few years, Egypt has struggled with an annual water deficit of almost 7 km3; by 2025, the nation would “run out of water” completely [7]. According to the Falkenmark Index [8], the nation was already functioning below the level of water scarcity; the total renewable water resource per person was 628 m3/year, a quantity that is currently under tremendous strain due to a growing population that has been expanding at a rate of over 1.8 to 2.1% annually since 1989 [1]. Therefore, to address this issue, Egypt should think about using natural and unconventional water resources, such as deep groundwater extraction, seawater desalination, and wastewater treatment [9,10,11,12]. One alternative is rain harvesting. During specific storm events, large amounts of rain fell in various parts of Egypt, which can occasionally cause disasters like flash floods and inundations. Rainwater harvesting is seen as a viable and promising solution to the problems of water scarcity and inundation [13,14]. Stormwater gathers significant quantities of pollutants from point and non-point sources when it flies over sidewalks, lawns, driveways, roads, and other urban surfaces. However, the quality of stormwater effluents is typically subpar when compared to natural waterways or even treated municipal sanitary wastewater [15,16,17]. Global urbanization is constantly sealing soils, removing vegetation, and altering natural drainage systems. These changes result in the surrounding landscape’s infiltration capacity decreasing, which causes an increase in the frequency and speed (such as the immediacy of a flooding event) of stormwater runoff events [18]. For instance, road surfaces in urban areas can contribute up to 40% of the overall amount of heavy metal loads and up to 26% of the total runoff volume [19,20,21]. This is an excessively high contribution to the pollution load when you consider the space taken up by road surfaces [22,23]. The main sources of traffic-related pollutants are engine oil leaks, tire and brake wear, road surface abrasion, and exhaust emissions. These contaminants can take the form of airborne particulate matter, heavy metals, solids, and polycyclic aromatic hydrocarbons (PAHs) [24]. Road surface solids are diverse in composition. In addition to traffic-related activities, air deposition [25] and nearby soil [26] also contribute solids to the environment around urban roads. During transport, complicated mixing mechanisms are used for solids that are deposited on road surfaces. Additionally, because of the regular traffic operations, traffic-related particles frequently react with the mineral components of soil to create special combinations. A lot of research has been carried out on heavy metals because of their potential damage to human health. The urban environment contains a variety of heavy metal species, but copper (Cu), cadmium (Cd), nickel (Ni), lead (Pb), zinc (Zn), and chromium (Cr) have drawn the most attention because their potential acute or chronic harmful effects on flora, fauna, and people. Table 1 summarizes heavy metals caused by traffic activities [27,28]. Stormwater-associated toxic heavy metals can build up in rivers and have a negative effect on living things. The presence of heavy metals in stormwater can pose a risk to human health, substantially weakening the safety of reuse at a time when stormwater is garnering significant attention as a potential alternative water supply [29]. The type of vehicle and operating circumstances have a significant impact on the amount of airborne particle pollution produced by that vehicle [30,31]. As fuel usage, which, in turn, depends on vehicle speed, affects emissions, operating circumstances play a big part. Traffic jams can result in frequent vehicle stop-starting, which results in incomplete fuel combustion and significant pollution loads such as particles. This implies that the production of airborne particulate pollution will be influenced by traffic congestion [32].
Polycyclic aromatic hydrocarbons (PAHs) are a broad class of chemical molecules containing at least two fused benzene rings arranged in various ways [33]. The main source of PAHs on urban road surfaces is traffic. Vehicle exhaust and the abrasion of road surfaces are the two main traffic-related sources of PAHs. As a result, increased traffic volumes can be blamed for higher PAH loadings [34]. Both the species composition and PAH loadings are impacted by traffic factors. Heavy PAH species offer a high risk to ecosystems and have a detrimental impact on the security of stormwater reuse. Vehicles’ use of fossil fuels causes the release of particle pollution into the atmosphere. Although initially suspended in the atmosphere, these pollutants can be deposited on ground surfaces through dry and wet deposition processes, where they can, then, be carried to receiving waterways by storms. Therefore, the periodic monitoring and assessment of the quality of stormwater, groundwater, and surface water for different uses is an important issue for water resources management [35,36].
The water quality index (WQI) model is a useful tool for evaluating the quality of surface water [37,38]. It makes use of aggregation techniques to reduce vast amounts of data on water quality to a single value or index. The WQI model has been used internationally to assess water quality (surface water and groundwater) using regional water quality standards. Due to its standardized structure and simplicity of usage, it has gained popularity since its invention in the 1960s. The selection of the water quality parameters, the creation of sub-indices for each parameter, the computation of parameter-weighting values, and the aggregation of sub-indices to produce the overall water quality index are the four phases that WQI models typically follow, in that order. To assess the water quality of rivers, lakes, reservoirs, and estuaries, several researchers have used a variety of WQI model applications [39]. Traffic condition is one of the primary issues affecting Egyptian society. Nowadays, it is difficult for people to use public transport because it is constantly congested, especially during rush hours. For the people, getting where they are going and estimating how long it will take them to get there is difficult. There could be additional issues and delays for the individuals at work [40]. Therefore, traffic congestion contributes to the polluting of air and road surfaces, as stated in Table 1. The aim of this study is to focus on an insightful picture on stormwater quality for different uses in the context of traffic congestion. To accomplish this, (i) the earlier research on the effect of high traffic volume on stormwater quality is reviewed; (ii) a case study for the assessment of stormwater quality in Egypt is considered, where three urban catchments with varying traffic intensities in the Faisal—A, Dokki—B, and Hadayek El-Ahram—C regions were examined; (iii) for the year 2021, the monthly average daily traffic (MADT) data were collected and analyzed for the three urban catchments studied; (iv) a laboratory analysis (physical, chemical, and biological) was carried out for the collected stormwater in six samples during the winter season for each region, distributed as follows: Faisal—A (13 March and 12 December 2021), El Dokki—B (two samples) (14 March and 20 January 2021), and Hadayek El-Ahram—C (3 January and 5 February 2021); and (v) the stormwater quality is assessed using the water quality index (WQI) in comparison to the Egyptian water quality criteria [41,42] and the World Health Organization [43]. In addition, the stormwater quality indices for irrigation including the sodium adsorption ratio (SAR), total dissolved solids (TDS), total hardness (TH), permeability index (PI), soluble sodium percentage (SSP), residual sodium bicarbonate (RSBC), magnesium adsorption ratio (MAR), and Kelley’s ratio (KR) were applied, and, finally, (vi) the conclusions and recommendations were presented.

2. Materials and Methods

2.1. Study Area

The study area is located in the Giza Governorate in the northern part of the Nile River Valley in Egypt as shown in Figure 1. The stormwater quality is assessed in three regions in urban areas of Giza, named Dokki, Hadayek El-Ahram, and Faisal regions. The urban area (Dokki) is located southwest of the Cairo city center; it is characterized by heavy traffic and other human activities that produce air pollutants such ozone, carbon dioxide, hydrocarbons, sulphur oxides, and suspended particulate matter. Hadayek El-Ahram is a district of central Giza. It is a middle-class and prosperous residential neighborhood. About 19 km from the center of Cairo and 14 km from Giza Square, Hadayek al-Ahram is situated close to Al Remaya Square, El Haram Street, and Faisal Street.
Moreover, Faisal Street is located in the east of Giza Governorate and extends to the western side of it at a distance of seven kilometers. Faisal Street is considered one of the most important entrances to Giza Governorate from and to many other governorates, at the end of which there is the shooting range that connects Giza Governorate and the roads leading to the governorates of Fayoum, Alexandria, and the North Coast.
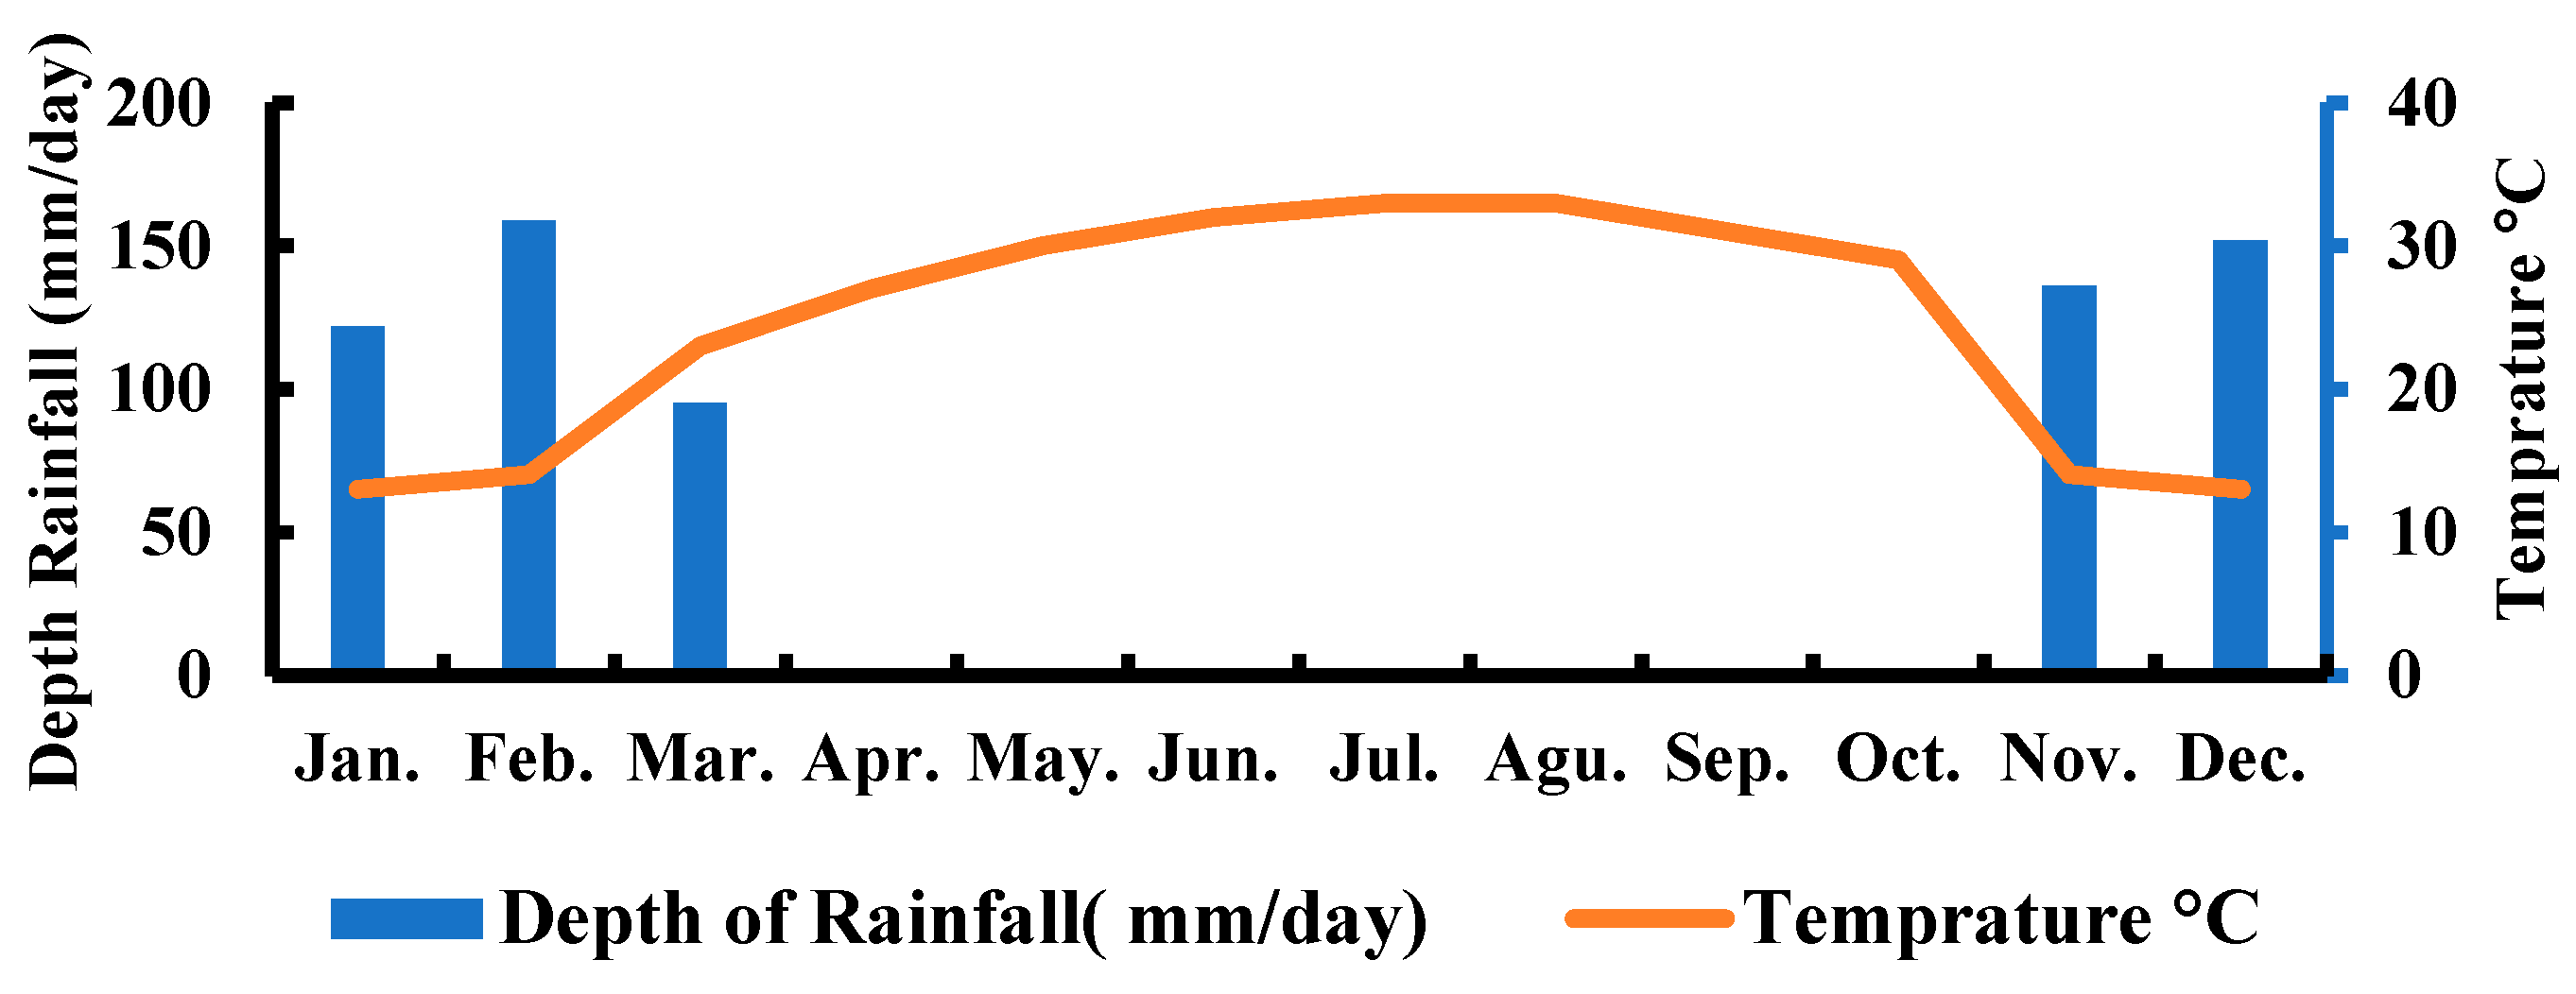
The study area expresses a semi-arid climate [44]. Weather data concerning the studied regions were obtained from the Egyptian Meteorological Authority (MEA) (http://web.civilaviation.gov.eg/companies/meteorology) (accessed on November, December, January, February, and March 2021). Figure 2 shows the average monthly rainfall depth and temperatures for the study area for the year 2021.

2.2. Traffic Data in the Study Area

The monthly average daily traffic (MADT) statistics for the studied road were gathered from the General Authority of Roads, Bridges, and Land Transport (GARBLT) (http://www.garblt.gov.eg, accessed on 3 June 2023) based on the Unicorn Limited device. The average MADT for Faisal Street, Dokki region, and Hadayek El-Ahram region were 47,950, 20,919, and 27,064 cars per day, respectively. The Arc GIS program was utilized to define the catchment area’s size and uses for each type of surface: Housing area/Commercial area/Housing area/Restaurant and parking service/etc. (Figure 1). In addition, Table 2 summarizes the catchment area for the three studied regions (Faisal, Dokki, and Hadayek El-Ahram regions), the type of surface, and the MADT.

2.3. Stormwater-Monitoring Points and the Analyzed Water Quality Parameters

The following distribution was made using the stormwater samples that were taken from each route throughout the winter season for this study: according to APHA [45], two samples, A1 and A2, from Faisal Street were sampled on 13 March and 20 December 2021, respectively; two samples, B1 and B2, from the El Dokki region were sampled on 14 March and 20 January 2021; and two samples, C1 and C2, from the Hadayek El-Ahram region were sampled on 3 January and 5 February 2021, respectively. The stormwater sample points’ locations are shown in Figure 3.
The samples of stormwater were obtained in a one-liter high-density polyethylene bottle, pre-cleaned with 10% nitric acid, rinsed repeatedly with bi-distilled water, stabilized with ultrapure nitric acid (0.5% HNO3), and stored at a temperature of around 4 °C. These samples were brought to the Faculty of Agriculture’s lab at Mansoura University where they underwent physical, chemical, and biological analysis. The water samples were analyzed for physicochemical characteristics: water temperature, electrical conductivity (EC), and total dissolved solids (TDS). The chemical parameters are pH, total hardness (TH), chemical oxygen demand (COD), biochemical oxygen demand (BOD), total nitrogen (TN), total suspended solids (TSS), Na+, Ca2+, K+, and Mg2+ (major cations), and HCO 3 , CO32−, Cl , NO 3 , and SO42− (major anions). Inductively coupled plasma was used for the determination of the heavy metals Al, Cr, Cd, Fe, Cu, Mn, Ni, Zn, and Pb; and major cations Na+, Ca2+, K+, and Mg2+, according to ASTM D8110-17 (Model: ICAP 7400). In addition, the pH was directly measured during water sampling using a digital pH meter, Jenway pH-meter (location: U.K) Model: 3505. The hydraulic conductivity of the water was directly measured using the Hanna Combo meter, Model- HI 98129.
According to ASTM D1252-06 criteria, the chemical oxygen demand (COD) was determined. To determine TDS, a typical fiberglass filter was used to filter a known volume of thoroughly mixed sample material. In accordance with ASTM D5907-18, the filtrated sample (liquid phase) was then evaporated to constant weight at 180 °C. Total phosphorus was measured as orthophosphate by the ascorbic acid method according to UV/VIS Spectrophotometer/PG instruments Model: T80. The process relies on the formation of an antimonyl-phosphomolybdate complex by the interaction of potassium antimony tartrate and ammonium molybdate with orthophosphate in the presence of ascorbic acid as a reducing agent. This compound yields an intense blue color, which was measured spectrophotometrically at 885 nm using a 1 cm cell length.

2.4. Water Quality Index (WQI)

The water quality index is a method for determining how acceptable the water is for drinking and other uses [35] using one figure. The following is how the WQI values arrived at the 27 water parameters for physical, chemical, and biological characteristics. A weight of wi = 3 to 4 is assigned to contaminants that have a significant impact on water quality, whereas a weight of wi = 1 to 2 is assigned to contaminants that have little or no impact [35,38,39]. Thus, weight = 2 is given to the following water parameters: pH, EC, SO4, CO3, HCO3, Cl, Mg, Ca, Na, and K. However, the weight attributed to TDS, TSS, TN, TP, Ni, Fe, Cu, and Al is 3, While the weights for NO3, NH4, BOD, and COD are set at 4. Additionally, the weights for Cr, Cd, Mn, Zn, and Pb are 4.
The following equation is used to determine the relative weight (Wi):
Wi = wi / i = 1 n wi
wi is the weight of each parameter, where n is the number of parameters and Wi is the relative weight of the i th parameter. The quality-rating scale ( q ) is then established for each parameter using the following formula:
q i = 100 Ci Si
where Ci is the concentration of each chemical parameter in each water sample in mg/L except for pH, and Si is the corresponding value according to [38]. Then, the sub-index ( SI i ) is estimated with each parameter, dimensionless and WQI, as follows:
SI i = Wi   ×   q i
Then, WQI is determined as follows:
WQI = i = 1 n SI i
where n is the number of parameters, q i is the quantity rating based on the concentration of the ith parameter, and SI i is the sub-index of the parameter. The relative weights (Wi) of the examined stormwater physicochemical characteristics are listed in Table 3.
The calculated WQI values can be grouped into six categories as shown in Table 4 [37].
The Excel program was utilized to carry out the statistics analysis, correlation between water quality parameters, and computation of the different water quality indices.

2.5. Evaluation of the Suitability of Irrigation Water Quality

Sodium adsorption ratio (SAR), total hardness (TH), total dissolved solids (TDS), soluble sodium percentage (SSP), residual sodium bicarbonate (RSBC), permeability index (PI), magnesium adsorption ratio (MAR), and Kelley’s ratio (KR) are the categories of groundwater indices that are used to determine whether or not a body of water is suitable for irrigation. Equations (5) to (11) were used to determine the following values: SAR, TH, SSP, PI, RSBC, MAR, and KR as shown in Table 5.
Based on the classifications of the indices SAR, EC, TDS, RSBC, TH, SSP, KR, and MAR, Table 6 shows the suitability of stormwater for irrigation.

3. Results

3.1. Stormwater Water Quality

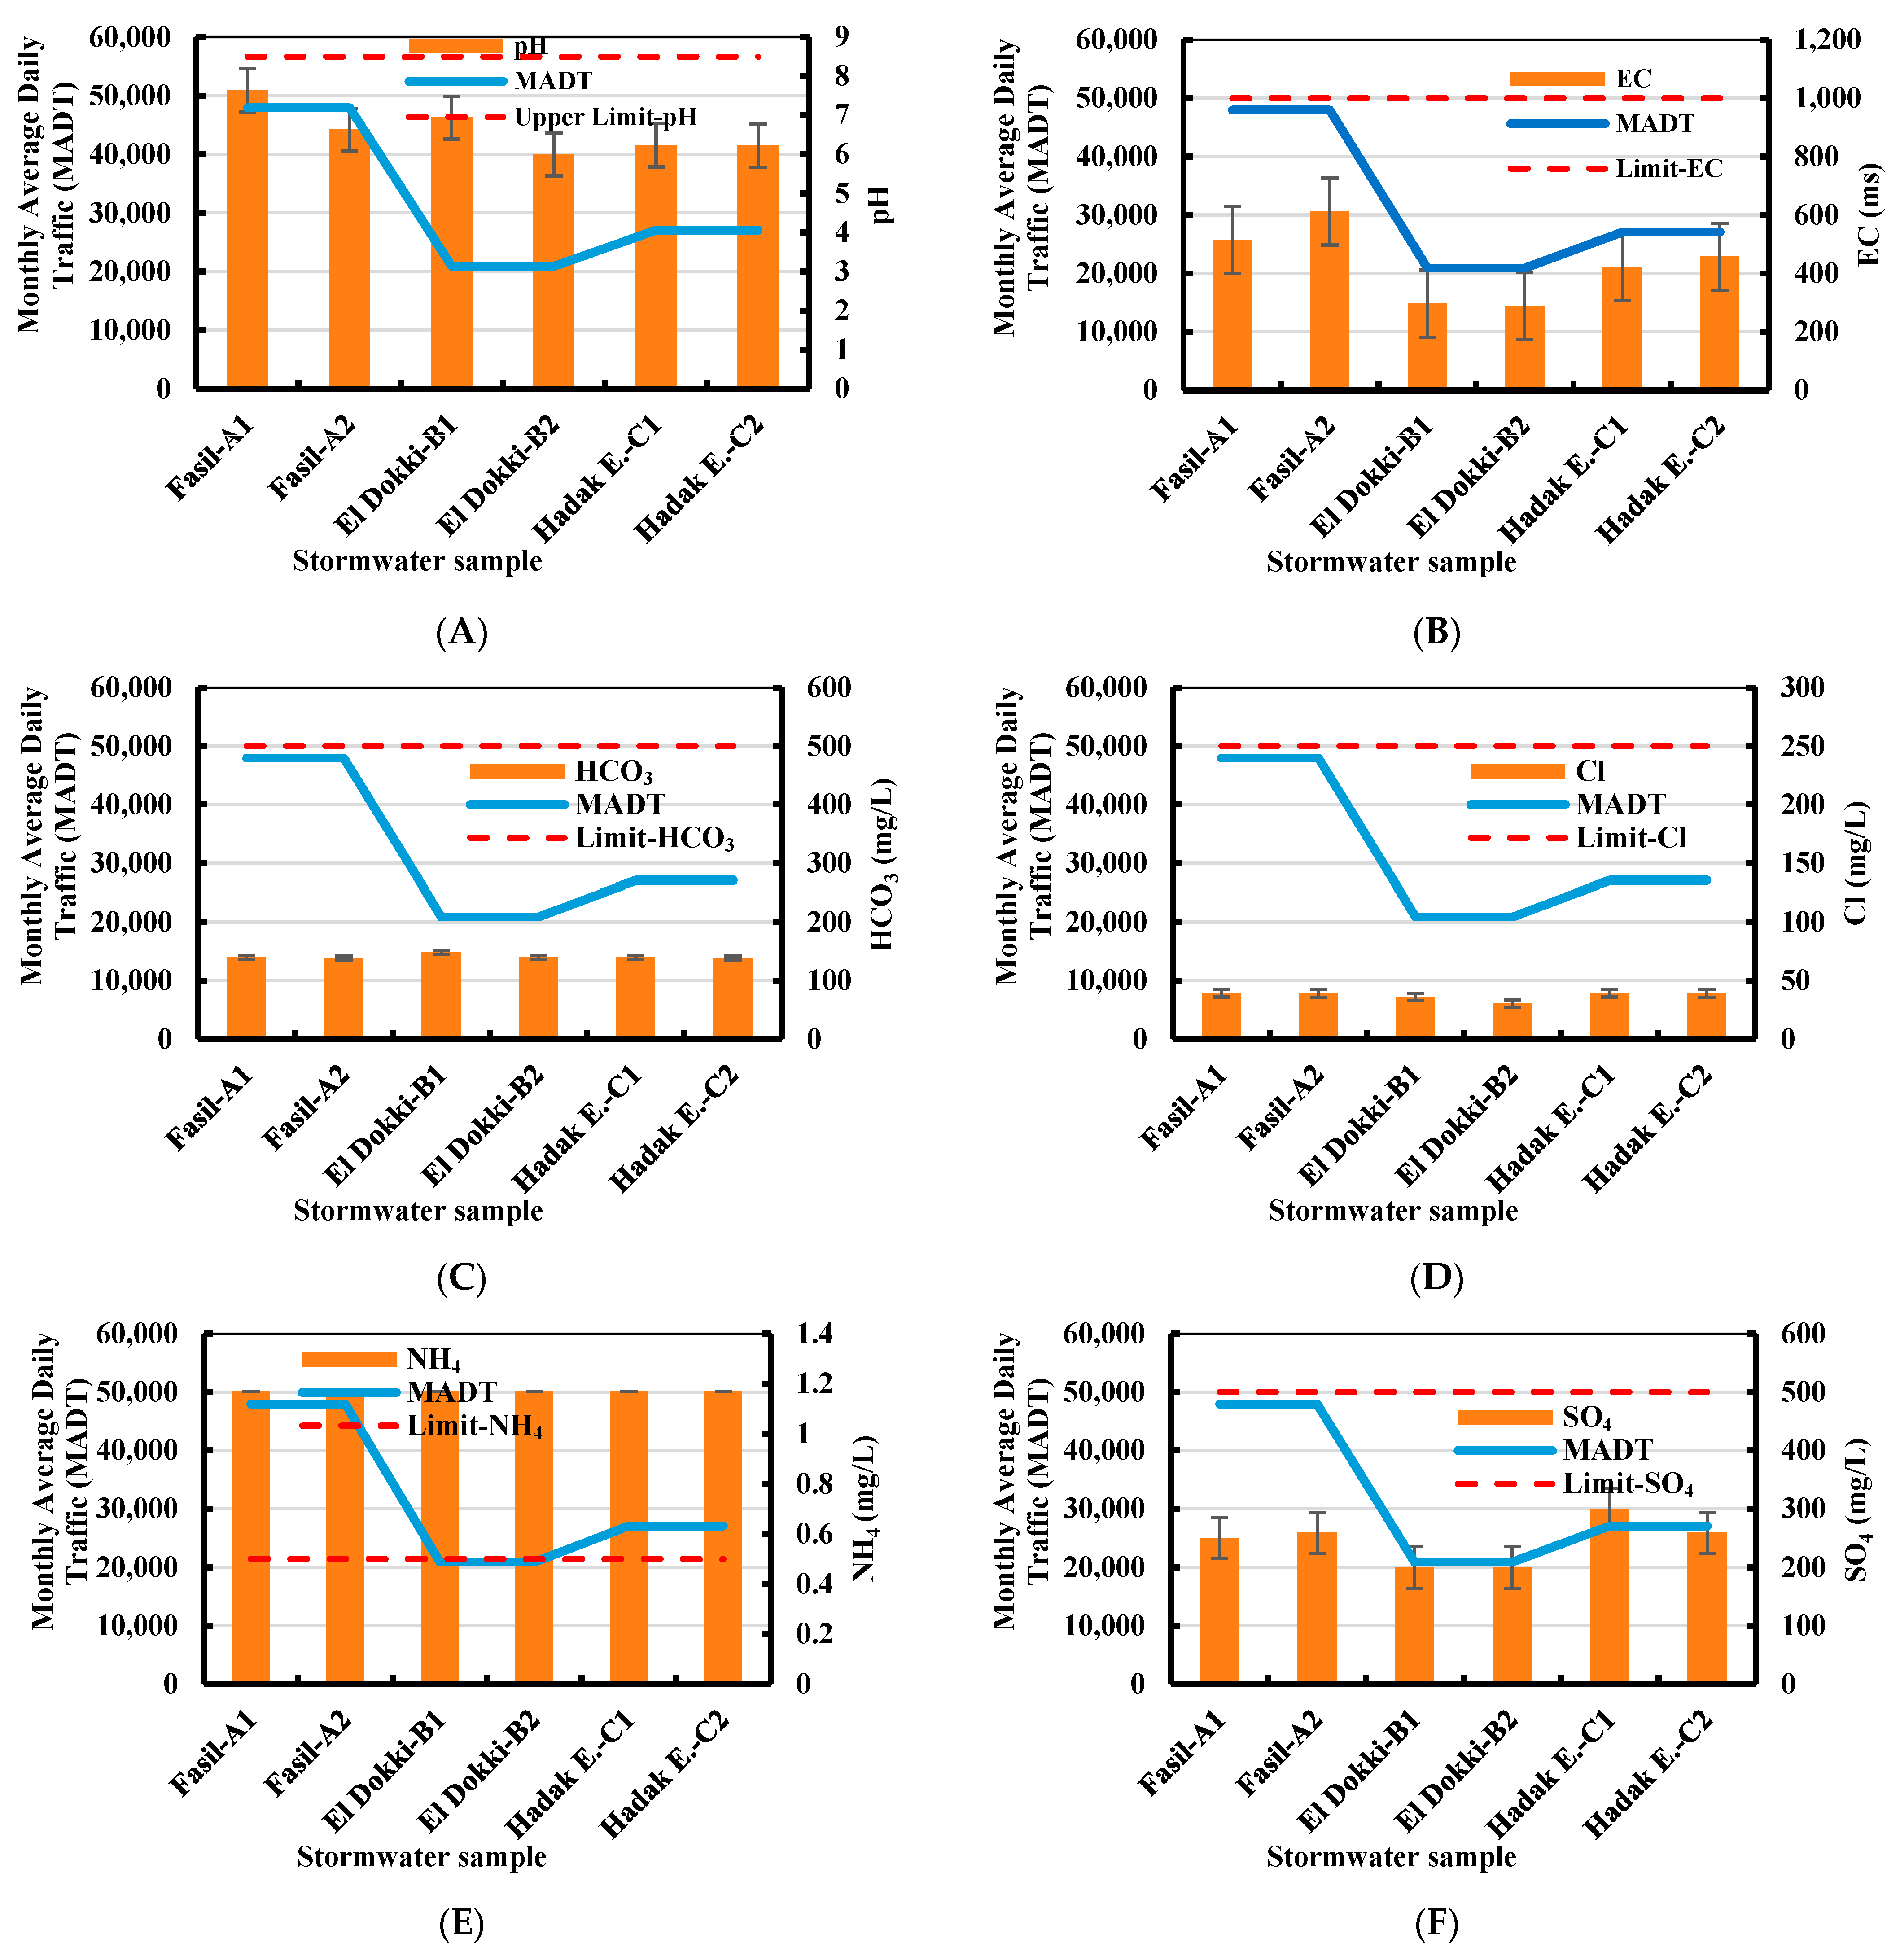
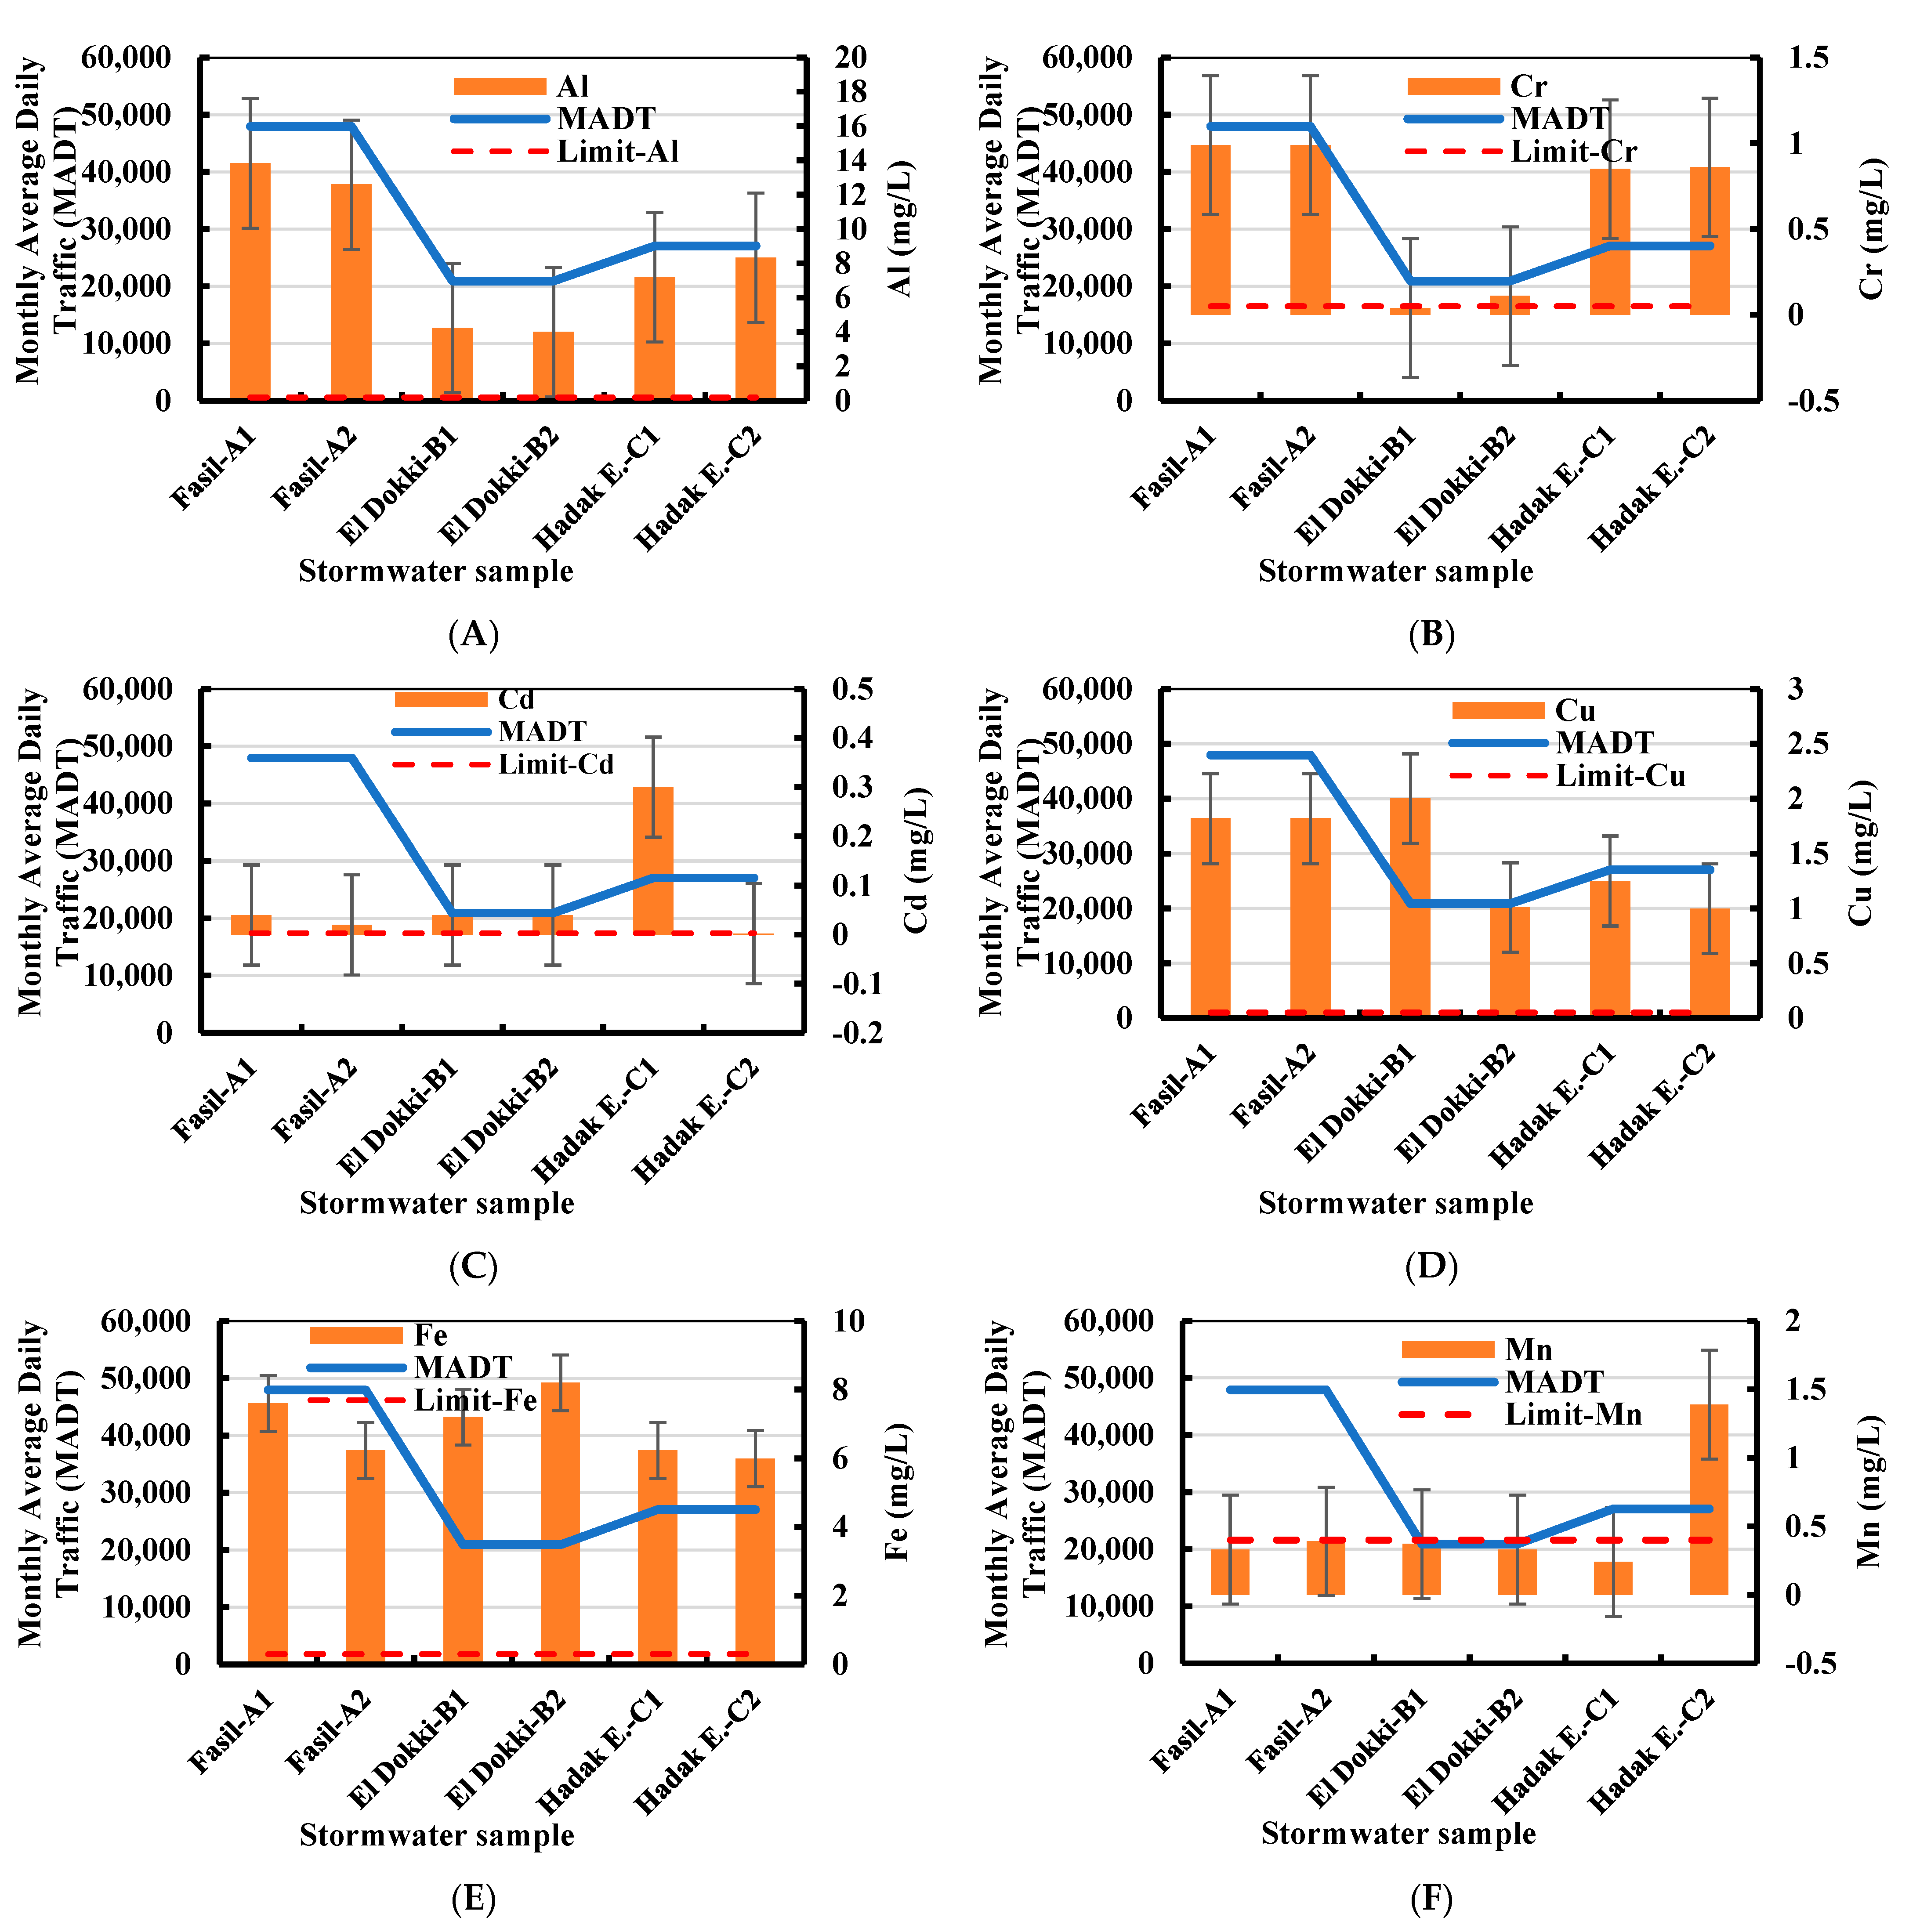
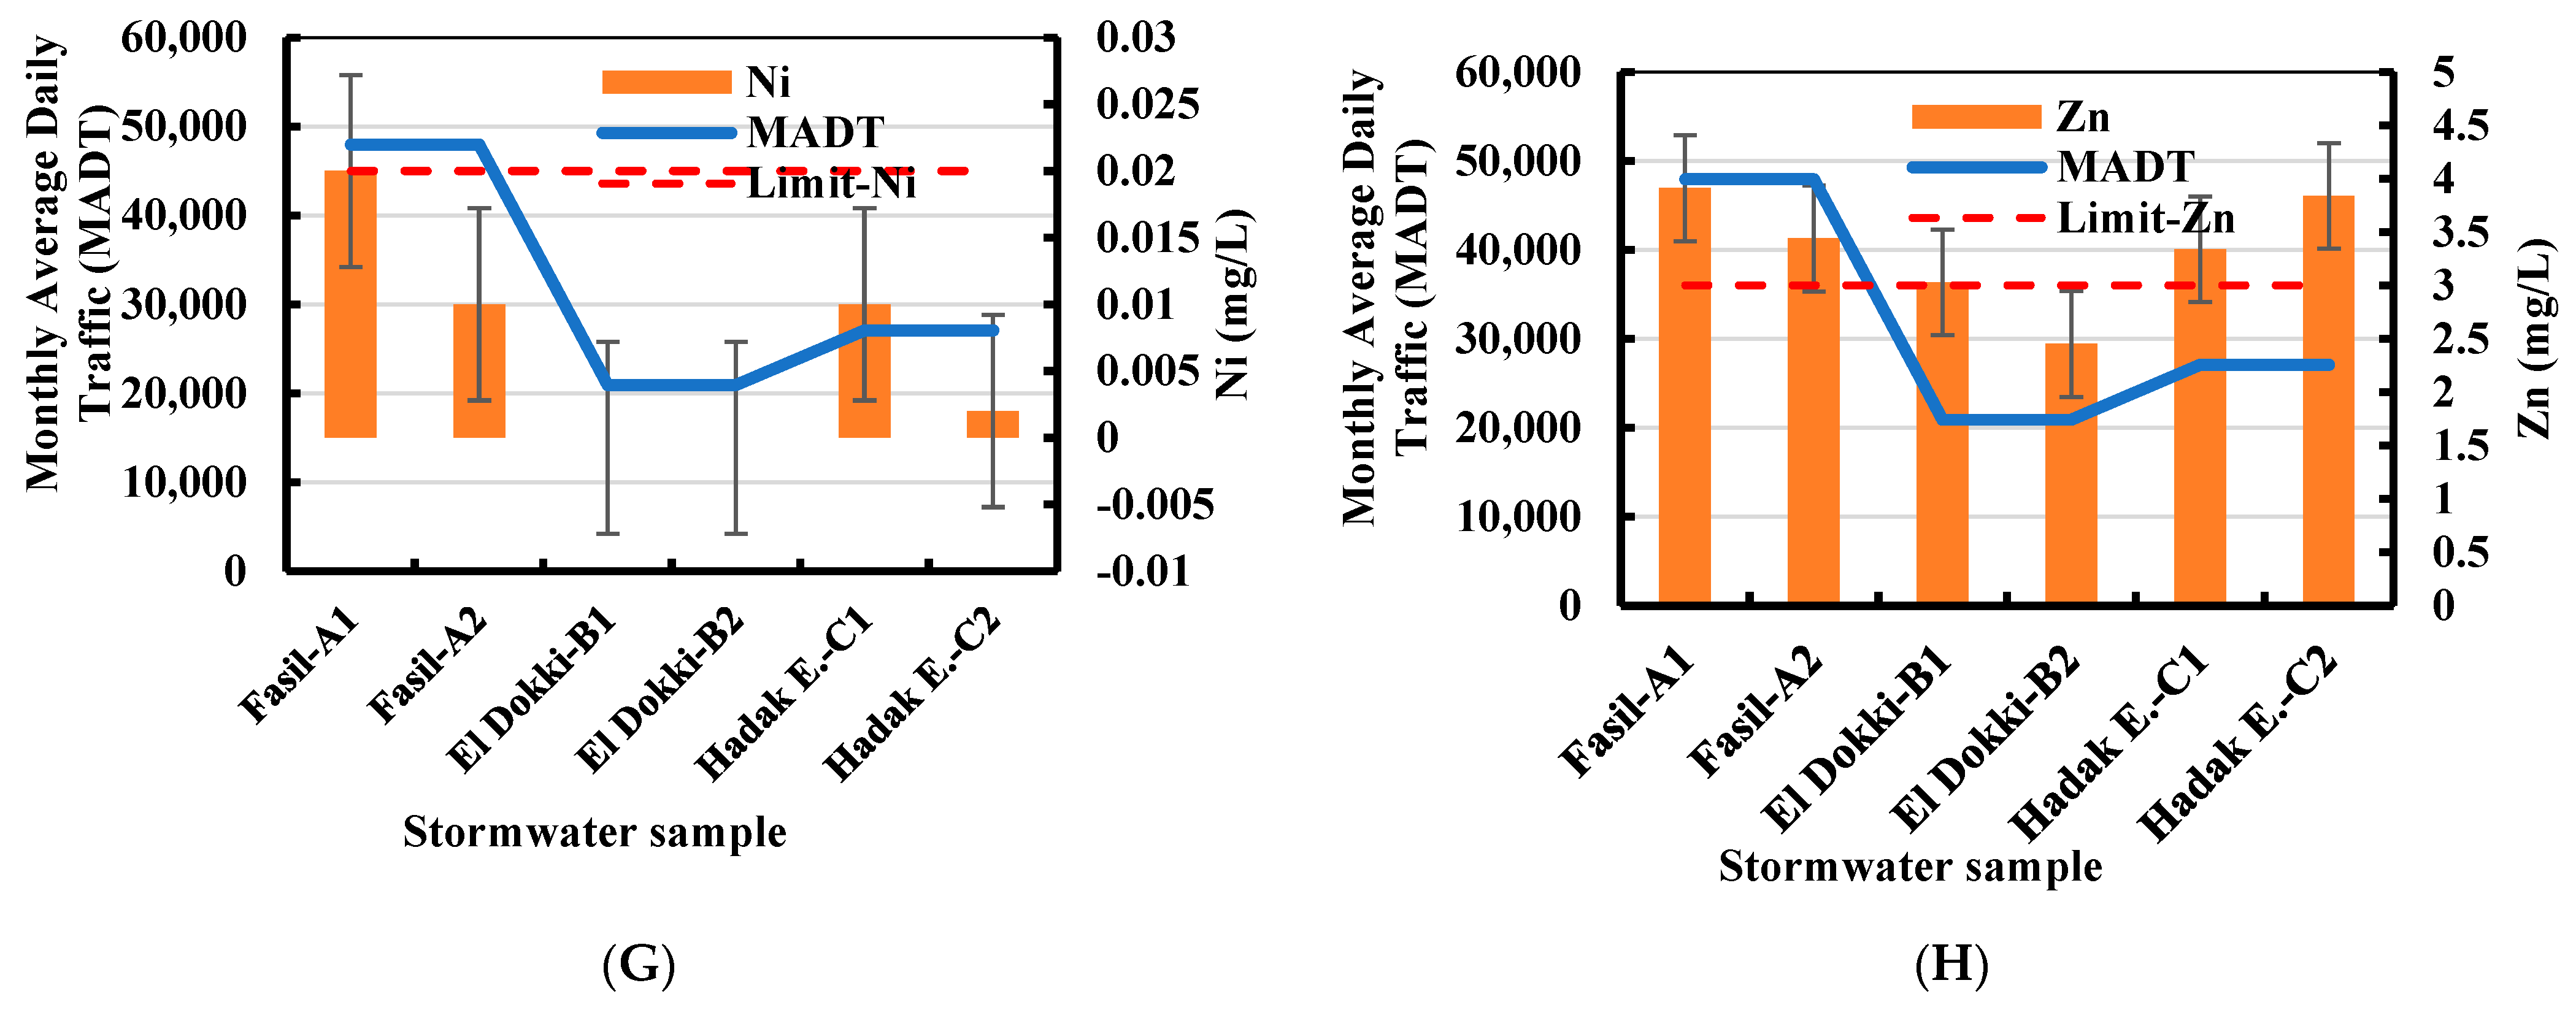
Table 7 summarizes the statistical analysis for the measured stormwater quality parameters in light of WHO and Egyptian water quality standards. The results show that the pH and conductivity are in the range of common values for road runoff according to the Egypt Decrees [41] limits. With regard to phosphorus, this study discovered a relationship between traffic volume and stormwater pollution levels. Site A1 recorded the highest amounts of total phosphorus, followed by site C1. The highest amount of heavy traffic and the impacts of first-flush stormwater may increase oil pollution, which would explain the high pollution at site A with almost all of the traffic being heavy. On the other hand, the TSS are in the range of common values for road runoff; moreover, the total nitrogen and TDS are in the range of common values according to the Egypt Decrees limits, but site A1 has a higher value of TSS (817 mg/L). Figure 4A shows the variation of MADT for the studied sites and the pH indicating acid stormwater at El Dokki—B2, Hadayek E.—C1, and Hadayek E.—C2. Figure 4B shows the variation of MADT for the studied sites and the EC indicating low EC values for the stormwater at the smallest MADT at El Dokki—B1 and El Dokki—B2. On the other hand, the variation of MADT has no effect on the HCO3, Cl, NH4, and TN concentrations as shown in Figure 4C–E,I, respectively. In addition, the variation of BOD, COD, and TP concentrations with the MADT for the studied sites show a small variation as these pollutants come from point pollutant sources and do not depend on traffic congestion as shown in Figure 4K,L,J, respectively. Figure 4G shows significant correlations between MADT and heavy metals. The results indicated that the concentration of the TSS in stormwater is influenced by the traffic intensity where sites A and C show significantly higher pollution of TSS, because the traffic intensity at A is more than twice that of B and C. Most of the highest monthly loads were measured at the three sites, which have a MADT of 47,950, 20,919, and 27,064 cars, respectively. Modern engine lubricants prepared with zinc dialkyl-dithio phosphate compounds are employed to protect moving metal components from wear when considering phosphorus emissions from automobiles [54]. The results also revealed that BOD concentrations were highest at C1, C2, A1, and A2 (45, 45, 40, and 38 mg/L, respectively), but, at site B, they were in the range of common values, according to the Egypt Decrees limits, and the COD was higher at site A1, A2, and C1 (80, 79, and 59.66 mg/L), respectively, but, at site B1, B2, and C2, it was in the range of common values. The levels of pollutant concentrations generated from the highest-traffic sites, such as BOD and COD and oil and grease, were relatively higher than those measured at lower-traffic sites. The results for heavy metals in Table 7 showed that the concentration of dissolved Zn, Cu, Fe, and Cr at El Dokki, Hadayek El-Ahram, and Faisal did not fall within the range of common values, in general, but the results for heavy metal concentrations were generally higher; this might be due to the high-traffic activities and percent of street areas in urban catchments (Figure 4). On the other hand, according to Egypt’s Decrees limits, the value of Mn in all sites falls within the range of the common values for road runoff. Several studies on street runoff in the literature have found that metal concentrations are positively correlated with the number of vehicles on the street during a rainfall event [21]. In addition, according to the findings, the concentration of the key heavy elements Al, Cr, Cd, Fe, Cu, Mn, Ni, Zn, and Pb is higher than the Egyptian stormwater standards, as shown in Figure 5.

3.2. WQI Results

Table 8 summarizes the WQI results for the studied regions. Therefore, the results show that the WQI ranged from 426 to 929 with an average of 661 + 168. The WQI of 776 and 708 for Faisal (A), 499 and 426 for El Dokki (B), and 929 and 626 for Hadayek El-Ahram (C) indicate that the water is unfit for drinking and, before use, proper treatment is required. Therefore, heavy metals like Al, Cr, Cd, Fe, and Cu were present in it. In addition, BOD, COD, and TP pollutants also contribute to the high value of the WQI. Figure 4 shows the relationship between the measured stormwater quality parameters, Egyptian water quality criteria (Egypt Decree [41,42]), and the MADT.

3.3. Stormwater Quality for Irrigation

The results for the gathered samples’ stormwater irrigation indices are summarized in Table 9. While the total hardness (TH) and residual sodium bicarbonate (RSBC) indicate poor irrigation water quality, the stormwater quality irrigation indices for TDS, SAR, SSP, PI, and MAR indicate excellent stormwater for irrigation.

4. Discussion

The generation of pollutants is affected by various factors, such as rainfall intensity, land type, and the previous dry period; their relationships have been well-established in previous studies [55,56]. Based on the stormwater quality parameter results, the values of total phosphorus demonstrate remarkable fluctuations at most sites. Spatial variation was recorded, with site C1 showing the highest mean value (6 mg/L), followed by sites A1 and B1 (5.02 mg/L and 4.55 mg/L, respectively). The higher concentrations may be due to the domestic and industrial sewage disposal at these sites; moreover, the elevated phosphorous concentrations are related to the pollutants [11,57]. It is interesting that the mean average value of TN is even lower than the recommended TN content according to the Egypt Decrees [41,42] and WHO [43]. In addition, heavy traffic and other human activities that produce air pollutants such as ozone, carbon dioxide, hydrocarbons, sulphur oxides, and suspended particulate matter contribute to a decrease in pH, indicating acid stormwater (Figure 4A). The results show that traffic intensity has an effect on the TSS in stormwater. Table 7 and Figure 4G shows the substantially higher pollution of TSS at the Faisal site compared to that at El Dokki and Hadayek El-Ahram, where the traffic intensity at Faisal is more than twice that of El Dokki and Hadayek El-Ahram. These results are consistent with the previous literature [58,59]. Table 7 and Figure 5C,D,H show that the average concentration of dissolved Zn, Cu, Mg, and Fe was 3.91 mg/L, 1.82 mg/L, 46.25 mg/L, and 7.62 mg/L, respectively, at the Faisal—A1; whereas, it indicates 3.028 mg/L, 2 mg/L, 500 mg/L, and 7.21 mg/L, respectively, at El Dokki—B1. At Hadayek E.—C1, it was 3.342, 1.253, 46.249, and 6.23 mg/L, respectively. In general, the results of heavy metal concentrations were generally higher due to the high-traffic activities and percentage of street areas in urban catchments [29]. For example, in several studies, including those by [60], it was shown that the primary factor influencing the concentrations of heavy metals in stormwater was traffic density. Heavy metal pollutants from vehicles may also be affected by driving behaviors (such as how often brakes are used) and how long vehicles are left in a location (idling). It is well-recognized that significant sources of metals in stormwater include tire wear and vehicle brake emissions [28]. The results showed that the levels of organic pollutants (COD and BOD) and disintegrated heavy metals (Zn, Cu, Pb, and Mn) were mainly due to the high traffic volume; these results are compatible with the previous literature [59]. The assessment of drinking water quality is a timely requirement amid emerging public health problems in this context, where the availability of safe water is at risk due to natural and man-made activities; the WQI was employed to analyze the variation in stormwater quality. For the six stormwater samples from Faisal—A1—A2, El Dokki—B1—B2, and Hadayek E.—C1—C2, using the Excel program, the correlation matrix between the researched physio-chemical parameters and WQI was performed and examined as shown in Table 10. As a result, it was shown that there was a high positive correlation between WQI and SO4, Cl, BOD, TSS, Cr, Cd, and TDS, while a moderate correlation was found between WQI and COD, Zn, and Al. The correlation between QWI and Mg, on the other hand, is strongly negative, while the correlation between QWI and Na, K, and Al is modest. Weak correlations are observed between WQI and pH, HCO3, Cu, Mn, and Ca. As shown in Table 10, an 84% positive correlation between TSS and WQI is observed where the TSS may include heavy metals that are transferred from the surface by stormwater during the rainfall season. Therefore, lowering the amount of TSS in stormwater would lead to significantly reduced levels of particle-bound heavy metals and total phosphorus. There are other options, such as eliminating particle-bound pollution using non-structural preventive approaches, such as street sweeping, before it enters storm drain water. To collect rainwater, it is also recommended to have an effective stormwater sewerage system. The irrigation water quality indices show the total hardness (TH) and residual sodium bicarbonate (RSBC) indicating poor irrigation water. Hard water flows through the irrigation system of a farmer’s field before it ever reaches the soil, leaving behind hard water deposits that eventually limit the effectiveness of water delivery to the plants. Watering zones may entirely block up over time, which is frequently the case with drip irrigation systems [61]. Surendran et al. [62] confirmed the viability of using low-quality water for agriculture while also demonstrating the positive effects of magnetically treated irrigation water on crop development and output. Reverse osmosis (RO) systems are sometimes used by farmers to alleviate a variety of water problems, including hard water, in some specialized growth environments, such as greenhouses and hydroponics enterprises [63]. RO, however, ultimately has no effect on treating hard water. Additionally, excessive amounts of calcium and magnesium, the minerals that make up the majority of hard water, lead to the fouling of pricey membranes that are essential to the functionality and effectiveness of RO systems. Large quantities of ozone are produced by agricultural ozone water treatment systems, which, when injected into water, instantly oxidize or remove unwanted pollutants for simple filtering. One of the main benefits of our ozone treatment system is that it is easily scalable, including our softeners, to be able to treat bigger volumes of contaminated irrigation water. The end result is soft water that is safe for crops and will not harm irrigation systems [64]. The ability of electric vehicles to help improve air quality in cities and towns is their main advantage. Sun et al. [65] concluded that employing renewable energy during the manufacturing and battery production process would reduce CO2 emissions, particularly in China and the USA. Battery electric vehicles were shown to be more energy-efficient. And, finally, to deal with the traffic congestion solutions, smart road design is recommended. Therefore, one of the easiest ways to lessen traffic congestion is to stop the problem of traffic congestion brought on by too many people trying to drive at once on any one road. In a civil engineer’s design, providing several routes to the same destination can help reduce the number of vehicles in congested areas. Drivers spend less time waiting in traffic as a result of the traffic being distributed over all streets. Reducing the number of lanes available to private automobiles in favor of public transportation is another option. A civil engineer’s plan can reduce the overall number of vehicles on the road by swapping out a few open roadway lanes for bus lanes, carpool lanes, or even sidewalks, as some potential drivers may choose to use another mode of transportation that is more cost-effective or better suits their lifestyle. There will inevitably be drivers who need or choose to operate their own automobiles. However, the likelihood of congestion can be decreased by lowering the overall number of vehicles on the road by offering alternate routes.
The need for a greater investment in public transport options across the nation is highlighted in a 2022 report by the United States Public Interest Research Group (USPIRG). Reduced oil consumption (USPIRG estimates that even the current level of public transport utilization saves billions of gallons a year), less traffic congestion, and a smaller national environmental impact are cited as arguments for increased public transit use. (https://onlinemasters.ohio.edu/blog/traffic-congestion-problems-and-solutions/, accessed on 1 June 2023).

5. Conclusions

By using motor cars and engaging in other human activities that are common in urban areas, many pollutants, including dangerous species like heavy metals, reach the urban environment. Either these pollutants are instantly deposited on ground surfaces, such as roads, or they accumulate in the atmosphere first before reaching those surfaces. This study examines the impact of traffic congestion on the stormwater quality in urbanized regions and determines whether it is adequate for irrigation and drinking. In order to monitor and assess the stormwater quality, three different locations in Egypt’s densely populated and urbanized Giza Governorate were chosen: Faisal (A), El Dokki (B), and Hadayek El-Ahram (C), which have respective catchment areas of 10,476, 7566, and 9870 m2, and monthly average daily traffic (MADT) values of 47,950, 20,919, and 27,064 cars. Six water samples were examined, and the physio-chemical and heavy metal stormwater quality indicators were compared with Egypt’s water standards and World Health Organization (WHO) recommendations. The results show that the WQI ranged from 426 to 929, with an average of 661 ± 168, proving that each area under investigation had contaminated stormwater and required pretreatment in order for it to be useable. Therefore, the WQI of 776 and 708 for Faisal (A), 499 and 426 for El Dokki (B), and 929 and 626 for Hadayek El-Ahram (C) indicate that the water is unfit for drinking. Therefore, heavy metals like Al, Cr, Cd, Fe, and Cu were present in it. The stormwater quality irrigation indices of total dissolved solids (TDS), sodium adsorption ratio (SAR), soluble sodium percentage (SSP), permeability index (PI), magnesium adsorption ratio (MAR), and Kelley’s ratio (KR), however, show excellent stormwater for irrigation, while total hardness (TH) and residual sodium bicarbonate (RSBC) show poor irrigation water quality. Strong linear correlations between heavy metals, total phosphorus (TP), and TSS were discovered. Based on the correlation between TSS, heavy metals, and TP that has been found, lowering the stormwater’s suspended-solid levels would result in much lower particle-bound heavy metals and total phosphorus levels. The sites with the highest traffic volume recorded maximum stormwater pollution. The careful selection of the location for a single-sample collection is a crucial issue because the stormwater quality changes significantly during a specific event. The location should be favorable for stormwater and satisfy the following criteria: (i) the outfall locations, including longitude and latitude recurving water, are certain; (ii) the site drainage map, (iii) the estimation of the impervious area within each outfall drainage area, (iv) facility improvement which may affect the discharge described, (v) the facility’s history of large leaks or spills of toxic or hazardous pollutants within the last three years, as well as the location and description of any existing structures and nonstructural pollutant sources like onsite materials that may come into contact with stormwater runoff, are all factors that should be considered. The obtained sampling data from stormwater flows, which is a useful tool for identifying pollutant sources, best management practices, and plans for preventing stormwater pollution, can be developed to prioritize eradicating these sources. There are alternatives, such as removing particle-bound pollution using non-structural preventive methods before it enters storm drain water, including street sweeping. Installing an adequate stormwater sewerage system is also advised to collect rainwater. In addition, the use of renewable energy throughout the manufacturing and battery production processes will lower CO2 emissions, and battery electric vehicles are more energy-efficient. To deal with the traffic congestion solutions, (i) smart road design is recommended; and (ii) by substituting a few open roadway lanes for bus lanes, carpool lanes, or even sidewalks, a civil engineer’s plan can decrease the overall number of vehicles on the road because some potential drivers might decide to use another mode of transportation that is more cost-effective or better suits their lifestyle, (iii) according to the United States Public Interest Research Group (USPIRG) report for 2022 that emphasizes the need for increased funding for public transportation alternatives across the country. Increased public transit usage is justified by claims of decreased oil consumption (USPIRG calculates that even current public transportation use saves billions of gallons annually), decreased traffic, and a milder national environmental impact. Finally, carrying out seasonal monitoring for stormwater quality is an important issue for the best management practices and policies for reducing stormwater pollution.

Author Contributions

Conceptualization, M.E.G. and A.M.E.S.; methodology, M.E.G. and A.M.E.S.; software, M.E.G. and A.M.E.S.; validation, M.E.G., A.M.E.S. and H.B.F.; formal analysis, M.E.G., A.M.E.S. and H.B.F.; investigation, M.E.G., A.M.E.S. and H.B.F.; resources, M.E.G., A.M.E.S. and H.B.F.; data curation, M.E.G. and A.M.E.S.; writing—original draft preparation, M.E.G. and A.M.E.S.; writing—review and editing, M.E.G., A.M.E.S. and H.B.F.; visualization, M.E.G. and H.B.F.; supervision, M.E.G. and H.B.F. All authors have read and agreed to the published version of the manuscript.

Funding

This research received no external funding.

Institutional Review Board Statement

The study was conducted in accordance with the Declaration of Helsinki.

Informed Consent Statement

Not applicable.

Data Availability Statement

The data are available upon request.

Acknowledgments

The authors warmly thank the General Authority of Roads, Bridges, and Land Transport (GARBLT) and the Ministry of Water Resources and Irrigation in Egypt for their co-operation in supplying the data required for carrying out this work.

Conflicts of Interest

The authors declare no conflict of interest.

References

  1. Abdelazim, N. Conventional water resources and agriculture in Egypt. In The Handbook of Environmental Chemistry; Springer: Cham, Switzerland, 2019; Volume 74, pp. 233–241. [Google Scholar]
  2. Gabr, M.E. Land reclamation projects in the Egyptian Western Desert: Management of 1.5 million acres of groundwater irrigation. Water Int. 2023, 48, 240–258. [Google Scholar] [CrossRef]
  3. Abdel-Maksoud, B.M. Estimation of air temperature and rainfall trends in Egypt. Asian J. Adv. Res. Rep. 2018, 1, 1–22. [Google Scholar] [CrossRef]
  4. Radwan, G.; Ellah, A. Water resources in Egypt and their challenges, Lake Nasser case study. Egypt. J. Aquat. Res. 2020, 46, 1–12. [Google Scholar]
  5. UNICEF. Report. 2021. Available online: https://a-z-animals.com/blog/discover-the-most-populated-cities-in-the-world/ (accessed on 10 June 2023).
  6. Walaa, Y.E.; Ahmed, H.E. Managing risks of the Grand Ethiopian Renaissance Dam on Egypt. Ain Shams Eng. J. 2018, 9, 2383–2388. [Google Scholar] [CrossRef]
  7. Omran, E.S.E.; Negm, A. Environmental Impacts of the GERD Project on Egypt’s Aswan High Dam Lake and Mitigation and Adaptation Options. In Grand Ethiopian Renaissance Dam Versus Aswan High Dam. The Handbook of Environmental Chemistry; Negm, A., Abdel-Fattah, S., Eds.; Springer: Cham, Switzerland, 2018; Volume 79. [Google Scholar] [CrossRef]
  8. Falkenmark, M. Meeting water requirements of an expanding world population. Philos. Trans. R. Soc. Lond. Ser. B Biol. Sci. 1997, 352, 929–936. [Google Scholar] [CrossRef]
  9. Gabr, M.E. Impact of climatic changes on future irrigation water requirement in the Middle East and North Africa’s region: A case study of upper Egypt. Appl. Water Sci. 2023, 13, 158. [Google Scholar] [CrossRef]
  10. Djuma, H.; Bruggeman, A.; Eliades, M.; Lange, M.A. Non-conventional water resources research in semi-arid countries of the Middle East. Desalination Water Treat. 2016, 57, 2290–2303. [Google Scholar] [CrossRef]
  11. Ibrahim, M.; Al-Zyoud, S.; Elhaddad, E. Surface water quality monitoring for River Nile, Egypt using GIS-Techniques. Open J. Geol. 2018, 8, 161–173. [Google Scholar] [CrossRef]
  12. Gabr, M.E.; Al-Ansari, N.; Salem, A.; Awad, A. Proposing a wetland-based economic approach for wastewater treatment in arid regions as an alternative irrigation water source. Hydrology 2023, 10, 20. [Google Scholar] [CrossRef]
  13. Gabr, M.E.; El Shorbagy, A.M.; Faheem, H.B. Utilizing the harvesting of rainwater to provide safe road transportation efficiency and increase water resources in the context of climatic change. Sustainability 2022, 14, 9656. [Google Scholar] [CrossRef]
  14. Gabr, M.E.; El-Ghandour, H.A.; Elabd, S.M. Prospective of the utilization of rainfall in coastal regions in the context of climatic changes: Case study of Egypt. Appl. Water Sci. 2023, 13, 19. [Google Scholar] [CrossRef]
  15. Janke, B.D.; Finlay, J.C.; Hobbie, S.E. Trees and streets as drivers of urban stormwater nutrient pollution. Environ. Sci. Technol. 2017, 51, 9569–9579. [Google Scholar] [CrossRef] [PubMed]
  16. Gunawardena, J.M.A.; Liu, A.; Egodawatta, P.; Ayoko, G.A.; Goonetilleke, A. Influence of Traffic and Land Use on Urban Stormwater Quality: Implications for Urban Stormwater Treatment Design. In Springer Briefs in Water Science and Technology 2018; Springer: Singapore, 2018. [Google Scholar]
  17. Pilone, F.G.; Garcia-Chevesich, P.A.; McCray, J.E. Urban Drool Water Quality in Denver, Colorado: Pollutant Occurrences and Sources in Dry-Weather Flows. Water 2021, 13, 3436. [Google Scholar] [CrossRef]
  18. Zgheib, S.; Moilleron, R.; Chebbo, G. Priority pollutants in urban stormwater: Part 1—Case of separate storm sewers. Water Res. 2012, 46, 6683–6692. [Google Scholar] [CrossRef]
  19. Popick, H.; Brinkmann, M.; McPhedran, K. Assessment of stormwater discharge contamination and toxicity for a cold-climate urban landscape. Environ. Sci. Eur. 2022, 34, 43. [Google Scholar] [CrossRef] [PubMed]
  20. Yang, Y.Y.; Toor, G.S. Sources and mechanisms of nitrate and orthophosphate transport in urban stormwater runoff from residential catchments. Water Res. 2017, 112, 176–184. [Google Scholar] [CrossRef]
  21. Iwegbue, C.M.A.; Kekeke, E.F.; Tesi, G.O.; Olisah, C.; Egobueze, F.E.; Chukwu-Madu, E.; Martincigh, B.S. Impact of Land-Use Types on the Distribution and Exposure Risk of Polycyclic Aromatic Hydrocarbons in Dusts from Benin City, Nigeria. Arch. Environ. Contam. Toxicol. 2021, 81, 210–226. [Google Scholar] [CrossRef]
  22. Davis, B.; Birch, G. Comparison of heavy metal loads in stormwater runoff from major and minor urban roads using pollutant yield rating curves. Environ. Pollut. 2010, 158, 2541–2545. [Google Scholar] [CrossRef]
  23. Xue, H.; Li, Z.; Liu, X. Characteristics of heavy metal pollution in road runoff in the Nanjing urban area, East China. Water Sci. Technol. 2020, 81, 1961–1971. [Google Scholar] [CrossRef]
  24. Shorshani, M.F.; Bonhomme, C.; Petrucci, G.; André, M.; Seigneur, C. Road traffic impact on urban water quality: A step towards integrated traffic, air and stormwater modelling. Environ. Sci. Pollut. Res. 2014, 21, 5297–5310. [Google Scholar] [CrossRef]
  25. Dixon, H.J.; Elmarsafy, M.; Hannan, N.; Gao, V.; Wright, C.; Khan, L.; Gray, D.K. The effects of roadways on lakes and ponds: A systematic review and assessment of knowledge gaps. Environ. Rev. 2022, 30, 501–523. [Google Scholar] [CrossRef]
  26. Gunawardena, J.; Egodawatta, P.; Ayoko, G.A.; Goonetilleke, A. Role of traffic in atmospheric accumulation of heavy metals and polycyclic aromatic hydrocarbons. Atmos. Environ. 2012, 54, 502–510. [Google Scholar] [CrossRef]
  27. Zhang, H.; Wang, Z.F.; Zhang, Y.L.; Ding, M.J.; Li, L.H. Identification of traffic-related metals and the effects of different environments on their enrichment in roadside soils along the Qinghai–Tibet highway. Sci. Total Environ. 2015, 521–522, 160–172. [Google Scholar] [CrossRef] [PubMed]
  28. De Silva, S.; Ball, A.S.; Huynh, T.; Reichman, S.M. Metal accumulation in roadside soil bourne, Australia: Effect of road age, traffic density and vehicular speed. Environ. Pollut. 2016, 208, 102–109. [Google Scholar] [CrossRef] [PubMed]
  29. Huber, M.; Welker, A.; Helmreich, B. Critical review of heavy metal pollution of traffic area runoff: Occurrence, influencing factors, and partitioning. Sci. Total Environ. 2016, 541, 895–919. [Google Scholar] [CrossRef]
  30. Liu, A.; Liu, L.; Li, D.Z.; Guan, Y.T. Characterizing heavy metals build-up on urban road surfaces, implication for stormwater reuse. Sci. Total Environ. 2015, 515–516, 20–29. [Google Scholar] [CrossRef]
  31. Pohjola, M.A.; Kousa, A.; Kukkonen, J.; Harkonen, J.; Karppinen, A.; Aarnio, P.; Koskentalo, T. The spatial and temporal variation of measured urban pm10 and pm2.5 in the Helsinki metropolitan area. Water Air Soil Pollut. Focus 2002, 2, 189–201. [Google Scholar] [CrossRef]
  32. Jandacka, D.; Durcanska, D.; Bujdos, M. The contribution of road traffic to particulate matter and metals in air pollution in the vicinity of an urban road. Transp. Res. Part D Transp. Environ. 2017, 50, 397–408. [Google Scholar] [CrossRef]
  33. Liu, L.; Liu, A.; Li, Y.; Zhang, L.X.; Zhang, G.J.; Guan, Y.T. Polycyclic aromatic hydrocarbons associated with road deposited solid and their ecological risk: Implications for road stormwater reuse. Sci. Total Environ. 2016, 563–564, 190–198. [Google Scholar] [CrossRef]
  34. Krein, A.; Schorer, M. Road runoff pollution by polycyclic aromatic hydrocarbons and its contribution to river sediments. Water Res. 2000, 34, 4110–4115. [Google Scholar] [CrossRef]
  35. Gabr, M.; Soussa, H.; Fattouh, E. Groundwater quality evaluation for drinking and irrigation uses in Dayrout city Upper Egypt. Ain Shams Eng. J. 2021, 12, 327–340. [Google Scholar] [CrossRef]
  36. Megahed, H.A.; Farrag, A.E.H.A. Groundwater potentiality and evaluation in the Egyptian Nile Valley: Case study from Assiut Governorate using hydrochemical, bacteriological approach, and GIS techniques. Bull. Natl. Res. Cent. 2019, 43, 1–20. [Google Scholar] [CrossRef]
  37. Brown, R.M.; Clelland, N.L.; Deininger, R.A.; Connor, M.F. A water quality index crashing the physiological barrier. Indic. Environ. Qual. 1972, 1, 173–182. [Google Scholar]
  38. Davies, J.M. Application and tests of the Canadian Water Quality Index for assessing changes in water quality in lakes and rivers of central North America. Lake Reserve Manag. 2006, 22, 308–320. [Google Scholar] [CrossRef]
  39. Tegegne, A.M.; Lohani, T.K.; Eshete, A.A. Evaluation of groundwater quality for drinking and irrigation purposes using proxy indices in the Gunabay watershed, Upper Blue Nile Basin, Ethiopia. Heliyon 2023, 9, e15263. [Google Scholar] [CrossRef] [PubMed]
  40. Samy, A.; Eissa, M.; Shahen, S.; Said, M.M.; Shahaba, R.M.A. Geochemistry and assessment of groundwater resource in coastal arid region aquifer (Dahab delta, South Sinai, Egypt). Beni-Suef Univ. J. Basic Appl. Sci. 2023, 12, 54. [Google Scholar] [CrossRef]
  41. Egypt Decree No.458; Drinking Water Quality Standards. Ministry of Health and Population in Arabic: Warraq, Egypt, 2007.
  42. Egypt Decree, 92/2013, “For the Protection of the Nile River and Its Waterways from Pollution”, Decree of Minister of Water Resources and Irrigation no. 92 for Year 2013 for the Executive Regulation of Law 48/1982, 92/2013 (in Arabic). Available online: https://www.mwri.gov.eg/index.php/ministry/ministry-17/12-1984 (accessed on 15 June 2023).
  43. WHO (World Health Organization). Guidelines for the Safe Use of Wastewater, Excreta and Greywater in: Wastewater Use in Agriculture; World Health Organization: Geneva, Switzerland, 2006; Volume 2. [Google Scholar]
  44. Gabr, M.E.S. Management of irrigation requirements using FAO-CROPWAT 8.0 model: A case study of Egypt. Model. Earth Syst. Environ. 2022, 8, 3127–3142. [Google Scholar] [CrossRef]
  45. APHA. Standard Method for the Examination of Water and Wastewater, 19th ed.; American Public Health Association: Washington, DC, USA, 1995; p. 500. [Google Scholar]
  46. Richards, L.A. Diagnosis and Improvement of Saline and Alkali Soils; Handbook; Scientific Publishers: Meerut, India, 1954. [Google Scholar]
  47. Todd, D.K. Groundwater Hydrology; Wiley: New York, NY, USA, 1980. [Google Scholar]
  48. Eaton, F.M. Significance of carbonate in irrigation water. Soil Sci. 1950, 62, 123–133. [Google Scholar] [CrossRef]
  49. Doneen, L.D. Notes on Water Quality in Agriculture; Published as a Water Science and Engineering Paper 4001; Department of Water Science and Engineering, University of California: Riverside, CA, USA, 1964. [Google Scholar]
  50. Raghaunth, H.M. Groundwater; Wiley Eastern Ltd.: New Delhi, India, 1989; p. 563. [Google Scholar]
  51. Kelley, W.P. Permissible composition and concentration of irrigated waters. Proc. ASCF 1940, 66, 607. [Google Scholar]
  52. Wilcox, L.V. Classification and Use of Irrigation Waters; Circular 969; USDA: Washington, DC, USA, 1955.
  53. Freeze, R.A.; Cherry, J.A. Groundwater; Prentice Hall Inc.: Englewood Cliffs, NJ, USA, 1979. [Google Scholar]
  54. Sharma, K.; Raju, N.J.; Singh, N.; Sreekesh, S. Heavy metal pollution in groundwater of urban Delhi environs: Pollution indices and health risk assessment. Urban Clim. 2022, 45, 101233. [Google Scholar] [CrossRef]
  55. Lucke, T.; Drapper, D.; Hornbuckle, A. Urban stormwater characterization and nitrogen composition from lot-scale catchments—New management implications. Sci. Total Environ. 2018, 619–620, 65–71. [Google Scholar] [CrossRef] [PubMed]
  56. Gustafson, K.R.; Garcia-Chevesich, P.A.; Slinski, K.M.; Sharp, J.O.; McCray, J.E. Quantifying the effects of residential infill redevelopment on urban stormwater quality in denver, colorado. Water 2021, 13, 988. [Google Scholar] [CrossRef]
  57. Poudyal, S.; Cochrane, T.A.; Bello-Mendoza, R. Carpark pollutant yields from first flush stormwater runoff. Environ. Chall. 2021, 5, 100301. [Google Scholar] [CrossRef]
  58. Liao, Z.; Chu, J.; Luo, C.; Chen, H. Revealing the characteristics of dissolved organic matter in urban runoff at three typical regions via optical indices and molecular composition. J. Environ. Sci. 2021, 108, 8–21. [Google Scholar] [CrossRef]
  59. Hornig, S.; Bauerfeld, K.; Beier, M. Dynamization of Urban Runoff Pollution and Quantity. Water 2022, 14, 418. [Google Scholar] [CrossRef]
  60. Zhang, W.; Li, J.; Sun, H.; Che, W. Pollutant first flush identification and its implications for urban runoff pollution control: A roof and road runoff case study in Beijing, China. Water Sci. Technol. 2021, 83, 2829–2840. [Google Scholar] [CrossRef]
  61. Talebnejad, R.; Sepaskhah, A.R. Effect of different saline groundwater depths and irrigation water salinities on yield and water use of quinoa in lysimeter. Agric. Water Manag. 2015, 148, 177–188. [Google Scholar] [CrossRef]
  62. Surendran, U.; Sandeep, O.; Joseph, E.J. The impacts of magnetic treatment of irrigation water on plant, water and soil characteristics. Agric. Water Manag. 2016, 178, 21–29. [Google Scholar]
  63. Srivastava, S.; Vaddadi, S.; Kumar, P.; Sadistap, S. Design and development of reverse osmosis (RO) plant status monitoring system for early fault prediction and predictive maintenance. Appl. Water Sci. 2018, 8, 15. [Google Scholar] [CrossRef]
  64. Sathya, K.; Nagarajan, K.; Carlin Geor Malar, G.; Rajalakshmi, S.; Lakshmi, P.R. A comprehensive review on comparison among effluent treatment methods and modern methods of treatment of industrial wastewater effluent from different sources. Appl. Water Sci. 2022, 12, 70. [Google Scholar] [CrossRef]
  65. Sun, D.; Kyere, F.; Sampene, A.K.; Asante, D.; Yaa, N.; Kumah, G. An investigation on the role of electric vehicles in alleviating environmental pollution: Evidence from five leading economies. Environ. Sci. Pollut. Res. 2023, 30, 18244–18259. [Google Scholar] [CrossRef] [PubMed]
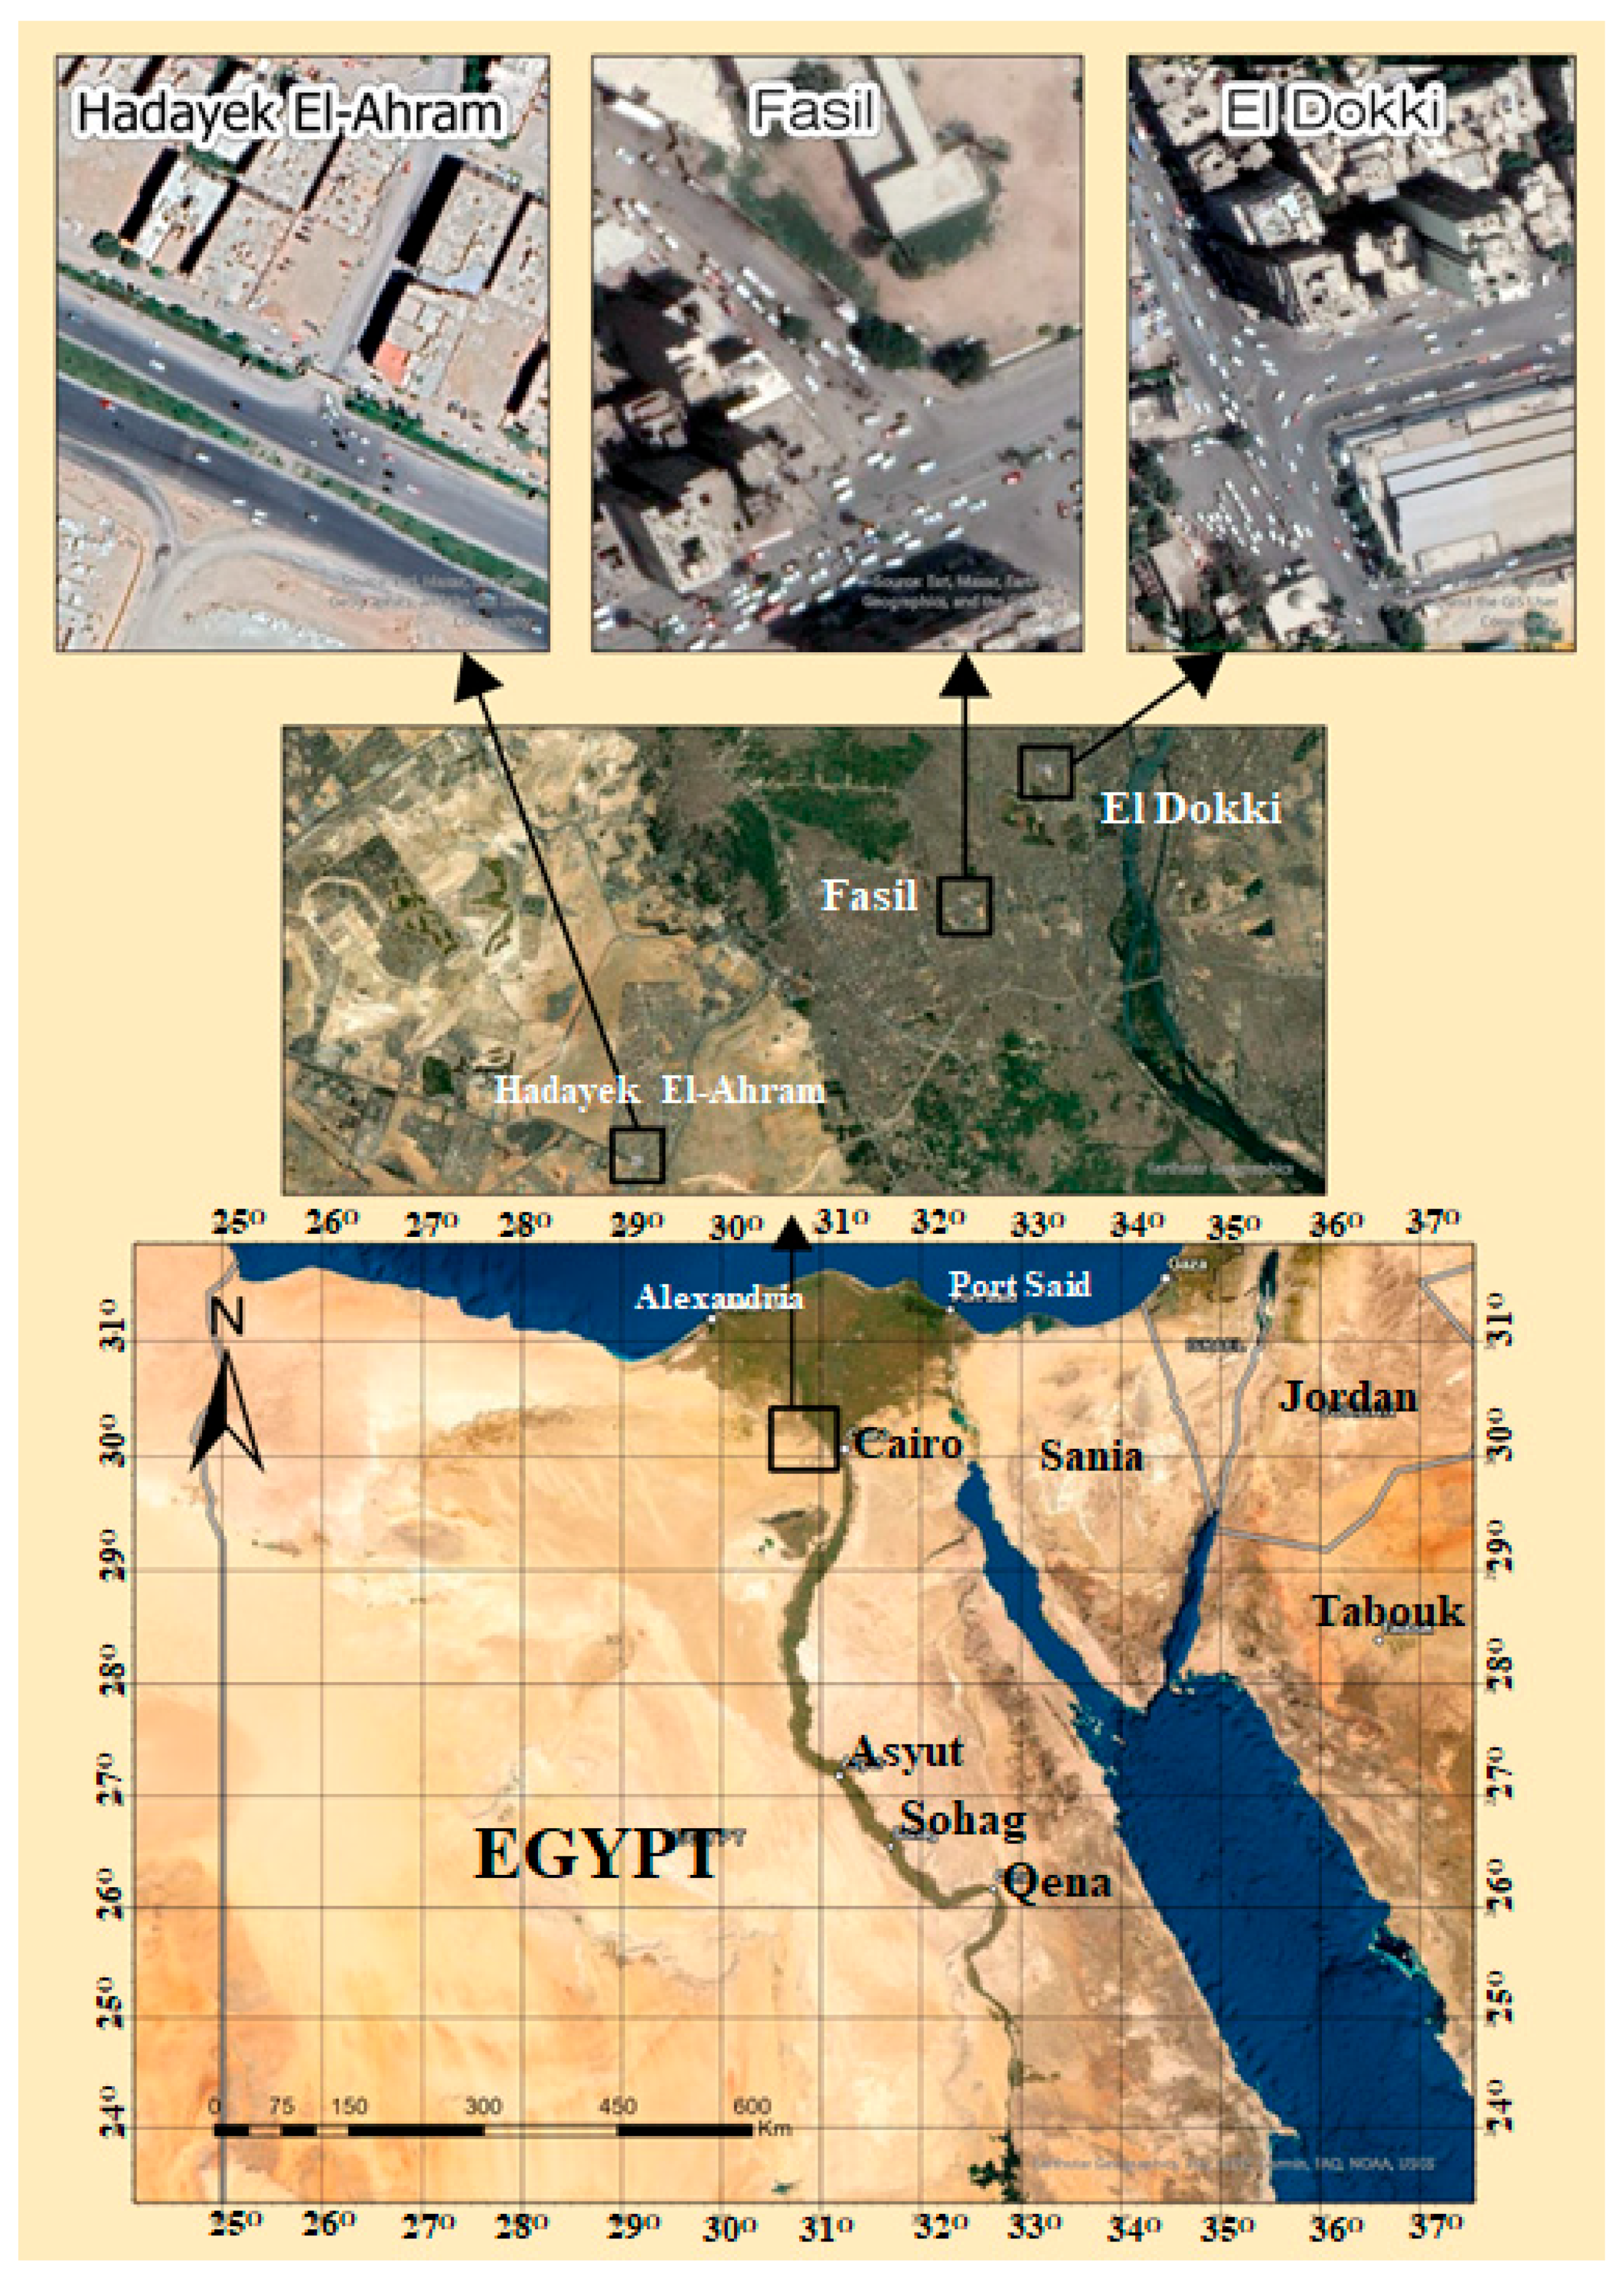
Figure 1. Map of the study area.
Sustainability 15 13927 g001
Figure 2. Average data of the rainfall depth and average temperature in 2021.
Sustainability 15 13927 g002
Figure 3. Locations of the stormwater sampling points A1 and A2, from Faisal Street; B1 and B2, from the El Dokki region; and C1 and C2, from the Hadayek El-Ahram region.
Sustainability 15 13927 g003
Figure 4. Variation between measured stormwater quality parameters, Egyptian water quality criteria (Egypt Decree [41,42]), and the MADT, (A) pH, (B) Ec, (C) HCO3, (D) Cl, (E) NH4, (F) SO4, (G) TSS, (H) TDS, (I) TN, (J) TP, (K) BOD, and (L) COD.
Sustainability 15 13927 g004aSustainability 15 13927 g004b
Figure 5. Variation between measured stormwater heavy metal concentrations, Egyptian water quality criteria [41,42], and the MADT, (A) Al, (B) Cr, (C) Cd, (D) Cu, (E) Fe, (F) Mn, (G) Ni, and (H) Zn.
Sustainability 15 13927 g005aSustainability 15 13927 g005b
Table 1. Main heavy metals caused by traffic actions [27,28].
Engine OilFuelTire WearBrake WearChassisRoad PaintSurface Wear for Road
Al X X X
CrXXXXXXX
CdXXXX
Fe XXX
Cu XX X
Mn XXXX
NiXXXX X
ZnXXXX X
Pb XXX XX
Table 2. Description of the measurement points, catchment area, type of surface, and monthly average daily traffic (MADT).
Points of MeasurementThe Catchment Area’s Size ( m 2 )Type of SurfaceMonthly Average Daily Traffic (MADT) (Cars)
Faisal10,476Housing area/Commercial area/Restaurants and parking service/Street/Asphalt47,950
El Dokki7566Housing area/Public station/Main street and commercial area/Street/Asphalt20,919
Hadayek El-Ahram9870Housing area/Main street/Asphalt and grass area27,064
Table 3. The relative weight of stormwater physicochemical parameters.
Water ParameterUnitwiWi (%)
pH_22.56
ECµs/cm22.56
NO3mg/L45.13
NH4mg/L45.13
SO4mg/L22.56
CO3mg/L22.56
HCO3mg/L22.56
Clmg/L22.56
BODmg/L45.13
CODmg/L45.13
TDSmg/L33.85
TSSmg/L33.85
TNmg/L33.85
TPmg/L33.85
Namg/L22.56
Kmg/L22.56
Mgmg/L22.56
Camg/L22.56
Almg/L33.85
Crmg/L33.85
Cdmg/L33.85
Femg/L33.85
Cumg/L33.85
Mnmg/L45.13
Nimg/L33.85
Znmg/L45.13
Pbmg/L45.13
Sum 78100
Wi is the relative weight of the ith parameter, and wi, is the weight of each parameter.
Table 4. Ranges of the water quality index for possible usage [37].
WQI ValueGrade of Water QualityPossible Usages
0–25ExcellentIrrigation, drinking, and industrial
25–50GoodIrrigation, domestic, and industrial
51–75PoorIrrigation and industrial
76–100Very poorIrrigation
101–150UnsuitableIrrigation is a restricted use
>150Unfit for drinkingBefore use, proper treatment is required
Table 5. Water quality indices for irrigation purposes.
Quality ParameterApplied FormulaReference
1SAR SAR = Na + ( Ca 2 + +   Mg 2 + ) / 2 (5)Richards [46]
2THTH = 2.497 Ca 2 + + 4.11 Mg 2 + (6)Todd [47]
3SSP SSP = Na 2 + + K 2 + Mg 2 + +   Na 2 +   + K 2 +   × 100(7)Eaton [48]
4RSBC RSBC = HCO 3 +   Ca 2 + (8)Doneen [49]
5PI PI = Na + + HCO 3 Ca 2 + +   Mg 2 + +   Na + × 100 (9)Raghaunth [50]
6MAR MAR = Mg 2 + Mg 2 +   Ca 2 + × 100 (10)Raghaunth [50]
7KR KR = Na + Mg 2 +   Ca 2 + × 100 (11)Kelley [51]
Table 6. Indices for the stormwater classification of suitability for irrigation uses.
IndicesRangeRankingReference
SAR<10 mg/L
10–18 mg/L
18–26 mg/L
<26 mg/L
Excellent
Good
Doubtful
Unsuitable
Richards [46]
EC<250 μs/cm
250–750 μs/cm
750–2250 μs/cm
2250–5000 μs/cm
>5000 μs/cm
Excellent
Good
Permissible
Doubtful
Unsuitable
Wilcox [52]
TH0–75 mg/L
75–150 mg/L
150–300 mg/L
Soft
Moderately hard
Hard
Todd [47]
TDS0–1000 mg/LFreshwaterFreeze [53]
RSBC<5 meq/L
5–10 meq/L
>10 meq/L
Safe
Marginal
Unsatisfactory
Doneen [49]
SSP<20 mg/L
40–80 mg/L
<80 mg/L
Excellent
Good
Fair/permissible
Poor
Eaton [48]
MAR<50 mg/L
<50 mg/L
Excellent
Harmful for soil
Raghaunth [50]
KR<1
>1
Suitable
Excess level
Kelley [51]
PI>75%
<25%
Good for irrigation unsuitableRaghaunth [50]
Table 7. Statistical analysis for the measured stormwater quality parameters in light of WHO and Egyptian water quality standards.
Water ParameterUnitA1A2B1B2C1C2Max.Min.S.D.AverageWHO [43]Egypt Decree [41,42]
pH_7.636.636.9466.236.227.6366.60.66.5–8.47.5
ECµs/cm515612297289421458612289432.0114.65001000
NO3mg/L00000000005045
NH4mg/L1.171.171.171.171.171.171.171.171.200.50.5
SO4mg/L250259200200300259300200244.735.3250250
CO3mg/L0000000000N.D.300
HCO3mg/L140.23139.1148.9140.12140.2139.12148.9139.1141.33.4500500
Clmg/L39.2539.23630.339.339.239.330.337.23.3250250
BODmg/L403825264545452536.58.266
CODmg/L5059.749.238.510010010038.566.224.71010
TDSmg/L329.6320.15190189269.44250.3329.6189258.155.65001000
TSSmg/L817750200200790759817200586.0273.8800800
TNmg/L1.21.171.171.171.171.171.21.171.20.03.53.5
TPmg/L5.024.994.554.0266.126.124.025.10.722
Namg/L90.0391.2119.2290.167070119.227088.416.5200200
Kmg/L43.1550.1247.0245.1639.1352.152.139.1346.14.31212
Mgmg/L46.2540.2350.0448.1240.2550.1950.1940.2345.84.23030
Camg/L588.41520.19410.03380.03425429.13588.41380.03458.872.17575
Almg/L13.8312.64.2547.28.3313.8348.43.80.20.2
Crmg/L0.990.990.040.110.850.860.990.040.60.40.10.05
Cdmg/L0.040.020.040.040.30.0020.30.0020.10.10.010.003
Femg/L7.66.237.28.26.235.998.25.996.90.80.30.3
Cumg/L1.821.8221.011.251211.50.40.050.05
Mnmg/L0.330.390.370.330.241.391.390.240.50.40.50.4
Nimg/L0.020.01000.010.0020.0200.00.00.20.02
Znmg/L3.913.443.032.453.343.843.912.453.30.50.13
Pbmg/L000000.120.120000.20.01
N.D., not detected; Max., maximum; Min., minimum; S.D., standard deviation; A1, Faisal—A1; A2, Faisal—A2; B1, El Dokki—B1; B2, El Dokki—B2; C1, Hadayek E.—C1; and C2, Hadayek E.—C2.
Table 8. WQI results for the studied regions.
SampleWQIGrade of Water QualityUses
A1776Unfit for drinkingBefore use, proper treatment is required
A2708Unfit for drinkingBefore use, proper treatment is required
B1499Unfit for drinkingBefore use, proper treatment is required
B2426Unfit for drinkingBefore use, proper treatment is required
C1929Unfit for drinkingBefore use, proper treatment is required
C2626Unfit for drinkingBefore use, proper treatment is required
Table 9. Stormwater irrigation indices’ result for the collected samples.
SampleEC
(µs/cm)
TDS
(mg/L)
SAR
(mg/L)
TH
(mg/L)
RSBC
(meq/L)
SSP (%)KR (%)MAR
(mg/L)
PI (%)
A1515329.65.11659.331.717.314.27.314.1
A2612320.25.41464.328.220.116.37.215.8
B1297190.07.91229.522.926.525.910.922.7
B2289189.06.21146.721.324.021.111.219.7
C1421269.44.61226.723.519.015.08.715.3
C2458250.34.51277.823.720.314.610.514.9
Table 10. Studied physio-chemical parameters with WQI correlation matrix.
pHSO4HCO3ClBODCODTDSTSSNaKMgCaAlCrCdFeCuMnZnWQI
pH1.00
SO4−0.071.00
HCO30.30−0.571.00
Cl0.400.78−0.211.00
BOD−0.010.93−0.650.811.00
COD−0.390.80−0.350.620.821.00
TDS0.500.67−0.560.760.690.201.00
TSS0.220.89−0.650.870.950.620.881.00
Na0.46−0.770.83−0.35−0.83−0.76−0.36−0.691.00
K−0.12−0.28−0.030.06−0.060.00−0.06−0.060.121.00
Mg0.05−0.690.44−0.41−0.44−0.24−0.62−0.540.340.401.00
Ca0.800.33−0.300.600.39−0.150.900.65−0.01−0.03−0.341.00
Al0.600.51−0.510.700.590.060.970.81−0.250.09−0.450.951.00
Cr0.240.84−0.690.830.900.530.930.99−0.640.02−0.570.710.871.00
Cd−0.250.63−0.070.210.370.500.060.26−0.41−0.80−0.59−0.20−0.170.161.00
Fe0.23−0.740.25−0.77−0.73−0.84−0.38−0.640.49−0.310.39−0.05−0.28−0.61−0.261.00
Cu0.80−0.170.560.31−0.27−0.450.32−0.020.730.00−0.140.560.380.02−0.200.071.00
Mn−0.280.11−0.250.250.400.54−0.060.24−0.420.710.50−0.160.020.22−0.41−0.48−0.461.00
Zn0.510.62−0.320.900.790.500.760.86−0.390.18−0.120.700.780.83−0.07−0.570.200.451.00
WQI0.180.94−0.420.760.810.600.730.84−0.58−0.53−0.750.470.560.790.71−0.530.06−0.190.581.00
Sustainability 15 13927 i001 Positive correlation Sustainability 15 13927 i002 negative correlation.
Disclaimer/Publisher’s Note: The statements, opinions and data contained in all publications are solely those of the individual author(s) and contributor(s) and not of MDPI and/or the editor(s). MDPI and/or the editor(s) disclaim responsibility for any injury to people or property resulting from any ideas, methods, instructions or products referred to in the content.