1. Introduction
The amount of energy that is consumed in residential buildings is affected by several factors [
1]. Firstly, there are a variety of environmental factors that have demonstrated effects on the energy balance of buildings [
2,
3]. Research has revealed that energy consumption is largely influenced by the climate conditions that the buildings are in [
4]. Specifically, outside temperatures [
5] and climate zones (i.e., geographical location) [
6] significantly affect energy needs and usage. Energy demands and consumption purposes vary greatly across different geographical locations [
7]. In colder locations, more energy is used for heating, whereas warmer locations need more energy for cooling. Secondly, building attributes, such as house size and age, number of rooms, building insulation, and construction materials, have been shown to be systematically related to the energy consumption of residential buildings [
7]. Thirdly, the number and type of appliances significantly impact households’ energy use [
8]. Fourthly, household characteristics such as the number of family members and residents’ income are positively correlated with buildings’ energy consumption [
6].
In this mix of factors that determine the energy balance of residential homes, human behavior plays a pivotal role as several of the known factors related to residential energy use have a behavioral component [
9,
10,
11]. For example, previous research has demonstrated relationships between residents’ energy consumption and their attitudes [
12], value orientation [
13,
14], and reasoning [
15,
16]. This study set out to contribute to the literature on socio-technical systems by focusing on a behavior that greatly affects the energy balance of residential homes: the selection of temperature setpoints. Thermostat setpoints are an important factor of household energy consumption and have been shown to determine, under certain weather conditions, up to 30% of the energy use in households [
17]. Adding to previous studies on temperature choices that focused on psychological constructs such as residents’ attitudes and environmental values, the current study aimed to explore effects of the characteristics of thermostat scales on setpoint choices.
Building on research on the role of anchoring as a communicative-cognitive mechanism that can alter perceptions, judgments, and sustainable behaviors, we aimed to explore possible effects of thermostat anchors—that is, the characteristics of a thermostat that can serve as an anchor—on the selection of temperature setpoints. The scale-dependency hypothesis predicts that choices of temperature setpoints are not scale-invariant but are affected by the characteristics of the used temperature scale such as the midpoint, range, and increment of a thermostat and its displayed current temperature.
In the following, we describe some general findings on anchoring effects in the domain of environmental decision making, including temperature-related anchoring effects. Different from classic studies on anchoring, thermostats potentially offer various anchors that can be utilized by thermostat users, thus, inviting questions about the role of multiple anchors in environmental decision making. Next, we describe a study that had the goal of testing for the independent and combined effects of potential thermostat anchors including the midpoint, range, and increment of the scale on the selection of setpoints for indoor temperatures. We conclude with a discussion of the limitations of the presented study and questions for future research.
2. Anchoring Effects: Environmental Judgments, Temperature Anchors, and Multiple Anchors
Human judgment and estimation processes often start with an anchor. Anchors provide an initial value that can be used as a default and direct, alter, or limit processing of subsequent information. Anchors have been shown to affect experts’ estimations of house prices [
18], influence negotiation outcomes [
19,
20], impact consumers’ willingness to pay [
21], sway decision making among judges [
22], and alter numerical estimates [
23].
Anchor effects have been observed in judgments related to the environment and in sustainable behavior in various contexts. For example, previous findings have suggested positive anchoring effects of the start of bids and the prices passengers are willing to pay for their airplane tickets [
24]. When the start bid or the airfare was high, it was much more likely that consumers’ bids fell in a higher bid interval as well. According to the authors, these anchoring effects joined the positive effects of passengers’ perceptions of the effectiveness of a proposed carbon travel tax and their perceived responsibility to prevent climate change to influence high willingness to pay for the presented bid. As a second example, Andersson et al. [
25] demonstrated effects of anchors and normative messages on people’s willingness to travel for longer periods of time to reduce carbon dioxide (CO
2) emissions. The authors found that participants who were assigned to a condition with a high anchor (8 h and 30 min of travel) and a normative message on CO
2 emissions (a prompt stating a target for reducing CO
2 emissions) were willing to travel for longer compared to participants in conditions of low anchors (5 h and 30 min of travel) and no normative messages.
Anchoring does not necessarily impair judgments but can also be used to increase the accuracy of judgments under certain circumstances and can facilitate efficient judgments to the extent that a provided anchor is accurate. Bosetti et al. [
26] reported anchoring effects of prior beliefs regarding conditional probabilities. The authors showed how a specific format of presenting scientific information to policy makers (a model estimate plus statistical range) positively affected their likelihood of accurately reporting conditional probabilities closer to scientific evidence.
We set out to explore anchoring effects in the use of temperature scales. Multiple potential anchors such as the current temperature that is displayed on a thermostat and the midpoint of the scale can serve as anchors. It is plausible to assume that each of these thermostat features may affect the setpoints that consumers select. Previous studies have shown that temperature cues have anchoring effects on consumers’ service evaluation, such as cues related to high (vs. low) outside temperatures influencing consumers’ assessment of a free night’s accommodation as high-value (vs. low-value) [
27]. Joireman et al. [
28] found that participants tended to express more concern about global warming and willingness to pay to reduce it when they were presented with a condition of high future increases in temperature compared to a condition of low future increases in temperature. A temperature display in the form of a scale provides visual cues (e.g., the middle of scale) as well as numbers that can serve as an anchor (see Bae & Koo, [
29], for a combination of visual and text-based cues). Typically, anchors are provided in the form of numbers. However, anchors can also have an effect when provided through visuals [
30].
Anchors have also been related to scales in the past: Székely and Weinmann [
31] showed how high-default values on a scale of optional donations toward carbon offset payments on an online flight-booking platform resulted in higher payments compared to low-default values. Thermostat scales provide several numbers that could be used by residents as anchors. Some studies looked into multiple anchors. Bahník et al. [
32] showed how an anchor is influenced by previous anchoring in a phenomenon known as sequential anchoring. Their findings suggest that the second anchor appears to influence the aimed judgment more than the first anchor. As shown by Lin and Chen [
33], consumers use multiple anchors when evaluating a supplementary product when the purchase of a focal product has been made. In their study, the internal reference price (i.e., the price a consumer considered worthwhile and willing to pay for a product) was the main anchor and the criterion to decide if other anchors should be considered.
Based on these previous studies on anchoring effects in the domain of environmental decision making, including studies on multiple anchors, we expected that the choice of a setpoint on a thermostat may not be invariant across features of the scale that is used but may be affected by thermostat features such as the midpoint, range, and increment of the scale as well as the current temperature. Each of these characteristics can potentially serve as an anchor when selecting a setpoint temperature, including situations in which a thermostat user makes a decision as to whether to retain the current temperature and to pick it as a setpoint or to change the current temperature and setpoint. The scale-dependency hypothesis predicts that the temperature setpoints that are chosen by residents are not scale-invariant but are systematically affected by characteristics of the scale. To test the scale-dependency hypothesis, a study was conducted in which participants were asked to select a variety of setpoints in a simulated environment.
3. Methods
3.1. Participants
Using Prolific Academic [
34,
35,
36], a sample of 404 participants was recruited for this study. The sample comprised adult U.S. residents with a 99% or higher approval rate [
37]. Participants received USD 2.4 in compensation for their participation. After excluding incomplete responses and participants who failed the attention checks, the final sample included 384 responses (55.5% female, 44.5% male;
Mage = 41.21 years,
SDage = 13.48 years).
3.2. Procedure and Design
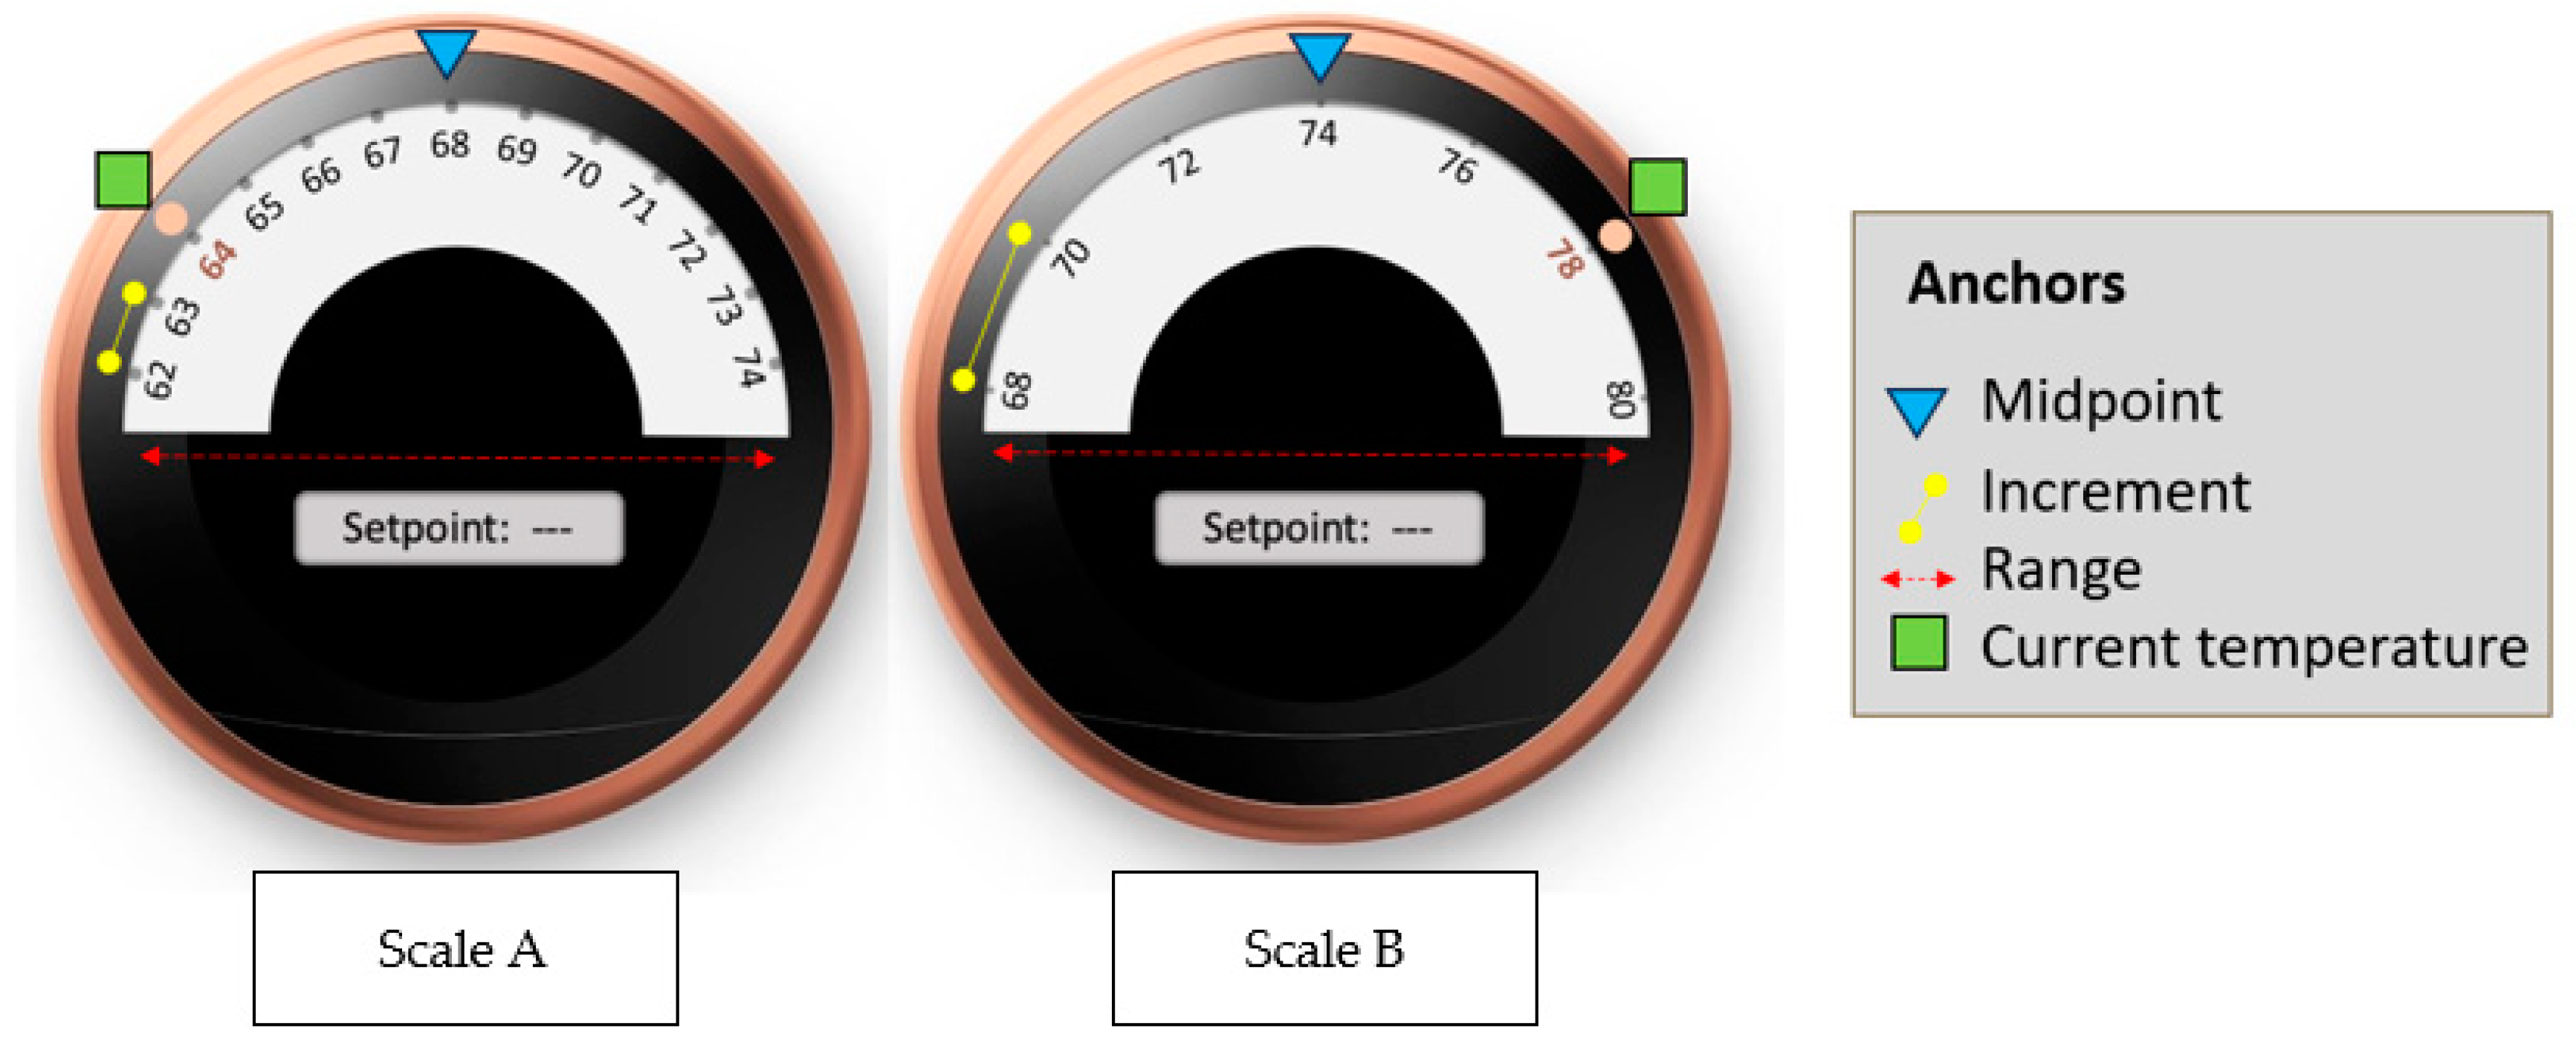
Participants were asked to imagine that they were working as a manager of a residential apartment complex and had to select in this function a setpoint temperature for incoming residents. For each apartment, they saw a visual display that showed the current temperature (see
Figure 1). Their task consisted in selecting a setpoint that would make the incoming tenants feel comfortable. After reading the description of each incoming tenant, participants interacted with the temperature scale to choose a setpoint temperature they deemed appropriate.
Participants were randomly assigned to one of 25 different scale conditions that systematically differed in the following temperature scale properties: (1) the midpoint, (2) the range, (3) the increment between marks, and (4) the current temperature (see
Table 1 for a systematic overview).
Participants completed the temperature selection task for seven different potential tenants. Current temperatures varied across the descriptions of incoming tenants (see
Table 1 for details). As the main dependent variable, the selected setpoints were measured and analyzed across variations of the scale characteristics that served as independent variables of the experiment.
3.3. Materials and Measures
Participants were asked to imagine that they were managers of an apartment complex including a four-story building that was home to 56 households with 40 one-bed units and 9 two-bed units. The apartment complex was newly built and the focus of several studies exploring effects of socio-technical aspects of energy-conserving behaviors of which this study was a part (see [
38] for details). Participants were shown a picture of the apartment complex, were provided with a short video tour guiding them through an apartment, and were shown a floor map.
They were told that in less than a week, they would be welcoming several tenants as their new residents for one-bedroom apartments in the building. In preparation for the new residents’ move-in days, they were asked to set an optimal temperature for each apartment to have the incoming resident(s) of that apartment feel at home from the moment they enter their apartment. Their task consisted in choosing an optimal temperature for each household. Tenants included a 27-year-old graduate student, a 36-year-old artificial intelligence developer, a healthcare worker of 50 years old, a delivery worker, and a couple from California. Each future tenant was described in a short paragraph. For example, the description of the graduate student read:
“Resident 1. Justin, 27, is a graduate student from Texas A&M. He is moving to Indiana for his research project. It is his first time in Indiana, as well as his first-time leaving Texas. He will be involved in field research about heavy water and related health risks. As he needs to collect data and run experiments in a lab, he will be staying outside of his apartment most of the day. He will be moving in on the first move-in date, Monday.”
For each of the seven tenants, participants were asked to indicate whether or not they would like to retain the current temperature as the setpoint. If they answered no, a follow-up question was provided, asking Which temperature would you select for Justin, a graduate student?, where [Justin, a graduate student] was replaced by the respective tenant moving in other tasks.
Figure 1 provides examples of two scales that were used in the study, and
Table 1 provides a systematic overview of the characteristics of the scales that were utilized in the experiment. The scales systematically varied in the chosen midpoint (with values of 68, 70, 72, 74, or 76 °F), range (set at 7 or 13), and increment (at 1 or 2). Concurrently, the current temperature was manipulated as a within-subjects factor by systematically varying the temperature across the seven different tasks following the description in
Table 1.
Each row in
Table 1 corresponds to a scale that was presented with seven different current temperatures to participants that were assigned the respective scale. The numerals highlighted in bold within each set denote the specific current temperature markings on the scales provided to participants. For example, if a participant was assigned the set 1-1, their scale had a range of 13 marks and a midpoint of 68 °F. In each of the seven tasks, the scale exhibited a distinct current temperature marking of 62, 64, 66, 68, 70, 72, or 74 °F. The order in which the tasks were presented was randomized for each participant.
In addition to the selected setpoint for each tenant, demographic variables including participants’ age, gender, income, and education were ascertained at the end of the study, as well as participants’ generally preferred indoor temperature in winter and summer and their environmental value orientation. The survey also included two attention check items.
4. Results
The overall average setpoint that was selected by participants was
M = 71.57 °F (
SD = 2.32, with a range from 64 to 78 °F). To test for possible effects of the current temperature and the midpoint of the scale, a MANOVA was conducted with the within-subjects factor
current temperature and the between-subjects factor
midpoint temperature, which varied from 68 to 76 °F (see the five sets in
Table 1). The factor
current temperature had seven levels, where the lowest and highest temperatures differed by at least six degrees Fahrenheit (see
Table 1 for details).
The analysis revealed that both factors, the midpoint and current temperature, systematically and independently affected the setpoint that was selected for incoming residents. As is displayed in
Figure 2 (also see
Table 2), the midpoint of the provided scale affected the setpoint such that larger midpoints resulted in larger selected setpoint temperatures as expected (main effect
midpoint,
F(4,379) = 26.56;
p < 0.01).
Scales that had a midpoint of 68 °F yielded an average setpoint of M = 70.27 °F (SD = 2.18), whereas scales with a midpoint of 76 °F yielded an average setpoint of M = 73.21 °F (SD = 2.1).
The selected setpoint was also systematically affected by the current temperature, with higher current temperatures yielding higher selected setpoints (main effect
current temperature,
F(6,379) = 24.44;
p < 0.01; see
Table 3 and
Figure 3). The effects of the midpoint and current temperature did not interact in a substantial way, suggesting that the effects were independent of each other (interaction
midpoint ×
current temperature:
F(24,379) = 1.06;
p = 0.38).
Whereas the analysis of the effects of the midpoint and current temperature included all scales and judgments, for the test of possible effects of the used range and increment, specific conditions were compared. These conditions were included in the design of the study for the purpose of testing for range and increment effects. Within each of the five midpoints in
Table 1 (Set 1-x to 5-x), two conditions only differed in their range (Sets 4 and 5 within each midpoint set), and two sets only differed in their increment (Sets 1 and 3). For example, Set 1-4 and Set 1-5 have the same seven current temperatures of 65, 66, 67, 68, 69, 70, and 71 °F. However, the scales differ in that the range of the scale in Set 1-5 goes from 62 to 74 °F, whereas the range of Set 1-4 is restricted to 65–71 °F. To the extent that participants choose more extreme (higher and lower) degrees when the range of a scale is larger (Sets 1-5, 2-5, 3-5, 4-5, and 5-5), we expected that the absolute difference of their chosen setpoints from the current setpoint would be larger when the range is large than in conditions in which the range is narrow (as in Sets 1-4, 2-4, 3-4, 4-4, and 5-4, respectively). Accordingly, a MANOVA including the factors
current temperature,
midpoint, and
range (small vs. large) with the absolute difference between the chosen setpoint and the current temperature yielded a main effect of
range (
F(1,145) = 5.36;
p = 0.02). On average, participants’ selected setpoints deviated more from the current temperature when the range was large (
M = 2.77;
SD = 1.50) than when it was small (
M = 2.28;
SD = 1.29).
Deviations of the selected temperature from the current temperature also provide a way of seeing whether the increment of a scale affects the selection of temperatures. Systematic comparisons of Sets 1-1, 2-1, 3-1, 4-1, and 5-1 with Sets 1-3, 2-3, 3-3, 4-3, and 5-3 revealed no substantial effects related to differences in the increment of the scales (F(1,140) = 0.12; p = 0.73). Participants’ selected setpoints did not significantly deviate more from the current temperature when the scale used increments of 2 °F (M = 3.24; SD = 1.46) than when it used increments of 1 °F (M = 3.31; SD = 1.24).
5. Discussion
The study provides support for the scale-dependency hypothesis: As expected, setpoint choices were not invariant across different temperature scales. Instead, the selected temperatures were systematically affected by the current temperature that was displayed as well as the midpoint and range of the provided scales. Anchoring effects have been explained by various processes (see Epley & Gilovich [
39]; Röseler et al. [
23]). Among others, the literature described anchoring effects as an anchoring and under-adjustment process where judges start with an anchor and process additional information in such a way that information processing is stopped once a plausible and acceptable judgment is reached. Alternatively, judges may search for information confirming their initial anchor-related hypothesis. Both processes can possibly explain the reported anchoring effects of thermostats. It would be helpful to delineate in future research which processes participants employ when choosing temperature setpoints. Moreover, as in other preference-related domains, it seems intuitive to assume that consumers may influence each other. Thus, it would be valuable to include social cues as anchors as well.
The study has several limitations that suggest future research opportunities. Participants chose temperatures for tenants in vignette-based scenarios. As with other studies using vignettes, it is important to replicate the observed findings by studying actual thermostat choices in residential homes. Relatedly, in the current study, participants were asked to select temperature setpoints for incoming tenants. Even though this is a scenario that can be extrapolated to various situations, including the selection of temperature setpoints in hotels and office buildings in which employees choose setpoints for others, future research may test if the observed anchor effects also hold when participants choose temperature setpoints for themselves. Even though participants may be guided more strongly by a general preference for a specific setpoint, thermostat characteristics may well affect setpoint temperatures also when individuals select temperatures for themselves across different seasons (e.g., winter vs. summer), across different times of the day (daytime vs. nighttime) and while they are at home or away. Temperature settings typically vary across these situations, providing room for anchoring effects.
It would be interesting to learn in which order thermostat users typically process information. One possible sequence in which participants may process the provided anchors may start with the current temperature. If the current temperature is plausible, the information search may stop, and the current temperature may not be changed. The decision as to whether the current temperature is acceptable or not may depend on participants’ internal anchor (that is, the temperature they prefer in similar circumstances) and the midpoint of the scale. In situations in which the current temperature is perceived as being not acceptable, the midpoint may serve as a new anchor. The range may guide the set of plausible setpoints in that participants only choose a setpoint outside the provided range if the range is perceived as being too narrow.
More research is needed to test for the robustness of the identified anchor effects across various settings, including situations in which judges select setpoints for themselves and to identify the cognitive processes that yield the observed anchor effects. To the extent that the observed novel anchor effects in this study generalize across other thermostats, scenarios, and users, they provide guidance for communicative–cognitive design principles that can affect environmental judgments and sustainable behavior.
6. Conclusions
A significant factor in the energy balance of residential homes is the energy-saving behaviors of its residents [
13,
14,
38,
40]. While energy demands can greatly vary across seasons and geographical locations, heating and cooling determine a large percentage of energy use in households [
4,
5,
6]. One consequential behavior is the selection of temperature setpoints for thermostats [
38], which can strongly affect the energy balance of residential homes by determining, under certain conditions, up to 30% of the energy use [
17].
Due to the large number of private households, even slight changes in household temperatures have a significant impact on emissions. Sperber et al. [
41] looked at the effects of lowering setpoint temperatures on CO
2 emissions and gas consumption in single-family houses in Germany. Their calculations suggest that reducing temperature setpoints by 2 to 4 °C could save 14 to 30 Terawatt-hour per year (TWh/a) of natural gas and induce CO
2 savings of 3 to 6 Metric tons per year (Mt/a).
The presented study adds to the existing literature showing that the selection of setpoints by residents can be influenced through feedback and smart socio-technical systems [
38]. Drawing upon the literature on anchoring in judgment and decision making, this study found independent effects of the current temperature as well as the midpoint and range of the used thermostat scale on the selected temperature setpoints. Future research may test if the effects generalize across situations in which residents choose temperatures at different times of the day and under various outside temperature conditions as well as delineating the underlying cognitive processes of the described anchoring effects.
Author Contributions
Conceptualization, T.R.; Methodology, T.R., J.O. and H.B.; Formal analysis, T.R.; Data curation, J.O. and J.P.L.-R.; Writing—original draft, T.R. and J.P.L.-R.; Writing—review & editing, T.R. and J.O.; Supervision, T.R.; Funding acquisition, T.R. All authors have read and agreed to the published version of the manuscript.
Funding
This work was supported by the National Science Foundation under Grant NSF1737591 to Torsten Reimer.
Institutional Review Board Statement
The study was conducted in accordance with the Declaration of Helsinki and approved by the Institutional Review Board of Purdue University (protocol code IRB-2021-1349).
Informed Consent Statement
Informed consent was obtained from all participants involved in the study.
Data Availability Statement
The data presented in this study are available on request from the corresponding author.
Conflicts of Interest
The authors report there is no competing interest to declare.
References
- Rafsanjani, H.N. Factors Influencing the Energy Consumption of Residential Buildings: A Review. In Proceedings of the Construction Research Congress 2016, San Juan, Puerto Rico, 31 May–2 June 2016; American Society of Civil Engineers: Reston, VA, USA, 2016; pp. 1133–1142. [Google Scholar]
- Campagna, L.M.; Fiorito, F. On the Impact of Climate Change on Building Energy Consumptions: A Meta-Analysis. Energies 2022, 15, 354. [Google Scholar] [CrossRef]
- Huang, J.; Gurney, K.R. The Variation of Climate Change Impact on Building Energy Consumption to Building Type and Spatiotemporal Scale. Energy 2016, 111, 137–153. [Google Scholar] [CrossRef]
- Li, X.; Deng, Q.; Ren, Z.; Shan, X.; Yang, G. Parametric Study on Residential Passive House Building in Different Chinese Climate Zones. Sustainability 2021, 13, 4416. [Google Scholar] [CrossRef]
- Fumo, N.; Rafe Biswas, M.A. Regression Analysis for Prediction of Residential Energy Consumption. Renew. Sustain. Energy Rev. 2015, 47, 332–343. [Google Scholar] [CrossRef]
- Debs, L.; Metzinger, J. A Comparison of Energy Consumption in American Homes by Climate Region. Buildings 2022, 12, 82. [Google Scholar] [CrossRef]
- Kuang, B.; Schelly, C.; Ou, G.; Sahraei-Ardakani, M.; Tiwari, S.; Chen, J. Data-Driven Analysis of Influential Factors on Residential Energy End-Use in the US. J. Build. Eng. 2023, 75, 106947. [Google Scholar] [CrossRef]
- McKenna, E.; Few, J.; Webborn, E.; Anderson, B.; Elam, S.; Shipworth, D.; Cooper, A.; Pullinger, M.; Oreszczyn, T. Explaining Daily Energy Demand in British Housing Using Linked Smart Meter and Socio-Technical Data in a Bottom-up Statistical Model. Energy Build. 2022, 258, 111845. [Google Scholar] [CrossRef]
- Jain, R.K.; Taylor, J.E.; Culligan, P.J. Investigating the Impact Eco-Feedback Information Representation Has on Building Occupant Energy Consumption Behavior and Savings. Energy Build. 2013, 64, 408–414. [Google Scholar] [CrossRef]
- Alymani, M.; Mengash, H.A.; Aljebreen, M.; Alasmari, N.; Allafi, R.; Alshahrani, H.; Elfaki, M.A.; Hamza, M.A.; Abdelmageed, A.A. Sustainable Residential Building Energy Consumption Forecasting for Smart Cities Using Optimal Weighted Voting Ensemble Learning. Sustain. Energy Technol. Assess. 2023, 57, 103271. [Google Scholar] [CrossRef]
- Venturi, E.; Ochs, F.; Dermentzis, G. Identifying the Influence of User Behaviour on Building Energy Consumption Based on Model-Based Analysis of in-Situ Monitoring Data. J. Build. Eng. 2023, 64, 105717. [Google Scholar] [CrossRef]
- Gârdan, I.P.; Micu, A.; Paștiu, C.A.; Micu, A.E.; Gârdan, D.A. Consumers’ Attitude towards Renewable Energy in the Context of the Energy Crisis. Energies 2023, 16, 676. [Google Scholar] [CrossRef]
- Loaiza-Ramírez, J.P.; Reimer, T.; Moreno-Mantilla, C.E. Who Prefers Renewable Energy? A Moderated Mediation Model Including Perceived Comfort and Consumers’ Protected Values in Green Energy Adoption and Willingness to Pay a Premium. Energy Res. Soc. Sci. 2022, 91, 102753. [Google Scholar] [CrossRef]
- Loaiza-Ramírez, J.P.; Moreno-Mantilla, C.E.; Reimer, T. Do Consumers Care about Companies’ Efforts in Greening Supply Chains? Analyzing the Role of Protected Values and the Halo Effect in Product Evaluation. Clean. Logist. Supply Chain 2022, 3, 100027. [Google Scholar] [CrossRef]
- Holmgren, M.; Kabanshi, A.; Langeborg, L.; Barthel, S.; Colding, J.; Eriksson, O.; Sörqvist, P. Deceptive Sustainability: Cognitive Bias in People’s Judgment of the Benefits of CO2 Emission Cuts. J. Environ. Psychol. 2019, 64, 48–55. [Google Scholar] [CrossRef]
- Sörqvist, P.; MacCutcheon, D.; Holmgren, M.; Haga, A.; Västfjäll, D. Moral Spillover in Carbon Offset Judgments. Front. Psychol. 2022, 13, 957252. [Google Scholar] [CrossRef] [PubMed]
- Ghahramani, A.; Zhang, K.; Dutta, K.; Yang, Z.; Becerik-Gerber, B. Energy Savings from Temperature Setpoints and Deadband: Quantifying the Influence of Building and System Properties on Savings. Appl. Energy 2016, 165, 930–942. [Google Scholar] [CrossRef]
- Northcraft, G.B.; Neale, M.A. Experts, Amateurs, and Real Estate: An Anchoring-and-Adjustment Perspective on Property Pricing Decisions. Organ. Behav. Hum. Decis. Process 1987, 39, 84–97. [Google Scholar] [CrossRef]
- Bystranowski, P.; Janik, B.; Próchnicki, M.; Skórska, P. Anchoring Effect in Legal Decision-Making: A Meta-Analysis. Law Hum. Behav. 2021, 45, 1–23. [Google Scholar] [CrossRef] [PubMed]
- Orr, D.; Guthrie, C. Anchoring, Information, Expertise, and Negotiation: New Insights from Meta-Analysis. Ohio State J. Disput. Resolut. 2006, 21, 597–628. [Google Scholar]
- Li, L.; Maniadis, Z.; Sedikides, C. Anchoring in Economics: A Meta-Analysis of Studies on Willingness-to-Pay and Willingness-to-Accept. J. Behav. Exp. Econ. 2021, 90, 101629. [Google Scholar] [CrossRef]
- Englich, B.; Mussweiler, T.; Strack, F. Playing Dice with Criminal Sentences: The Influence of Irrelevant Anchors on Experts’ Judicial Decision Making. Pers. Soc. Psychol. Bull. 2006, 32, 188–200. [Google Scholar] [CrossRef]
- Röseler, L.; Schütz, A. Hanging the Anchor off a New Ship: A Meta-Analysis of Anchoring Effects. PsyArXiv Prepr. 2022, 1–54. [Google Scholar] [CrossRef]
- Brouwer, R.; Brander, L.; Van Beukering, P. “A Convenient Truth”: Air Travel Passengers’ Willingness to Pay to Offset Their CO2 Emissions. Clim. Chang. 2008, 90, 299–313. [Google Scholar] [CrossRef]
- Andersson, H.; Ahonen-Jonnarth, U.; Holmgren, M.; Marsh, J.E.; Wallhagen, M.; Bökman, F. What Influences People’s Tradeoff Decisions between CO2 Emissions and Travel Time? An Experiment with Anchors and Normative Messages. Front. Psychol. 2021, 12, 702398. [Google Scholar] [CrossRef] [PubMed]
- Bosetti, V.; Weber, E.; Berger, L.; Budescu, D.V.; Liu, N.; Tavoni, M. COP21 Climate Negotiators’ Responses to Climate Model Forecasts. Nat. Clim. Chang. 2017, 7, 185–190. [Google Scholar] [CrossRef]
- Barbera, M.; Northey, G.; Septianto, F.; Spanjaard, D. Those Prices Are HOT! How Temperature-Related Visual Cues Anchor Expectations of Price and Value. J. Retail. Consum. Serv. 2018, 44, 178–181. [Google Scholar] [CrossRef]
- Joireman, J.; Barnes Truelove, H.; Duell, B. Effect of Outdoor Temperature, Heat Primes and Anchoring on Belief in Global Warming. J. Environ. Psychol. 2010, 30, 358–367. [Google Scholar] [CrossRef]
- Bae, J.; Koo, D.-M. Lemons Problem in Collaborative Consumption Platforms: Different Decision Heuristics Chosen by consumers with Different Cognitive Styles. Internet Res. 2018, 28, 746–766. [Google Scholar] [CrossRef]
- Parsons, G.; Yan, L. Anchoring on Visual Cues in a Stated Preference Survey: The Case of Siting Offshore Wind Power Projects. J. Choice Model. 2021, 38, 100264. [Google Scholar] [CrossRef]
- Székely, N.; Weinmann, M. Nudging People to Pay CO2 Offsets-The Effect of Anchors in Flight Booking Processes. In Proceedings of the 24th European Conference on Information Systems (ECIS 2016), Istanbul, Turkey, 12–15 June 2016. [Google Scholar]
- Bahník, Š.; Houdek, P.; Vrbová, L.; Hájek, J. Variations on Anchoring: Sequential Anchoring Revisited. Judgm. Decis. Mak. 2019, 14, 711–720. [Google Scholar] [CrossRef]
- Lin, C.-H.; Chen, M. Follow Your Heart: How Is Willingness to Pay Formed under Multiple Anchors? Front. Psychol. 2017, 8, 2269. [Google Scholar] [CrossRef]
- Peer, E.; Rothschild, D.; Gordon, A.; Evernden, Z.; Damer, E. Data Quality of Platforms and Panels for Online Behavioral Research. Behav. Res. Methods 2021, 54, 1643–1662. [Google Scholar] [CrossRef] [PubMed]
- Peer, E.; Brandimarte, L.; Samat, S.; Acquisti, A. Beyond the Turk: Alternative Platforms for Crowdsourcing Behavioral Research. J. Exp. Soc. Psychol. 2017, 70, 153–163. [Google Scholar] [CrossRef]
- Douglas, B.D.; Ewell, P.J.; Brauer, M. Data Quality in Online Human-Subjects Research: Comparisons between MTurk, Prolific, CloudResearch, Qualtrics, and SONA. PLoS ONE 2023, 18, e0279720. [Google Scholar] [CrossRef]
- Matherly, T. A Panel for Lemons? Positivity Bias, Reputation Systems and Data Quality on MTurk. Eur. J. Mark. 2019, 53, 195–223. [Google Scholar] [CrossRef]
- Kim, H.; Ham, S.; Promann, M.; Devarapalli, H.; Bihani, G.; Ringenberg, T.; Kwarteng, V.; Bilionis, I.; Braun, J.E.; Taylor Rayz, J.T.; et al. MySmartE—An Eco-Feedback and Gaming Platform to Promote Energy Conserving Thermostat-Adjustment Behaviors in Multi-Unit Residential Buildings. Build. Environ. 2022, 221, 109252. [Google Scholar] [CrossRef]
- Epley, N.; Gilovich, T. Putting Adjustment Back in the Anchoring and Adjustment Heuristic: Differential Processing of Self-Generated and Experimenter-Provided Anchors. Psychol. Sci. 2001, 12, 391–396. [Google Scholar] [CrossRef]
- Johnson, N.; Reimer, T. The Adoption and Use of Smart Assistants in Residential Homes: The Matching Hypothesis. Sustainability 2023, 15, 9224. [Google Scholar] [CrossRef]
- Sperber, E.; Frey, U.; Bertsch, V. Turn down Your Thermostats—A Contribution to Overcoming the European Gas Crisis? The Example of Germany. Heliyon 2024, 10, e23974. [Google Scholar] [CrossRef]
| Disclaimer/Publisher’s Note: The statements, opinions and data contained in all publications are solely those of the individual author(s) and contributor(s) and not of MDPI and/or the editor(s). MDPI and/or the editor(s) disclaim responsibility for any injury to people or property resulting from any ideas, methods, instructions or products referred to in the content. |
© 2024 by the authors. Licensee MDPI, Basel, Switzerland. This article is an open access article distributed under the terms and conditions of the Creative Commons Attribution (CC BY) license (https://creativecommons.org/licenses/by/4.0/).


