Abstract
The aim of this paper is to identify and develop key indicators related to beach and marine litter using land and coastal areas as sources to diagnose the current situation in Tunisia. Based on the results, recommendations have been developed to support the decision-making process. In this study, three main indicators and twelve sub-indicators were developed and classified into driving factors and resulting situations. These were developed based on (1) a large literature and participative approach and (2) beach litter monitoring campaigns carried out on five beaches from the north to the south during three years and different seasons using the Convention for the Protection of the Marine Environment of the North-East Atlantic (OSPAR) method for beach litter monitoring on 100 m. The results show that plastic represented the main littered item in coastal areas and beaches in Tunisia (ranging between 54% and 70%). In addition, another one of the most littered items was packaging, which ranged between 54% and 74% of the total waste. The findings highlight that tourism and recreational activities represent the main source of items identified (between 89% and 95%). Furthermore, the amount of litter identified was relatively important during a low tourism period in comparison to the period from the preseason preparation to the end of the high season when cleaning operations can have a great impact. Finally, the findings indicate that the average quantities of plastic per kilometer in Gammarth, Hammamet, and Sousse tourism areas were much lower than in Sfax and Gabès.
1. Introduction
Marine litter represents the items discarded, misplaced, or carried by winds and rivers that find their way to the sea and shorelines. It mainly consists of plastic, metals, glass, rubber, clothing, and paper. Land-based origins account for up to 80% of marine littering [1,2], having tourism activities, sewage, and illegal or mismanaged landfills as main contributors. Marine litter has been identified in all marine habitats, from urban beaches to the most remote places in the oceans [3], starting from the coasts, beaches [4,5], cliffs, dunes, and ports to the surface of the water with floating litter [6], to the open seas and oceans [6,7,8,9,10], and in all marine habitats [11] including the seabed [12].
Plastic represents a relevant litter item that has been identified in several coastal areas. This polymeric substance has become a major threat to the environment because of its chemical composition and biodegradable behavior. It can take hundreds of years for plastic waste to disappear. Plastic is widely used because it is cheap, easy to produce, and lasts a long time. It is considered to be an indispensable part of modern life. As the world’s demand for plastic continues to grow, with recent estimates of a 43% increase in plastic production over the last decade [13], plastic waste management remains a global challenge and is now recognized as a major threat to marine biota [14].
The source of plastic litter found on the coast can be clearly identified for some litter items. These are mostly items that originate from fisheries (e.g., accidental loss, intentional abandonment, and discarding of fishing gear), shipping (e.g., ship-generated waste, accidental releases of plastic pellets, plastic blasting in shipyards, etc.), cosmetics and personal care products (e.g., use of microbeads), and textiles and clothing (e.g., synthetic fibers released during washing), as well as retail and tourism (e.g., plastic bags, bottles, packaging, disposable tableware and cutlery). The problem is exacerbated by inadequate waste management infrastructures and practices as well as by direct littering by residents, tourists, and professionals [15].
Plastic bags, fishing equipment, and food and beverage containers are the most common items and constitute more than 80% of litter stranded on beaches [16,17]. A significant portion of these materials undergoes slow decomposition or remains non-biodegradable. This is also noticeable on the seabed with 90% of litter being plastic [18,19,20,21].
Marine debris traverses long distances propelled by ocean currents and winds, ubiquitously present across marine and coastal environments—from polar regions to the equator, spanning continental coastlines to secluded remote islands [11]. The phenomenon is a growing global problem, which poses an increasingly serious threat to the environment, the economy, and health. Therefore, it is necessary to understand the various sources, forms, and impacts of marine litter and devise a concrete and effective solution for removing it from the coasts and seas.
The Mediterranean Sea is peculiar in more than one respect. It is a basin of concentration, with a small surface area (1% of the world’s oceans). However, it shelters more than 10% of the world’s biodiversity. It may contain some of the highest accumulations of marine litter on the seafloor, which exceeds more than 100,000 items per square kilometer [20]. For many decades, industrial, agricultural, and urban wastes have been discharged into the Mediterranean Sea via coastal outfalls, rivers, and the atmosphere.
In fact, marine litter in North Africa is attracting specific attention in the Mediterranean Sea area. The region has several difficulties related to solid waste management from its collection to its treatment. According to [22], the collection rate in the region is considered to range from insufficient to very low in some areas. In addition, landfilling is the main waste treatment method in the region, amounting to between 88% and 98%. The region’s Mediterranean coastal area is spread over 6000 km where tourism and fishing represent the main economic activities in the region and highly influence marine litter.
Tunisia, situated among the North African nations and boasting 1670 km of Mediterranean coastline, confronts various waste management challenges. As per the National Waste Management Agency (ANGed), the waste collection rate in the nation falls short of 84%, and the current system relies heavily on waste landfilling. Indeed, two coastal landfills have been shut down and substituted with open dumpsites. In addition, the collection, transportation, and cleaning system is deemed to be inadequate, attributed to a lack of organization and unsustainable financing. The rise in marine litter and its accumulation on most Tunisian beaches has become a significant concern for all segments of society, particularly in tourist areas [23].
Decisions concerning waste management and marine litter should rely on dependable data and essential indicators. An indicator provides a measure of the ‘state’ of the environment, such as the abundance of plastic litter in the ocean, using data gathered by monitoring the shoreline, sea surface, seafloor, or biotic compartments. As mentioned above, the selection of indicators and the monitoring methods used will also depend on the policy questions being addressed as well as local environmental, social, and economic considerations. Indicators can be used to detect the presence of marine litter in a given habitat (exposure) and the spatial and temporal trends of accumulation (sinks), as well as to provide information on its potential sources or its subsequent impacts on biodiversity and benefits [24].
The utilization of indicators is on the rise, driven by the growing demand for environmental information. Presently, the data provided by these indicators is crucial for policymakers, law enforcement in this domain, and decision-making. Given the significance of this issue, making informed and accurate choices in selecting and utilizing indicators is imperative [25].
The objective of the current paper is to identify potential indicators related to marine litter, its main sources, driving factors, and resulting states. To do this, a participative approach was undertaken to develop and highlight the main indicators for the Tunisian case. This research aims to comprehend the state of marine litter in the coastal areas of Tunisia, with the objective of formulating appropriate recommendations rooted in sustainable organizational and financial solutions.
2. Study Site and Methods
2.1. Study Area
This study concentrates on the coastal regions of Tunisia, encompassing thirteen (13) governorates along the littoral zone that extends to the Mediterranean Sea. These governorates, listed from north to south, include Jendouba, Béja, Bizerte, Ariana, Tunis, Ben Arous, Nabeul, Sousse, Monastir, Mehdia, Sfax, Gabès, and Medenine. The remaining governorates are classified as inland. Tunisia comprises a total of 350 municipalities, with 130 of them situated along the coast, maintaining direct contact with the sea. The Tunisian coastline spans 1670 km, of which 575 km consist of sandy beaches [26].
According to the same reference, the Tunisian coast presents several well-differentiated landscapes:
- The sandy beaches, which occupy approximately 575 km, constitute the most common landscape on the Tunisian coast and shelter a major part of the population, essentially in the bays and gulfs of the eastern side of the country;
- The coastal cliffs comprise about 400 km, which are found mainly on the northern side and to the east of the main capes;
- The coastline with sandy dunes, covered with forest (for example, Zoueraa, Bizerte, Gammarth, Oued Abid, Medfoun, Ghedhabna);
- About 60 islands and islets;
- Wetlands.
Target Cities
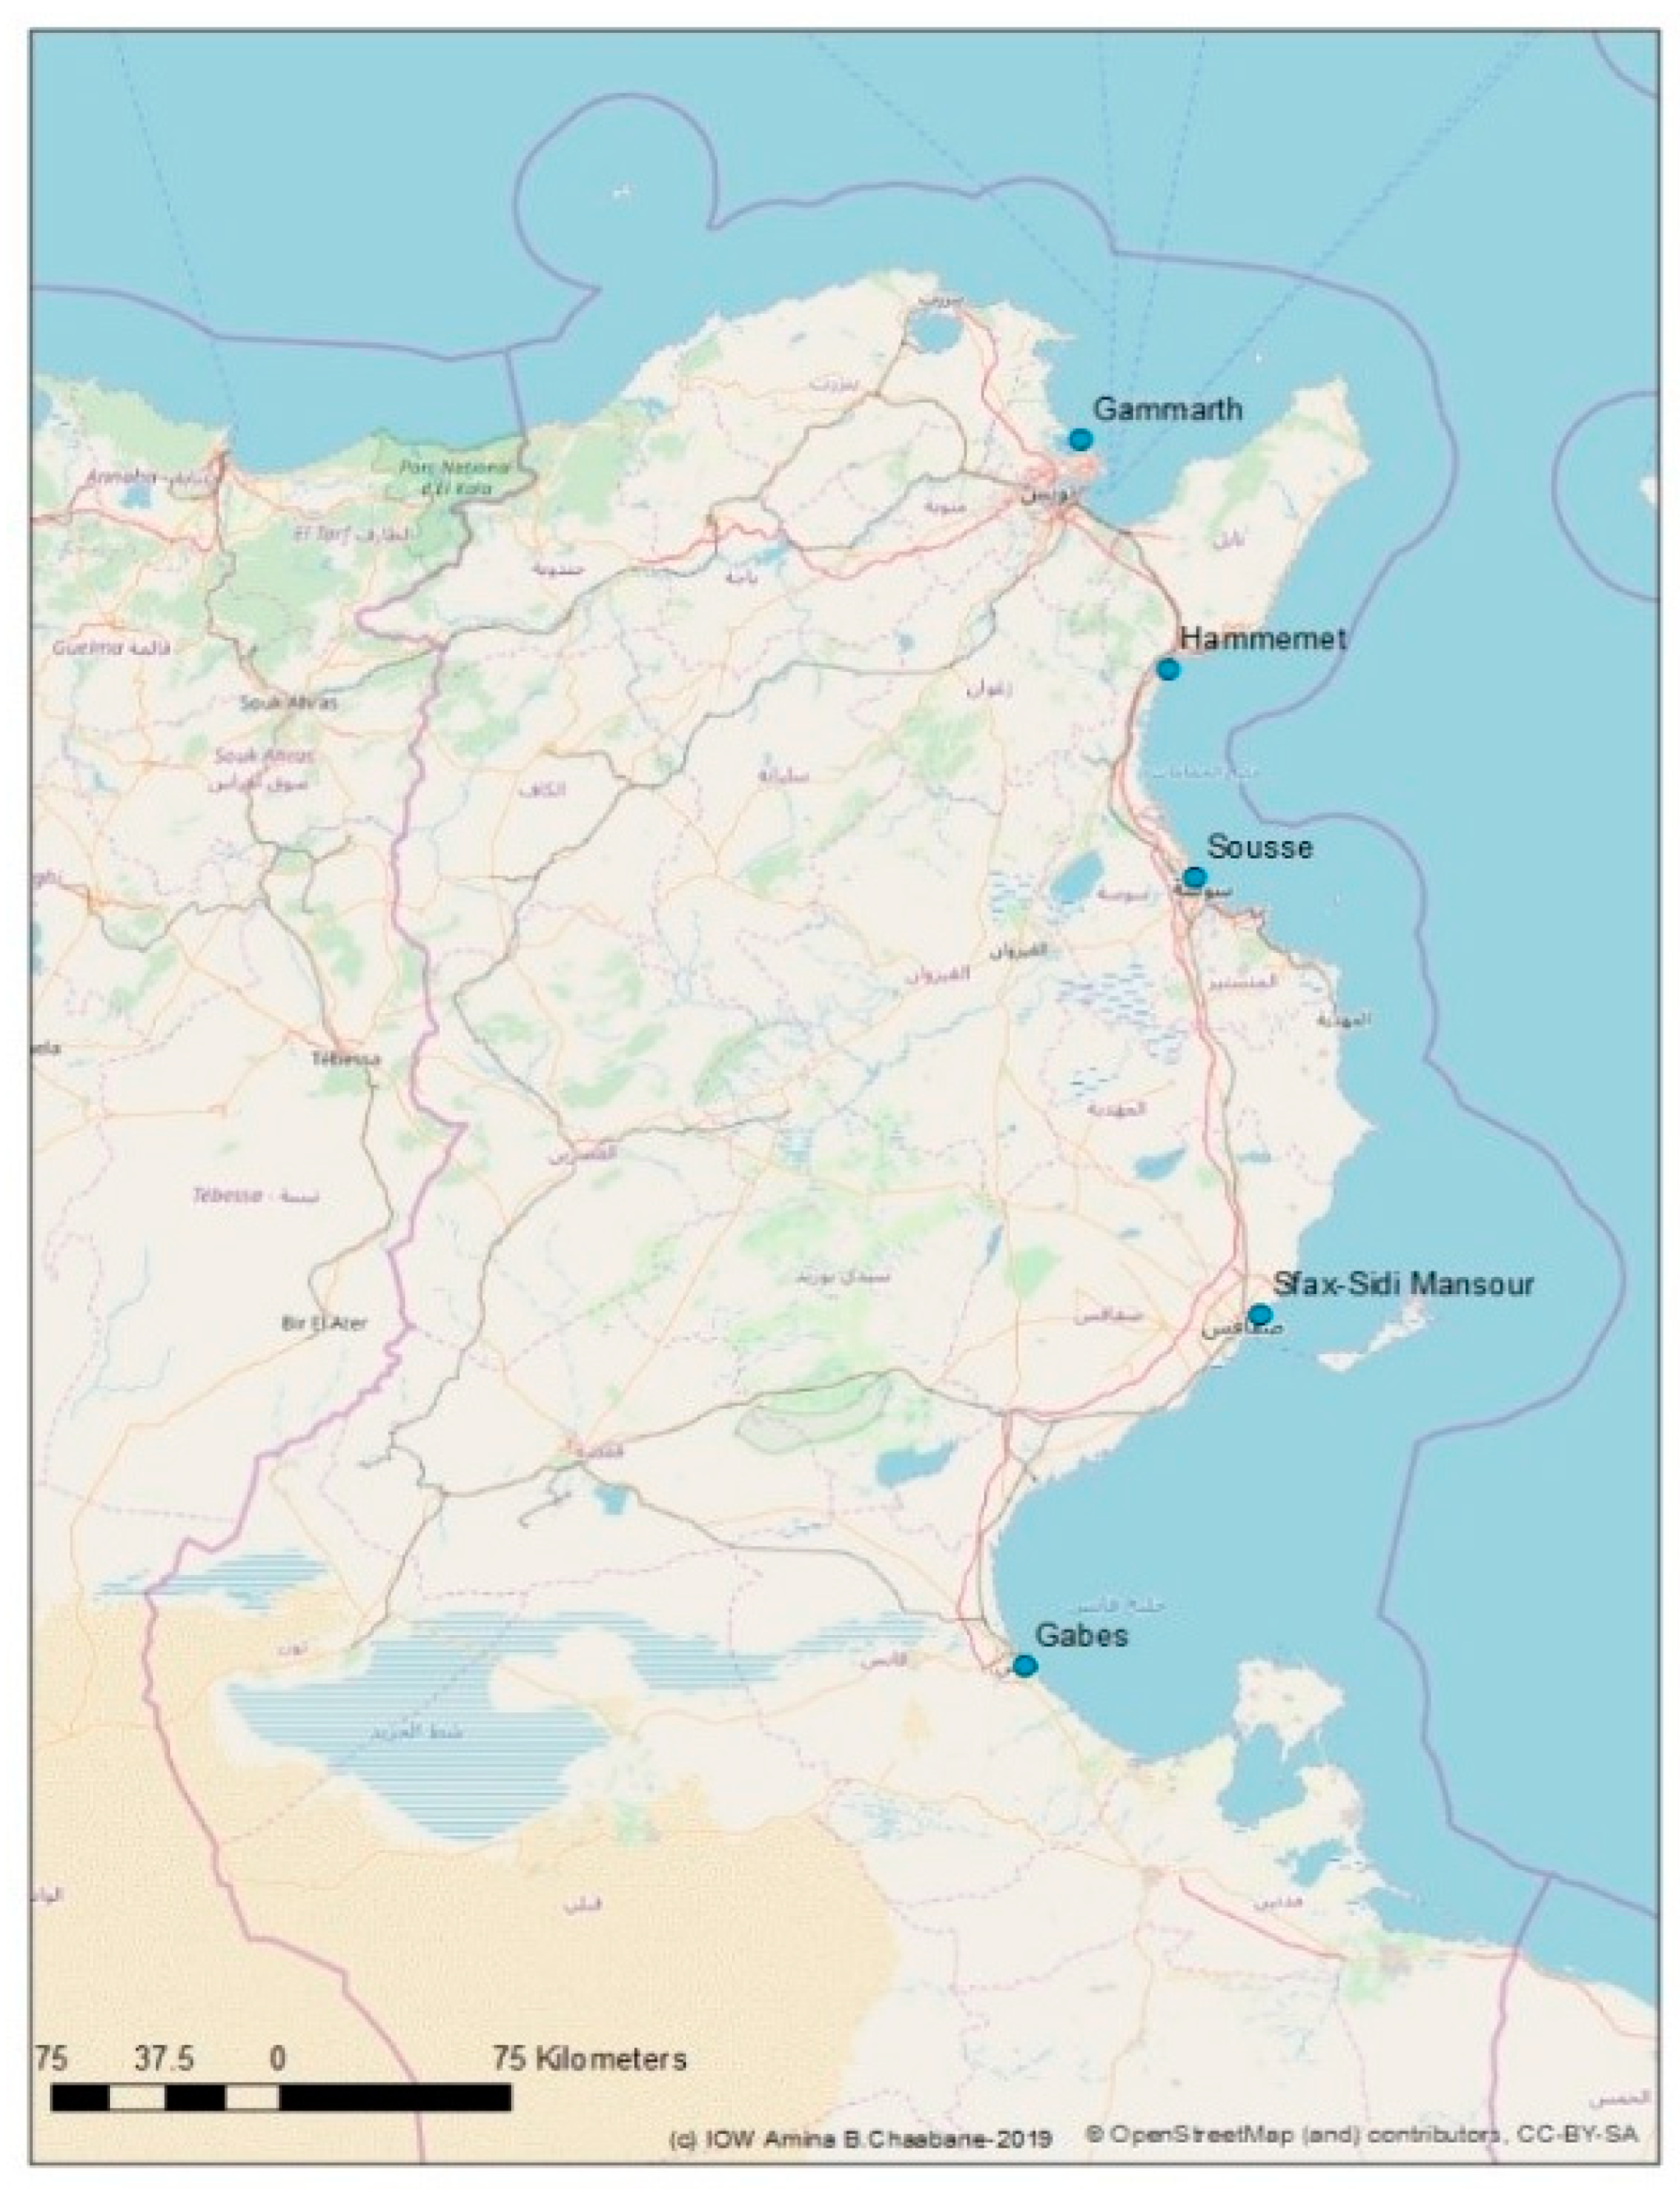
In delineating the study’s scope, it was essential to define the area of influence, concentrating on 13 governorates and 130 local authorities that collectively represent the Tunisian coastal region. The sampling phase of this research included five beaches situated in Gammarth (Tunis), Hammamet (Nabeul), Sousse (Sousse), Sidi Mansour (Sfax), and Gabès (Gabès), as shown on the map in Figure 1. These coastal areas are notable for their significant economic activities, encompassing tourism, fishing, and diversified industries. In the following table (Table 1), a detailed description of each city where the sampled beaches are located presents the main economic activities and what it is known for.

Figure 1.
Location of the sampling stations in Tunisia’s coastal areas.

Table 1.
Characteristics and description of sampled target cities.
The same locations have been considered for different sampling campaigns in order to compare the monitoring results between the seasons and the results of the different economic activities.
2.2. Methods
2.2.1. Target Waste Stream
The primary focus of this study was solid waste, specifically plastic, generated in specified coastal areas in Tunisia. These areas are experiencing a robust expansion of the plastic industry, offering notable economic and social opportunities. In Tunisia, there are approximately 283 active companies in the plastic sector, of which 79 are dedicated exporters, accounting for 28% of the total number of companies in the sector [27]. The primary clientele for the plastic industry includes the agri-food sector, the pharmaceutical sector, and, to a lesser extent, the agricultural sector. As per the Ministry of Environment, Tunisia is grappling with numerous challenges associated with plastic pollution, necessitating the development of effective organizational, financial, and technical solutions to address the issue.
2.2.2. Study Approach
The approach of this study began by collecting data through the literature review and interviews with relevant stakeholders. The primary objective was to identify key indicators associated with solid waste and plastic litter in the coastal areas of Tunisia.
The objective was as follows:
- -
- Describe the existing legal, institutional, and financial framework for the management of solid waste and marine litter in Tunisia;
- -
- Evaluate the primary factors contributing to marine littering in Tunisia.
In addition, a number of field visits and sampling campaigns were carried out to identify the pressures and resulting states in five Tunisian cities. Figure 2 summarizes the main aspects of the study approach.
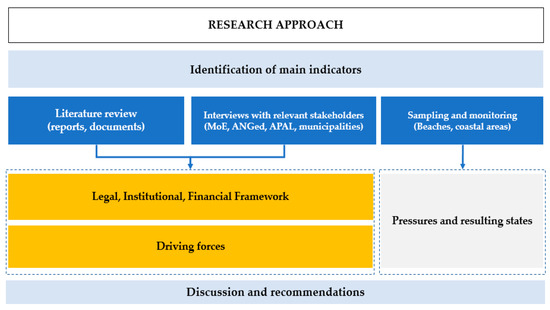
Figure 2.
Study’s concept approach.
2.2.3. Data Collection
The first step of the study consisted of an in-depth diagnosis of the current situation related to plastic pollution in the Tunisian coastal areas and of the main driving forces. The assessment encompassed all coastal cities and governorates in Tunisia, considering any potential activities that might generate waste. To do this, a review of the literature on solid waste management and marine litter in Tunisian coastal areas was undertaken to support the identification of appropriate indicators and to diagnose the Tunisian marine litter framework. Furthermore, documentation and existing studies, including reports, laws, programs, scientific articles, research, and theses, were gathered and analyzed for the same objective. The first questionnaire concerned the national authorities, including the Ministry of Environment, ANGed, the Coastal Protection and Development Agency (APAL), and the International Center for Environmental Technologies (CITET). It focused on the identification of the legal, institutional, and financial framework for solid waste management and marine litter in Tunisia. The second questionnaire focused on municipalities as the main authority responsible for waste collection, transportation, and cleanliness in coastal areas. Questions included the role of public and private sectors, the type of waste collected, and the financial aspects of waste management (collection costs, taxes paid by hotels, the role of the tourism fund, etc.).
The relevant indicators for the Tunisian context were selected, based on the current solid waste management framework and the current situation related to marine litter.
2.2.4. Beach Litter Monitoring Methodology
The level of litter and trends in the abundance of litter items were monitored on selected beaches by applying a standard OSPAR (Convention for the Protection of the Marine Environment of the North-East Atlantic) monitoring protocol [28]. It is defined as a standard method and software useful for statistical analysis of beach litter information and data [29].
This method was adopted in this study and focused on sampling all fractions of litter items. In fact, the collection and quantification of marine debris such as plastic, paper, glass, metal, and others (sanitary waste, fishing equipment, etc.) were carried out in the area next to coastal hotels, restaurants, and the redevelopment area.
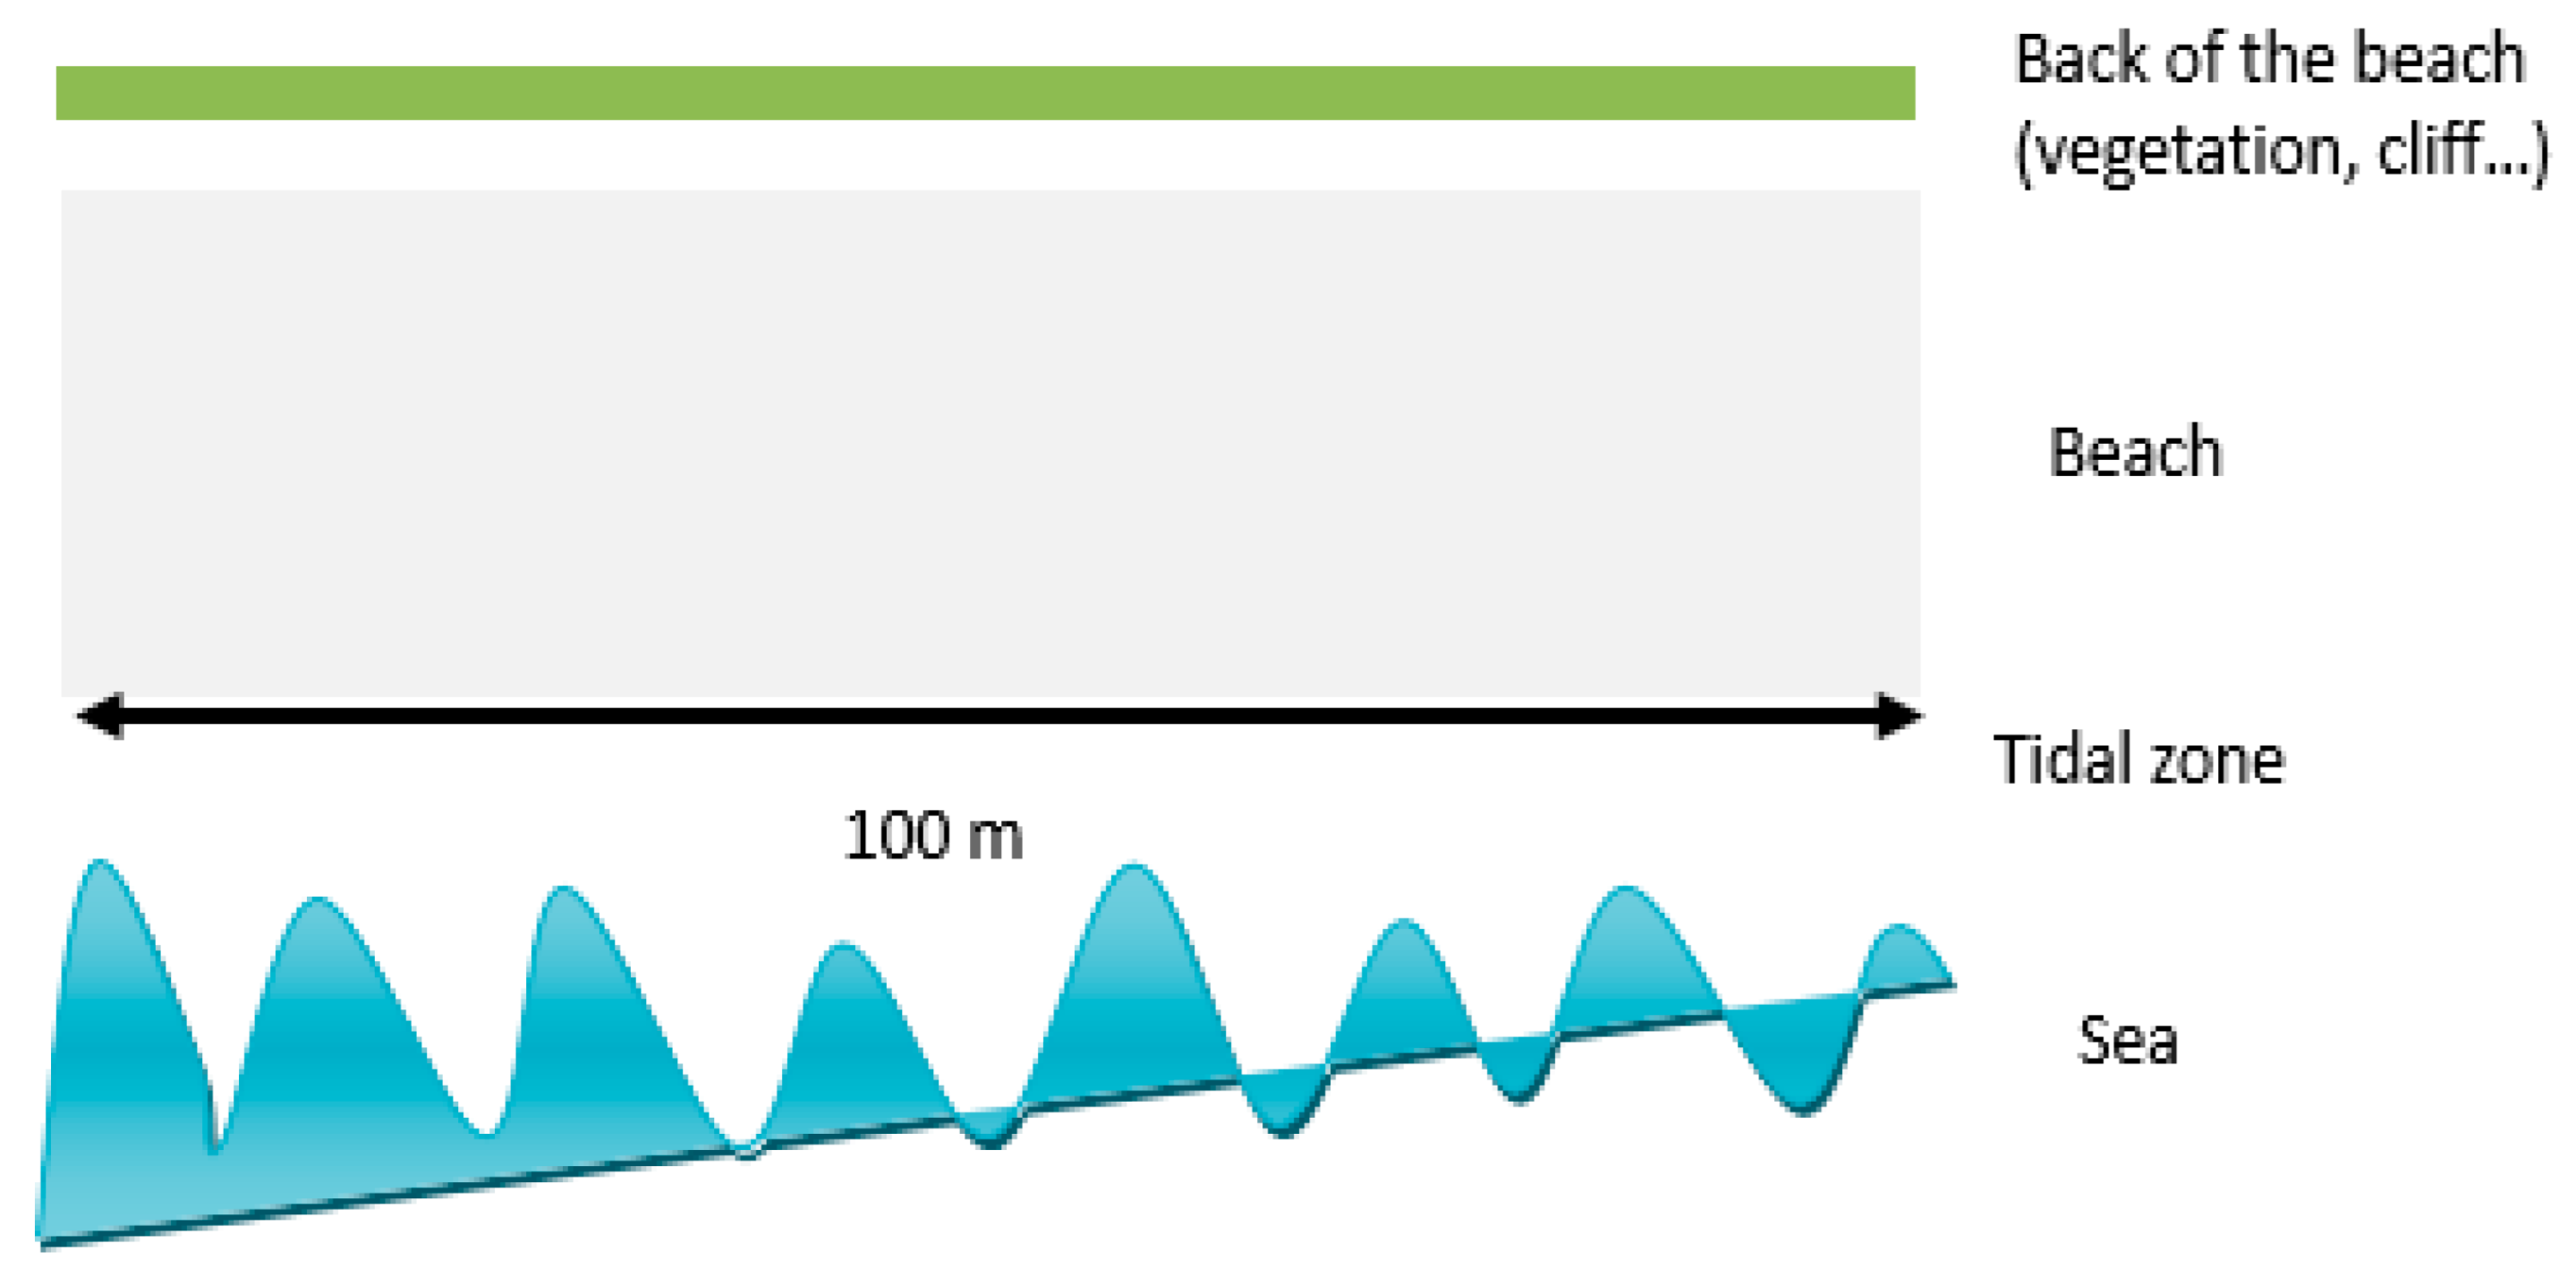
In the case of this research, the 100 m method was considered. As mentioned in the ‘Guideline for Monitoring Marine Litter on the Beaches in the OSPAR Maritime Area’ [28], this consists of the selection of survey beaches following the criteria defined in OSPAR.
The beaches must consist of sand or gravel, be open to the sea, accessible to a team of workers throughout the year, possess a minimum length of several hundred meters, remain devoid of permanent structures year-round, and not be subject to any other litter collection activities such as beach cleaning before the sampling campaign.
The illustration of the area that should be sampled on the beach is presented in Figure 3 where the 100 m beach length/the whole beach is defined.
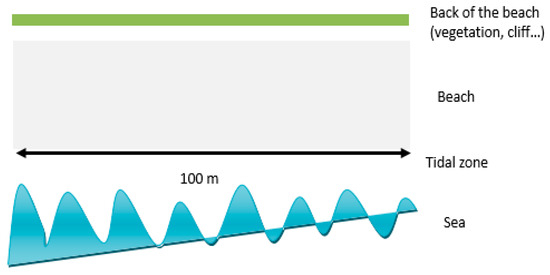
Figure 3.
Illustration of the sampled beach.
On-site, the focus was on 100 m beach stretches that covered the whole area between the seafront and the back of the beach.
As a first step, all items visible to the naked eye were collected. Second, the OSPAR photo guide was followed to assist with the identification and classification of litter items. The majority of items collected belonged to the size class above 2.5 cm (macro-litter). However, smaller meso-litter particles (0.5–2.5 cm), for example, cigarette butts, were partly included as well.
2.2.5. Selection Criteria of Sampling Sites
Before starting the sampling campaign, cities and areas were selected according to different parameters:
Abundance of litter: Ideally, the selected sites should represent litter abundance and composition for a given region. Not all coastal sites were appropriate as they may be limited in terms of accessibility, suitability for sampling (sand or rocks/boulders), and beach cleaning activities.
Length of the beach: A minimum length of 100 m.
Area: Low to moderate slope (15–45°).
Accessibility: Clear access to the sea (not blocked by breakwaters or jetties) such that marine litter is not screened by anthropogenic structures. In addition, the site should be accessible to the survey team all year round, although some consideration had to be given to sites that are iced-in over winter and the difficulty in accessing very remote areas.
Ideally, the location should remain unaffected by other litter collection activities, such as cleaning operations.
No impacts on species: Sampling activities should be conducted so as not to impact any endangered or protected species such as sea turtles, sea birds or shore birds, marine mammals, or sensitive beach vegetation; in many cases, this would exclude national parks, but this may vary depending on local management arrangements.
2.2.6. Indicators’ Development
Developing key indicators for assessing the marine litter situation in Tunisia was regarded as a valuable tool for acquiring precise information about the present state and enhancing decision-making processes. This is attributed to the significant demand for increased knowledge and information essential for comprehending environmental parameters. To achieve this, a set of indicators related to solid waste management focusing on plastic litter in the Tunisian coastal areas was identified and selected to push for effective data collection.
In this study, the main indicators related to marine litter in Tunisian coastal areas were identified and classified as follows:
- -
- Legal, institutional, and financial indicators of solid waste management and beach and marine litter in Tunisia related to driving forces from one side, and
- -
- to pressure and resulting states from the other side;
- Legal, institutional, and financial framework.
To grasp the prevailing conditions concerning waste management and marine litter in coastal areas of Tunisia, it was valuable to examine the existing legislation. Additionally, assessing the coherence of responsibilities among various Tunisian institutions and actors, along with analyzing the structure of the financial flow, proved worthwhile.
- Driving forces
Driving forces are the causes that stimulate a certain marine litter situation in a Tunisian coastal area. In this study, the following indicators were considered:
- -
- Waste generated from land-based activities, waste related to population growth, plastic waste generated in the coastal area, the intensity of the waste generated by the tourism sector, industrial activities, agriculture, etc.;
- -
- Waste generated on the beaches and coastal zones, including recreational activities, ports, fishing, aquaculture, etc.;
- Pressure and resulting states
This set of indicators represents the main pressures as a result of the different driving forces, such as:
- -
- Plastic litter fractions: During the beach litter campaigns, littered fractions were collected to identify the percentage of plastic fractions.
- -
- TOP 10 plastic items: The 10 most commonly found single-use plastic items on Tunisian beaches were identified and classified.
- -
- Sources of different litter: This indicator aimed to identify different land- and ocean-based sources of litter.
- -
- Quantity of plastic litter: This indicator concerned the quantity of plastic materials along 1 km in each sampling station in the coastal areas of Tunisia.
- -
- Share of packaging litter: The percentage of packaging litter composed of plastic in the sampling areas.
3. Results and Discussion
3.1. Key Indicators: Solid Waste Management and Marine Litter in Tunisia
3.1.1. Solid Waste Management Main Practices in Tunisia
The quantities of solid waste in Tunisia are on the rise in tandem with population growth. According to ANGed, the average per capita production per day is around 0.65 kg per inhabitant per day with significant disparities between the urban and rural areas. Official figures show that the most widely used method for the disposal and treatment of solid waste in Tunisia is landfilling (95%). However, only 5% of the generated waste is recycled or composted. The country produces more than 2.8 million tons of solid waste, with an increasing rate of 2.8% per year [30].
Jambeck et al. [31] estimated that 4.8–12.7 MMT of plastic waste entered the oceans in 2010. They predicted at least a 10-fold increase in plastic waste entering the oceans from 2010 to 2025; predictions for 2025 range from just below 100 to 250 MMT. According to WWF [32], Tunisia dumped 8500 tons of plastic into the Mediterranean in 2016, of which 33% returned to the Tunisian coast within a year.
Solid waste collection is characterized by a low level of organization and an overall lack of coordination among stakeholders and activities. The collection systems implemented by municipalities typically adhere to a uniform pattern. Bins are used for both organic and nonorganic waste, and there is no practice of segregating waste at the source. The municipal waste collection rate across Tunisia is almost 84%. Nowadays, the entire Tunisian territory, including the rural areas, is covered by municipal services, especially the waste collection service, as waste management has become a devolved competence that is managed by the local authorities. Today, nine sanitary landfills in Tunisia and fifty-six transfer stations are in operation. However, four landfills (Monastir, Kerkennah, Sfax, and Djerba) and six transfer stations were closed for different reasons.
Source-based waste separation is only implemented in a few specific areas and municipalities. Various waste sorting initiatives have been initiated since 2005, including projects in Hay El Khadhra, Sidi Bou Said, Djerba, and Tunis. Anticipated outcomes have not been realized due to financial and organizational challenges. The processing of specific materials depends significantly on informal waste pickers who gather recyclable and valuable materials from mixed waste. The informal sector plays a significant role in driving waste sorting and recycling operations. Referring to ANGed, about 4% of the total waste generated is recovered as recyclable materials such as polyethylene terephthalate (PET), polyethylene high-density (PEHD), and metals. These materials are sorted and collected by waste pickers from the waste containers installed in the street or from landfills and dumpsites. According to ANGed, waste pickers ensure the collection of 80% of collected recyclable materials. Despite the efforts made, the recycling rate has not recorded any increase [23].
The system designed for the collection and recycling of used packaging, known as ECO-Lef, serves the public in facilitating the recovery and reclamation process. This initiative is executed by small companies approved and authorized by ANGed. These companies purchase materials from informal collectors, commonly referred to as “Barbechas,” and compensate them directly based on the weight of the materials. The collection companies sell the collected amounts to ECO-Lef; however, they are not obliged to sell the material to the system. At the ECO-Lef points, materials are collected, recorded, compacted, and prepared to be sold to recycling companies. Yet, many ECO-Lef points have been closed due to a lack of logistics and disagreement with local authorities.
3.1.2. Financial Framework
The financial considerations are crucial for establishing a suitable and sustainable model to address marine litter problems in Tunisian coastal areas. The financial system associated with marine litter in Tunisia is closely tied to the solid waste management system, primarily funded by the government through local authorities. The main financing streams are as follows:
- -
- The government through the national budget or via the depollution fund managed by the Ministry of Finance, which covers the financing of 80% of the landfills in operation and the financing of an important part of different waste flow systems;
- -
- The municipal budget, including the tax on hotels representing 1% of their business turnover (for collection, cleaning, and transportation of the waste to transfer stations or to landfills);
- -
- The producers of packaging in the case of the national system for ECO-Lef packaging. The producers/bottlers who place packaging on the Tunisian market participate through an annual contribution to the ECO-Lef system. However, only about 7% of current packaging producers in the Tunisian market (including plastic packaging) pay their contributions to the public system. Despite the requirement for companies to display the system logo on their packaging, including an identification number, ANGed faces challenges in effectively conducting product control due to insufficient resources.
Importers of products on the Tunisian market participate financially in imports by paying 5% of their turnover to the Ministry of Finance, in particular to the depollution fund. The ministry then takes responsibility for the distribution of the funds, according to the government program.
Hotels contribute 2% of their annual turnover, with 1% allocated to the national fund for the protection of tourism areas and the remaining 1% directed to the municipality. These funds serve various purposes, including beach and tourism area cleaning operations.
3.1.3. Legal Framework
The waste management regulatory framework is made up of different types of jurisdictions, including the general framework that regulates the waste sector regardless of the nature of this waste, specific frameworks for each type of waste, and a coastal management framework.
From a legal point of view, the solid waste management sector in Tunisia is mainly organized by two framework laws: the first is related to the local government code of 2018, and the second is Law no. 96-41 of 10 June 1996, related to waste and control of its management.
The code of local authorities of 9 May 2018 refers to waste management and declares that the collection, sorting, and transport of household and similar waste to controlled landfills are assigned to municipalities, and the central government is required to provide collective equipment in the field of the environment, such as controlled landfills.
Law no. 96-41 of 10 June 1996 defines the waste management philosophy and its implementation methods. This is guided by three essential principles, including the reduction of waste, the recovery of valuable materials, and landfilling of non-recovered material.
In relation to packaging waste and plastic, Tunisia has set up a specific system of collection, treatment, and valorization of packaging, the ECO-Lef system, and is still working to develop regulations for all several waste streams, such as WEEE, textiles, glass, paper, cardboard, etc.
3.1.4. Institutional Framework
The current institutional framework related to marine litter in Tunisia is represented by several actors who are operating according to different rules. However, different marine litter actors have different responsibilities and influence on the sector. In this study, the different responsibilities were classified according to the institutions, as indicated in the following Figure 4.
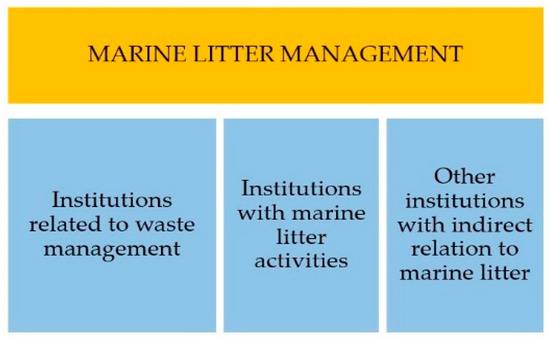
Figure 4.
Marine litter institutions’ level in Tunisia.
- Institutions related to waste management
Solid waste management involves the engagement of public entities, both at the national and local levels, as well as the private sector. Multiple organizations and institutions actively participate in this domain. The key officials of solid waste management in Tunisia are as follows:
- -
- At the national level, the Ministry of Environment and ANGed have a direct link to the topic due to their relation to the solid waste management sector. ANGed is the national waste management operator in charge of the waste transport from the transfer stations to the landfills, the management of the landfills, and the treatment of leachate through private operators. It is also responsible for providing the necessary infrastructure (transfer stations, landfills, or other treatment facilities). ANGed is also responsible for operating different waste stream systems, including packaging.
- -
- At the local level, municipalities are the first responsible bodies for solid waste management collection and street and beach cleaning in the territory. They are responsible for the collection and transport of the collected mixed waste to the transfer stations. In the framework of the decentralization process, the number of municipalities has been extended to 350 to cover the entire Tunisian territory.
- -
- Other institutions are also involved, such as:
- -
- The National Agency for the Protection of the Environment (ANPE) is responsible for overseeing the adherence to waste management regulations by institutions, citizens, and industrial entities. It has the power to prosecute and penalize offenders.
- -
- APAL is a non-administrative public institution created by Law no. 95-72 promulgated on 24 July 1995. APAL is called upon to implement the policy of the State in the field of coastal protection and development, protect the maritime public domain against illegal encroachments and occupations, and give its approval to any development and equipment project on the coast before its execution. These duties exist within the framework of consultation with the stakeholders. APAL ensures, in consultation with the coastal municipalities, beach cleaning operations.
- -
- CITET provides technical assistance to help companies better manage their waste and implement environmental management, training, and information systems.
- -
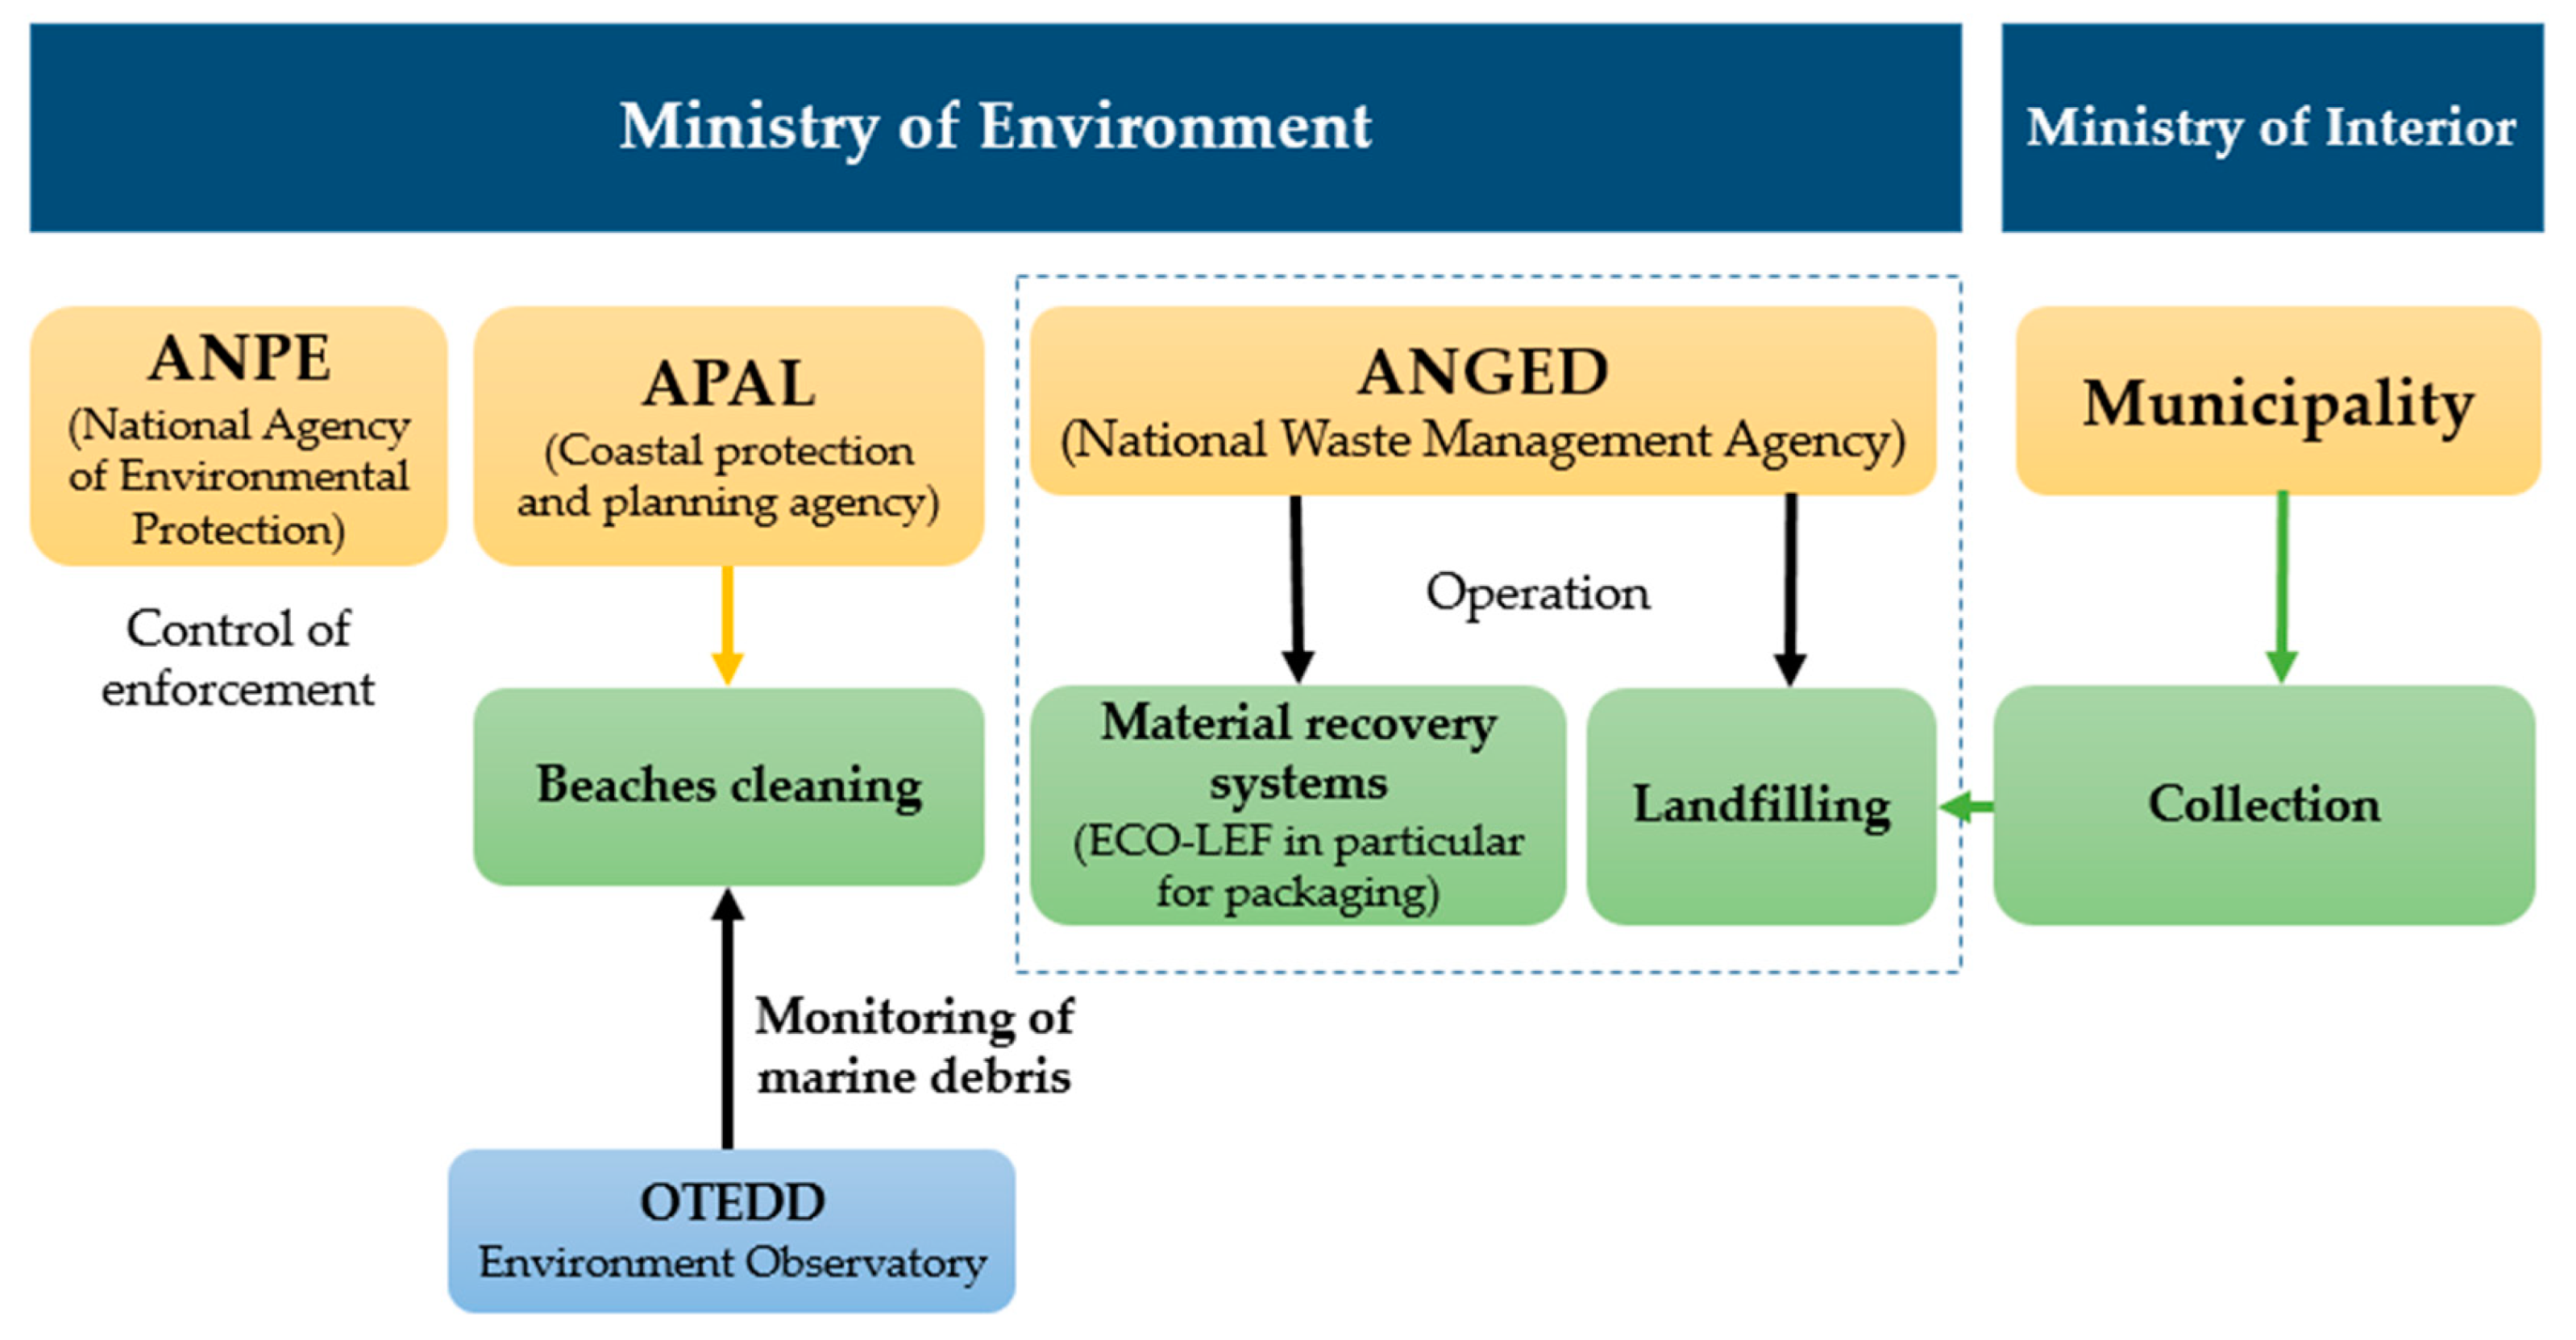
- The interactions between the different stakeholders are represented in the following Figure 5.
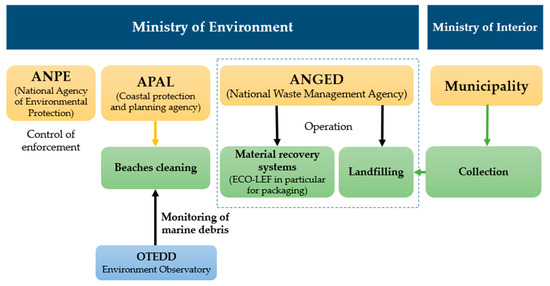 Figure 5. Legal responsibilities of the main institutions related to solid waste and marine litter.
- Institutions with marine litter activities
A number of institutions in Tunisia were created with a specific task related to marine litter, including but not limited to:
- -
- The General Secretariat for Maritime Affairs: a position, filled for the first time, in accordance with Decree no. 2019-144 of 18 February 2019, creating a Ministerial Commission and a General Secretariat for Maritime Affairs;
- -
- The Tunisian Observatory for the Environment and Sustainable Development (OTEDD) constitutes the basis of a permanent mechanism for the observation, collection, production, analysis, management, and dissemination of information on the state of the environment and sustainable development, to support decision-making.
- Other institutions indirectly related to marine litter
In addition to the above-mentioned institutions, a number of other actors contribute to the marine litter management issue:
- -
- The Ministry of Finance ensures the collection of eco-taxes and participates in solid waste management financing, particularly the financing of part of ECO-Lef activities, financing of other waste stream systems, and financing 80% of the waste treatment in landfills.
- -
- The Ministry of Public Health, for its part, monitors and manages waste from healthcare establishments and assesses the health impacts of products.
- -
- The Ministry of Industry, Energy and Mines is responsible for the development of sectoral strategies, programs, and national guidelines to support the sector and the development and development of policies and adequate legislation including (i) the optimal exploitation of resources, (ii) an incentive for innovation and the encouragement of scientific research and its development, and (iii) anchoring and devoting exchanges and consultation with all government and parliamentary bodies and authorities, the private sector, and civil society in all matters relating to energy and mining resources.
- -
- The Technical Center for Chemistry is responsible for carrying out diagnostic studies aimed at determining the strategic choices and the material and immaterial resources required. The Center is also responsible for assessing companies’ situations and identifying areas for improvement in terms of technology, organization, respect for the environment, and occupational safety.
- -
- The Packaging Technical Center (Packtec) performs physio-mechanical and chemical analyses and tests on various materials as well as physical, mechanical, and optical tests and barrier properties using high-tech equipment to control the quality of plastic packaging.
- -
- The Ministry of Agriculture, Water Resources and Fisheries is responsible for supporting efforts toward reducing pollution from sources such as agricultural waste and fishing ports, in addition to protecting water resources.
- -
- The National Institute of Sciences and Technologies (INSTM) is a public institution in the field of research, working under the Ministry of Agriculture, Water Resources and Fisheries. INSTM is active in different projects related to marine litter and fighting pollution in coastal areas.
- -
- The Agency for the Promotion of Industry and Innovation (APII) deals with the promotion of products and projects and industrial sectors, particularly the plastic sector.
In addition to the above-mentioned institutions, other actors are very active in the field and contribute directly or indirectly to the solid waste management sector and to fighting marine litter:
- -
- The private sector is mainly active in waste collection and cleaning companies, particularly in coastal and tourism cities during summer periods where waste generation reaches very high levels. Small collection and recycling companies are also active in recyclable material collection and recycling.
- -
- Informal waste collectors are not visible in the current ECO-Lef official system despite their significant contribution to preserving the ecosystem and ensuring sustainable development. The involvement of the informal collectors in the Tunisian economy could be of great help to this population, mainly on the social, health, economic, and environmental levels, as well as for the economy of the country. Within the ECO-Lef system, “Barbechas” cannot currently directly access the system’s collection points, which are open only to holders of commercial licenses, who also must be approved by ANGed. Consequently, the majority of the “Barbechas” cannot benefit from the high price guaranteed by ECO-Lef and are, therefore, obliged to use intermediaries offering lower prices.
- -
- Producers of packaging under the framework of Law no. 96-41 (Polluter Pays Principles) financially contribute to the public system for the recovery and recycling of ECO-Lef packaging waste.
- -
- Importers pay 5% of turnover on their imported materials to the depollution fund, managed by the Ministry of Finance.
3.2. Key Indicators: Driving Forces
3.2.1. Waste Generated from Land-Based Activities
- Population in Tunisia and its coastal areas
Population, a driving force, is an indicator of land-based anthropogenic sources of plastic waste generated by household consumption and coastal and beach visitation. According to the United Nations Environment Program [33], an increase in population inevitably leads to an increase in the amount of waste in cities and waste infrastructures, particularly landfills. The increase in the quantity of household waste in Tunisia is more intense in coastal areas where urbanization is important. The concentration of population in coastal agglomerations leads to a change in production and consumption patterns, the production of more waste, and a change in its composition.
The coasts of Tunisia, bounded to the north and east by the Mediterranean Sea, are subject to increasing pressures, including the concentration of the population and visitors. The location of the population is constantly growing. In 2014, 70.7% of the population was concentrated on the coast, and it is estimated that this has increased to 71.8% in 2021 compared with 67.7% in 2004 and 64.7% in 1956, following a migratory dynamic from inland areas. Currently, according to the National Institute of Statistics [34], the total population of the 13 governorates opening onto the Mediterranean Sea is 7.768 million inhabitants (estimated 8.607 million in 2021). These regions bring together 130 coastal municipalities after the extension of the municipal space in 2018, which currently covers the entire Tunisian territory. These coastal municipalities represent 45% of the total population of Tunisia [34], which currently stands at 11.8 million [34].
- Waste management operations in Tunisian coastal areas
The average amount of waste generated per capita mentioned in the national strategy for the integrated management of household and similar waste is 0.65 kg/person/day. With regard to the percentage within this figure, according to ANGed, the plastic fraction in household waste is estimated at an average of 9.4%. The composition of waste varies from one municipality to another. According to a characterization carried out in Sidi Bou Saïd (high-income area), Bardo (middle-income area), and Hrairia (low-income area), the following plastic percentages were apparent: 17.6%, 12.1%, and 6.2%, respectively.
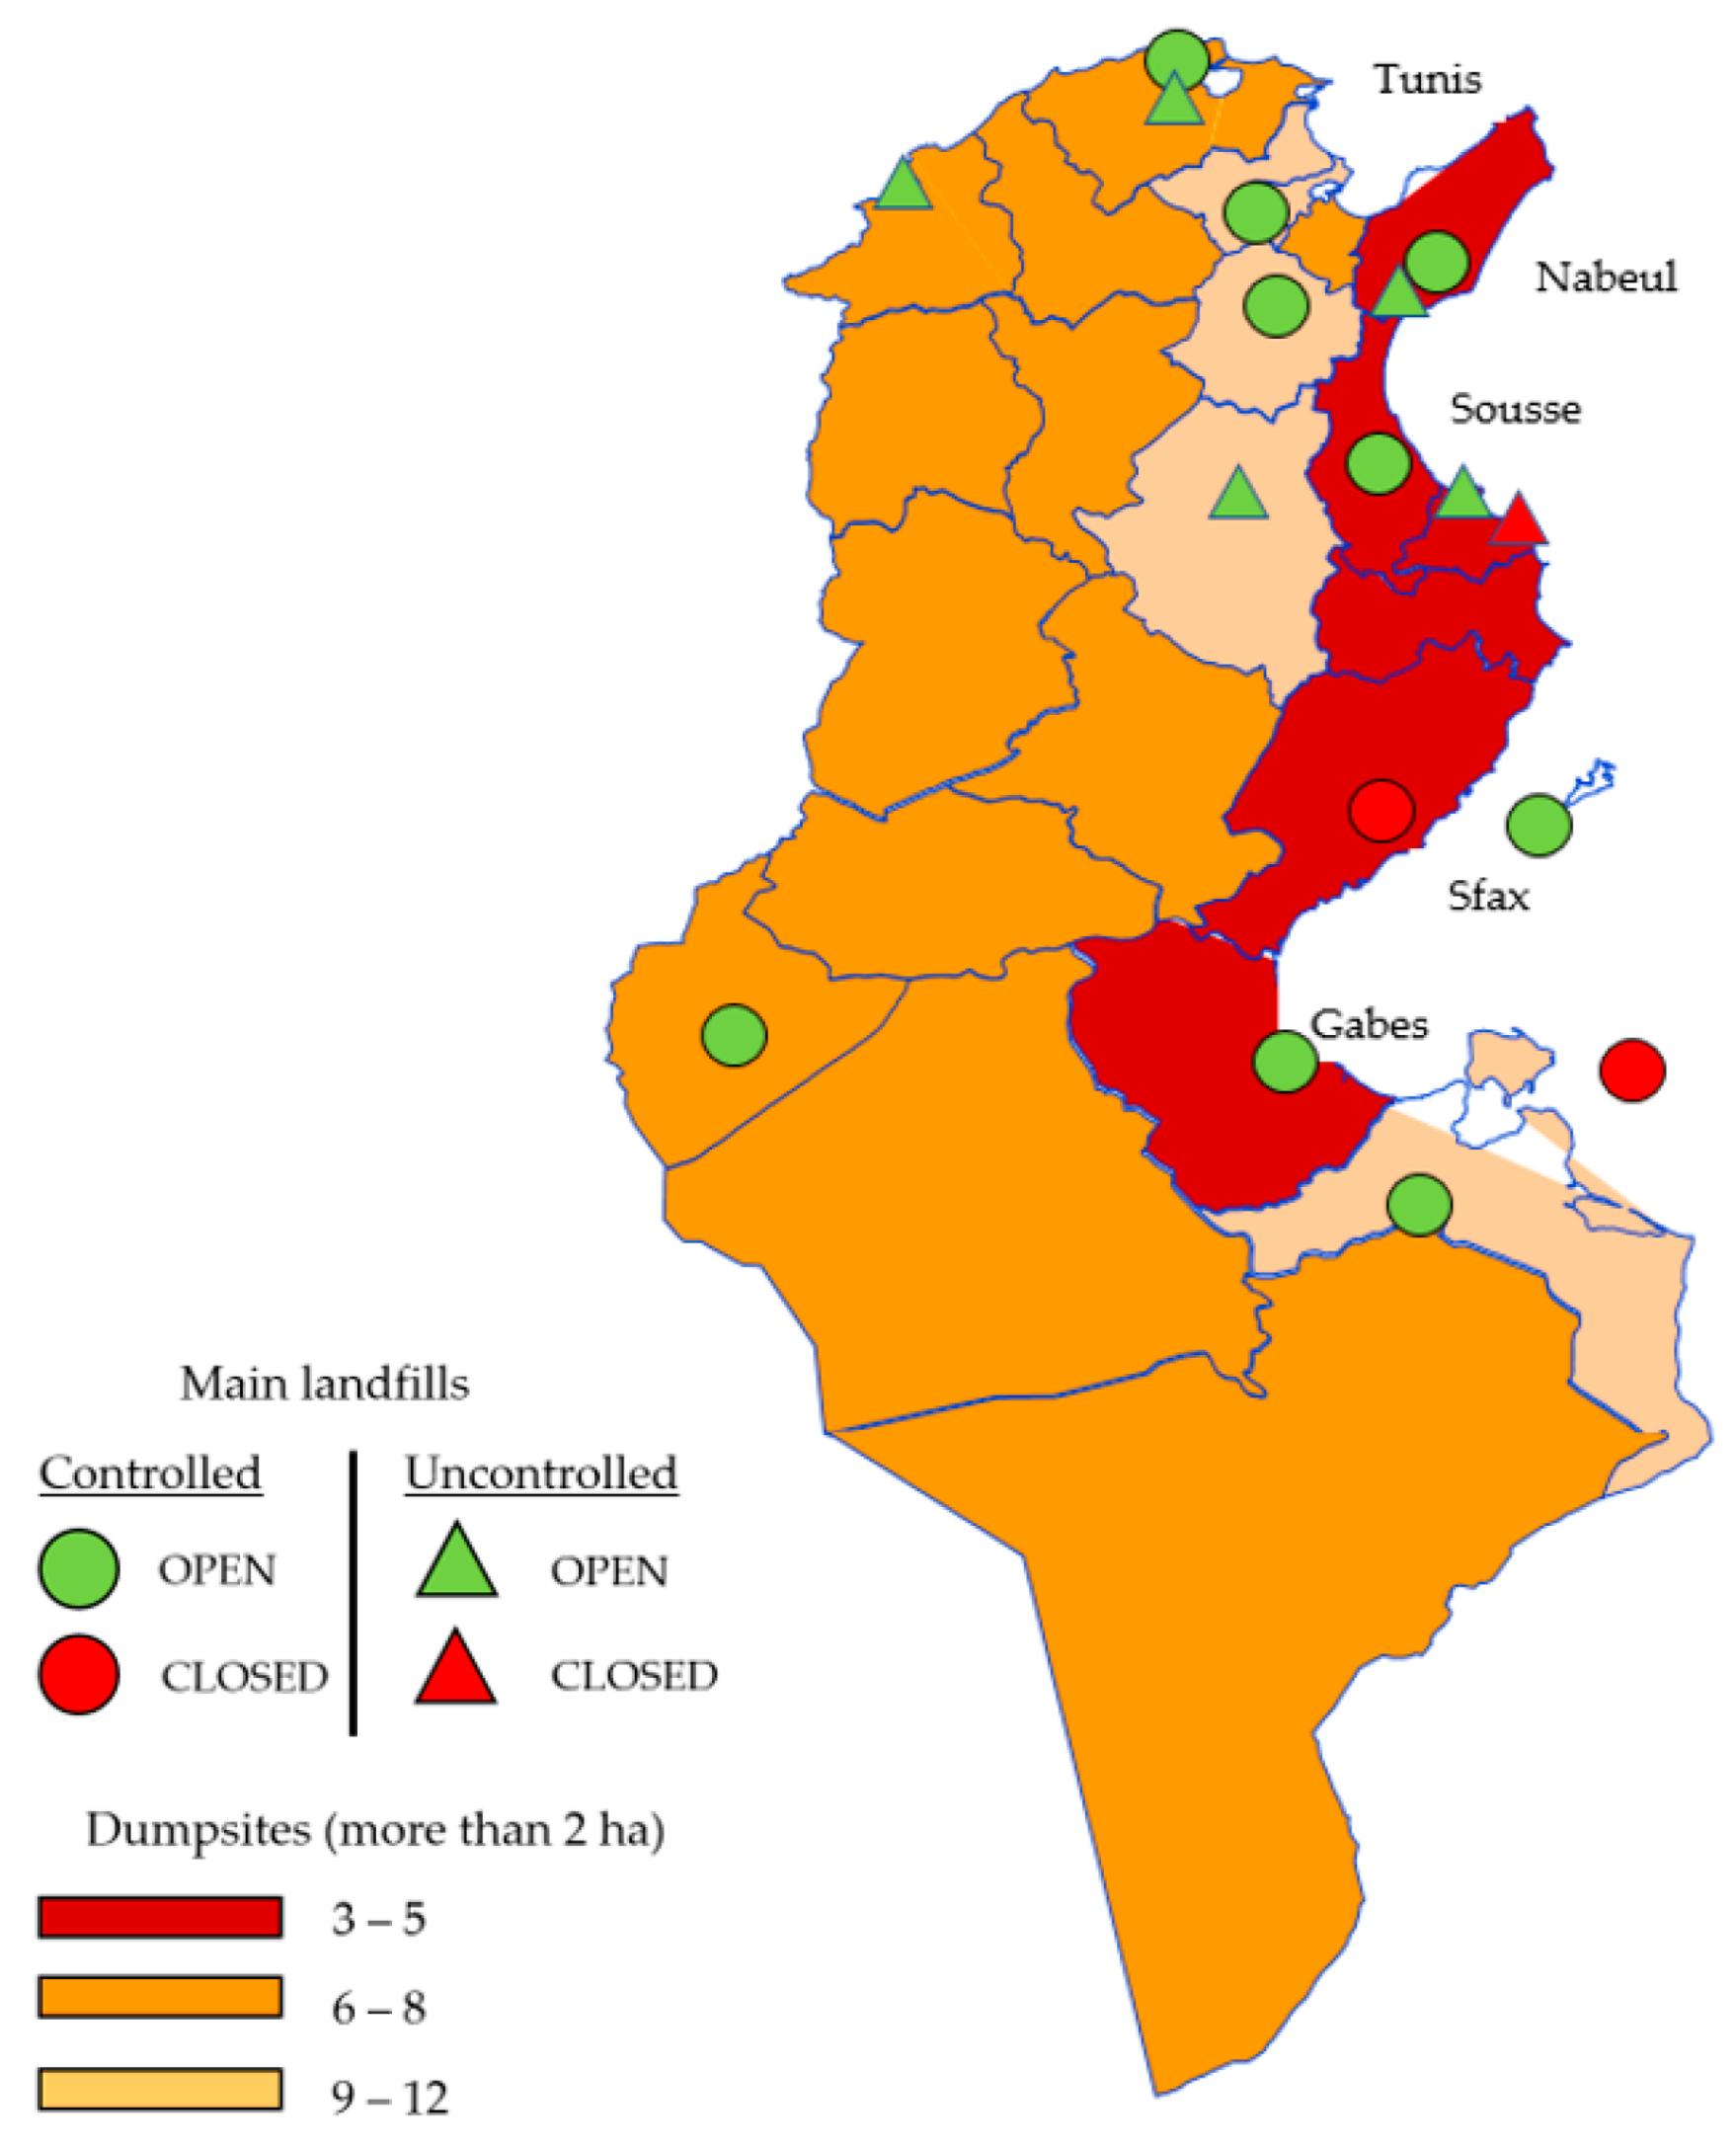
Mismanaged solid waste is waste that is not collected or disposed of in inappropriate places (in non-anarchic landfills) and will end up in nature and the sea through rivers, waterways, winds, storms, and tides. Eleven landfills are currently active in the coastal governorates, three of which have been closed or are not operational: Djerba, Mehdia, and Monastir as presented in Figure 6.

Figure 6.
Controlled landfills and scheduled centers in Tunisia (Data collected from ANGed and designed by the author).
- Waste generation from the land-based tourism sector
Tunisia relies significantly on tourism as a crucial economic driver. The Ministry of Tourism reports a rise in tourist numbers, surging from 8.2 million in 2018 to approximately 9.4 million in 2019. Notably, 95% of Tunisia’s tourist activity is concentrated in coastal regions [35].
The majority of tourist facilities are situated along the country’s coastlines. Major tourist hotspots, especially during the summer season, produce substantial amounts of waste. This scenario adds pressure on local authorities to effectively handle the waste using their existing logistical resources. Currently, more than 76% of hotels and restaurants, particularly those serving tourists, are located in coastal governorates, with only 24% situated in interior governorates. These establishments generate significant amounts of waste, as evidenced by the waste characterization conducted in hotels in Hammamet and Gammarth [35]. Notably, the plastic fraction comprises between 14% and 20% of the total waste generated in these locations. A majority of Tunisian hotels, constituting 83%, dispose of waste without any source sorting, adopting an indiscriminate approach. Conversely, the remaining hotels have taken steps to implement sorting measures, aiming to reduce waste and improve recycling efforts.
- Waste generated from the agricultural sector
The annual estimate for agricultural waste is 4 million tons. This type of waste undergoes recovery and reuse processes, being utilized as livestock feed and for food preparation and heating; it is also suitable for composting on both private and state farms [36].
- Waste generated from industries
The Tunisian coastline is characterized by a significant concentration of urban and tourist activities, with approximately 65% of urban agglomerations (equivalent to around 4.5 million inhabitants) and nearly 95% of hotel capacities (exceeding 200,000 beds) situated in this region. Additionally, almost all of Tunisia’s industrial activities, including heavy industries and the majority of energy-related industries, are clustered along the coast. These industrial activities contribute to various forms of pollution, particularly in coastal areas such as Gabès, Menzel Bourguiba, Bizerte, Goulette Radès, Sousse, Monastir, and Sfax-Skhira [37].
3.2.2. Waste Generated on the Beaches and in Coastal Zones
- Recreational activities
As per APAL [26], the overall coastal length in contact with sea level is 1670 km, comprising 68% continental length, 20% island length, and 12% artificial length. The condition of the coast significantly impacts both manual and mechanical cleaning operations. Presently, there are over 142 beaches along the Tunisian coast. In the target sampling cities, the number of beaches is, respectively, 7 in Tunis, 12 in Sousse, 34 in Nabeul, 5 in Sfax, and 11 in Gabès. The average dimensions of these beaches range from 1 to 7 km in length and 5 to 70 m in width.
These coastal cities are renowned for their diverse recreational activities, hosting various events on their beaches throughout the year, especially during the summer season. Tunisia possesses significant advantages for the development of pleasure boating. Its proximity to Europe is a key factor, complemented by natural attractions that appeal to boaters, such as its central Mediterranean location, extensive coastlines, picturesque landscapes, mild climate, and abundant sunshine. Currently, there are six operational marinas with a combined capacity of 2150 berths: Port El Kantaoui, Monastir, Tabarka, Hammamet, Bizerte, and Sidi Bou-Saïd.
- Tourism activities
The tourism industry stands as a cornerstone of the Tunisian economy, contributing to foreign exchange and exerting considerable influence on trade, transportation, communication, crafts, and more. It accounts for 13.1% of the Tunisian gross domestic product (amounting to 13,928 MTD/year in 2018). The country boasts a hotel capacity exceeding 237,000 beds, with over 86% concentrated along Tunisian beaches [37]. Additionally, 95% of tourist activities are centered in the coastal regions.
In 2018, the tourism sector contributed to approximately 100,000 direct jobs and 289,000 indirect jobs, totaling 389,000 jobs, of which 98,000 were permanent positions [38]. This positions tourism as the second-largest employer, following agriculture.
The economic contribution of tourism is significant, especially when compared with other countries in the Mediterranean basin [37].
- Commercial port activities
Maritime transport holds paramount importance for the national economy. Commercial ports and maritime transportation play a crucial role in fostering development and facilitating the promotion of Tunisia in foreign trade. As per data from the Ministry of Transport [39], a substantial 98% of the country’s foreign trade is conducted via the sea, utilizing eight commercial ports that serve as pivotal hubs in the national economy. Annually, these commercial ports manage the transit of over 30 million tons of goods, 500,000 containers, 140,000 trailers, 720,000 passengers, and 300,000 cars. Tunisia is connected to the main Mediterranean ports through nearly 40 regular maritime lines [37].
- Fishing and aquaculture
The Ministry of Agriculture, Water Resources and Fisheries reported a 2% increase in the production of fishery and aquaculture products in Tunisia, reaching 41,562 tons by the end of the initial five months of 2021. This marks a rise from the 40,673 tons recorded during the corresponding period in 2020.
The fisheries sector holds a crucial position in Tunisia, serving as a vital source of animal protein and contributing significantly to foreign currency earnings. As of 2017, approximately 52,000 individuals directly depend on fishing for their livelihood. Over the years, from 2009 to 2019, Tunisia’s annual fish production has hovered around 125,094 tons, with the central and southern maritime areas contributing to nearly 80% of the overall total. In 2019, the Gulf of Gabès, accessible directly by three governorates (Sfax, Gabès, and Médenine), housed 23,085 fishermen, constituting nearly 45% of the country’s fishing population. Coastal fishing in this region accounted for approximately 70% of the national production in this sector, totaling around 38,000 tons of marine products. The fishing fleet in the same year comprised approximately 12,993 active units, with 93% being coastal boats. The fishing and aquaculture sector provided 50,621 jobs, distributed as follows: 71.5% in coastal fishing, 12% in bluefish fishing, 12.5% in trawling, 2% in shore fishing, and 2% in aquaculture [40].
The percentage distribution of fishing activity across Tunisian governorates in recent years is as follows (see Table 2): Jendouba and Beja (1%), Bizerte (5%), Tunis and Ben Arous (2%), Nabeul (14%), Sousse (4%), Monastir (20%), Mahdia (17%), Sfax (15%), Gabès (6%), Medenine (14%), with the remainder distributed across other governorates.
Table 2.
Fishing port and intensity of the activity in different governorates in Tunisia [40].
Annually, fishing and aquaculture activities produce solid waste, primarily in the form of plastic waste. This includes items like nets, fishing lines, cages, traps, ropes, crab traps, shipping containers, and packaging waste like PET. The utilization of traditional fishing tools is in decline and faces the risk of disappearing due to various factors, primarily associated with pricing, material durability, product availability, and other related considerations.
Tunisia boasts a total of 42 fishing ports spread across the country, categorized into three main types: (1) offshore ports equipped with adequate depth and length of quays, (2) coastal ports with more modest specifications, and (3) shelter sites. Additionally, there is a significant number of artisanal fishing landing sites [40].
3.3. Pressures and Resulting States
3.3.1. Plastic Litter Fraction
The OSPAR tables used to classify litter items were developed to adapt to the frequent litter fractions found in the countries where the OSPAR methodology for beach litter monitoring was developed. A general code and OSPAR ID were attributed to each type of litter item.
For the case of Tunisian beaches, another classification was adopted in order to reduce the number of items and regroup them to obtain a statistical analysis of data from the different surveys based on a specific classification deduced from the type of items frequently found on the beaches.
Figure 7 shows the percentage of plastic fraction identified during the beach litter monitoring on the different beaches during the different sampling campaigns. Plastic represents the main item identified and varies between 54% and 70% of the total number of items generated.
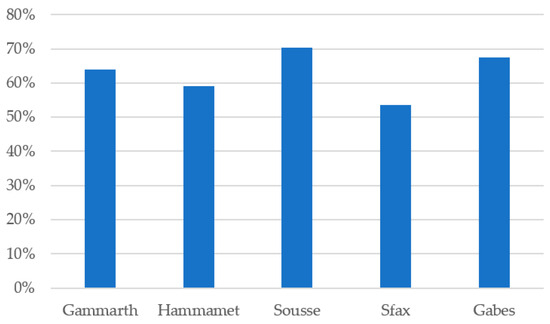
Figure 7.
Percentage of plastic in total waste identified on beaches.
The results indicate that plastic represents the highest fraction of beach litter, including items such as bottles, cutlery items, and bags. In addition, other plastic items related to fishing activities (nets and pieces of nets, cords, etc.) have also been identified on most beaches. Sousse, an important tourism destination with a high level of commercial beach activity, had the largest portion of plastic and single-use plastic items, with 70% of the total identified waste.
The second greatest proportion is observed in Gabès, accounting for 68% of plastics in relation to the overall monitored waste, followed by Gammarth with approximately 64%. In the touristic area of Hammamet, a slightly lower percentage of 59% is noted, likely attributable to effective plastic waste management practices. Last, Sfax exhibits the lowest proportion of plastic waste, comprising around 54% of the total waste.
3.3.2. Number of Items Identified at Sampling Beaches during Different Seasons
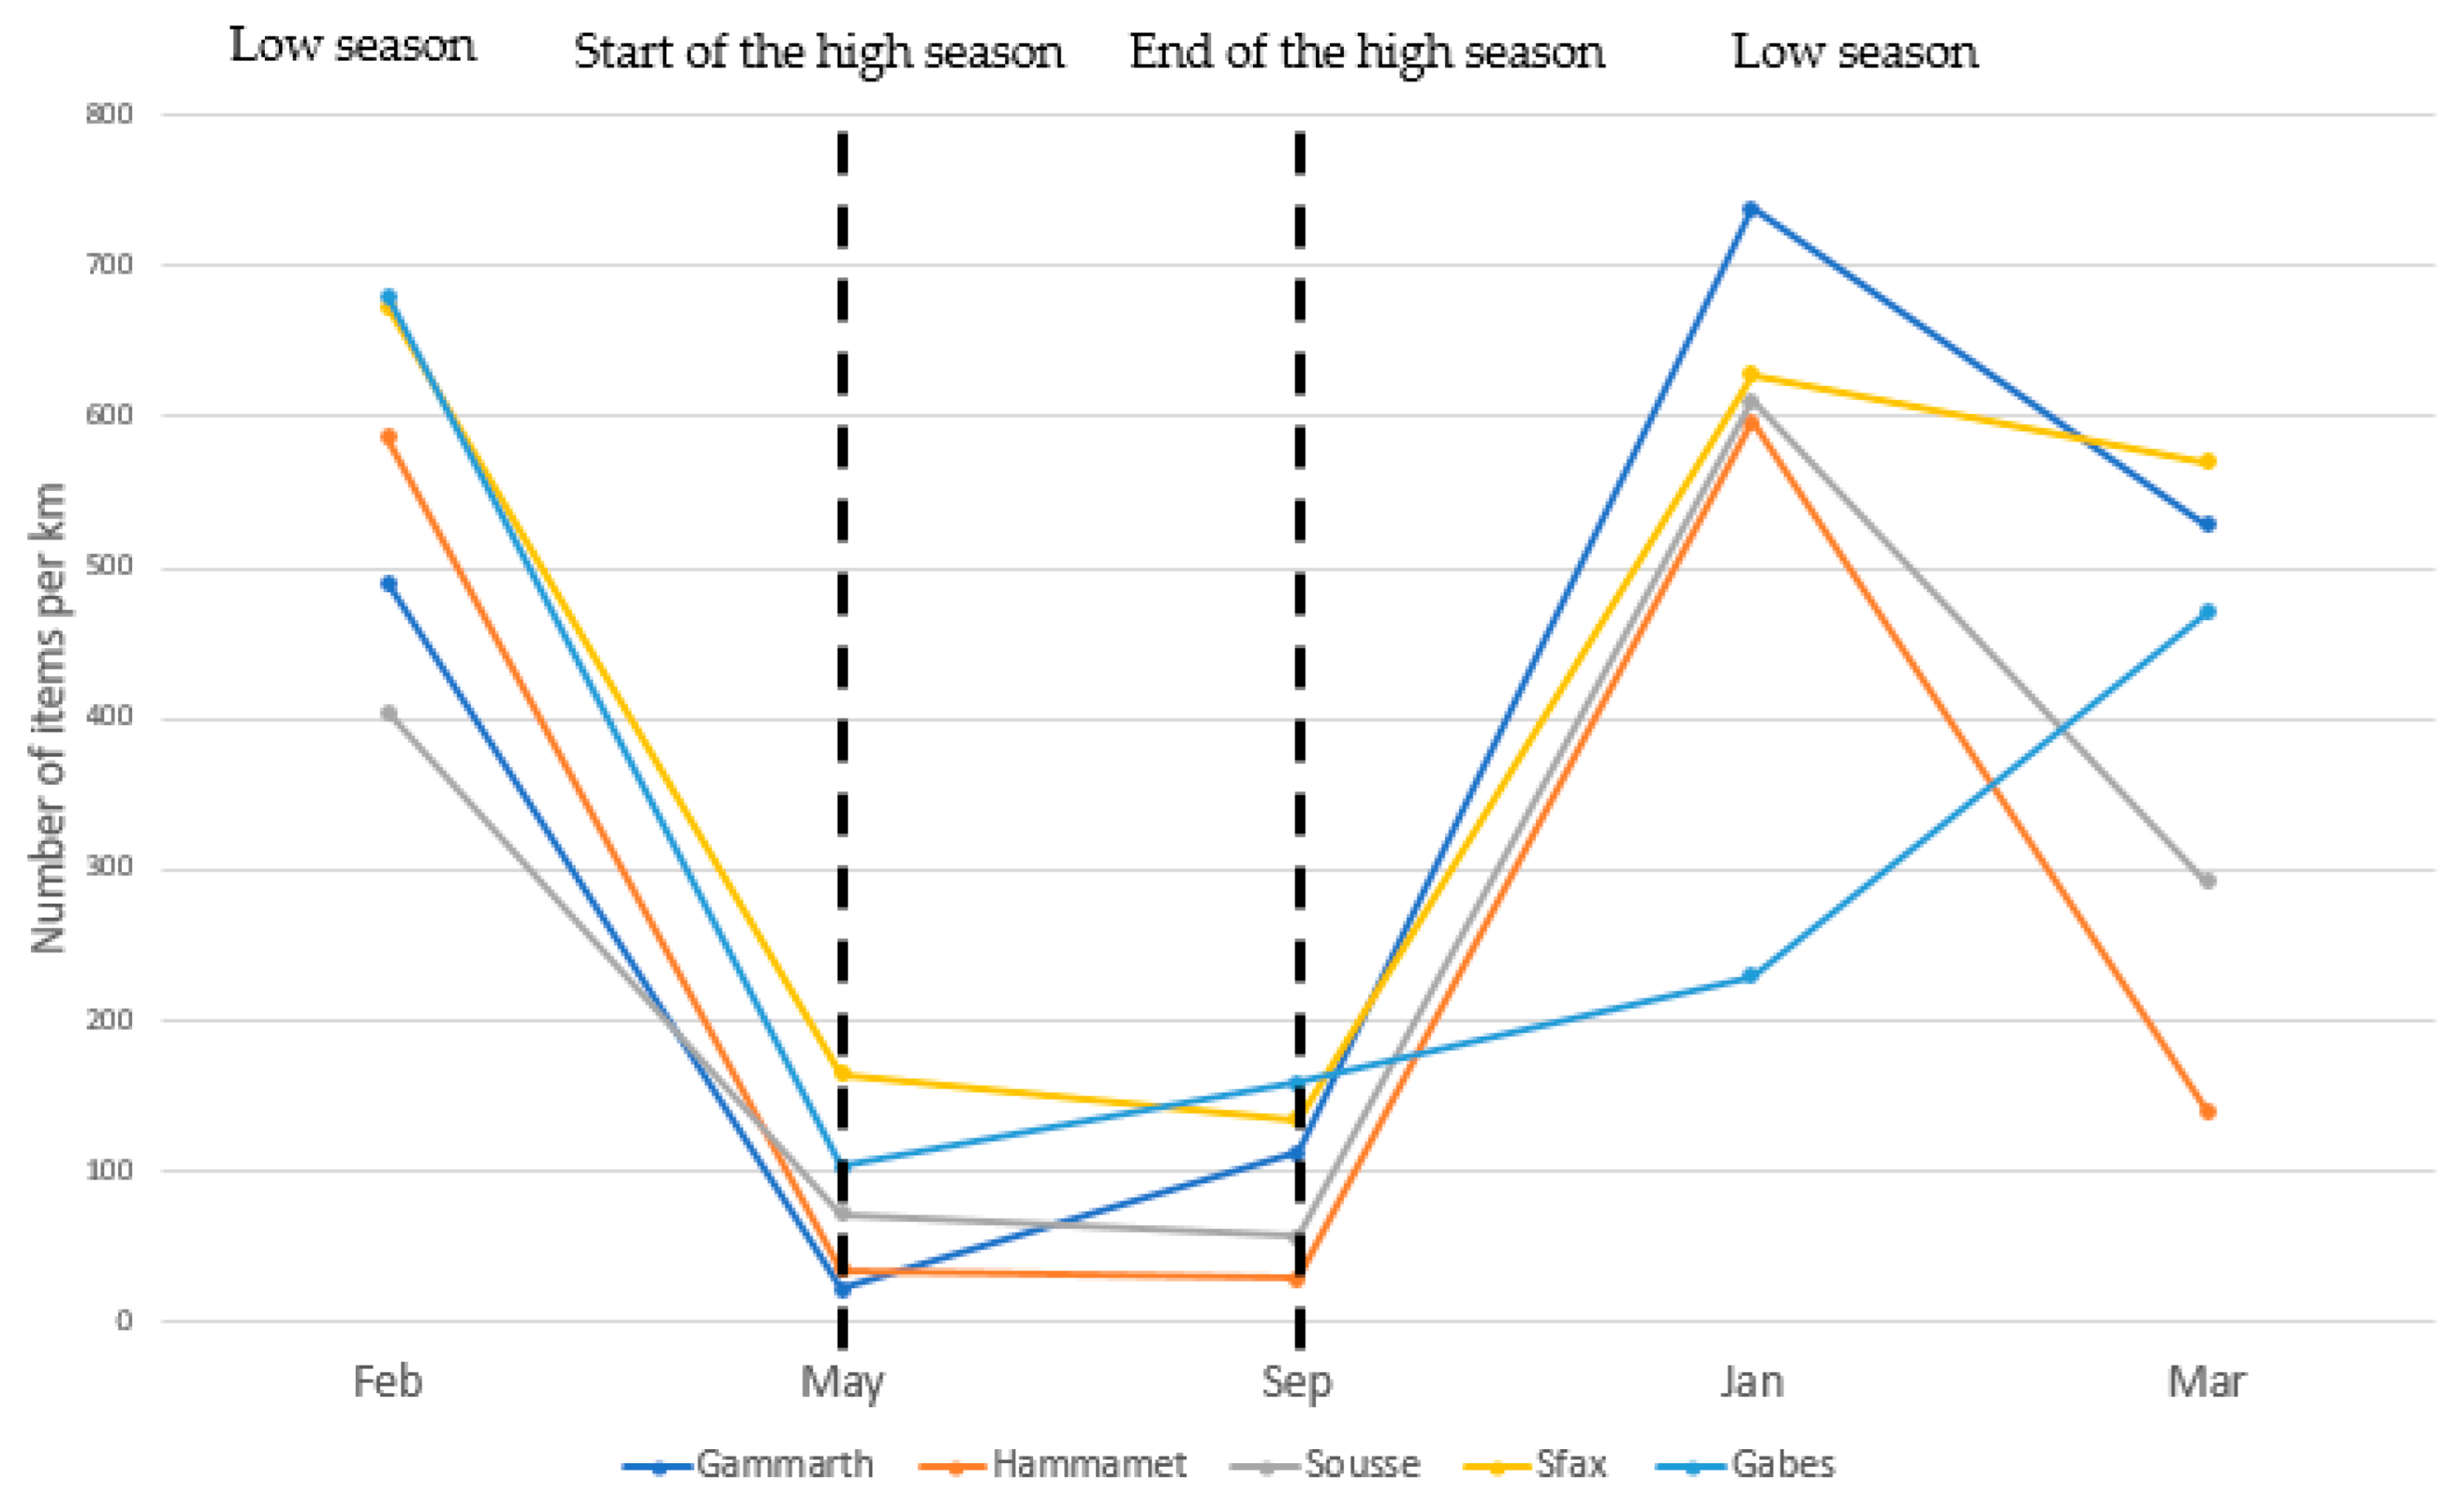
To establish a connection between the littered items identified and waste management and cleaning practices, monitoring campaigns have been conducted throughout various seasons of the year. This approach ensured coverage of different levels of visitor intensity in the area.
The findings in Figure 8 show that the number of items identified on target beaches from September to May was higher than the number of items identified in the period from May to September. Indeed, beach cleaning operations do not occur with uniform frequency throughout the year, nor do they span the entirety of coastal areas across the country. This discrepancy arises due to insufficient financial resources and varying financial situations among municipalities. APAL and the municipalities increase the cleaning operation frequencies before and during high tourism seasons and, particularly, in tourism municipalities (from May until September), which explains the decrease in the amount of litter identified in this period. However, since cleaning actions decrease during the low seasons, this results in the accumulation of litter on beaches for a certain period.
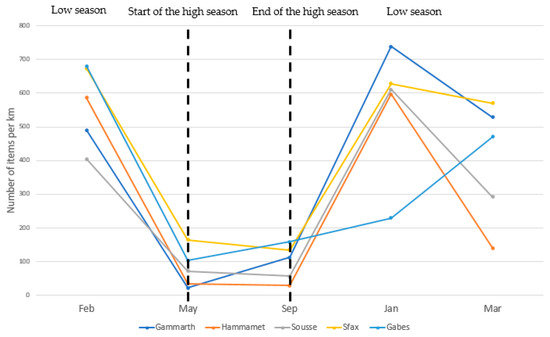
Figure 8.
Fluctuation of the number of items identified (per 100) during different touristic seasons.
3.3.3. Top 15 Plastic Items
In order to highlight the dominant litter fractions on each beach, a list of the fifteen top litter items was identified following the beach litter monitoring campaigns. This list will facilitate the selection and implementation of the most effective reduction measures.
These lists are based on the classification of the litter items following the OSPAR categorization of each piece of litter, including fragments, (identity of litter items) [41].
The items listed in the following table (Table 3) highlight the most frequently found type of litter in each station on the 100 m monitored.
Table 3.
Top 15 items identified in target cities.
3.3.4. Sources of Plastic Litter
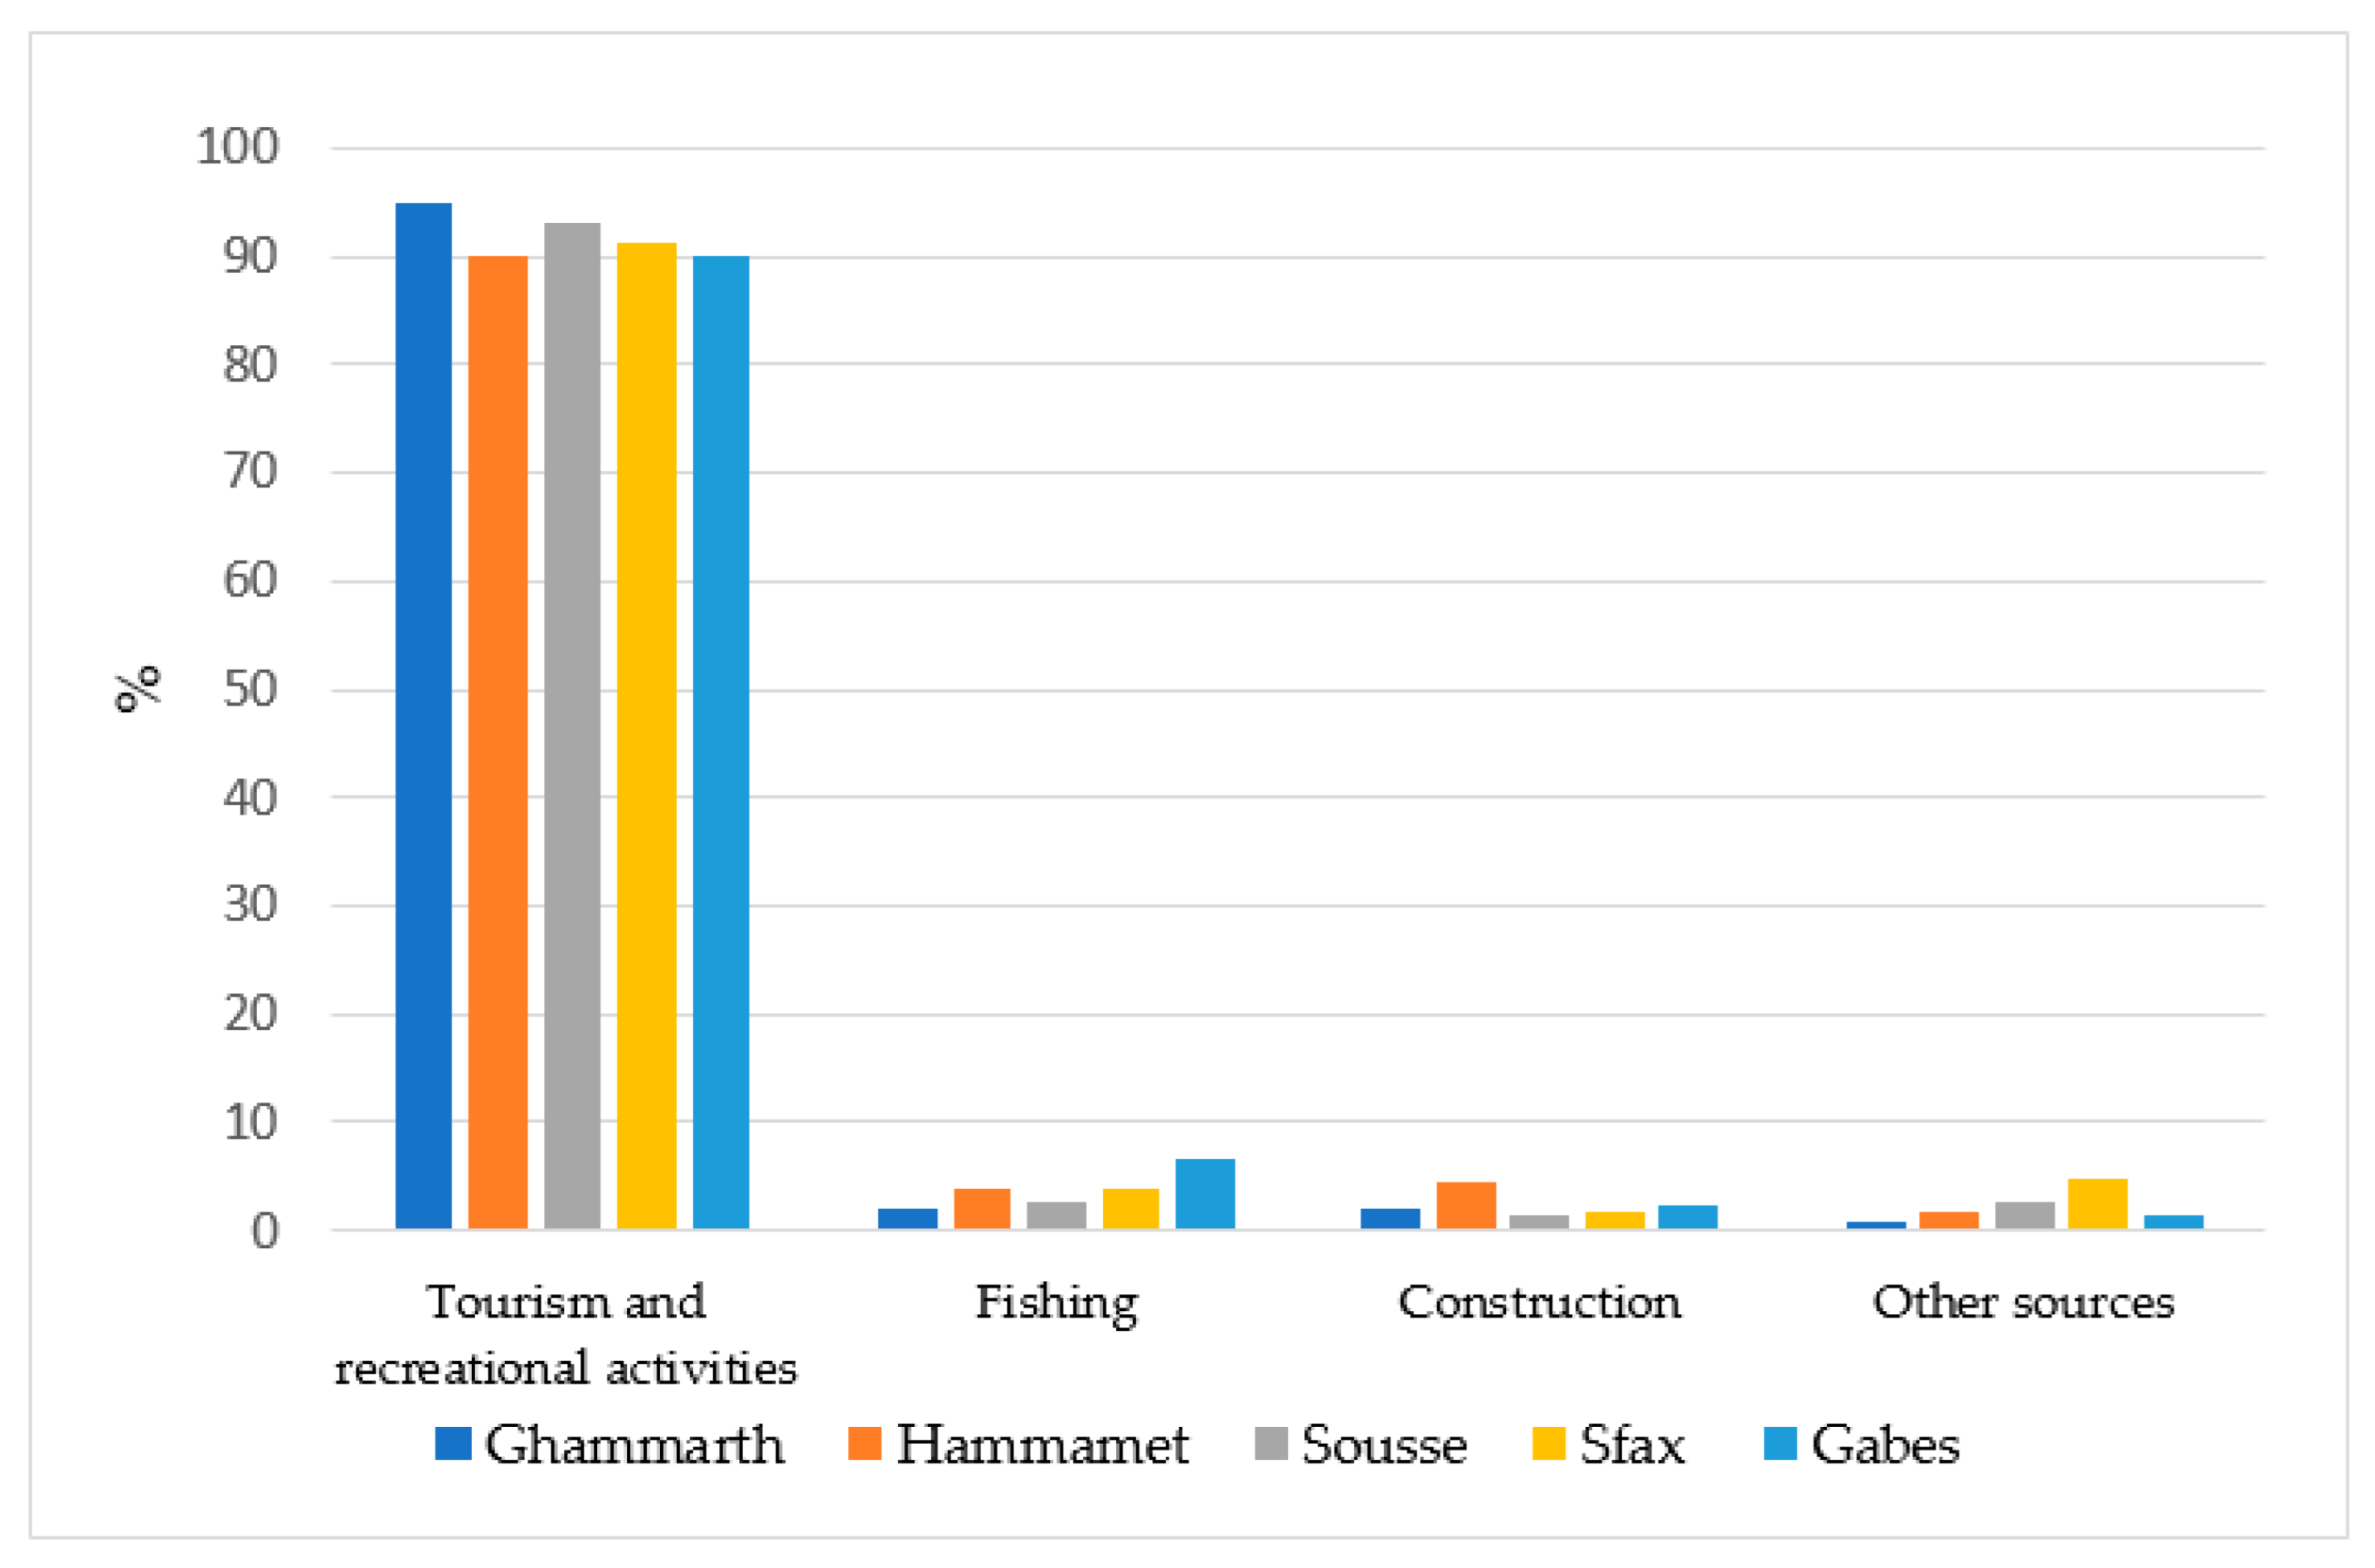
Beach litter and marine litter could have several sources of origin. Several activities have been identified in the Tunisian coastal areas, in addition to waste management practices. In this study, sources of beach litter were classified into four categories: tourism and recreational activities, fisheries, construction waste, and others. The findings in this case study showed an uneven percentage for the different sources as presented in Figure 9.
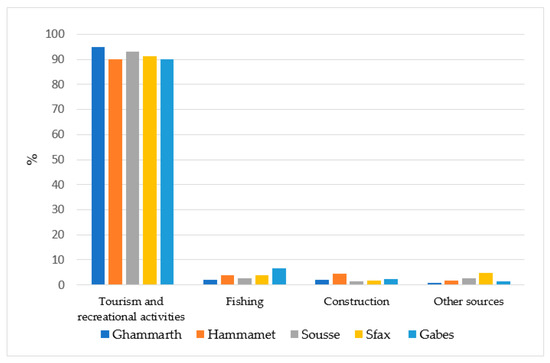
Figure 9.
Percentage of identified litter by each source.
- Tourism and recreational activities sector
Tourism in Tunisia is a sector that produces different forms of pollution; the main types are water pollution, solid waste production, and aesthetic pollution. Waste management is one of the major challenges in tourist areas.
Waste generated by hotel guests per night is superior to the waste generated per inhabitant, per household, per night in tourism municipalities in Tunisia. According to Chaabane [42], the average waste generated in hotels is about 2.6 kg, compared with 1 kg generated by households.
- Fisheries activities
In addition to the waste produced by the significant recreational activity on the Tunisian coast, fishing activities generate different quantities at different intensities, depending on the areas. For example, the production of plastic waste is significant in fishing ports where the intensity of activity is high, such as those of Nabeul (including Hammamet), Mehdia, Monastir, and Sousse, which is a large commercial and touristic port, as well as Sfax, and Médenine, not far from Gabès [34].
- Construction sector
As many entertainment projects are planned to be developed adjacent to beaches, such as cafés, restaurants, or even clubs, a great deal of construction waste is left behind. While walking through the monitored beaches, many pieces of metallic rods, pieces of bricks, plastic tubes, etc. were found.
- Other sources
Litter on the beaches has not only defined sources but also other kinds of sources, such as, but not limited to, medical waste, sports activities waste, and industrial waste (tires, electronic waste, etc.).
The results in Figure 9 indicate that tourism and recreational activities represent the main sources of beach litter in target cities in Tunisia (with more than 90% of the sources). The coastal cities of Tunisia are renowned for their seaside activities. Moreover, Tunisian tourism extends beyond hotels to encompass a diverse range of activities, including restaurants, beach bars, and formal and informal businesses, among others.
The highest percentage of litter is represented by tourism and recreational activities, followed by fishing activities, especially in the southern part of Tunisia. Litter related to construction is also listed as a dominant fraction in Hammamet where many new beach bars and restaurants are being built. As for the remaining sources, these are not related to a fixed or daily activity or the one that took place during the previous day or a few days before but to waste having an unspecified and sometimes unidentifiable source.
3.3.5. Quantity of Plastic Items on 1 km of Beach
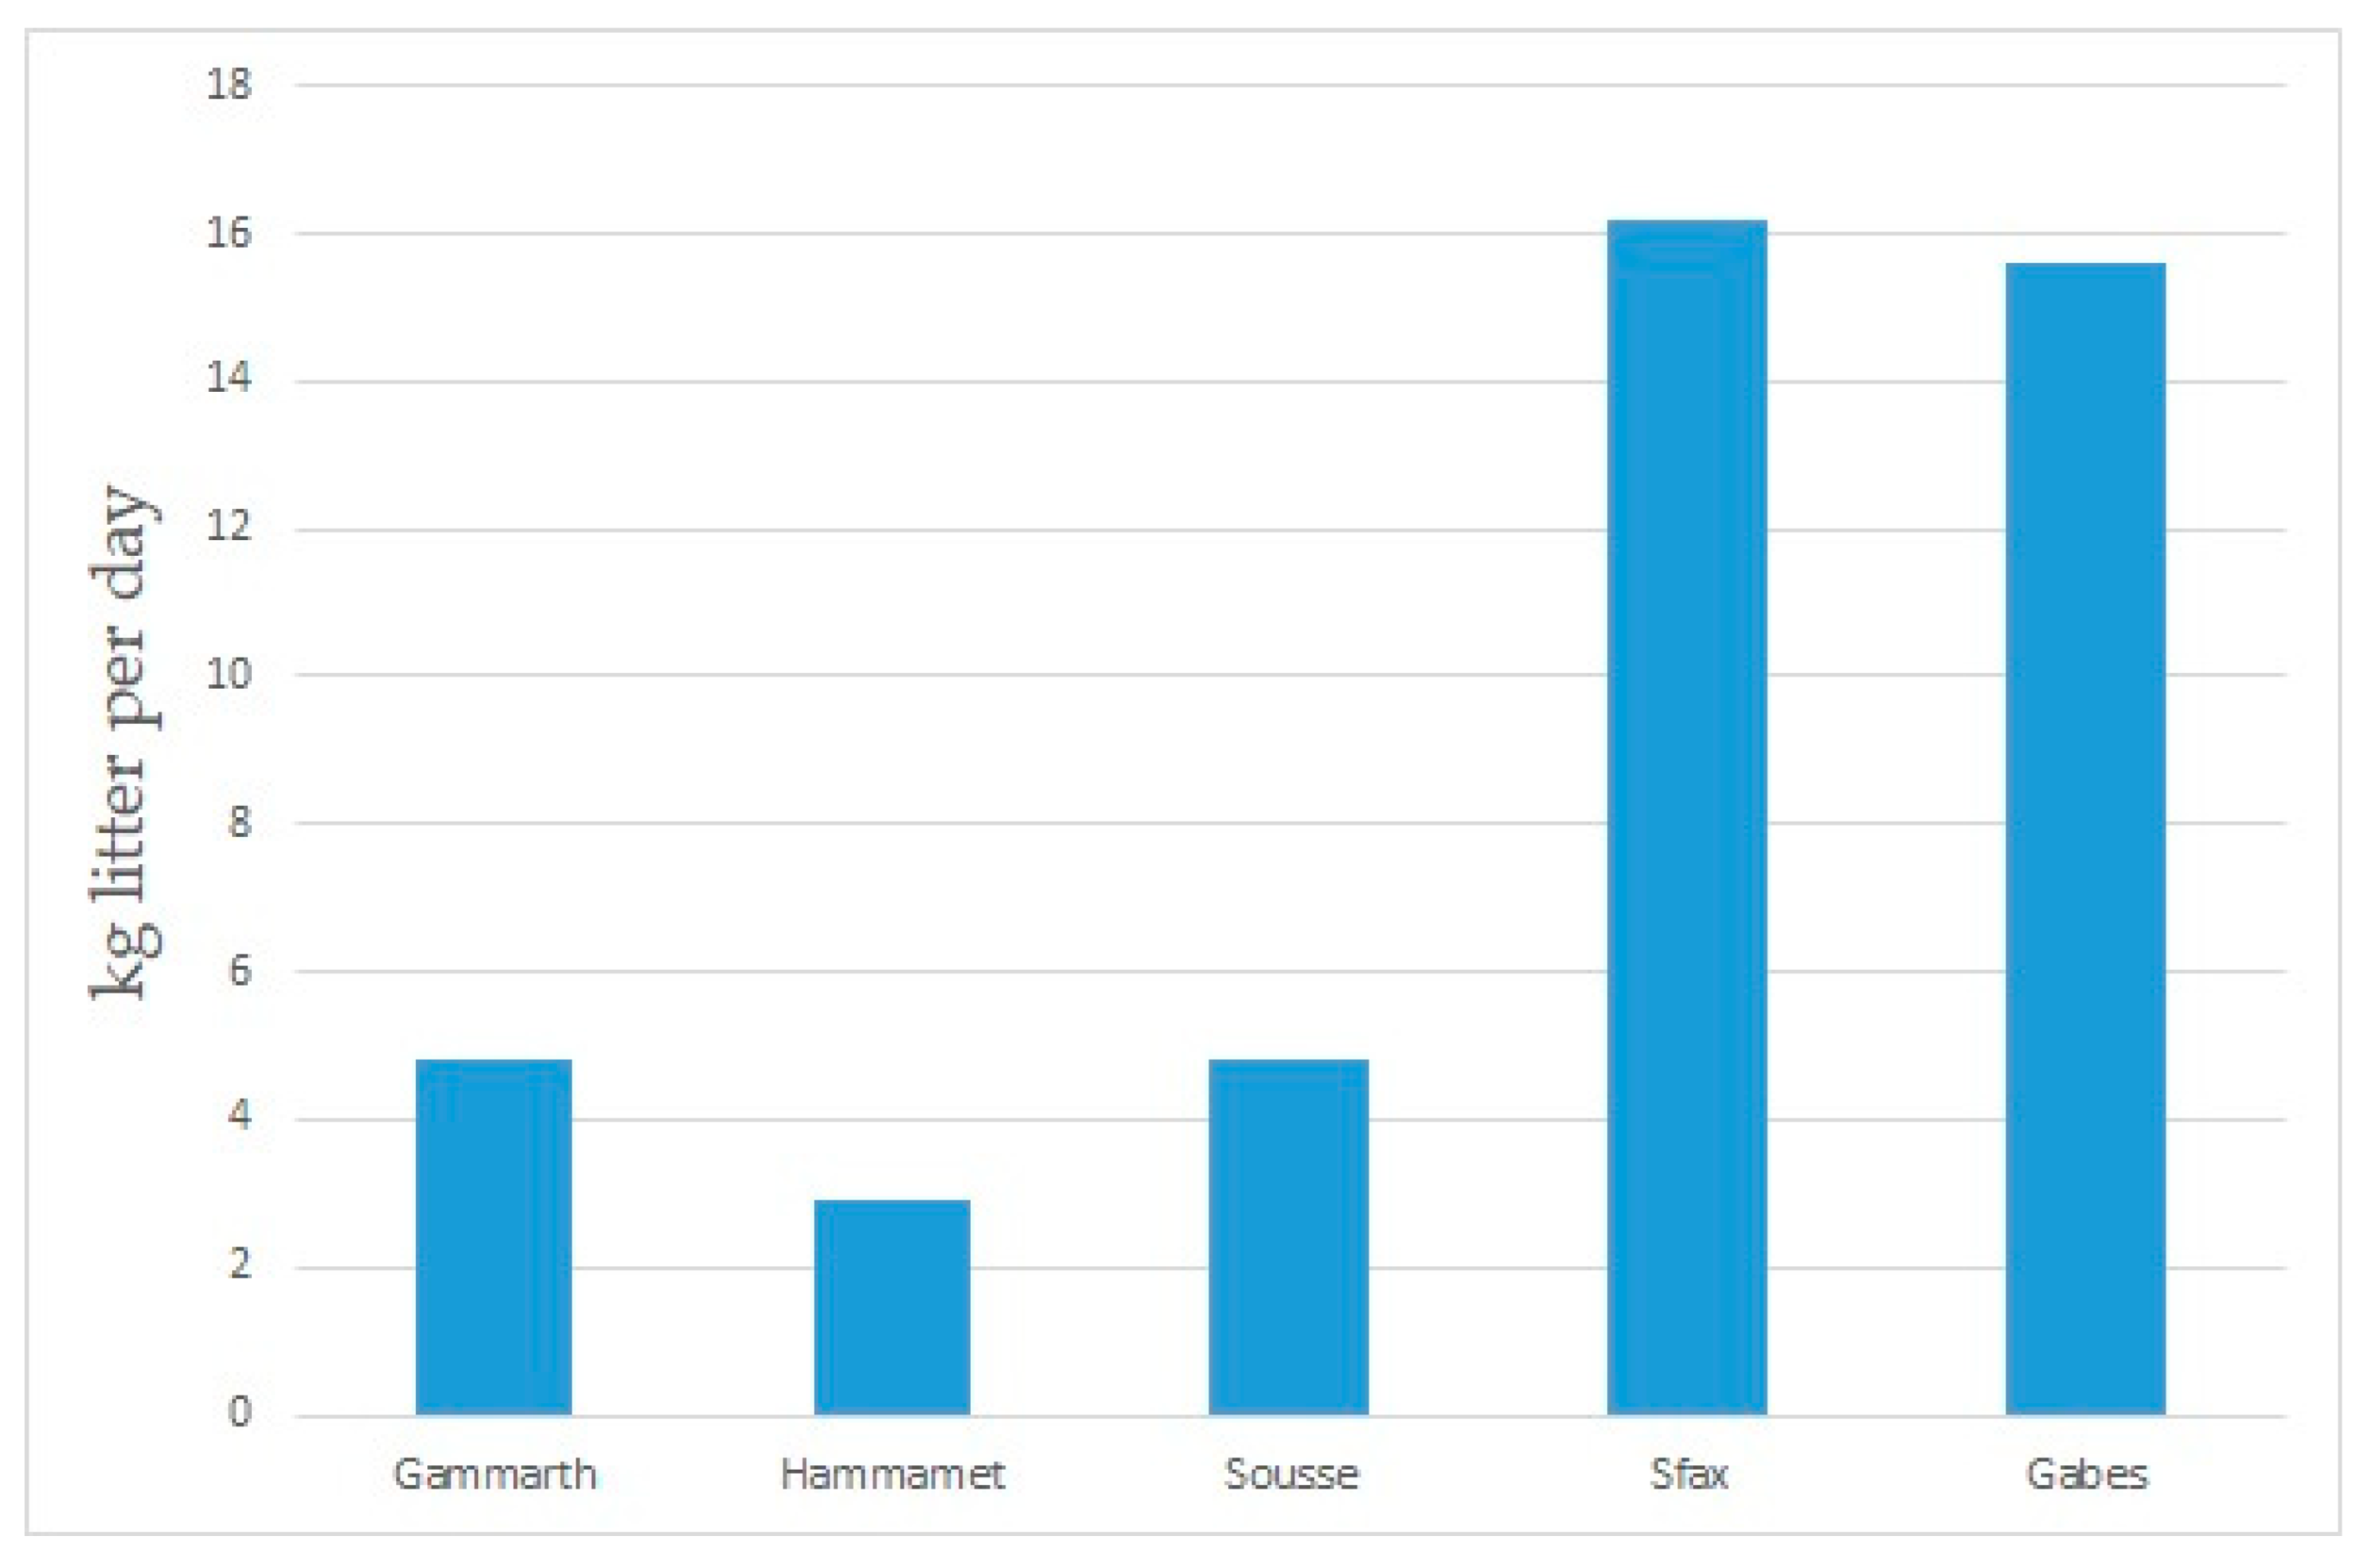
Extending the interpretation of the results from 100 m to 1 km allowed the researchers to give an approximation of the state of the beaches in terms of littering during high seasons compared with local activities. Gammarth, Hammamet, and Sousse are considered to be touristic cities where cleaning activities take place more often compared with other cities, such as Sfax and Gabès. The diagram in Figure 10 explains the low amount of plastic litter with an average of 4.16 kg/km/day (Gammarth: 4.8 kg/km/day; Hammamet: 2.9 kg/km/day; Sousse: 4.8 kg/km/day) and a higher average of 15.9 kg for the other cities (Sfax: 16.2 kg/km/day; Gabès: 15.6 kg/km/day).

Figure 10.
Average amount of plastic waste in target cities per km.
3.3.6. Beach Litter Packaging Percentage
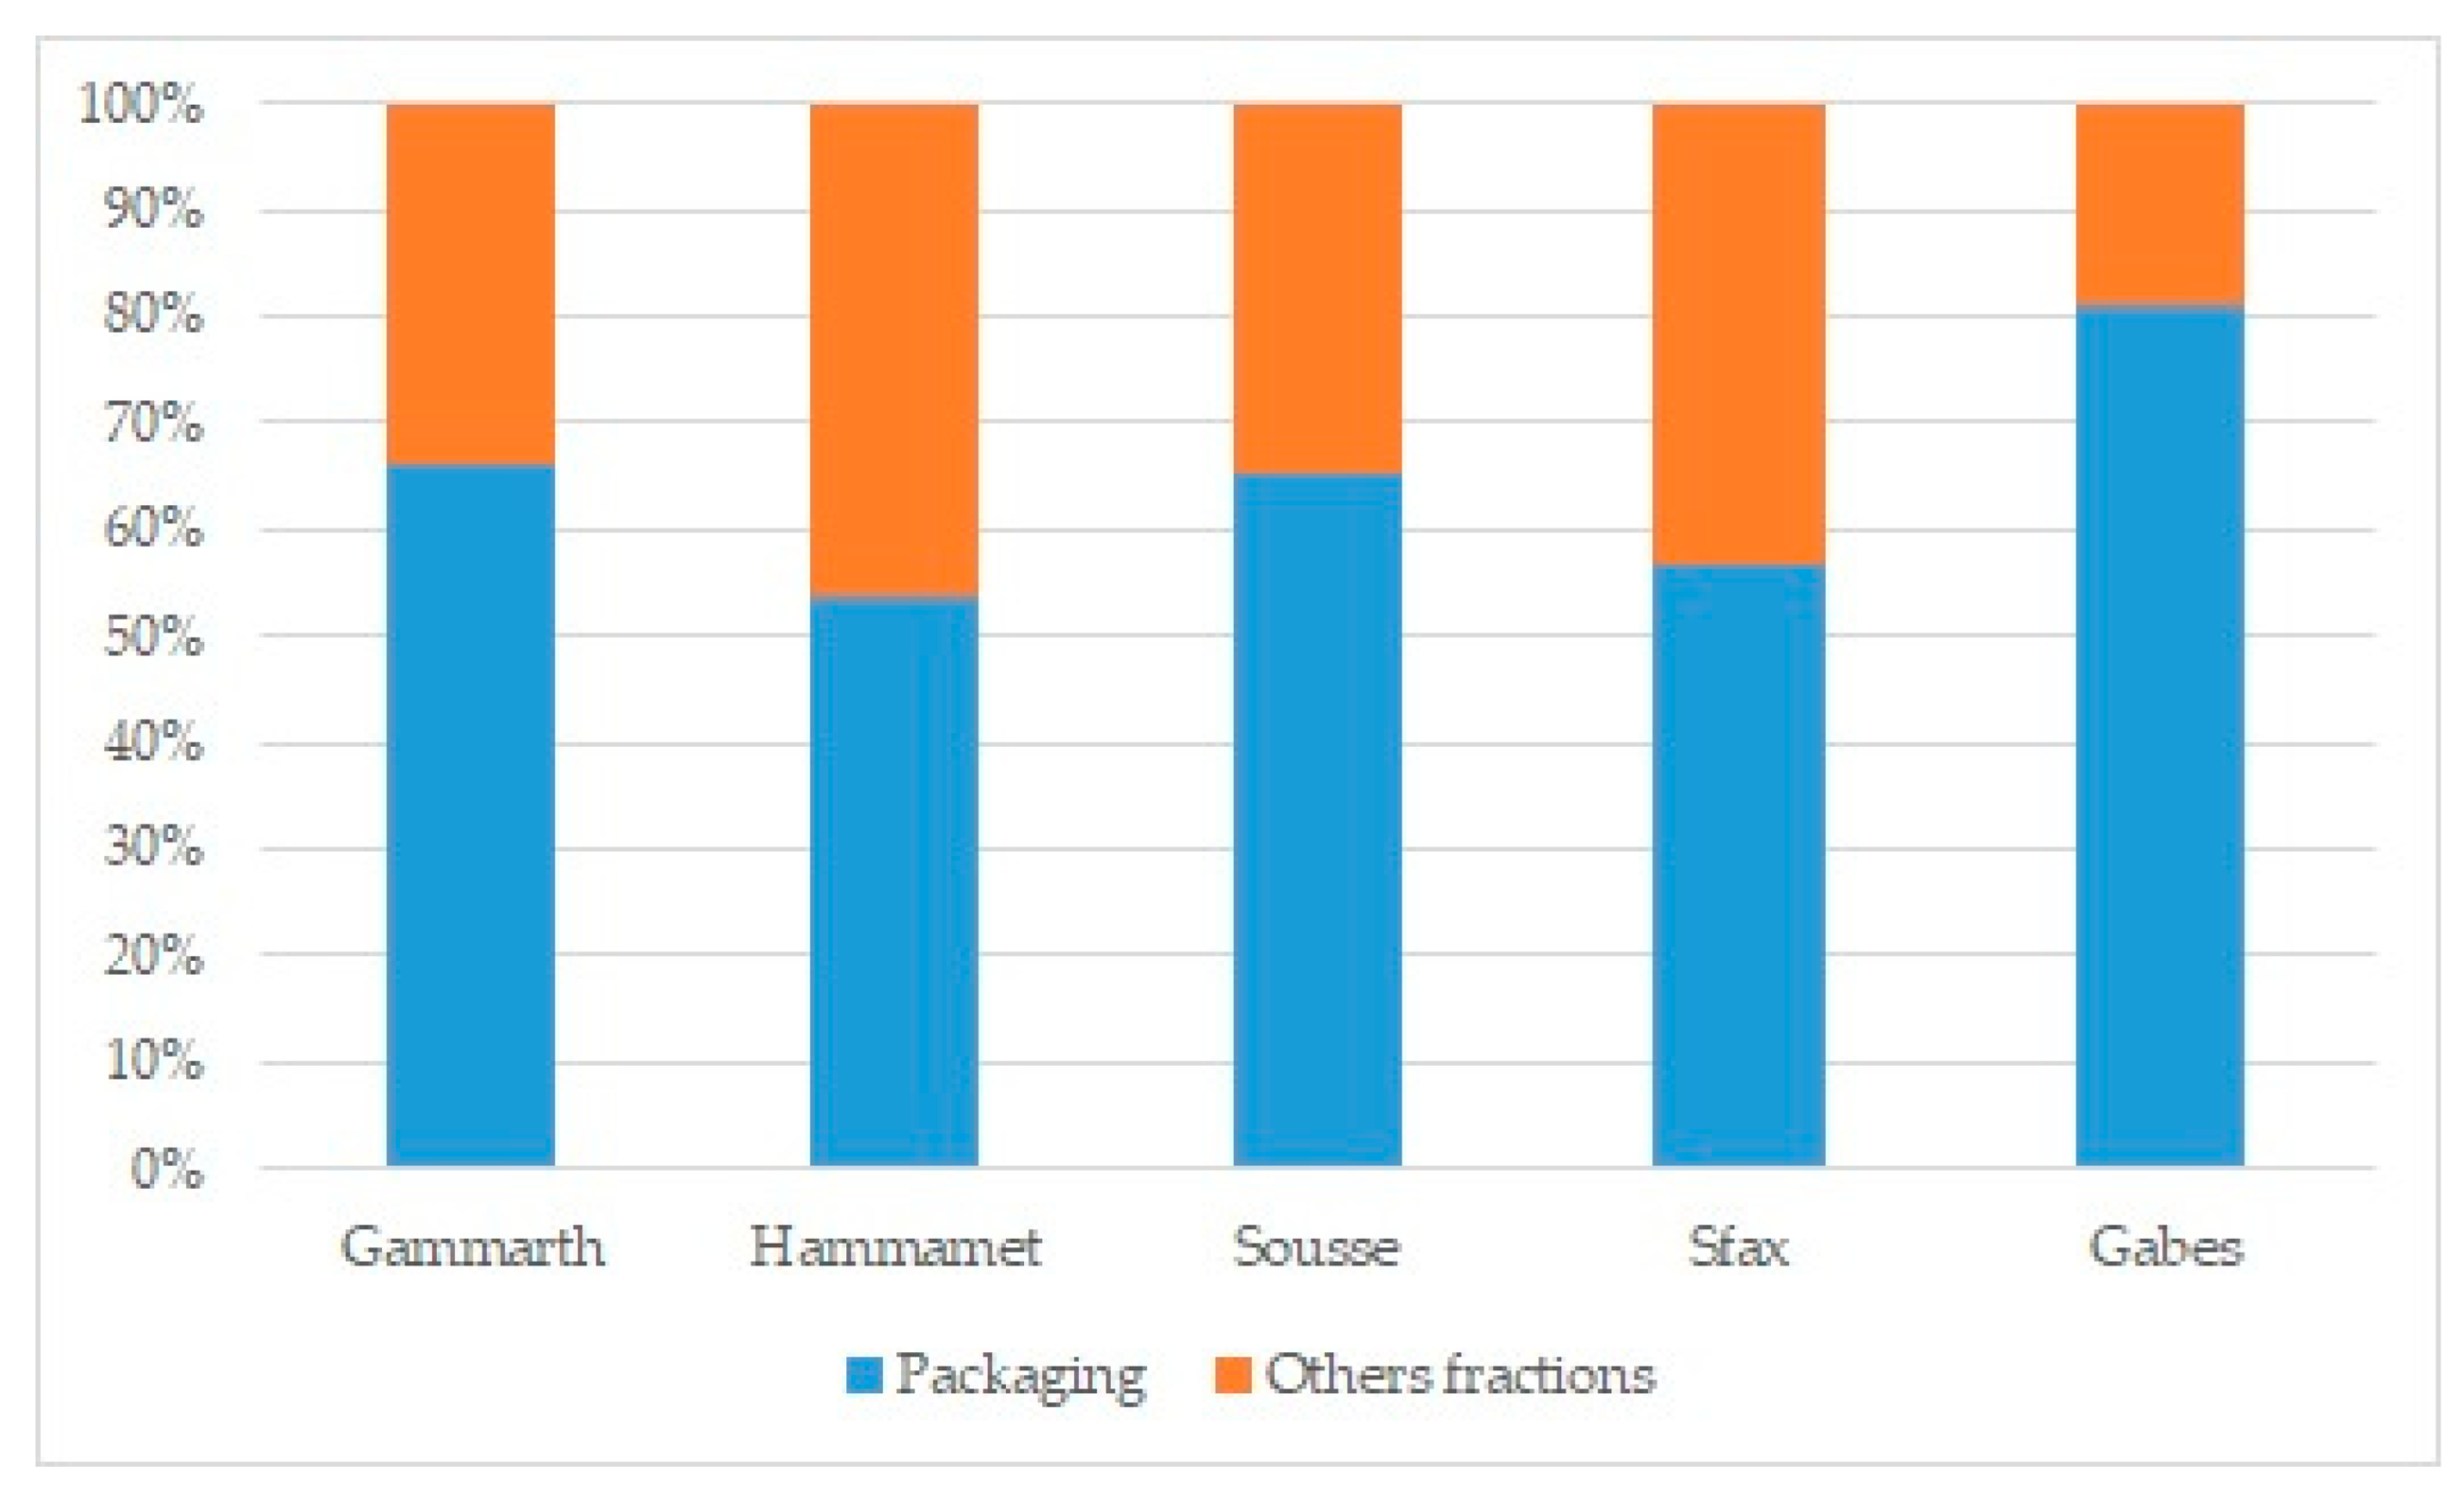
Visually, the packaging is very apparent on beaches in Tunisia. When browsing the beaches during the sampling, it was remarkable that the fraction of packaging was dominant compared with other types of existing waste. Figure 11 highlights the results of the analyses, depicting the proportion of packaging waste within the total identified litter on designated beaches.

Figure 11.
Percentage of the part of packaging fraction in the beach litter.
The average of total results shows that packaging is the main present waste stream in the sampled Tunisian beaches. It represents between 53% and 81% of the total waste monitored. The main identified items cover packaging with or without market value. Examples are food wraps, plastic bottles, films, plastic bags, drinks (bottles, containers, and drums), cans, multilayer packaging, crisp, sweet packets, lolly sticks, etc. Some of these materials are not collectible, given their diminutive dimensions and low value, while others are collected to be recycled. It is worth mentioning, that an important number of recyclable materials were identified on target beaches despite their high market value.
Plastic packaging is of concern to the environment because of its persistence and non-degradability. In addition, it is also harmful visual pollution to local visitors and tourists. This indicator is important for future decision-making processes targeting the establishment of an extended producer responsibility system for packaging in Tunisia. In fact, the identification of the packaging share in the different tourism destinations and in different cities could help when calculating the budget required for each area to ensure cleaning operations.
4. Conclusions and Recommendations
The beach and marine litter issue is clearly visible in coastal areas of Tunisia. Plastic waste represents the main waste fraction identified in the coastal areas and beaches, particularly in the form of packaging materials. The study revealed an average identification of plastic litter at 4.16 kg/km/day in designated tourism areas. Notably, Sfax and Gabès exhibited a higher average of approximately 15.9 kg despite having low beach tourism activity. The findings of this study distinctly indicate that tourism and recreational activities constitute the primary sources of beach litter in coastal Tunisian areas, accounting for between 90% and 95%. In contrast, a smaller proportion of items can be attributed to fishing, construction, and other economic activities.
Even with the presence of a dedicated national system for packaging waste management and recovery (ECO-Lef), the utilization of this system for collecting packaging materials has not been fully developed. A substantial percentage of packaging materials has been identified on Tunisian beaches. The findings indicate that the lowest percentage of recorded packaging on beaches was in Hammamet (53.6%), while the highest percentage was observed in Gabès (83.3%). In fact, the packaging recovery system is predominantly influenced by the informal sector and the lack of traceability regarding the quantities collected outside the system. In addition, collected packaging materials are those that have a market value in Tunisia or outside (export). Furthermore, the current system does only cover a number of packaging products where the volume exceeds 100 mL. Therefore, solutions should be based on sustainable organizational and legal concepts that are adapted to the country’s specificities and existent strategies and systems. In addition, fighting marine litter caused by packaging materials requires the implementation of sustainable and structured financing that targets the circularity of the products put on the market. Therefore, it is highly recommended to optimize the current packaging recovery system by establishing a real extended producer responsibility system that covers packaging waste management operations, including beaches and coastal areas cleaning.
Moreover, local authorities need to improve their waste collection operations to increase the collection rates (84% at present) to avoid plastic pollution. In addition, the current infrastructure for waste treatment should be improved, and old open landfills should be closed. In fact, mismanaged landfills or dumpsites represent an important source of marine litter, particularly when they are located close to the coastal areas.
Plastic bags still represent a major issue in the Tunisian coastal areas. Despite the plastic bags ban launched by the Tunisian government, this problematic item is still causing issues at economic, social, and environmental levels. The results in the case of studied beaches in target cities in Tunisia show that plastic bags are still in the top six items. Plastic bags are more present in non-tourism areas (Gabès and Sfax) than in tourism areas.
Plastic cutlery and single-use items are also present on the Tunisian beaches and in coastal areas. Those items are difficult to collect and are considered to be problematic as they do not have any value and, thus, cannot be reintegrated into the economic value chain. They remain abandoned in the environment without any collection either by the authorities or by the informal sector. This presents several environmental issues. The beach litter monitoring campaigns show that a number of single-use plastic items were identified and are classified as the top 15 plastic items, such as caps and lids, drink bottles, food wrap, cutlery/trays/straws, crisp/sweet packets, lolly sticks, etc. Therefore, it is recommended that a national framework is created that encourages local authorities to prioritize actions and make decisions on the distribution, commercialization, and use of single-use cutlery by citizens, particularly by commerce and businesses. Local decrees related to problematic single-use plastic items should consider the specificities of the area, based on targeted and dedicated monitoring campaigns. In order to gradually integrate the regulations, municipalities should develop pilot projects at specific events or areas in order to monitor the results, find alternatives to the materials used, and duplicate the experience. As an example, according to Baccar Chaabane et al. [43], the municipality of Rostock in Germany developed a pilot project to test the decomposition behavior of biodegradable and single-use tableware items in water sources.
Furthermore, the monitoring campaign highlighted that cigarette butts are placed in the top two items identified in target coastal areas in different seasons and years during the elaboration of this research. Serious actions should be taken at this level as well.
Awareness sharing is a crucial activity that must be reinforced at different levels of the value chain, including the producer, the consumer, and the decision-makers.
While recognizing the significance of exploring circular solutions to address marine and beach litter, the importance of cleaning operations remains pivotal in minimizing litter density along the shorelines. In fact, results show a noticeable and substantial reduction in waste observed on the sampled beaches during the summer season can be directly attributed to the proactive beach cleaning initiatives. In contrast, during the winter period, these efforts are often minimal or entirely lacking, leading to elevated levels of waste accumulation.
The problem of beach litter is evident not just in Tunisia but also in numerous developing and developed nations. Many countries are implementing measures to address marine and beach litter. However, the study report by [44] indicates that despite these efforts, litter on beaches continues to pose several challenges. Addressing the issue necessitates the implementation of a set of cohesive measures tailored to the specific context of each country and the nature of the problematic items. The measures could include but are not limited to establishing extended producer responsibilities, developing a “deposit system” or a “return bonus system”, and banning some single-use plastic items while making available the necessary alternatives.
This research has developed key indicators encompassing the legal, institutional, and financial framework, as well as the driving forces, pressures, and resultant states related to marine litter in Tunisia. These indicators serve as influential factors guiding decision-making processes and could be useful at national and local levels. Nevertheless, these indicators should be used and continuously actualized. Decisions ought to rely on tangible data, which constitute the fundamental element of indicator development and serve as the cornerstone of information.
It is important to recognize and acknowledge certain limitations associated with this study. The primary emphasis of this study was on beaches, but there is potential for extension to examine the marine litter situation in other marine litter sources, such as commercial ports and pleasance ports in Tunisia. However, these areas require developing a specific methodology for litter monitoring.
Author Contributions
Conceptualization, A.B.C., A.N. and H.S.; methodology, A.B.C., A.N. and H.S.; validation, A.B.C., A.N. and H.S.; formal analysis, A.B.C.; investigation, A.B.C.; data curation, A.B.C., A.N. and H.S.; writing original draft preparation, A.B.C.; writing review and editing, A.B.C., A.N. and H.S.; supervision H.S. All authors have read and agreed to the published version of the manuscript.
Funding
This research received no external funding.
Institutional Review Board Statement
Not applicable.
Informed Consent Statement
Informed consent was obtained from all subjects involved in the study.
Data Availability Statement
Data are contained within the article.
Acknowledgments
We express our gratitude to all contributors who assisted in the fieldwork and data collection that contributed to the development of this work.
Conflicts of Interest
The authors declare no conflicts of interest.
References
- Galgani, F.; Fleet, D.; Van Franeker, J.; Katsanevakis, S.; Maes, T.; Mouat, J.; Oosterbaan, L.; Poitou, I.; Hanke, G.; Thompson, R.; et al. Marine strategy framework directive, task group 10 report: Marine Litter. In JRC Scientific and Technical Reports; Zampoukas, N., Ed.; European Commission Joint Research Centre: Ispra, Italy, 2010. [Google Scholar]
- OSPAR. Pilot Project on Monitoring Marine Beach Litter: Monitoring of Marine Litter on Beaches in the OSPAR Region; OSPAR Commission: London, UK, 2007. [Google Scholar]
- Pham, C.K.; Ramirez-Llodra, E.; Alt, C.H.; Amaro, T.; Bergmann, M.; Canals, M.; Company, J.B.; Davies, J.; Duineveld, G.; Galgani, F.; et al. Marine litter distribution and density in European seas, from the shelves to deep basins. PLoS ONE 2014, 9, e95839. [Google Scholar] [CrossRef] [PubMed]
- McWilliams, M.; Liboiron, M.; Wiersma, Y. Rocky shoreline protocols miss micro plastics in marine debris surveys (Fogo Island, Newfoundland and Labrador). Mar. Pollut. Bull. 2017, 129, 480–486. [Google Scholar] [CrossRef] [PubMed]
- Addamo, A.M.; Perrine, L.; Hanke, G. Top Marine Beach Litter Items in Europe. A review and synthesis based on beach litter data. In MSFD Technical Group on Marine Litter; European Training Foundation: Torino, Italy, 2017. [Google Scholar]
- Lebreton, L.; Slat, B.; Ferrari, F.; Sainte-Rose, B.; Aitken, J.; Marthouse, R.; Hajbane, S.; Cunsolo, S.; Schwarz, A.; Levivier, A.; et al. Evidence that the Great Pacific Garbage Patch is rapidly accumulating plastic. Sci. Rep. 2018, 8, 4666. [Google Scholar] [CrossRef] [PubMed]
- Law, K.L.; Morét-Ferguson, S.; Maximenko, N.A.; Proskurowski, G.; Peacock, E.E.; Hafner, J.; Reddy, C.M. Plastic accumulation in the North Atlantic subtropical gyre. Science 2010, 329, 1185–1188. [Google Scholar] [CrossRef] [PubMed]
- Cózar, A.; Martí, E.; Duarte, C.M.; García-de-Lomas, J.; van Sebille, E.; Ballatore, T.J.; Eguíluz, V.M.; González-Gordillo, J.I.; Pedrotti, M.L.; Echevarría, F.; et al. The Arctic Ocean as a dead end for floating plastics in the North Atlantic branch of the Thermohaline Circulation. Sci. Adv. 2017, 3, e1600582. [Google Scholar] [CrossRef] [PubMed]
- Lacerda, A.L.D.F.; Rodrigues, L.D.S.; van Sebille, E.; Rodrigues, F.L.; Ribeiro, L.; Secchi, E.R.; Kessler, F.; Proietti, M.C. Plastics in sea surface waters around the Antarctic Peninsula. Sci. Rep. 2019, 9, 3977. [Google Scholar] [CrossRef] [PubMed]
- Mulochau, T.; Lelabousse, C.; Séré, M. Estimations of densities of marine litter on the fringing reefs of Mayotte (France—South Western Indian Ocean)—Impacts on coral comunities. Mar. Pollut. Bull. 2020, 160, 111643. [Google Scholar] [CrossRef] [PubMed]
- United Nations Environment Programme. Marine Litter. An Analytical Overview; United Nations Environment Programme: Nairobi, Kenya, 2005. [Google Scholar]
- Van Cauwenberghe, L.; Vanreusel, A.; Mees, J.; Janssen, C.R. Microplastic pollution in deep-sea sediments. Environ. Pollut. 2013, 182, 495–499. [Google Scholar] [CrossRef] [PubMed]
- Plastics Europe. An Analysis of European Plastics Production, Demand and Waste Data. In Plastics—The Facts; Plastics Europe: Brussels, Belgium, 2016. [Google Scholar]
- Oberbeckmann, S.; Loeder, M.G.; Gerdts, G.; Osborn, A.M. Spatial and seasonal variation in diversity and structure of microbial biofilms on marine plastics in Northern European waters. FEMS Microbiol. Ecol. 2014, 90, 478–492. [Google Scholar] [CrossRef] [PubMed]
- Watkins, E.; ten Brink, P. Marine Litter Socio Economic Study; United Nations Environment Programme: Nairobi, Kenya, 2017. [Google Scholar]
- Topçu, E.N.; Tonay, A.M.; Dede, A.; Öztürk, A.A.; Öztürk, B. Origin and abundance of marine litter along sandy beaches of the Turkish Western Black Sea Coast. Mar. Environ. Res. 2013, 85, 21–28. [Google Scholar] [CrossRef] [PubMed]
- Thiel, M.; Hinojosa, I.A.; Miranda, L.; Pantoja, J.F.; Rivadeneira, M.M.; Vásquez, N. Anthropogenic marine debris in the coastal environment: A multi-year comparison between coastal waters and local shores. Mar. Pollut. Bull. 2013, 71, 307–316. [Google Scholar] [CrossRef] [PubMed]
- Galil, B.S.; Golik, A.; Türkay, M. Litter at the bottom of the sea: A sea bed survey in the eastern Mediterranean. Mar. Pollut. Bull. 1995, 30, 22–24. [Google Scholar] [CrossRef]
- Galgani, F.; Burgeot, T.; Bocquene, G.; Vincent, F.; Leaute, J.; Labastie, J. Distribution and abundance of debris on the continental shelf of the Bay of Biscay and in Seine Bay. Mar. Pollut. Bull. 1995, 30, 58–62. [Google Scholar] [CrossRef]
- Galgani, F.; Leaute, J.P.; Moguedet, P.; Souplet, A.; Verin, Y.; Carpentier, A. Litter on the sea floor along European coasts. Mar. Pollut. Bull. 2000, 40, 516–527. [Google Scholar] [CrossRef]
- Ramirez-Llodra, E.; De Mol, B.; Company, J.B.; Coll, M.; Sardà, F. Effects of natural and anthropogenic processes in the distribution of marine litter in the deep Mediterranean Sea. Prog. Oceanogr. 2013, 118, 273–287. [Google Scholar] [CrossRef]
- Chaabane, W. IUCN Report: Overview of Marine Pollution by Plastic Waste in North African Countries; (Not published); FAO: Rome, Italy, 2021. [Google Scholar]
- Chaabane, W.; Nassour, A.; Nelles, M. Solid Waste Management Key Indicator Development for Hotels: A Tunisian Case Study Analysis. Recycling 2018, 3, 56. [Google Scholar] [CrossRef]
- Kershaw, P.J.; Turra, A.; Gakgani, F. Guidelines or the monitoring and assessment of plastic litter and microplastics in the ocean. In Reports and Studies; (GESAMP): IMO/FAO/UNESCO-IOC/UNIDO/WMO/IAEA/UN/UNEP/UNDP/ISA Joint Group of Experts on the Scientific Aspects of Marine Environmental Protection: London, UK, 2019; p. 130. [Google Scholar]
- Zabaleta, A. Sustainability Indicators for Municipal Solid Waste Treatment. Case study—The City of Stockholm: Landfill vs. Incineration. Master’s Thesis, KTH, School of Industrial Engineering and Management (ITM), Stockholm, Sweden, 2008. [Google Scholar]
- Ministry of Environment, Coastal Protection and Planning Agency (APAL), Government of Tunisia. Coastal Protection and Development Agency APAL; Ministry of Environment, Coastal Protection and Planning Agency (APAL), Government of Tunisia: Tunisia, Africa, 2013; (unpublished report). [Google Scholar]
- Ministry of Environment. Study of the Diagnosis and Upgrade of the Plastic Bag Sector in Tunisia; Ministry of Environment: Tunisia, Africa, 2018; (Unpublished report). [Google Scholar]
- OSPAR. Guideline for Monitoring Marine Litter on the Beaches in the OSPAR Maritime Area; OSPAR Commission: London, UK, 2010; ISBN 90-3631-973. [Google Scholar]
- Schulz, M.; van Loon, W.; Fleet, D.M.; Baggelaar, P.; van der Meulen, E. OSPAR standard method and software for statistical analysis of beach litter data. Mar. Pollut. Bull. 2017, 122, 166–175. [Google Scholar] [CrossRef] [PubMed]
- National Waste Management Agency (ANGED). Report 2018; National Waste Management Agency (ANGED): Tunisia, Africa, 2018. [Google Scholar]
- Jambeck, J.R.; Geyer, R.; Wilcox, C.; Siegler, T.R.; Perryman, M.; Andrady, A.; Narayan, R.; Law, K.L. Marine pollution. Plastic waste inputs from land into the ocean. Science 2015, 347, 768–771. [Google Scholar] [CrossRef] [PubMed]
- Dalberg Advisors. World Wildlife Fund: Mediterranean Marine Initiative. In Stop the Flood of Plastic: How Mediterranean Countries Can Save Their Sea; WWF—World Wide Fund for Nature: Gland, Switzerland, 2019. [Google Scholar]
- UN Enivronment Programme/Mediterranean Action Plan (UNEP/MAP). Report: Marine Litter Assessment in the Mediterranean; UN Enivronment Programme/Mediterranean Action Plan (UNEP/MAP): Athens, Greece, 2015. [Google Scholar]
- World Bank. Tunisia’s Strategy «Littoral Sans Plastiques—LISP»: Diagnosis of the Situation and Draft Action Plan; World Bank: Washington, DC, USA, 2022. [Google Scholar]
- Chaabane, W.; Nassour, A.; Bartnik, S.; Bünemann, A.; Nelles, M. Shifting Towards Sustainable Tourism: Organizational and Financial Scenarios for Solid Waste Management in Tourism Destinations in Tunisia. Sustainability 2019, 11, 3591. [Google Scholar] [CrossRef]
- Report on the Solid Waste Management in TUNISIA; Sweep-Net Project; 2014. Available online: https://www.retech-germany.net/fileadmin/retech/05_mediathek/laenderinformationen/Tunesien_laenderprofile_sweep_net.pdf (accessed on 2 April 2021).
- World Bank. The Blue Economy in Tunisia: Opportunity for Integrated and Sustainable Development of the Sea and Coastal Zones; World Bank: Washington, DC, USA, 2022. [Google Scholar]
- Tunisian Hotel Federation FTH et KPMG; World Bank: Washington, DC, USA, 2019.
- Official Website of the Ministry of Transport. Available online: http://www.transport.tn/fr/maritime/presentation (accessed on 3 August 2023).
- Ministry of Agriculture, General Directorate of Fisheries and Aquaculture. Report of the Preparatory Study for the Project to Build a Monitoring Vessel for the Management of Fishery Resources in the Tunisian Republic; Ministry of Agriculture, General Directorate of Fisheries and Aquaculture: Tunisia, Africa, 2020. [Google Scholar]
- G. JRC Technical Report. Marine Beach Litter in Europe—Top Items. European Union. 2016. Available online: https://ec.europa.eu/jrc (accessed on 5 February 2024).
- Chaabane, W. Solid Waste Management in Tourism Destinations in Tunisia: Diagnostic and Improvement Approaches. Doctoral Dissertation, University of Rostock, Rostock, Germany, 2020. [Google Scholar] [CrossRef]
- Baccar Chaabane, A.; Robbe, E.; Schernewski, G.; Schubert, H. Decomposition Behavior of Biodegradable and Single-Use Tableware Items in the Warnow Estuary (Baltic Sea). Sustainability 2022, 14, 2544. [Google Scholar] [CrossRef]
- Report on Assessing the Role and Impact of EPR in the Prevention of Marine Plastic Packaging Litter. GIZ: German Society for International Cooperation (GIZ) GmbH. 2022. Available online: https://www.giz.de/en/downloads/giz2022-en-epr-plastic-packaging-litter.pdf (accessed on 5 February 2024).


Disclaimer/Publisher’s Note: The statements, opinions and data contained in all publications are solely those of the individual author(s) and contributor(s) and not of MDPI and/or the editor(s). MDPI and/or the editor(s) disclaim responsibility for any injury to people or property resulting from any ideas, methods, instructions or products referred to in the content. |
© 2024 by the authors. Licensee MDPI, Basel, Switzerland. This article is an open access article distributed under the terms and conditions of the Creative Commons Attribution (CC BY) license (https://creativecommons.org/licenses/by/4.0/).