Article

Design Optimization of a Grid-Tied Hybrid System for a Department at a University with a Dispatch Strategy-Based Assessment

1
Department of Electrical, Electronic and Communication Engineering (EECE), Pabna University of Science and Technology (PUST), Pabna 6600, Bangladesh
2
Department of Electrical Engineering and Industrial Automation, Engineering Institute of Technology, Melbourne Campus, Melbourne, VIC 3001, Australia
3
School of Engineering and Energy, Murdoch University, Perth, WA 6150, Australia
4
Remote Sensing Unit, Electrical Engineering Department, Northern Border University, Arar 73213, Saudi Arabia
5
Department of Electrical and Electronic Engineering, Uttara University, Dhaka 1230, Bangladesh
6
Department of Computer Science, Victoria University, Sydney, NSW 2000, Australia
*
Authors to whom correspondence should be addressed.
Sustainability 2024, 16(7), 2642; https://doi.org/10.3390/su16072642
Submission received: 4 February 2024 / Revised: 5 March 2024 / Accepted: 19 March 2024 / Published: 23 March 2024

Abstract

:
In this research project, the optimal design and design evaluation of a hybrid microgrid based on solar photovoltaics, wind turbines, batteries, and diesel generators were performed. The conventional grid-tied mode was used in addition to dispatch strategy-based control. The study’s test location was the loads in the Electrical, Electronic and Communication Engineering (EECE) department at Pabna University of Science and Technology (PUST), Pabna, Bangladesh. DIgSILENT PowerFactory was employed to determine the power system-based behaviors (electrical power, current, voltage, and frequency) of the proposed hybrid system, while a derivative-free algorithm was used for the expense, optimal size, and emission assessments. While developing the microgrid, load following (LoF) and cycle charging (CyC) control were employed. The microgrid is supposed to have a 23.31 kW peak load requirement. The estimated microgrid’s levelized cost of energy (LE), its net present cost (NC), its operating cost, and its annual harmful gas emissions were estimated in this work. Additionally, since the microgrid is grid-connected, the amount of energy output that might be exported to the grid was also estimated, which will potentially increase during blackouts. The power system responses found in this study ensure that the various microgrid components’ voltage, frequency, current, and power outcomes are steady within the designated range, making the microgrid practical and robust.

1. Introduction

The world is developing and the population is increasing rapidly. Every day, the global demand for electrical energy is increasing substantially due to the fast growth of both the population and the economy. An increasing amount of the world’s continuously growing electricity demand is met by fossil fuels. The problem with producing electricity from fossil fuels is that they will eventually run out and that this kind of energy production is detrimental to the environment [1]. This demonstrates the need for an alternative source that will be a dependable, sustainable, and green source of energy. An option could be the usage of renewable energy sources such as hydro, wave, solar, geothermal, wind, etc., which are potential sustainable substitutes [2].
Renewable energy sources can be very effectively operated and governed within a setup named “microgrid”. A microgrid is a condensed form of a conventional grid system that generates and distributes power across a comparatively small area, primarily using renewable resources. Microgrids are created when numerous sources of renewable energy and loads are integrated within a specific area. With hybrid microgrids, a range of electricity sources (especially renewable) are combined with the ability to access AC as well as DC power supplies and loads [3]. Because of their high efficiency and sustainability, microgrids provide an extremely interesting research topic [4]. Microgrids mostly employ solar and wind power as their intermittent energy sources, and therefore a robust energy management system is necessary to ensure that the microgrid runs efficiently and meets its goals. In this regard, the dispatch strategy (DiS), an energy management system, controls and regulates the microgrid’s energy flow [5] as well as cost-related functions and performances [6]. A microgrid’s dispatching strategy (DiS) is a set of rules or guidelines that control the generating and storage units in order to satisfy the demand for electricity. It is a technique for controlling the microgrid such that the demand is efficiently satisfied. The microgrid’s total size, system costs, and system performance are all impacted by the dispatch control implementation. In addition to other DiSs, like predictive dispatch and generator order, load-following (LoF) and cycle-charging (CyC) dispatch techniques have been considered in this research endeavor since prior studies found that these strategies worked better in their study [1].
Even though microgrid designs and evaluations have been widely shared by scholars worldwide, some studies taking into account distinct DiSs have suggested a new field of study in microgrid designing. DiSs are characterized as control strategies that may be used inside the microgrid to efficiently manage the production and distribution of electrical energy [5]. The DiS may be defined as a collection of different rules for managing the system’s storage and generator, which will eventually ensure an efficient load demand accomplishment [7]. The DiS has an effect on the entire system, which can lead to reduced greenhouse gas (GHG) emissions, smaller component sizes, and lower system costs. It also helps in the construction of more practical, economical, safe, and reliable microgrids [1].
DiSs are significant for proper and appropriate resource management within microgrids. Being a comparatively new domain of interest, researchers have focused more on the technological and economic perspectives of a new microgrid design than on its dispatch control. Optimal sizing and technoeconomic studies of hybrid microgrids without dispatch strategy-based control offer a higher cost, a larger system size, higher emissions, and comparatively inefficient resource management. Moreover, in addition to dispatch control, it is also significant to assess the proposed system based on how good or acceptable the power system response of the system is. In [8], a technoeconomic analysis using HOMER Pro was conducted for an off-grid microgrid without considering power system analysis or a dispatch strategy-based study. A similar type of work has been performed in [9] for a remote location in Iraq. A technoeconomic analysis was also conducted in [10,11]. The research studies mentioned have not considered dispatch control in their analysis of the hybrid system.
A novel technique for hybrid microgrid optimization and operation has been proposed in [12]. The core contribution of this work was to reduce the various costs related to hybrid microgrid system operation and, further, to maximize renewable resource utilization. The work discussed the technoeconomic factors while optimizing the microgrid. The concept of this research work could be extended if the impact of the dispatch strategy was analyzed. Further, the concept could have been well evaluated if the power system responses, like voltage, power, current, frequency, etc., from the system with the proposed algorithm were discussed. Another research work proposes a novel mathematical approach that will lead to the optimal operation of a grid-connected hybrid system [13]. A demand-response-oriented demand-side management issue was solved in the research by not considering the dispatch control or the power system characteristics.
With a thorough focus on technoeconomic factors and the operational and pollution costs of the electricity and gas subsystems, [14] examines a variety of storage technologies found in multi-energy microgrids. Further, a technique was created that includes an optimization model that makes it easier to identify the best sites for storage systems inside microgrids. The model further includes a sensitivity analysis to determine the investment and maintenance costs related to the storage systems. A systematic technoeconomic and socio-environmental design optimization with an HOMER optimizer is presented in [15]. A similar type of work involving virtual synchronous generators and electric vehicle charging stations in hybrid microgrids is presented in [16]. Using vehicle-to-grid (V2G) engineering, a technoeconomic study is presented in [17]. This article evaluates the possibility of a hybrid backup system within the microgrid. Various hybrid backup system working setups are examined. Further, an improved power management approach is used for the hybrid backup system to increase the system’s resilience and reliability. Researchers in [18] analyzed the technoeconomic perspectives of manufacturing hydrogen for fuel cell buses in Fiji. This article considers both off-grid and grid-connected scenarios when sizing hybrid microgrids with solar panels and wind turbines as the main power source for hydrogen production. However, the researchers in both works overlooked the responses of the system to various dispatch modes.
Researchers in [19] conducted a technoeconomic assessment of a hybrid model for a campus microgrid. Four different configurations of the microgrid were studied in the work, and related comparisons were presented. The dispatch control was not implemented, and the assessment of the proposed microgrid on power system response was not conducted in the study. A similar type of study was conducted by researchers in [20], where hydrogen loads and storages were incorporated with grid connectivity. An HOMER optimizer was utilized in the work for the optimization. A technique for optimizing energy management in a hybrid system was proposed in [21]. A technique to maximize energy management (EM) in a microgrid featuring distributed generation and a battery storage system (BSS) is presented in this article. The main goal was to solve the problem of operating the microgrid in a way that is both economical and environmentally friendly, with an emphasis on reducing operational costs and emissions by utilizing the BSS as efficiently as possible throughout the daily schedule. In [22], a novel power-to-hydrogen (PtH) framework for using hydrogen as a clean, adaptable energy storage medium was presented. A short-term prediction model based on the artificial neural fuzzy inference system (ANFIS) was used to fine-tune the power management solution for daily operations. In [23], a technoeconomic optimization of a renewable microgrid was achieved using a PSO algorithm. Neither of these works considered dispatch control in their studies or a power system response-based evaluation of the work.
The gap in the abovementioned available research between technoeconomic analysis, dispatch strategy-based analysis, and power system response analysis was tried to be filled in [1,3]. But the researchers designed off-grid microgrids, which are disconnected from conventional grid connectivity and which are mainly suitable for various islanded areas, where the grid is unavailable and the establishment of grid connectivity is not feasible and becomes expensive.
A grid-connected microgrid can be used to provide uninterrupted power to a proposed site. The main contribution of this proposed work is to find a bridge inbetween the optimized design of a grid-tied microgrid, to find the technical, economic, and environmental parameters most suitable for the microgrid, to make a power system feasibility study based on stable and feasible voltage and frequency responses, all on the basis of various DiSs, and finally to determine the best dispatch approach suitable for the specific microgrid, which is the Deptartment of Electrical, Electronic and Communication Engineering (EECE), Pabna University of Science and Technology (PUST). Here, the proposed site is supplied mainly with renewable energy sources, and whenever the sources have a scarcity of supply (as they are intermittent sources), the load is satisfied with a backup conventional utility grid power supply. This work’s primary contribution will be as follows:
  • First, figure out the best configuration and optimal dimensions for the hybrid grid-connected microgrid components based on renewable energy, such as converters, solar PVs, wind turbines, etc., using a derivative-free technique. This will ensure that the net present cost (NC) and levelized cost of energy (LE) of the different options are as low as possible in the selected locations.
  • Second, by investigating the electrical performance of the system (active power, current, frequency, and voltage fluctuations of the developed microgrid) using the DIgSILENT PowerFactory structure, the best possible, cost-effective, stable, and dependable functioning of the optimum microgrid layout (based on the results obtained in the prior step) is guaranteed. In the future, the simulated results can be realistically used for the development of microgrids in real life.
The structure of the rest of the research paper is as follows: Section 2 includes the modeling, Section 3 is devoted to the methodological approach, Section 4 is devoted to the research findings and discussion, and Section 5 wraps up the study.

2. Demonstration of the Grid-Connected Microgrid System

2.1. Proposed Location

This study was conducted at the Department of Electrical, Electronic and Communication Engineering (EECE), Pabna University of Science and Technology (PUST), Pabna 6600, Bangladesh. The department is located on the second floor of a six-story academic building, and is located close to 24°00′44.7″ N, 89°16′49.1″ E, beside the Dhaka-Pabna highway. The department is equipped with two classrooms, a teachers’ lounge, a chairman’s office, two restrooms, and a computer laboratory and circuit laboratory. The suggested location is ideal for the planned microgrid since it has a sufficient wind and solar profile.

2.2. Information on Load Demand

Table 1 provides an estimate of the gross interconnected demand of the load at the suggested site. The highest demand is defined as an overall load collection of 23.31 kW, and the microgrid was developed with this in mind. The demand of the load is highest on the warmer days, in March through August, and lowest on the colder days, in September through February.

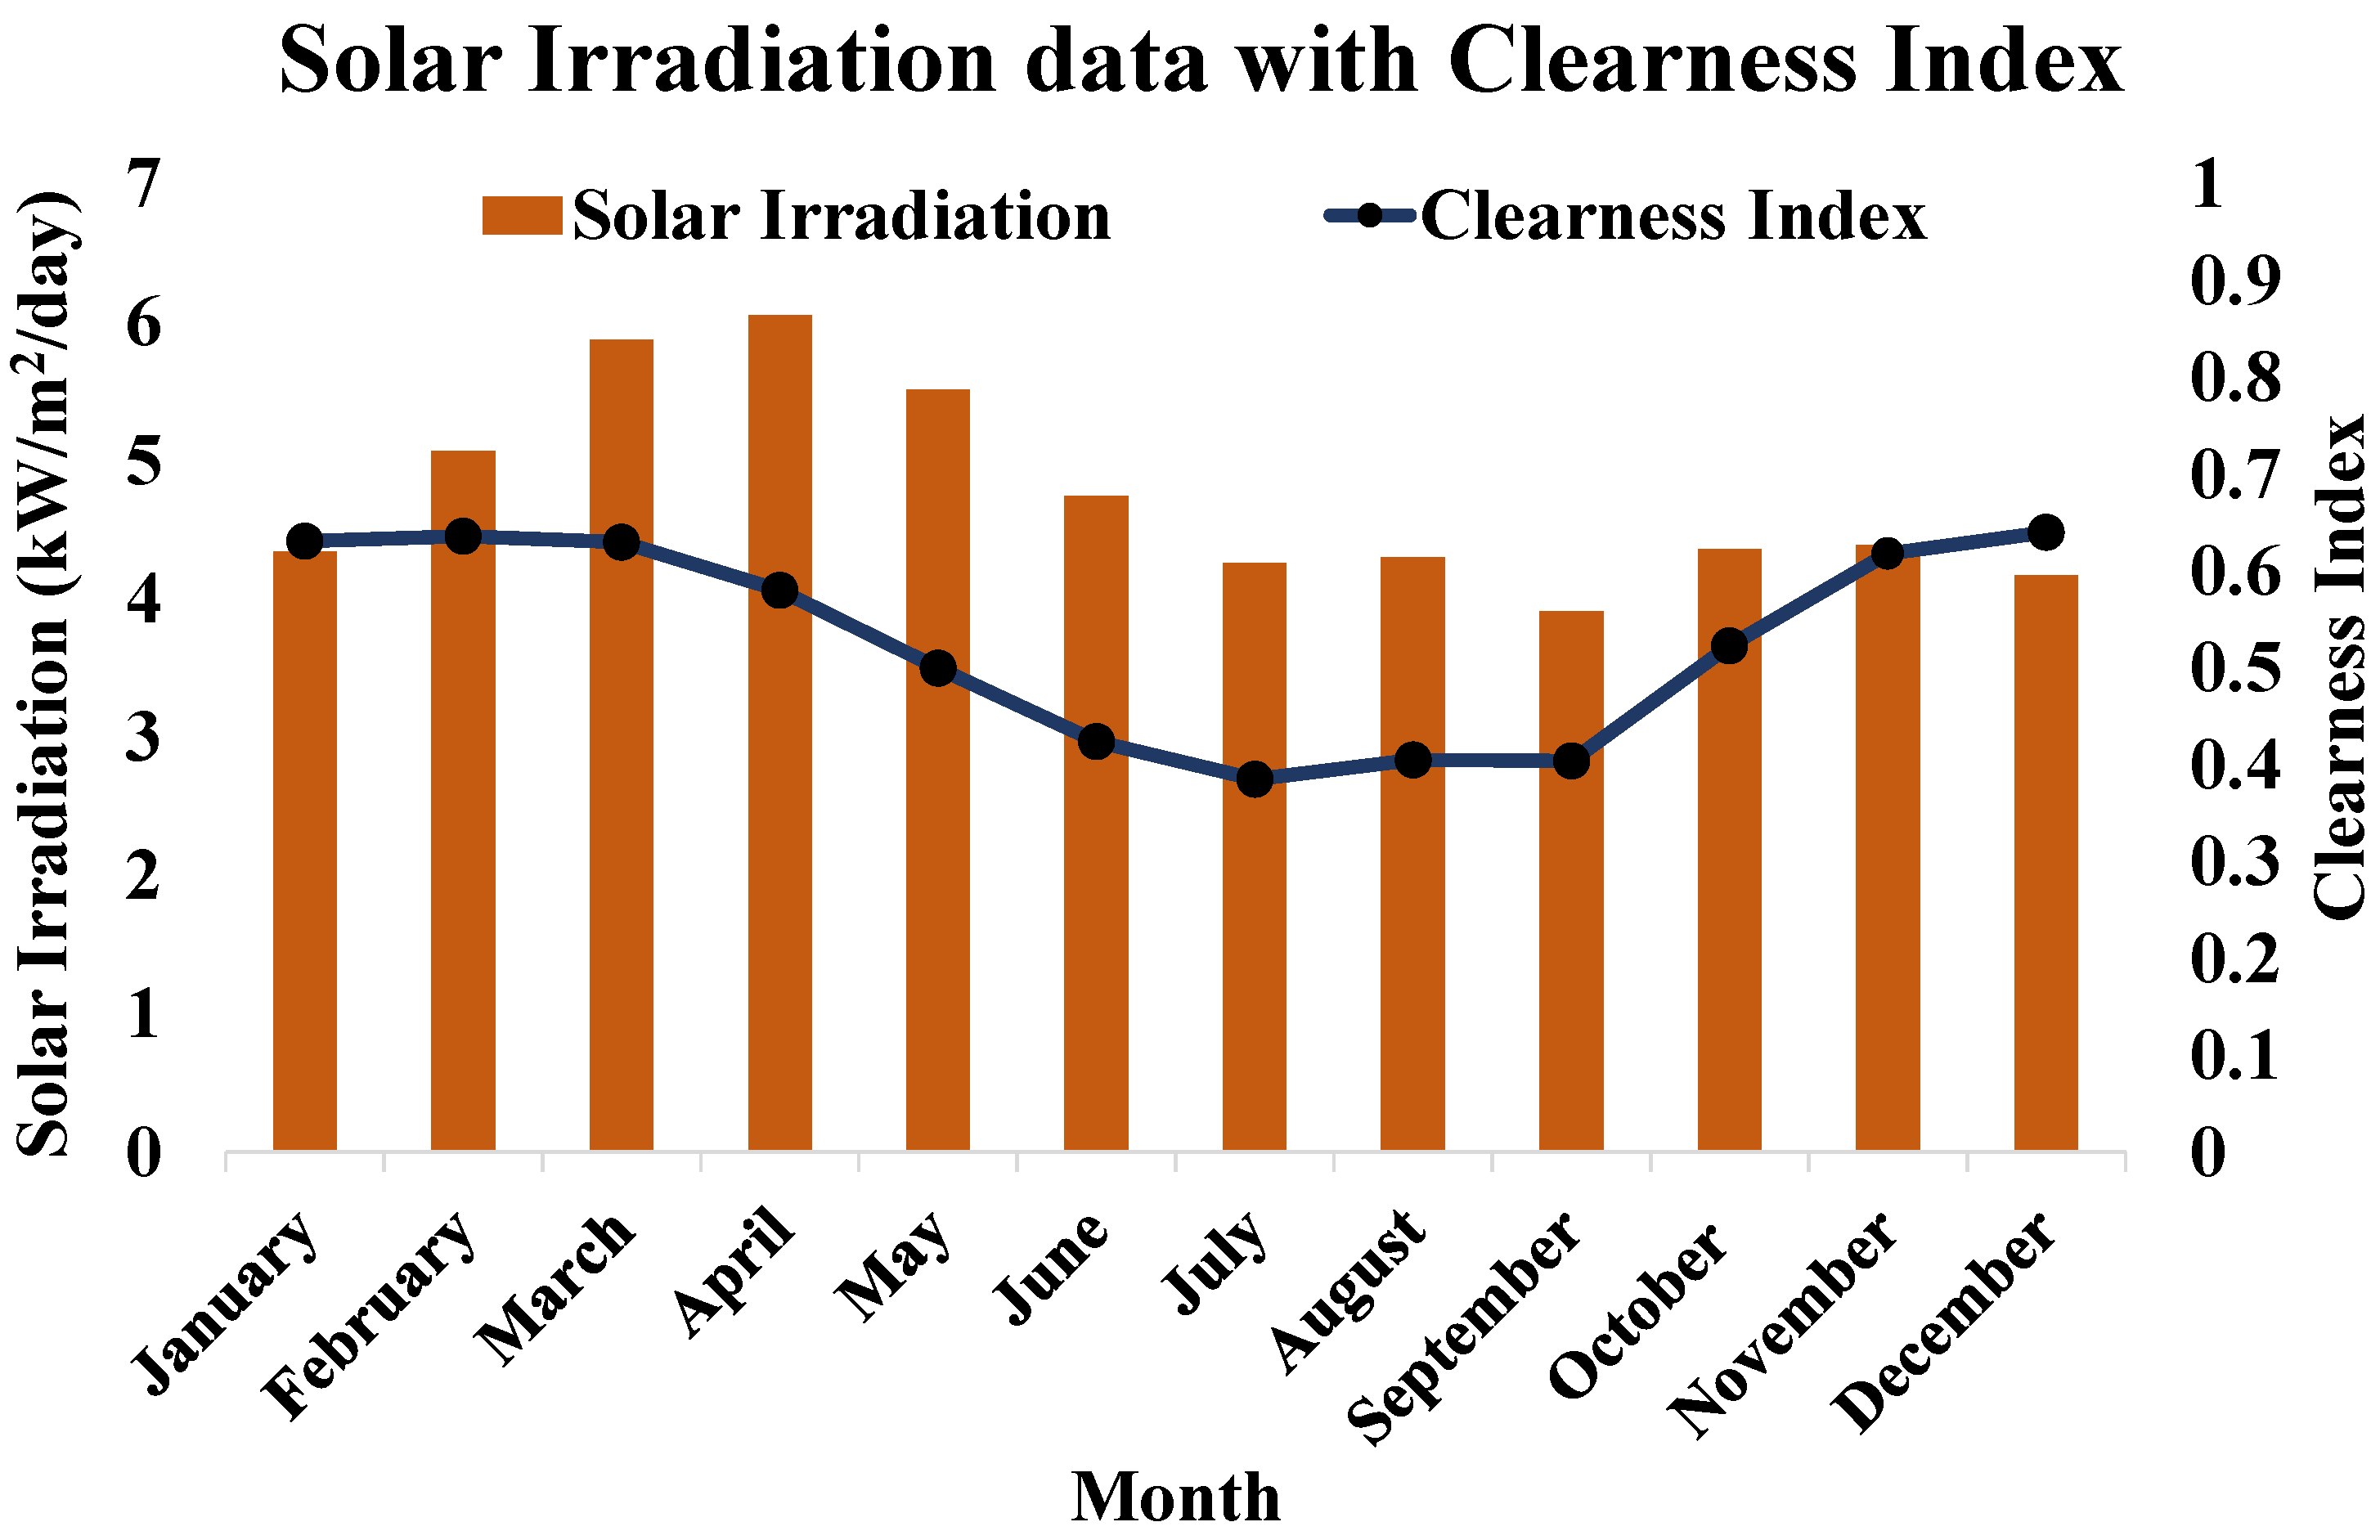
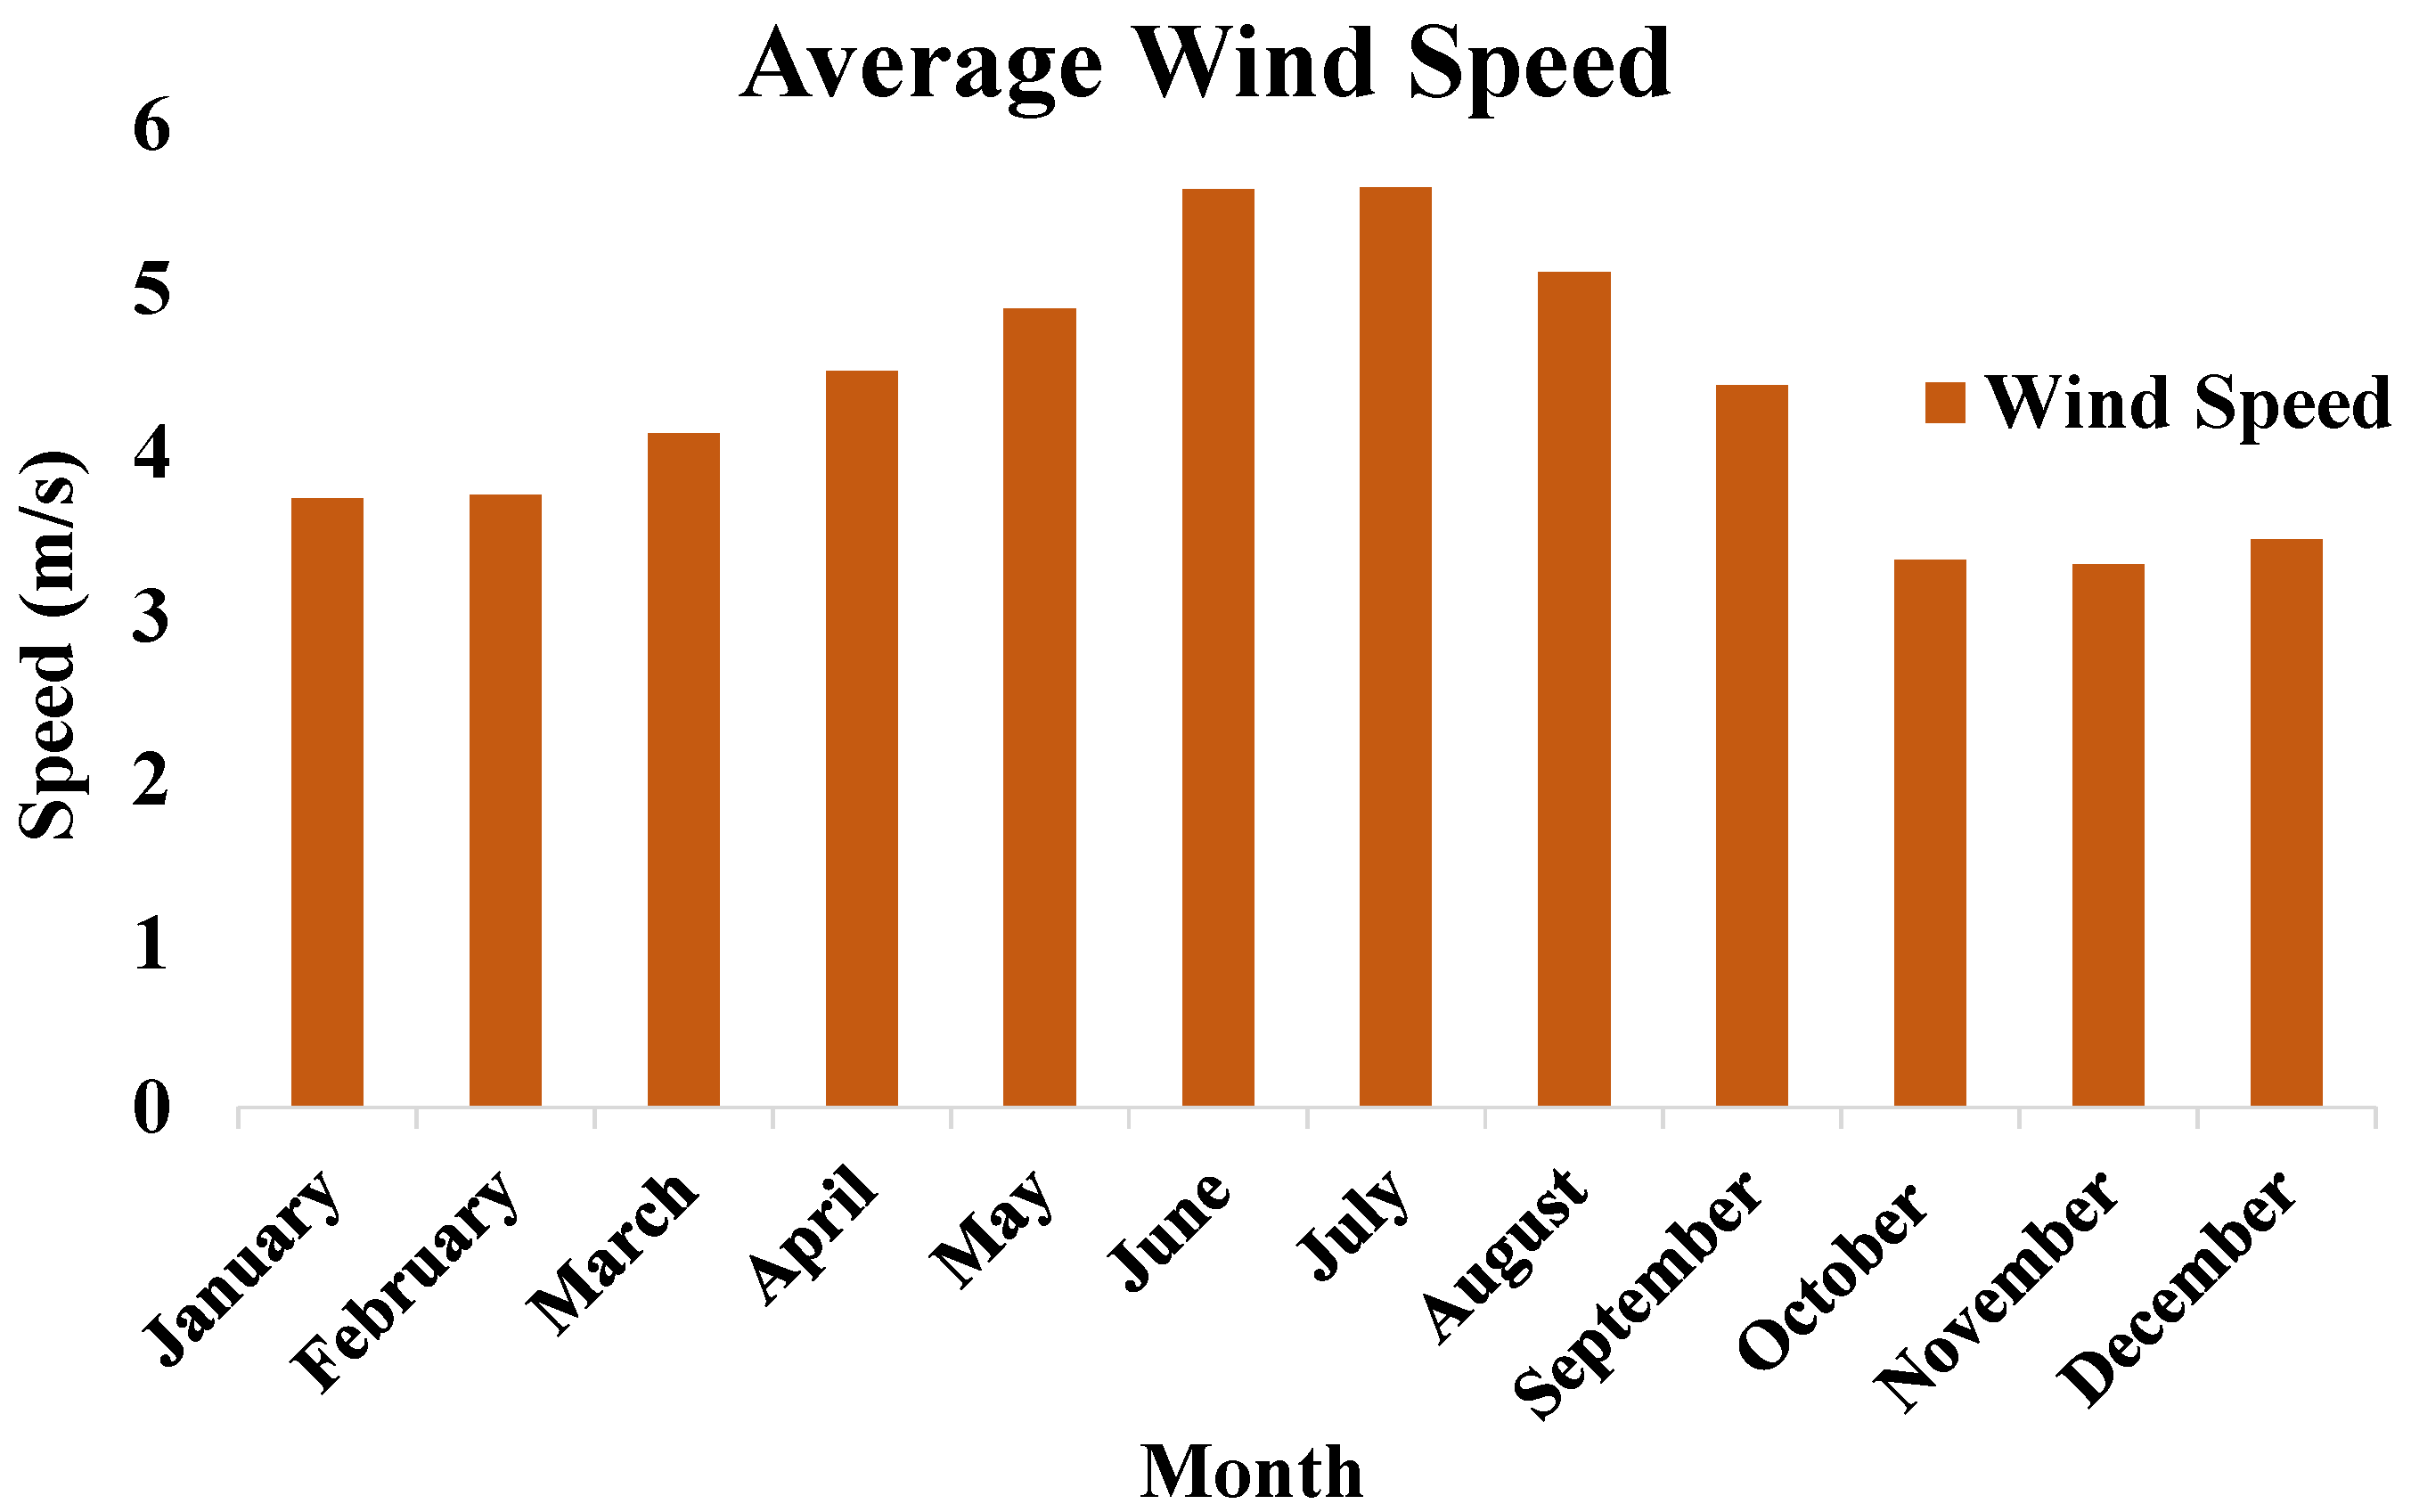
2.3. Summary of the Resources

The solar radiation pattern and the wind speed characteristics at the suggested site are typically referred to as “resources” in microgrid design. This research work’s resource profile is displayed in Figure 1 and Figure 2. Figure 1 represents the yearly average solar radiation data along with the clearness index for the proposed location, whereas Figure 2 shows the yearly average wind speed data for the proposed location. From the illustration, it can be observed that the radiation is the highest in the month of April compared to the other months of the year and it is approximately 6 kW/m2/day, and in September, the radiation is the lowest and is approximately 4 kW/m2/day. For the rest of the months, the radiation stays between 4 and 6 kW/m2/day. July has the lowest clearness index at 0.4, and January and December have the highest indexes at 0.65. Looking deeper into Figure 2, it is clear that June and July have the highest average wind speed at about 5.5 m/s, and the lowest speed of 3 m/s can be found in October and November. The rest of the months have speeds between 5.5 and 3 m/s.

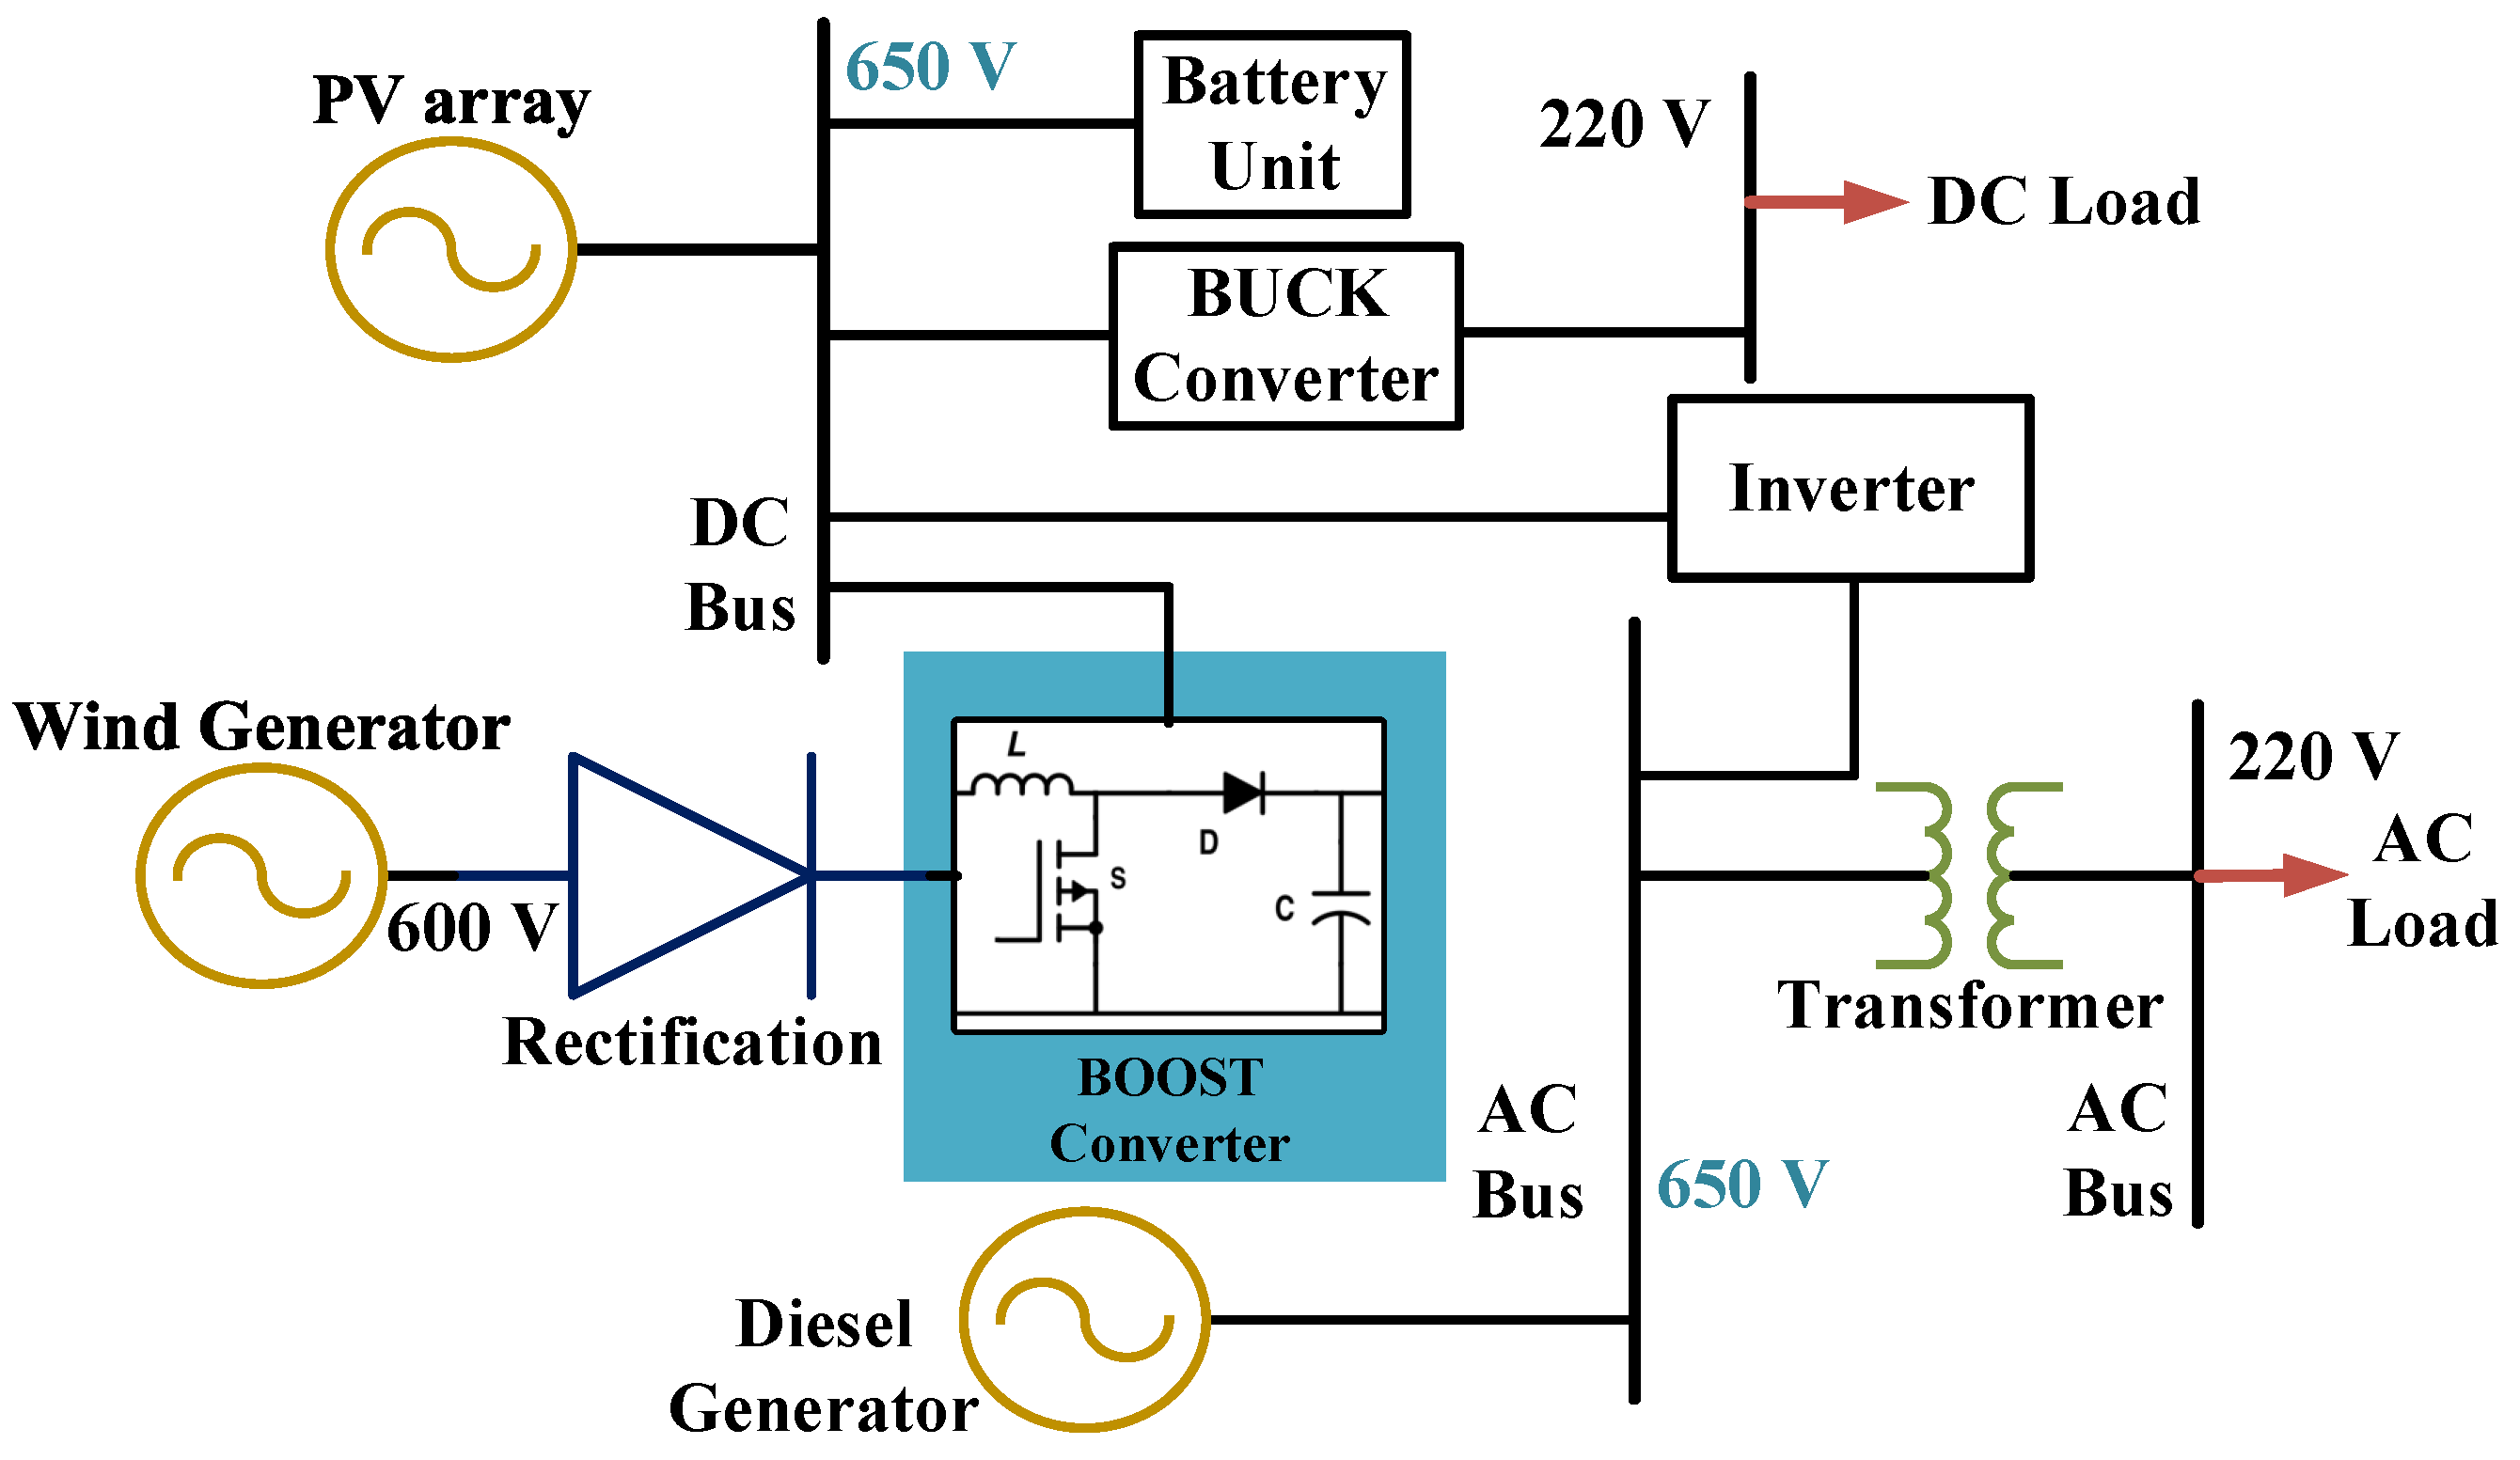
2.4. Construction of the Prototype of the Proposed Microgrid

The suggested microgrid includes solar PVs to harvest electricity from solar radiation, a wind turbine to transform wind energy into electrical power, a battery backup to store excess energy from intermittent wind- and solar-based renewable sources, a diesel generator backup to be used only in the event that neither the grid nor the renewable sources can meet the load demand, and other essential inverters/converters as well as both AC and DC loads. Figure 3 shows a suitable illustration for the proposed microgrid. From the figure, it is evident that the microgrid consists of two buses, i.e., a DC and AC bus. The DC loads are connected to this bus. The AC busbar contains the AC sources, i.e., the wind turbine, the backup diesel generator, the grid connectivity, the AC loads, and the solar PV supply after the necessary conversion and/or inversion to the AC. Transformers have been integrated for the necessary voltage level transformation, and converters have also been implemented wherever necessary.

3. Methodological Approach of the Research Work

In this work, the following factors were considered:
  • Real field component costs (gathered from market analysis) and meteorological resource data (wind speed and sunlight radiation data) were employed for the purpose of optimal size assessments.
  • The suggested system’s ability to produce stable and practicable responses was determined by analyzing the microgrid power system responses using the DIgSILENT PowerFactory platform with the appropriate system model. This ensured that the designed microgrid operated steadily and reliably.
A flow chart providing a basic description of the process is shown in Figure 4. As the algorithm starts, the required input data need to be input into the algorithm. Then, according to the different dispatch control approaches, the hybrid model is simulated for the optimum solution. If the model is enough for the load satisfaction, the various costs and emissions for the optimum system are identified, and if the model is unable to satisfy the demand, the components are resized and the simulation is run again. Then, the power system responses are estimated within the PowerFactory platform. If the required stable performance is obtained, the result is evaluated; otherwise, the components are resized, and the process from the third stage is repeated.
The block model for the DIgSILENT PowerFactory model, which was used for the power system response-based evaluation of the suggested microgrid, is shown in Figure 5. Here, for the simulation, the microgrid model was recreated, and, along with the optimum data input, the model was simulated for the evaluation of the power system responses. Here, all the necessary sources and loads are incorporated, along with the necessary converters and storage.

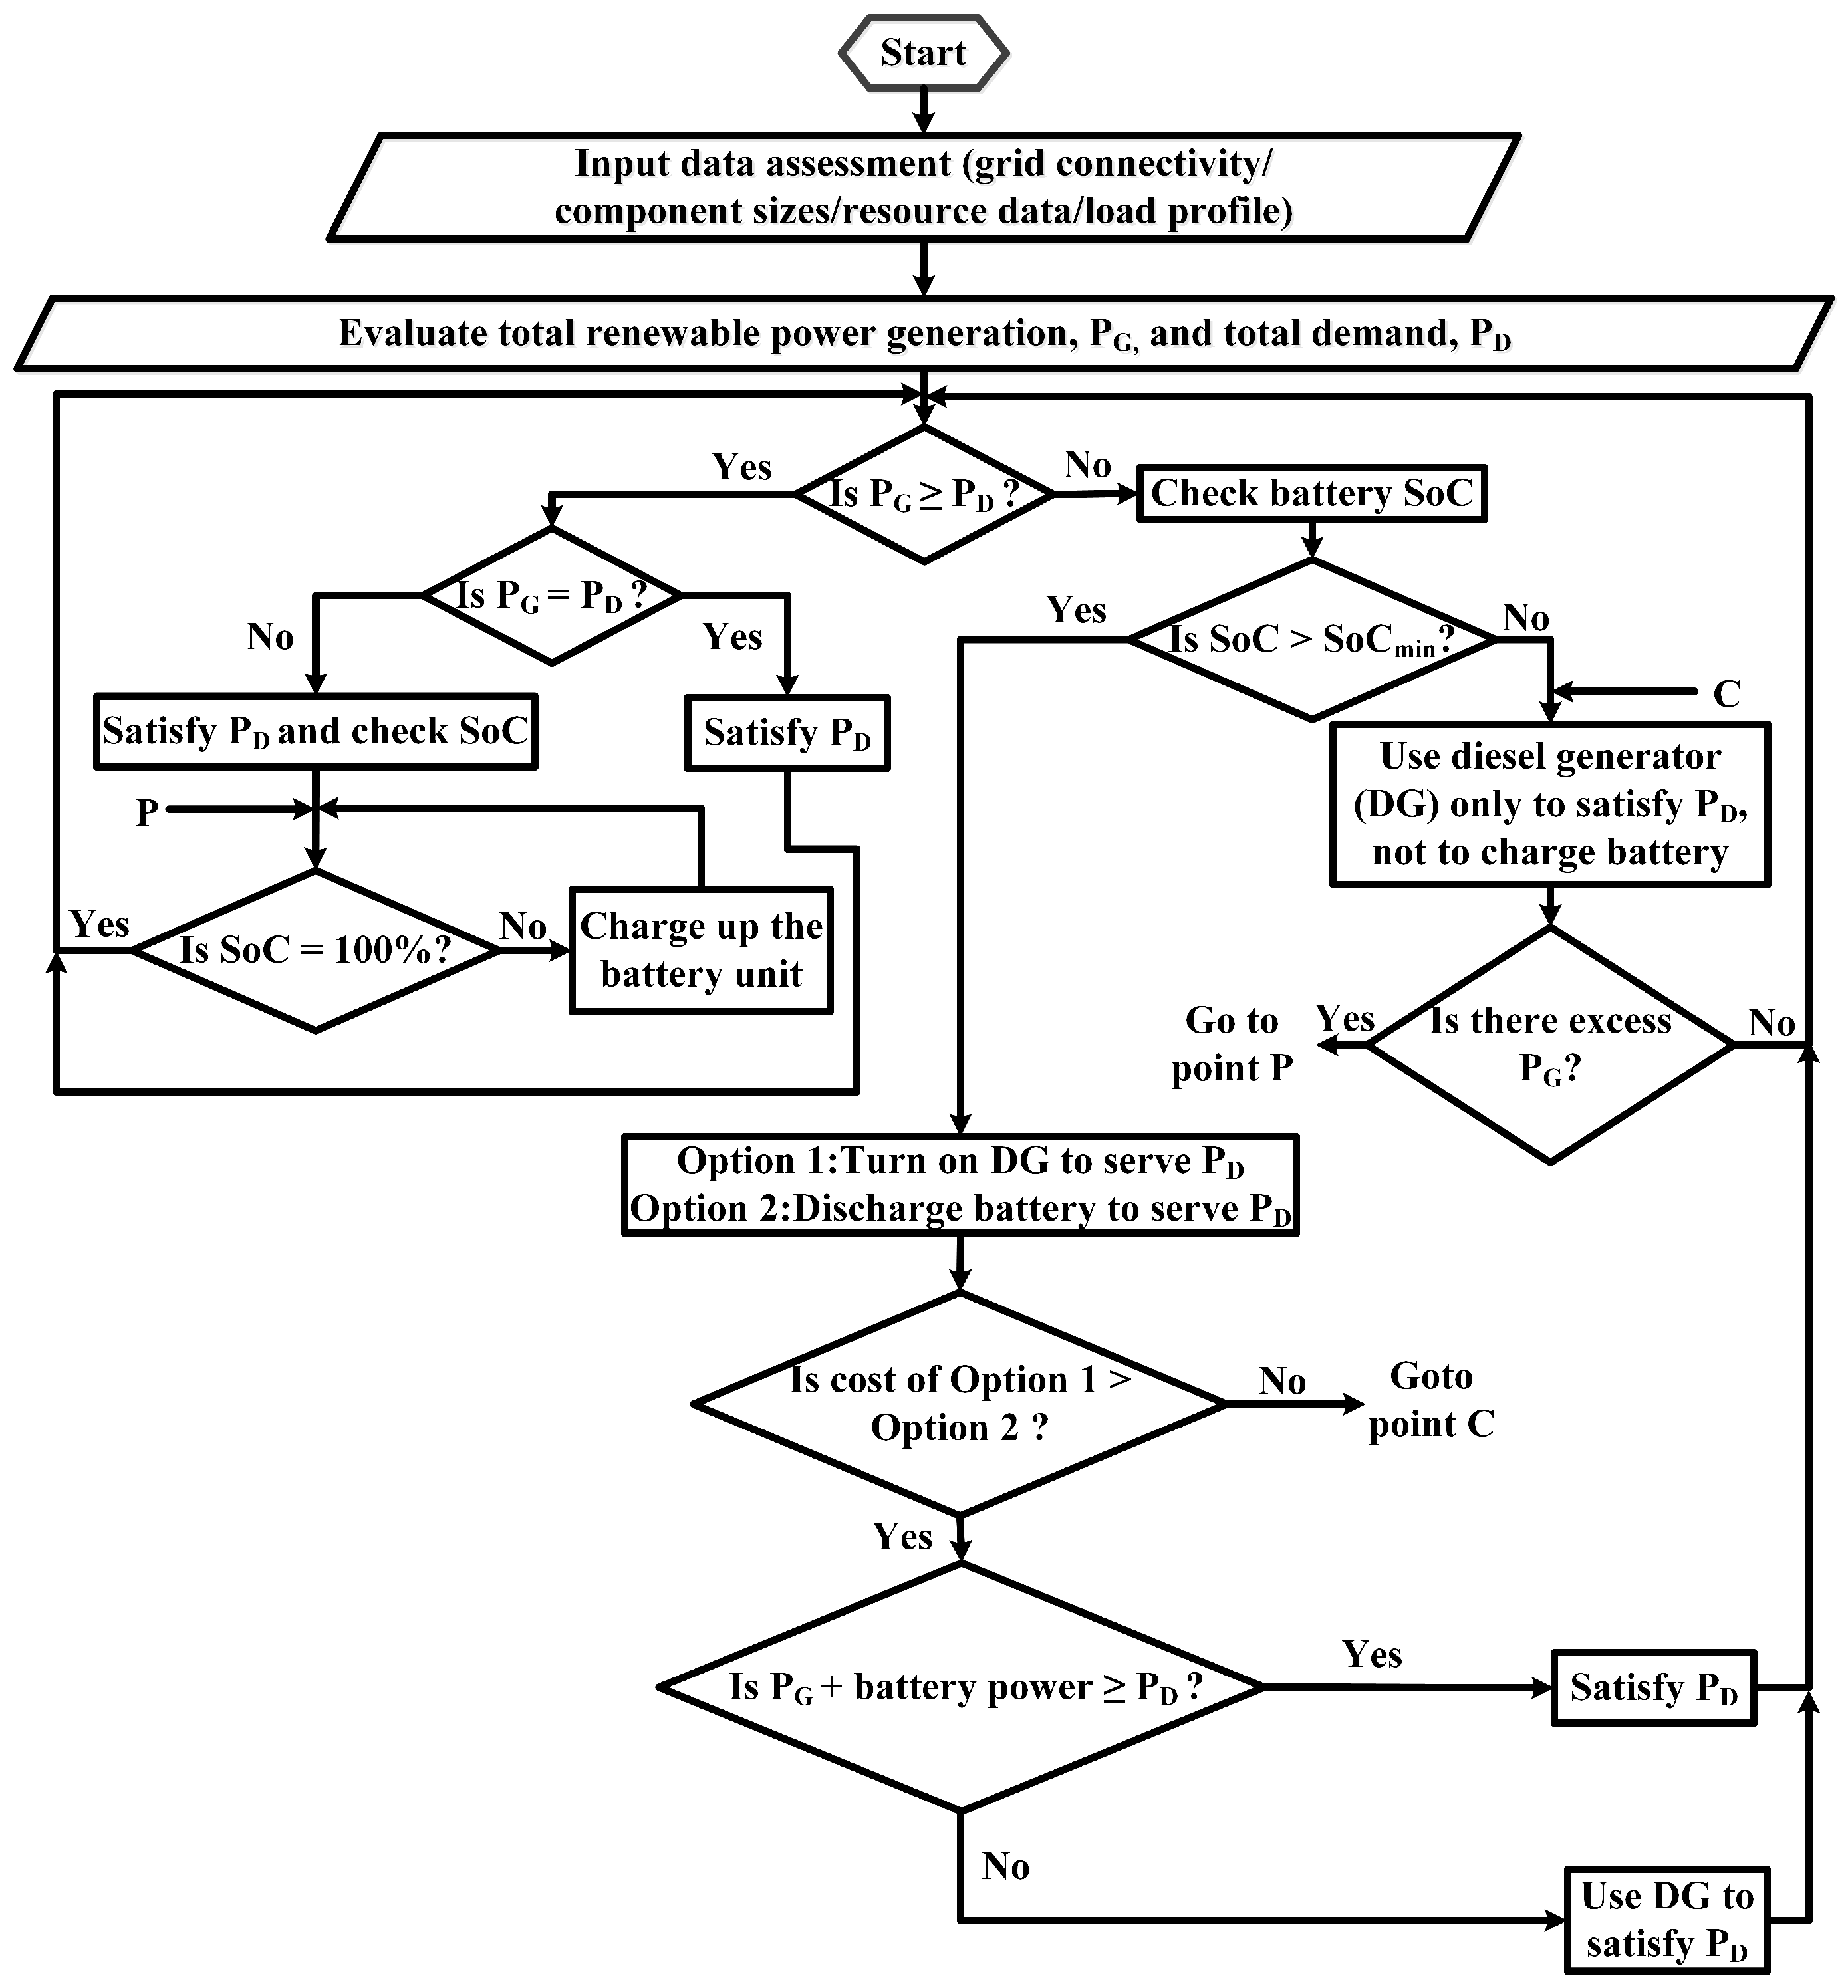
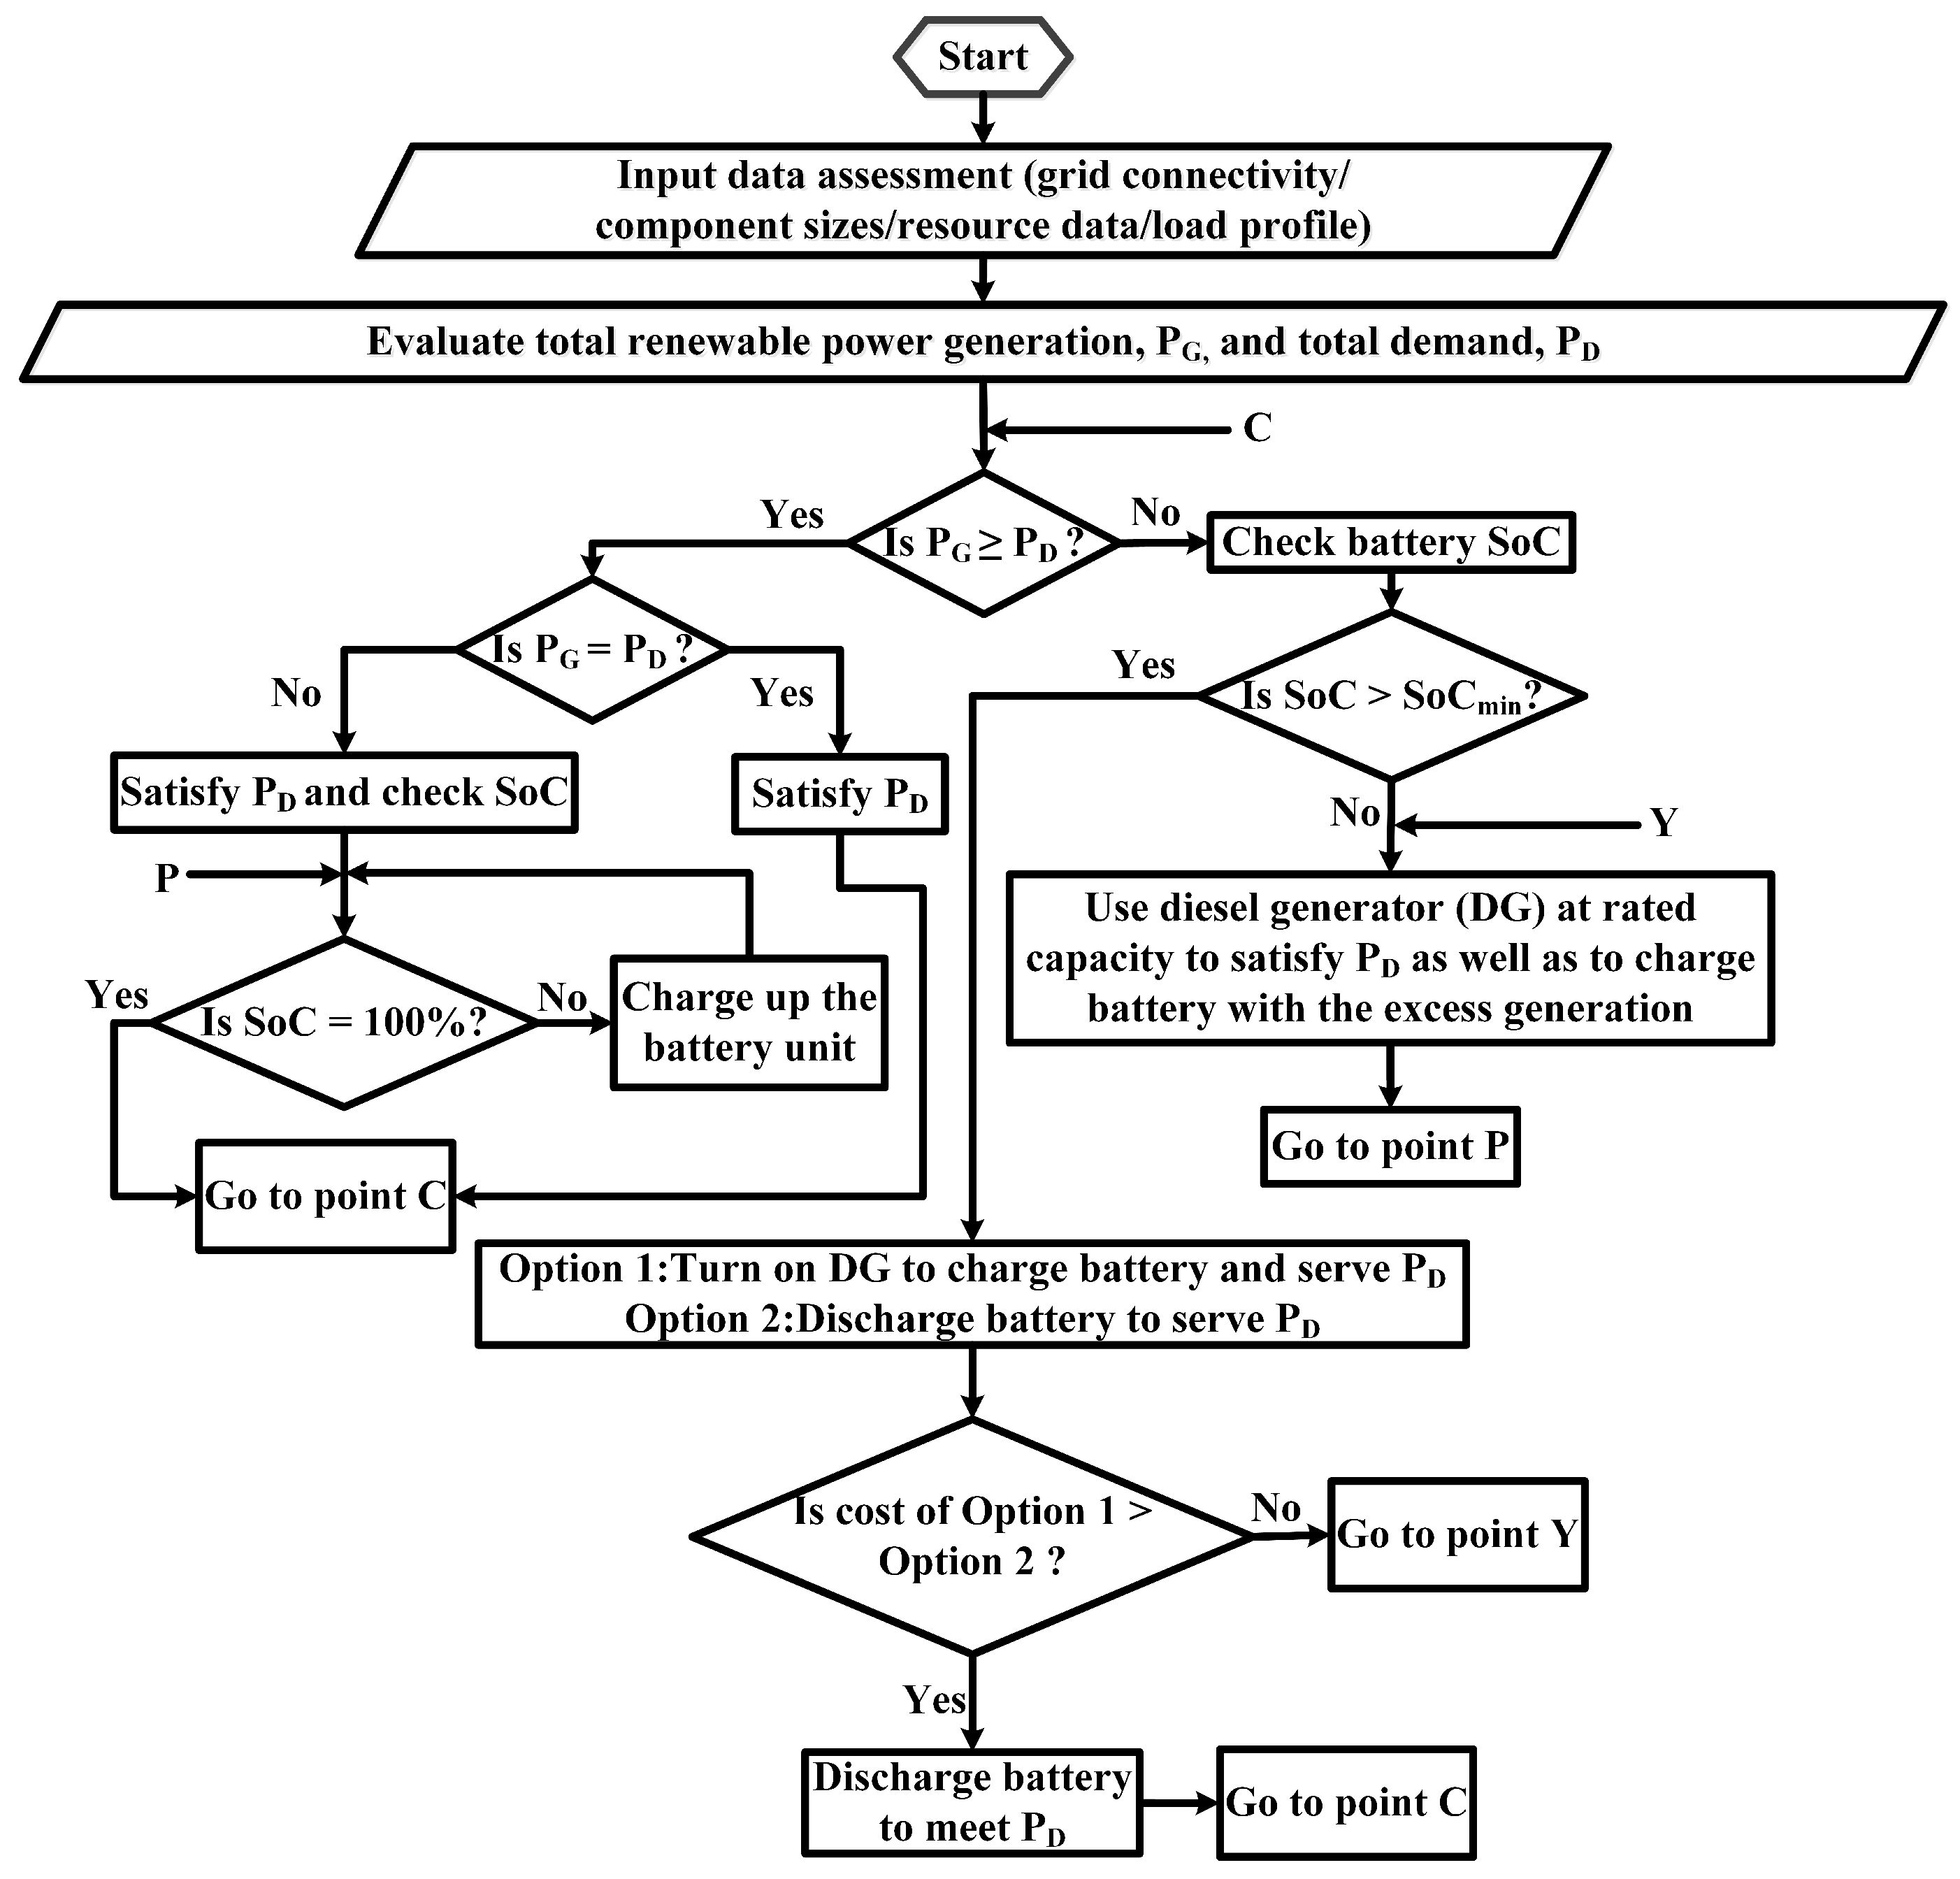
3.1. Load-Following (LoF) DiS

In the LoF technique, the generator only provides the precise quantity of electricity required to meet the load demand. Any remaining power once the principal loads are met is used only for charging batteries, which mainly require renewable energy sources. Figure 6 displays the LoF DiS flow chart. From the diagram, it can be seen that, first, the total demand and renewable power generation are evaluated. If the generation is greater than or equal to demand, the primary demand is satisfied, and if the battery needs charging, it is also charged. On the other hand, if the generation is less than the demand, the battery state of charge (SoC) is checked, and if needed, a backup diesel generator is used to charge the battery. If the battery is already charged, then it can be used to supply the primary load if it has a lower cost than is needed to bring the diesel generator into operation.

3.2. Cycle-Charging (CyC) DiS

When utilizing the CyC method, the generator always runs at full power. Thus, excess electricity is produced in this case. The excess energy is used to charge the storage device [5]. The CyC DiS flow chart is displayed in Figure 7. In this approach, unlike in LoF, the diesel generator is operated at its rated capacity to supply primary demand and to charge the storage unit with the extra energy generated. The battery SoC is checked multiple times, and, if needed, it is charged. Between operating the generator and battery, the least costly option is brought into action to fully satisfy the load demand.

3.3. Problem Formulation

This section and the successive subsections present the research work’s mathematical formulation.

3.3.1. Objective Function

Minimizing the microgrid’s cost for each node in a sustainable manner is the primary goal of implementing economic dispatch (ED) solutions in cases of microgrid optimization [24]. The objective function of the conventional ED issues discussed below can be roughly represented by a conventional objective function that uses a single quadratic equation [25].
E x p e n s e m i n i m u m = t = 1 N u m g F t ( P t )
where F t ( P t ) = x t + y t P t + z t P t 2 . Here, x t , y t , and z t are the fuel cost coefficients of the tth generator. The term P t is the power output of the tth generator in MW, N u m g indicates the total number of generators, and F t ( P t ) is the fuel cost function of the tth generator in dollars/h.

3.3.2. Equality and Inequality Constraints

The following limitations need to be met by the economic dispatch issues.

Active Power Balance Constraint

The overall electricity production is supposed to be equal to the sum of the system’s total demand (Ed) and the transmission network’s total loss (El) [26]. Then,
t = 1 N u m g F t ( P t ) = E d + E l .
where El can be evaluated by using B coefficients as
E l = t = 1 N u m g t = 1 N u m g E i B i t E t + i = 1 N u m g E i B o i + B o o
In Equation (3), B i t , B o o , and B o i are the loss coefficients.

Generation Constraints

According to [25,26], the power E g ( i ) produced by the ith source must be less than or equal to the highest possible output of the source E g . m x ( i ) and larger than or equal to the lowest permitted amount of generation E g . m ( i ) . Now,
E g . m ( i ) E g ( i ) E g . m x ( i )
The overall production of electricity shall be equal to the sum of the total power losses ( E l ), storage power ( E s ), and total load demand ( E d ) [26]:
Σ i E g ( i ) = E d + E l + E s

3.3.3. Optimal Sizing and Cost Function Reduction

The optimization equations, also known as the problems that need to be solved to obtain the optimal operating sizes and the needed quantity of power generation units [27], are given below. Here, v 1 , v 2 , and v 3 are weights to reveal the significance of the corresponding component, and u, w, x, y, and z are the corresponding sizes of different pieces of equipment in the system. The corresponding components’ levelized cost of energy is denoted by LE, the corresponding components’ net present cost is denoted by NC and GG, and C.CO2 quantifies the gas emission from the diesel generator unit. Here, the subscript WT = wind turbine, SPVC = solar photovoltaic cell, BU = battery unit, DG = diesel generator, G = conventional grid, and Net = summation of individual values.
m i n u , w , x , y , z , v 1 ϵ N 0 ( v 1 ( u . L E G + w . L E S P V C + x . L E W T + y . L E D G + z . L E B U ) )
m i n u , w , x , y , z , v 2 ϵ N 0 ( v 2 ( u . N C G + w . N C S P V C + x . N C W T + y . N C D G + z . N C B T ) )
m i n C , v 3 ϵ N 0 ( v 3 ( C . C O 2 D G ) )
m i n v 1 , v 2 , v 3 ϵ N 0 ( v 1 L E N e t + v 2 N C N e t + v 3 G G N e t )

3.3.4. Formulation of LE Calculation

The LE for the proposed micro system can be calculated utilizing the proposed derivative-free algorithm using the formula below [27].
L E = E x y e a r l y D e m P + D L + P s g
Here, E x y e a r l y = net yearly expense, P s g = yearly gross energy sold to grid, D e m P = gross primary demand, and D L = deferrable gross demand.

Formulation of NC Calculation

The NC, E N C , of the proposed hybrid microgrid can be evaluated using the following formula [27].
E N C = E x y e a r l y C . R . F ( x , L f p )
In (11), x = interest rate, L f p = project life, C . R . F ( . ) = capital recovery factor, and E x y e a r l y = net yearly expense.

Formulation of CO2 Emission

CO 2 emissions from the system can be assessed as [27]
C . CO 2 = 3.667 × L f × F . H . V . × C . E . F . l × C o x
Here, F.H.V. = fuel heating value in MJ/L, C.CO2 = CO2 emissions, L f = fuel in liters, C . E . F . l = carbon emission factor in ton carbon/TJ, and C o x = oxidized carbon fraction. Another fact that should be considered is that 3.667 g of CO2 contains 1 g of carbon.

Formulation of Economic Dispatch

The economic dispatch problem can be formulated using the following equations to explain the optimization problem [27]:
i P o w G e n i C G i P o w G e n i
Subject to
P o w G e n i m i n P o w G e n i P o w G e n i m a x
Σ i P o w G e n i = P D
The objective function in (13), where C G i is the cost (marginal) of each generator unit and P o w G e n i is the quantity of its power generation, is used to reduce the cost of power generation. While Equation (15) states that the total power generated must equal the demand for electricity P D , the term in Equation (14) mandates that none of the generators’ maximum or minimum restrictions may be broken.

Formulation of Frequency Stabilization

Maintaining the post-fault rate of change in frequency (RCF) and frequency nadir ( f n a d i r ) within their problematic inceptions as follows will guarantee a constant MG frequency [28]:
| R C F | R C F m a x , f m i n f n a d i r f m a x
Using the swing equation below, the hybrid microgrid’s frequency response can be controlled. If D = damping factor of load demand, Δ f ( t ) = deviation in frequency, I = inertia of the MG, Δ P o w G e n i ( t ) and Δ P S j ( t ) are, respectively, the power variations in synchronous unit i and battery storage j, and P o w i m denotes the power imbalance in MG, then,
2 I d Δ f ( t ) d t = i Δ P o w G e n i ( t ) + j Δ P S j ( t ) D Δ f ( t ) P o w i m .

4. Result and Discussion

The primary results of this research effort are outlined in this part, along with relevant critical analyses. Two subsections will be used to discuss the outcome for convenience. One concentrates on technoeconomic prospects and ideal sizing, while the other evaluates the suggested design based on power system responses.

4.1. Technoeconomic Analysis

An overview of the recommended microgrid size and related costs for the two suggested DiSs can be observed in Table 2. From the table, it can be observed that applying both of the dispatch strategies has the same impact on the optimal size and cost of the microgrid. This occurred as the proposed location is situated where the resources are available in such a quantity that both the dispatch algorithms are applicable with the lowest cost and size profiles. Being connected to the grid, the hybrid system is capable of both providing electricity to the grid and purchasing electricity from the grid. In this case, the hybrid system will purchase 57,914 kWh of electricity from the grid annually, as the intermittent sources of the hybrid system are not capable of supplying electricity for all of the day. On the contrary, the microgrid is capable of selling 1.3 kWh of electricity on an annual basis to the conventional grid. The predicted hazardous gas emissions for the two DiSs from the proposed microgrid during practical operation are summarized in Table 3. As the two dispatch strategies suggested have the same component size, they also have similar gas emissions. The highest emitted harmful gas is carbon dioxide, which has an estimated emission amount of 36,602 kg/year.

4.2. Power System Assessment

This part of the study discusses the second part of the research outcome, which is the power system study to evaluate the hybrid system design. The obtained system frequencies, voltage outputs, currents, and active power responses were studied from DIgSILENT PowerFactory simulations.

System’s Frequency Response

Figure 8 displays the frequency output from different components of the proposed microgrid. A time duration ranging from 0 to 3 s was selected to more effectively display the variations in the response. From the response, it can be seen that, at about 0.25 s, there is a dip down to 0.996 p.u. in the grid and AC load frequencies, and this is the greatest fluctuation. According to the standard power system rule, a frequency of deviation of ±2% Hz is acceptable. Here, a highest deviation of only 0.4% is observed. Within this time range, up to about 1.4 s, the diesel generator frequency stays roughly constant at 1 p.u. Just after the dip at 0.25 s, a positive spike of a height of 1.001 p.u. is found in the grid frequency, and a somewhat smaller deviation is observed for the AC load frequency. At about 0.6 s, two smaller positive spikes are observed for the grid and AC load frequencies. After this time and for the rest of the period, the AC load and grid offered a stable response of q p.u. The diesel generator offered fewer fluctuations than the other two and only had fluctuations at around 1.5 s. At about 1.4 s, a dip is observed that is smaller than the previous dip, and at 1.5 s, a positive spike occurs of about the same height as the first spike in the grid frequency. However, without considering these small disturbances, the result indicates that the microgrid operates at a steady frequency limit.

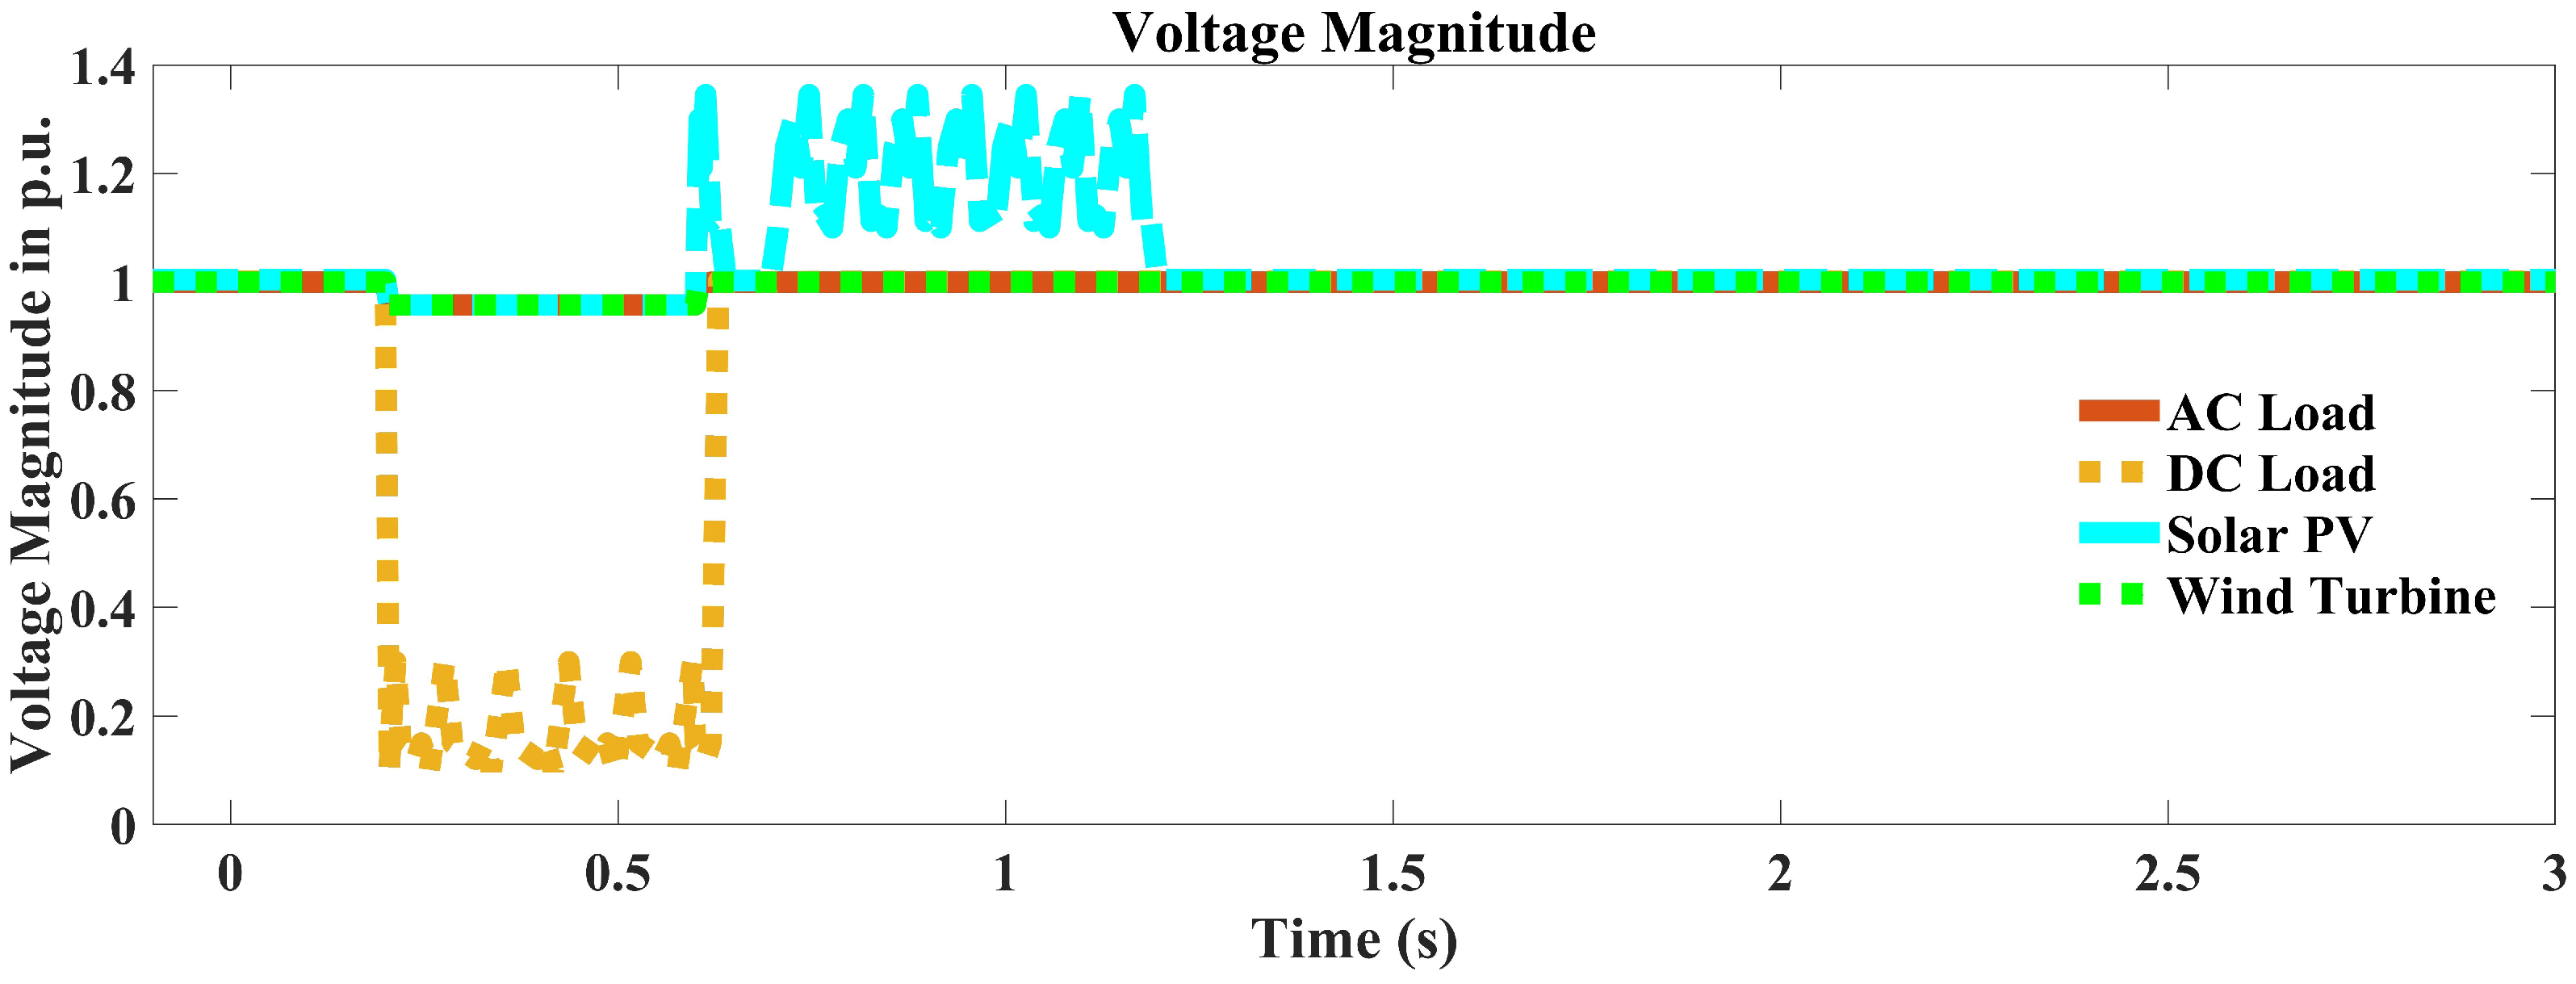
4.3. Voltage Responses of the Microgrid Components

Figure 9 illustrates the various microgrid components’ (i.e., wind turbine, diesel generator, grid, and solar PVs) voltage responses. Within an acceptable range, all of the voltages are steady. It can be observed that the responses have turbulence within the transient period of 1 s. After that period, the responses become stable at 1 p.u. From about 0.2 s to 0.6 s, diesel generation suffers from a 90% dip in the response, and from 0.6 s to about 1 s, a rise in the voltage up to about 120% is also found in the response. The response of the wind turbine shows the most stable response at 1 p.u., excepting a slight negative spike at 0.6 s. The solar PV offers a negative spike down to about 0.05 p.u. at 0.3 s, and a sag is also observed from 0.4 to 0.6 s down to 0.02 p.u. After that, the response becomes stable at 1 p.u., which is not a significant stability issue in the power system. The grid offers a similar response to the solar PV, except that the negative spike previously found in the solar PV at 0.3 s here is a bit smaller in magnitude.
Figure 10 shows another set of voltage responses for the AC, DC loads, solar PV, and wind turbine. The AC load and wind turbine (both of the AC components) have similar responses over the period. They offer a steady performance of 1 p.u. over the time, excepting the sag at 0.2 to 0.6 s to down to just below 1 p.u. Within the period, the DC load also has a voltage sag of 0.01 p.u. magnitude from 0.2 to 0.6 s. In the time period, there are a significant amount of fluctuations in the response, but after about 0.6 s, the response is stable at 1 p.u. On the other hand, the solar PV, another DC source, has a similar sag to the AC load and wind turbine at 0.2 to 0.6 s; moreover, it has a significant increase in voltage from 0.6 to 1.2 s, with a peak just below 1.4 p.u. After that, the response becomes stable.

4.4. Current Responses

The current responses of the solar PV, wind turbine, and diesel generator (the three generating devices within the design) are shown in Figure 11. The responses show fluctuations up to 0.75 s, and after that, all the responses become stable to their steady state values. Starting at about 0.8 p.u., the diesel generator suffers a decrease in current value to 0 p.u. from 0.2 to 0.6 s. After that, the response becomes stable at 0.8 p.u. for the rest of the time. Starting at 1.5 p.u., the solar PV has a dip over the same time period of the same magnitude. Similarly, after 0.6 s, the response is stable at 1.5 p.u. The wind turbine has the most unstable response up to 0.75 s. Starting at about 0.2 p.u. at about 0.2 s, it has a positive spike up to about 3 p.u. Then, for about 0.4 s, the response stays at 1 p.u., and again at 0.6 s, there is a positive spike of about 2.2 p.u. magnitude, which sharply decreases to 0 p.u. at 0.6 s. After that, the response rises to 0.2 p.u. again, and after 0.75 s, it stabilizes at that magnitude.

4.5. Active Power Responses

The active power responses from the microgrid components were also taken into consideration for the evaluation of the hybrid system for the proposed location. Figure 12 shows the responses for the active powers for wind turbine, diesel generator, grid, and solar PV per unit (p.u.). From the illustration, it is evident that, among the responses, the wind turbine tends to show the greatest fluctuation up to about 0.8 s. From 0 to about 0.2 s, the response was at 2 p.u., but after that, for a short period of about 0.4 s, the active power stayed at 0 p.u. After that, at 0.6 s, a negative spike from the wind turbine is observed, which was needed for the magnetic field inside the wind generator. Then, the response begins to rise again, and after 1 s, the response becomes stable again at 2 p.u. The other responses from the diesel generator, grid, and solar PV altogether coincide within 0.2 to 0.6 s. A value of 1.5 p.u. of grid active power indicates that the hybrid system takes a considerable amount of power from the grid during intermittency. The diesel generator provides the lowest amount of active power at about 0.7 p.u., which has been considered to serve as a backup source. Despite the fact that the optimum size suggested in Table 2 has a larger kW size for the solar PV than for the wind turbine, in the practical simulation platform, the wind turbine provided a larger amount of active power due to its more stable nature in wind speed at the proposed location. The responses are considered for 3 s, as beyond that timeframe, the responses are stable and nothing significant happens. After a shaky nature up to 1 s, the responses become stable and perform as expected.

4.6. Discussion of the Result

Based on its power system response evaluation and optimal design, the results demonstrate that the suggested microgrid can provide optimal operation at the lowest possible cost and hazardous gas emissions. Moreover, the active power, frequency, current, and voltage responses in the power system response section demonstrate that the hybrid system provides stable and practically implementable responses. This means that the proposed design can be implemented in the field with satisfactory performance using dispatch strategy-based control facilitates, which find the best solution while lowering costs, harmful emissions, and component size. This signifies the core contribution of the research work: a sustainable and robust solution to the electricity problem. The suggested microgrid’s viability and ability to be implemented in practice at the suggested location are shown by the power system response-based assessment. The microgrid was developed by incorporating multiple dispatch controllers and comparing them. For its present demand characteristics, resource profile, and meteorological characteristics, LoF and CyC deliver identical results on the basis of optimal sizing, emission levels, power system responses, and expenses. The reason behind this identical result is that, for the proposed location and load profile, the approach to satisfy the load demand is according to the DiSs. Moreover, as the grid is connected with the hybrid system, it works as a backup for any unstable and unexpected situations, like a shortage of generation from renewable sources or a fault within the hybrid system. The inclusion of a grid is one of the most important reasons that both of the dispatch strategies have offered similar responses. Also, the grid has a significant contribution with respect to keeping the power system responses within the stability limit. The grid-tied version also eliminates the necessity of considering a storage unit within the design. It also gives the facility of selling additional energy to broader consumers.

4.7. Application of the Research Work

The primary focus of this research study is the PUST Department of EECE. This study, however, is applicable to other parts of the world with similar demand patterns and weather. This study’s application, being a grid-tied microgrid, encompasses both islanded operations with different modifications and grid-covered regions.

5. Conclusions

This research study designs and evaluates a grid-connected hybrid microgrid for the EECE department at PUST, which consists of a diesel generator, solar PV, battery storage, and wind turbine. The concept relies on dispatch strategy-based control, which provides optimal sizing, reduced costs, and reduced emissions of hazardous gases from the recommended microgrid. The results of the study contribute significantly to this field of research and offer guidelines for developing a workable and ideal plan for the Department of EECE at PUST to build a grid-connected hybrid microgrid that primarily uses sustainable energy sources to provide a continuous supply of electricity to meet the suggested load requirements. With minor adjustments, this analysis can be applied to any other location with a similar load profile and meteorological conditions.

Author Contributions

Conceptualization, M.F.I. and S.A.S.; methodology, M.F.I., A.R., S.A.S., G.M.S., A.H.A., M.D.H. and N.E.N.B.; software, M.F.I., A.R. and S.A.S.; formal analysis, M.F.I. and S.A.S.; investigation, M.F.I., S.A.S., G.M.S., A.H.A. and M.D.H.; writing—original draft, M.F.I.; writing—review and editing, G.M.S., A.H.A., M.D.H. and N.E.N.B.; supervision, S.A.S., G.M.S. and A.H.A.; project administration, A.R. and S.A.S.; funding acquisition, A.R. All authors have read and agreed to the published version of the manuscript.

Funding

This work was funded by the Engineering Institute of Technology, Melbourne Australia.

Institutional Review Board Statement

Not applicable.

Informed Consent Statement

Not applicable.

Data Availability Statement

Data are contained within the article.

Acknowledgments

This work was funded by the Engineering Institute of Technology, Melbourne, Australia, and Pabna University of Science and Technology (PUST), Pabna, Bangladesh. The authors extend their appreciation to the Deanship of Scientific Research at Northern Border University, Arar, KSA for funding this research work through the project number “NBU-FFR-2024-2159-01”.

Conflicts of Interest

The authors declare no conflicts of interest.

References

  1. Ishraque, M.F.; Shezan, S.A.; Ali, M.; Rashid, M. Optimization of load dispatch strategies for an islanded microgrid connected with renewable energy sources. Appl. Energy 2021, 292, 116879. [Google Scholar] [CrossRef]
  2. Wang, J.; Azam, W. Natural resource scarcity, fossil fuel energy consumption, and total greenhouse gas emissions in top emitting countries. Geosci. Front. 2024, 15, 101757. [Google Scholar] [CrossRef]
  3. Chen, X.; Zhang, M.; Jiang, S.; Gou, H.; Zhou, P.; Yang, R.; Shen, B. Energy reliability enhancement of a data center/wind hybrid DC network using superconducting magnetic energy storage. Energy 2023, 263, 125622. [Google Scholar] [CrossRef]
  4. Abo-Zahhad, E.M.; Rashwan, A.; Salameh, T.; Hamid, A.K.; Faragalla, A.; El-Dein, A.Z.; Chen, Y.; Abdelhameed, E.H. Evaluation of solar PV-based microgrids viability utilizing single and multi-criteria decision analysis. Renew. Energy 2024, 221, 119713. [Google Scholar] [CrossRef]
  5. Rad, M.A.V.; Kasaeian, A.; Mahian, O. Evaluation of stand-alone hybrid renewable energy system with excess electricity minimizer predictive dispatch strategy. Energy Convers. Manag. 2024, 299, 117898. [Google Scholar]
  6. Cortes, G.S.; Gao, G.P.; Silva, F.B.; Song, Z. Unconventional monetary policy and disaster risk: Evidence from the subprime and COVID–19 crises. J. Int. Money Financ. 2022, 122, 102543. [Google Scholar] [CrossRef]
  7. Zurita, A.; Mata-Torres, C.; Cardemil, J.M.; Guédez, R.; Escobar, R.A. Multi-objective optimal design of solar power plants with storage systems according to dispatch strategy. Energy 2021, 237, 121627. [Google Scholar] [CrossRef]
  8. Chaurasia, R.; Gairola, S.; Pal, Y. Technical, economic feasibility and sensitivity analysis of solar photovoltaic/battery energy storage off-grid integrated renewable energy system. Energy Storage 2022, 4, e283. [Google Scholar] [CrossRef]
  9. Aziz, A.S.; Tajuddin, M.F.N.; Adzman, M.R.; Azmi, A.; Ramli, M.A. Optimization and sensitivity analysis of standalone hybrid energy systems for rural electrification: A case study of Iraq. Renew. Energy 2019, 138, 775–792. [Google Scholar] [CrossRef]
  10. Ali, F.; Ahmar, M.; Jiang, Y.; AlAhmad, M. A techno-economic assessment of hybrid energy systems in rural Pakistan. Energy 2021, 215, 119103. [Google Scholar] [CrossRef]
  11. Beza, T.M.; Wu, C.H.; Kuo, C.C. Optimal sizing and techno-economic analysis of minigrid hybrid renewable energy system for tourist destination islands of Lake Tana, Ethiopia. Appl. Sci. 2021, 11, 7085. [Google Scholar] [CrossRef]
  12. Heydari, A.; Nezhad, M.M.; Keynia, F.; Fekih, A.; Shahsavari-Pour, N.; Garcia, D.A.; Piras, G. A combined multi-objective intelligent optimization approach considering techno-economic and reliability factors for hybrid-renewable microgrid systems. J. Clean. Prod. 2023, 383, 135249. [Google Scholar] [CrossRef]
  13. Elazab, R.; Abdelnaby, A.T.; Keshta, H.; Ali, A. Optimal techno-economic feasibility analysis of a grid-tied microgrid considering demand response strategy. Electr. Power Syst. Res. 2023, 224, 109768. [Google Scholar] [CrossRef]
  14. Shahbazbegian, V.; Dehghani, F.; Shafiyi, M.A.; Shafie-khah, M.; Laaksonen, H.; Ameli, H. Techno-economic assessment of energy storage systems in multi-energy microgrids utilizing decomposition methodology. Energy 2023, 283, 128430. [Google Scholar] [CrossRef]
  15. Bouendeu, J.J.; Konchou, F.A.T.; Astrid, M.N.B.; Elmorshedy, M.F.; René, T. A systematic techno-enviro-socio-economic design optimization and power quality of hybrid renewable microgrids. Renew. Energy 2023, 218, 119297. [Google Scholar] [CrossRef]
  16. Abid, M.S.; Ahshan, R.; Al Abri, R.; Al-Badi, A.; Albadi, M. Techno-economic and environmental assessment of renewable energy sources, virtual synchronous generators, and electric vehicle charging stations in microgrids. Appl. Energy 2024, 353, 122028. [Google Scholar] [CrossRef]
  17. Elkholy, M.; Said, T.; Elymany, M.; Senjyu, T.; Gamil, M.M.; Song, D.; Ueda, S.; Lotfy, M.E. Techno-economic configuration of a hybrid backup system within a microgrid considering vehicle-to-grid technology: A case study of a remote area. Energy Convers. Manag. 2024, 301, 118032. [Google Scholar] [CrossRef]
  18. Ram, K.; Chand, S.S.; Prasad, R.; Mohammadi, A.; Cirrincione, M. Microgrids for green hydrogen production for fuel cell buses–A techno-economic analysis for Fiji. Energy Convers. Manag. 2024, 300, 117928. [Google Scholar] [CrossRef]
  19. Wong, S.Y.; Li, C. Techno-economic analysis of optimal hybrid renewable energy systems—A case study for a campus microgrid. Energy Rep. 2023, 9, 134–138. [Google Scholar] [CrossRef]
  20. Alluraiah, N.C.; Vijayapriya, P. Optimization, design and feasibility analysis of a grid-integrated hybrid AC/DC microgrid system for rural electrification. IEEE Access 2023, 11, 67013–67029. [Google Scholar] [CrossRef]
  21. Chakraborty, A.; Ray, S. Economic and environmental factors based multi-objective approach for optimizing energy management in a microgrid. Renew. Energy 2024, 222, 119920. [Google Scholar] [CrossRef]
  22. Khan, M.A.; Bayati, N.; Ebel, T. Techno-economic analysis and predictive operation of a power-to-hydrogen for renewable microgrids. Energy Convers. Manag. 2023, 298, 117762. [Google Scholar] [CrossRef]
  23. Parvin, M.; Yousefi, H.; Noorollahi, Y. Techno-economic optimization of a renewable micro grid using multi-objective particle swarm optimization algorithm. Energy Convers. Manag. 2023, 277, 116639. [Google Scholar] [CrossRef]
  24. Liu, W.; Zhuang, P.; Liang, H.; Peng, J.; Huang, Z. Distributed economic dispatch in microgrids based on cooperative reinforcement learning. IEEE Trans. Neural Netw. Learn. Syst. 2018, 29, 2192–2203. [Google Scholar] [CrossRef] [PubMed]
  25. Zhou, Q.; Shahidehpour, M.; Li, Z.; Che, L.; Alabdulwahab, A.; Abusorrah, A. Compartmentalization strategy for the optimal economic operation of a hybrid AC/DC microgrid. IEEE Trans. Power Syst. 2019, 35, 1294–1304. [Google Scholar] [CrossRef]
  26. Xiong, G.; Shi, D.; Duan, X. Multi-strategy ensemble biogeography-based optimization for economic dispatch problems. Appl. Energy 2013, 111, 801–811. [Google Scholar] [CrossRef]
  27. Ishraque, M.F.; Shezan, S.A.; Rashid, M.; Bhadra, A.B.; Hossain, M.A.; Chakrabortty, R.K.; Ryan, M.J.; Fahim, S.R.; Sarker, S.K.; Das, S.K. Techno-economic and power system optimization of a renewable rich islanded microgrid considering different dispatch strategies. IEEE Access 2021, 9, 77325–77340. [Google Scholar] [CrossRef]
  28. Wen, Y.; Chung, C.; Liu, X.; Che, L. Microgrid dispatch with frequency-aware islanding constraints. IEEE Trans. Power Syst. 2019, 34, 2465–2468. [Google Scholar] [CrossRef]
Figure 1. Solar radiation and clearness index.
Sustainability 16 02642 g001
Figure 2. Average wind speed profile.
Sustainability 16 02642 g002
Figure 3. Model of the proposed grid-connected microgrid.
Sustainability 16 02642 g003
Figure 4. Research methodology/flow diagram.
Sustainability 16 02642 g004
Figure 5. Block model of DIgSILENT PowerFactory study.
Sustainability 16 02642 g005
Figure 6. Flow diagram for LoF strategy.
Sustainability 16 02642 g006
Figure 7. Flow diagram for CyC strategy.
Sustainability 16 02642 g007
Figure 8. Microgrid component’s frequency responses.
Sustainability 16 02642 g008
Figure 9. Voltage responses of the various components within the microgrid.
Sustainability 16 02642 g009
Figure 10. Voltage responses of the various components within the microgrid.
Sustainability 16 02642 g010
Figure 11. Current responses of the various components within the microgrid.
Sustainability 16 02642 g011
Figure 12. Active power responses of the various sources within microgrid.
Sustainability 16 02642 g012
Table 1. Estimated connected load.
Type of LoadNo. of UnitsPower RatingTotal Watt
CCTV, computer with accessories30250 W7500 W
Ceiling fan30100 W3000 W
Other laboratory equipment (during lab time)--2410 W
Lighting load5040 W2000 W
Air conditioner42000 W8000 W
Photocopy machine2200 W400 W
Gross peak load (connected demand)23,310 W
Table 2. Summary of the outcomes of the optimization procedure.
DiSGenerator
(kW)
PV (kW)Battery
(kWh)
Wind Turbine
(kW)
GridConverter
(kW)
LE
(AUD/kWh)
NC (AUD)Operating Cost
(AUD)
EnSEnP
LoF251.73211.357,9140.3650.09674,7423814
CyC251.73211.357,9140.3650.09674,7423814
Here, EnP is equal to the energy (in kWh) acquired from the traditional grid; EnS is the amount of energy provided in kWh to the traditional grid.
Table 3. Generation of hazardous gas from the suggested microgrid.
Name of the GasCyC Quantity (kg/year)LoF Quantity (kg/year)
Hydrocarbons (Unburned)00
CO00
CO236,60236,602
Oxides of N277.677.6
SO2159159
Particulate Matter00
Disclaimer/Publisher’s Note: The statements, opinions and data contained in all publications are solely those of the individual author(s) and contributor(s) and not of MDPI and/or the editor(s). MDPI and/or the editor(s) disclaim responsibility for any injury to people or property resulting from any ideas, methods, instructions or products referred to in the content.

