Abstract
The Mediterranean region is a hot spot for climate change, with transportation accounting for a quarter of global CO2 emissions. To meet the 2030 Sustainable Development Goals (SDGs), a sustainable urban transport network is needed to cut carbon emissions and improve air quality. This study aims to investigate the electrification of public transport in both developed and underdeveloped countries by examining the existing public transport network of two modes of transportation (buses and trams) across the Mediterranean region. This study suggests that the electrification of public transportation could result in a significant additional demand for more than 200 GWh of electricity, depending on the size and congestion of the city. It also studies the potential reduction of greenhouse gas (GHG) emissions through the electrification of buses. Results show that electrification significantly impacts decreasing GHG emissions, helping achieve SDG 13. Furthermore, a financial analysis was conducted to determine the feasibility of using different bus fuel technologies. Regarding economic benefits, electric buses are not consistently optimal solutions, and diesel buses can be advantageous. Our finding shows that, at a 5% discount rate, the diesel bus is most favorable for Marseille, and, as discount rates increase, the advantage of electric buses diminishes. However, the high purchase price of electric buses compared to diesel buses is currently a major obstacle in achieving SDG 11, particularly for developing countries.
1. Introduction
According to projections from global climate change models, the Mediterranean basin emerges as a notable “hot spot”, signifying its heightened vulnerability to the impacts of global warming [1,2]. The air temperature within the basin exhibited a substantial rise throughout the 20th century, registering an increase ranging from 1.5 °C to 4 °C [3,4]. Climate change and global warming are among the most critical global issues, mainly motivated by the excessive amounts of greenhouse gases (GHG) sent into the atmosphere [5]. Figure 1 depicts the annual CO2 emissions per capita for the year 2022 worldwide [6]. According to the depicted figure, the majority of Mediterranean countries exhibit CO2 emissions ranging from 3.9 to 9.5 tons per capita, highlighting a notable variation within the region and emphasizing the urgency of targeted environmental initiatives. In contrast to the EU average of 560 cars per 1000 people, the motorization rate in the Mediterranean region is notably higher. Consequently, governments in the Mediterranean region have committed to adopting ambitious measures to diminish private car ownership. This strategic initiative aims to provide residents with increased access to environmentally sustainable mobility options while concurrently enhancing the overall efficiency and sustainability of the public transportation sector.
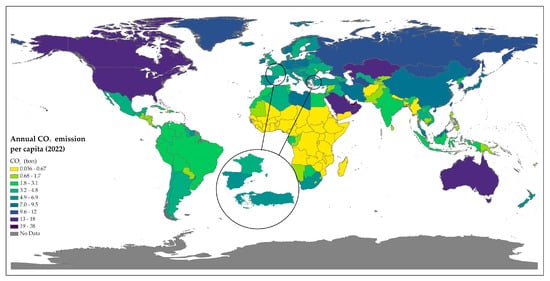
Figure 1.
The global annual CO2 emission per capita due to fossil fuels consumption for the year 2022, with a focus on the study area (right to left: Türkiye, Greece, France, and Spain). Source: Global Carbon Budget (2023); population based on various sources (2023), with major processing by Our World in Data. “Annual CO2 emissions (per capita)—GCB” [dataset]. Global Carbon Project, “Global Carbon Budget”; various sources, “Population” [original data] (accessed on: 30 January 2024) [6].
Transportation emissions were 23% of global energy-related CO2 emissions in 2015. In cities, public transportation contributes to a substantial share of travel [7]. Due to their considerable fossil fuel use and heavy emissions, buses can account for up to 34% of all vehicle emissions [8]. Enhancing public transportation systems is considered a potential solution to address concerns about increasing carbon emissions, rising temperatures, and traffic congestion in major cities [9]. Electric-powered public transportation has proven effective in alleviating congestion and reducing pollution in urban settings [10]. Although other clean technologies exist, such as hydrogen and alternative fuel-powered engines, electrification remains the most practical approach to combat urban air pollution [11,12]. This shift involves the displacement of internal combustion engines in favor of electricity-powered counterparts, encompassing battery-equipped electric vehicles (EVs), plug-in hybrid electric vehicles (PHEVs), and hybrid electric vehicles (HEVs), collectively referred to as EVs [7]. Such a transition not only addresses pollution concerns but also aligns with the broader global push towards sustainable and eco-friendly transportation alternatives.
Cities commonly choose between implementing electric mass transit systems using trams or trolleybuses. The decision between trams and trolleybuses in public transportation is influenced by various factors, with operating costs being a pivotal consideration. The energy consumption per passenger kilometer represents a critical determinant in this decision-making process, impacting the overall sustainability and economic viability of the chosen electric mass transit system [13]. While trams and trolleybuses are traditional contenders, electric buses have become a modern and versatile alternative. The evolving landscape of electric transportation technologies introduces an additional dimension for city planners. Assessing factors such as efficiency, infrastructure requirements, and environmental impact becomes essential when evaluating the suitability of electric buses compared to trams and trolleybuses for public transportation initiatives [14]. Public buses constitute a vital component of a city’s transportation infrastructure, operating on established fixed routes that render them well-suited for electrification. A study conducted by [15] anticipates a substantial growth in the number of electric buses, projecting a tripling of their prevalence within the next seven years. This forecast highlights the growing effort and determination to shift towards sustainable and environmentally friendly alternatives in public transportation.
It should be noted that replacing oil-powered vehicles with electric vehicles might not effectively reduce carbon emissions if the marginal electricity production relies on coal, potentially resulting in an overall increase in carbon emissions [16]. The occurrence of the “green paradox” necessitates that electric vehicles be cost-competitive with conventional gasoline vehicles, considering the extraction cost of gasoline.
The adoption of electric buses (e-buses) in the Mediterranean region is rising, exemplified by Marseille (France) taking the initiative as the first city to introduce a 100% electric bus line. With an ambitious vision, Marseille aims to convert approximately 50 buses annually and electrify its entire fleet by 2035. Recognizing the impact of the warm Mediterranean summers on urban mobility, cities like Alexandria (Egypt), Marrakesh (Morocco), and Rimini (Italy) have demonstrated a climate-sensitive strategy in promoting the adoption of environmentally friendly public transportation [17].
Sustainable urban mobility transition involves a comprehensive approach considering environmental, social, and economic aspects [18,19,20]. It aims to create efficient transit systems, reduce carbon emissions, alleviate traffic congestion, and enhance overall urban living quality [18,21]. Key components include integrating public transportation networks, promoting non-motorized modes, and adopting clean technologies. It seeks to build resilient, inclusive, and environmentally friendly urban spaces by striking a balance between individual, community, and environmental needs [22,23]. Sustainable urban mobility in the Mediterranean region requires a dual strategy: a thorough shift towards eco-friendly transportation and the electrification of existing systems. By transitioning to electric vehicles like buses and trams, powered by renewable energy sources like solar, Mediterranean cities can dramatically reduce their carbon footprint and air pollution, fostering a cleaner future for residents and tourists alike [23,24]. This combined approach is vital for the region’s long-term environmental and economic well-being.
Electrification of urban mobility in the Mediterranean region is a crucial initiative to address environmental challenges [25,26,27]. To the best of our knowledge, no comprehensive study has thoroughly examined the electrification of this region across various aspects, including energy demand, carbon reduction, and economic benefits. Therefore, our study focuses on this region to compare potential solutions and contribute to understanding sustainable mobility transitions in different scenarios.
Although low-emission transportation is desirable and beneficial for environmental health, evaluating total costs and benefits from several points of view is highly noteworthy [28,29]. Therefore, in this study, we will also use the Net Present Value (NPV) notion to assess the overall costs and benefits of various public transportation scenarios, considering internal (purchase, operation, and maintenance) and external (environmental and health) financial costs. Studies have shown that cost–benefit analysis (CBA) is potentially robust, and choices based on CBA lead to significantly higher net benefits compared to randomly selected plans. Thus, CBA contributes to improved decisions even under high uncertainty levels [30].
This paper aims to delve into the electrification of public transport networks within the Mediterranean region, specifically focusing on buses and trams—two pivotal components that have shaped urban transportation for many years. Both modes significantly contribute to public transportation, operating around the clock, setting them apart from other transportation methods. Their continuous service availability aligns with the demand, and their relatively lower energy consumption stands out, even when compared to more extensive systems like Mass Rapid Transit (trains and underground metro). Electricity consumption of these two modes of public transportation is calculated to understand future demand when transitioning to full electric transportation. Furthermore, the paper explores various scenarios to assess potential CO2 reduction in the context of electrifying public transport in the Mediterranean region. Finally, the cost analysis of these scenarios is investigated in terms of the external costs of environmental pollution and damage to health. The analysis of these scenarios provides valuable insights and aims to inform sustainable decision-making processes.
The remaining sections of the article are structured as follows: Section 2 will compare the advantages and disadvantages associated with electrifying the network. Following that, Section 3 will analyze the fleets of Mediterranean Good Practices cities across the three regions. The comparison results, potential energy consumption, CO2 emission reduction, and cost analysis related to electrification will be deliberated in Section 4. Section 5 will discuss the findings and offer new insights into the sustainable electrification of Mediterranean cities. Finally, Section 6 concludes the paper.
2. Electric Mobility
The electrification of public transportation vehicles entails converting thermal traction powertrains into electric traction powertrains. Electric powertrains are predominantly used in trams and metros in the transportation sector. However, buses and trains may still utilize thermal traction powertrains to generate traction power in many Mediterranean cities. Buses, in particular, often face electrification challenges, as they may rely on different power sources. Trams typically run with pantographs or catenaries, allowing for the seamless transfer of electricity to the motor throughout the entire journey. In contrast, buses may require additional infrastructure and advancements to facilitate effective electrification, posing challenges beyond improving energy consumption efficiency [31]. The primary drawback associated with batteries lies in their limited energy capacity, which sets a defined range for bus trips [32,33]. To overcome this limitation, strategically positioned recharging stations along the routes are employed to recharge the batteries whenever necessary. Nowadays, there are three methods for charging the batteries: wireless charging, conductive charging, and battery swapping, as depicted in Figure 2.

Figure 2.
Electric vehicle charging techniques.
Wireless charging is a convenient and efficient method of recharging batteries, especially in electric vehicles. This technology uses electromagnetic fields to transfer energy between a charging pad or infrastructure embedded in the road and the electric vehicle’s receiver located on the underside. The absence of physical connectors distinguishes wireless charging, providing a streamlined, cable-free experience for electric vehicle users. This method not only simplifies the charging process but also contributes to the aesthetic integration of charging infrastructure into urban environments. Despite its advantages, wireless charging is still evolving, with ongoing efforts focused on enhancing charging efficiency and addressing potential scalability challenges for widespread adoption in public transportation systems [34].
Conductive charging is a widely utilized method due to its versatility in recharging batteries from various power sources along the road or within depots. In the case of on-route charging, the implementation of pantographs facilitates the process involving the movement from up to down or vice versa. This technology allows electric buses to recharge while in motion, adding flexibility to their operational range. Conversely, depot charging focuses on the speed of the charging process, offering options for both fast and slow charging to cater to specific operational needs. The accessibility and adaptability of conductive charging contribute to its prevalence in supporting the infrastructure for electric vehicles in both on-route and depot scenarios [35].
Battery swapping is an innovative approach to address the limitations of battery energy capacity in electric vehicles. This method swiftly replaces the entire battery pack with a fully charged one at dedicated swap stations rather than recharging a depleted battery. This allows electric vehicles, especially heavy vehicles such as electric buses, to quickly resume operations, significantly reducing downtime associated with traditional charging methods. Battery swapping is particularly advantageous for applications where quick turnaround times are crucial, such as in public transportation and logistics [7]. While this approach offers expedited refueling, challenges related to standardization, infrastructure development, and the cost of maintaining large battery inventories need to be carefully considered for widespread adoption and integration into electric vehicle ecosystems.
In Figure 3, the transit service types are categorized as frequency-based (headway) or schedule-based, providing scheduling insights. In a frequency-based transit system, passengers can access the system based on defined headways, which may vary throughout the day or remain constant. This approach emphasizes the regular intervals between successive vehicles. On the other hand, schedule-based services involve routes with online timetables, where a published timeframe helps determine the headway. Arrival and departure times for different periods of the day are outlined, assuming a consistent and reliable service schedule. This distinction in transit services accommodates diverse passenger needs and preferences [36]. Low-frequency services are characterized by headways exceeding 10 min, signifying the time intervals between successive vehicles. On the other hand, high-frequency services are defined by headways equal to or less than 10 min, emphasizing more frequent and regular intervals between vehicles. This categorization clearly distinguishes between transit services based on the time intervals at which they operate, catering to passengers’ diverse preferences and expectations.

Figure 3.
Transit service types.
The Transit Network Timetable (TNT) plays a crucial role in the smooth functioning of public transportation systems. Its primary objective is to transport the maximum number of passengers while keeping operational costs minimal. Firstly, the TNT is designed to ensure efficient commuting by defining minimum headways. This is followed by Vehicle Allocation, which determines the minimum number of buses required to operate the service [37]. The paper considered the combination of transit network timetabling and vehicle scheduling from the perspective of regulating authorities. The objective is to create a synchronized network timetable and associated vehicle assignments, subject to a set of constraints and goals [38].
A well-planned bus schedule provides adequate public transportation and contributes to sustainability by encouraging mass transit over private vehicles, thereby reducing overall carbon emissions and traffic congestion [39]. Similarly, an efficiently designed vehicle schedule helps decrease the operational costs associated with running a bus line, further enhancing public transportation systems’ economic and environmental sustainability. However, the alignment between these two plans may only sometimes be seamless. In practice, bus timetables are often created without considering the coordination of arrival and departure times for each vehicle at the same bus terminus. This oversight can lead to inefficiencies, such as an unnecessarily large fleet size of buses, highlighting the importance of integrated planning approaches that prioritize both operational efficiency and sustainability goals.
On the other hand, reducing fleet size may negatively impact bus timetables despite lowering operating costs [40]. The analysis conducted by [41] to optimize a bus line in Singapore unveiled the potential for a 9.5% improvement in service regularity for the worst-case link under the hourly passenger boarding scenario through implementing a robust timetable. Bus Bunching (BB), a common occurrence during rush hours and on lanes serving multiple lines, poses challenges to transit efficiency. The optimization of individual line timetables emerges as a strategic measure to alleviate the risk of BB, with various strategies having been explored and implemented to address this phenomenon. Ref. [42] developed algorithms to regulate the headway between subsequent buses. Ref. [43] designed a mechanism for regulating speed that took bus-to-bus communication and extended green times into account.
When formulating fleet schedules, it is crucial to consider the type of operating speed from the outset. Running speed and commercial speed represent two critical categories of operating speeds for vehicles traversing a route. The distinction between these speeds has been outlined in [44], with [45] contributing a model for calculating the commercial speed of buses along a route. Additionally, ref. [46] has identified the average speed for various transportation modes. Exploring new methods becomes imperative to offer alternative solutions and address current challenges in optimizing fleet schedules and energy efficiency in urban transportation systems.
Incorporating the concepts of commercial speed and running speed can significantly influence the network’s frequency, taking into account factors such as route length, population density, and time of day. Integrating speed allocation with a frequency-based approach establishes a cohesive network, optimizing the efficiency of public transportation services. This approach minimizes investments in generating, transmitting, and powering electricity, enhancing overall efficiency, as emphasized in [47]. Furthermore, embracing innovations within the transportation sector has the potential to impact CO2 emissions swiftly and improve the sustainability of the transportation system, particularly in industries with lower pollution levels, as suggested in [48]. Combining the optimization of speed, frequency-based planning, and the adoption of green energy, we can create a comprehensive strategy for building a sustainable and efficient urban transportation network.
The electrification of public transportation systems, especially buses and trams, has enormous potential to promote sustainability in urban mobility. Innovative electric vehicle charging techniques such as wireless charging, conductive charging, and battery swapping can not only reduce carbon emissions but also improve the efficiency of transit services. The careful consideration of transit service types, whether frequency-based or schedule-based, becomes crucial in creating a well-coordinated and sustainable network. Optimized schedules, speed allocation, and the integration of green energy sources for electrification are all contributing factors to a more sustainable public transportation ecosystem. The pursuit of reducing CO2 emissions aligns with the global imperative to combat climate change. The insights underscore the necessity for comprehensive planning and innovative strategies to establish a sustainable and environmentally friendly public transportation infrastructure, especially in Mediterranean cities with outdated public transportation systems [17].
3. Mediterranean Good Practices
Many northern Mediterranean cities experienced a decline in CO2 emissions during the 2008 financial crisis [49]. This outcome can be attributed to the interaction between the recession’s impact on urban mobility and the sustainable mobility policies implemented in the preceding decade [14,17]. In cities, particularly those in the northern Mediterranean region, multimodal methods and other sustainable urban mobility initiatives have already been introduced. Across most EU cities along the Mediterranean Sea, plans for sustainable urban mobility are created and regularly evaluated, leading to the effective implementation of sustainable mobility measures. In contrast, many cities in the southern and eastern Mediterranean are in the nascent stages of urban transportation planning, with mobility measures needing to be more effective due to the formidable challenges associated with implementing large-scale solutions in urban transportation, as highlighted in [14,17].
This paper aims to gain insight into the current public transportation scenarios within the urban cities of the three distinct Mediterranean regions. Focusing on the widely utilized modes of transportation, bus rapid transit (BRT) and light rail transit (LRT), we will explore the prevalence and effectiveness of buses and trams, especially given their prominence even in developing countries. Geographically, the regions will be categorized as follows: north Mediterranean, encompassing the area from Portugal to Italy; south Mediterranean, spanning from Morocco to Egypt; and east Mediterranean, covering the region from Egypt to Italy. To gain practical insights into the sustainable mobility development of each Mediterranean region, specific cities have been selected for comprehensive analysis:
- North Mediterranean: Barcelona and Marseille;
- South Mediterranean: Tunis and Algiers;
- East Mediterranean: Izmir and Athens.
These chosen cities represent diverse urban landscapes within their regions, allowing for a nuanced examination of sustainable mobility initiatives and their effectiveness. These cities have been specifically selected for a focused analysis of their public transportation systems, encompassing buses and trains, with a particular emphasis on potential CO2 reduction through electrification [2]. The objective of concentrating on these key aspects is to uncover diverse strategies, hurdles, and accomplishments in advancing sustainable urban transportation within the north, south, and east Mediterranean regions. The analytical examination of these cities will provide valuable insights into the distinct factors that shape the development of sustainable mobility across the Mediterranean, paving the way for informed measures to enhance the sustainability of transportation systems in these regions.
3.1. North Mediterranean
Barcelona, the capital of Catalonia, is situated in the eastern part of Spain and had a population of approximately 1.6 million people in 2021. Renowned for its rich cultural heritage, Barcelona features a robust public transit system comprising metros, buses, trams, and trains, all seamlessly operated by Transports Metropolitans de Barcelona (TMB). This extensive network enhances mobility for both residents and visitors alike. Moving eastward, Marseille, the capital of the Provence-Alpes-Côte d’Azur region in France, stands as a vibrant ancient port city along the southern coast. Régie des Transports de Marseille (RTM) oversees Marseille’s contemporary public transportation system, offering reliable and efficient services encompassing a metro system, buses, and trams. The well-managed transit infrastructure is crucial in facilitating convenient and sustainable mobility within the city.
3.1.1. Bus
Barcelona has an extensive bus network covering most of the city and its suburbs, making buses a popular choice for suburban residents and those traveling long distances within the city. With numerous bus lines operating, the routes are thoughtfully designed to offer convenient access to essential locations, including shopping centers, tourist attractions, and schools. The bus routes in Barcelona are categorized to enhance accessibility and streamline transportation services:
- Horizontal: where the roads are parallel to the seashore (H4–H8–H12–H16);
- Vertical: where the routes are perpendicular to the seashore (V7–V11–V15);
- Diagonal: where the trails take a diagonal path between horizontal and vertical (D20–D40).
RTM manages multiple bus lines, ensuring regular and convenient intervals to key locations in Marseille. The bus schedules are structured into Day and Night buses. Day buses operate throughout the city and suburban areas from 4:30 a.m. to 10:00 p.m., while Night buses cover main routes during the night from 10:00 p.m. to 8:45 a.m. Figure 4 provides a comparative analysis of the fleet sizes in both cities, considering the number of vehicles each fleet possesses. Additionally, the total distance covered per day in kilometers is a crucial metric for evaluating the efficiency and reach of the bus services [50,51].
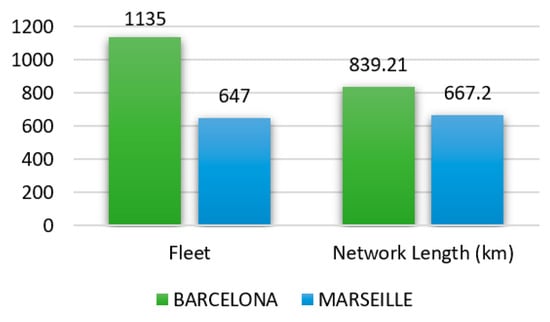
Figure 4.
BRT network in north Mediterranean.
In evaluating the sustainability and future electrification prospects of BRT networks in Barcelona and Marseille, key parameters such as fleet sizes, network lengths, and populations served were considered. Barcelona, with a fleet size of 1135 and a network length of 839.21 km, caters to a population of 1.62 million. In contrast, Marseille, with a fleet size of 647 and a network length of 667.2 km, serves a population of 870,321. Both cities are compelled to explore sustainable practices, such as currently operating traditional vehicles, emphasizing the adoption of eco-friendly fuels, or transitioning to electric buses to mitigate environmental impacts.
3.1.2. Tram
The public transportation systems in Barcelona and Marseille feature modern tram networks that play a vital role in facilitating convenient urban mobility. Barcelona’s tram network includes two lines: Trambaix (T1–T2–T3) and Trambesòs (T4–T5–T6). Meanwhile, Marseille boasts a modern light rail network comprising three lines with a total distance of 16.4 km. The trams in both cities serve as crucial connectors, offering easy access to critical locations such as the city center, beaches, and parks.
Operational details highlight the efficiency of these tram networks. In Barcelona, the trams operate from 5:00 a.m. to 1:00 a.m., ensuring extensive daily coverage. Similarly, Marseille’s trams maintain a headway frequency of 8 min, indicating frequent and regular commuter service. Figure 5 visually represents the synchronized tram schedules in both cities, emphasizing their commitment to providing reliable and accessible public transportation options.

Figure 5.
LRT network in north Mediterranean.
Barcelona, with a LRT fleet size of 41 and a network length of 23.2 km, serves a large population. In contrast, Marseille, with a fleet size of 47 and a network length of 16.4 km, serves a smaller population than Barcelona. Both cities exhibit a commitment to sustainable urban transportation through their LRT systems. While Barcelona has a smaller fleet size, its longer network suggests a potential for future electrification initiatives, which would be particularly significant in its densely populated urban setting. Marseille, with a slightly larger fleet and a shorter network, can focus on optimizing sustainability through strategic electrification plans tailored to its unique urban characteristics.
3.2. South Mediterranean
Tunis, the capital city of Tunisia, is a vibrant and historic metropolis located on the Mediterranean coast of North Africa. With a population of over 0.7 million spread across 212 , the city boasts diverse public transportation modes overseen by TRANSTU, established in 2003. TRANSTU manages the bus network, the Métro léger de Tunis (light railway system), and the TGM light rail link to La Marsa. On the western border of Tunisia is Algiers, the capital of Algeria, which is the largest country in Africa. Algiers features a modern transportation network encompassing an underground metro line and a tram line, serving a population of approximately 3 million over an expansive area of 363 . The authority for urban transportation in Algiers is decentralized among three entities—shared right of way, guided transit, and private—contributing to the efficiency of the city’s transportation system [52].
3.2.1. Bus
Like many North African cities, Tunis and Algiers lack a well-defined bus network or rapid transit service. TRANSTU in Tunis manages a fleet of 350 buses, while ETUSA in Algiers operates 275 buses. Both cities need help in terms of organization and authority within the Public Transport Operator (PTO) framework for their bus networks. Instead of conventional buses, paratransit buses play a prominent role in transporting passengers across the cities. The major drawback of paratransit modes lies in the lack of defined routes, as drivers have the flexibility to choose the roads for their trips [53]. This unpredictability in routes disrupts the frequency of vehicles throughout the day, leading to inconsistent schedules and inconveniences for passengers.
3.2.2. Tram
The tram network in North Africa stands out as one of the most robust systems compared to the bus network. Egypt, Tunisia, Algeria, and Morocco each boast at least one network utilizing tramways or light rail transit (LRT) systems, as depicted in Figure 6. In Tunis, the LRT system comprises six lines, collectively accommodating approximately 50,000 passengers daily, with the additional Tunis Lake-Marine light rail system known as TGM, connecting Tunis Marine to La Marsa. Conversely, Algiers features a single tram line managed by SETRAM, catering to nearly 150,000 passengers daily, operating from 5:30 a.m. to 11:15 p.m. The schedules vary between summer and winter, encompassing both day and night hours in both cities.
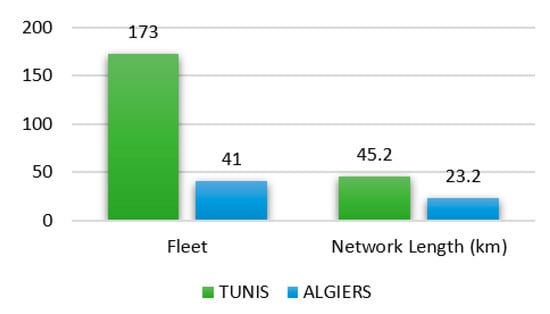
Figure 6.
LRT network in south Mediterranean.
Analyzing the LRT networks in Tunis and Algiers reveals distinct sustainability and future electrification characteristics. Tunis, with a fleet of 173 vehicles and a network length of 45.2 km, showcases a robust commitment to extensive public transportation for its population of around 0.6 million. This positions Tunis favorably for future electrification initiatives that align with long-term environmental goals. Algiers, with a smaller LRT fleet of 41 vehicles and a network length of 23.2 km, may strategically focus on sustainability through targeted electrification plans and operational efficiency tailored to its unique urban characteristics and a larger population of around 2.8 million. Both cities share the common goal of considering future electrification to contribute to global sustainability objectives, with Tunis showcasing the potential for a more comprehensive electrification strategy while Algiers emphasizes strategic planning in line with its larger population.
3.3. East Mediterranean
Izmir, a vibrant metropolis with a population exceeding 4.3 million, remains a global attraction. The İzmir Metropolitan Municipality oversees the comprehensive public transportation system, encompassing buses, trams, metros, and trains, serving the expansive 7340 city. Venturing to the northwest, Athens, Greece’s capital, boasts a well-established public transportation network catering to both residents and visitors. Covering an area of 412 km2, Athens has witnessed a transformation in its urban transportation system since the 2004 Olympics, meeting the needs of its 3.15 million inhabitants. The city’s diverse transportation modes include buses, metro, trams, and suburban railways, complementing its significance as a major seaport and renowned tourist destination with picturesque beaches and historical landmarks. Recent surveys report a population of 130,000 within the 610 Mediterranean city.
3.3.1. Bus
Izmir bus fleet stands out with its comprehensive coverage, encompassing a remarkable 415 routes that weave through every corner of the city. The services start at 6:00 a.m., ensuring a robust presence until just before midnight. Five dedicated bus routes navigate the main roads at night, providing essential services even after dark. Meanwhile, Athens maintains an extensive network with 282 courses operating throughout the day and into the night, from 5:00 a.m. to 11:30 p.m. The Greek capital further enhances accessibility with six buses that operate 24 h a day, denoted by the codes X14, X80, X93, X95, X96, and X97. Figure 7 illustrates the similarities between the public transportation approaches of Izmir and Athens, specifically their bus services.

Figure 7.
BRT network in east Mediterranean.
Currently relying on traditional vehicles in their BRT fleets, both cities prioritize extensive coverage to serve their populations. Izmir, with 1766 buses and a network spanning 1523 km for a population of 4.36 million, demonstrates a dedication to a comprehensive BRT system. Athens, boasting 1897 buses and a network of 1793 km for 3.8 million residents, similarly emphasizes the importance of a well-connected BRT network. While both cities showcase a significant commitment to BRT, Izmir’s marginally larger fleet and network suggest greater potential for future electrification. The shared focus on sustainability aligns with global trends, allowing both cities to enhance their BRT networks by adopting electric or hybrid vehicles, contributing to the east Mediterranean region’s long-term environmental goals.
3.3.2. Tram
Izmir boasts a relatively advanced tram system featuring two lines that offer efficient and picturesque transportation to key destinations in the city center. Running along dedicated tracks, these trams cover a total distance of 31.8 km, providing a modern and sustainable alternative to buses. Line 1, known as Tram Karsiyaka, gracefully navigates the north shore of the Gulf of Izmir. In contrast, Line 2, named Tram Konak, traverses the south coast of the Gulf and the city center, enhancing accessibility and reducing reliance on traditional vehicles. Prompted by the 2004 Olympics, Athens underwent a tram network revitalization, resulting in two new LRT lines covering a combined distance of 34.3 km. This sustainable approach aligns with the evolving needs of a dynamic city. The headway frequency in Izmir is set at 10 min, promoting regular and efficient service. Athens boasts a slightly higher frequency at 7.5 min, contributing to enhanced urban mobility and sustainability, as depicted in Figure 8.

Figure 8.
LRT network in east Mediterranean.
Examining the LRT networks in Izmir and Athens reveals their shared commitment to sustainable public transportation, as they currently employ traditional vehicles in their fleets. Izmir, with a fleet of 38 LRT vehicles covering 31.6 km for a population of 4.36 million, emphasizes the importance of efficient and environmentally friendly transit. Athens, with 60 LRT vehicles covering 34.3 km for a population of 3.8 million, similarly highlights the significance of a well-connected LRT network, contributing to efficient mobility and reduced environmental impact. While both cities demonstrate dedication to LRT networks, Izmir’s slightly smaller fleet and network suggest the potential for increased capacity in future electrification efforts.
4. Results and Analysis
4.1. Energy Consumption Analysis
The electrification of public transportation relies on the method of delivering electricity to the powertrain, with the use of a pantograph making trams a popular mode of transportation due to the continuous electricity supply throughout the entire trip. Considering future sustainability, the average daily commercial speed in Europe stands at around 14.6 km/h. Independently analyzing each city, Barcelona’s tram achieves a daily average commercial speed of 17.5 km/h, surpassing Marseille, which ranges between 13 to 17 km/h daily. In the southern Mediterranean, Tunis experiences a lower LRT commercial speed of 9 to 13 km/h, contrasting with Algiers, where the tramway operates at 12.8 km/h. The daily average commercial speed in Izmir is 16.5 to 17.8 km/h, whereas Athens consistently operates at 17.9 km/h. Notably, the disparity in commercial speeds between southern Mediterranean cities and northern and eastern Mediterranean cities is evident, impacting daily trip numbers and overall service efficiency.
The daily average commercial speeds are crucial in shaping the future sustainability and electrification of Mediterranean cities’ tram and LRT systems [54]. Cities with higher commercial speeds, including Barcelona, Marseille, Izmir, and Athens, are poised for positive impacts, such as increased efficiency, reduced travel times, and heightened service reliability, fostering an attractive public transportation environment. This, in turn, contributes to enhanced energy efficiency and decreased environmental impact. Conversely, cities with lower commercial speeds, exemplified by Tunis in the southern Mediterranean, face challenges that may impede sustainability and electrification efforts, necessitating targeted investments in infrastructure, technology, or policy adaptations. Using pantographs in trams emerges as a sustainable practice supporting continuous electricity supply, aligning with future electrification goals. A customized strategy for each city is essential to optimize efficiency, minimize environmental impact, and progress toward sustainable and electrified public transportation systems in the Mediterranean region.
Contrastingly, electrifying buses offers two distinct methods. The first employs the pantograph, mainly observed in articulated buses. The second utilizes batteries to provide traction power, albeit facing two primary drawbacks: limited range and extended recharge times. When considering weight per passenger, trams typically outweigh trolleybuses. While this might imply higher energy consumption per passenger kilometer in trams due to their increased weight, it does not necessarily translate to higher power consumption. This is because trams, which have steel wheels on steel rails, have significantly lower rolling resistance compared to trolleybuses with rubber tires on asphalt or concrete roads.
Trams in a city consume energy, which is influenced by various factors such as their design, operational patterns, passenger capacity, and infrastructure. Trams are more energy-efficient and greener public transportation modes than individual vehicles that run on fossil fuels. Trams use electricity as the primary energy source, usually supplied through overhead wires or a third rail. The efficiency of a tram’s electric propulsion system, regenerative braking capabilities, and the weight of the vehicle are crucial factors that determine energy consumption. Moreover, energy usage is also influenced by route topography, speed, frequency of stops, and the overall demand for the service. Tram energy consumption is being studied [55,56,57], with estimates ranging between 2 and 5 kWh/km.
The average speed of trams differs depending on the location and the infrastructure. In congested city centers with frequent stops and traffic interactions, the speed ranges from 15 to 20 km/h. Meanwhile, the speed is between 25 and 35 km/h in the suburbs, with dedicated lanes and fewer stops. However, in modern systems with advanced infrastructure and priority signaling, the speed can be as high as 40 km/h or more.
Table 1 presents the energy consumption for the LRT system, assuming that trams operate 18 h per day throughout the entire year. The calculations are based on energy consumption estimates, ranging from a lower boundary of 2 kWh/km to an upper boundary of 5 kWh/km, with a specific average speed for each city based on available data. Tunis stands out with the highest average energy consumption among the cities under study, boasting a fleet of 173 in the LRT system and a network length of 45.2 km, equating to 119.89 MWh per day. In contrast, Algiers, with a fleet of 41 and a network length of 23.2 km, exhibits the lowest average energy consumption at 33.06 MWh per day. In this table, the rows with a more intense color indicate cities with higher energy consumption.

Table 1.
Energy consumption for the LRT system in terms of daily and annually for case studies.
The energy consumption of electric buses depends on several factors. The key factors that influence energy consumption are the model and specifications of the bus, including size, weight, battery capacity, and motor type. Generally, newer advanced models are more efficient. Other factors that play a crucial role include the operating conditions, such as the route characteristics, climate, and traffic congestion. Passenger load, driving behavior, maintenance, and efficiency are also significant. Due to these factors, energy consumption for electric buses typically ranges from 1.1 to 2.3 kWh/km for smaller buses in optimal conditions, 2.0 to 3.5 kWh/km for larger or less efficient models, and can exceed 4.0 kWh/km under demanding conditions like severe uphill routes or extreme weather.
Table 2 presents the energy consumption for the BRT system for cities with available data. The calculations consider energy consumption estimates ranging from a lower limit of 1.1 kWh/km to an upper limit of 2.3 kWh/km [31,39,58], considering a specific total daily coverage for the entire fleet in each city. Athens distinguishes itself as having the highest average energy consumption among the cities under examination, featuring a BRT system fleet of 1897 and a network length of 1793 km, totaling 506.27 MWh per day. Conversely, Marseille, with a fleet of 647 and a network length of 667.2 km, demonstrates the lowest average energy consumption at 105.73 MWh per day. In this table, the rows with a more intense color indicate cities with higher energy consumption.
Table 2.
Energy consumption for the BRT system in terms of daily and annually for case studies.
Table 1 and Table 2 reveal that BRT systems in the Mediterranean region consume more energy than LRT systems. The difference in energy demands between buses and trams is due to the fact that buses cover a greater number of lines and services. However, when considering the electrification of bus rapid transit systems, it is essential to evaluate these energy demands critically from a sustainability perspective. The growing energy demands highlight the significance of incorporating renewable and sustainable energy sources into public transportation systems to reduce environmental effects and maintain ecological balance in the long term. It is crucial to address these aspects to achieve a sustainable coexistence of efficient urban mobility and sustainable practices in the Mediterranean region.
4.2. Air Pollution Analysis
In our investigation of the CO2 emissions from buses in Mediterranean cities, we explored four fuel type scenarios: S1, diesel; S2, CNG; S3, hybrid; and S4, fully electric. The emission indices of the various fuels (Table 3) were extracted from the available literature [59,60,61]. However, it is crucial to note that these values are not universally constant, as they depend on various factors, including driving conditions, road types, fuel economy, and, significantly, the source of energy production. The CO2 emission is calculated using Equation (1). The results highlight a clear disparity between conventional fossil fuel-powered buses and those utilizing alternative, more sustainable options. Electric buses, in particular, have demonstrated a substantial reduction in CO2 emissions compared to their counterparts running on traditional fuels. The deployment of electric buses, especially when integrated with renewable energy sources, emerges as a key strategy for cities seeking to address both local air quality concerns and global climate change challenges. This can help transportation achieve a net zero situation as the emission both in the well-to-tank (WTT) and the tank-to-well (TTW) will move towards zero [62].
where is the number of bus fleets, is the emission index of fuel type and is the average annual distance traveled. Figure 9 shows the map of the study areas and their CO2 emissions in the assumed scenarios. A more detailed numerical analysis of the amount of emissions is presented in Table 4.
Table 3.
Fuel types and their emission factors.
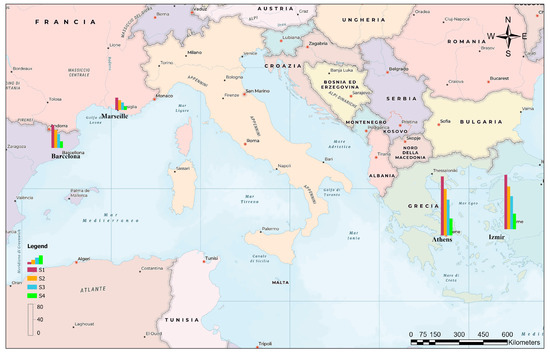
Figure 9.
The CO2 emissions of the Mediterranean cities in four scenarios: Marseille, France, Athens, Greece, Barcelona, Spain, Izmir, and Turkey.
Table 4.
The result of CO2 emission estimation under different fuel type bus technologies.
As seen from Table 4, Athens and Izmir, due to being mega cities and having a high population, have larger bus fleets and thus emit higher GHG amounts. In this table, the rows with a more intense color indicate cities with higher estimated CO2 emission. As cleaner fuels are used, the amount of pollution emitted decreases. Comparing S4, where the whole fleet is fully electric buses, to S1, where all of the fleet is conventional diesel fuel type, we can witness an approximate 71% reduction in emissions. This percentage in metropolises with a large number of public transportation fleets and extended networks accounts for a considerable amount of carbon emission per capita. For instance, if the entire bus fleet of the city of Athens transitions into full electric buses, it could result in an almost 200-ton decrease in CO2 emissions, which is a considerable number compared to cities such as Barcelona and Marseille, showing the importance of the electrification of public transportation.
4.3. Cost Analysis
Decision makers often decide based on several factors to choose a specific scenario. Transportation is not an exception, and these criteria include the costs of acquiring, operating, and maintaining the buses. The external costs of environmental pollution and damage to health are also a part of the bus technology choice, which policymakers should consider. Here, we propose the concept of Net Present Value to calculate the costs related to each bus technology to help make better decisions for public transportation [28]. The total NPV for each bus type over a period of 12 years (average lifetime of city buses) is given by Equation (2).
where is the purchase price of the bus, and are the operation cost and the external cost of each bus technology, respectively. is the discount rate, which is responsible for discounting the future costs to their present value by considering factors such as inflation and investment risks.
The purchase price for different buses can vary based on the manufacturer and various characteristics of buses. Still, this paper considers the average price of each bus category. The operation cost roughly depends on the fuel consumption, fuel price, mileage, and maintenance costs. Finally, the external costs can be defined as the total damage of pollution emissions to the environment and public health. The total CO2 emissions in the EU in 2021 were estimated to be around 2.7 trillion tons, and the marginal environmental and health costs of GHG (CO2, CH4, N2O) emissions were computed to be nearly EUR 150,657 million [63]. Therefore, the damage valuation of the CO2 is approximately EUR 54.94 per ton. Consequently, the damage cost for each fuel type can be calculated.
Equation (3) calculates the operational cost of each bus, where is the average annual distance, is the maintenance cost, is the fuel consumption rate, and is the fuel price. Hybrid buses use a combination of diesel fuel and electricity, as shown in Table 5. The constants and are considered to be 0.5 in this research. Furthermore, Equation (4) computes the external cost, where is the external damage of each fuel type considered. Table A1 (Appendix A) presents all the variables, their description, and values considered in these computations.
Table 5.
The comparison of operation and external costs of the four bus technologies (values in thousands of euros).
The external costs in Table 5 show a declining trend from diesel technology to electric buses, owing to lower GHG emissions. In this table, the rows with a more intense color indicate cities with higher estimated external costs. Operation costs also show a downward trend from diesel to electric due to lower maintenance and fuel costs. Overall, the electric bus almost decreases the operation costs by half and external costs by four times.
Figure 10 presents the results of the NPV computation for each bus type for the case studies. A key element in the NPV equation is selecting a reasonable amount for the discount rate, which affects the final value. Therefore, we have considered three values of 1%, 3%, and 5% to better analyze the value of different scenarios. Figure 10a–c show the NPV results for the four bus technologies with 1, 3, and 5 percent discount rates, respectively.

Figure 10.
The NPV values (in thousands of euros) of four bus technologies for the case studies with discount rates: (a) 1%, (b) 3%, and (c) 5%.
Figure 10 shows that when the discount rate is considered low, the net benefit of electric buses relative to other technologies increases, owing to lower operation and external costs (in Barcelona, when r = 1%, the benefit of electric vs. diesel = EUR 82,670). The NPV of electric buses relative to other technologies decreases as the discount rate increases (in Barcelona, when r = 5%, the benefit of electric vs. diesel = EUR 1350, which means a 98% drop in the benefit compared to when r is 1%). This is due to the higher purchase cost of electric buses than other technologies (EUR +300 thousand relative to diesel). A diesel bus is not always the worst case in terms of NPV; for example, in the cities of Barcelona and Marseille, CNG and hybrid buses are worse compared to diesel, but in the cities of Izmir and Athens, the NPV value of the four bus technologies have a decreasing form from diesel to CNG, CNG to hybrid, and hybrid to electric in all three discount rates. However, an electric bus is the best option for all of the case studies in all three scenarios for the discount rate, except for Marseille when the discount rate is 5%; an electric bus can cost EUR 13,810 more than a diesel bus in the 12-year period. Table 6 illustrates both the optimal and suboptimal scenarios for each case study. To increase table readability, in the first row, color intensity increases as the discount rate increases, and colors green and red represent the best and worst cases, respectively. In subsequent rows, colors light blue, yellow, gray, and pink represent electric, CNG, Hybrid, and diesel buses, respectively. Contrary to expectations, the electric bus does not consistently emerge as the optimal choice, and, likewise, the diesel bus is sometimes a favorable choice. Notably, when the discount rate is set at 5%, the diesel bus is the most advantageous option for Marseille. Additionally, as discount rates increase, the advantage of electric buses diminishes significantly.
Table 6.
The best and worst cases for each city in different scenarios.
5. Discussion
To promote sustainability in the Mediterranean region’s public transportation, a comprehensive comparative analysis examines the complexities of electrification, focusing on BRT and LRT systems. Moreover, the CO2 emission reduction and cost analysis of electrification of the BRT system is investigated. To increase the availability of BRT services in the city, we need to determine the operating speed and total distance covered daily. The commercial speed significantly impacts low-speed profiles, while the running speed affects high-speed profiles. However, there are some challenges we must address to switch to fully electric powertrains, as discussed more in the following.
- Public transportation providers continue to express concerns about the limited driving range of electric buses and the time required to recharge them [64]. To ensure that operations remain efficient, it is essential that electric buses have the capacity to complete their trips without the need for recharging. The regularity and dependability of public transportation services may be affected by the time required to recharge electric vehicles, which is longer than the time needed to refuel traditional vehicles with fossil fuels.
- The technology of batteries is a crucial component in the electrification of public transportation [65]. Currently, the range and capacity of electric buses are limited by the energy density of their batteries. To overcome these limitations, it is imperative to develop new technologies that offer higher energy density and are also lighter, thus increasing the effectiveness, affordability, and durability of electric buses.
- Adapting existing infrastructure to support electric vehicles can be a challenging task [66]. Retrofitting public transportation infrastructure for electric buses requires making necessary changes to accommodate their unique requirements. Many cities have built bus depots and repair facilities for conventional vehicles, which need to be modified to support electric cars. This approach requires additional funding and changes in infrastructure and may cause delays to regular business operations.
- The complete electrification of public transportation systems, encompassing BRT systems, introduces a heightened demand for additional electricity to support daily operations. The transition towards full electrification of transportation poses a unique challenge to the existing power systems, which must be examined closely to determine their capacity to accommodate the increased energy requirements [67]. This shift in urban mobility marks a new era and calls for reevaluating power infrastructure to ensure it can cope with the growing demands of sustainable transportation. It is essential to address this surge in electricity demand to foster the successful integration of eco-friendly public transit solutions while simultaneously reinforcing the resilience and adaptability of regional power grids.
- Additionally, concurrent charging of a substantial fleet of high capacity can introduce challenges related to power quality within the existing system. This highlights the importance of assessing and addressing potential issues that may arise from the combined charging demands of a large fleet. It emphasizes the need for effective power quality management strategies to ensure a stable and reliable electrical infrastructure.
- Our findings suggest that switching to electric buses can significantly reduce CO2 emissions and support the larger goal of decarbonizing the transportation industry. Areas that have adopted electric buses and powered them with clean energy sources have seen a significant decrease in their public transit system’s carbon footprint. These findings highlight the potential for positive environmental impact through the electrification of public transportation in Mediterranean cities. Moreover, it demonstrates the crucial role that these initiatives can play in shaping a more sustainable and resilient urban future.
- Authorities consider various factors when considering a new strategy, including financial benefits. Our paper shows that while electric buses are environmentally friendly, they may only sometimes be the best investment. The same is true for diesel buses, which are only sometimes the worst option. This is because the purchase price of electric buses is higher than that of diesel buses, sometimes even double. Despite the higher operating costs of diesel buses, their lower purchase price makes them a profitable long-term investment. The high cost of electric buses is a significant obstacle to achieving SDG 11, which aims to provide affordable and sustainable public transportation. Reducing the purchase price of electric buses would increase their long-term net benefit, especially in developing countries with high inflation.
- Despite the effectiveness of NPV and CBA analyses, it is shown that not many countries utilize these outputs while considering investment choices [68]. In Mediterranean areas that suffer from high pollution emissions and investment budget is limited, findings of this type of study can prove to be vital when it comes to selecting the most beneficial option.
- The electrification of public transportation offers a significant reduction in CO2 emissions; however, it poses challenges for governments, particularly in underdeveloped countries in the Mediterranean region. Heavy reliance on electric systems may limit investment capacity. For instance, our findings reveal that, despite their environmental benefits, electric buses are costlier than their diesel counterparts, primarily due to higher initial expenses [16]. This financial barrier may hinder the adoption of electric versions, compounded by the substantial energy requirements, posing challenges in providing electricity and upgrading infrastructure, especially in underdeveloped countries. Addressing these barriers is crucial for aligning with SDG targets.
- Governments can efficiently lower overall adaptation expenses and reduce carbon emissions by providing incentives and subsidies [69], along with decreasing the initial purchase costs of electric buses [16]. Furthermore, enhancing the use of renewable energy sources for electricity proves to be an effective strategy in diminishing carbon emissions [70]. The strategic deployment of electric buses, especially when combined with renewable energy sources, is a significant approach for cities aiming to address local air quality issues and global climate change challenges simultaneously.
- The potential for electricity production, urban planning, and city topology (including street types, driving style, and environmental conditions), as well as the specific types of buses used in each city, pose constraints on the analysis presented in this study. Since these data were not available and were not within the scope of this study, we investigated the case studies from a general point of view. This study can be adapted and analyzed for each city if specific datasets were available for each city. Access to more data would also enhance the precision of the output.
As cities in the Mediterranean region face the challenge of accommodating increasing urban mobility, it is essential to prioritize sustainable practices in the electrification of public transportation. In order to reduce the negative impact on the environment caused by transportation, it is necessary to incorporate renewable energy sources and consider the diverse energy requirements of various systems. These are critical factors to consider to create a more eco-friendly and efficient transportation infrastructure throughout the cities in the region.
6. Conclusions
This study investigated electrifying public transportation in developed and underdeveloped countries, emphasizing buses and trams for a sustainable urban transport network aligned with the 2030 Sustainable Development Goals in the Mediterranean. Southern Mediterranean cities favor LRT but lag in speed compared to the north and east. The east boasts expansive BRT networks, while the north leads in electrified fleets. This study showed that BRT systems in the Mediterranean consume more energy than LRT systems, primarily due to buses covering more lines and services. Furthermore, it emphasizes the need to incorporate renewable energy sources to counter environmental impacts and maintain sustainability targets in the growing energy demands of public transportation, suggesting a potential additional demand of over 200 GWh for electrification, contingent on city size and congestion. The pollution emission estimations showed that implementing clean energy transportation systems can significantly decrease air pollution. For instance, replacing diesel buses with electric ones can reduce CO2 emissions by around 70%. This is especially important for large cities with significant fleets, as this percentage can significantly impact their overall greenhouse gas emissions. However, several factors are taken into account when making a decision. NPV calculations have shown that electric buses may not always be the best option financially (for Marseille, at a 5% discount rate, the diesel bus is the best option, as shown in Table 6). Although electric buses have lower operating and maintenance costs (about 50% less than diesel buses), their value is negatively impacted by their high purchase price (almost twice as high).
In future research, the potential impact of proposed transportation electrification plans on air quality can be assessed using satellite data for near-real-time, large-scale, and cost-effective air pollution monitoring [71]. Earth observation images offer valuable atmospheric insights for further greenhouse emission studies. Furthermore, more sophisticated Net Present Value (NPV) calculations could be employed for a comprehensive financial cost–benefit analysis, provided detailed data are available, enabling a more refined comparison of various scenarios [69]. Moreover, further studies must take into account wider financial impacts on public transportation projects, such as changes in tax revenues and after-tax part of changes due to investment effects such as spillover [72].
Author Contributions
Conceptualization, S.M.M., B.R., A.N. and M.L.; Methodology, S.M.M., B.R. and A.N.; Software, S.M.M. and B.R.; Validation, S.M.M., B.R., A.N. and M.L.; Formal analysis, S.M.M. and B.R.; Investigation, S.M.M., B.R., A.N. and M.L.; Resources, A.N. and M.L.; Data curation, B.R.; Writing—original draft, S.M.M., B.R. and A.N.; Writing—review & editing, S.M.M., B.R., A.N. and M.L.; Visualization, B.R.; Supervision, S.M.M., A.N. and M.L.; Project administration, S.M.M.; Funding acquisition, S.M.M. and M.L. All authors have read and agreed to the published version of the manuscript.
Funding
This research received funding from the European Union Next-GenerationEU (PIANO NAZIONALE DI RIPRESA E RESILIENZA (PNRR)–MISSIONE 4 COMPONENTE 2, INVESTIMENTO 1.4–D.D. 1033 17/06/2022, CN00000023).
Data Availability Statement
Data are contained within the article.
Acknowledgments
This study was carried out within the MOST Sustainable Mobility Center. This manuscript reflects only the authors’ views and opinions; neither the European Union nor the European Commission can be considered responsible for them.
Conflicts of Interest
The authors declare no conflicts of interest.
Appendix A
Table A1 presents the parameters and the value considered in NPV calculations for the different bus technologies and their respective scenarios.
Table A1.
Variables considered for the NPV computations.
Table A1.
Variables considered for the NPV computations.
| Variable | Description | Value |
|---|---|---|
| Purchase price: diesel bus (thousands of euros) | 300 | |
| Purchase price: CNG bus (thousands of euros) | 400 | |
| Purchase price: hybrid bus (thousands of euros) | 500 | |
| Purchase price: electric bus (thousands of euros) | 600 | |
| Maintenance cost: diesel bus (EUR/km) | 0.62 | |
| Maintenance cost: CNG bus (EUR/km) | 0.62 | |
| Maintenance cost: hybrid bus (EUR/km) | 0.45 | |
| Maintenance cost: electric bus (EUR/km) | 0.35 | |
| Fuel consumption: diesel bus (liter/km) | 0.64 | |
| Fuel consumption: CNG bus (kg/km) | 0.63 | |
| Fuel consumption: hybrid bus | ||
| Fuel consumption: electric bus (kWh/km) | 1.7 | |
| Fuel price: diesel (EUR/L) | 1.7 | |
| Fuel price CNG (EUR/kg) | 1.4 | |
| Fuel price: electricity (EUR/kWh) | 0.29 | |
| External damage: cost diesel (EUR/km) | 0.077 | |
| External damage: cost CNG (EUR/km) | 0.06 | |
| External damage: cost diesel (EUR/km) | 0.047 | |
| External damage: cost electric (EUR/km) | 0.022 | |
| Lifetime (year) | 12 | |
| Discount rate | {0.01, 0.03, 0.05} | |
| Bust type index | {D, CNG, H, E} | |
| coefficients | 0.5 |
References
- Giorgi, F. Climate Change Hot-Spots. Geophys. Res. Lett. 2006, 33, 101029. [Google Scholar] [CrossRef]
- Tarasi, D.; Daras, T.; Tournaki, S.; Tsoutsos, T. Transportation in the Mediterranean during the COVID-19 Pandemic Era. Glob. Transit. 2021, 3, 55–71. [Google Scholar] [CrossRef] [PubMed]
- Meyssignac, B.; Calafat, F.M.; Somot, S.; Rupolo, V.; Stocchi, P.; Llovel, W.; Cazenave, A. Two-Dimensional Reconstruction of the Mediterranean Sea Level over 1970–2006 from Tide Gage Data and Regional Ocean Circulation Model Outputs. Glob. Planet. Chang. 2011, 77, 49–61. [Google Scholar] [CrossRef]
- Baabou, W.; Grunewald, N.; Ouellet-Plamondon, C.; Gressot, M.; Galli, A. The Ecological Footprint of Mediterranean Cities: Awareness Creation and Policy Implications. Environ. Sci. Policy 2017, 69, 94–104. [Google Scholar] [CrossRef]
- Ranjgar, B.; Niccolai, A. Large-Scale Rooftop Solar Photovoltaic Power Production Potential Assessment: A Case Study for Tehran Metropolitan Area, Iran. Energies 2023, 16, 7111. [Google Scholar] [CrossRef]
- Friedlingstein, P.; O’Sullivan, M.; Jones, M.W.; Andrew, R.M.; Bakker, D.C.E.; Hauck, J.; Landschützer, P.; Le Quéré, C.; Luijkx, I.T.; Peters, G.P.; et al. Global Carbon Budget 2023. Earth Syst. Sci. Data 2023, 15, 5301–5369. [Google Scholar] [CrossRef]
- Miraftabzadeh, S.M.; Longo, M.; Foiadelli, F. Mobility and Future Trends. In Emerging Battery Technologies to Boost the Clean Energy Transition: Cost, Sustainability, and Performance Analysis; Passerini, S., Barelli, L., Baumann, M., Peters, J., Weil, M., Eds.; Springer International Publishing: Cham, Switzerland, 2024; pp. 3–11. ISBN 978-3-031-48359-2. [Google Scholar]
- Lin, Y.; Zhang, K.; Shen, Z.J.M.; Ye, B.; Miao, L. Multistage Large-Scale Charging Station Planning for Electric Buses Considering Transportation Network and Power Grid. Transp. Res. Part C Emerg. Technol. 2019, 107, 423–443. [Google Scholar] [CrossRef]
- Avishai, C. Urban mobility and public transport: Future perspectives and review. Int. J. Urban Sci. 2021, 25, 455–479. [Google Scholar]
- Adib, A.; Shadmand, M.B.; Shamsi, P.; Afridi, K.K.; Amirabadi, M.; Fateh, F.; Ferdowsi, M.; Lehman, B.; Lewis, L.H.; Mirafzal, B.; et al. E-Mobility—Advancements and Challenges. IEEE Access 2019, 7, 165226–165240. [Google Scholar] [CrossRef]
- Liu, Y.; Cruz-Morales, P.; Zargar, A.; Belcher, M.S.; Pang, B.; Englund, E.; Dan, Q.; Yin, K.; Keasling, J.D. Biofuels for a Sustainable Future. Cell 2021, 184, 1636–1647. [Google Scholar] [CrossRef]
- Saldarini, A.; Miraftabzadeh, S.M.; Brenna, M.; Longo, M. Strategic Approach for Electric Vehicle Charging Infrastructure for Efficient Mobility along Highways: A Real Case Study in Spain. Vehicles 2023, 5, 761–779. [Google Scholar] [CrossRef]
- Mwambeleko, J.J.; Kulworawanichpong, T.; Greyson, K.A. Tram and Trolleybus Net Traction Energy Consumption Comparison. In Proceedings of the 2015 18th International Conference on Electrical Machines and Systems, ICEMS 2015, Pattaya, Thailand, 25–28 October 2015; pp. 2164–2169. [Google Scholar]
- Battarra, R.; Mazzeo, G. Challenges of Mediterranean Metropolitan Systems: Smart Planning and Mobility. Transp. Res. Procedia 2022, 60, 92–99. [Google Scholar] [CrossRef]
- Electric Buses Will Take Over Half the World Fleet by 2025–Bloomberg. Available online: https://www.bloomberg.com/news/articles/2018-02-01/electric-buses-will-take-over-half-the-world-by-2025#xj4y7vzkg (accessed on 31 March 2023).
- Eliasson, J.; Proost, S. Is Sustainable Transport Policy Sustainable? Transp. Policy 2015, 37, 92–100. [Google Scholar] [CrossRef]
- Bastida-Molina, P.; Ribó-Pérez, D.; Gómez-Navarro, T.; Hurtado-Pérez, E. What Is the Problem? The Obstacles to the Electrification of Urban Mobility in Mediterranean Cities. Case Study of Valencia, Spain. Renew. Sustain. Energy Rev. 2022, 166, 112649. [Google Scholar] [CrossRef]
- Okraszewska, R.; Romanowska, A.; Wołek, M.; Oskarbski, J.; Birr, K.; Jamroz, K. Integration of a Multilevel Transport System Model into Sustainable Urban Mobility Planning. Sustainability 2018, 10, 479. [Google Scholar] [CrossRef]
- Gallo, M.; Marinelli, M. Sustainable Mobility: A Review of Possible Actions and Policies. Sustainability 2020, 12, 7499. [Google Scholar] [CrossRef]
- Miskolczi, M.; Földes, D.; Munkácsy, A.; Jászberényi, M. Urban Mobility Scenarios until the 2030s. Sustain. Cities Soc. 2021, 72, 103029. [Google Scholar] [CrossRef]
- Hodson, M.; Geels, F.W.; McMeekin, A. Reconfiguring Urban Sustainability Transitions, Analysing Multiplicity. Sustainability 2017, 9, 299. [Google Scholar] [CrossRef]
- Zawieska, J.; Pieriegud, J. Smart City as a Tool for Sustainable Mobility and Transport Decarbonisation. Transp. Policy 2018, 63, 39–50. [Google Scholar] [CrossRef]
- Pietrzak, K.; Pietrzak, O. Environmental Effects of Electromobility in a Sustainable Urban Public Transport. Sustainability 2020, 12, 1052. [Google Scholar] [CrossRef]
- Ruggieri, R.; Ruggeri, M.; Vinci, G.; Poponi, S. Electric Mobility in a Smart City: European Overview. Energies 2021, 14, 315. [Google Scholar] [CrossRef]
- Serrano-López, R.; Linares-Unamunzaga, A.; San Emeterio, C.M. Urban Sustainable Mobility and Planning Policies. A Spanish Mid-Sized City Case. Cities 2019, 95, 102356. [Google Scholar] [CrossRef]
- Bakogiannis, E.; Kyriakidis, C.; Siti, M.; Eleftheriou, V. Four Stories for Sustainable Mobility in Greece. Transp. Res. Procedia 2017, 24, 345–353. [Google Scholar] [CrossRef]
- Dehghanmongabadi, A.; Hoşkara, Ş. Challenges of Promoting Sustainable Mobility on University Campuses: The Case of Eastern Mediterranean University. Sustainability 2018, 10, 4842. [Google Scholar] [CrossRef]
- Holland, S.P.; Mansur, E.T.; Muller, N.Z.; Yates, A.J. The Environmental Benefits of Transportation Electrification: Urban Buses. Energy Policy 2021, 148, 111921. [Google Scholar] [CrossRef]
- Börjesson, M.; Bastian, A.; Eliasson, J. The Economics of Low Emission Zones. Transp. Res. Part A Policy Pract. 2021, 153, 99–114. [Google Scholar] [CrossRef]
- Asplund, D.; Eliasson, J. Does Uncertainty Make Cost-Benefit Analyses Pointless? Transp. Res. Part A Policy Pract. 2016, 92, 195–205. [Google Scholar] [CrossRef]
- Wang, S.; Lu, C.; Liu, C.; Zhou, Y.; Bi, J.; Zhao, X. Understanding the Energy Consumption of Battery Electric Buses in Urban Public Transport Systems. Sustainability 2020, 12, 10007. [Google Scholar] [CrossRef]
- Hannan, M.A.; Hoque, M.M.; Hussain, A.; Yusof, Y.; Ker, P.J. State-of-the-Art and Energy Management System of Lithium-Ion Batteries in Electric Vehicle Applications: Issues and Recommendations. IEEE Access 2018, 6, 19362–19378. [Google Scholar] [CrossRef]
- Tang, B.; Xu, Y.; Wang, M. Life Cycle Assessment of Battery Electric and Internal Combustion Engine Vehicles Considering the Impact of Electricity Generation Mix: A Case Study in China. Atmosphere 2022, 13, 252. [Google Scholar] [CrossRef]
- Amjad, M.; Farooq-i-Azam, M.; Ni, Q.; Dong, M.; Ansari, E.A. Wireless charging systems for electric vehicles. Renew. Sustain. Energy Rev. 2022, 167, 112730. [Google Scholar] [CrossRef]
- Paul, T.; Yamada, H. Operation and Charging Scheduling of Electric Buses in a City Bus Route Network. In Proceedings of the 2014 17th IEEE International Conference on Intelligent Transportation Systems, ITSC 2014, Qingdao, China, 8–11 October 2014; pp. 2780–2786. [Google Scholar]
- Ansari Esfeh, M.; Wirasinghe, S.C.; Saidi, S.; Kattan, L. Waiting Time and Headway Modelling for Urban Transit Systems—A Critical Review and Proposed Approach. Transp. Rev. 2021, 41, 141–163. [Google Scholar] [CrossRef]
- Guihaire, V.; Hao, J.K. Transit Network Re-Timetabling and Vehicle Scheduling. In Proceedings of the International Conference on Modelling, Computation and Optimization in Information Systems and Management Sciences, Metz, France, 8 September 2008. [Google Scholar]
- Ibarra-Rojas, O.J.; Giesen, R.; Rios-Solis, Y.A. An Integrated Approach for Timetabling and Vehicle Scheduling Problems to Analyze the Trade-off between Level of Service and Operating Costs of Transit Networks. Transp. Res. Part B Methodol. 2014, 70, 35–46. [Google Scholar] [CrossRef]
- Sebastiani, M.T.; Lüders, R.; Fonseca, K.V.O. Evaluating Electric Bus Operation for a Real-World BRT Public Transportation Using Simulation Optimization. IEEE Trans. Intell. Transp. Syst. 2016, 17, 2777–2786. [Google Scholar] [CrossRef]
- Xu, X.; Yu, Y.; Long, J. Integrated Electric Bus Timetabling and Scheduling Problem. Transp. Res. Part C Emerg. Technol. 2023, 149, 104057. [Google Scholar] [CrossRef]
- Gkiotsalitis, K.; Alesiani, F. Robust Timetable Optimization for Bus Lines Subject to Resource and Regulatory Constraints. Transp. Res. E Logist. Transp. Rev. 2019, 128, 30–51. [Google Scholar] [CrossRef]
- Daganzo, C.F.; Pilachowski, J. Reducing Bunching with Bus-to-Bus Cooperation. Transp. Res. Part B Methodol. 2011, 45, 267–277. [Google Scholar] [CrossRef]
- Estrada, M.; Mensión, J.; Aymamí, J.M.; Torres, L. Bus Control Strategies in Corridors with Signalized Intersections. Transp. Res. Part C Emerg. Technol. 2016, 71, 500–520. [Google Scholar] [CrossRef]
- Cortés, C.E.; Gibson, J.; Gschwender, A.; Munizaga, M.; Zúñiga, M. Commercial Bus Speed Diagnosis Based on GPS-Monitored Data. Transp. Res. Part C Emerg. Technol. 2011, 19, 695–707. [Google Scholar] [CrossRef]
- Paola, C.; Longo, G.; Santorini, F. Modelling Transport Corridors. In Proceedings of the 3rd International SIIV Congress “People, Land, Environment and Transport Infrastructure-Reliability and Development”, Bari, Italy, 22–24 September 2005. [Google Scholar]
- Thilakaratne, R.S.; Wirasinghe, S.C.; Hubbell, J. Analysis of Flows and Speeds of Urban Transit Systems for Consideration of Modal Transition in a Corridor. WIT Trans. Built Environ. 2011, 116, 251–262. [Google Scholar]
- Martins, F.; Moura, P.; de Almeida, A.T. The Role of Electrification in the Decarbonization of the Energy Sector in Portugal. Energies 2022, 15, 1759. [Google Scholar] [CrossRef]
- Demircan Çakar, N.; Gedikli, A.; Erdoğan, S.; Yıldırım, D.Ç. A Comparative Analysis of the Relationship between Innovation and Transport Sector Carbon Emissions in Developed and Developing Mediterranean Countries. Environ. Sci. Pollut. Res. 2021, 28, 45693–45713. [Google Scholar] [CrossRef] [PubMed]
- Lemaitre-Curr, E.; Tode, L. State of the Environment and Development in the Mediterranean (SoED) 2020; United Nations: New York, NY, USA, 2021; ISBN 9789280737967. Available online: https://planbleu.org/wp-content/uploads/2021/04/SoED_full-report.pdf (accessed on 15 December 2023).
- RTM|Régie Des Transports Métropolitains. Available online: https://www.rtm.fr/ (accessed on 16 April 2023).
- TMB Barcelona Bus and Metro|Transports Metropolitans de Barcelona. Available online: https://www.tmb.cat/en/home (accessed on 16 April 2023).
- Tabti-Talamali, A.; Baouni, T. Public Transportation in Algiers: Towards a New Governance Approach. Case Stud. Transp. Policy 2018, 6, 706–715. [Google Scholar] [CrossRef]
- Luthra, A.S.H.W. Para transit system in medium sized cities: Problem or panacea. ITPI J. 2006, 3, 55–61. [Google Scholar]
- Górka, A.; Czerepicki, A.; Krukowicz, T. The Impact of Priority in Coordinated Traffic Lights on Tram Energy Consumption. Energies 2024, 17, 520. [Google Scholar] [CrossRef]
- Kulesz, B.; Sikora, A. Comparison of Different Tram Cars in Poland Basing on Drive Type, Rated Power and Energy Consumption. In MATEC Web of Conferences; EDP Sciences: Warsaw, Poland, 2018; Volume 180, p. 02006. [Google Scholar]
- Kuminek, T. Energy Consumption in Tram Transport. Logist. Transp. 2013, 18, 93–100. [Google Scholar]
- Duarte, G.O.; Gonçalves, G.A.; Farias, T.L. Analysis of Fuel Consumption and Pollutant Emissions of Regulated and Alternative Driving Cycles Based on Real-World Measurements. Transp. Res. D Transp. Environ. 2016, 44, 43–54. [Google Scholar] [CrossRef]
- Gallet, M.; Massier, T.; Hamacher, T. Estimation of the Energy Demand of Electric Buses Based on Real-World Data for Large-Scale Public Transport Networks. Appl. Energy 2018, 230, 344–356. [Google Scholar] [CrossRef]
- Mao, F.; Li, Z.; Zhang, K. Carbon Dioxide Emissions Estimation of Conventional Diesel Buses Electrification: A Well-to-Well Analysis in Shenzhen, China. J. Clean. Prod. 2020, 277, 123048. [Google Scholar] [CrossRef]
- Zhang, S.; Wu, Y.; Liu, H.; Huang, R.; Yang, L.; Li, Z.; Fu, L.; Hao, J. Real-World Fuel Consumption and CO2 Emissions of Urban Public Buses in Beijing. Appl. Energy 2014, 113, 1645–1655. [Google Scholar] [CrossRef]
- Grijalva, E.R.; López Martínez, J.M. Analysis of the Reduction of CO2 Emissions in Urban Environments by Replacing Conventional City Buses by Electric Bus Fleets: Spain Case Study. Energies 2019, 12, 525. [Google Scholar] [CrossRef]
- Miraftabzadeh, S.M.; Saldarini, A.; Cattaneo, L.; El Ajami, S.; Longo, M.; Foiadelli, F. Comparative Analysis of Decarbonization of Local Public Transportation: A Real Case Study. Heliyon 2024, 10, e25778. [Google Scholar] [CrossRef]
- The Costs to Health and the Environment from Industrial Air Pollution in Europe–2024 Update—European Environment Agency. Available online: https://www.eea.europa.eu/publications/the-cost-to-health-and-the (accessed on 8 February 2024).
- Mahmoud, M.; Garnett, R.; Ferguson, M.; Kanaroglou, P. Electric Buses: A Review of Alternative Powertrains. Renew. Sustain. Energy Rev. 2016, 62, 673–684. [Google Scholar] [CrossRef]
- Eleftheriadis, P.; Giazitzis, S.; Leva, S.; Ogliari, E. Data-Driven Methods for the State of Charge Estimation of Lithium-Ion Batteries: An Overview. Forecasting 2023, 5, 576–599. [Google Scholar] [CrossRef]
- Niccolai, A.; Ranjgar, B.; Trimarchi, S. A GIS-Based Approach for Optimal Electric Vehicles Charging Stations Deployment. In Proceedings of the 2023 IEEE International Conference on Environment and Electrical Engineering and 2023 IEEE Industrial and Commercial Power Systems Europe, EEEIC/I and CPS Europe, Madrid, Spain, 6–9 June 2023. [Google Scholar] [CrossRef]
- Saldarini, A.; Longo, M.; Zaninelli, D.; Consolo, V.; Crisostomi, E.; Ceraolo, M.; Dudkina, E.; Miraftabzadeh, S.M. Literature Review on Electric Grid Resilience: Electric Vehicles as a Possible Support? In Proceedings of the 2023 AEIT International Conference on Electrical and Electronic Technologies for Automotive (AEIT AUTOMOTIVE), Modena, Italy, 17–19 July 2023; pp. 1–6. [Google Scholar]
- Eliasson, J.; Börjesson, M.; Odeck, J.; Welde, M. Does Benefit–Cost Efficiency Influence Transport Investment Decisions? J. Transp. Econ. Policy (JTEP) 2015, 49, 377–396. [Google Scholar]
- Börjesson, M.; Eliasson, J.; Rubensson, I. Distributional Effects of Public Transport Subsidies. J. Transp. Geogr. 2020, 84, 102674. [Google Scholar] [CrossRef]
- Miraftabzadeh, S.M.; Longo, M. High-Resolution PV Power Prediction Model Based on the Deep Learning and Attention Mechanism. Sustain. Energy Grids Netw. 2023, 34, 101025. [Google Scholar] [CrossRef]
- Shami, S.; Ranjgar, B.; Bian, J.; Khoshlahjeh Azar, M.; Moghimi, A.; Amani, M.; Naboureh, A. Trends of CO and NO2 Pollutants in Iran during COVID-19 Pandemic Using Timeseries Sentinel-5 Images in Google Earth Engine. Pollutants 2022, 2, 156–171. [Google Scholar] [CrossRef]
- Eliasson, J.; Fosgerau, M. Cost-Benefit Analysis of Transport Improvements in the Presence of Spillovers, Matching and an Income Tax. Econ. Transp. 2019, 18, 1–9. [Google Scholar] [CrossRef]
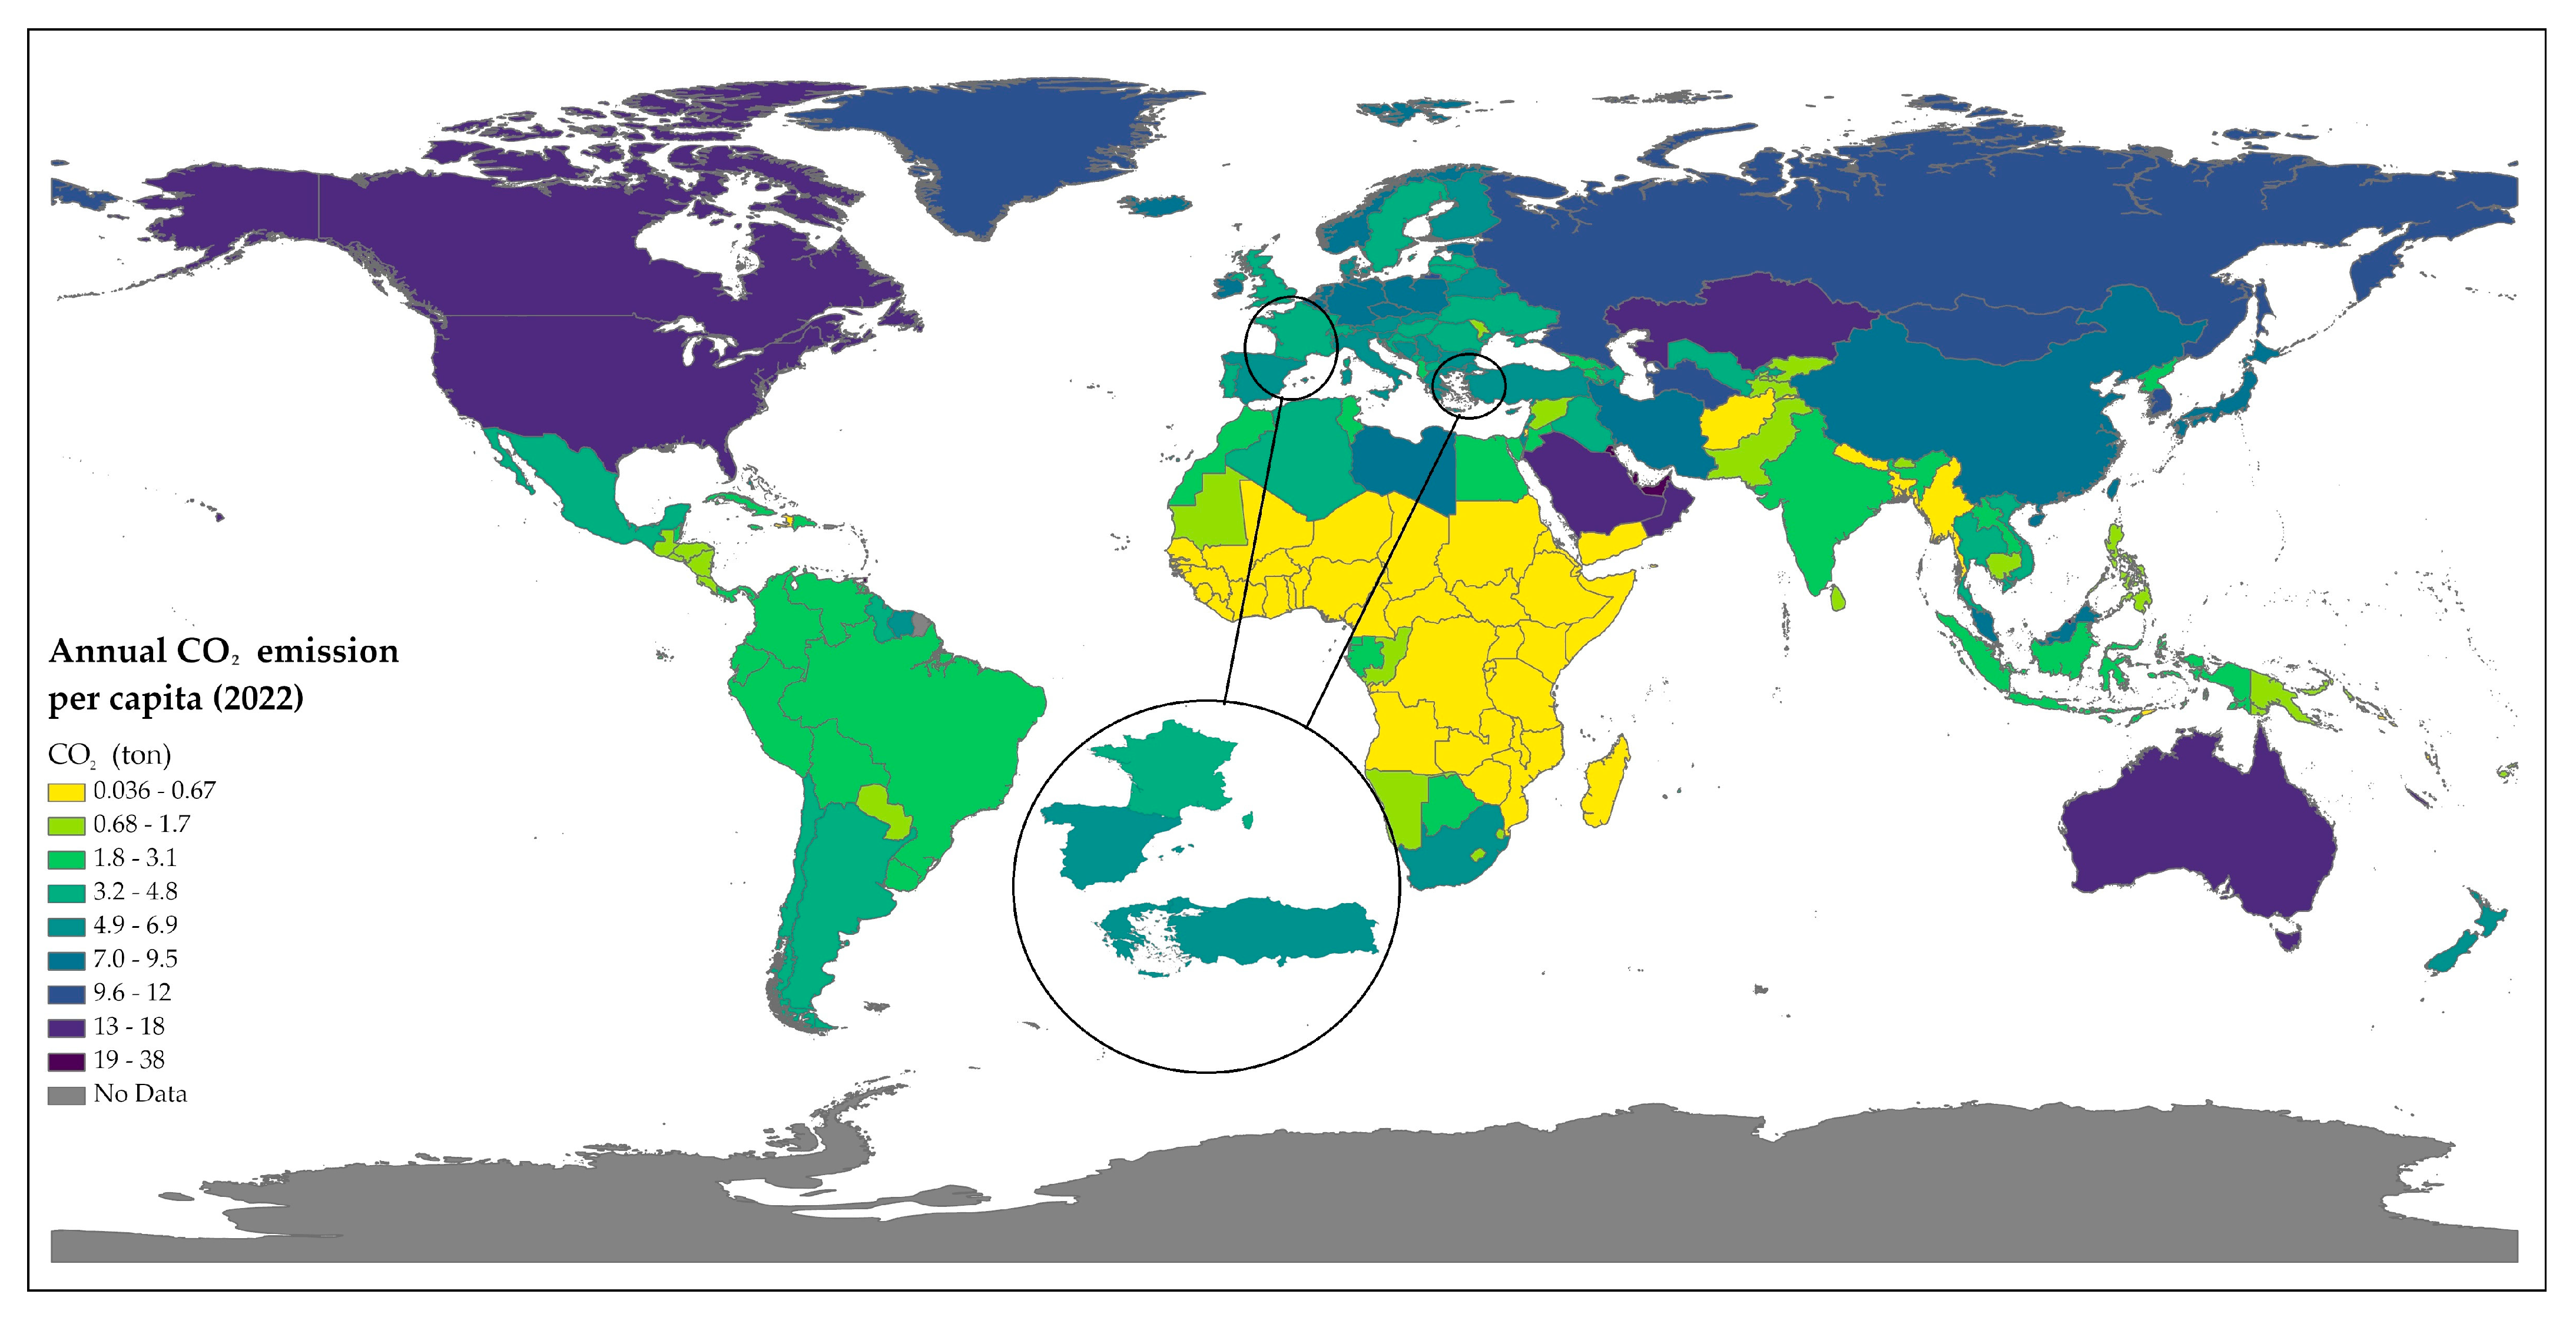
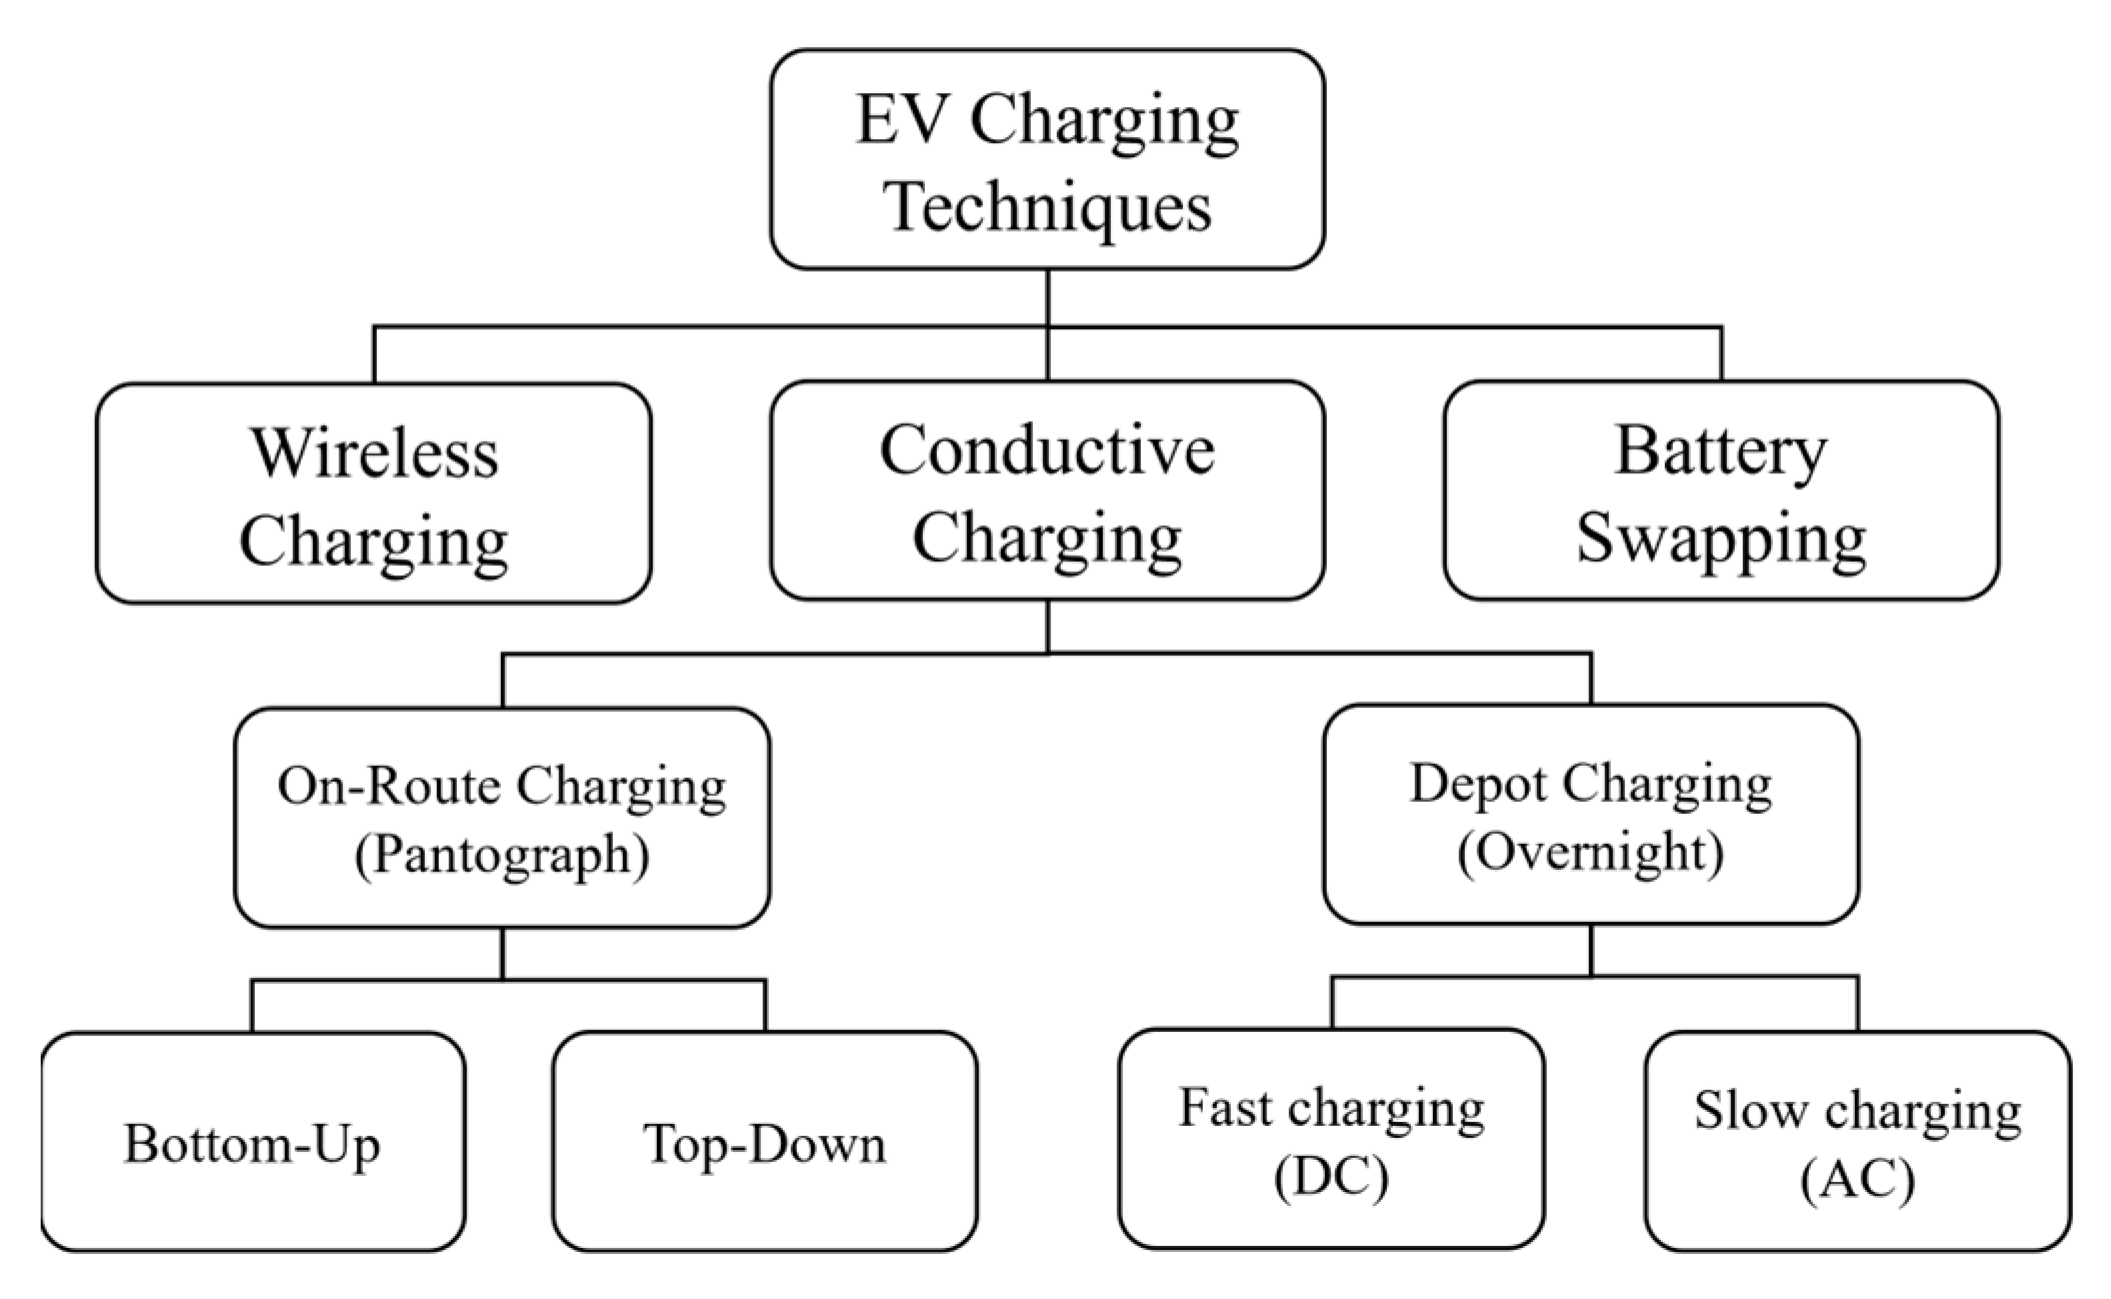
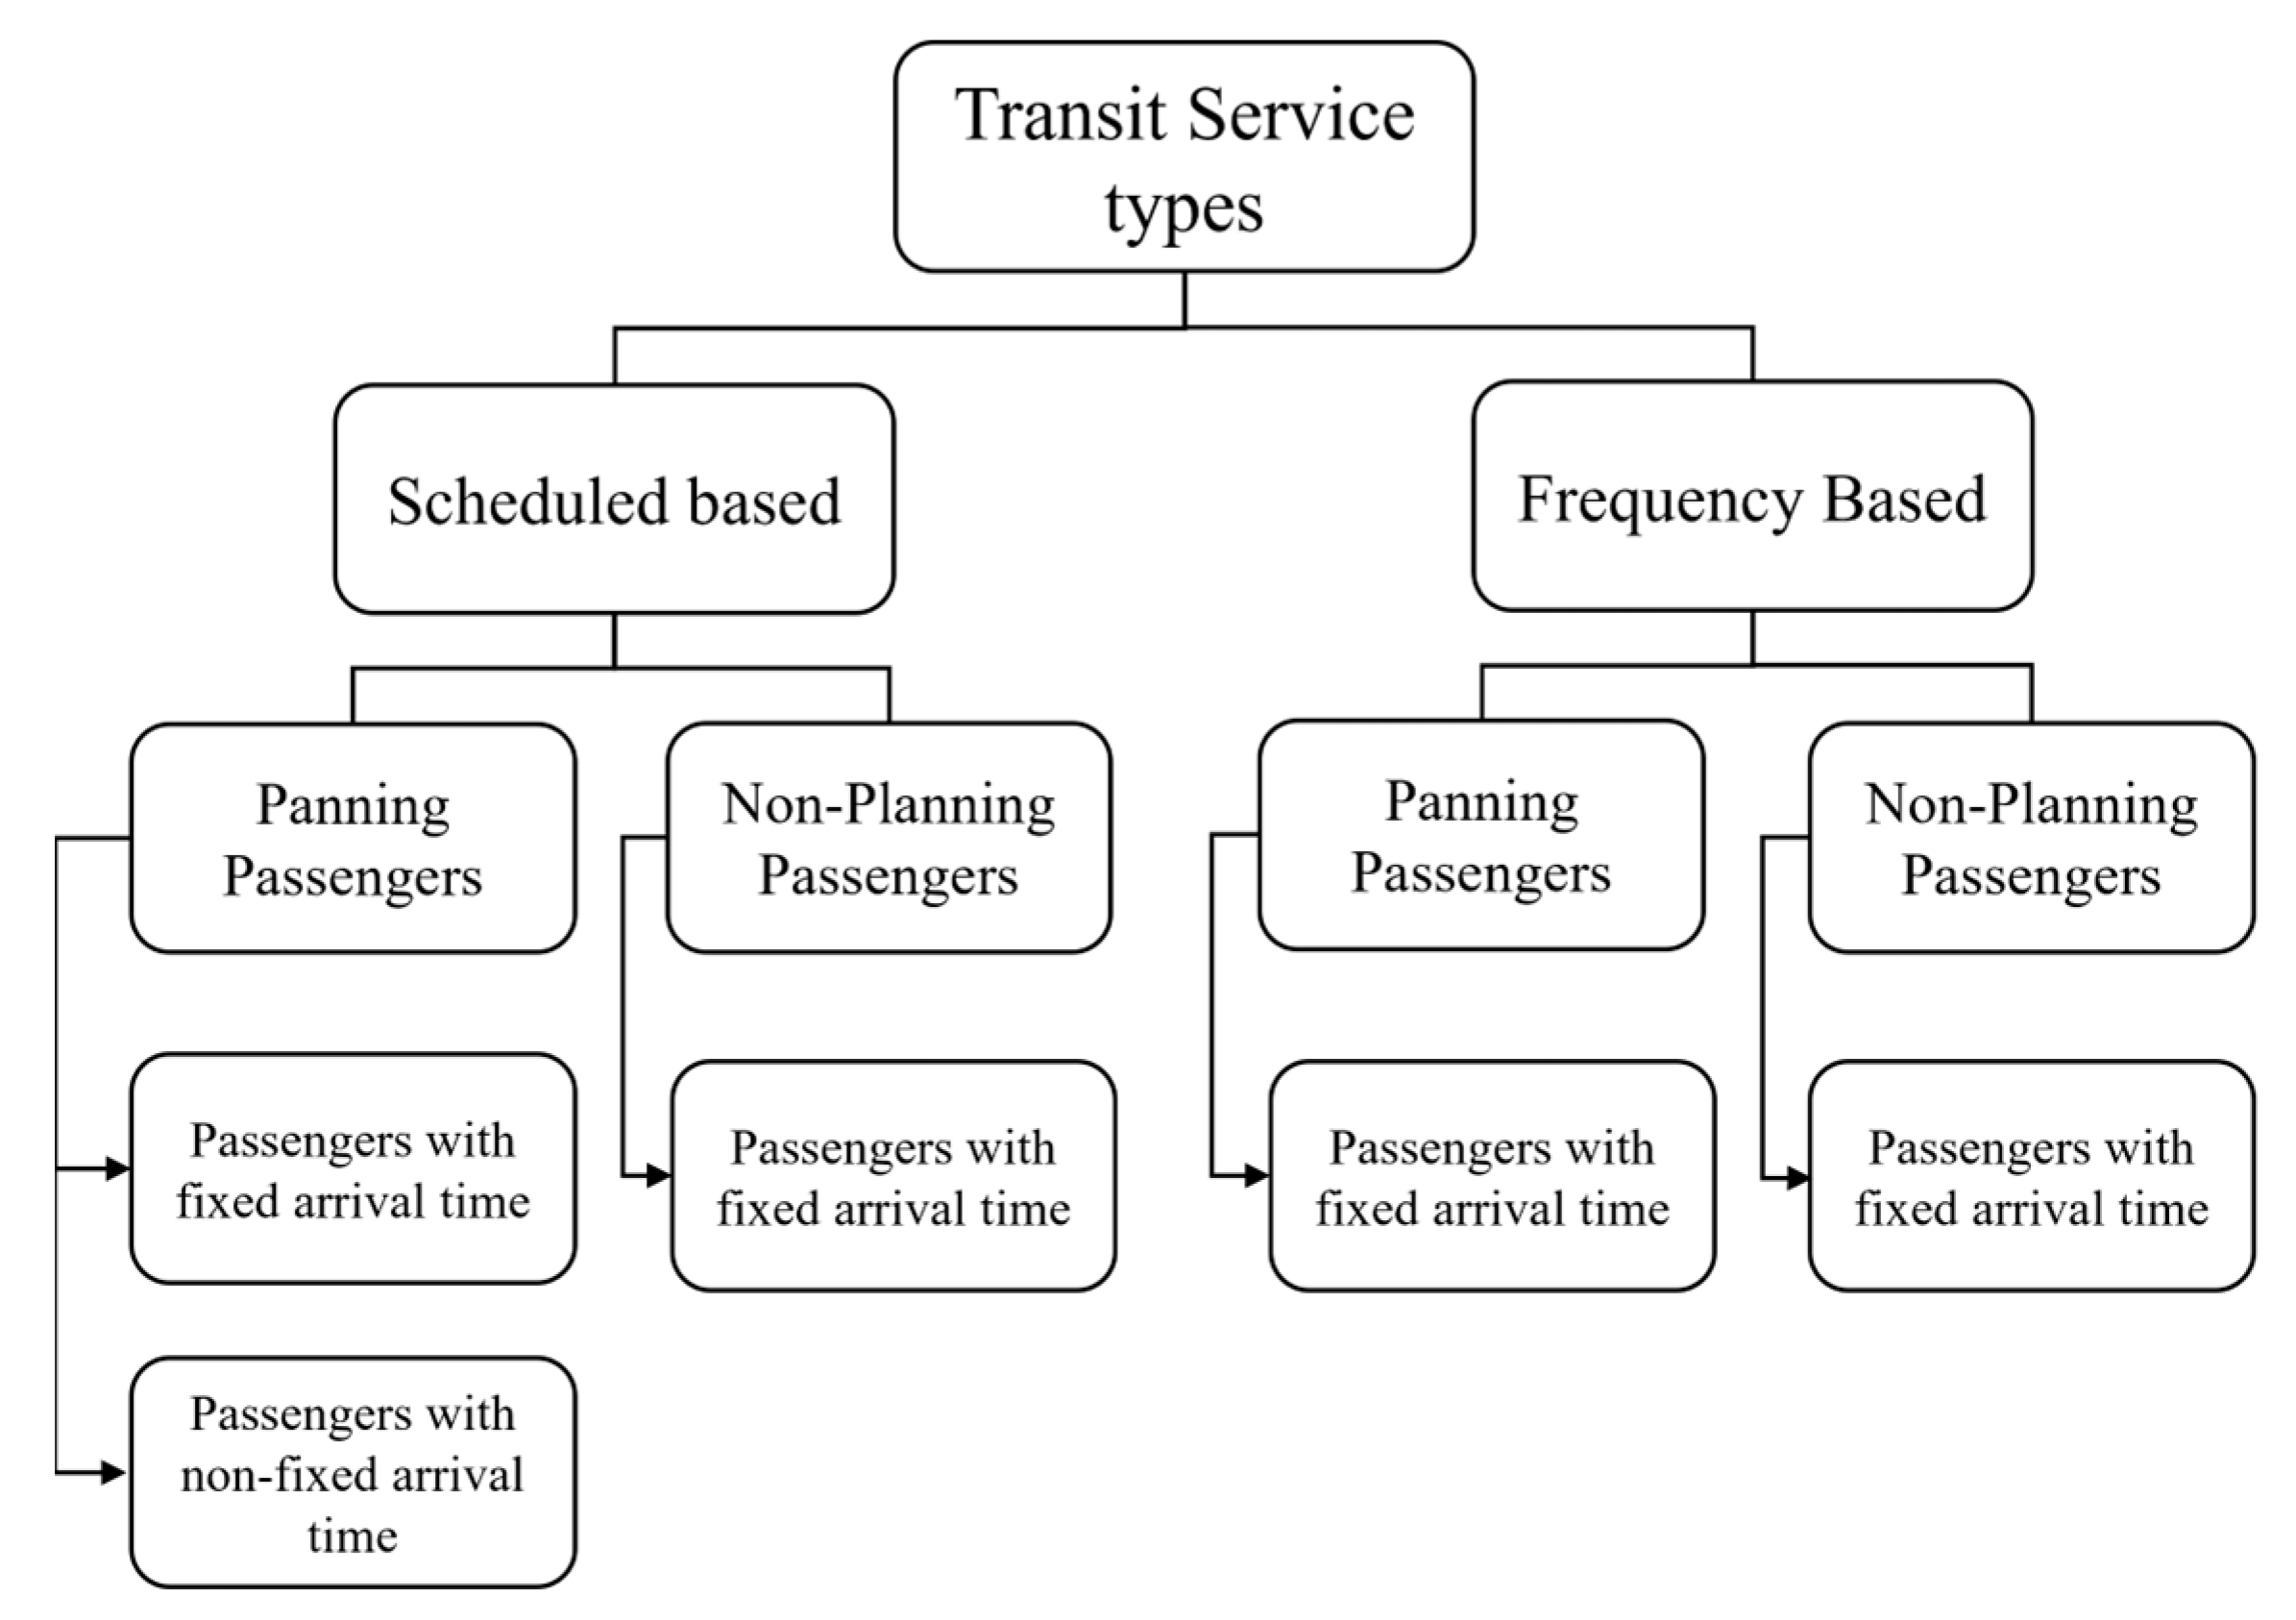

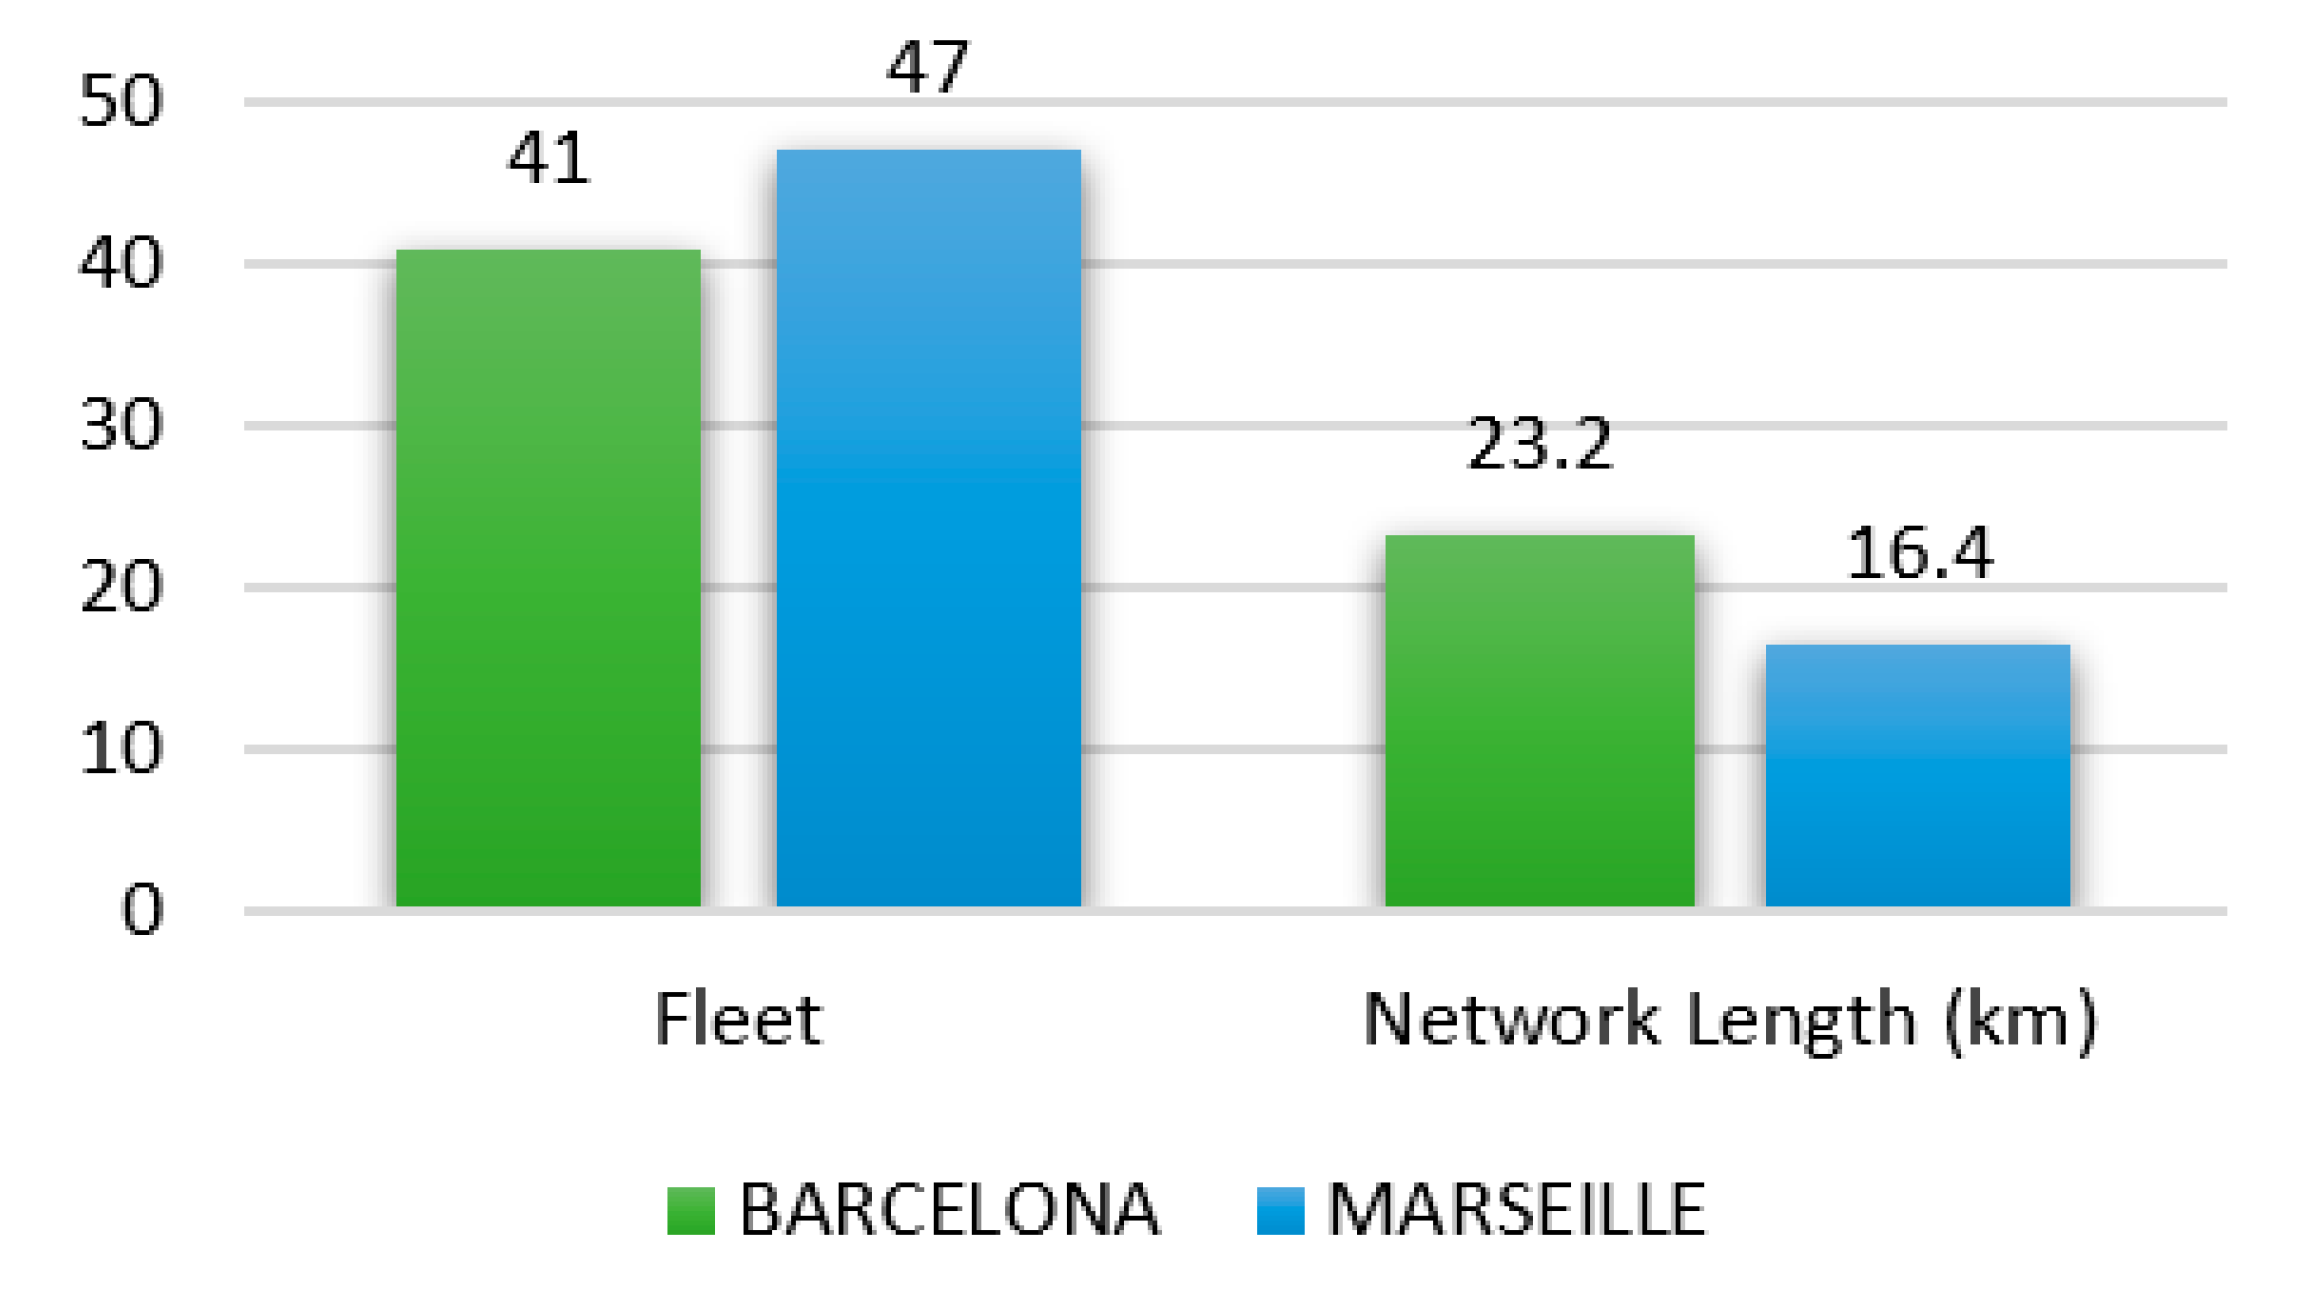

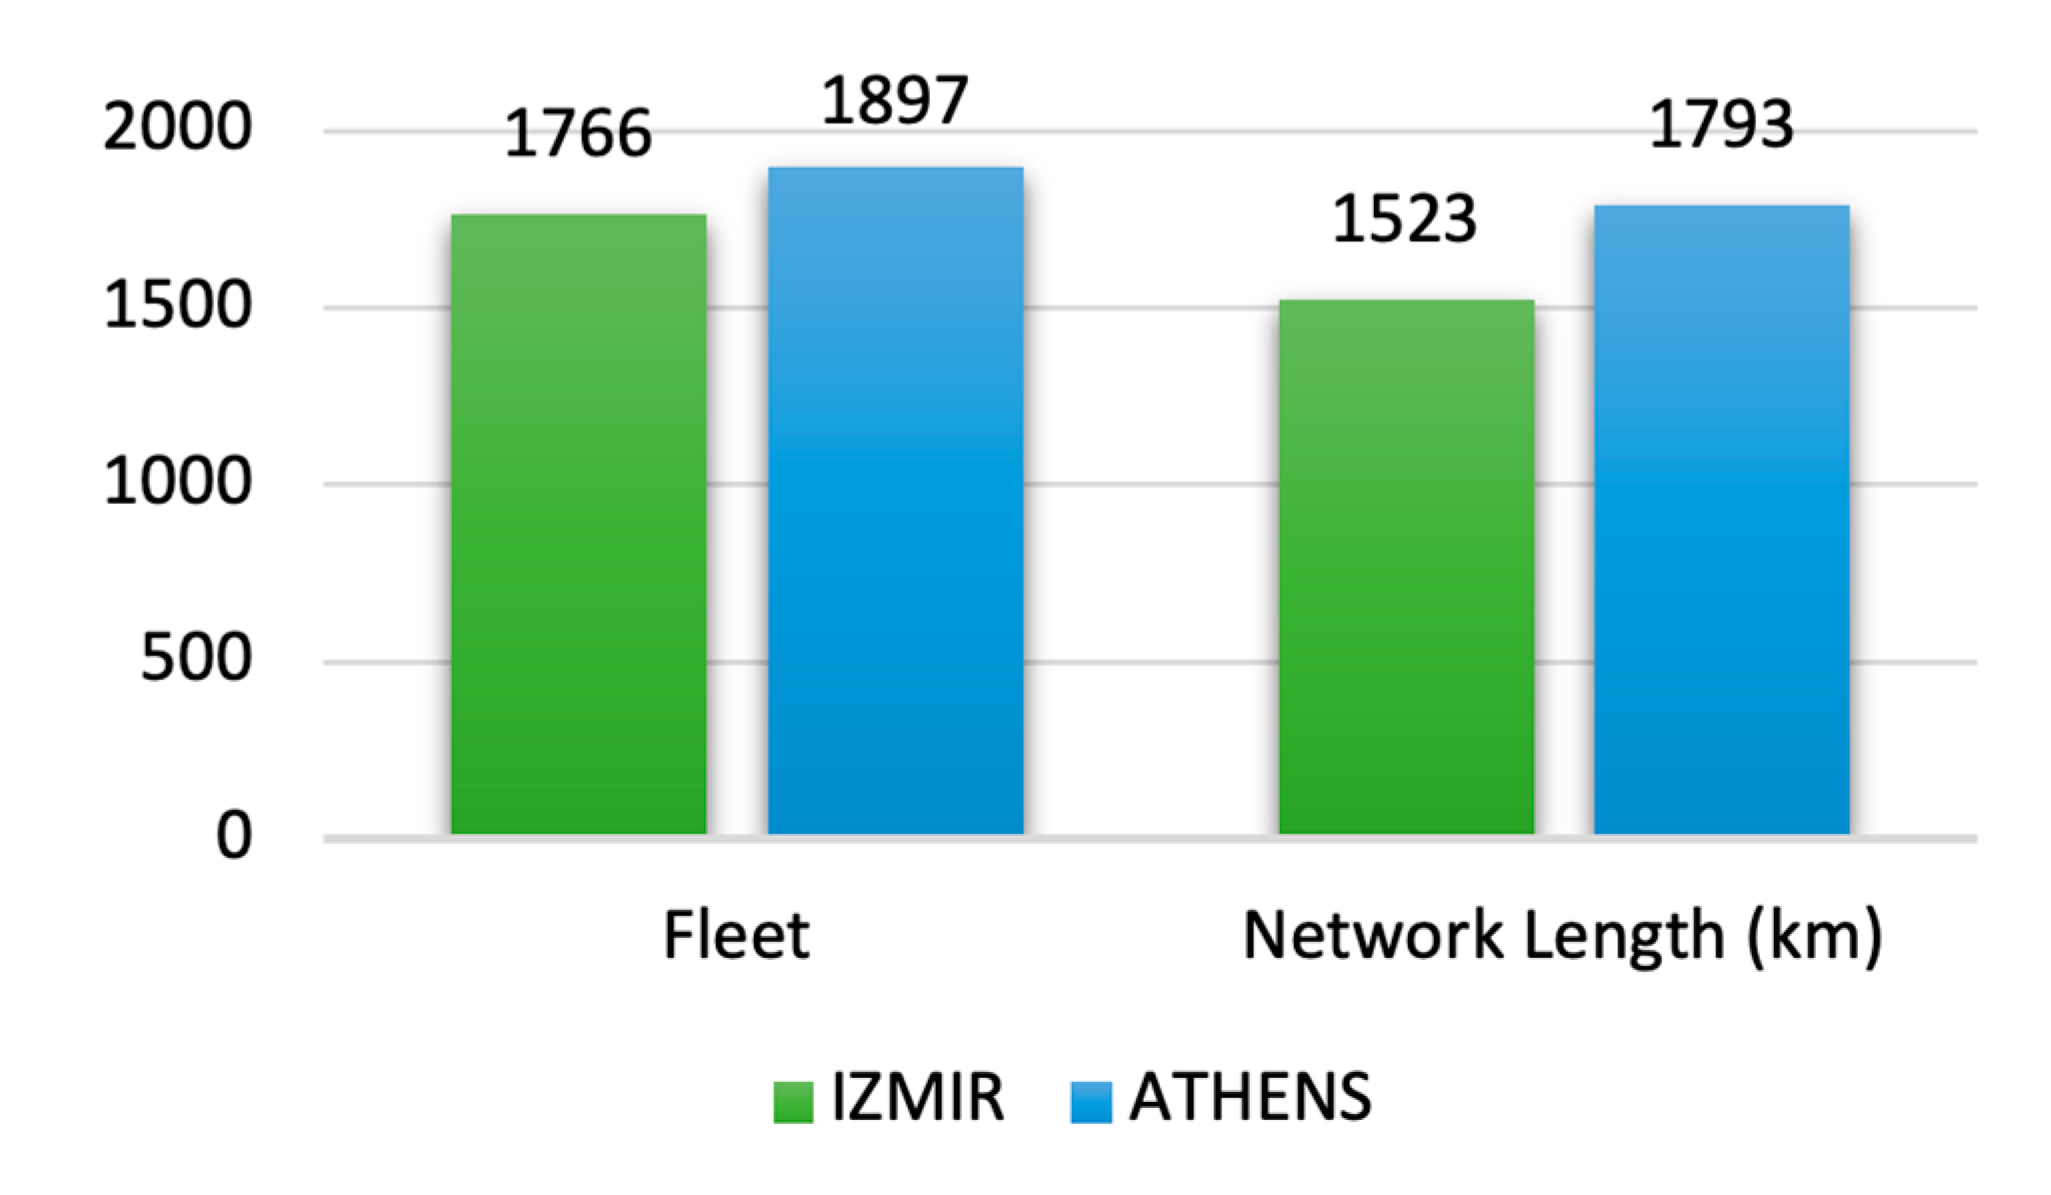
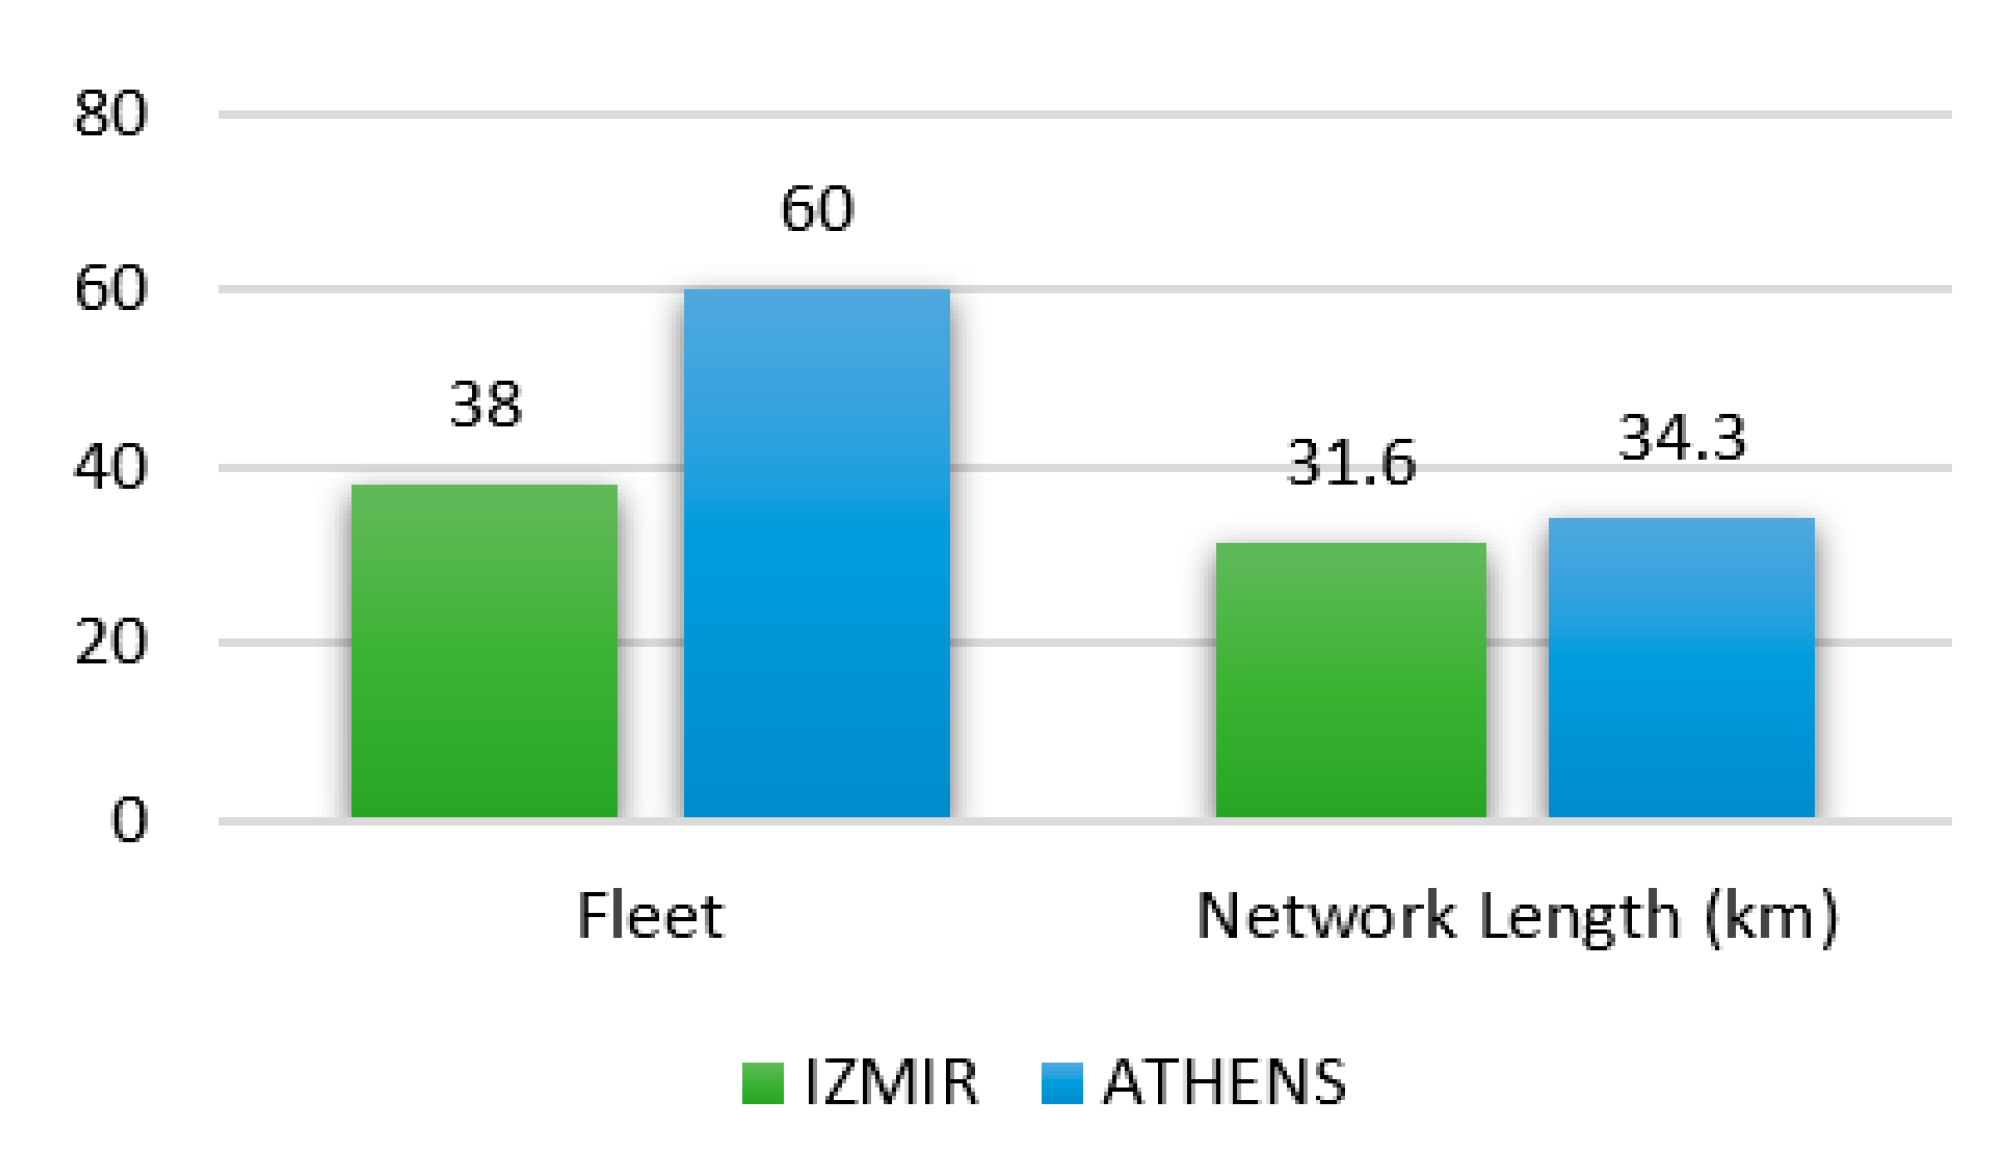

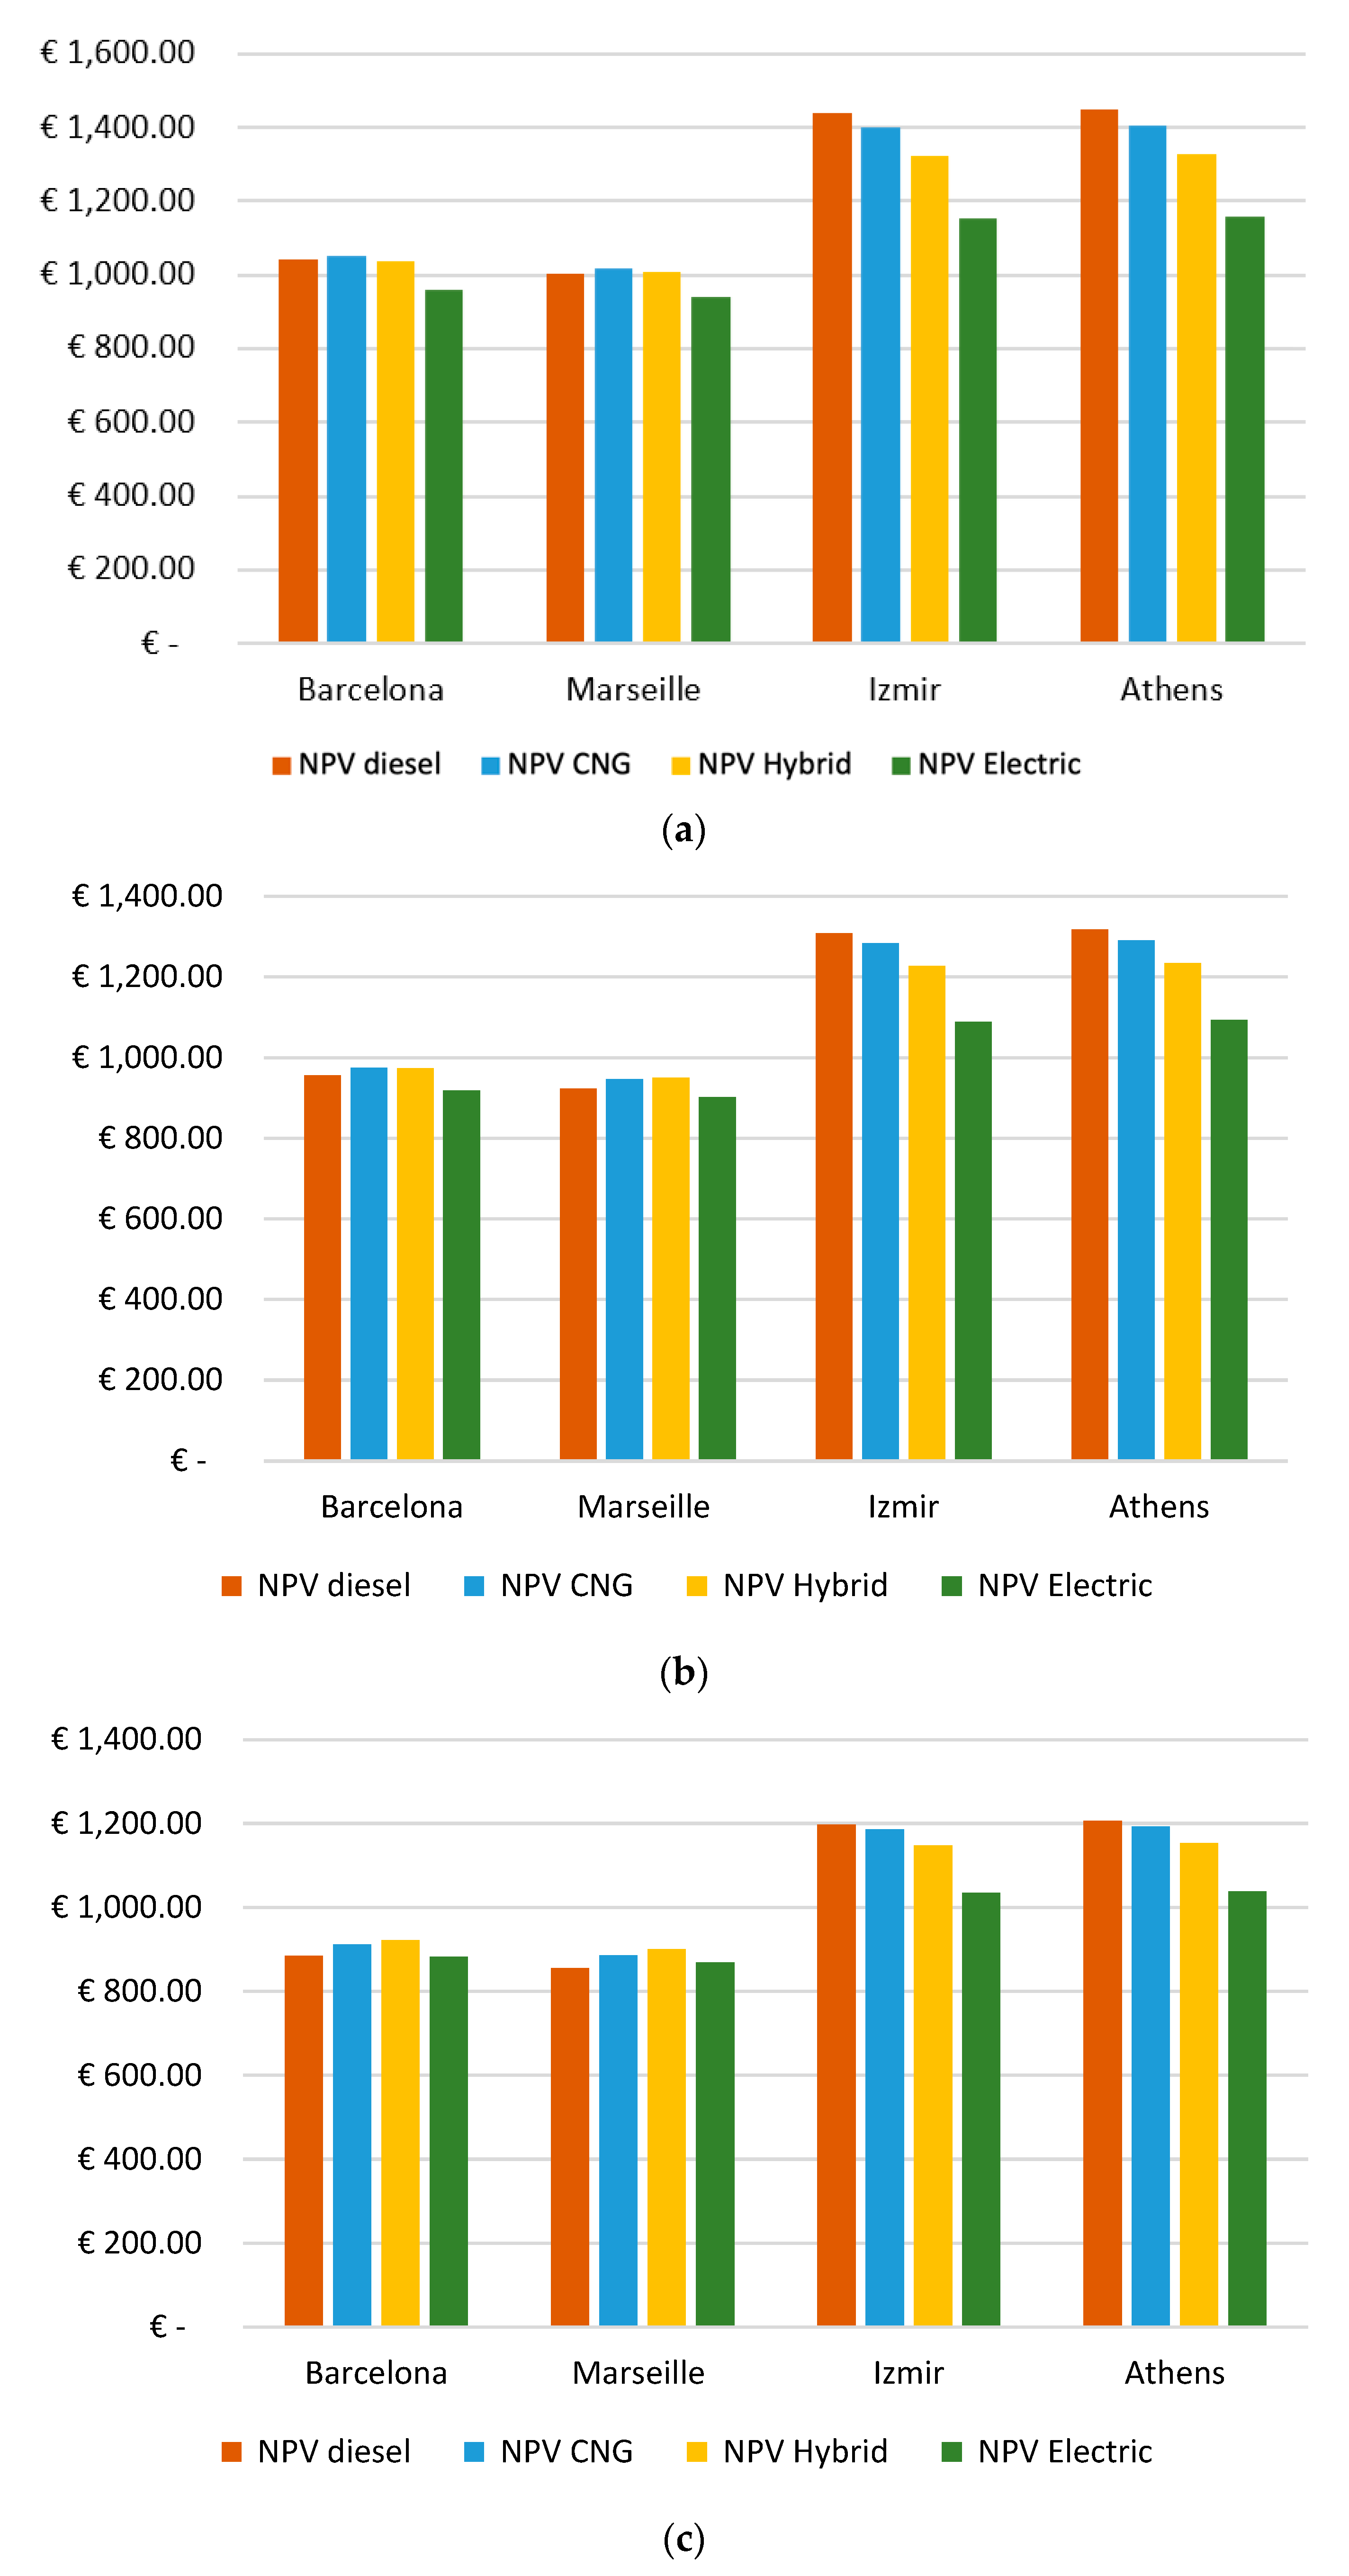
Disclaimer/Publisher’s Note: The statements, opinions and data contained in all publications are solely those of the individual author(s) and contributor(s) and not of MDPI and/or the editor(s). MDPI and/or the editor(s) disclaim responsibility for any injury to people or property resulting from any ideas, methods, instructions or products referred to in the content. |
© 2024 by the authors. Licensee MDPI, Basel, Switzerland. This article is an open access article distributed under the terms and conditions of the Creative Commons Attribution (CC BY) license (https://creativecommons.org/licenses/by/4.0/).