

Optimal Sustainable Manufacturing for Product Family Architecture in Intelligent Manufacturing: A Hierarchical Joint Optimization Approach


Abstract
1. Introduction
2. Literature Review
2.1. Product Family Architecture
2.2. Sustainable Manufacturing Processes
2.3. Bilevel Programming
3. Consideration Sustainable Product Family Design
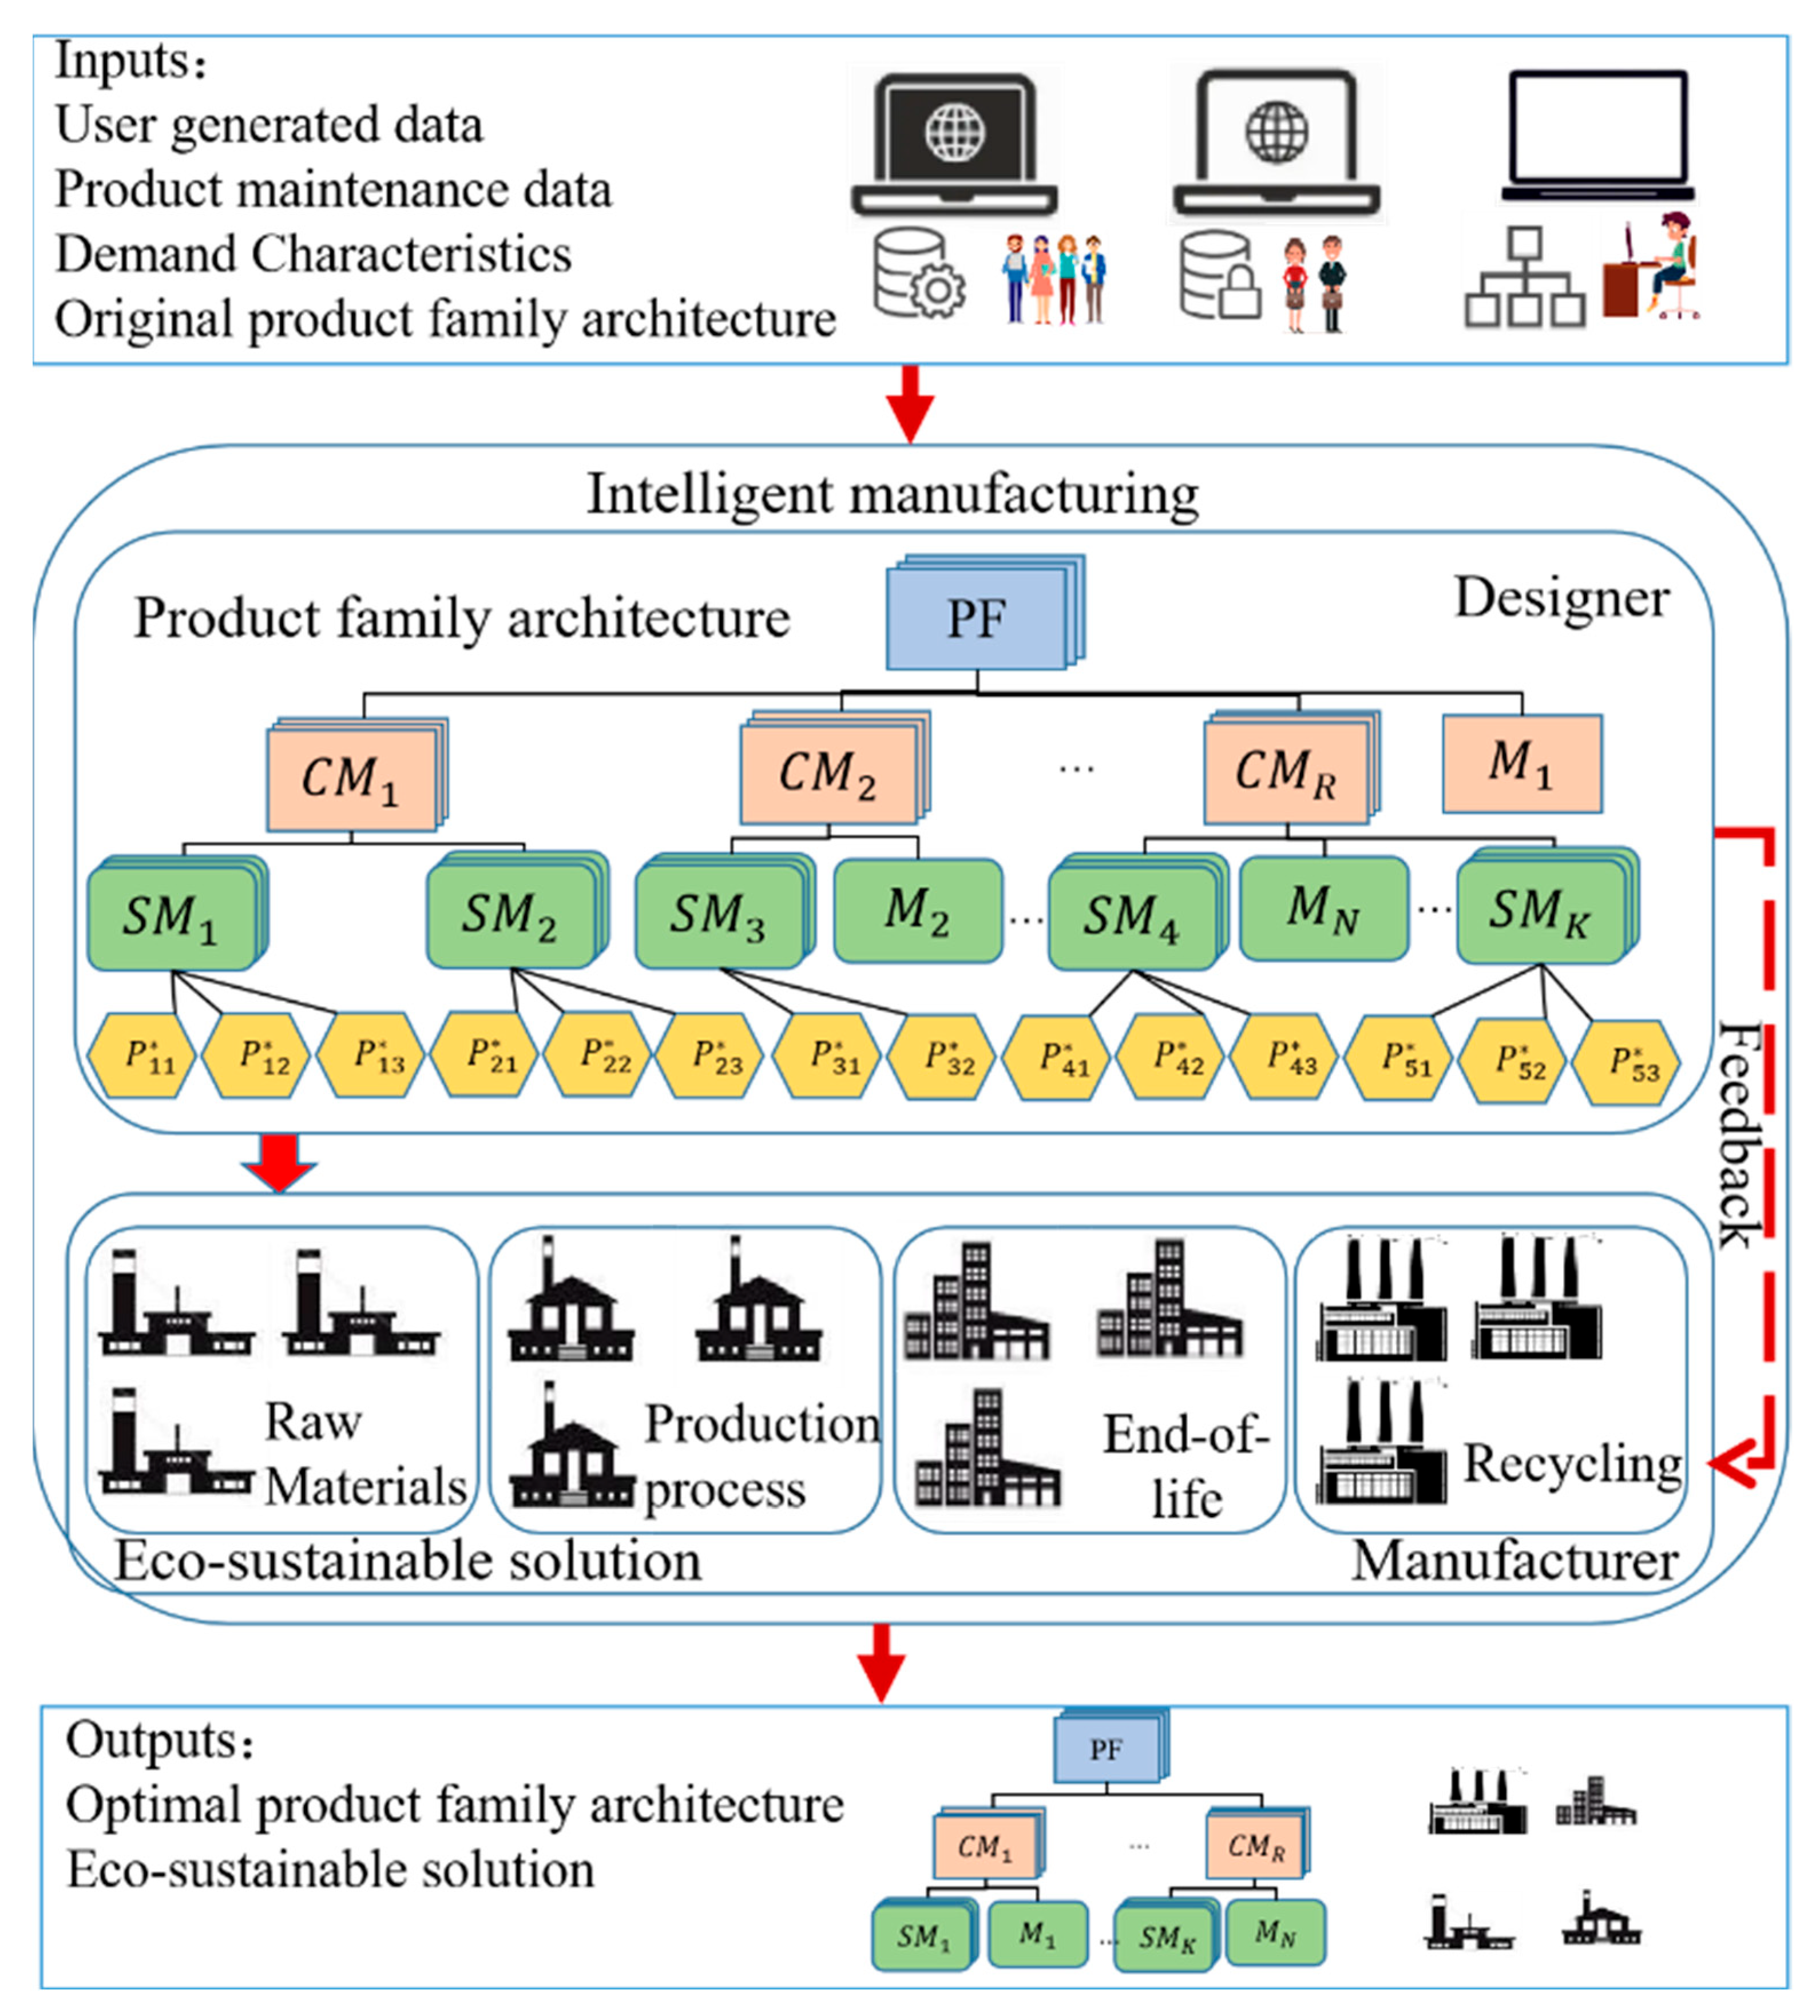
3.1. Research Methodology
3.2. Problem Description
3.3. Hierachical Interactive Decisions for Dynamic Evalution
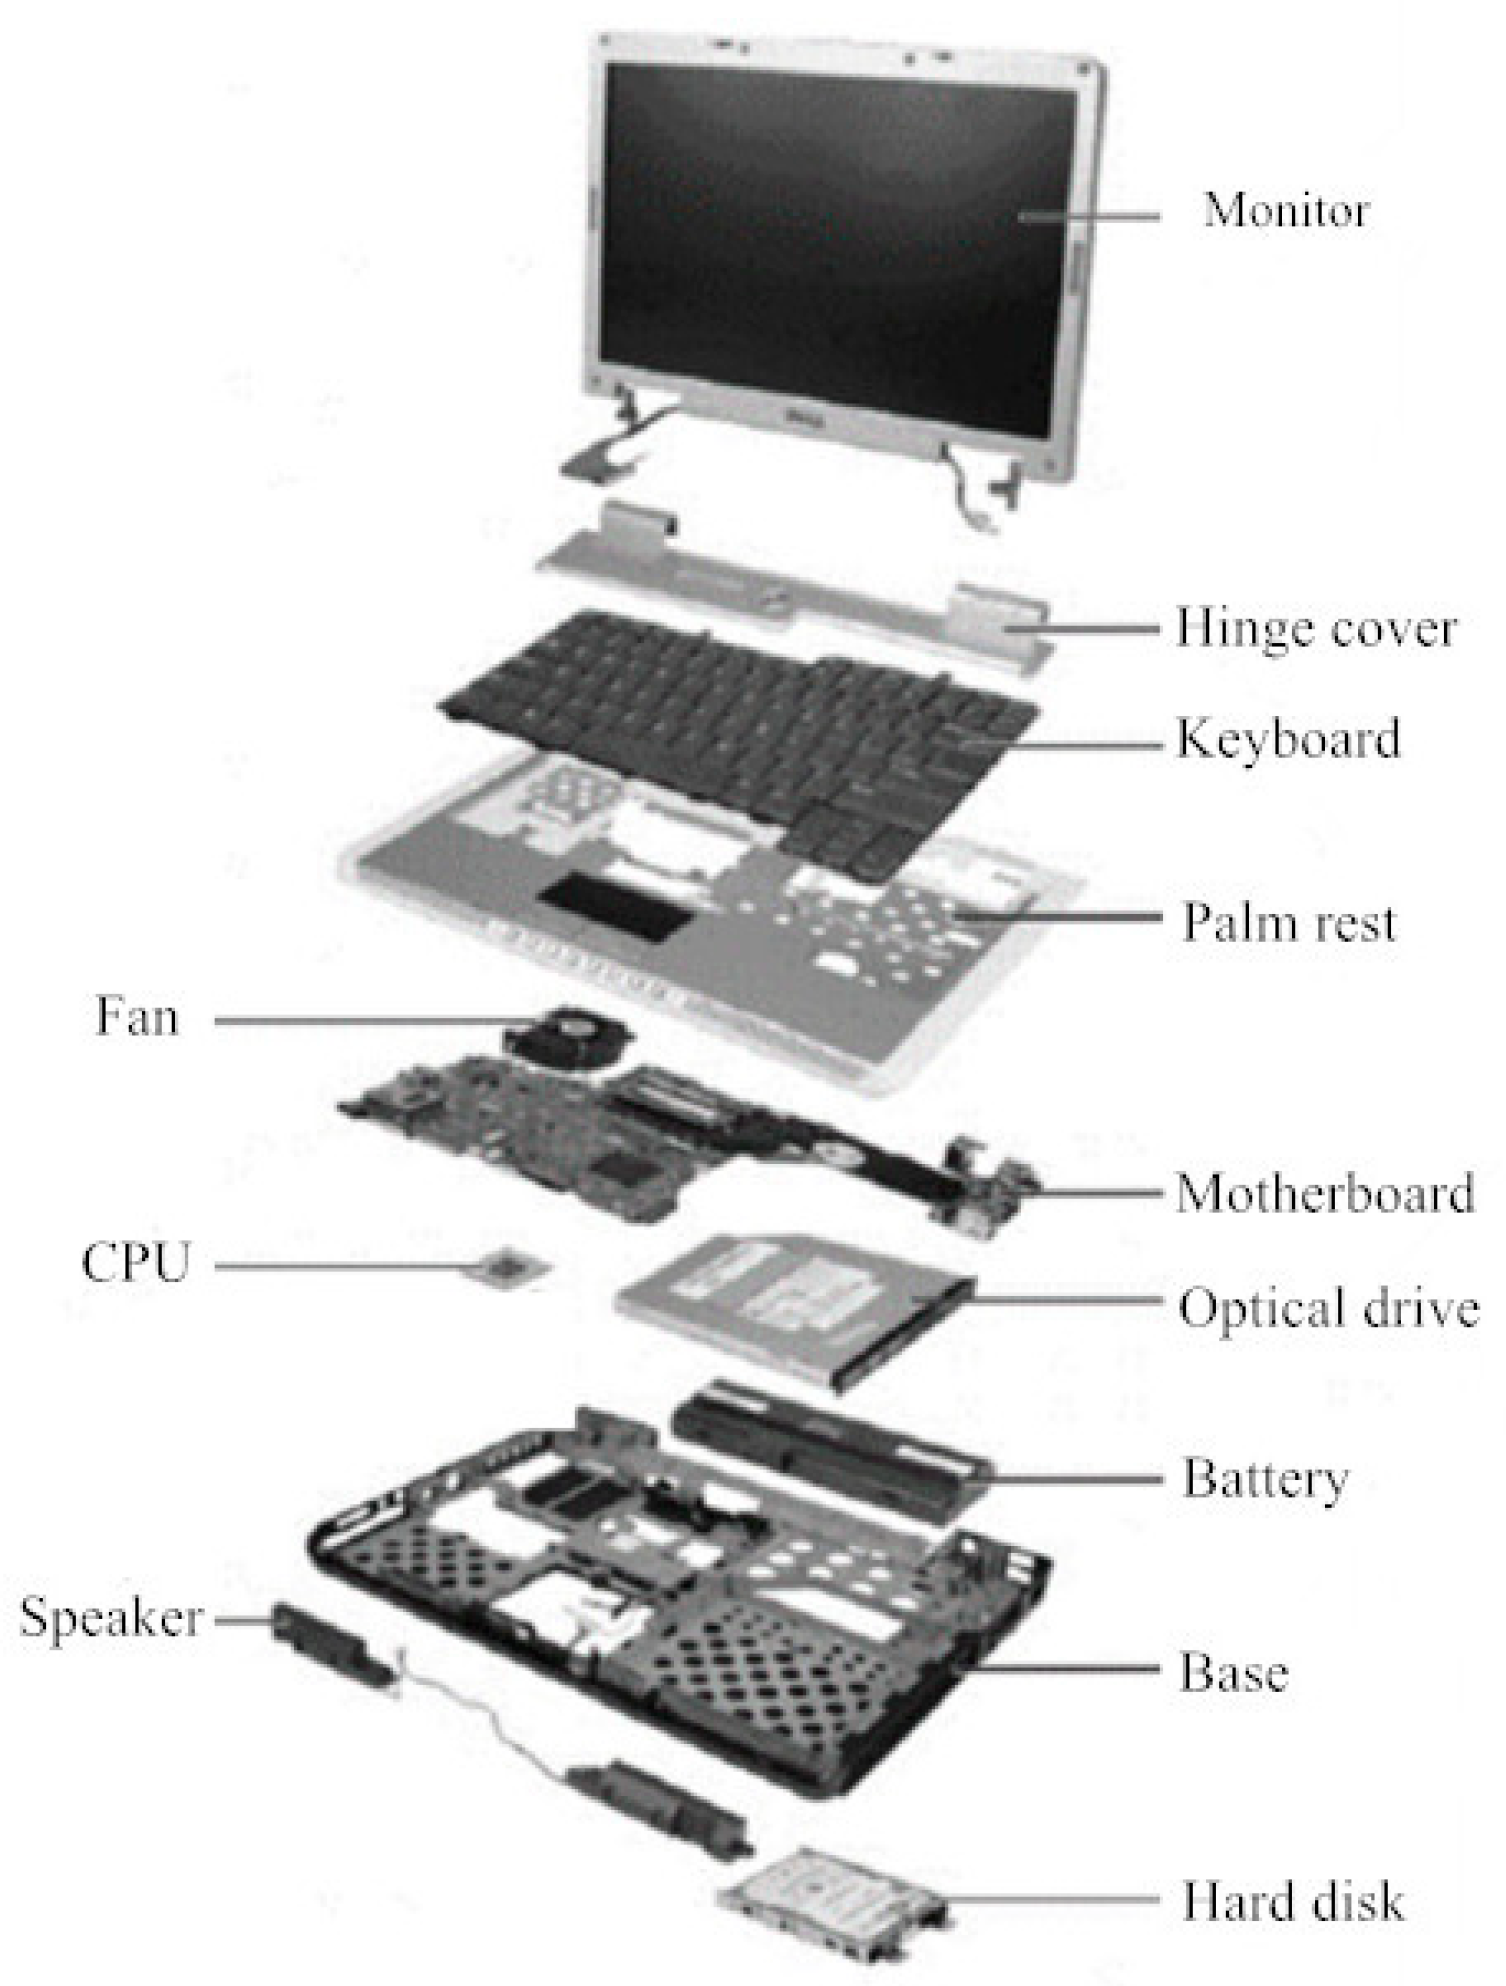
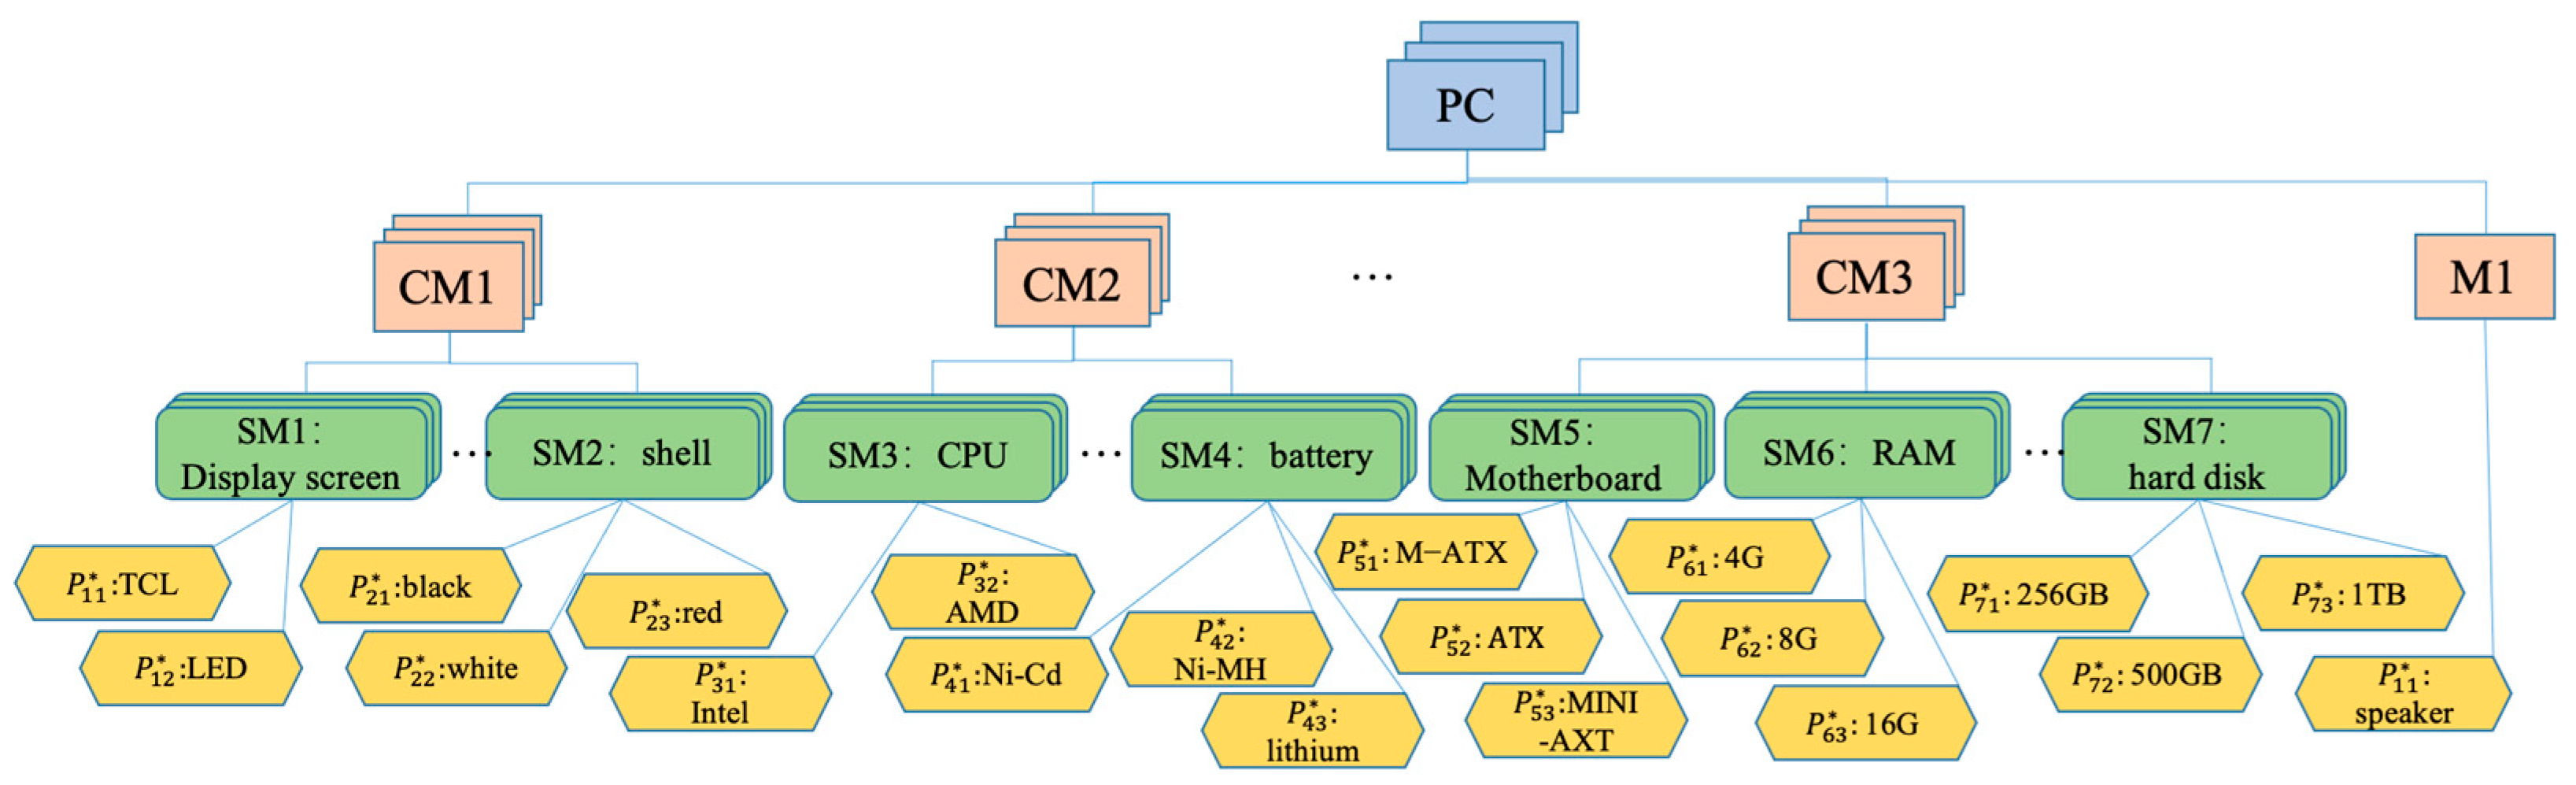
3.4. Illustrative Example
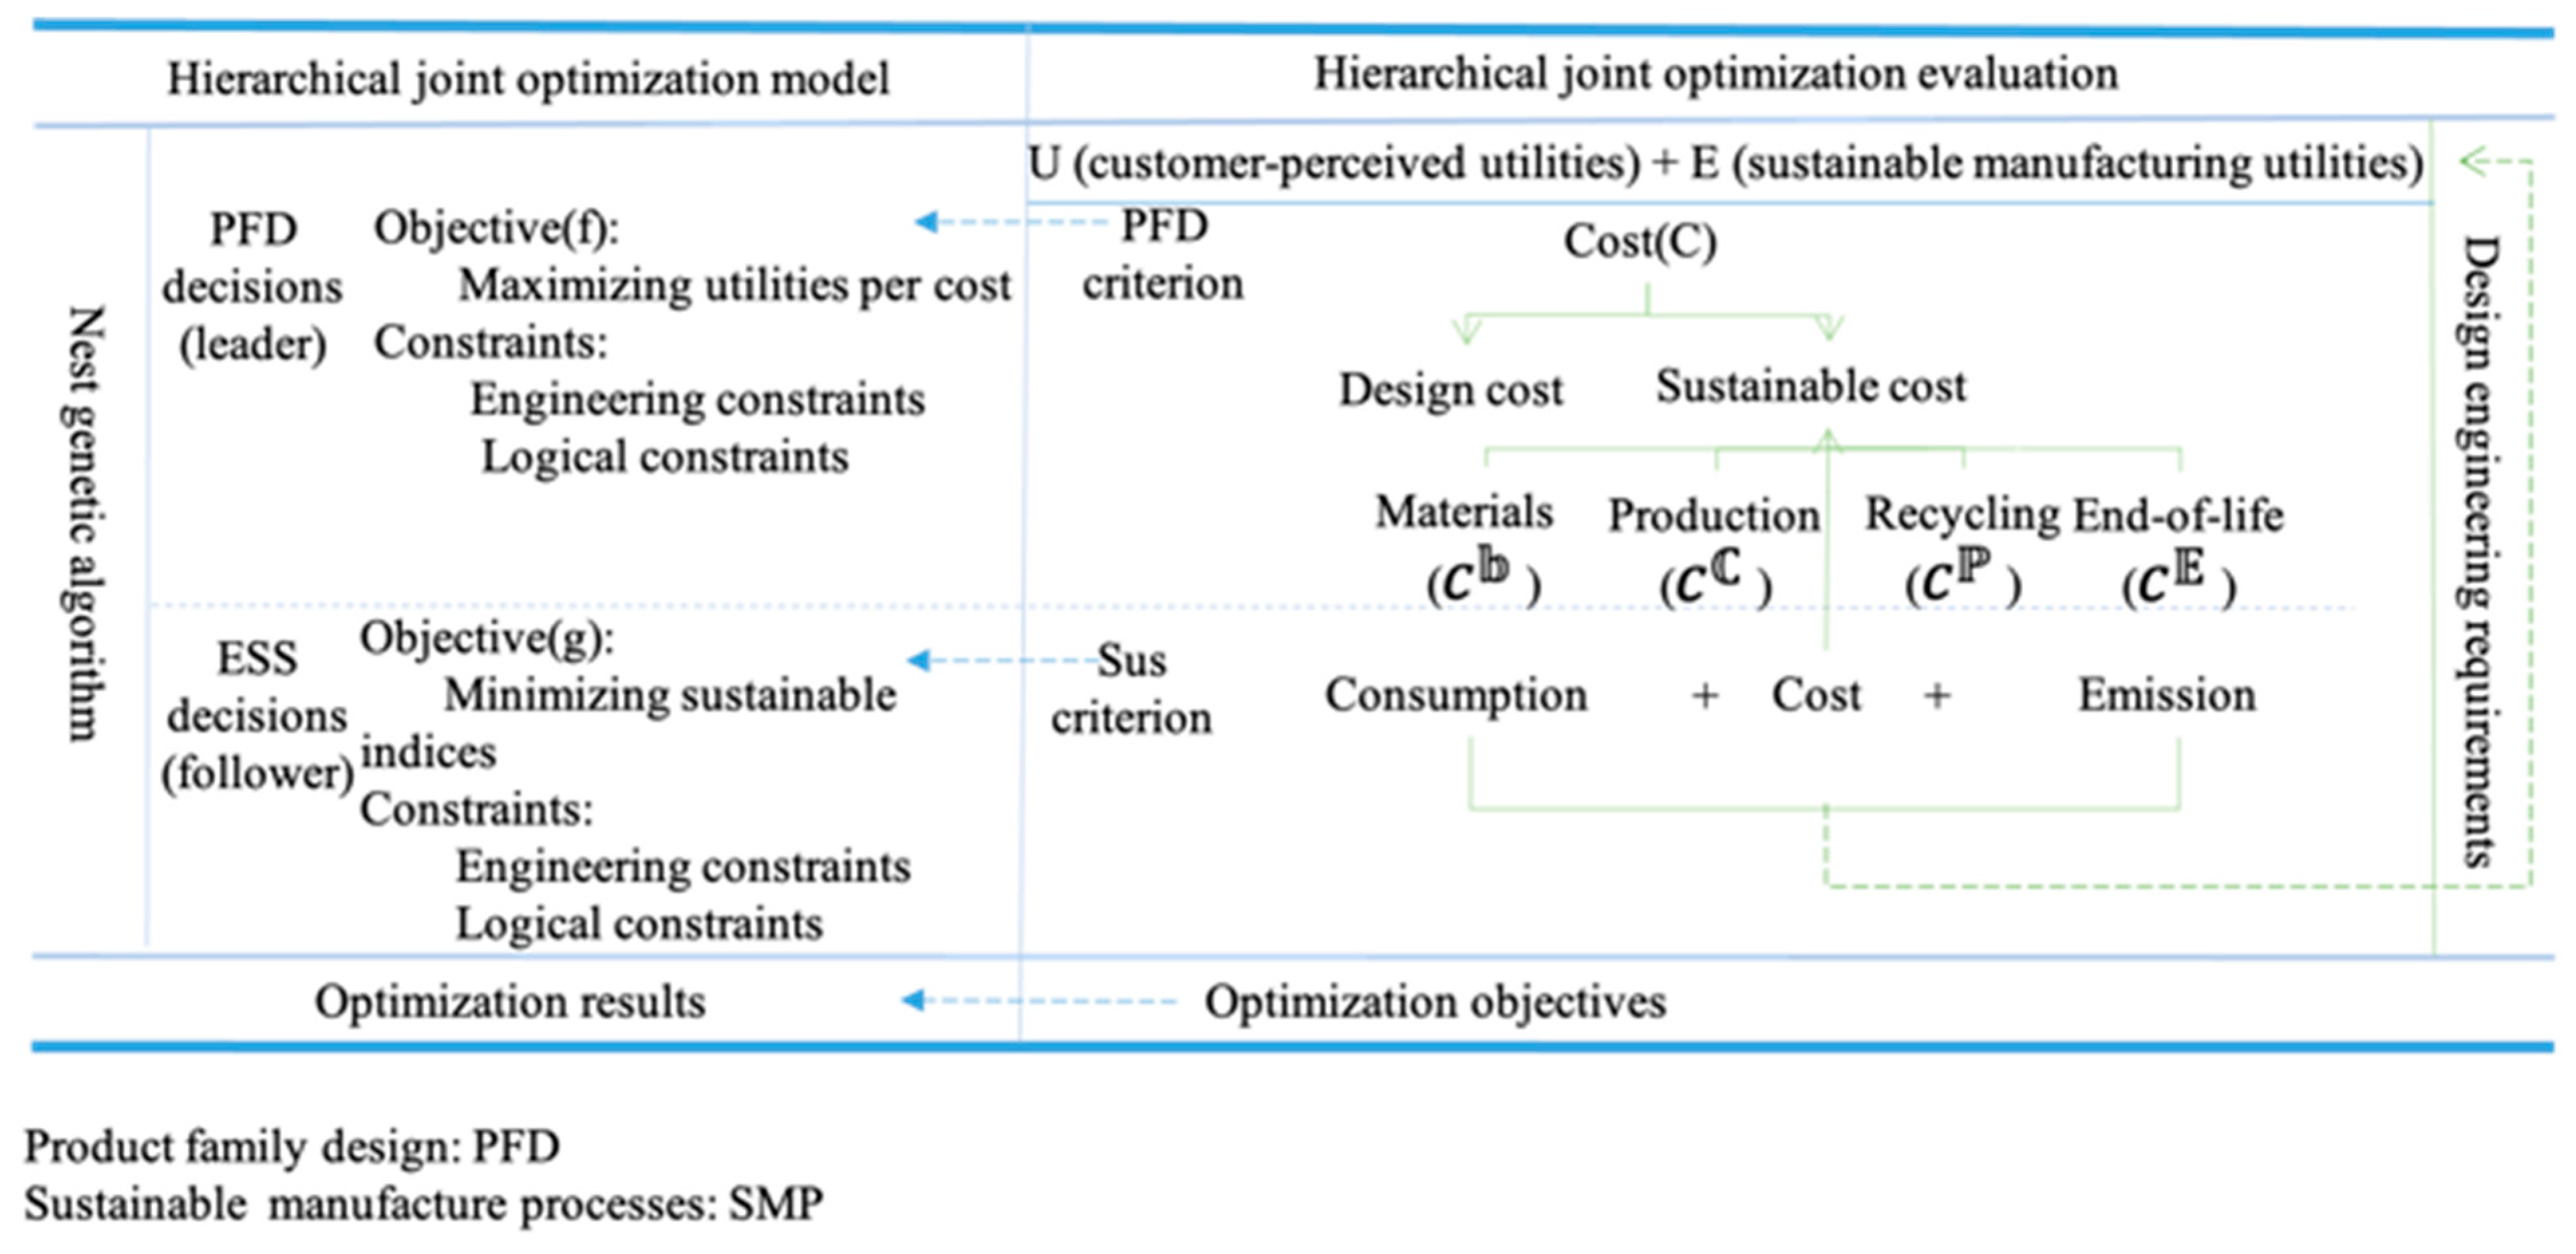
4. Hierarchical Joint Optimization
4.1. Parameters
4.2. Decision Variables
4.3. Upper-Level Optimization
4.4. Lower-Level Optimization
- (1)
- Product family cost is divided by direct and indirect cost;
- (2)
- The SMPs of the product family only consider the economic, environmental and consumer demands.
4.5. HJO Decision Making of PFA and SMPs
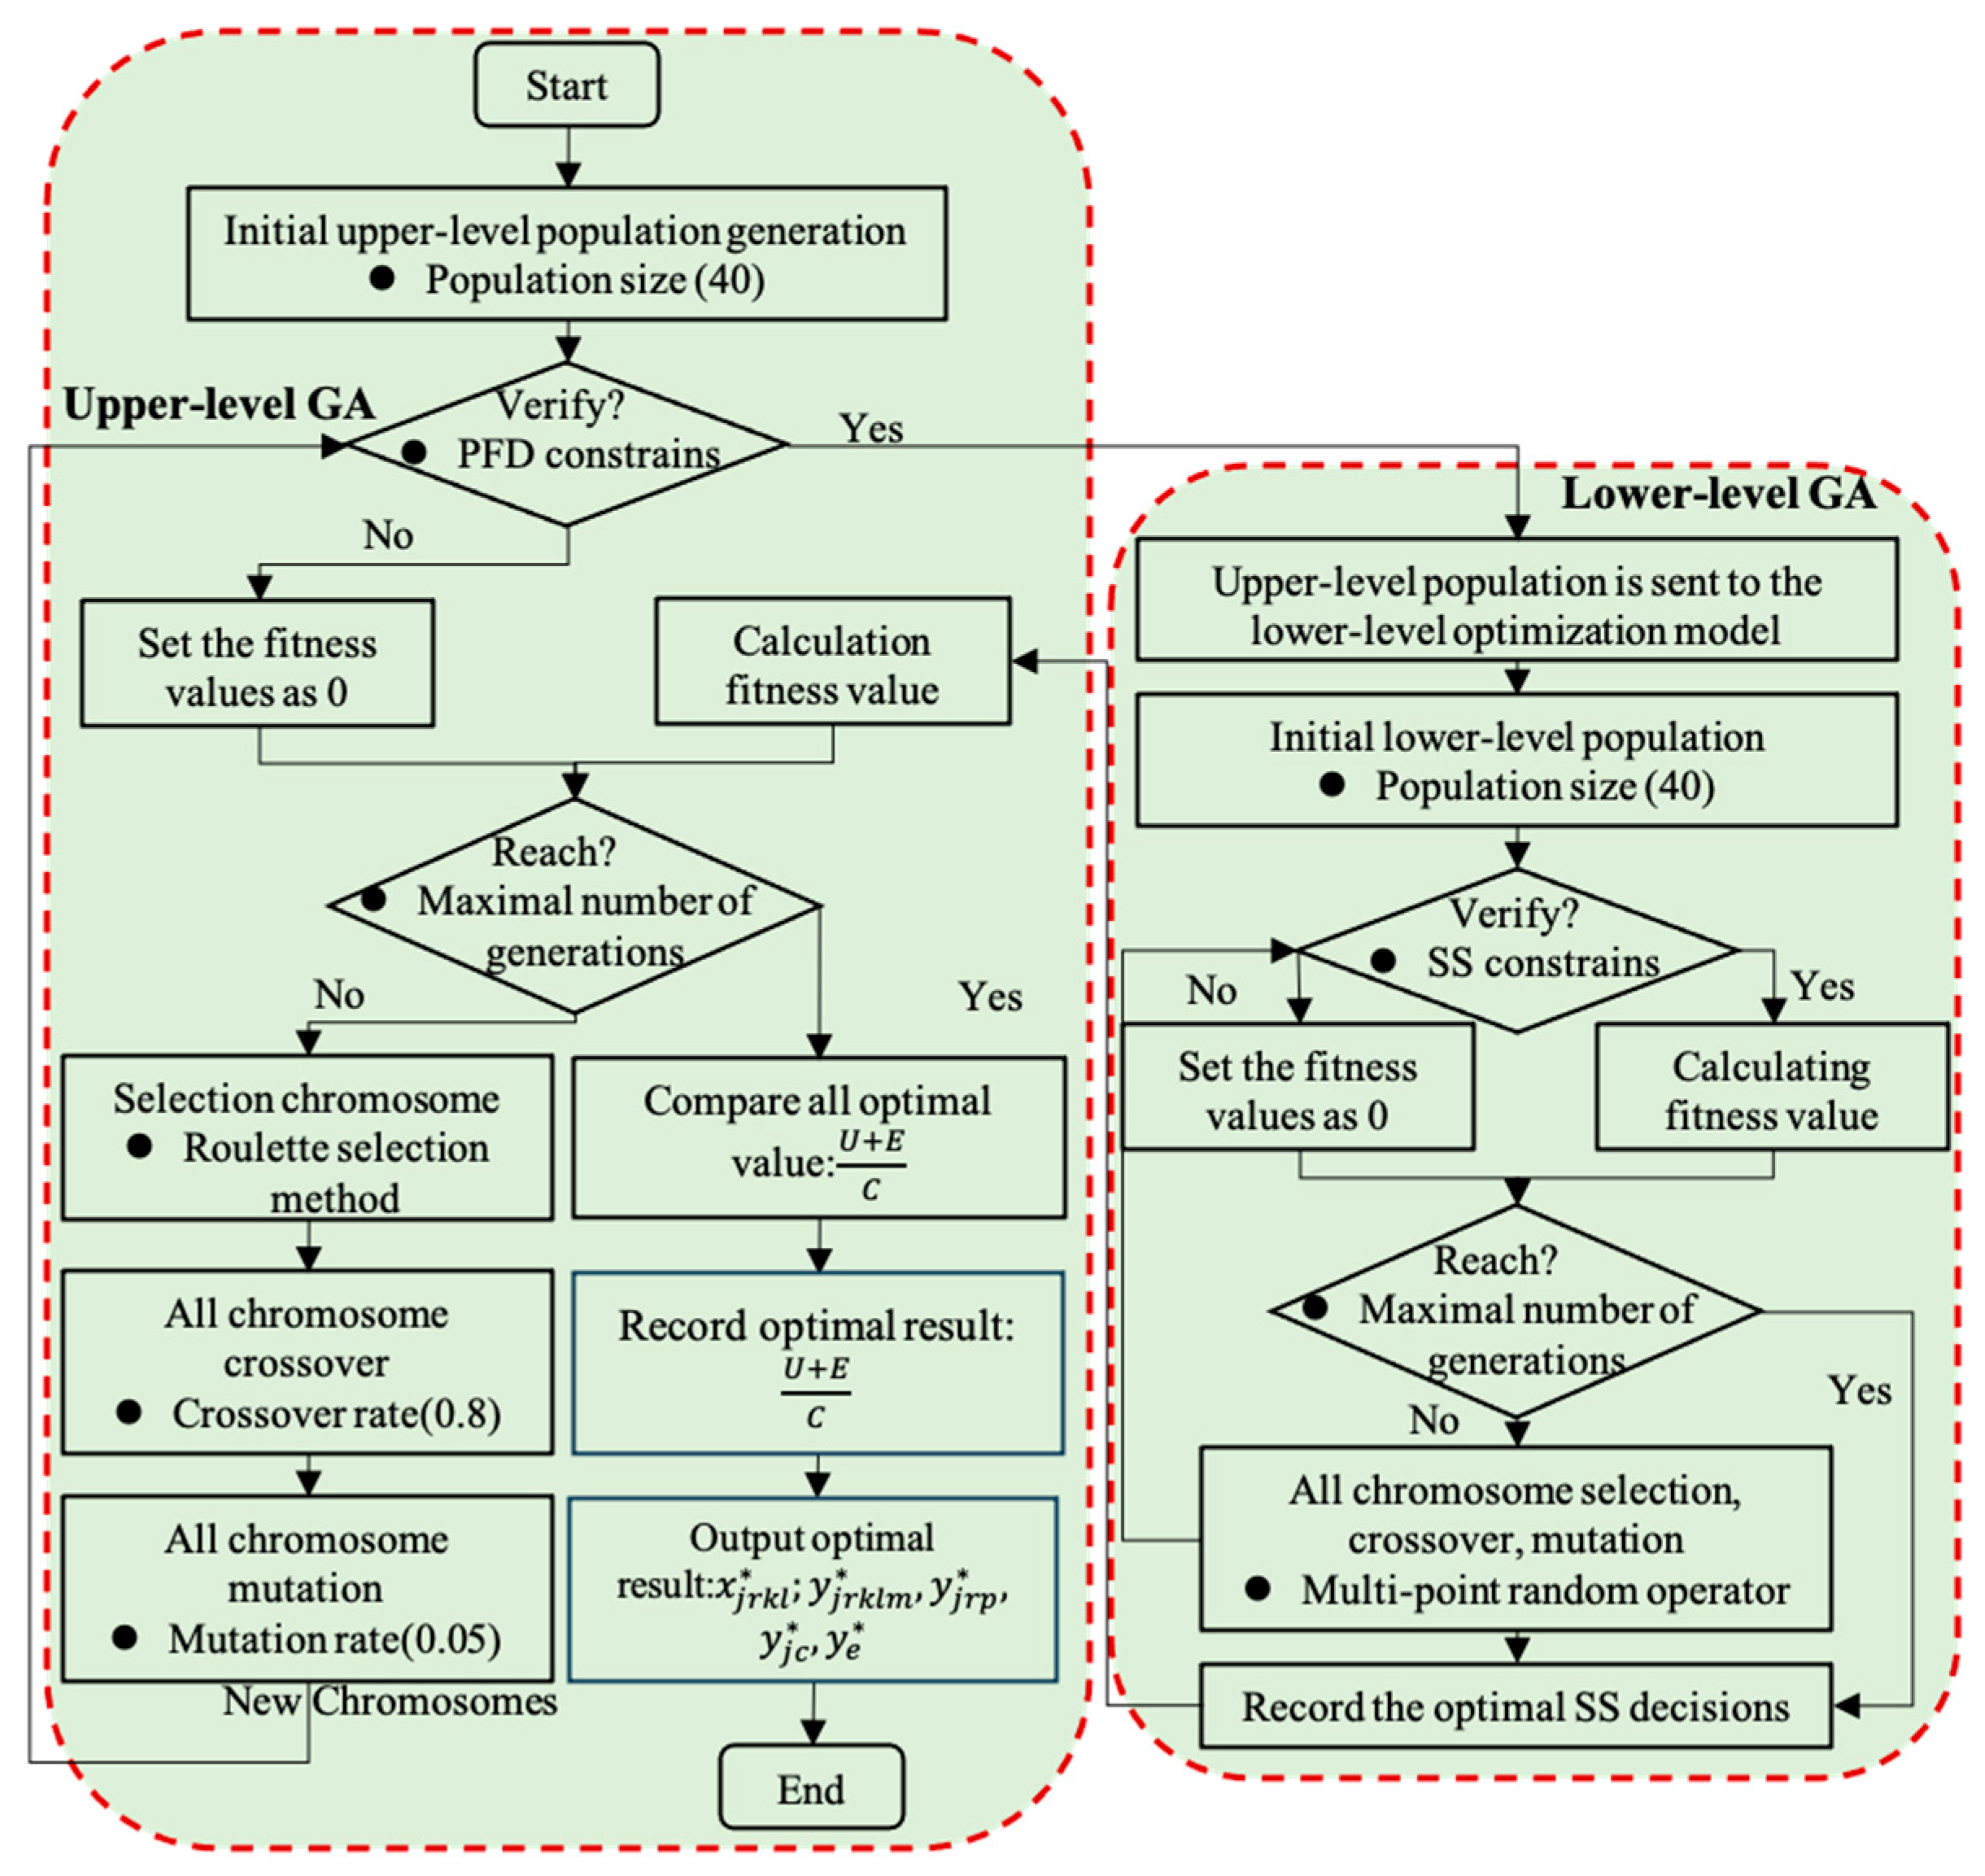
5. Solution of the Model
5.1. Algorithm Construction and Evaluation
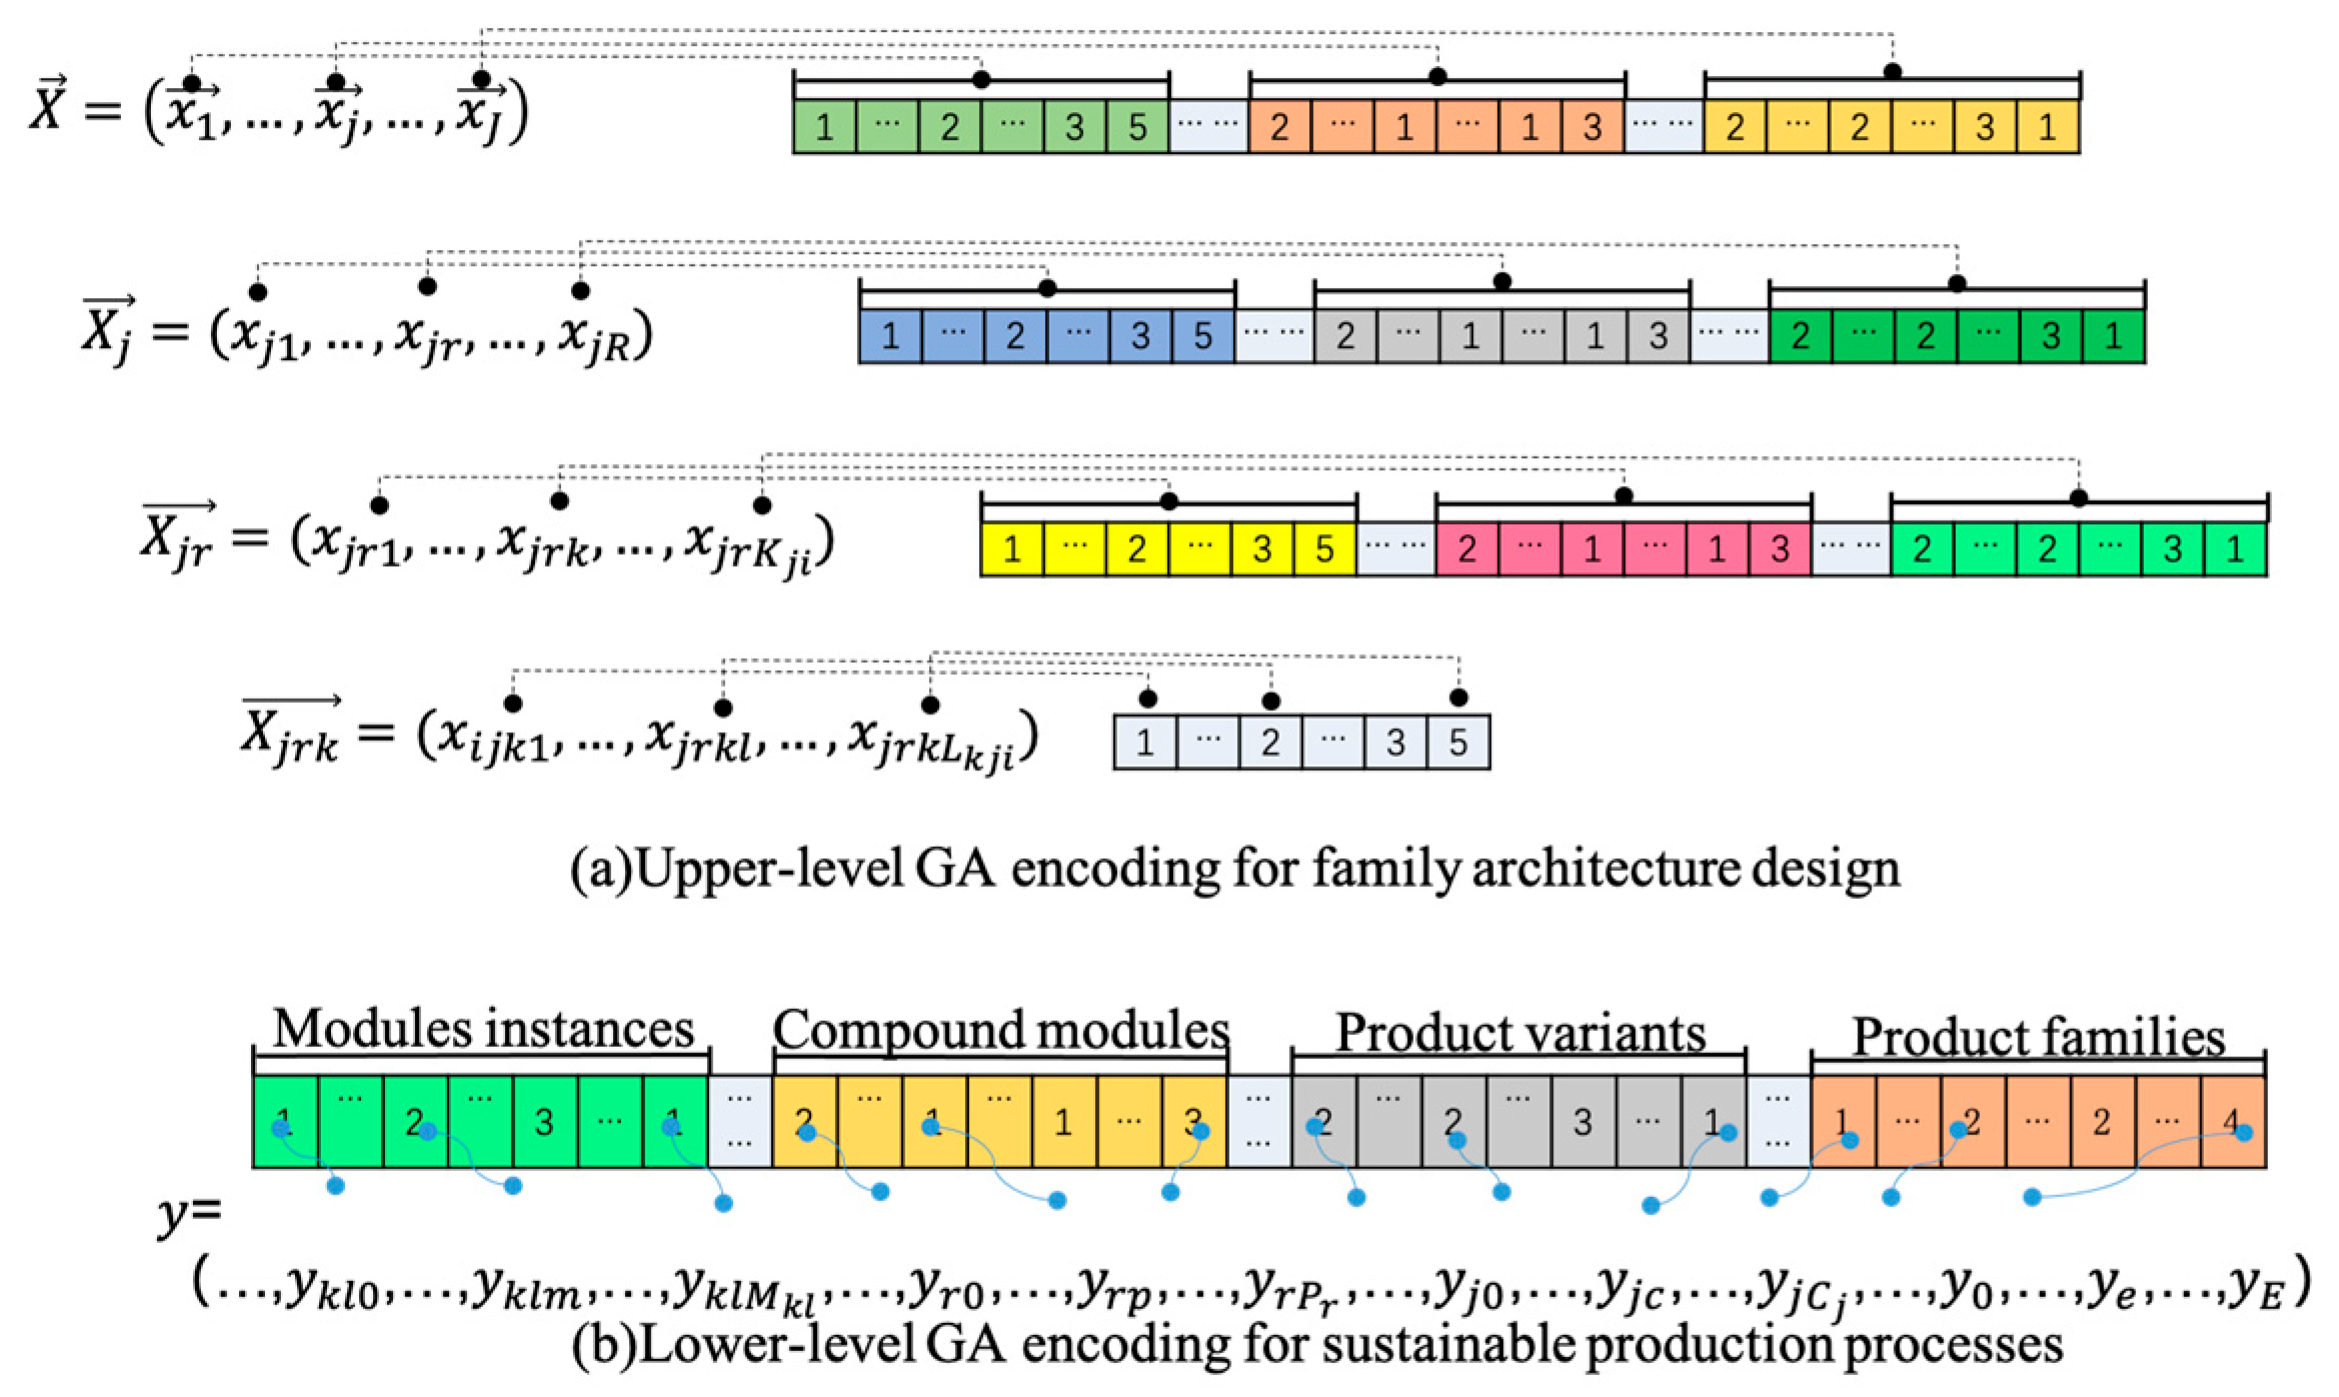
5.2. Encoding
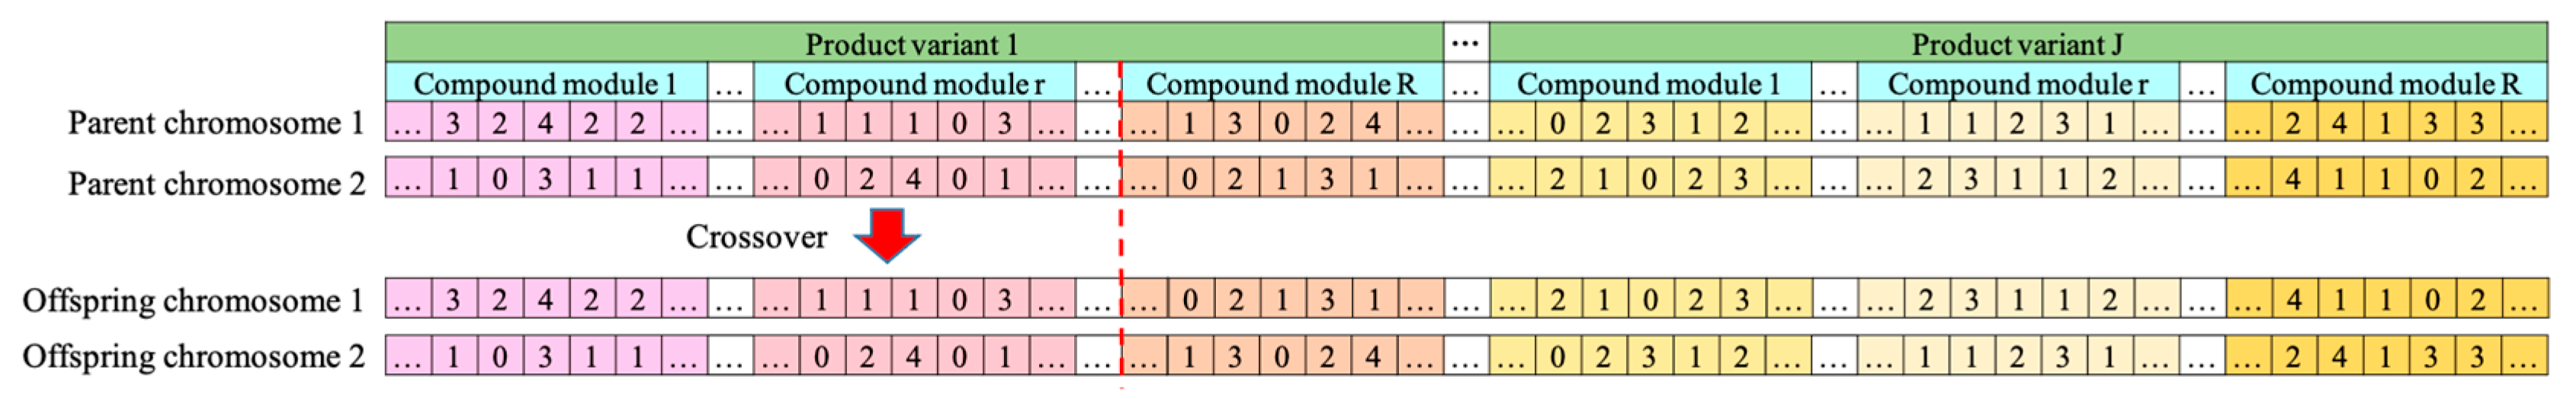
5.3. Crossover and Mutation
6. Case Study
6.1. Background Description
6.2. Results of HJO Model
6.3. Sustainability Analysis for Problem
6.4. Performance Analysis for Model
6.5. Reliability Analysis for Algorithm
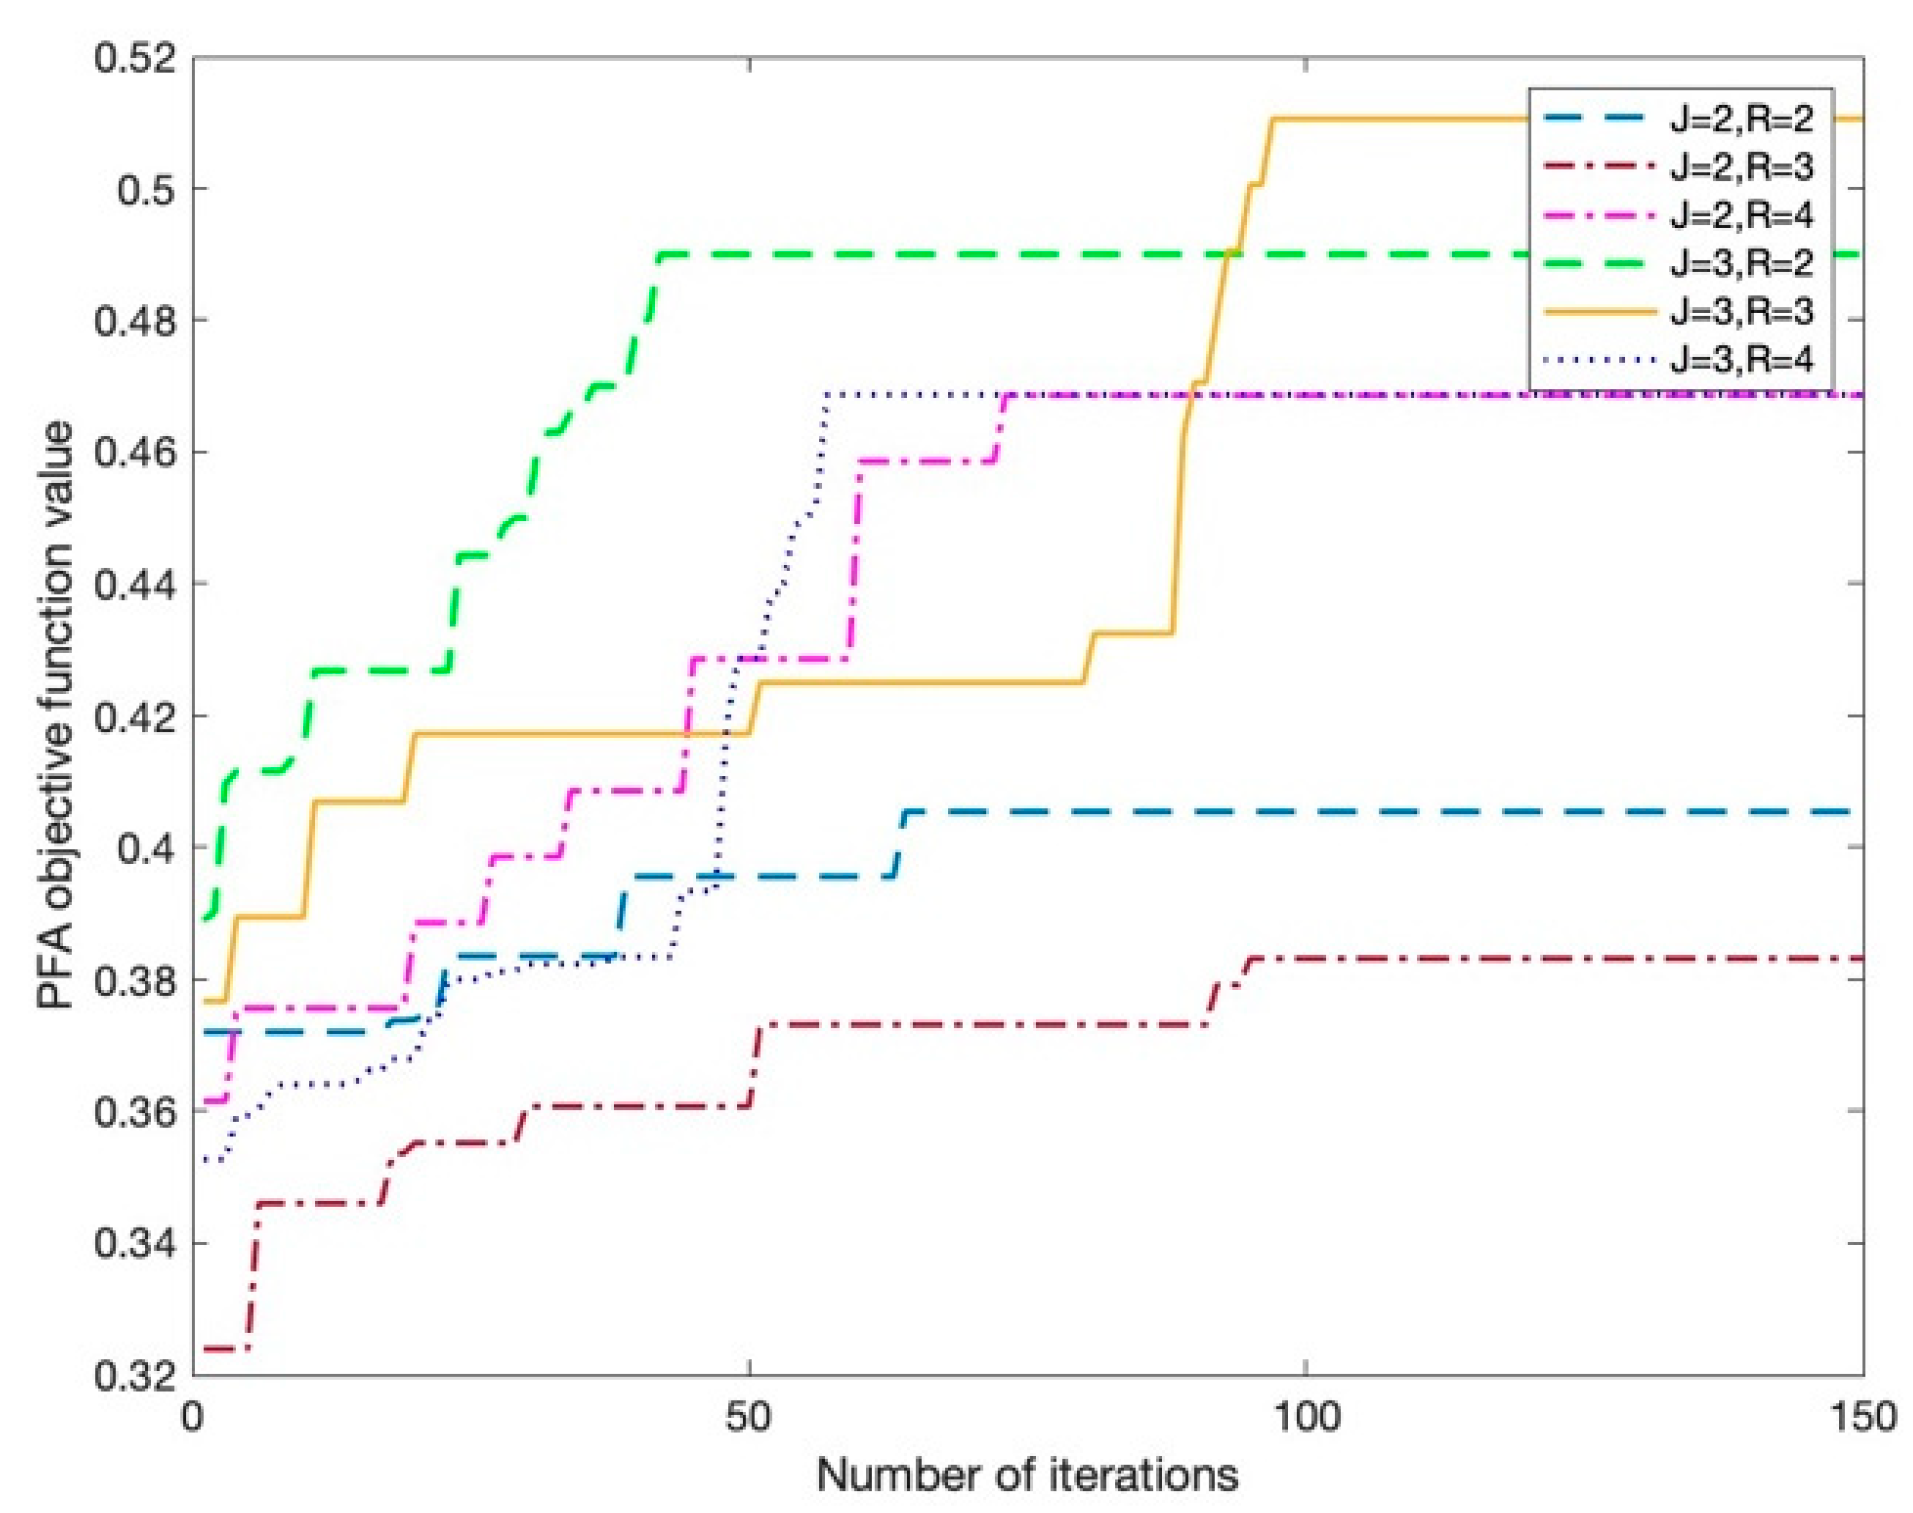
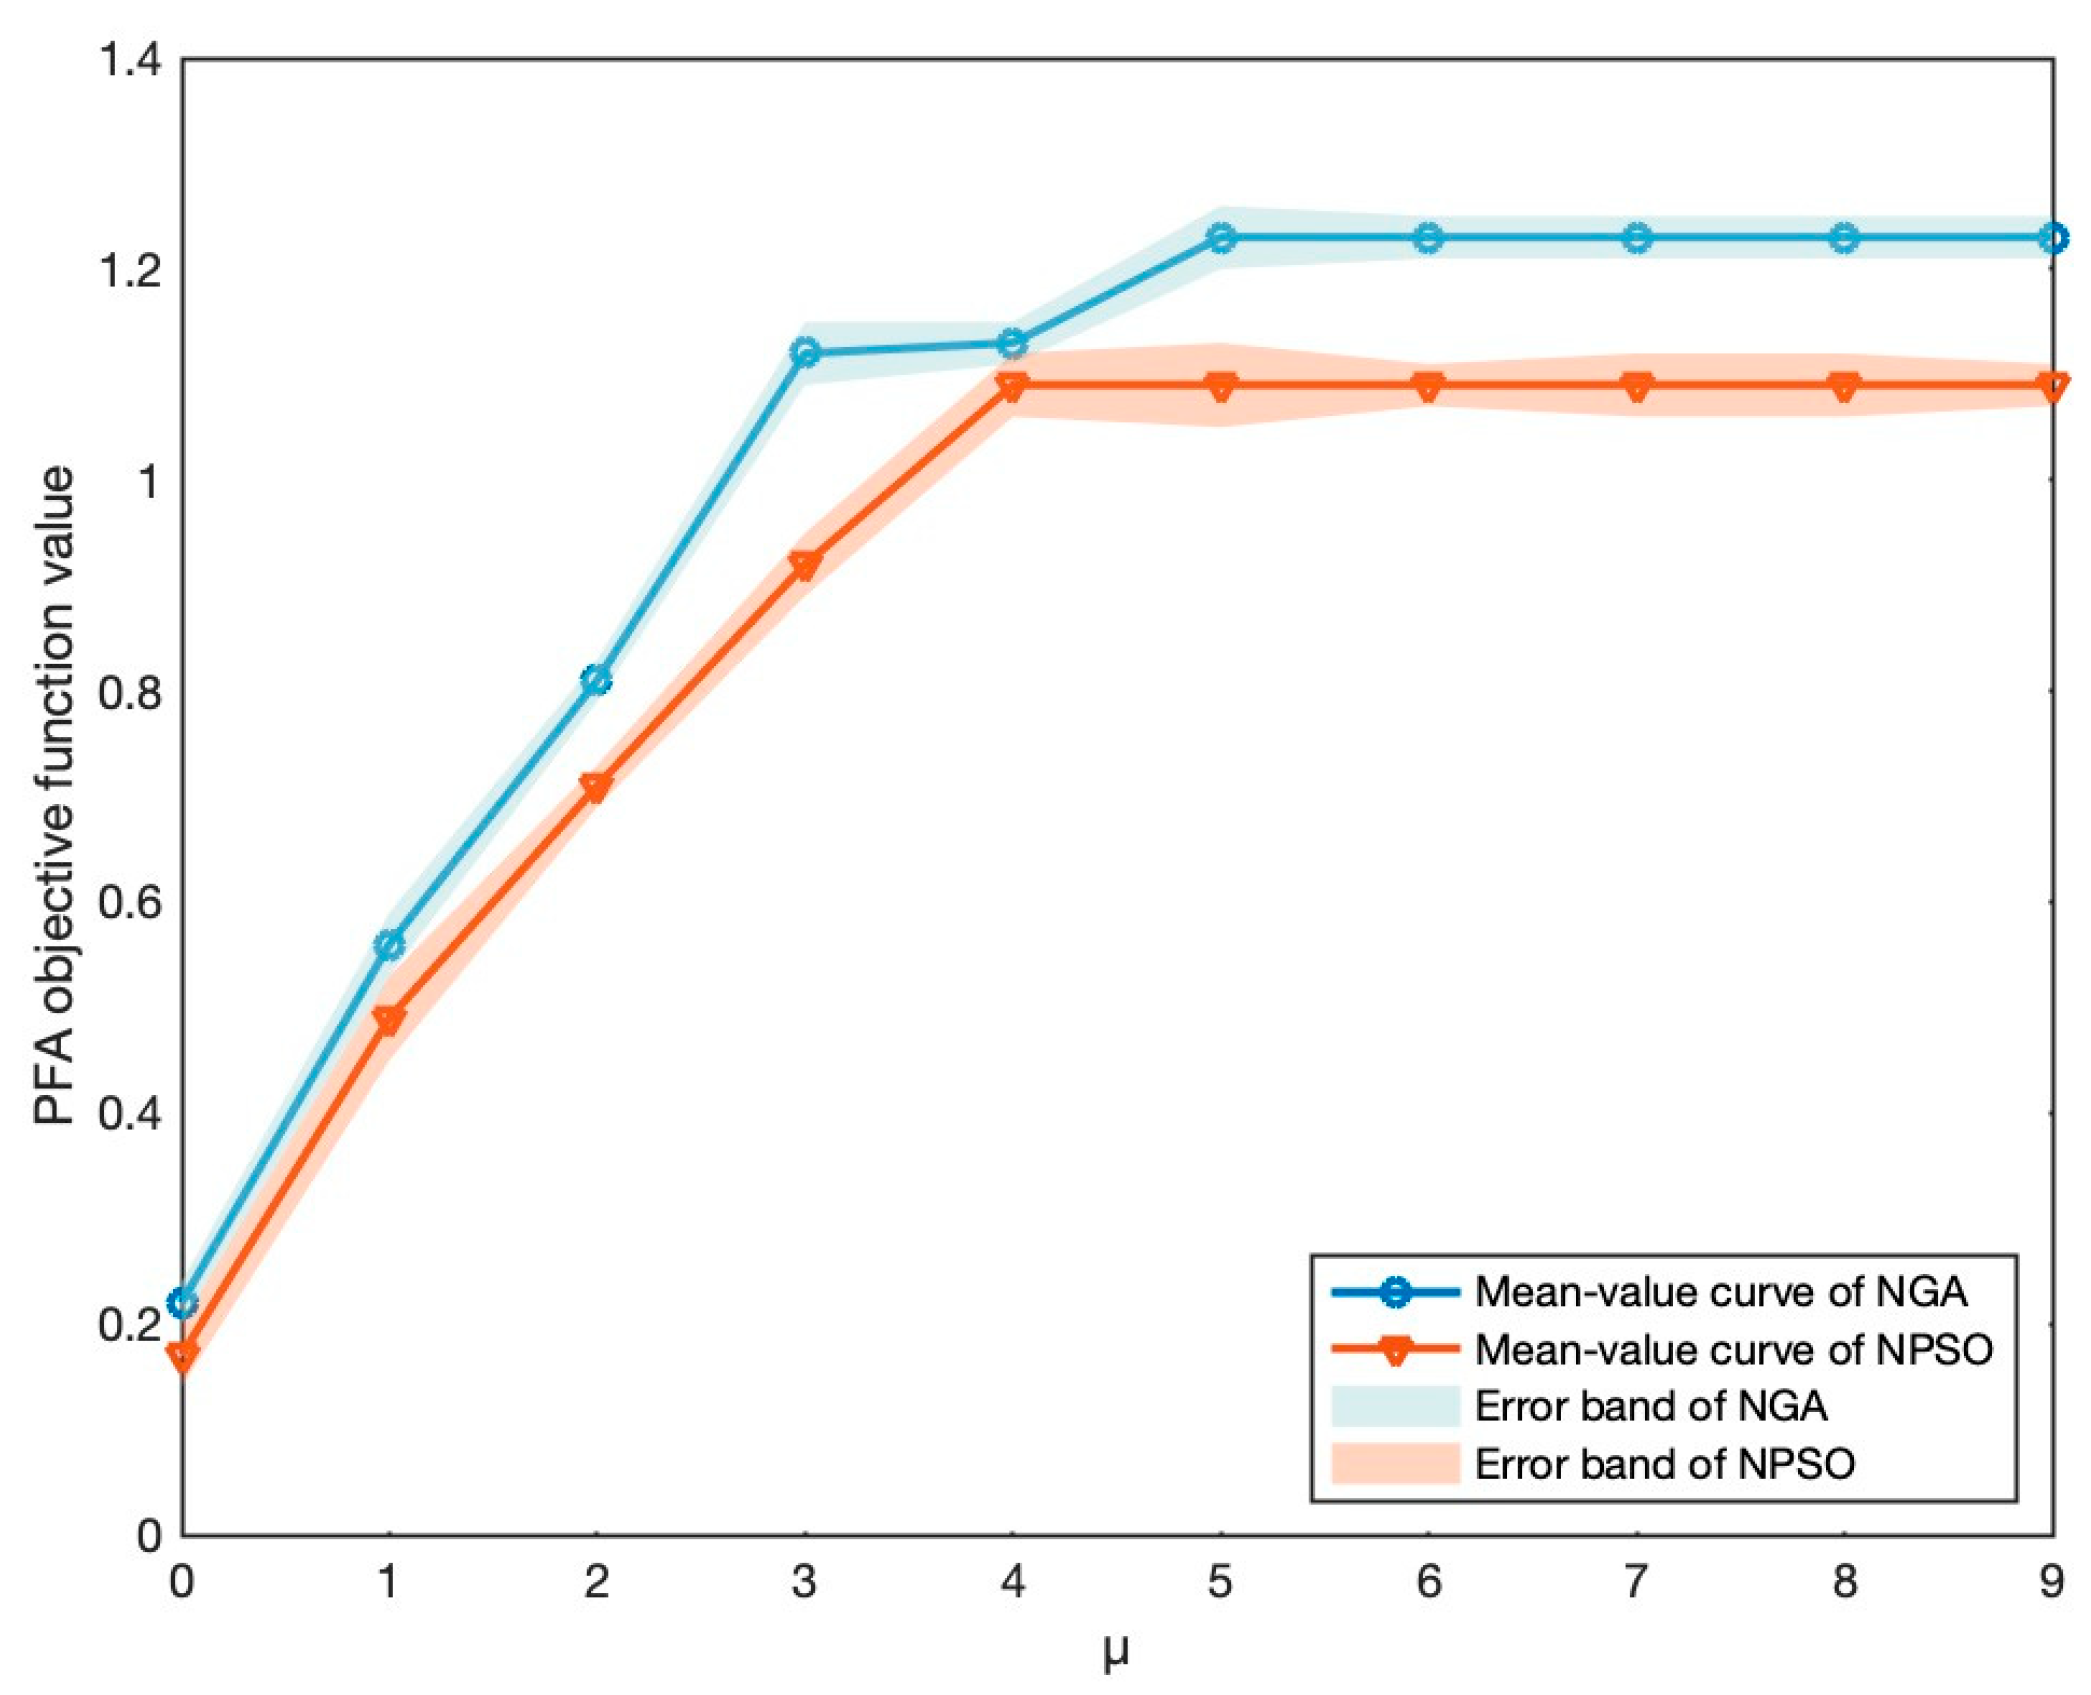
- Optimality Analysis: Particle swarm optimization (PSO) is a relatively recent heuristic algorithm inspired by the social behavior of crowded species like bird flocking and fish schooling, which has demonstrated success across a wide range of optimization tasks [53]. Consequently, we undertake sensitivity analysis of the parameter μ in the MNL choice rule on the PFA objective function value using both our proposed NGA algorithm and the PSO algorithm within a bilevel solving framework in order to verify the reliability of our proposed algorithm in terms of optimality. An experiment is conducted by fixing μ as a series of constants ranging from 0 to 9 in increments of 1. The parameter settings of PSO are as follows: The number of swarms is 1, the number of particles is set to 20, and the number of generations is set to 100. The inertia weight (w) is set to 0.4 and 0.6. The acceleration coefficients (c1 and c2) are set to 2, and rand1 and rand2 follow a standard normal distribution with a mean of 0 and a variance of 1. As illustrated in Figure 11, it is apparent that the PFA objective function value calculated by the nested PSO algorithm for 10 points ranging from 0 to 9 is inferior to those obtained by the NGA. Consequently, we can infer that the reliability of our proposed NGA in terms of optimality surpasses that of the PSO algorithm.
- Stability Analysis: The second set of experiments involves conducting multiple trials for each value of the parameter μ in the MNL choice rule to determine deviation values. Subsequently, we assess the model’s stability by comparing the range of deviation intervals for each value. The shaded area depicts the error band from multiple trials. As illustrated in Figure 11, the NGA displays varying levels of fluctuation across different parameter values. There is a smaller range of fluctuation compared with the PSO algorithm. Hence, we can infer that the reliability of our proposed NGA in terms of stability outperforms that of the PSO algorithm.
7. Conclusions, Limitations and Future Research Directions
7.1. Conclusions
- (1)
- Considering sustainable product family design and manufacturing processes is valuable. Drawing from the experimental outcomes in Section 6.3, it becomes evident that, while integrating sustainability into the product family could potentially lead to additional manufacturing and sustainable costs, these expenses pale in comparison with the considerable boost in market share and competitive advantage. This result is consistent with the prevailing research findings on green product innovation, further validating the correctness and necessity of our consideration of sustainable PFA design and manufacturing processes [54,55].
- (2)
- Sustainable PFA design can be achieved by introducing sustainable utility functions. The incorporation of sustainability can alter the module configuration choices in PFA design schemes [25]. Because the objective of the PFA design is often to maximize utility per unit cost, the impact of sustainability on PFA can be described by constructing sustainable utility models. The form of sustainable utility models (such as linear or nonlinear) typically depends on the actual problem and decision preferences.
- (3)
- The HJO mechanism is advantageous. The proposed HJO model is robust and excels when dealing with the complex tradeoffs between the optimal PFA design decision and SMP decision. Compared with the IOM and TSM, the HJO approach tends to obtain better PFA solutions leveraging with the SMP decision. The study findings provide an approach for the industry to address the joint optimization problem concerning PFA design and SMPs.
- (4)
- NGA is reliable. Through the comparative experiments in Section 6.5, we observe that our algorithm exhibits favorable performance in both optimality and stability. The nested algorithm framework we designed aligns with the approach for bi-level optimization and is easily scalable. These research findings can serve as a basis for subsequent studies on nested algorithms.
7.2. Limitations and Future Research Directions
Author Contributions
Funding
Data Availability Statement
Conflicts of Interest
References
- Bag, S.; Yadav, G.; Dhamija, P.; Kataria, K.K. Key resources for industry 4.0 adoption and its effect on sustainable production and circular economy: An empirical study. J. Clean. Prod. 2021, 281, 125233. [Google Scholar] [CrossRef]
- Jayal, A.D.; Badurdeen, F.; Dillon, O.W., Jr.; Jawahir, I.S. Sustainable manufacturing: Modeling and optimization challenges at the product, process and system levels. CIRP J. Manuf. Sci. Technol. 2010, 2, 144–152. [Google Scholar] [CrossRef]
- Mesa, J.; Esparragoza, I.; Maury, H. Developing a set of sustainability indicators for product families based on the circular economy model. J. Clean. Prod. 2018, 196, 1429–1442. [Google Scholar] [CrossRef]
- Enyoghasi, C.; Fazleena, B. Industry 4.0 for sustainable manufacturing: Opportunities at the product, process, and system levels. Resour. Conserv. Recycl. 2021, 166, 105362. [Google Scholar] [CrossRef]
- Bag, S.; Pretorius, J.H.C. Relationships between industry 4.0, sustainable manufacturing and circular economy: Proposal of a research framework. Int. J. Organ. Anal. 2022, 30, 864–898. [Google Scholar] [CrossRef]
- Frank, A.G.; Dalenogare, L.S.; Ayala, N.F. Industry 4.0 technologies: Implementation patterns in manufacturing companies. Int. J. Prod. Econ. 2019, 210, 15–26. [Google Scholar] [CrossRef]
- Mejía-Moncayo, C.; Jean-Pierre, K.; Lucas, A.H. On the development of a smart architecture for a sustainable manufacturing-remanufacturing system: A literature review approach. Comput. Ind. Eng. 2023, 180, 109282. [Google Scholar] [CrossRef]
- Jiao, J.; Simpson, T.W.; Siddique, Z. Product family design and platform-based product development: A state-of-the-art review. J. Intell. Manuf. 2007, 18, 5–29. [Google Scholar] [CrossRef]
- Berry, S.; Ariel, P. The pure characteristics demand model. Int. Econ. Rev. 2007, 48, 1193–1225. [Google Scholar] [CrossRef]
- Kim, S.; Moon, S.K. Sustainable platform identification for product family design. J. Clean. Prod. 2017, 143, 567–581. [Google Scholar] [CrossRef]
- He, B.; Li, F.; Cao, X.; Li, T. Product sustainable design: A review from the environmental, economic, and social aspects. J. Comput. Inf. Sci. Eng. 2020, 20, 040801. [Google Scholar] [CrossRef]
- Zhou, J.; Xia, T.; Yu, L. Multi-objective optimization-based TOPSIS method for sustainable product design under epistemic uncertainty. Appl. Soft Comput. 2021, 98, 106850. [Google Scholar] [CrossRef]
- Li, Y.; Roy, U. A multi-objective optimisation methodology towards product design for sustainability. Int. J. Strateg. Eng. Asset Manag. 2018, 3, 154–176. [Google Scholar] [CrossRef]
- Badurdeen, F.; Aydin, R.; Brown, A. A multiple lifecycle-based approach to sustainable product configuration design. J. Clean. Prod. 2018, 200, 756–769. [Google Scholar] [CrossRef]
- Jiao, R.J.; Tseng, M.M. On equilibrium solutions to joint optimization problems in engineering design. CIRP Ann-Manuf. Tech. 2013, 62, 155–158. [Google Scholar] [CrossRef]
- Cross, N. Engineering Design Methods: Strategies for Product Design; John Wiley & Sons: Hoboken, NY, USA, 2021. [Google Scholar]
- Yang, D.; Jiao, J.R.; Ji, Y.; Du, G.; Helo, P.; Valente, A. Joint Optimization for Coordinated Configuration of Product Families and Supply Chains by a Leader–Follower Stackelberg Game. Eur. J. Oper. Res. 2015, 246, 263–280. [Google Scholar] [CrossRef]
- Sajid, M.; Ertz, M. Blueprints to Benefits: Towards an Index to Measure the Impact of Sustainable Product Development on the Firm’s Bottom Line. Sustainability 2024, 16, 537. [Google Scholar] [CrossRef]
- Pirmoradi, Z.; Wang, G.G.; Simpson, T.W. A Review of Recent Literature in Product Family Design and Platform-Based Product Development. Adv. Prod. Fam. Prod. Platf. Des. 2014, 1–46. [Google Scholar]
- Tyagi, S.; Yang, K.; Tyagi, A.; Verma, A. A Fuzzy Goal Programming Approach for Optimal Product Family Design of Mobile Phones and Multiple-platform Architecture. IEEE Trans. Syst. Man Cybern. Part C (Appl. Rev.), 2012; 42, 1519–1530. [Google Scholar]
- Trentin, A.; Perin, E.; Forza, C. Increasing the consumer-perceived benefits of a mass-customization experience through sales-configurator capabilities. Comput. Ind. 2014, 65, 693–705. [Google Scholar] [CrossRef]
- Yoo, J.; Park, M. The effects of e-mass customization on consumer perceived value, satisfaction, and loyalty toward luxury brands. J. Bus. Res. 2016, 69, 5775–5784. [Google Scholar] [CrossRef]
- Ma, S.; Du, G.; Jiao, J.R.; Zhang, R. Hierarchical game joint optimization for product family-driven modular design. J. Oper. Res. Soc. 2016, 67, 1496–1509. [Google Scholar] [CrossRef]
- Ceschin, F.; Gaziulusoy, I. Evolution of design for sustainability: From product design to design for system innovations and transitions. Des. Stud. 2016, 47, 118–163. [Google Scholar] [CrossRef]
- Xiao, W.; Du, G.; Zhang, Y.; Liu, X. Coordinated optimization of low-carbon product family and its manufacturing process design by a bilevel game-theoretic model. J. Clean. Prod. 2018, 184, 754–773. [Google Scholar] [CrossRef]
- Tao, F.; Cheng, J.; Qi, Q.; Zhang, M.; Zhang, H.; Sui, F. Digital twin-driven product design, manufacturing and service with big data. Int. J. Adv. Manuf. Technol. 2018, 94, 3563–3576. [Google Scholar] [CrossRef]
- Lim, K.; Yan, H.; Zheng, P.; Chen, C.-H. A state-of-the-art survey of Digital Twin: Techniques, engineering product lifecycle management and business innovation perspectives. J. Intell. Manuf. 2020, 31, 1313–1337. [Google Scholar] [CrossRef]
- Ma, J.; Kremer, G.E.O. A systematic literature review of modular product design (MPD) from the perspective of sustainability. Int. J. Adv. Manuf. Technol. 2016, 86, 1509–1539. [Google Scholar] [CrossRef]
- Huang, A.; Badurdeen, F. Sustainable Manufacturing Performance Evaluation: Integrating Product and Process Metrics for Systems Level Assessment. Procedia Manuf. 2017, 8, 563–570. [Google Scholar] [CrossRef]
- Kremer, G.E.; Haapala, K.; Murat, A.; Chinnam, R.B.; Kim, K.Y.; Monplaisir, L.; Lei, T. Directions for instilling economic and environmental sustainability across product supply chains. J. Clean. Prod. 2016, 112, 2066–2078. [Google Scholar] [CrossRef]
- Madani, S.R.; Rasti-Barzoki, M. Sustainable supply chain management with pricing, greening and governmental tariffs determining strategies: A game-theoretic approach. Comput. Ind. Eng. 2017, 105, 287–298. [Google Scholar] [CrossRef]
- Mangla, S.K.; Kazancoglu, Y.; Sezer, M.D.; Top, N.; Sahin, I. Optimizing fused deposition modelling parameters based on the design for additive manufacturing to enhance product sustainability. Comput. Ind. 2023, 145, 103833. [Google Scholar] [CrossRef]
- Leng, J.; Ruan, G.; Jiang, P.; Xu, K.; Liu, Q.; Zhou, X.; Liu, C. Blockchain-empowered sustainable manufacturing and product lifecycle management in industry 4.0: A survey. Renew. Sustain. Energy Rev. 2020, 132, 110112. [Google Scholar] [CrossRef]
- Garbie, I.H. DFSME: Design for sustainable manufacturing enterprises (an economic viewpoint). Int. J. Prod. Res. 2013, 51, 479–503. [Google Scholar] [CrossRef]
- Yan, J.; Feng, C. Sustainable design-oriented product modularity combined with 6R concept: A case study of rotor laboratory bench. Clean Technol. Environ. Policy 2014, 16, 95–109. [Google Scholar] [CrossRef]
- Kim, S.; Moon, S.K. Eco-modular product architecture identification and assessment for product recovery. J. Intell. Manuf. 2016, 30, 383–403. [Google Scholar] [CrossRef]
- Guo, S.; Choi, T.M.; Shen, B. Green product development under competition: A study of the fashion apparel industry. Eur. J. Oper. Res. 2020, 280, 523–538. [Google Scholar] [CrossRef]
- Dempe, S.; Zemkoho, A. Bilevel Opstimization; Springer Optimization and Its Applications: New York, NY, USA, 2020; p. 161. [Google Scholar]
- Ma, Y.; Du, G.; Jiao, R.J. Optimal crowdsourcing contracting for reconfigurable process planning in open manufacturing: A bilevel coordinated optimization approach. Int. J. Prod. Econ. 2020, 228, 107884. [Google Scholar] [CrossRef]
- Zhou, K.; Du, G.; Jiao, J. Personalized service product family design optimization considering crowdsourced service operations. Comput. Ind. Eng. 2022, 166, 107973. [Google Scholar] [CrossRef]
- Serrano, B.; Minner, S.; Schiffer, M.; Vidal, T. Bilevel optimization for feature selection in the data-driven newsvendor problem. Eur. J. Oper. Res. 2024, 315, 703–714. [Google Scholar] [CrossRef]
- Du, G.; Zhang, Y.; Liu, X.; Jiao, R.J.; Xia, Y.; Li, Y. A review of leader-follower joint optimization problems and mathematical models for product design and development. Int. J. Adv. Manuf. Technol. 2019, 103, 3405–3424. [Google Scholar] [CrossRef]
- Camacho-Vallejo, J.F.C.; Villegas, J.G. Metaheuristics for bilevel optimization: A comprehensive review. Comput. Oper. Res. 2023, 106410. [Google Scholar]
- Allende, G.B.; Georg, S. Solving bilevel programs with the KKT-approach. Math. Program. 2013, 138, 309–332. [Google Scholar] [CrossRef]
- Shi, C.; Zhang, G.; Lu, J. The K th-best approach for linear bilevel multi-follower programming. J. Glob. Optim. 2005, 33, 563–578. [Google Scholar] [CrossRef]
- Colson, B.; Marcotte, P.; Savard, G. An Overview of Bilevel Optimization. Ann. Oper. Res. 2007, 153, 235–256. [Google Scholar] [CrossRef]
- Andersen, R.; Brunoe, T.D.; Nielsen, K. Platform-based product development in the process industry: A systematic literature review. Int. J. Prod. Res. 2023, 61, 1696–1719. [Google Scholar] [CrossRef]
- Zhou, F.; Jiao, R.J.; Lei, B. Bilevel Game-Theoretic Optimization for Product Adoption Maximization Incorporating Social Network Effects. IEEE Trans. Syst. Man Cybern. Syst. 2016, 46, 1047–1060. [Google Scholar] [CrossRef]
- Dellaert, B.G.C.; Stremersch, S. Marketing Mass-Customized Products: Striking a Balance Between Utility and Complexity. J. Mark. Res. 2005, 42, 219–227. [Google Scholar] [CrossRef]
- Kaul, A.; Rao, V.R. Research for Product Positioning and Design Decisions: An Integrative Review. Int. J. Res. Mark. 1995, 12, 293–320. [Google Scholar] [CrossRef]
- Wang, Z.; Sobey, A. A comparative review between Genetic Algorithm use in composite optimisation and the state-of-the-art in evolutionary computation. Compos. Struct. 2020, 233, 111739. [Google Scholar] [CrossRef]
- Guariso, G.; Sangiorgio, M. Improving the performance of multiobjective genetic algorithms: An elitism-based approach. Information 2020, 11, 587. [Google Scholar] [CrossRef]
- Pakseresht, M.; Mahdavi, I.; Shirazi, B.; Mahdavi-Amiri, N. Co-reconfiguration of product family and supply chain using leader–follower Stackelberg game theory: Bi-level multi-objective optimization. Appl. Soft Comput. 2020, 91, 106203. [Google Scholar] [CrossRef]
- Skordoulis, M.; Kyriakopoulos, G.; Ntanos, S.; Galatsidas, S.; Arabatzis, G.; Chalikias, M.; Kalantonis, P. The mediating role of firm strategy in the relationship between green entrepreneurship, green innovation, and competitive advantage: The case of medium and large-sized firms in Greece. Sustainability 2022, 14, 3286. [Google Scholar] [CrossRef]
- Rehman, S.U.; Kraus, S.; Shah, S.A.; Khanin, D.; Mahto, R.V. Analyzing the relationship between green innovation and environmental performance in large manufacturing firms. Technol. Forecast. Soc. Chang. 2021, 163, 120481. [Google Scholar] [CrossRef]
- Catumba, B.D.S.; dos Santos, J.C.S. Sustainability and challenges in hydrogen production: An advanced bibliometric analysis. Int. J. Hydrog. Energy 2023, 48, 7975–7992. [Google Scholar] [CrossRef]
- Mazyavkina, N.; Sviridov, S.; Ivanov, S.; Burnaev, E. Reinforcement learning for combinatorial optimization: A survey. Comput. Oper. Res. 2020, 134, 105400. [Google Scholar] [CrossRef]


| Parameters | Parameter Description |
|---|---|
| Utility for the j-th product variant in the i-th market segment. | |
| Weight for the k-th basic module of the j-th product variant. | |
| Utility for the l-th module instance of the k-th basic module in the i-th market. | |
| Constant related to the comprehensive utility for the j-th product variant in i-th market segments. | |
| Error term for the j-th product variant in the i-th market segment. | |
| Sustainable utility for the j-th product variant in the i-th market segment. | |
| Sustainable utility for the l-th module instance of the k-th basic module in i-th market segments. | |
| Probability for the j-th product variant in the i-th market segment. | |
| C | Enterprise total cost. |
| Enterprise design cost. | |
| Enterprise sustainable cost. | |
| Number of customers in the i-th market segment. | |
| Fixed design cost. | |
| Sustainable design cost for selecting the m-th raw material of the l-th module instance of the k-th basic module of the r-th compound module of the j-th product variant. | |
| Sustainable design cost for selecting the p-th production method of the r-th compound module of the j-th product variant. | |
| Sustainable design cost for selecting the c-th recycling method of the j-th product variant. | |
| Sustainable design cost for selecting the e-th end-of-life processing method of the product family. | |
| Fixed cost for selecting the m-th raw material of the l-th module instance of the k-th basic module. | |
| Unit variable cost for selecting the m-th raw material of the l-th module instance of the k-th basic module. | |
| Fixed manufacturing cost for selecting the p-th production method of the r-th compound module. | |
| Unit variable manufacturing cost for selecting the p-th production method of the r-th compound module. | |
| Fixed recycling cost for selecting the c-th recycling method of the j-th product variant. | |
| Unit variable recycling cost for selecting the c-th recycling method of the j-th product variant. | |
| Fixed process cost for selecting the e-th end-of-life processing method. | |
| Unit variable process cost for selecting the e-th end-of-life processing method. | |
| Emission for selecting the m-th raw material of the l-th module instance of the k-th basic module of the r-th compound module of the j-th product variant. | |
| Emission for selecting the p-th production method of the r-th compound module of the j-th product variant. | |
| Emission for selecting the c-th recycling method of the j-th product variant. | |
| Emission for selecting the e-th end-of-life processing method of the product family. | |
| Consumption for selecting the m-th raw material of the l-th module instance of the k-th basic module of the r-th compound module of the j-th product variant. | |
| Consumption for selecting the p-th production method of the r-th compound module of the j-th product variant. | |
| Consumption for selecting the c-th recycling method of the j-th product variant. | |
| Consumption for selecting the e-th end-of-life processing method of the product family. | |
| Recovery probability of the j-th product variant. | |
| Proportion of e-th end-of-life processing method of the product family. | |
| Maximal number of product variants. |
| ID | Name | Attribute | |
|---|---|---|---|
| Shell | Black | ||
| White | |||
| Red | |||
| Display | LCD | ||
| LED | |||
| Speaker | Mono | ||
| Stereo | |||
| Motherboard | ATX | ||
| M-ATX | |||
| Graphics card | Standalone graphics | ||
| Integrated graphics | |||
| CPU | Intel | ||
| RAM | 4G | ||
| 8G | |||
| 16G | |||
| Keyboard | Mechanical | ||
| Plastic film | |||
| Conductive rubber | |||
| Capacitive | |||
| Hard disk | 1TB | ||
| 500GB | |||
| 256GB | |||
| Battery | Nickel-cadmium | ||
| NiMH | |||
| Lithium | |||
| Fan | 60 | ||
| 80 | |||
| 120 | |||
| Optical drive | CD | ||
| CD/DVD |
| ID | … | |||||
|---|---|---|---|---|---|---|
| 1 | Red | LCD | Mono | ATX | … | DVD |
| 2 | White | LED | Mono | ATX | … | CD |
| 3 | Black | LCD | Stereo | ATX | … | DVD |
| 4 | Red | LCD | Mono | ATX | … | CD |
| … | … | … | … | … | … | … |
| 31 | Black | LCD | Stereo | M-ATX | … | DVD |
| 32 | Red | LCD | Mono | ATX | … | CD |
| 1.41 | 5.11 | ||
| 2.53 | −1.35 | ||
| 6.42 | 2.46 | ||
| 6.47 | −3.23 | ||
| 7.45 | 1.46 | ||
| … | … | … | … |
| 3.58 | 3.16 |
| R | ||
|---|---|---|
| R = 2 | Motherboard, graphics card, CPU and hard disk are mandatory; the others are to be optimized | |
| Shell, RAM, keyboard and battery are mandatory; the others are to be optimized | ||
| R = 3 | Motherboard, graphics card and RAM are mandatory; the others are to be optimized | |
| Shell, CPU and hard disk are mandatory; the others are to be optimized | ||
| Display, speaker and optical drive are mandatory; the others are to be optimized | ||
| R = 4 | Display, speaker and RAM are mandatory; the others are to be optimized | |
| Motherboard, graphics card and CPU are mandatory; the others are to be optimized | ||
| RAM and hard disk are mandatory; the others are to be optimized | ||
| Keyboard is mandatory; the others are to be optimized |
| m | ||||||
|---|---|---|---|---|---|---|
| 1 | 20 | 80 | 9 | 3 | 2 | |
| 2 | 22 | 70 | 8 | 6 | 4 | |
| 1 | 25 | 80 | 8 | 8 | 3 | |
| 2 | 23 | 60 | 9 | 1 | 10 | |
| 1 | 20 | 70 | 6 | 9 | 8 | |
| 2 | 21 | 90 | 9 | 10 | 2 | |
| 1 | 260 | 300 | 20 | 50 | 32 | |
| 2 | 260 | 310 | 21 | 20 | 23 | |
| 1 | 100 | 210 | 23 | 20 | 21 | |
| 2 | 120 | 290 | 25 | 19 | 40 | |
| … | … | … | … | … | … | |
| 1 | 200 | 190 | 10 | 10 | 17 | |
| 2 | 180 | 200 | 12 | 16 | 6 |
| m | n | |||||||||
|---|---|---|---|---|---|---|---|---|---|---|
| 1 | 0.9 | 0.5 | 1 | 0.5 | 2 | 1 | 1 | 23 | 5 | |
| … | … | … | … | … | … | … | ||||
| 4 | 0.2 | 7 | 0 | 0.9 | 25 | 6 | ||||
| 2 | 0.7 | 0.9 | 1 | 0.4 | 6 | 4 | 0.8 | 20 | 4 | |
| … | … | … | … | … | … | … | ||||
| 4 | 0.7 | 4 | 1 | 1.1 | 23 | 5 | ||||
| 1 | 0.9 | 0.2 | 1 | 0.6 | 8 | 3 | 1.2 | 22 | 4 | |
| … | … | … | … | … | … | … | ||||
| 4 | 0.9 | 5 | 0 | 0.6 | 25 | 6 | ||||
| 2 | 0.6 | 0.4 | 1 | 0.9 | 1 | 1 | 0.7 | 10 | 20 | |
| … | … | … | … | … | … | … | ||||
| 4 | 0.8 | 7 | 5 | 0.9 | 22 | 4 | ||||
| 1 | 0.7 | 0.6 | 1 | 0.7 | 9 | 8 | 1.1 | 10 | 3 | |
| … | … | … | … | … | … | … | ||||
| 4 | 0.6 | 10 | 4 | 1.2 | 11 | 1 | ||||
| 2 | 0.9 | 0.9 | 1 | 0.7 | 4 | 2 | 1.2 | 10 | 30 | |
| … | … | … | … | … | … | … | ||||
| 4 | 0.5 | 3 | 6 | 1.0 | 12 | 27 | ||||
| 1 | 0.3 | 0.9 | 1 | 0.4 | 5 | 2 | 0.6 | 21 | 22 | |
| … | … | … | … | … | … | … | ||||
| 4 | 0.9 | 2 | 2 | 0.7 | 19 | 8 | ||||
| 2 | 0.3 | 0.8 | 1 | 0.5 | 2 | 2 | 0.8 | 10 | 10 | |
| … | … | … | … | … | … | … | ||||
| 4 | 0.2 | 3 | 0 | 0.9 | 12 | 6 | ||||
| 1 | 0.7 | 0.2 | 1 | 0.4 | 2 | 2 | 1.0 | 22 | 9 | |
| … | … | … | … | … | … | … | ||||
| 4 | 0.2 | 2 | 3 | 0.9 | 18 | 7 | ||||
| 2 | 0.8 | 0.5 | 1 | 0.2 | 1 | 4 | 1.2 | 10 | 2 | |
| … | … | … | … | … | … | … | ||||
| 4 | 0.3 | 2 | 3 | 0.9 | 8 | 1 | ||||
| … | … | … | … | … | … | … | … | … | … | … |
| 1 | 0.8 | 0.8 | 1 | 0.5 | 1 | 7 | 0.8 | 25 | 9 | |
| … | … | … | … | … | … | … | ||||
| 4 | 0.6 | 8 | 2 | 0.9 | 29 | 7 | ||||
| 2 | 0.7 | 0.9 | 1 | 0.4 | 1 | 6 | 1.0 | 24 | 3 | |
| … | … | … | … | … | … | |||||
| 4 | 0.6 | 5 | 7 | 1.1 | 28 | 8 |
| P | ||||||
|---|---|---|---|---|---|---|
| 1 | 900 | 500 | 25 | 90 | 50 | |
| 2 | 910 | 510 | 22 | 120 | 40 | |
| 3 | 800 | 450 | 23 | 80 | 30 | |
| 1 | 700 | 520 | 24 | 40 | 80 | |
| … | … | … | … | … | … | … |
| 1 | 500 | 300 | 11 | 30 | 25 | |
| 2 | 550 | 310 | 9 | 50 | 20 | |
| 3 | 400 | 350 | 12 | 10 | 17 | |
| 4 | 390 | 270 | 10 | 90 | 32 |
| Stage | PV | c | |||||
|---|---|---|---|---|---|---|---|
| Recycling | 1 | 1 | 27 | 300 | 10 | 9 | 3 |
| 2 | 15 | 390 | 19 | 10 | 1 | ||
| 2 | 1 | 32 | 320 | 17 | 15 | 3 | |
| 2 | 37 | 290 | 17 | 22 | 4 | ||
| 3 | 83 | 330 | 14 | 15 | 2 | ||
| 3 | 1 | 26 | 290 | 13 | 13 | 3 | |
| 2 | 56 | 280 | 12 | 11 | 1 | ||
| 4 | 1 | 12 | 160 | 12 | 12 | 3 | |
| 2 | 57 | 590 | 12 | 17 | 4 | ||
| 3 | 37 | 470 | 12 | 8 | 1 | ||
| 4 | 66 | 510 | 18 | 6 | 2 |
| Stage | e | |||||
|---|---|---|---|---|---|---|
| End of life processing | 1 | 23 | 300 | 73 | 130 | 34 |
| 2 | 24 | 500 | 70 | 150 | 32 | |
| 3 | 25 | 100 | 68 | 200 | 19 | |
| 4 | 22 | 300 | 77 | 150 | 22 | |
| 5 | 20 | 200 | 79 | 180 | 47 |
| PV | ||||||
|---|---|---|---|---|---|---|
| 1 | 2 | 3 | 2 | 3 | ||
| 1 | ||||||
| 3 | ||||||
| 1 | ||||||
| 1 | 2 | |||||
| 2 | ||||||
| 1 | ||||||
| 2 | ||||||
| 1 | ||||||
| 1 | 2 | |||||
| 1 | ||||||
| 1 | ||||||
| 2 | ||||||
| 1 | ||||||
| 2 | 1 | 3 | 3 | |||
| 2 | ||||||
| 2 | ||||||
| 2 | ||||||
| 1 | ||||||
| 2 | 2 | |||||
| 2 | ||||||
| 2 | ||||||
| 1 | ||||||
| 2 | ||||||
| 1 | ||||||
| 2 | 2 | |||||
| 3 | ||||||
| 1 | ||||||
| 2 | ||||||
| 1 | ||||||
| 2 | ||||||
| 3 | 1 | 3 | 2 | |||
| 1 | ||||||
| 3 | ||||||
| 1 | ||||||
| 2 | ||||||
| 1 | ||||||
| 1 | 2 | |||||
| 2 | ||||||
| 1 | ||||||
| 2 | ||||||
| 2 | ||||||
| 1 | ||||||
| 2 | 2 | |||||
| 3 | ||||||
| 2 | ||||||
| 1 | ||||||
| 2 |
| Approach | (J, R) | J = 2; R = 2 | J = 2; R = 3 | J = 2; R = 4 | J = 3; R = 2 | J = 3; R = 3 | J = 3; R = 4 |
|---|---|---|---|---|---|---|---|
| HJO | U/C (×10−1) | 4.1 | 3.8 | 4.6 | 4.9 | 5.1 | 4.6 |
| Index (×1019) | 4.9 | 4.8 | 4.8 | 4.9 | 4.7 | 4.7 | |
| NS-HJO | U/C (×101) | 1.8 | 1.6 | 1.5 | 2.0 | 1.9 | 1.8 |
| Index (×106) | 1.5 | 1.4 | 1.4 | 1.5 | 1.5 | 1.4 | |
| IOM | U/C (×10−1) | 4.0 | 3.7 | 4.2 | 4.7 | 4.9 | 4.4 |
| Index (×1019) | 4.8 | 4.7 | 4.5 | 4.6 | 4.8 | 4.6 | |
| TSM | U/C (×10−1) | 3.6 | 3.5 | 4.1 | 4.6 | 4.7 | 4.4 |
| Index (×1019) | 4.9 | 4.8 | 4.5 | 4.5 | 4.8 | 4.9 |
Disclaimer/Publisher’s Note: The statements, opinions and data contained in all publications are solely those of the individual author(s) and contributor(s) and not of MDPI and/or the editor(s). MDPI and/or the editor(s) disclaim responsibility for any injury to people or property resulting from any ideas, methods, instructions or products referred to in the content. |
© 2024 by the authors. Licensee MDPI, Basel, Switzerland. This article is an open access article distributed under the terms and conditions of the Creative Commons Attribution (CC BY) license (https://creativecommons.org/licenses/by/4.0/).
Share and Cite
Ma, Y.; Chen, X.; Ma, S. Optimal Sustainable Manufacturing for Product Family Architecture in Intelligent Manufacturing: A Hierarchical Joint Optimization Approach. Sustainability 2024, 16, 2727. https://doi.org/10.3390/su16072727
Ma Y, Chen X, Ma S. Optimal Sustainable Manufacturing for Product Family Architecture in Intelligent Manufacturing: A Hierarchical Joint Optimization Approach. Sustainability. 2024; 16(7):2727. https://doi.org/10.3390/su16072727
Chicago/Turabian StyleMa, Yujie, Xueer Chen, and Shuang Ma. 2024. "Optimal Sustainable Manufacturing for Product Family Architecture in Intelligent Manufacturing: A Hierarchical Joint Optimization Approach" Sustainability 16, no. 7: 2727. https://doi.org/10.3390/su16072727
APA StyleMa, Y., Chen, X., & Ma, S. (2024). Optimal Sustainable Manufacturing for Product Family Architecture in Intelligent Manufacturing: A Hierarchical Joint Optimization Approach. Sustainability, 16(7), 2727. https://doi.org/10.3390/su16072727