
Leisure and Happiness of the Elderly: A Machine Learning Approach


Abstract
:1. Introduction
2. Literature Review
2.1. Concept of Happiness and Factors Affecting Happiness
2.2. Leisure and Happiness of the Elderly
2.3. Leisure Factors Affecting the Happiness of the Elderly
3. Research Methods
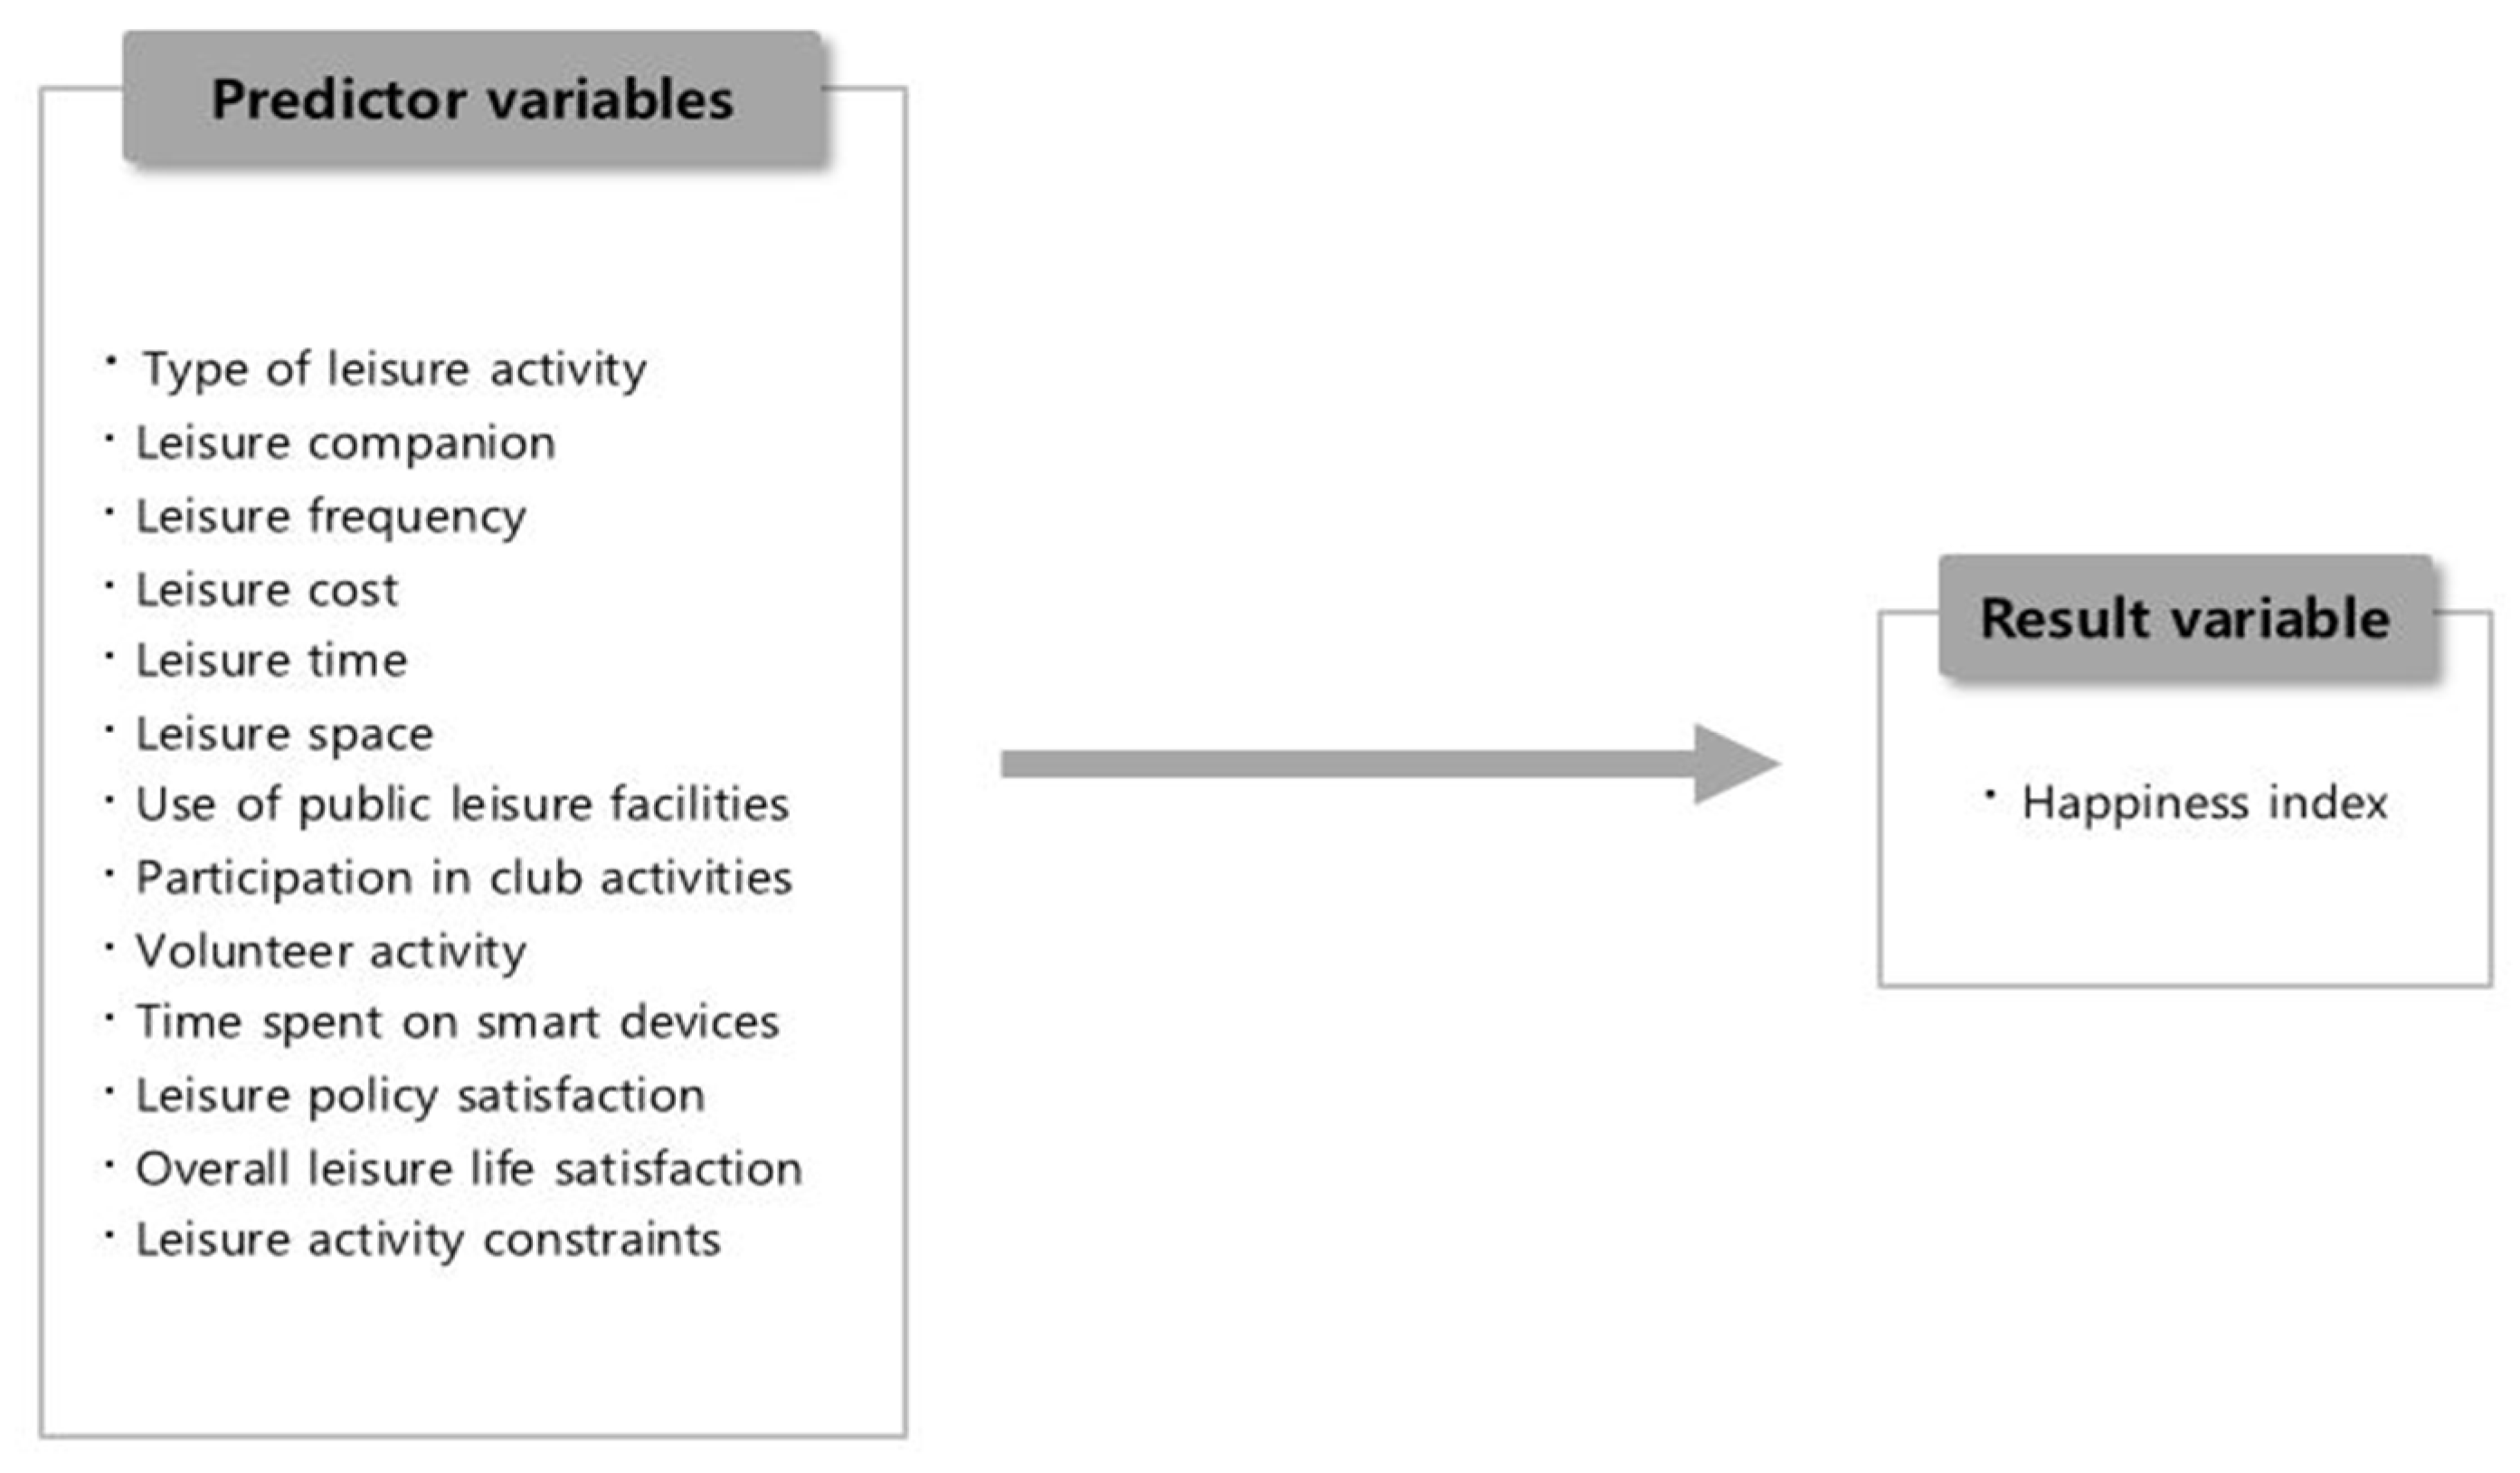
3.1. Research Model
3.2. Data Analysis and Target Population
- Survey structure
- -
- Survey agency: Ministry of Culture, Sports and Tourism
- -
- Survey subject: Population over 15 years old nationwide
- -
- Number of valid respondents: 10,060
- -
- Survey period: 9 September 2019–14 November 2019
- -
- Survey method: Household visit interviews in which a professional surveyor visits a sample of households and fills in the responses to the questionnaire
- -
- Legal basis: Statistics of approval designated by the National Statistics Agency (approval number: No. 113014)
- Sampling design
- -
- Target population: Population over 15 years old nationwide
- -
- Survey population: Members of households over the age of 15 who reside in all households in Korea at the time of the survey
- -
- Sampling frame: Use of data from the National Statistics Office’s ‘2017 Census’ survey
- -
- Stratification: A total of 17 cities and provinces are stratified into urban cities and rural areas which divided into dong (i.e., towns) and eup/myeon (i.e., villages), reflecting the characteristics of urban and rural areas.
- -
- Sampling method: Stratified Multi-Stage Cluster Sampling
- -
- Sample allocation and extraction method: Random extraction after allocation by square root proportional distribution in consideration of the number of households in the trial by the precision and adequacy of the sample, etc.
- Weighting
3.3. Analytic Variables
3.3.1. Result Variable
3.3.2. Predictor Variables
3.4. Analysis Method
3.4.1. Data Preprocessing
One-Hot Encoding
Data Scaling
Multicollinearity
Data Partitioning
Building and Evaluating Predictive Models
Hyperparameter Optimization
Analysis Tools
4. Research Results
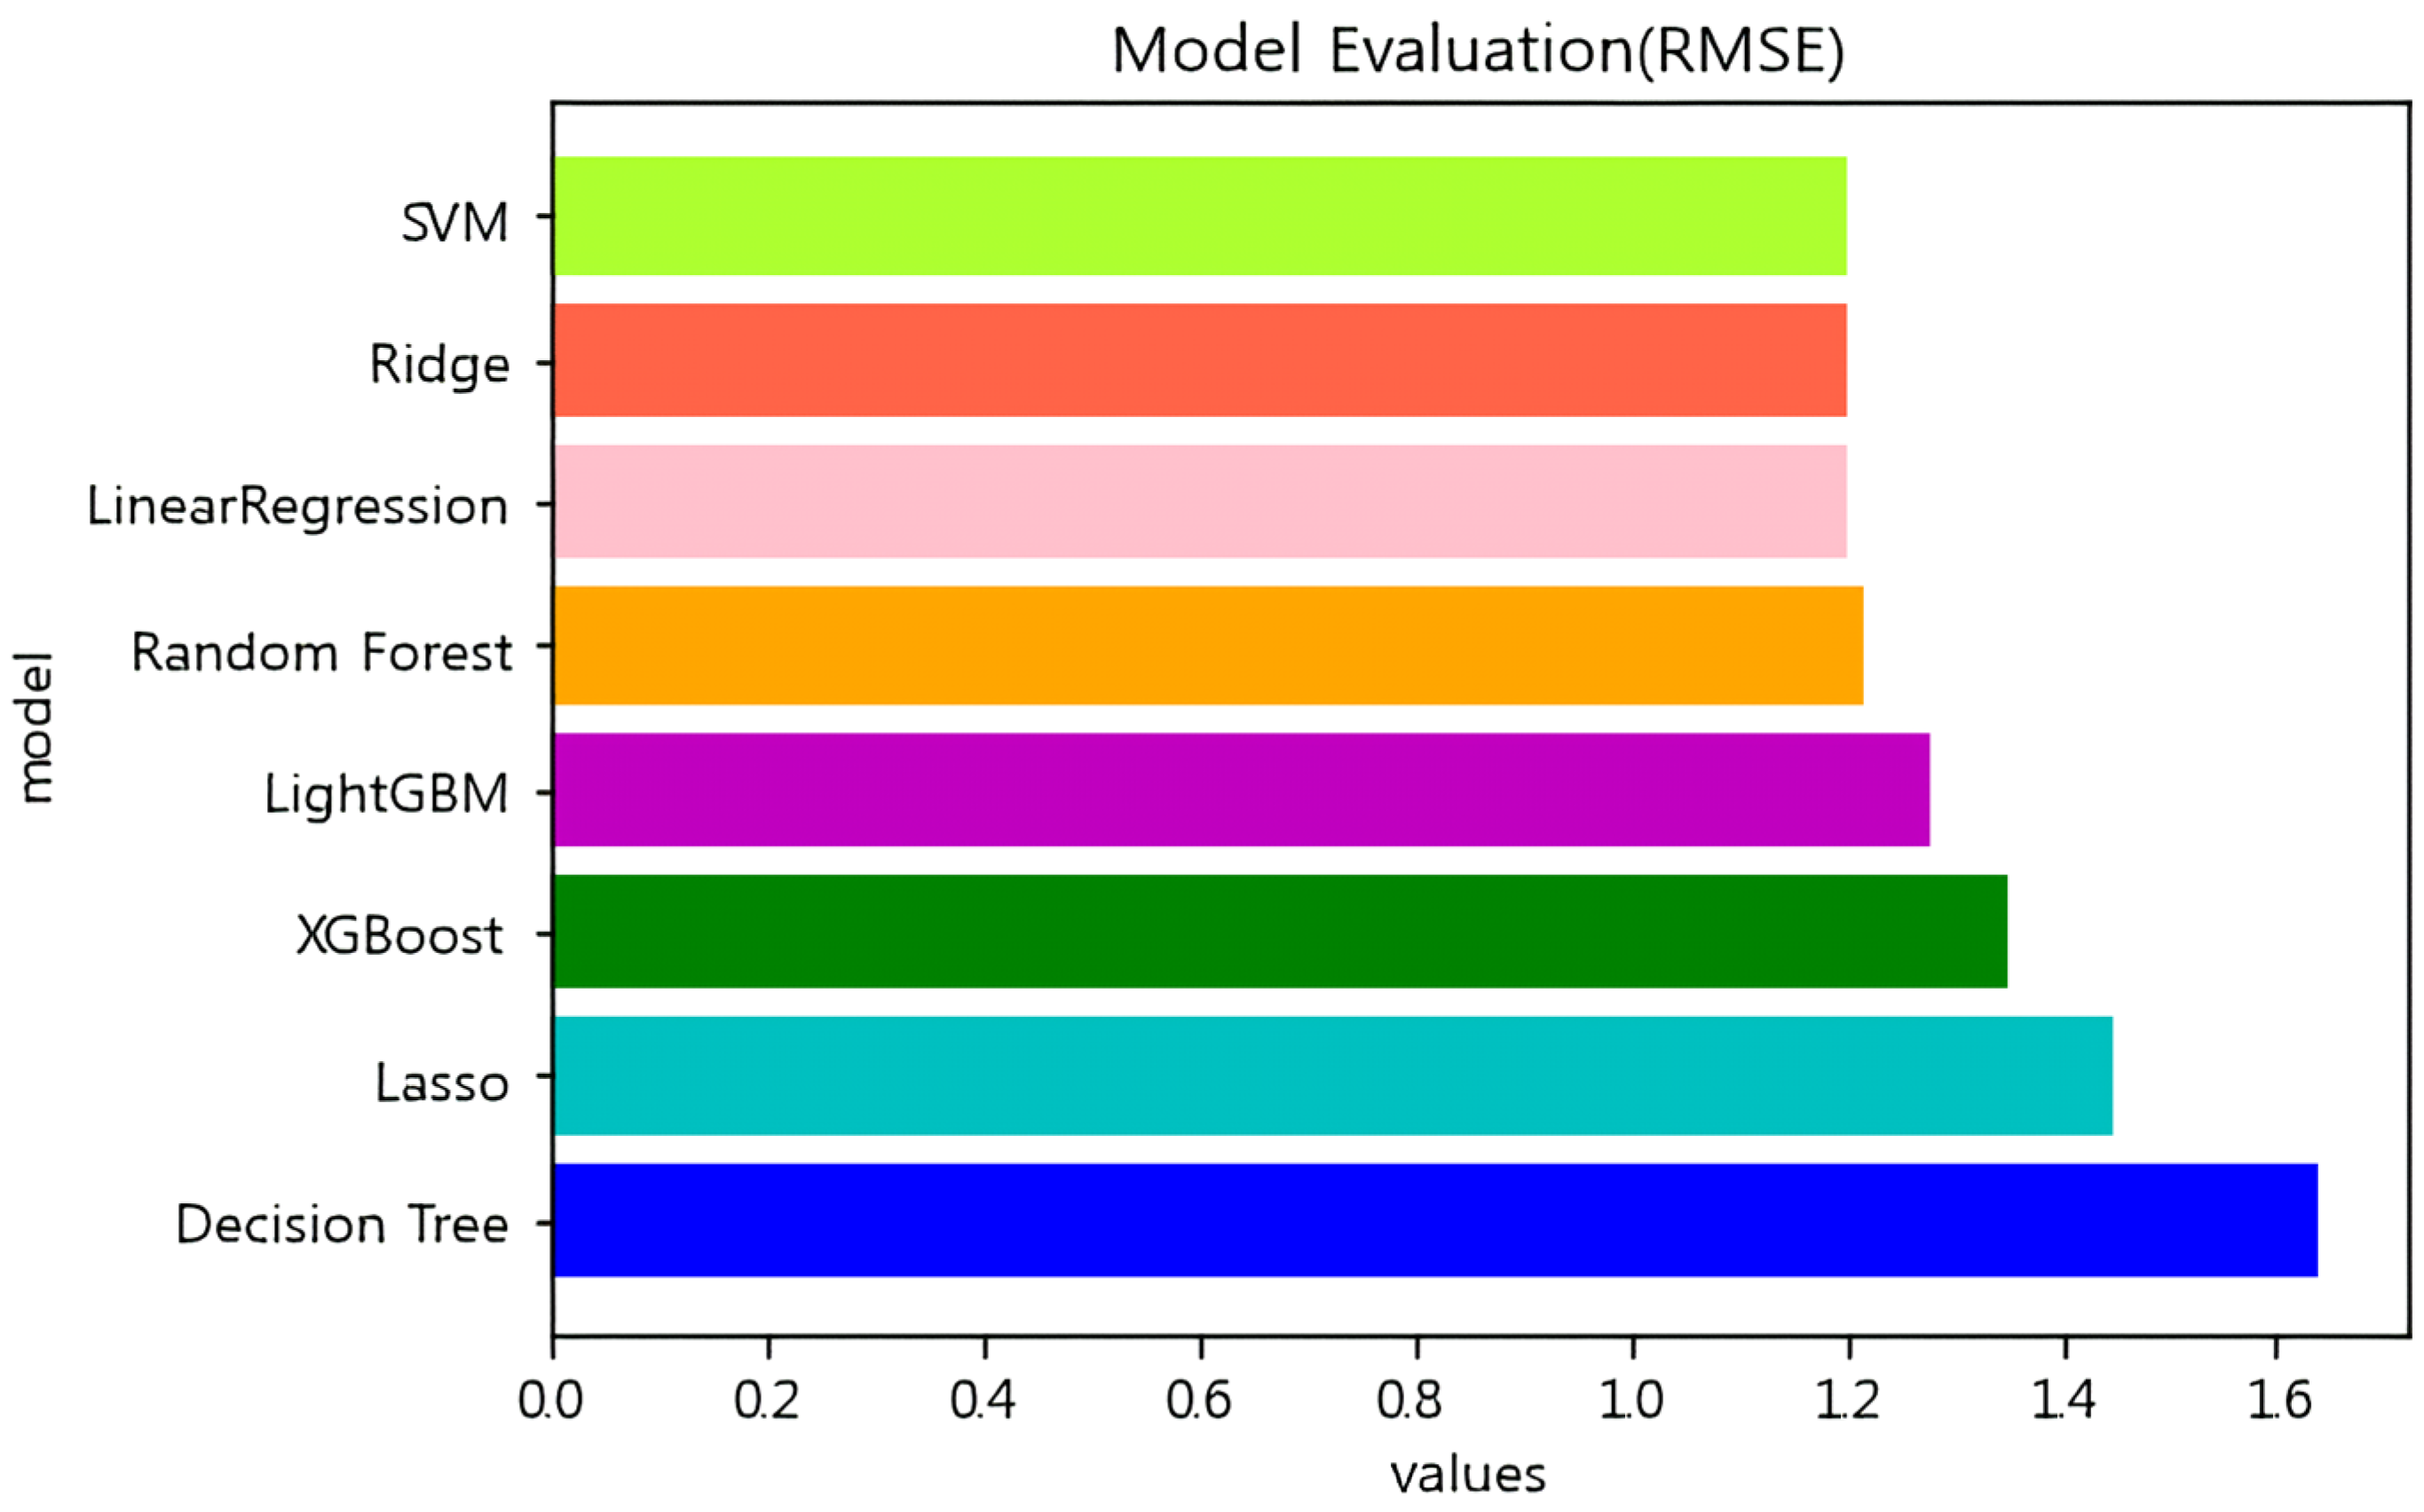
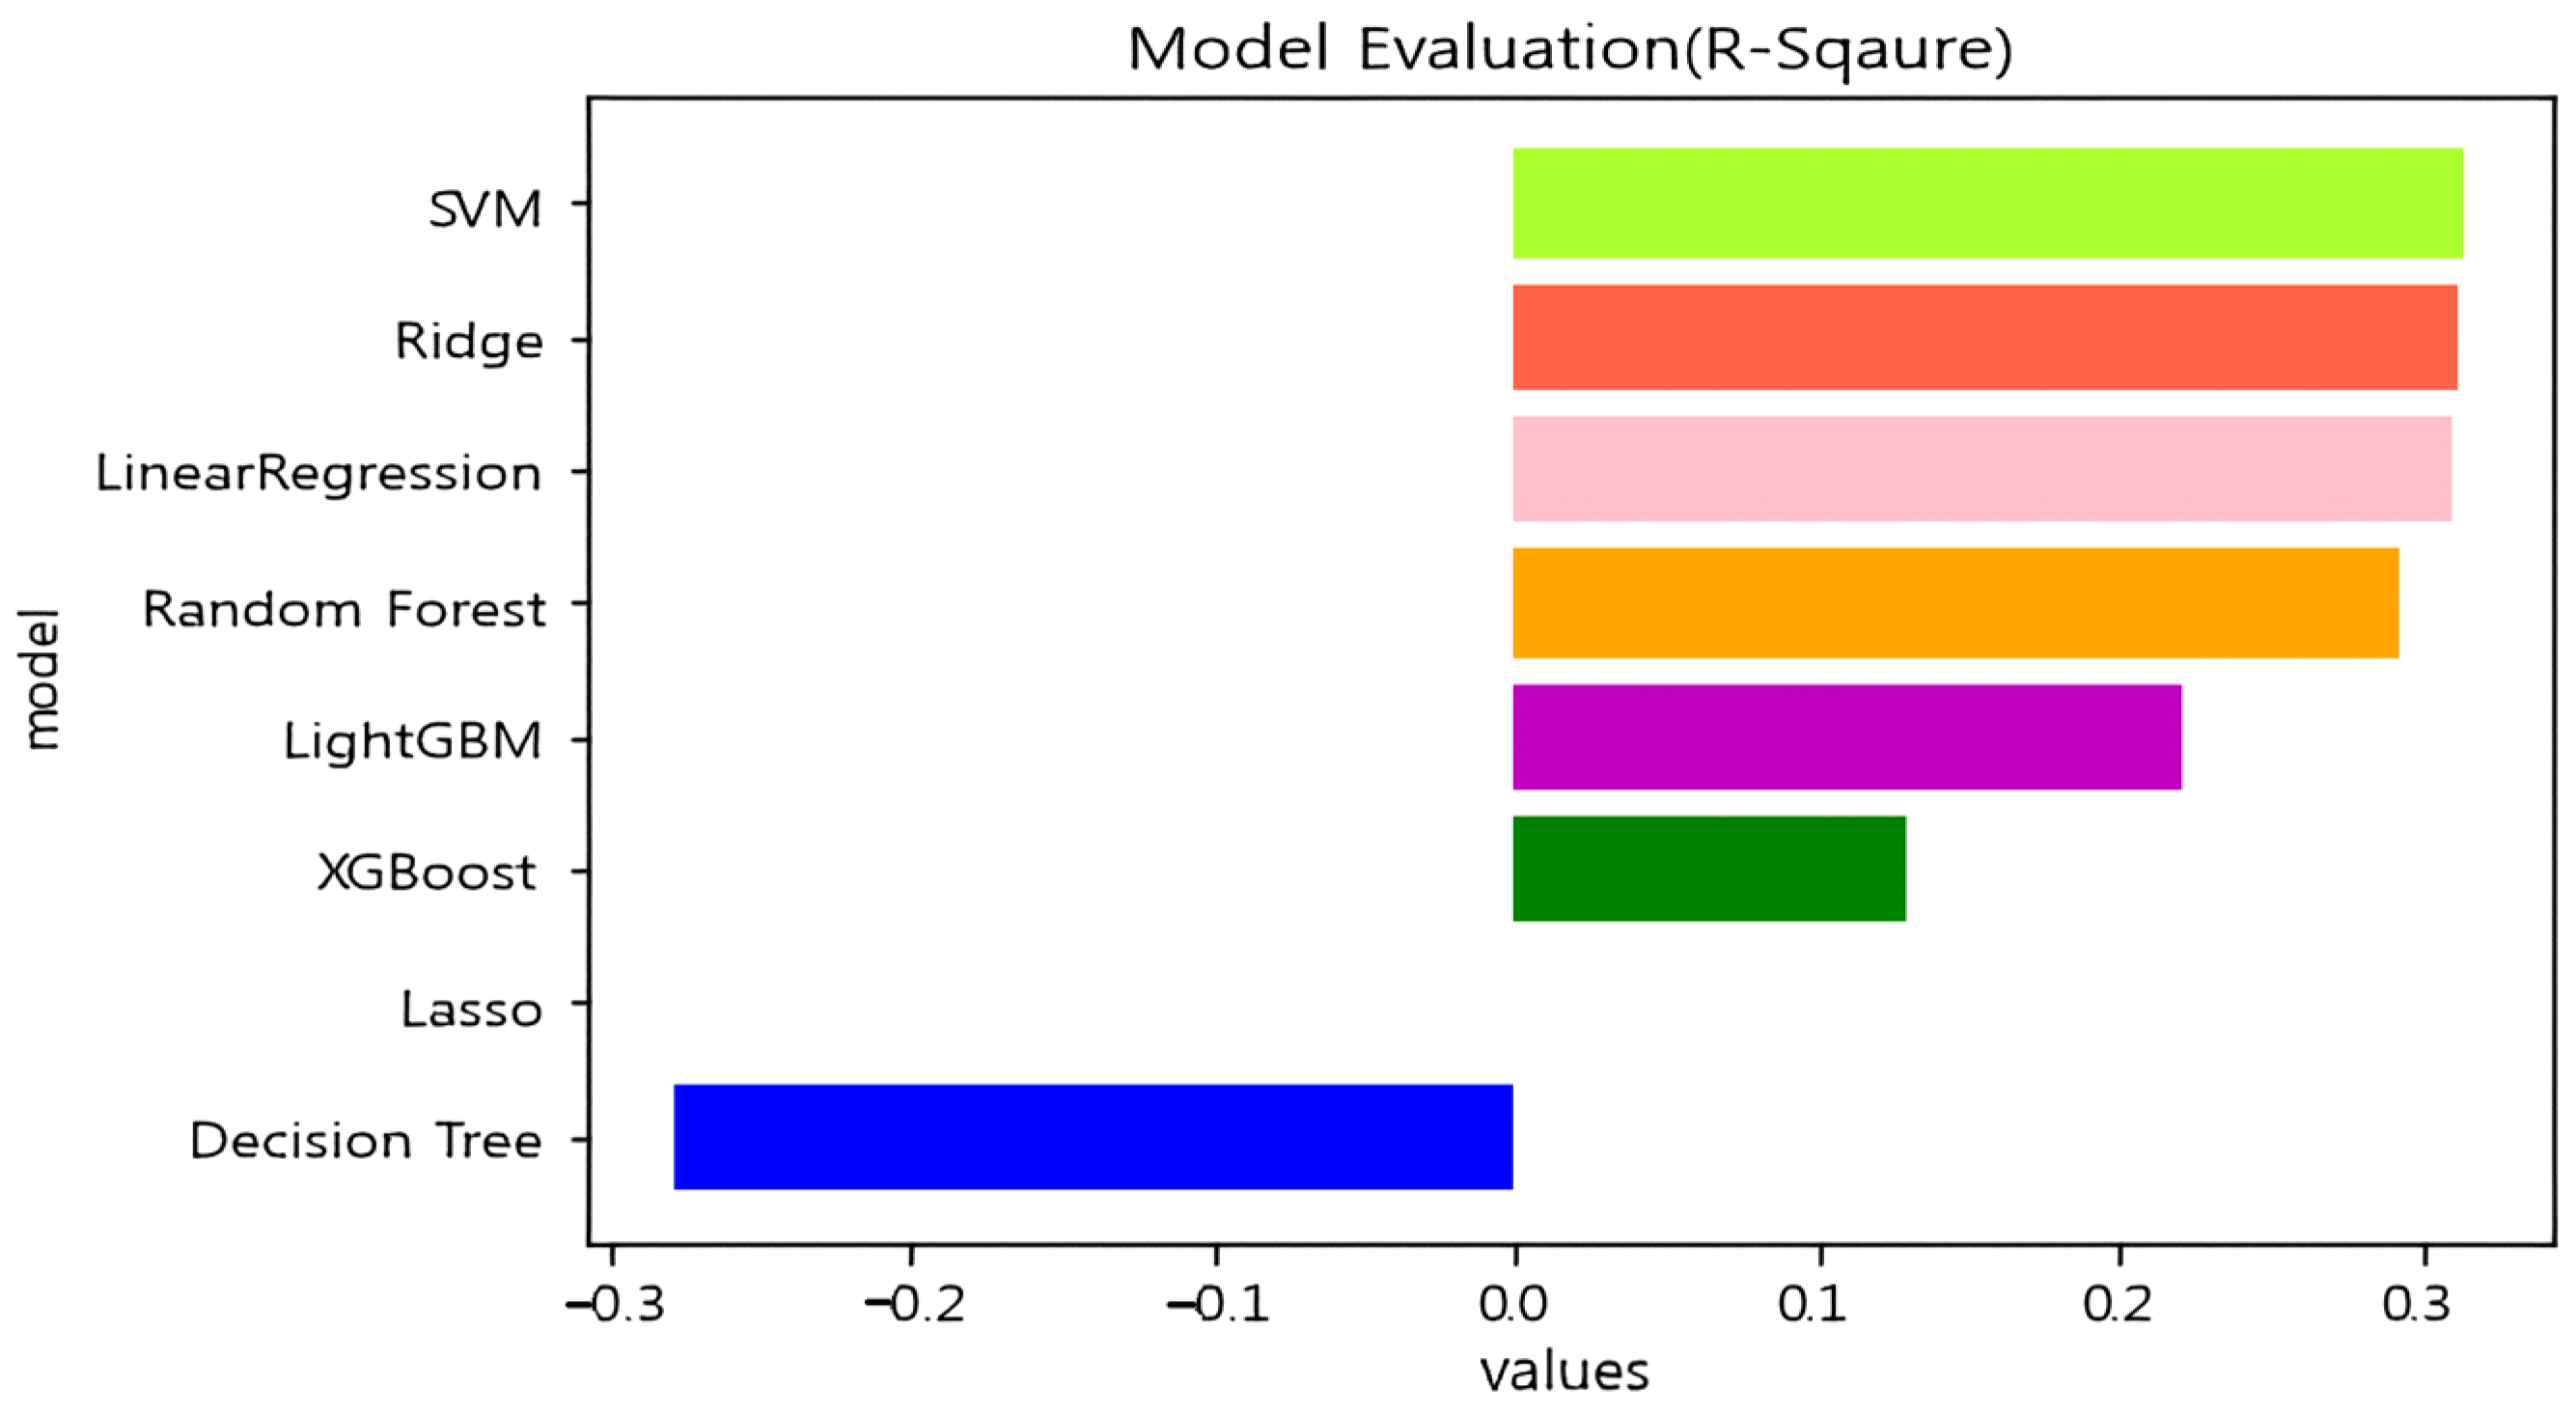
4.1. Model Performance Evaluation
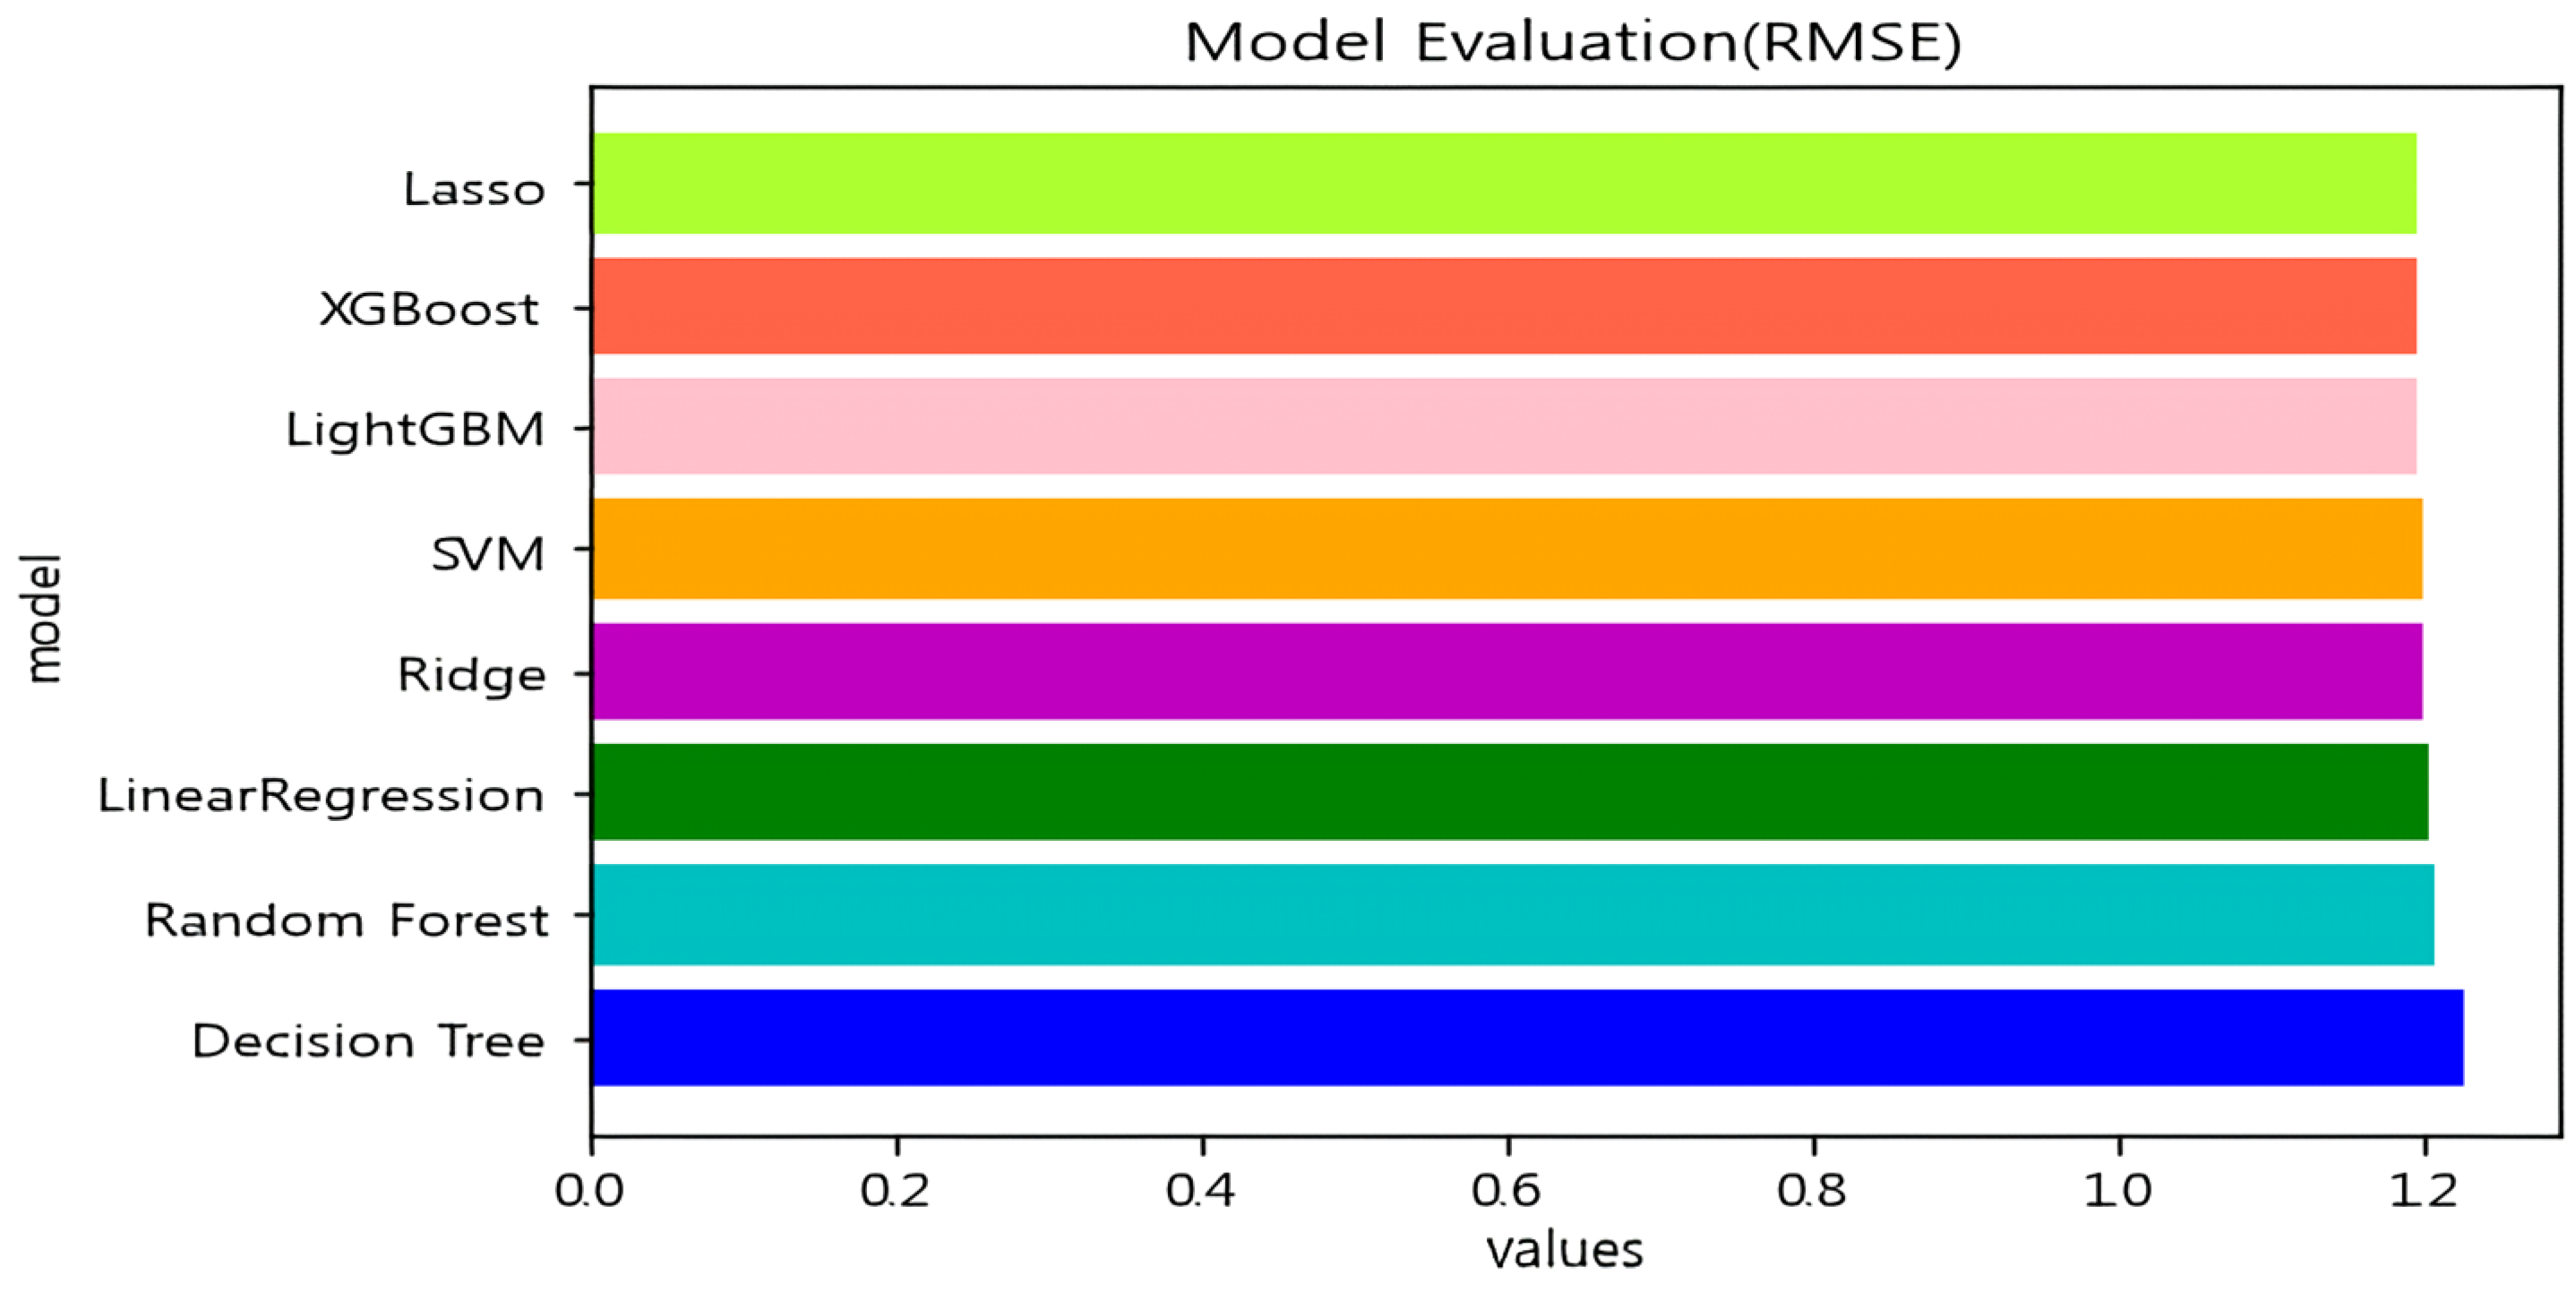
4.2. Hyperparameter Optimization
4.3. Importance of Predictor Variables
5. Discussion and Conclusions
Author Contributions
Funding
Institutional Review Board Statement
Informed Consent Statement
Data Availability Statement
Conflicts of Interest
References
- Statistics Korea. Future Population Projections. 2021. Available online: https://kostat.go.kr/portal/korea/kor_nw/1/2/6/index.board (accessed on 1 September 2022).
- United Nations. World Population Ageing 2019; UN: New York, NY, USA, 2020.
- Helliwell, J.F.; Layard, R.; Sachs, J.D.; De Neve, J.-E.; Aknin, L.B.; Wang, S. (Eds.) World Happiness Report 2022; Sustainable Development Solutions Network: New York, NY, USA, 2022.
- Kim, J.Y. Path Analysis Amongs Education level, Employment Status and Self-Esteem Effecting on the Life Satisfaction of the Elderly. Korean J. Gerontol. Soc. Welf. 2017, 72, 167–190. [Google Scholar]
- Chirinda, W.; Phaswana-Mafuya, N. Happy life expectancy and correlates of happiness among older adults in South Africa. Aging Ment. Health 2019, 23, 1000–1007. [Google Scholar] [CrossRef] [PubMed]
- Didino, D.; Taran, E.A.; Gorodetski, K.; Melikyan, Z.A.; Nikitina, S.; Gumennikov, I.; Casati, F. Exploring predictors of life satisfaction and happiness among Siberian older adults living in Tomsk Region. Eur. J. Ageing 2018, 15, 175–187. [Google Scholar] [CrossRef] [PubMed]
- Zhao, C.; Guo, J. Are veterans happy? Long-term military service and the life satisfaction of elderly individuals in China. J. Happiness Stud. 2022, 23, 477–508. [Google Scholar] [CrossRef]
- Lobos, G.; Grunert, K.G.; Bustamante, M.; Schnettler, B. With health and good food, great life! Gender differences and happiness in Chilean rural older adults. Soc. Indic. Res. 2016, 127, 865–885. [Google Scholar] [CrossRef]
- Steptoe, A. Happiness and health. Annu Rev Public Health 2019, 40, 339–359. [Google Scholar] [CrossRef] [PubMed]
- Dorji, N. Older Adults’ Happiness and Quality of Life: Spiritualism, Social Connectedness, and Health Status. In Handbook of Health and Well-Being; Springer: Singapore, 2022; pp. 437–451. [Google Scholar]
- Saber, M.; Rashedi, V.; FadakarDavarani, M.M.; Borhaninejad, V. Social Support, Happiness, and Self-Rated Health among Older Adults: A Population-Based Study. Adv. Gerontol. 2021, 11, 22–28. [Google Scholar] [CrossRef]
- Kang, M.H. The Basic Pension System and Happiness of the Elderly Women in Poverty: Focusing on the Mediating Effect of Self-Efficacy. Korean J. Converging Humanit. 2019, 7, 7–29. [Google Scholar]
- Arias-Monsalve, A.M.; Arias-Valencia, S.; Rubio-León, D.C.; Aguirre-Acevedo, D.C.; Rengifo, L.R.; Cortes JA, E.; Paredes-Arturo, Y.V. Factors Associated with Happiness in Rural Older Adults: An Exploratory Study. Int. J. Psychol. Res. 2022, 15, 70–83. [Google Scholar] [CrossRef]
- Ingrand, I.; Paccalin, M.; Liuu, E.; Gil, R.; Ingrand, P. Positive perception of aging is a key predictor of quality-of-life in aging people. PLoS ONE 2018, 13, e0204044. [Google Scholar] [CrossRef]
- Luchesi, B.M.; de Oliveira, N.A.; de Morais, D.; de Paula Pessoa, R.M.; Pavarini SC, I.; Chagas MH, N. Factors associated with happiness in the elderly persons living in the community. Arch. Gerontol. Geriatr. 2018, 74, 83–87. [Google Scholar] [CrossRef] [PubMed]
- Kaliterna Lipovčan, L.; Brkljačić, T.; Prizmić Larsen, Z.; Brajša-Žganec, A.; Franc, R. Leisure activities and the subjective well-being of older adults in Croatia. GeroPsych J. Gerontopsychol. Geriatr. Psychiatry 2018, 31, 31. [Google Scholar] [CrossRef]
- Lee, H.; Heo, S. Benefits of leisure activities for the quality of life of older South Korean adults. Leis. Stud. 2021, 40, 199–211. [Google Scholar] [CrossRef]
- Yoshida, Y.; Iwasa, H.; Ishioka, Y.; Suzukamo, Y. Leisure activity moderates the relationship between living alone and mental health among J apanese older adults. Geriatr. Gerontol. Int. 2021, 21, 421–425. [Google Scholar] [CrossRef] [PubMed]
- Jung, S.M.; Lee, Y.S. The Effect of Leisure Time and Leisure Companions on Life Satisfaction for Retired Elderly Couples: Focusing on Gender Differences. Fam. Cult. 2022, 34, 101–138. [Google Scholar]
- Mukherjee, P.; Ghosh, A.; Dasgupta, S. Role of leisure activity in quality of life and meaning in life of male and female older adults. J. Geriatr. Ment. Health 2022, 9, 4. [Google Scholar]
- Wion, R.K.; Fazeli, P.L.; Vance, D.E. The association between leisure activity engagement and health-related quality of life in middle-aged and older people with hiv. Gerontologist 2022, 62, 1018–1028. [Google Scholar] [CrossRef]
- Mito, H.; Kinjo, H. A cross-sectional study on relationships between musical activities and quality of life in Japanese older adults. Res. Stud. Music Educ. 2022, 45, 37–55. [Google Scholar] [CrossRef]
- Moon, J.; Lee, W.S.; Shim, J. Exploring Korean Middle-and Old-Aged Citizens’ Subjective Health and Quality of Life. Behav. Sci. 2022, 12, 219. [Google Scholar] [CrossRef]
- Wang, J.; Xu, J.; Nie, Y.; Zhang, X.; Li, Y.; Wu, Q. Effects of Social Participation and Its Diversity, Frequency, and Type on Depression in Middle-Aged and Older Persons: Evidence From China. Front. Psychiatry 2022, 13, 825460. [Google Scholar] [CrossRef]
- Park, S.M.; Mun, S.Y. The Effect of Participation in Social Activities on the Subjective Health Satisfaction of the Older Adults with and without Chronic Illnesses. Korean Soc. Health Serv. Manag. 2018, 12, 113–123. [Google Scholar] [CrossRef]
- Cha, M. Factors Influencing Happiness of Elderly People with Cognitive Impairment in Korea. NVEO Nat. Volatiles Essent. Oils J. 2021, 8, 5083–5096. [Google Scholar]
- Gaia, A.; Sala, E.; Cerati, C. Social networking sites use and life satisfaction: A quantitative study on older people living in Europe. Eur. Soc. 2021, 23, 98–118. [Google Scholar] [CrossRef]
- Thaithatkul, P.; Chalermpong, S.; Laosinwattana, W.; Kato, H. Mobility, Activities, and Happiness in Old Age: Case of the Elderly in Bangkok. Case Stud. Transp. Policy 2022, 10, 1462–1471. [Google Scholar] [CrossRef]
- Min, K.S. Effects of Leisure Resources on Leisure Life Satisfaction and Happiness in the Elderly:Focusing on analysis of difference by household types. Korean J. Leis. Recreat. Park 2020, 44, 45–57. [Google Scholar] [CrossRef]
- Choung, Y.; Pak, T.Y.; Chatterjee, S. Consumption and life satisfaction: The Korean evidence. Int. J. Consum. Stud. 2021, 45, 1007–1019. [Google Scholar] [CrossRef]
- Lee, M.S. The relationship among dancesports participants’ restriction on exercise, depression and ego integrity of the elderly in COVID-19. Off. J. Korean Soc. Danc. Sci. 2022, 39, 29–41. [Google Scholar]
- Chick, G.; Hsu, Y.C.; Yeh, C.K.; Hsieh, C.M. Leisure constraints, leisure satisfaction, life satisfaction, and self-rated health in six cities in Taiwan. Leis. Sci. 2015, 37, 232–251. [Google Scholar] [CrossRef]
- Kim, I.H.; Kim, C.S. “Leisure Life Satisfaction”: Will It Have a Beneficial Impact on Depression Among Older Adults in Community Care Settings in Korea? J. Prev. Med. Public Health 2022, 55, 398–406. [Google Scholar] [CrossRef]
- Kuykendall, L.; Tay, L.; Ng, V. Leisure engagement and subjective well-being: A meta-analysis. Psychol. Bull. 2015, 141, 364. [Google Scholar] [CrossRef]
- Kwon, C.M. Python Machine Learning Perfect Guide; Wikibooks: Paju, Republic of Korea, 2019. [Google Scholar]
- Géron, A. Hands-On Machine Learning with Scikit-Learn, Keras, and TensorFlow: Concepts, Tools, and Techniques to Build Intelligent Systems; O’Reilly Media, Inc.: Sebastopol, CA, USA, 2019. [Google Scholar]
- Oishi, S.; Graham, J.; Kesebir, S.; Galinha, I.C. Concepts of happiness across time and cultures. Personal. Soc. Psychol. Bull. 2013, 39, 559–577. [Google Scholar] [CrossRef] [PubMed]
- Diener, E. Subjective well-being. Psychol. Bull. 1984, 95, 542. [Google Scholar] [CrossRef]
- Veenhoven, R. Greater happiness for a greater number: Is that possible and desirable? J. Happiness Stud. 2010, 11, 605–629. [Google Scholar] [CrossRef]
- Kalmijn, W.M.; Arends, L.R. Measures of inequality: Application to happiness in nations. Soc. Indic. Res. 2010, 99, 147–162. [Google Scholar] [CrossRef] [PubMed]
- Wu, Y.; Cao, Y. Research on the influence of ecological environment satisfaction and income level on Chinese residents’ happiness: Empirical analysis based on CGSS data. Sustainability 2023, 15, 8175. [Google Scholar] [CrossRef]
- Zhu, J.; Liang, C.; Lucas, J.; Cheng, W.; Zhao, Z. The influence of income and social capital on the subjective well-being of elderly Chinese people, based on a panel survey. Sustainability 2020, 12, 4786. [Google Scholar] [CrossRef]
- Frank, R.H. Does money buy happiness. In The Science of Well-Being; Oxford University Press: Oxford, UK, 2005; pp. 461–473. [Google Scholar]
- Cheon, H. The structural relationship between exercise frequency, social health, and happiness in adolescents. Sustainability 2021, 13, 1050. [Google Scholar] [CrossRef]
- Koçak, O.; Ak, N.; Erdem, S.S.; Sinan, M.; Younis, M.Z.; Erdoğan, A. The role of family influence and academic satisfaction on career decision-making self-efficacy and happiness. Int. J. Environ. Res. Public Health 2021, 18, 5919. [Google Scholar] [CrossRef]
- Layard, R. Happiness: Lessons From a New Science; Penguin Press: London, UK, 2005. [Google Scholar]
- Zhu, S.; Li, M.; Zhong, R.; Coyte, P.C. The effects of co-residence on the subjective well-being of older Chinese parents. Sustainability 2019, 11, 2090. [Google Scholar] [CrossRef]
- Frey, B.S.; Stutzer, A. What can economists learn from happiness research? J. Econ. Lit. 2002, 40, 402–435. [Google Scholar] [CrossRef]
- Leyden, K.M.; Goldberg, A.; Michelbach, P. Understanding the pursuit of happiness in ten major cities. Urban Aff. Rev. 2011, 47, 861–888. [Google Scholar] [CrossRef]
- Helliwell, J.F.; Putnam, R.D. A well-being manifesto for a flourishing society. In The Science of Well-Being; Oxford University Press: Oxford, UK, 2005; pp. 435–460. [Google Scholar]
- Putnam, R.D. Bowling alone: The collapse and revival of American community. J. Cathol. Educ. 2000, 6, 12. [Google Scholar]
- Liang, C.; Sun, J. A study of the happiness of chinese university students and Its influencing factors—A case study of Beijing universities. Sustainability 2022, 14, 16057. [Google Scholar] [CrossRef]
- Haar, J.; Schmitz, A.; Di Fabio, A.; Daellenbach, U. The role of relationships at work and happiness: A moderated moderated mediation study of New Zealand managers. Sustainability 2019, 11, 3443. [Google Scholar] [CrossRef]
- Li, Q.; An, L. Corruption takes away happiness: Evidence from a cross-national study. J. Happiness Stud. 2020, 21, 485–504. [Google Scholar] [CrossRef]
- Chen, Q.; Chou, C.Y.; Chen, C.C.; Lin, J.W.; Hsu, C.H. The effect of leisure involvement and leisure satisfaction on the well-being of pickleball players. Sustainability 2021, 14, 152. [Google Scholar] [CrossRef]
- Sanagustín-Fons, M.V.; Tobar-Pesántez, L.B.; Ravina-Ripoll, R. Happiness and cultural tourism: The perspective of civil participation. Sustainability 2020, 12, 3465. [Google Scholar] [CrossRef]
- Kim, J.; Yamada, N.; Heo, J.; Han, A. Health benefits of serious involvement in leisure activities among older Korean adults. Int. J. Qual. Stud. Health Well-Being 2014, 9, 24616. [Google Scholar] [CrossRef]
- Urzeala, C.; Popescu, V.; Courteix, D.; Mitrache, G.; Roco, M.; Teodorescu, S. Barriers and facilitators for the Romanian older adults in enjoying physical activity health-related benefits. Sustainability 2021, 13, 12511. [Google Scholar] [CrossRef]
- Zhang, L.; Zhang, J. Impacts of leisure and tourism on the elderly’s quality of life in intimacy: A comparative study in Japan. Sustainability 2018, 10, 4861. [Google Scholar] [CrossRef]
- Kim, J.; Lee, S.; Chun, S.; Han, A.; Heo, J. The effects of leisure-time physical activity for optimism, life satisfaction, psychological well-being, and positive affect among older adults with loneliness. Ann. Leis. Res. 2017, 20, 406–415. [Google Scholar] [CrossRef]
- Lin, Y.T.; Chen, M.; Ho, C.C.; Lee, T.S. Relationships among leisure physical activity, sedentary lifestyle, physical fitness, and happiness in adults 65 years or older in Taiwan. Int. J. Environ. Res. Public Health 2020, 17, 5235. [Google Scholar] [CrossRef] [PubMed]
- Ryu, J.R. Effects of Relational Goods on Happiness of Elderly People in Korea. Korean Soc. Secur. Stud. 2017, 33, 29–57. [Google Scholar]
- Yamashita, T.; Bardo, A.R.; Liu, D. Experienced subjective well-being during physically active and passive leisure time activities among adults aged 65 years and older. Gerontologist 2018, 59, 718–726. [Google Scholar] [CrossRef] [PubMed]
- Lee, J.H.; Lee, J.H.; Park, S.H. Leisure activity participation as predictor of quality of life in Korean Urban-dwelling elderly. Occup. Ther. Int. 2014, 21, 124–132. [Google Scholar] [CrossRef] [PubMed]
- Kim, K.W.; Hwang, H.S. A Study on the Influence Factors of Happiness in single-person elderly households by Age Group of the Elderly. Korean J. Gerontol. Soc. Welf. 2021, 76, 45–70. [Google Scholar] [CrossRef]
- Kim, J.H. The Effect of Social Activities on Life Satisfaction in the Elderly Living in Jeju: A Comparison Household Types. J. Community Welf. 2021, 77, 1–31. [Google Scholar] [CrossRef]
- Lee, H.K. Volunteer activity changes after middle years old and the influences of volunteering on well-being. Innov. Aging 2019, 3, S178. [Google Scholar] [CrossRef]
- Cho, D.; Post, J.; Kim, S.K. Comparison of passive and active leisure activities and life satisfaction with aging. Geriatr. Gerontol. Int. 2018, 18, 380–386. [Google Scholar] [CrossRef]
- Gil IS GA, I.; Gil-Lacruz, L.M. Active aging and happiness: European senior citizen volunteers. Sociológia 2019, 51, 290–312. [Google Scholar]
- Ryu, J.; Heo, J. Relationships between leisure activity types and well-being in older adults. Leis. Stud. 2018, 37, 331–342. [Google Scholar] [CrossRef]
- Oerlemans, W.G.; Bakker, A.B.; Veenhoven, R. Finding the key to happy aging: A day reconstruction study of happiness. J. Gerontol. Ser. B Psychol. Sci. Soc. Sci. 2011, 66, 665–674. [Google Scholar] [CrossRef] [PubMed]
- Oh, Y.E.; Lee, J. Study on variables affecting rural elderly’s self-efficacy: Focused on mediating effect of social capital. Korean J. Community Living Sci. 2017, 28, 561–579. [Google Scholar] [CrossRef]
- Hodge, C.; Bocarro, J.N.; Henderson, K.A.; Zabriskie, R.; Parcel, T.L.; Kanters, M.A. Family leisure: An integrative review of research from select journals. J. Leis. Res. 2015, 47, 577–600. [Google Scholar] [CrossRef]
- Park, K.R. The effect of leisure activities and leisure satisfaction on subjective well-being of the pre-elderly. Korean J. Hum. Ecol. 2009, 18, 287–300. [Google Scholar] [CrossRef]
- Kim, S.H. A Study on the Difference between the Factors Affecting Happiness between the Baby Boom Generation and the Elderly Generation. J. Contents 2021, 21, 591–602. [Google Scholar] [CrossRef]
- Kim, E.K.; Ha, K.S. The Effects of Social Participation and Social Support on Quality of Life of the Elderly. J. Digit. Converg. 2013, 11, 811–820. [Google Scholar] [CrossRef]
- Park, C.J. The Factors of Leisure Affecting Happiness of the Elderly by Sex in Korea. J. Korean Gerontol. Soc. 2020, 40, 163–178. [Google Scholar] [CrossRef]
- Kwon, H.C.; Yeum, D.M.; Cho, H.C. Are the Working Elderly Happy?: Longitudinal Mediating Effect of Self-esteem. J. Humanit. Soc. Sci. 21 2020, 11, 67–76. [Google Scholar]
- Park, S.M.; Park, S.A. The Factors Associated with Depression in Pre-elderly and Young-elderly. J. Korea Acad.-Ind. Coop. Soc. 2022, 23, 519–529. [Google Scholar] [CrossRef]
- Kolosnitsyna, M.; Khorkina, N.; Dorzhiev, H. Determinants of life satisfaction in older Russians. Ageing Int. 2017, 42, 354–373. [Google Scholar] [CrossRef]
- Kim, H.Y. Happiness Inequality in Old Age. Korean J. Soc. Welf. 2020, 72, 97–123. [Google Scholar] [CrossRef]
- Park, C.J.; Shin, D.H. The Factors Affecting Happiness in Older Rural Residents. Health Soc. Welf. Rev. 2018, 38, 98–128. [Google Scholar] [CrossRef]
- Ergin, I.; Mandiracioglu, A. Demographic and socioeconomic inequalities for self-rated health and happiness in elderly: The situation for Turkey regarding World Values Survey between 1990 and 2013. Arch. Gerontol. Geriatr. 2015, 61, 224–230. [Google Scholar] [CrossRef] [PubMed]
- DeLeire, T.; Kalil, A. Does consumption buy happiness? Evidence from the United States. Int. Rev. Econ. 2010, 57, 163–176. [Google Scholar] [CrossRef]
- Cha, Y.J. Correlation between leisure activity time and life satisfaction: Based on KOSTAT time use survey data. Occup. Ther. Int. 2018, 2018, 5154819. [Google Scholar] [CrossRef] [PubMed]
- Kim, H.J.; Fredriksen-Goldsen, K.; Jung, H.H. Determinants of Physical Functioning and Health-Related Quality of Life among Sexual and Gender Minority Older Adults with Cognitive Impairment. J. Aging Health 2022, 35, 138–150. [Google Scholar] [CrossRef] [PubMed]
- Zhou, Y.; Wu, Q.; Li, C.; Ding, L. Association between community environment and depressive symptoms among Chinese middle-aged and older adults: Evidence from national longitudinal surveys from 2011 to 2018. J. Gerontol. Ser. A 2022, 77, 2265–2271. [Google Scholar] [CrossRef]
- Kim, D.; Jin, J. The impact of welfare facilities on happiness of the elderly: Evidence from Seoul, Korea. J. Plan. Educ. Res. 2019, 43, 332–345. [Google Scholar] [CrossRef]
- Park, C.J. The Factors of Leisure Affecting Happiness of the Middle-aged in Korea. Discourse Policy Soc. Sci. 2019, 12, 23–48. [Google Scholar] [CrossRef]
- Chai, X.; Kalyal, H. Cell phone use and happiness among Chinese older adults: Does rural/urban residence status matter? Res. Aging 2019, 41, 85–109. [Google Scholar] [CrossRef] [PubMed]
- Fang, Y.; Chau, A.K.; Wong, A.; Fung, H.H.; Woo, J. Information and communicative technology use enhances psychological well-being of older adults: The roles of age, social connectedness, and frailty status. Aging Ment. Health 2018, 22, 1516–1524. [Google Scholar] [CrossRef] [PubMed]
- Ractham, P.; Techatassanasoontorn, A.; Kaewkitipong, L. Old But Not Out: Social Media Use and Older Adults’ Life Satisfaction. Australas. J. Inf. Syst. 2022, 26, 1–28. [Google Scholar] [CrossRef]
- Bertocchi, F.M.; De Oliveira, A.C.; Lucchetti, G.; Lucchetti AL, G. Smartphone Use, Digital Addiction and Physical and Mental Health in Community-dwelling Older Adults: A Population-based Survey. J. Med. Syst. 2022, 46, 53. [Google Scholar] [CrossRef]
- Damant, J.; Knapp, M.; Freddolino, P.; Lombard, D. Effects of digital engagement on the quality of life of older people. Health Soc. Care Community 2017, 25, 1679–1703. [Google Scholar] [CrossRef] [PubMed]
- Lewin, K.M.; Meshi, D.; Schuster, A.M.; Cotten, S.R. Active and passive social media use are differentially related to depressive symptoms in older adults. Aging Ment. Health 2022, 27, 176–183. [Google Scholar] [CrossRef] [PubMed]
- Zhao, L. The effects of mobile social media use on older migrants’ social integration and life satisfaction: Use types and self-esteem perspective. Soc. Sci. Comput. Rev. 2021, 41, 249–264. [Google Scholar] [CrossRef]
- Nimrod, G.; Ivan, L. The dual roles technology plays in leisure: Insights from a study of grandmothers. Leis. Sci. 2022, 44, 715–732. [Google Scholar] [CrossRef]
- Kim, M.Y. The Influence of Serious Leisure on the Ego-Integrity among older Adults and the Moderating Effect of Leisure Constraints. Korean J. Gerontol. Soc. Welf. 2018, 73, 87–113. [Google Scholar]
- Argan, M.; Argan, M.T.; Dursun, M.T. Examining relationships among well-being, leisure satisfaction, life satisfaction, and happiness. Int. J. Med. Res. Health Sci. 2018, 7, 49–59. [Google Scholar]
- Liu, H.; Chen, X.; Zhang, H. Leisure satisfaction and happiness: The moderating role of religion. Leis. Stud. 2021, 40, 212–226. [Google Scholar] [CrossRef]
- Tokay Argan, M.; Mersin, S. Life satisfaction, life quality, and leisure satisfaction in health professionals. Perspect. Psychiatr. Care 2021, 57, 660–666. [Google Scholar] [CrossRef] [PubMed]
- Ministry of Culture, Sports and Tourism. 2019 National Leisure Activity Survey. Available online: https://www.mcst.go.kr/kor/s_policy/dept/deptView.jsp?pSeq=1770&pDataCD=0406000000&pType=08 (accessed on 1 September 2022).
- Ministry of Culture, Sports and Tourism. 2020 National Leisure Activity Survey. Available online: https://www.mcst.go.kr/kor/s_policy/dept/deptView.jsp?pSeq=1830&pDataCD=0406000000&pType= (accessed on 1 September 2022).
- Chicco, D.; Warrens, M.J.; Jurman, G. The coefficient of determination R-squared is more informative than SMAPE, MAE, MAPE, MSE and RMSE in regression analysis evaluation. PeerJ Comput. Sci. 2021, 7, e623. [Google Scholar] [CrossRef] [PubMed]
- Kim, E.J.; Kang, H.W. Exploring the Factors Influencing Happiness using Machine Learning: Focusing on Factors of Leisure. J. Leis. Stud. 2022, 20, 167–181. [Google Scholar]
- Kim, M.H.; Kim, J.H. Trends in leisure activities among Korean older adults: 7-year changes based on the Korean National Leisure Condition Survey. J. Korean Gerontol. Soc. 2020, 40, 871–894. [Google Scholar] [CrossRef]
- Lee, M.S.; Kang, H.Y.; Lee, C.W. The Relationship among Serious Leisure, Leisure Satisfaction and Quality of Life for Older Korean Adults. Korean J. Phys. Educ. 2017, 56, 503–515. [Google Scholar] [CrossRef]
- Park, K.W.; Lee, C.W.; Kim, M.J. Effect of serious leisure experience on the leisure satisfaction among senior sport games participants. J. Phys. Educ. Sport 2016, 16, 584. [Google Scholar]
- Huang, C.; Li, Y. Understanding leisure satisfaction of Chinese seniors: Human capital, family capital, and community capital. J. Chin. Sociol. 2019, 6, 5. [Google Scholar] [CrossRef]
- Dattilo, J.; Lorek, A.; Sliwinski, M.; Chen, S.T.; Hill, N. An examination of video assisted leisure education in middle-aged and older adults. J. Leis. Res. 2021, 52, 227–246. [Google Scholar] [CrossRef]
- Seon, E.A. A study on the efficient operation of leisure and welfare facilities for the elderly in the senior welfare law. Public Land Law Rev. 2014, 65, 341–359. [Google Scholar]
- Hong, S.H.; Kim, S.E. Constraints to Participation in Senior Welfare Centers: Focusing on the Difference of Regional Types. Health Soc. Welf. Rev. 2016, 36, 125–156. [Google Scholar] [CrossRef]
- Seino, S.; Kitamura, A.; Nishi, M.; Tomine, Y.; Tanaka, I.; Taniguchi, Y.; Shinkai, S. Individual-and community-level neighbor relationships and physical activity among older Japanese adults living in a metropolitan area: A cross-sectional multilevel analysis. Int. J. Behav. Nutr. Phys. Act. 2018, 15, 46. [Google Scholar] [CrossRef]
- Steptoe, A.; Shankar, A.; Demakakos, P.; Wardle, J. Social isolation, loneliness, and all-cause mortality in older men and women. Proc. Natl. Acad. Sci. USA 2013, 110, 5797–5801. [Google Scholar] [CrossRef]
- Kim, G.E.; Choi, M.J. Characteristics of Solitary Leisure in Korean Society: Focusing on Teenage Male and Elderly Male Group. J. Korea Plan. Assoc. 2019, 54, 18–29. [Google Scholar] [CrossRef]


| Variable | Variable Type | Item | Value |
|---|---|---|---|
| q2_1_n2_2 | categorical variable | Type of leisure activity in which the most participated in the past year | 1 = Cultural and artistic activity 2 = Sports activity 3 = Tourism 4 = Hobbies 5 = Rest activity 6 = Social and other activities |
| q2_2_1_1 | categorical variable | Companionship (leisure activity companion) | 1 = Alone (without a companion) 2 = Together (with a companion) |
| q2_3_1_1 | categorical variable | Frequency in leisure activities | 1 = Everyday 2 = Not everyday |
| q2_5_1 | continuous variable | Leisure cost (one-time basis) | Response value (won) |
| q9 | continuous variable | Leisure cost (monthly average) | Response value (won) |
| q13 | continuous variable | Average leisure time per day | Response value (hour) |
| q16_1 | categorical variable | The most used leisure space outside of the home | 1 = Indoor space 2 = Outdoor space |
| q19 | categorical variable | Use of public leisure facilities | 1 = Yes 2 = No |
| q22 | categorical variable | Participation in club activities | 1 = Yes 2 = No |
| q23 | categorical variable | Volunteer activity | 1 = Yes 2 = No |
| q24 | continuous variable | Time spent on smart devices during leisure time | Response value (hour) |
| q27 | continuous variable | Leisure policy satisfaction | 7-point scale 1 = Very dissatisfied 7 = Very satisfied |
| q30 | continuous variable | Overall leisure life satisfaction | 7-point scale 1 = Very dissatisfied 7 = Very satisfied |
| q35 | continuous variable | Leisure activity constraints (degree) | 7-point scale 1 = No constraints at all 7 = Very constrained |
| Variable | Baseline Variables |
|---|---|
| q2_1_n2_2 | Rest activity |
| q2_2_1_1 | Alone |
| q2_3_1_1 | Everyday |
| q16_1 | Indoor space |
| q19 | Yes |
| q22 | Yes |
| q23 | Yes |
| Model | RMSE | R2 |
|---|---|---|
| Linear Regression | 1.202 | 0.311 |
| Ridge | 1.201 | 0.312 |
| Lasso | 1.449 | 0.000 |
| SVM | 1.200 | 0.314 |
| Decision Tree | 1.638 | −0.278 |
| Random Forest | 1.217 | 0.294 |
| XGBoost | 1.351 | 0.130 |
| LightGBM | 1.278 | 0.222 |
| Model | Hyperparameter Optimzation | RMSE | R2 |
|---|---|---|---|
| Linear Regression | - | 1.202 | 0.311 |
| Ridge | alpha = 50 | 1.198 | 0.316 |
| Lasso | alpha = 0.01 | 1.195 | 0.319 |
| SVM | kernel = ‘linear’, C = 0.1, gamma = 0.001 | 1.198 | 0.316 |
| Decision Tree | max_depth = 3, min_samples_leaf = 45 | 1.225 | 0.284 |
| Random Forest | n_estimators = 170 | 1.207 | 0.305 |
| XGBoost | colsample_bylevel = 0.5, colsample_bytree = 0.6, gamma = 0.1, learning_rate = 0.01, max_depth = 3, min_child_weight = 5, n_estimators = 500, reg_lambda = 0.1, subsample = 0.8 | 1.195 | 0.319 |
| LightGBM | colsample_bytree = 0.3, learning_rate = 0.03, max_depth = 3, n_estimators = 300, num_leaves = 5, reg_alpha = 0.007, reg_lambda = 0.2 | 1.197 | 0.317 |
Disclaimer/Publisher’s Note: The statements, opinions and data contained in all publications are solely those of the individual author(s) and contributor(s) and not of MDPI and/or the editor(s). MDPI and/or the editor(s) disclaim responsibility for any injury to people or property resulting from any ideas, methods, instructions or products referred to in the content. |
© 2024 by the authors. Licensee MDPI, Basel, Switzerland. This article is an open access article distributed under the terms and conditions of the Creative Commons Attribution (CC BY) license (https://creativecommons.org/licenses/by/4.0/).
Share and Cite
Kim, E.-J.; Kang, H.-W.; Park, S.-M. Leisure and Happiness of the Elderly: A Machine Learning Approach. Sustainability 2024, 16, 2730. https://doi.org/10.3390/su16072730
Kim E-J, Kang H-W, Park S-M. Leisure and Happiness of the Elderly: A Machine Learning Approach. Sustainability. 2024; 16(7):2730. https://doi.org/10.3390/su16072730
Chicago/Turabian StyleKim, Eui-Jae, Hyun-Wook Kang, and Seong-Man Park. 2024. "Leisure and Happiness of the Elderly: A Machine Learning Approach" Sustainability 16, no. 7: 2730. https://doi.org/10.3390/su16072730