Abstract
Biofuels’ induced land-use change (ILUC) emissions have been widely studied over the past 15 years. Many studies have addressed uncertainties associated with these estimates. These studies have broadly examined uncertainties associated with the choice of economic models, their assumptions and parameters, and a few bio-physical variables. However, uncertainties in land-use emission factors that represent the soil and vegetation carbon contents of various land types across the world and are used to estimate carbon fluxes due to land conversions are mostly overlooked. This paper calls attention to this important omission. It highlights some important sources of uncertainty in land-use emissions factors, explores the range in these factors from established data sources, and compares the influence of their variability on ILUC emissions for several sustainable aviation fuel (SAF) pathways. The estimated land-use changes for each pathway are taken from a well-known computable general equilibrium model, GTAP-BIO. Two well-known carbon calculator models (CCLUB and AEZ-EF) that represent two different sets of emissions factors are used to convert the GTAP-BIO estimated land-use changes to ILUC emissions. The results show that the calculated ILUC emissions obtained from these carbon calculators for each examined SAF pathway are largely different, even for the same amortization time horizon. For example, the ILUC emissions values obtained from the AEZ-EF and CCLUB models for producing jet fuel from corn ethanol for a 25-year amortization period are 24.9 gCO2e/MJ and 15.96 gCO2e/MJ, respectively. This represents a 60% difference between the results of these two carbon calculators for the same set of land-use changes. The results show larger differences for other pathways as well.
1. Introduction
Since the late 2000s, many papers have estimated greenhouse gas (GHG) emissions of biofuels’ induced land-use change (ILUC). To accomplish this task, as described by the Committee on Current Methods for Life Cycle Analyses of Low-Carbon Transportation Fuels in the United States [1], the examined studies for the calculation of ILUC emissions followed a similar approach consisting of two sequential phases: (i) using an economic model to project regional land-use changes for the biofuel under study, and (ii) implementing a set of land-use emission factors (LUEFs) combined with some supporting assumptions to convert the projected land-use changes to GHG emissions. In general, the LUEFs estimate the soil and vegetation carbon content of land and are used to quantify emissions from different types of land conversions.
The existing literature has frequently noted that the estimated ILUC emissions values are uncertain [1,2,3,4,5,6,7,8]. The variations in modeling approach and structure, modeling assumptions and data, and implemented economic parameters are identified as the main sources of uncertainties in ILUC emissions values. However, only a few papers have studied uncertainties in LUEFs and their associated assumptions. Plevin et al. [6] conducted a sensitivity assessment combining the GTAP-BIO model with an agro-ecological zone emission factor (AEZ-EF) model [9,10] and concluded that the estimated ILUC emissions values are more sensitive to the changes in economic parameters than the changes in LUEFs. However, by using only one source for LUEFs, the authors’ sensitivity assessment did not account for variability in background data or modeling assumptions behind the LUEFs. Leland et al. [7] performed a similar sensitivity assessment focusing on the impacts of four selected AEZ-EF input parameters on ILUC emission. In a related perspective, Taheripour and Tyner [4] examined the influence of different sets of LUEFs in combination with the estimated land-use changes for various biofuel pathways obtained from the GTAP-BIO model and concluded that the estimated ILUC emissions value of each pathway vary significantly with changes in the implemented LUEFs obtained from alternative sources.
In another study, Chen et al. [8] compared the estimated land-use changes for several biodiesel pathways obtained from the GTAP-BIO model using two different set of emission factors, including the Carbon Calculator for Land-Use and Land Management Change from Biofuels Production (CCLUB) [11] and AEZ-EF models. The authors showed that the ILUC emissions value of each pathway vary significantly with the implemented LUEFs used in these emission accounting models. In particular, they showed that the selected LUEFs for marginal cropland could largely alter the estimated ILUC emissions values. The findings of these studies demonstrate that the role of LUEFs in assessing ILUC emissions values is an important gap in land-use change research that has not been adequately evaluated.
This paper aims to fill this knowledge gap with two different but related research activities. The first evaluates the available sources of information on vegetation and soil carbon datasets that have been used in developing LUEFs to understand their similarities and differences across various land types and ecological conditions. The second applies the two emission accounting models mentioned above (AEZ-EF and CCLUB) to estimated land-use changes obtained from an advanced version of the GTAP-BIO model for eight Sustainable Aviation Fuel (SAF) pathways to examine the sensitivity of the ILUC emissions values to the changes in the LUEFs embedded in these accounting models. The eight selected SAF pathways represent those pathways that could be deployed in the US. These research activities significantly contribute to the debates on uncertainties in ILUC emissions values by highlighting how differences in the data source and LUEF modeling approach affect ILUC emissions values.
The article is organized as follows. The Materials and Methods section explains how ILUC emissions have been calculated and introduces the data sources that are often used to estimate LUEFs and their components. This section also outlines the main features of the GTAP-BIO model, which is frequently applied to estimate ILUC emissions. The section ends with a presentation of methods used in the present study to calculate ILUC emissions for a set of eight biofuel aviation pathways with two different set of LUEFs to highlight the importance of uncertainties in these factors. The results section includes a presentation of the wide ranges of LUEFs obtained from different datasets, a review of the causes of differences between LUEF datasets, and highlights the influence of these differences on a case study of ILUC emissions for the eight aviation biofuel pathways. We conclude the article with a short discussion emphasizing the importance of uncertainties in LUEFs and the ways that this line of uncertainty should be addressed by future research.
2. Materials and Methods
2.1. Common Approach in Calcualting ILUC Emissions
As noted in the Introduction, two sets of data are required to calculate ILUC emissions from a biofuel pathway: (i) estimated land-use changes due to an increase in consumption/production of the selected biofuel, and (ii) a set of LUEFs for the relevant land-use transitions. In general, regardless of differences across modeling practices, the following stylized formula has been implemented to calculate an ILUC emissions value for a given pathway (Zhao et al. [12]):
In this formula, the index i represents the list of all types of land transitions (e.g., forest to cropland, forest to pasture, etc.), the index k shows spatial resolution (which could represent the national level, agro-ecological level, grid cell, or any other geographical resolution) within each country, and the index r indicates countries. The variables , , T, and E are land conversions in hectares, land-use emission factors measured in gCO2e per hectare, amortization time horizon in years, and annual energy produced by the pathway under study measured in megajoules (MJ), respectively. Therefore, an ILUC emissions value estimates emissions in gCO2e/MJ.
Hence, one needs to determine , , T, and E in calculating ILUC emissions values. The last two variables of this list are usually predetermined by the accounting system and fuel type, respectively. However, the first two variables are unknown and must be estimated, simulated, or measured. A sizeable expansion in production or consumption of a biofuel pathway that uses agricultural feedstocks (e.g., corn, soybeans, or perennial grasses) could induce land-use changes directly or indirectly at the local, national, and international levels (Hertel et al. [13]. The size, location, and type of land-use changes (i.e., ) could vary based on the characteristics of the pathway under consideration and on many economic and biophysical variables. Unfortunately, land-use changes are not directly observable or measurable. Economic models have been used to estimate land-use changes. In this paper, we use the results of a well-known computable general equilibrium (CGE) model, GTAP-BIO, which has been widely used in this field of research to assess land-use changes for various biofuel pathways.
2.2. Components and Sources of LUEFs
In calculating ILUC emissions values, one needs to determine the variable for the i, k, and r indices, which is not a trivial task. In principle, this variable should capture all types of carbon fluxes associated with each type of land conversion. These fluxes are driven by changes in biological and mineral carbon pools, including soil organic carbon, carbon stock in above- and belowground live biomass, and dead organic matter and litter. Additionally, some carbon accounting frameworks include forgone carbon sequestration, emissions due to biomass burning through land clearing, and non-CO2 emissions associated with the land use, land-use change, and forestry (LULUCF). Because of differences in background data and the included categories of emissions, alternative data sources provide widely varying estimates of for the same land-use transition and location.
Several foundational data sources in this field include the Harmonized World Soil Database (HWSD) [14], IPCC [15,16], Winrock [17], and Woods Hole [18] datasets of carbon in soil and vegetation. Terrestrial-biogeochemical models such as Century [19,20], Daycent [21], TEM [22], and ISAM [23] have also been widely used to estimate the core components of LUEFs. Additional sources for critical background data on terrestrial carbon pools and associated GHG emissions during land-use transitions include individual studies such as Gibbs et al. [24], Saatchi et al. [25], and Batjes [26].
In addition to the required data on soil and vegetation carbon stocks, depending on the case under study, one may need additional information or use certain assumptions to mix and match and variables. One may follow different approaches and assumptions to facilitate this process, which can cause significant variations in the resulting ILUC emissions values. The following three examples represent different approaches that the AEZ-EF and CCLUB models use to match the GTAP-BIO estimated land-use changes with their emission factors. Example 1: The GTAP-BIO model projects conversion of “cropland pasture” (a category of marginal land) to crop production due to biofuel shocks. In an ad hoc manner, the AEZ-EF model assumes that the soil carbon content for this type of land in each AEZ region is half of that of pasture land. On the other hand, the CCLUB model relies on a terrestrial-biogeochemical model (Century) to evaluate carbon content for this type of land by AEZ. Example 2: The AEZ-EF uses some assumptions and extends the original GTAP-BIO land conversions beyond the land conversions that this CGE model provides to match the land conversions with its emissions factors. For instance, the AEZ-EF model includes emission factors for converting forest or pasture to sugarcane. The GTAP-BIO model does not determine these land conversions. However, the AEZ-EF model uses some assumptions and determines these land conversions. The CCLUB model only uses the original GTAP-BIO land conversions. Example 3: The AEZ-EF uses some assumptions and assigns a portion of converted forest to cropland as forest on peat land, while the CCLUB uses more recent data with a different assumed portion of converted forest to cropland as forest on peat land.
Because the results of the GTAP-BIO model are used in this paper, we use two emissions accounting models that have been developed and used to convert the results of this model to ILUC emissions values. These two models are the AEZ-EF and CCLUB. The AEZ-EF model relies on IPCC, FAO, HWSD, and several other data sources to convert the GTAP-BIO results to ILUC emissions. This model follows the IPCC approach of using the differences in the biomass and soil organic carbon (SOC) pools between land-cover types as the emissions (or sequestration) values from land conversion.
In contrast, CCLUB provides users with Century simulated GHG emissions changes in US domestic land conversions to cropland and the option of using either the Winrock or Woods Hole data sources for international land conversions to simulate biomass and SOC changes between land-use categories over a period of time. As mentioned earlier, using the Century model, the CCLUB model also provides some assessments for the emission factors associated with the land category of “cropland pasture”. In conclusion, the AEZ-EF and CCLUB models use different sources of data on carbon pools and follow different assumptions to convert the results of the GTAP-BIO model to ILUC emissions, especially for US domestic land conversions.
To highlight uncertainties and variations in the data on , we first review four existing sets of emission factors for converting forest to cropland and pasture to cropland: AEZ-EF, TEM, Winrock, and Woods Hole. These datasets have been used in calculating ILUC values for various US biofuel pathways over the past 15 years, but are limited by their reliance on outdated data in assessing emission factors. For example, the AEZ-EF model uses the 2006 IPCC guidelines for national greenhouse gas inventories instead of the new guidelines published in 2019. To highlight the potential impacts of using outdated data, we compare changes in the reference values for SOC stocks obtained from the IPCC 2006 and 2019 guidelines.
Finally, we calculate ILUC emissions values for eight aviation biofuel pathways that can be produced in the US by using the estimated land-use changes provided by the GTAP-BIO model and CCLUB carbon accounting model and compare the results with the corresponding values that have been calculated by the Carbon Offsetting and Reduction Scheme for International Aviation (CORSIA) of the International Civil Aviation Organization (ICAO) [12] using the AEZ-EF model. The eight selected SAF pathways are introduced in the next section. In this paper, we calculate ILUC emissions values for the selected pathways using the AEZ-EF and CCLUB models to highlight their differences.
2.3. A Short Review of GTAP-BIO Model and Implemented for the Examined SAF Pathways
As mentioned above, the AEZ-EF and CCLUB emission calculators were designed to use the estimated land conversions () obtained from the GTAP-BIO model. Hence, in this paper, we use the estimated land-use changes obtained from this CGE model which has been widely used in assessing ILUC emissions values due to biofuel production and policy. This global CGE model is an advanced version of the standard GTAP model originally developed by Hertel [27]. This global macro model represents consumers and producers and simulates their behaviors in consuming and producing goods and services to determine their demands and supplies, respectively. It also includes government consumption, international trade, and investment. The standard GTAP model traces the production, consumption, and trade of all goods and services produced across the world by country. However, the standard model and its database do not represent biofuels and their by-products explicitly. The GTAP-BIO model and its database remedy this deficiency and explicitly represent supplies and uses of alternative types of biofuels that are commercially produced around the world [13,28,29,30,31,32]. These biofuels include ethanol produced from grains (e.g., corn and wheat) and sugar crops (e.g., sugarcane and sugar beet) and biodiesel produced from soy oil, rapeseed oil, palm oil, and other types of vegetable oils. Note that using oilseeds for biodiesel production generates oilseed meal and converting grains to ethanol generates distiller’s dried grains with solubles (DDGS). These by-products play an important role when assessing the system-wide land-use effects of a biofuel pathway.
In addition, the GTAP-BIO model represents land uses by the agricultural and forestry sectors and traces their changes due to changes in demands for foods and biofuels. The agricultural sectors in this model include crop producers (rice, wheat, coarse grains, soybeans, rapeseed, palm oil, other oilseeds, sugar crops, and other crops) and livestock producers (dairy farms, ruminants, and non-ruminants). The GTAP-BIO model divides the accessible land across three land-cover categories: forest, pasture/grassland, and cropland. It then allocates pasture land across livestock activities and cropland across crop producers. The model takes into account multiple cropping (producing more than one crop per year on the same cropland), allows the return of unused cropland to crop production if needed, and takes into account yield improvement due to higher crop profitability.
An advanced version of GTAP-BIO has been developed to assess potential land-use changes for pioneering biofuels that are not yet produced at the commercial level. In addition to traditional crops, this model also has the capability to simulate the production of dedicated energy crops such as miscanthus, switchgrass, and poplar. Zhao et al. [12] have used this advanced version of the GTAP-BIO model to estimate land-use changes for a wide range of SAF pathways that can be produced across the world. This study applies the estimated land-use changes provided by Zhao et al. [12] for eight SAF pathways that can be produced in the US. These pathways are: (i) jet fuel produced from soy oil using the hydro-processed ester and fatty acid technology (soy oil HEFA); (ii) jet fuel produced from corn using the iso-butanol alcohol technology (corn ATJ); (iii) jet fuel produced from corn ethanol (corn ETJ); (iv) jet fuel produced from miscanthus using the Fischer–Tropsch technology (miscanthus FTJ); (v) jet fuel produced from switchgrass using the Fischer–Tropsch technology (switchgrass FTJ); (vi) jet fuel produced from poplar using the Fischer–Tropsch technology (poplar FTJ); (vii) jet fuel produced from miscanthus using the iso-butanol alcohol technology (miscanthus ATJ); and (viii) jet fuel produced from switchgrass using the iso-butanol alcohol technology (miscanthus ATJ). The technical details regarding these pathways are provided in the CORSIA Supporting Document [33]. More details about the estimated land-use changes for these pathways are provided in Zhao et al. [12]. The estimated land-use changes for the selected SAF pathways were obtained for the given expansions in their fuel supplies as reported in Table 1.

Table 1.
Assumed expansions in supplies of the selected SAF pathways.
As shown in Table 1, in addition to jet fuel, some SAF pathways produce a conventional biofuel co-product as well. The co-product biofuels could be ethanol or biodiesel that can be used in road transportation. The biofuel co-products of the HEFA and ETJ technologies are biodiesel and diesel/gasoline, respectively. The ATJ technology produces no co-product biofuel. The total energy output for each pathway (including jet fuel and conventional biofuel) is shown in petajoules and also in billion gallons of gasoline equivalent (BGGE) in Table 1. The variable E presented in the denominator of Equation (1) represents the total energy output of each pathway after conversion to megajoules.
3. Results
3.1. Uncertainty in Emission Factors
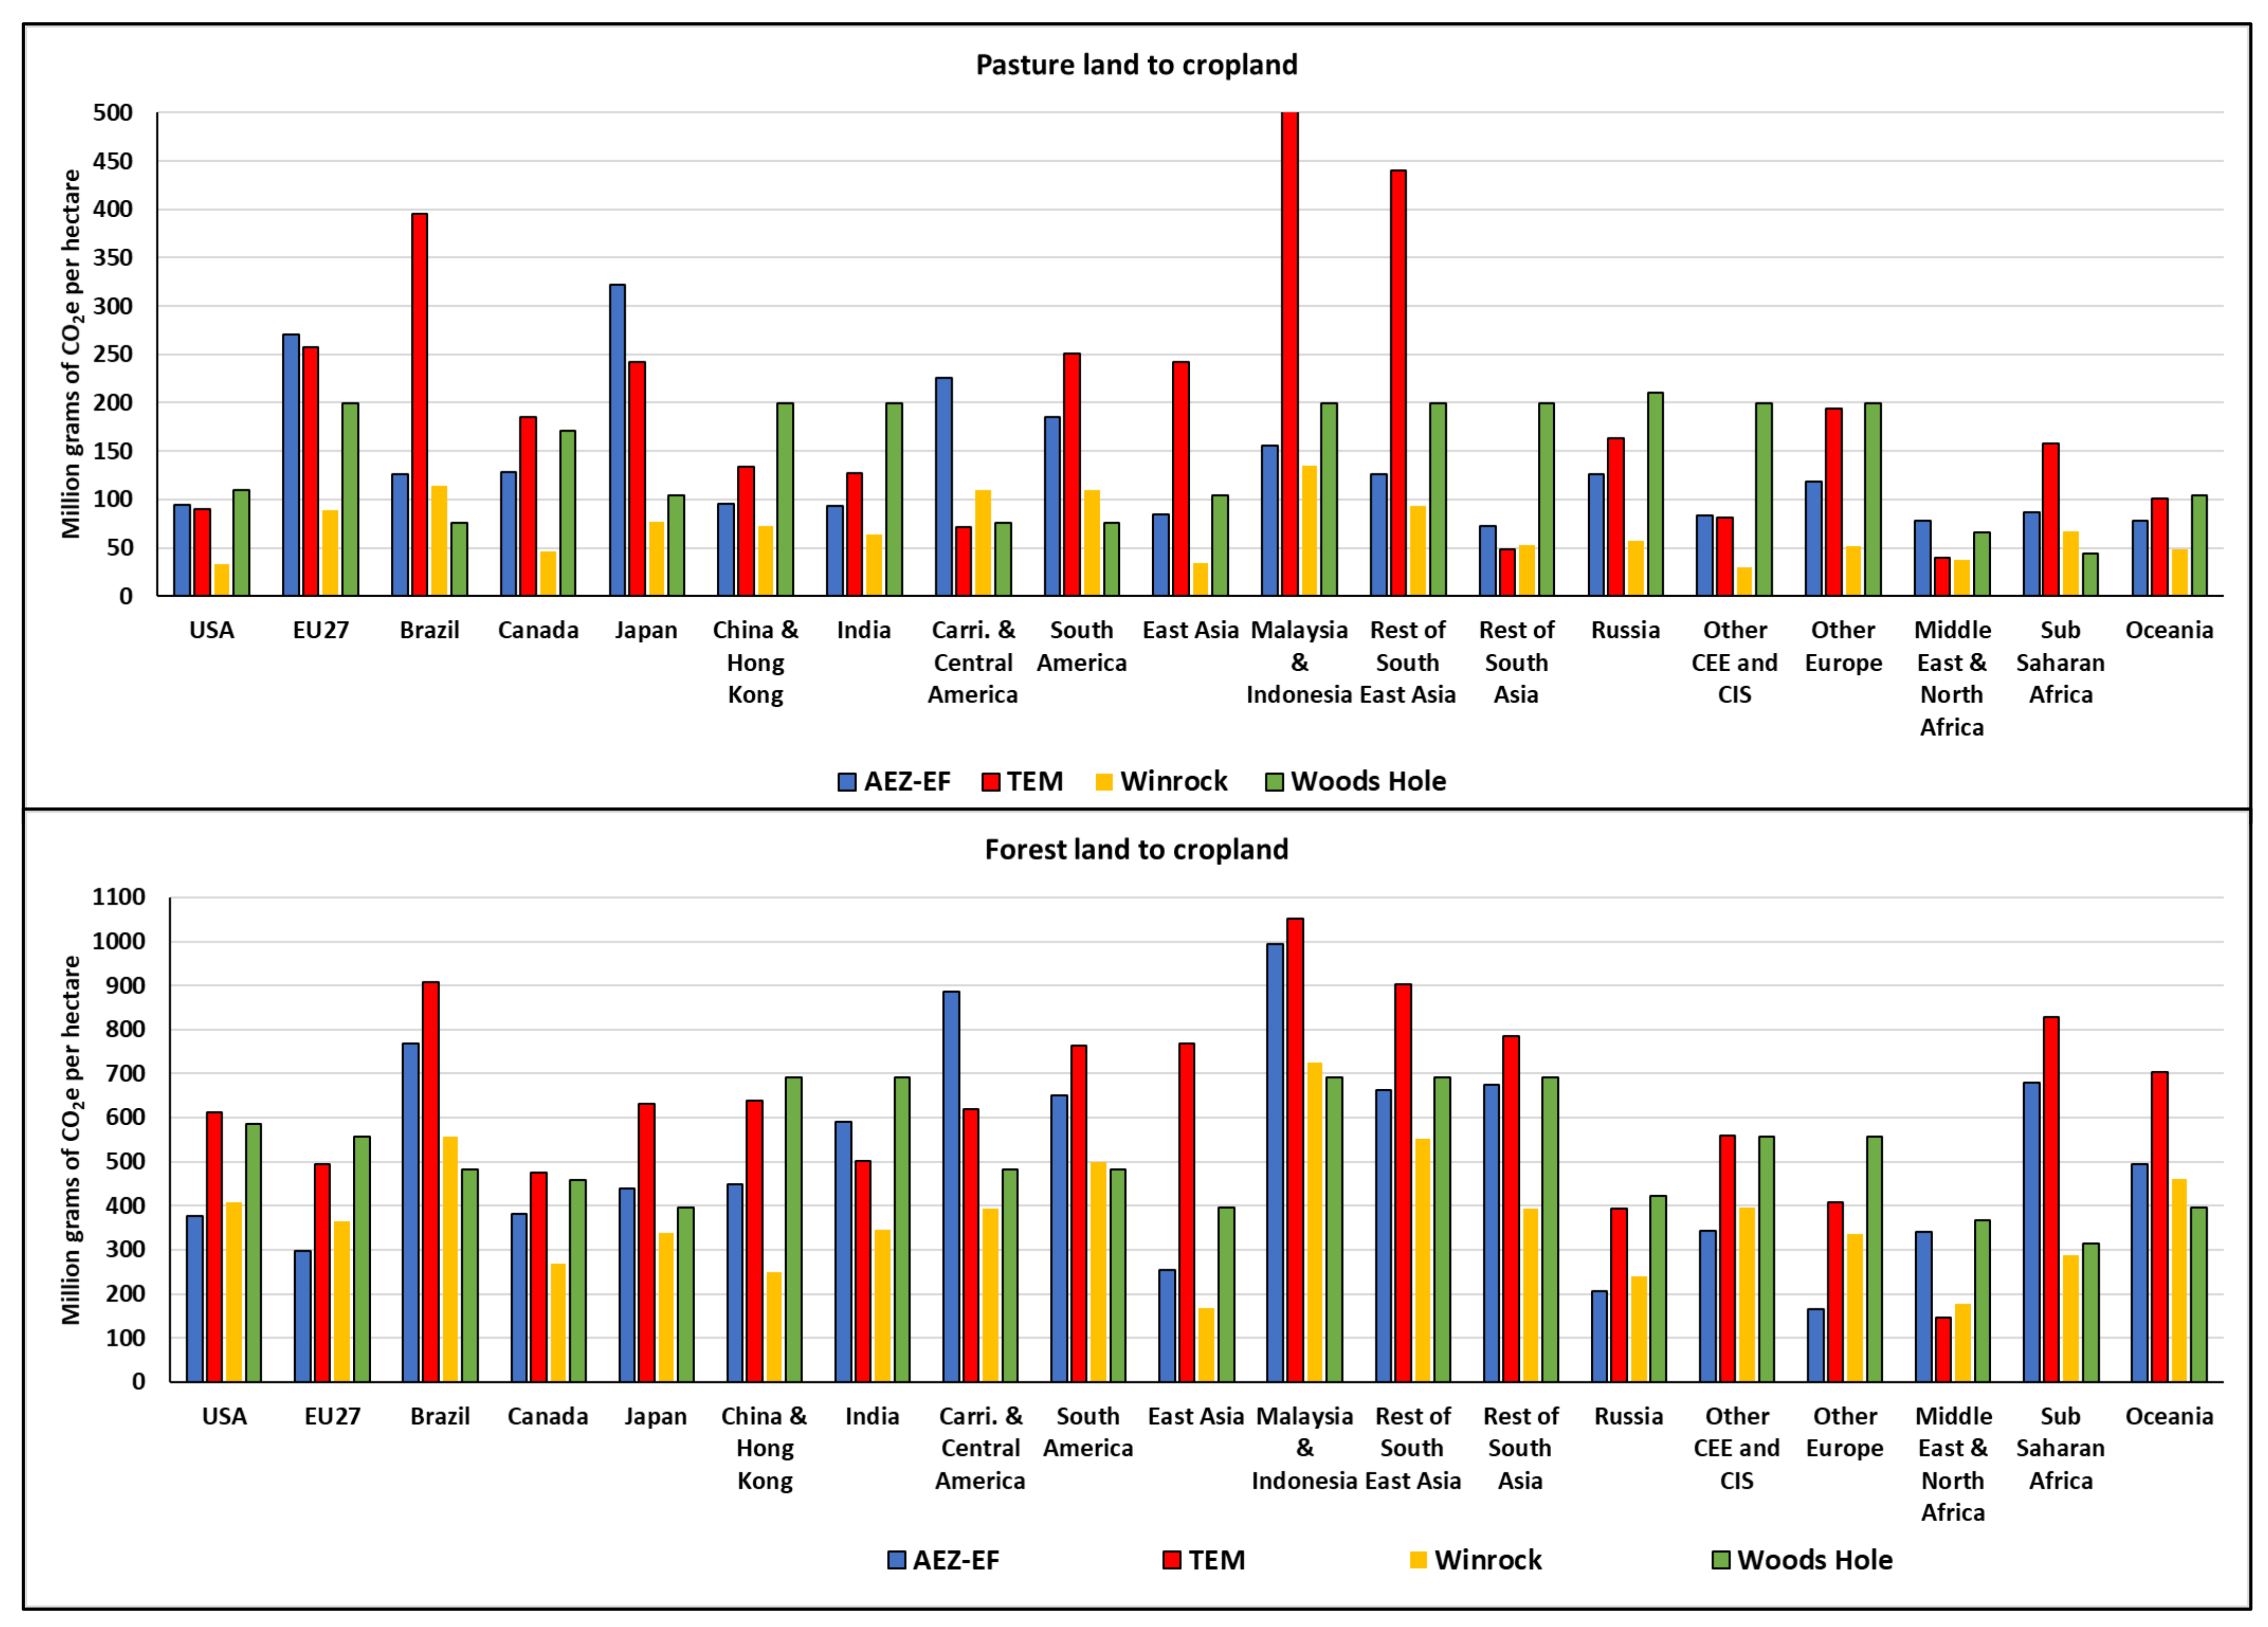
The results show that the existing data sources provide different assessments of emission factors for a given land type conversion (pasture to cropland or forest to cropland) in a geographical region. Figure 1 provides comparisons across the existing data sources on emission factors for converting forest and pasture to cropland across the world. The data sources are the AEZ-EF, TEM, Winrock, and Woods Hole datasets. This figure shows the following:
- Regardless of region or data source, the emission factors of converting forest land to cropland are higher than the emission factors of converting pasture to cropland;
- Regardless of the data source for a given land type, the emission factors vary significantly across regions. This is because the vegetation cover and soil characteristics vary significantly across regions;
- For a given region and land type, alternative sources provide significantly different emission factors. This item highlights uncertainties in LUEFs across data sources; and
- The observed variation among the alternative sources of LUEFs for a given country or region is caused by many factors, including differences in model assumptions, system boundaries, primary carbon stock data sources, and categorization of ecosystems and land uses, among others. Major research efforts are needed to identify, prioritize, and validate these factors to better assess the true scope and uncertainty of ILUC emissions.

Figure 1.
Emission factors for converting forest and pasture to cropland by region across different data sources. The AEZ-EF emission factors represent weighted averages across AEZs of each region using pasture and forest areas. The Winrock emission factors are taken from the CCLUB tables. Other emission factors are obtained from Taheripour and Tyner [4]. The CEE and CIS regions represent Central and Eastern Europe and the Commonwealth of Independent States, respectively.
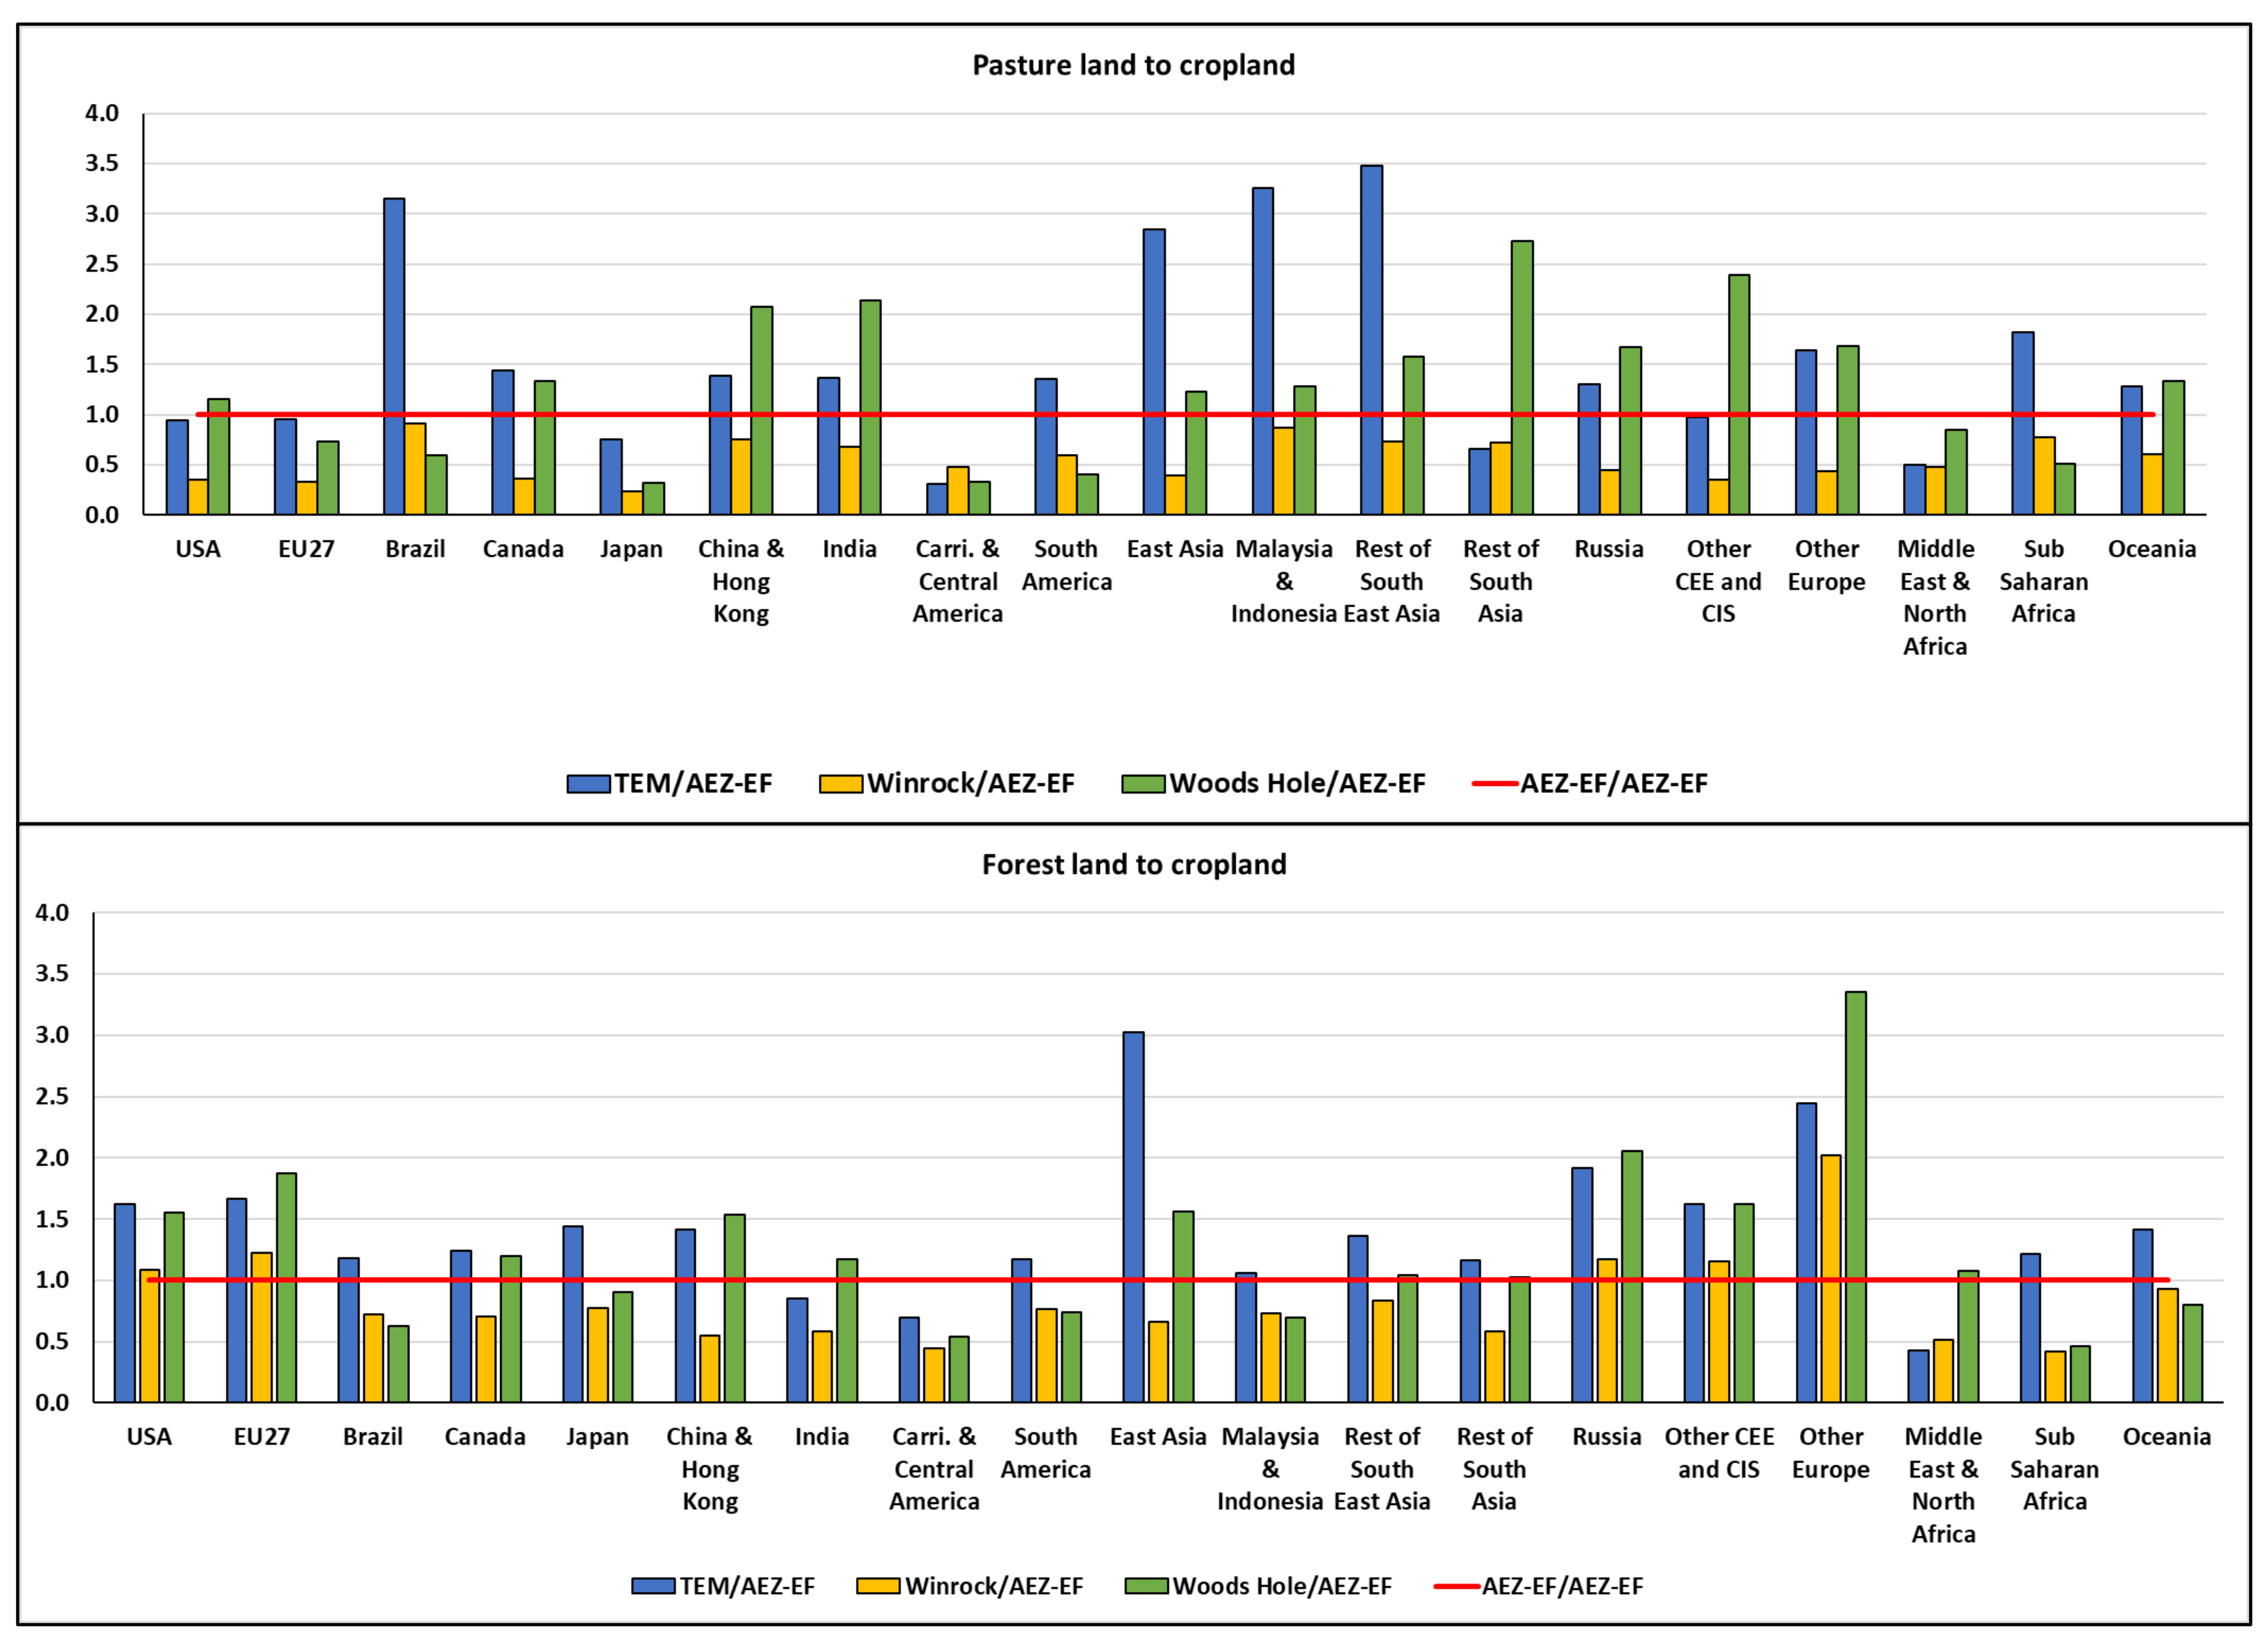
To better assess this line of uncertainty, we examined the differences between these emission factor sources by calculating the ratios of TEM/AEZ-EF, Woods Hole/AEZ-EF, and Winrock/AEZ-EF for each type of land conversion (pasture to cropland and forest to cropland) in each region. As shown in Figure 2, the ratios for both forest and pasture are highly variable across regions. This figure shows the following:
- There is a large disparity among emission factors for the pasture land to cropland transition, which often vary by a factor of three or more between the smallest and largest estimates;
- The TEM emissions factors for pasture land to cropland in Brazil, East Asia, Malaysia, and Indonesia, and the rest of South Asia are much larger than those EFs from other sources.
- The Woods Hole emission factors for pasture land to cropland in China, India, the rest of South Asia, Russia, and some European regions are much larger than those emissions factors from other sources;
- The forest land to cropland transition emissions factors from TEM and Woods Hole models are larger than those from other models;
- In each region, the disparity among the alternative sources of emission factors for forest land is also considerable, but lower than the disparity for pasture land.
These results suggest that differences across alternative sources of emission factors, in many cases, are extremely large. This indicates that using alternative emission factors could lead to major uncertainties in assessing ILUC emissions values. Each of these datasets represents various data items, components, and assumptions. They represent different assessments for soil organic carbon and carbon stock in above- and belowground live biomass. Their assessments for dead organic matter and litter carbon pools are different. For example, in addition to the carbon content of forest live biomass, emission factors may include carbon stored in dead organic matter consists of litter and dead wood. Quantification of these carbon sources is highly uncertain and varies across data sources. The existing data sources also follow different assumptions in calculating forgone carbon sequestration. Forgone sequestration refers to the carbon that would have been captured by soils or plants that are lost due to land-use changes. Alternative sources that provide emission factors use different data sources and follow different approaches and assumptions to assess forgone sequestration. This leads to significant variations in emissions factors. The existing emission factors may also follow different approaches in calculating biomass burning through land clearing and non-CO2 emissions associated with LULUCF. Biomass burning may accrue in land-clearing activities induced by expansions in demand for cropland. The share of biomass burning in land-clearing activities varies across regions. In addition, various approaches could be followed in assessing the CO2 and non-CO2 emissions due to biomass burning. These factors jointly make the emissions induced by biomass burning very uncertain.
With the observed variations in the presented emission factors, it should be very clear that these factors are major sources of uncertainties. Understanding this line of uncertainty could help to provide better estimates for ILUC emissions values for alternative biofuel pathways.

Figure 2.
Ratios of emission factors of TEM/AEZ-EF, Winrock/AEZ-EF, Woods Hole/AEZ-EF, and AEZ-EF/AEZ-EF for converting pasture and forest to cropland by region. The AEZ-EF emission factors represent weighted averages across AEZs of each region using pasture and forest areas. The Winrock emission factors are taken from the CCLUB tables. Other emission factors are obtained from Taheripour and Tyner [4]. The CEE and CIS regions represent Central and Eastern Europe and the Commonwealth of Independent States, respectively.
3.2. Emission Factors Containing Outdated Data
As mentioned before, emission factors represent various data items, components, and assumptions. Many of these data items have not been updated over time, while the existing literature has provided their new updates. As an example, the AEZ-EF model following Edwards et al. [34] assumes that 33% of an increase in palm plantation is converted from forest on peatland in Malaysia and Indonesia. However, as noted by Zhao et al. [12], more recent data provided by Austin et al. [35] suggest lower rates of palm on peatland.
The AEZ-EF model relies on an outdated version of HWSD data and follows the IPCC 2006 guidelines to estimate SOC for each region-AEZ. The HWSD dataset has been revised over time. However, the AEZ-EF emission factors have not been updated accordingly. The first version of this dataset (V1.1) was released in 2009. The AEZ-EF model was built using this version. The latest version of this dataset was released in 2023. Updating the AEZ-EF data sources to represent the new version of HWSD data could affect the estimates of ILUC emissions.
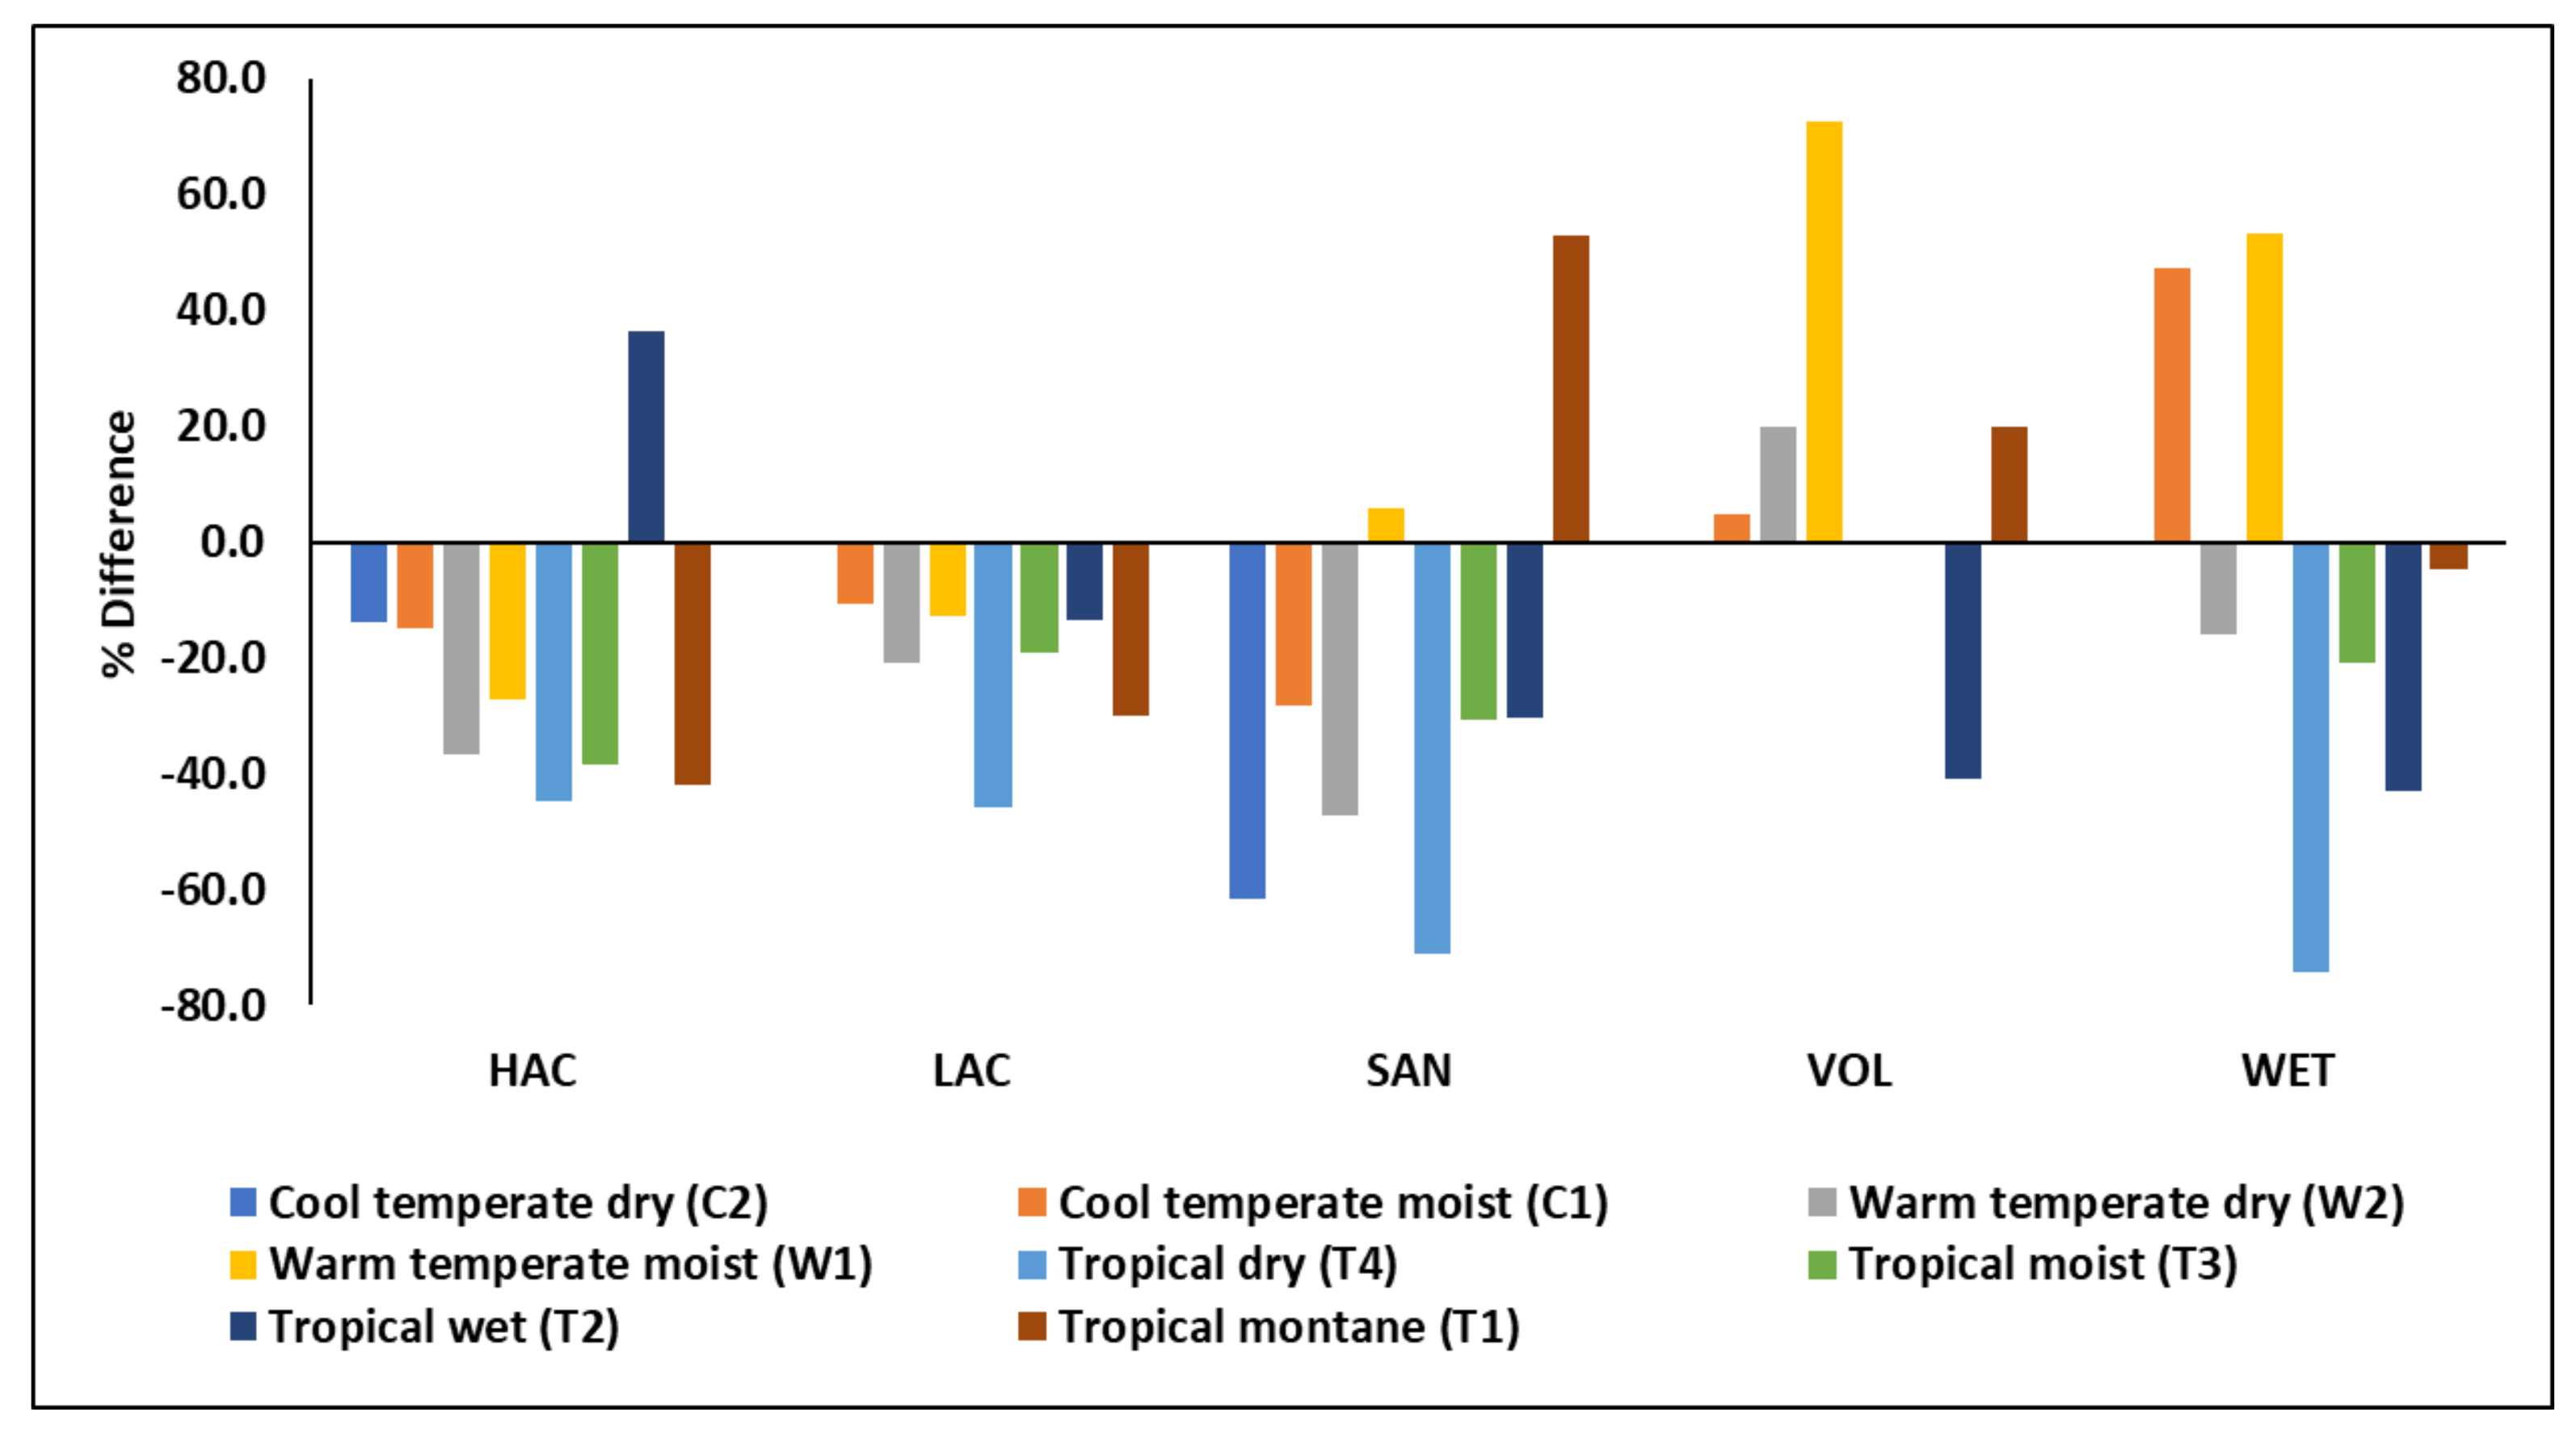
As another example and as explained above, the AEZ-EF model relies on the IPCC 2006 guidelines to determine its emission factors. However, the IPCC revises its datasets and guidelines over time. These revisions suggest that soil and vegetation carbon content data sources are uncertain and subject to reassessments over time. To highlight this fact, consider Figure 3, which shows percent differences in the IPCC default reference values for soil organic carbon stocks (SOCREF) for mineral soil presented in the 2019 and 2006 guidelines for various soil types and climate regions. This figure indicates that in most cases, the default SOCREF values declined in the new IPCC guideline. This suggests that the AEZ-EF model that uses the 2006 IPCC guidelines in determining SOC values needs to adopt the newer 2019 IPCC guidelines to provide ILUC emissions based on the most recent available information. Note that the SOC values are not the only data items of the AEZ-EF model that should change due to revisions in the IPCC guidelines. Other important data items and assumptions that need revisions according to the newer IPCC guidelines are global warming potentials, litter data, soil stock change factors, and forest combustion factors.
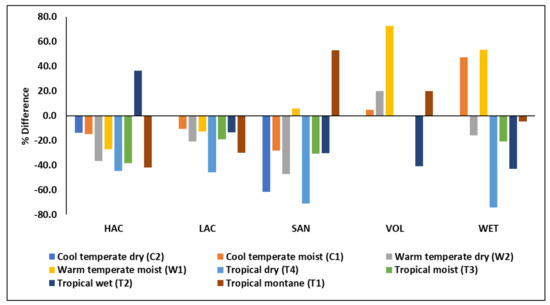
Figure 3.
Percent differences in reference values for soil organic carbon stocks (SOCREF) between the 2019 and 2006 IPCC national accounting guidance for various soil types and climate regions. Here, HAC, LAC, SAN, VOL, and WET stand for high activity clay soils, low activity clay soils, sandy soils, volcanic soils, and wetland soils, respectively. Percent differences are [(SOCREF of 2019_SOCREF of 2006)/SOCREF of 2006] × 100.
3.3. ILUC Emissions for Selected SAF Pathways
The calculated ILUC emission values for the selected eight US SAF pathways differ substantially when assessed using the AEZ-EF versus CCLUB carbon accounting models (Table 2). For the soy oil HEFA, corn ATJ, and corn ETJ pathways, the CCLUB model provides lower ILUC emission values than AEZ-EF. In these cases, the difference is primarily driven by a more detailed parameterization of the “cropland pasture” land category in CCLUB compared to AEZ-EF. Based on extensive research characterizing cropland pasture, CCLUB accounts for accumulation of SOC upon conversion to cropland through Century simulations. In contrast, the AEZ-EF model assumes on an ad hoc basis that the conversion of cropland pasture to crop production releases carbon with a soil carbon content of half of that for pasture land.
Table 2.
Estimated ILUC emissions values for US SAF pathways using different emissions accounting models for a 25-year amortization time horizon (gCO2e/MJ).
The results applying the AEZ-EF emissions factors suggest substantially lower ILUC emissions for dedicated energy crops than those calculated using the CCLUB model. For these biofuel pathways, the AEZ-EF assigns improvements in SOC per hectare of converted cropland to the dedicated energy crops. However, CCLUB only considers improvements in the SOC of cropland pasture. The implications of these differences are highlighted in Table 2. The calculated SOC values indicate that the AEF-EF model assesses large negative changes in SOC on land conversion to dedicated bioenergy crops. A match between the approaches followed by these models in assessing SOC gains could lead to lower differences between their results for the pathways that use dedicated energy crops as feedstock. As presented in Table 2, those pathways that use dedicated energy crops provide major carbon savings due to the accumulation of biomass carbon in the production processes of these energy crops as well.
As mentioned above, Table 2 shows ILUC emissions values for a 25-year amortization time horizon, the assumption in the ICAO CORSIA program. However, the US biofuel policies consider a 30-year amortization time horizon. Table 3 provides the ILUC values for the examined pathways for 25-year and 30-year amortization time horizons.
Table 3.
Estimated ILUC emissions values for various SAF pathways using different emissions accounting models for 25- and 30-year amortization time periods (gCO2e/MJ).
As shown in Table 3, a 30-year amortization time horizon leads to lower ILUC emissions values for all pathways and for both the AEF-EF and CCLUB models.
3.4. Land-Use Emission Factors Used in Other Economic Models
Uncertainties associated with emission factors are not limited to the emission factors that are used to convert the GTAP-BIO estimated land-use changes to ILUC emissions. Other economic models that have been used to assess ILUC emissions are subject to the same uncertainties. Here, we briefly introduce the emission factors of three other economic models.
The economic projection and policy analysis (EPPA) model [36] which has been used to assess land-use changes and their associated emissions uses a set of emissions factors that were obtained from the TEM model [37,38]. These emissions factors are different from those emission factors that are reported and used by Taheripour et al. [4] using the same terrestrial model. This model estimates land-use emission factors by calculating the net ecosystem productivity, the carbon emissions due to the conversion of natural land to agricultural use, and carbon emissions because of the decomposition of forestry and agricultural products [39]. The calculations of these components are subject to various types of uncertainties regarding the implemented data and model parameters.
The global biosphere management model (GLOBIOM) [40] is another model which has been used to evaluate ILUC emissions for various biofuel pathways [33]. This model uses IPCC guidelines and data, a version of the HWSD dataset, and its own equations to calculates carbon fluxes from land-use changes. While details regarding the emission factors of this model are not available, one could expect that the emission factors of this model are also subject to uncertainties, as GLOBIOM also uses the same data sources and approaches that are used by other models.
The global change analysis model (GCAM) has also used to assess ILUC emissions. According to Kyle et al. [41], this model uses a set of predetermined emission factors. These emission factors divide the carbon pools into vegetation and soil carbon, similar to the AEZ-EF model approach. However, the vegetation carbon pool used in GCAM disregards litter and dead vegetation. This model relies on various publications to assess the soil and carbon content of land by region and AEZ. These data sources are subject to uncertainties, similar to the data sources that are used in the AEZ-EF and CCLUB models. Van de Ven et al. [42] have reported the GCAM model emission factors by land type and AEZ.
4. Discussion
This paper highlights that many studies have addressed uncertainties in ILUC emissions stemming from the choice of economic models and their assumptions and parameters, while uncertainties in LUEFs that represent soil and vegetation carbon contents of various land types across the world and are used to estimate carbon fluxes due to land conversions are mostly overlooked. We call attention to this major omission, demonstrating that common sources of LUEFs vary substantially for the same land type, geographical region, and vegetation cover. Some of this variation is due to differences in background in model system boundaries, assumptions, and data sources. The existing LUEFs not only use different sources of data to measure the soil and vegetation carbon of the global land cover, they follow different approaches in determining carbon fluxes due to changes in dead organic matter, litter carbon pools, forgone carbon sequestration, and emissions due to biomass burning that occur in land-clearing activities. LUEFs estimates often rely on outdated data sources, which could also lead to inaccurate ILUC emissions. By highlighting the differences in the calculated ILUC values from a variety of aviation biofuel pathways using two common LUEFs datasets, this study emphasizes that the choice of LUEFs dataset, and thus the variation in model systems and data sources, substantially affects ILUC values for biofuels. To reduce these uncertainties and provide more accurate ILUC emissions from biofuels, more advanced research activities are required to improve estimates in the soil and vegetation carbon of land-cover types across geographies, validate the data sources that underpin existing LUEFs, and develop a set of standard procedures for the application of biological carbon estimates and modeling systems to the field of ILUC.
As recommended by the Committee on Current Methods for Life Cycle Analyses of Low-Carbon Transportation Fuels in the United States [1], with up-to-date data sources, additional research should be conducted to improve and validate LUEFs. These improvement and validation efforts are needed to better estimate the change in GHG emissions by displacing fossil fuels with biofuels. This will help to guide policies and programs that support expansions in biofuels to ensure savings in GHG in transportation sectors by biofuels. Key policies and programs (e.g., the US Renewable Fuel Standard, the California Low Carbon Fuel Standard, and the ICAO-CORSIA program) rely on life cycle analyses and estimations of ILUC emissions to calculate the GHG emission intensities of biofuels. With new research activities that improve and validate the LUEFs, we could enhance effectiveness of the public policies in reducing GHG emissions. Without developing these crucial new studies, public policy may have unintended consequences of supporting fuel options that may have high-ILUC GHG emissions.
5. Conclusions
This study shows that while the existing literature has extensively discussed uncertainties in modeling land-use changes due to biofuels, no major effort has been made to evaluate uncertainties in land-use emission factors. Our study indicates that variations in the available data sources that provide land-use emission factors are substantially large. Hence, moving from one set of land-use emission factors to another significantly affects the estimated ILUC emissions values for a given set of estimated land-use changes for a given pathway. To highlight and confirm this important point, we explained components of several available emissions factors, data sources, and assumptions that have been used to develop those emissions factors and show that the AEZ-EF and CCLUB models, which represent two sets of different land-use emission factors, provide different assessments for ILUC emissions values. Finally, we discussed that uncertainties in emissions factors are not limited to the emissions factors used in the AEZ-EF and CCLUB models that have been frequently used to assess ILUC values in combination with the GTAP-BIO model land-use change projections. The ILUC emissions calculated by other economic models such as EPPA, CGAM, and GLOBIOM are also subject to uncertainties in land-use emission factors as well.
The varied selection of primary data sources, system boundaries, and other modeling assumptions make it very challenging to identify the root causes of the observed variations across models for emission factors for a given country/region. Major research efforts are needed to determine the sources of these variations, assess the accuracy of these models, and validate the resulting emissions factors. To reconcile large differences in emission quantification due to biofuel uses, we call for using advanced satellite and remote-sensing technology to refine emission factor quantifications and field sampling studies to verify the model estimates for large-scale quantification of emissions due to biofuel production.
Author Contributions
Conceptualization, F.T. and S.M.; methodology, F.T., S.M. and M.W.; results, all authors; analysis, all authors; writing, all authors. All authors have read and agreed to the published version of the manuscript.
Funding
This study received financial support from the United States Federal Aviation Administration Office of Environment and Energy through ASCENT, the FAA Center of Excellence for Alternative Jet Fuels and the Environment, ASCENT project 01 through the FAA Award (number 13-C-AJFEPU) under the supervision of A. Oldani and P. Lobo.
Institutional Review Board Statement
Not applicable.
Informed Consent Statement
Not applicable.
Data Availability Statement
The data presented in this study are available on request from the corresponding author.
Conflicts of Interest
The authors declare no conflicts of interest.
References
- National Academies of Sciences, Engineering, and Medicine. Current Methods for Life-Cycle Analyses of Low-Carbon Transportation Fuels in the United States; The National Academies Press: Washington, DC, USA, 2022. [Google Scholar]
- Plevin, R.J.; O’Hare, M.; Jones, A.D.; Torn, M.S.; Gibbs, H.K. Greenhouse gas emissions from biofuels’ indirect land use change are uncertain but may be much greater than previously estimated. Environ. Sci. Technol 2010, 44, 8015–8021. [Google Scholar] [CrossRef]
- Laborde, D.; Padella, M.; Edwards, R.; Marelli, L. Progress in Estimates of ILUC with MIRAGE Model; European Commission—Joint Research Centre: Ispra, Italy, 2014; p. 44. [Google Scholar]
- Taheripour, F.; Tyner, W. Induced Land Use Emissions Due to first and second generation biofuels and uncertainty in land use emissions factors. Econ. Res. Int. 2013, 2013, 315787. [Google Scholar] [CrossRef]
- Valin, H.; Peters, D.; van den Berg, M.; Frank, S.; Havlik, P.; Forsell, N.; Hamelinck, C.; Pirker, J.; Mosnier, A.; Balkovic, J.; et al. The Land Use Change Impact of Biofuels Consumed in the EU: Quantification of Area and Greenhouse Gas Impacts; ECOFYS: Utrecht, The Netherlands, 2015; p. 261. [Google Scholar]
- Plevin, R.J.; Beckman, J.; Golub, A.A.; Witcover, J.; O’Hare, M. Carbon accounting and economic model uncertainty of emissions from biofuels-induced land use change. Environ. Sci. Technol 2015, 49, 2656–2664. [Google Scholar] [CrossRef] [PubMed]
- Leland, A.; Hoekman, S.K.; Liu, X. Review of modifications to indirect land use change modeling and resulting carbon intensity values within the California Low Carbon Fuel Standard regulations. J. Clean. Prod. 2018, 180, 698–707. [Google Scholar] [CrossRef]
- Chen, R.; Qin, Z.; Han, J.; Wang, M.; Taheripour, F.; Tyner, W.; O’Connor, D.; Duffield, J. Life cycle energy and greenhouse gas emission effects of biodiesel in the United States with induced land use change impacts. Bioresour. Technol. 2018, 251, 249–258. [Google Scholar] [CrossRef] [PubMed]
- Gibbs, H.; Yui, S.; Plevin, R.J. New Estimate of Soil and Biomass Carbon Stocks for Global Economic Models; GTAP Center, Department of Agricultural Economics, Purdue University: West Lafayette, IN, USA, 2014. [Google Scholar]
- Plevin, R.J.; Gibbs, H.K.; Duffy, J.; Yui, S.; Yeh, S. Agro-Ecological Zone Emission Factor (AEZ-EF) Model (v47); GTAP Center, Department of Agricultural Economics, Purdue University: West Lafayette, IN, USA, 2015. [Google Scholar]
- Kwon, H.; Liu, X.; Dunn, J.B.; Mueller, S.; Wander, M.M.; Wang, M. Carbon Calculator for Land Use and Land Management Change from Biofuels Production (CCLUB); Argonne National Laboratory: Lemont, IL, USA, 2021. [Google Scholar]
- Zhao, X.; Taheripour, F.; Malina, R.; Staples, M.D.; Tyner, W.E. Estimating induced land use change emissions for sustainable aviation biofuel pathways. Sci. Total Environ. 2021, 779, 146238. [Google Scholar] [CrossRef]
- Hertel, T.W.; Golub, A.; Jones, A.; O’Hare, M.; Plevin, R.; Kammen, D. Effects of U.S. maize ethanol on global land use and greenhouse gas emissions: Estimating market mediated responses. Bioscience 2010, 60, 223–231. [Google Scholar] [CrossRef]
- FAO; IIASA. Harmonized World Soil Database Version 2.0; FAO: Rome, Italy; IIASA: Laxenburg, Austria, 2023. [Google Scholar] [CrossRef]
- Eggleston, H.S.; Buendia, L.; Miwa, K.; Ngara, T.; Tanabe, K. IPCC Guidelines for National Greenhouse Gas Inventories; Institute for Global Environmental Strategies (IGES), Hayama, Japan, 2006.
- IPCC. Refinement to the 2006 IPCC Guidelines for National Greenhouse Gas Inventories; Calvo Buendia, E., Tanabe, K., Kranjc, A., Baasansuren, J., Fukuda, M., Ngarize, S., Osako, A., Pyrozhenko, Y., Shermanau, P., Federici, S., Eds.; IPCC: Geneva, Switzerland, 2019. [Google Scholar]
- Harris, N.; Grimland, S.; Brown, S. Land Use Change and Emission Factors: Updates Since the RFS Proposed Rule; Winrock International: Arlington, VA, USA, 2009. [Google Scholar]
- Houghton, R.A. Carbon emissions and the drivers of deforestation and forest degradation in the tropics. Curr. Opin. Environ. Sustain. 2012, 4, 597–603. [Google Scholar] [CrossRef]
- Parton, W.J.; Scurlock, J.M.O.; Ojima, D.S.; Gilmanov, T.G.; Scholes, R.J.; Schimel, D.S.; Kirchner, T.; Menaut, J.-C.; Seastedt, T.; Garcia Moya, E.; et al. Observations and modeling of biomass and soil organic matter dynamics for the grassland biome worldwide. Glob. Biogeochem. 1993, 7, 785–809. [Google Scholar] [CrossRef]
- Parton, W.J.; Scurlock, J.M.O.; Ojima, D.S.; Schimel, D.S.; Hall, D.O. Impact of climate change on grassland production and soil carbon worldwide. Glob. Change Biol. 1995, 1, 13–22. [Google Scholar] [CrossRef]
- Parton, W.J.; Hartman, M.; Ojima, D.; Schimel, D. DAYCENT and its land surface submodel: Description and testing. Glob. Planet. Change 1998, 19, 35–48. [Google Scholar] [CrossRef]
- Zhuang, Q.; McGuire, A.D.; Melillo, J.M.; Clein, J.S.; Dargaville, R.J.; Kicklighter, D.W.; Myneni, R.B.; Dong, J.; Romanovsky, V.E.; Harden, J.; et al. Carbon cycling in extratropical terrestrial ecosystems of the Northern Hemisphere during the 20th century: A modeling analysis of the influences of soil thermal dynamics. Tellus B Chem. Phys. Meteorol. 2003, 55, 751–776. [Google Scholar] [CrossRef]
- Jain, A.K.; Yang, X. Modeling the effect of two different land cover change data sets on the carbon stocks of plants and soil in concert with CO2 and climate change. Glob. Biogeochem. Cycle 2005, 19, 1–20. [Google Scholar] [CrossRef]
- Gibbs, H.K.; Brown, S.; Niles, J.O.; Foley, J.A. Monitoring and estimating tropical forest carbon stocks: Making REDD a reality. Environ. Res. Lett. 2007, 2, 045023. [Google Scholar] [CrossRef]
- Saatchi, S.S.; Harris, N.L.; Brown, S.; Lefsky, M.; Mitchard, E.T.A.; Salas, W.; Zutta, B.R.; Buermann, W.; Lewis, S.L.; Hagen, S.; et al. Benchmark map of forest carbon stocks in tropical regions across three continents. Proc. Natl. Acad. Sci. USA 2011, 108, 9899–9904. [Google Scholar] [CrossRef] [PubMed]
- Batjes, N.H. Harmonized soil property values for broad-scale modelling (WISE30sec) with estimates of global soil carbon stocks. Geoderma 2016, 269, 61–68. [Google Scholar] [CrossRef]
- Hertel, T.W. Global Trade Analysis: Modeling and Applications; Cambridge University Press: New York, NY, USA, 1997. [Google Scholar]
- Taheripour, F.; Hertel, T.W.; Tyner, W.; Beckman, J.; Birur, D. Biofuels and their by-products: Global economic and environmental implications. Biomass Bioenergy 2010, 34, 278–289. [Google Scholar] [CrossRef]
- Taheripour, F.; Hertel, T.W.; Tyner, W. Implications of biofuels mandates for the global livestock industry: A computable general equilibrium analysis. Agric. Econ. 2011, 42, 325–342. [Google Scholar] [CrossRef]
- Taheripour, F.; Qianlai, Z.; Tyner, W.; Lu, X. Biofuels, cropland expansion, and the extensive margin. Energy Sustain. Soc. 2012, 2, 25. [Google Scholar] [CrossRef]
- Taheripour, F.; Tyner, W. Biofuels and land use change: Applying recent evidence to model estimates. Appl. Sci. 2013, 3, 14–38. [Google Scholar] [CrossRef]
- Taheripour, F.; Zhao, X.; Tyner, W. The impact of considering land intensification and updated data on biofuels land use change and emissions estimates. Biotechnol. Biofuels 2017, 10, 191. [Google Scholar] [CrossRef] [PubMed]
- ICAO. CORSIA Supporting Document: CORSIA Eligible Fuels—Life Cycle Assessment Methodology, version 4; ICAO: Montreal, QC, Canada, 2021. [Google Scholar]
- Edwards, R.; Mulligan, D.; Marelli, L. Indirect Land Use Change from Increased Biofuels Demand. Comparison of Models and Results for Marginal Biofuels Production from Different Feedstocks; EC Joint Research Centre: Ispra, Italy, 2010. [Google Scholar]
- Austin, K.G.; Mosnier, A.; Pirker, J.; Mccallum, I.; Fritz, S.; Kasibhatla, P.S. Shifting patterns of oil palm driven deforestation in Indonesia and implications for zero-deforestation commitments. Land Use Policy 2017, 69, 41–48. [Google Scholar] [CrossRef]
- Paltsev, S.; Reilly, J.; Jacoby, H.; Eckaus, R.; McFarland, J.; Babiker, M. The MIT Emissions Prediction and Policy Analysis (EPPA) Model: Version 4; Report 125; MIT Joint Program on the Science and Policy of Global Change, Cambridge, USA: 2005.
- McGuire, A.D.; Sitch, S.; Clein, J.S.; Dargaville, R.; Esser, G.; Foley, J.; Heimann, M.; Joos, F.; Kaplan, J.; Kicklighter, D.W.; et al. Carbon balance of the terrestrial biosphere in the Twentieth Century: Analyses of CO2, climate and land use effects with four process-based ecosystem models. Glob. Biogeochem. Cycles 2001, 15, 183–206. [Google Scholar] [CrossRef]
- Felzer, B.; Kicklighter, D.W.; Melillo, J.; Wang, C.; Zhuang, Q.; Prinn, R. Effects of ozone on net primary production and carbon sequestration in the conterminous United States using a biogeochemistry model. Tellus B 2004, 56, 230–248. [Google Scholar] [CrossRef]
- Qudsia, J.E.; Paltsev, S.; Kicklighter, D.W.; Winchester, N.W. Are Land-Use Emissions Scalable with Increasing Corn Ethanol Mandates in the United States?; Report 295; Report-MIT Joint Program on the Science and Policy of Global Change, Cambridge, USA: 2016.
- Havlík, P.; Valin, H.; Mosnier, A.; Frank, S.; Lauri, P.; Leclère, D.; Palazzo, A.; Batka, M.; Boere, E.; Brouwer, A.; et al. GLOBIOM documentation; International Institute for Applied Systems Analysis (IIASA): Laxenburg, Austria.
- Kyle, P.; Luckow, P.; Calvin, K.; Emanuel, W.; Nathan, M.; Zhou, Y. GCAM 3.0 Agriculture and Land Use: Data Sources and Methods; Report 21025; Pacific Northwest National Laboratory: Richland, WA, USA, 2011. [Google Scholar]
- Van de Ven, D.J.; Capellan-Peréz, I.; Arto, I.; Cazcarro, I.; de Castro, C.; Patel, P.; Gonzalez-Eguino, M. The potential land requirements and related land use change emissions of solar energy. Sci. Rep. 2021, 11, 2907. [Google Scholar] [CrossRef] [PubMed]
Disclaimer/Publisher’s Note: The statements, opinions and data contained in all publications are solely those of the individual author(s) and contributor(s) and not of MDPI and/or the editor(s). MDPI and/or the editor(s) disclaim responsibility for any injury to people or property resulting from any ideas, methods, instructions or products referred to in the content. |
© 2024 by the authors. Licensee MDPI, Basel, Switzerland. This article is an open access article distributed under the terms and conditions of the Creative Commons Attribution (CC BY) license (https://creativecommons.org/licenses/by/4.0/).