Article

Microplastic Occurrence Characteristics and Ecological Risk Assessment of Urban River in Cold Regions during Ice-Covered Periods

1
College of Wildlife and Protected Area, Northeast Forestry University, Harbin 150040, China
2
Jiamusi Ecological and Environmental Monitoring Center of Heilongjiang Province, Harbin 150040, China
3
Key Laboratory of National Territory Spatial Planning and Ecological Restoration in Cold Regions, Ministry of Natural Resources, Harbin 150040, China
*
Author to whom correspondence should be addressed.
Sustainability 2024, 16(7), 2731; https://doi.org/10.3390/su16072731
Submission received: 8 January 2024 / Revised: 23 February 2024 / Accepted: 15 March 2024 / Published: 26 March 2024

Abstract

:
This paper focuses on the Harbin section of the Songhua River in the cold region of northern China. The occurrence characteristics and pollution level of microplastics (MPs) are explored in both the ice and water of urban inland rivers and estuaries during the ice-covered periods. The abundance of MPs in Majiagou ice averaged 324.4 ± 261.5 particles/L, and the abundance of MPs in Songhua ice averaged 65.0 ± 68.2 particles/L. In the water with different depths of Songhua, the MP abundance ranged from 1.0 ± 0.7 particles/L to 12.9 ± 9.4 particles/L, with an average of 5.6 ± 7.6 particles/L. The amount of MPs in ice is about 11 times that in water, where ice formation is mainly responsible for the decline in the MP abundance in aquatic environments. The abundance of MPs in urban inland rivers gradually increased from south to north, while that in the mainstream of the Songhua River showed an increasing trend from east to west. Detected MPs were mainly fiber and white in shape and color, respectively, with a particle size < 0.5 mm. The extent of microplastics in ice is greater than that in water, and melting in the following spring will exacerbate the environmental impact. The results identified the discharge of domestic sewage as the main source of MPs in urban inland rivers. Polyethylene, polypropylene, and polyacrylonitrile were the main types of polymers. The results of the ecological risk assessment showed that the MP pollution in the Harbin section of the Songhua River reached moderate and severe pollution levels during the ice-covered periods. Its potential risk should receive more attention, and control should be strengthened.

1. Introduction

In recent years, microplastic pollution has become increasingly acknowledged and has developed into a hot environmental issue. As early as 2004, Thompson first proposed the concept of “microplastics (MPs)” by studying plastic debris in marine waters and sediments [1]. MPs range in size [2] from microns to millimeters, with a variety of shapes [3,4]. Marine MPs are figuratively referred to as “PM2.5 in the ocean”. Although the size of MPs varies, MPs are generally defined as plastic fibers, pellets, or films with a particle size of < 5 mm [5]. Plastic is a type of synthetic or natural polymer. Because of its low cost, wide availability, and convenience, it has been widely used in agriculture, industry, construction, and other fields and has become an indispensable part of daily life [6]. Since the start of the 21st century, the annual output of plastic products has varied from 367 to 480 million tons. Plastic products are mainly polyethylene (PE), polypropylene (PP), and polyvinyl chloride (PVC) [7], which are the most used in daily life.
Nowadays, plastic products, as a new type of pollutant that has a great impact on cities, are everywhere in the environment [8]. Researchers have found it globally in a variety of environmental media, including oceans [9], rivers [10], lakes [11], soils [6], and even the atmosphere [12]. Due to their small size, these microplastics are eaten by fish, shellfish, and other organisms, which will cause intestinal obstruction, tissue inflammation, and other physical damage to organisms [13], and then pass up along the food chain and eventually affect human beings [14], causing digestive system diseases and immune system disorders, and even increasing the risk of cancer [15,16]. In addition, microplastics will adsorb toxic substances such as polychlorinated biphenyls (PCBs) and polycyclic aromatic hydrocarbons (PAHs) during the production process [17], and when organisms ingest these microplastics, these toxic substances may be released into organisms, resulting in toxic effects in organisms [18]. Moreover, the presence of microplastics may also have a wide range of impacts on ecosystems, including altering the soil structure, affecting the survival and reproduction of aquatic organisms [19], and disrupting the balance of ecosystems. Under the multiple effects of environmental factors, plastics are broken down into small fragments and flow into river systems through domestic sewage, industrial sewage, and sewage treatment plants [20]. River ecosystems are important water sources for urban life and agricultural production. Therefore, it is necessary to pay attention to the occurrence and pollution of MPs in river ecosystems.
However, current studies on MPs in river ecosystems mainly focus on natural factors such as the rainy season and storms [9,21,22,23,24], and studies on the ice-bound river ecosystem in cold regions are still underrepresented. Harbin is an important metropolis in the cold region of north China. Over the ice-covered periods, the water surface of the river section is completely covered by fixed ice [25,26], and pollutants can more easily enter the ice. Furthermore, because of comprehensive factors such as soil–water freezing during the ice-covered periods, river runoff is low, and the water self-purification capacity is poor, leading to serious pollution.
This is the first study on MP pollution in winter rivers of typical large industrial cities in northeast China, where the ice season lasts for half a year. The abundance and composition of MPs deserve further analysis. Therefore, the purpose of this study was to (1) investigate the occurrence characteristics and spatial pattern of MPs; (2) analyze the quantity, color, shape, size, and main composition of MPs in ice and water; and (3) to study the harm degree of MP size pollution on the environment during the ice period. By understanding the microplastic pollution of rivers in winter, this study will lay a better foundation for subsequent pollution research and provide theoretical support for the protection and governance of urban river ecosystems.

2. Materials and Methods
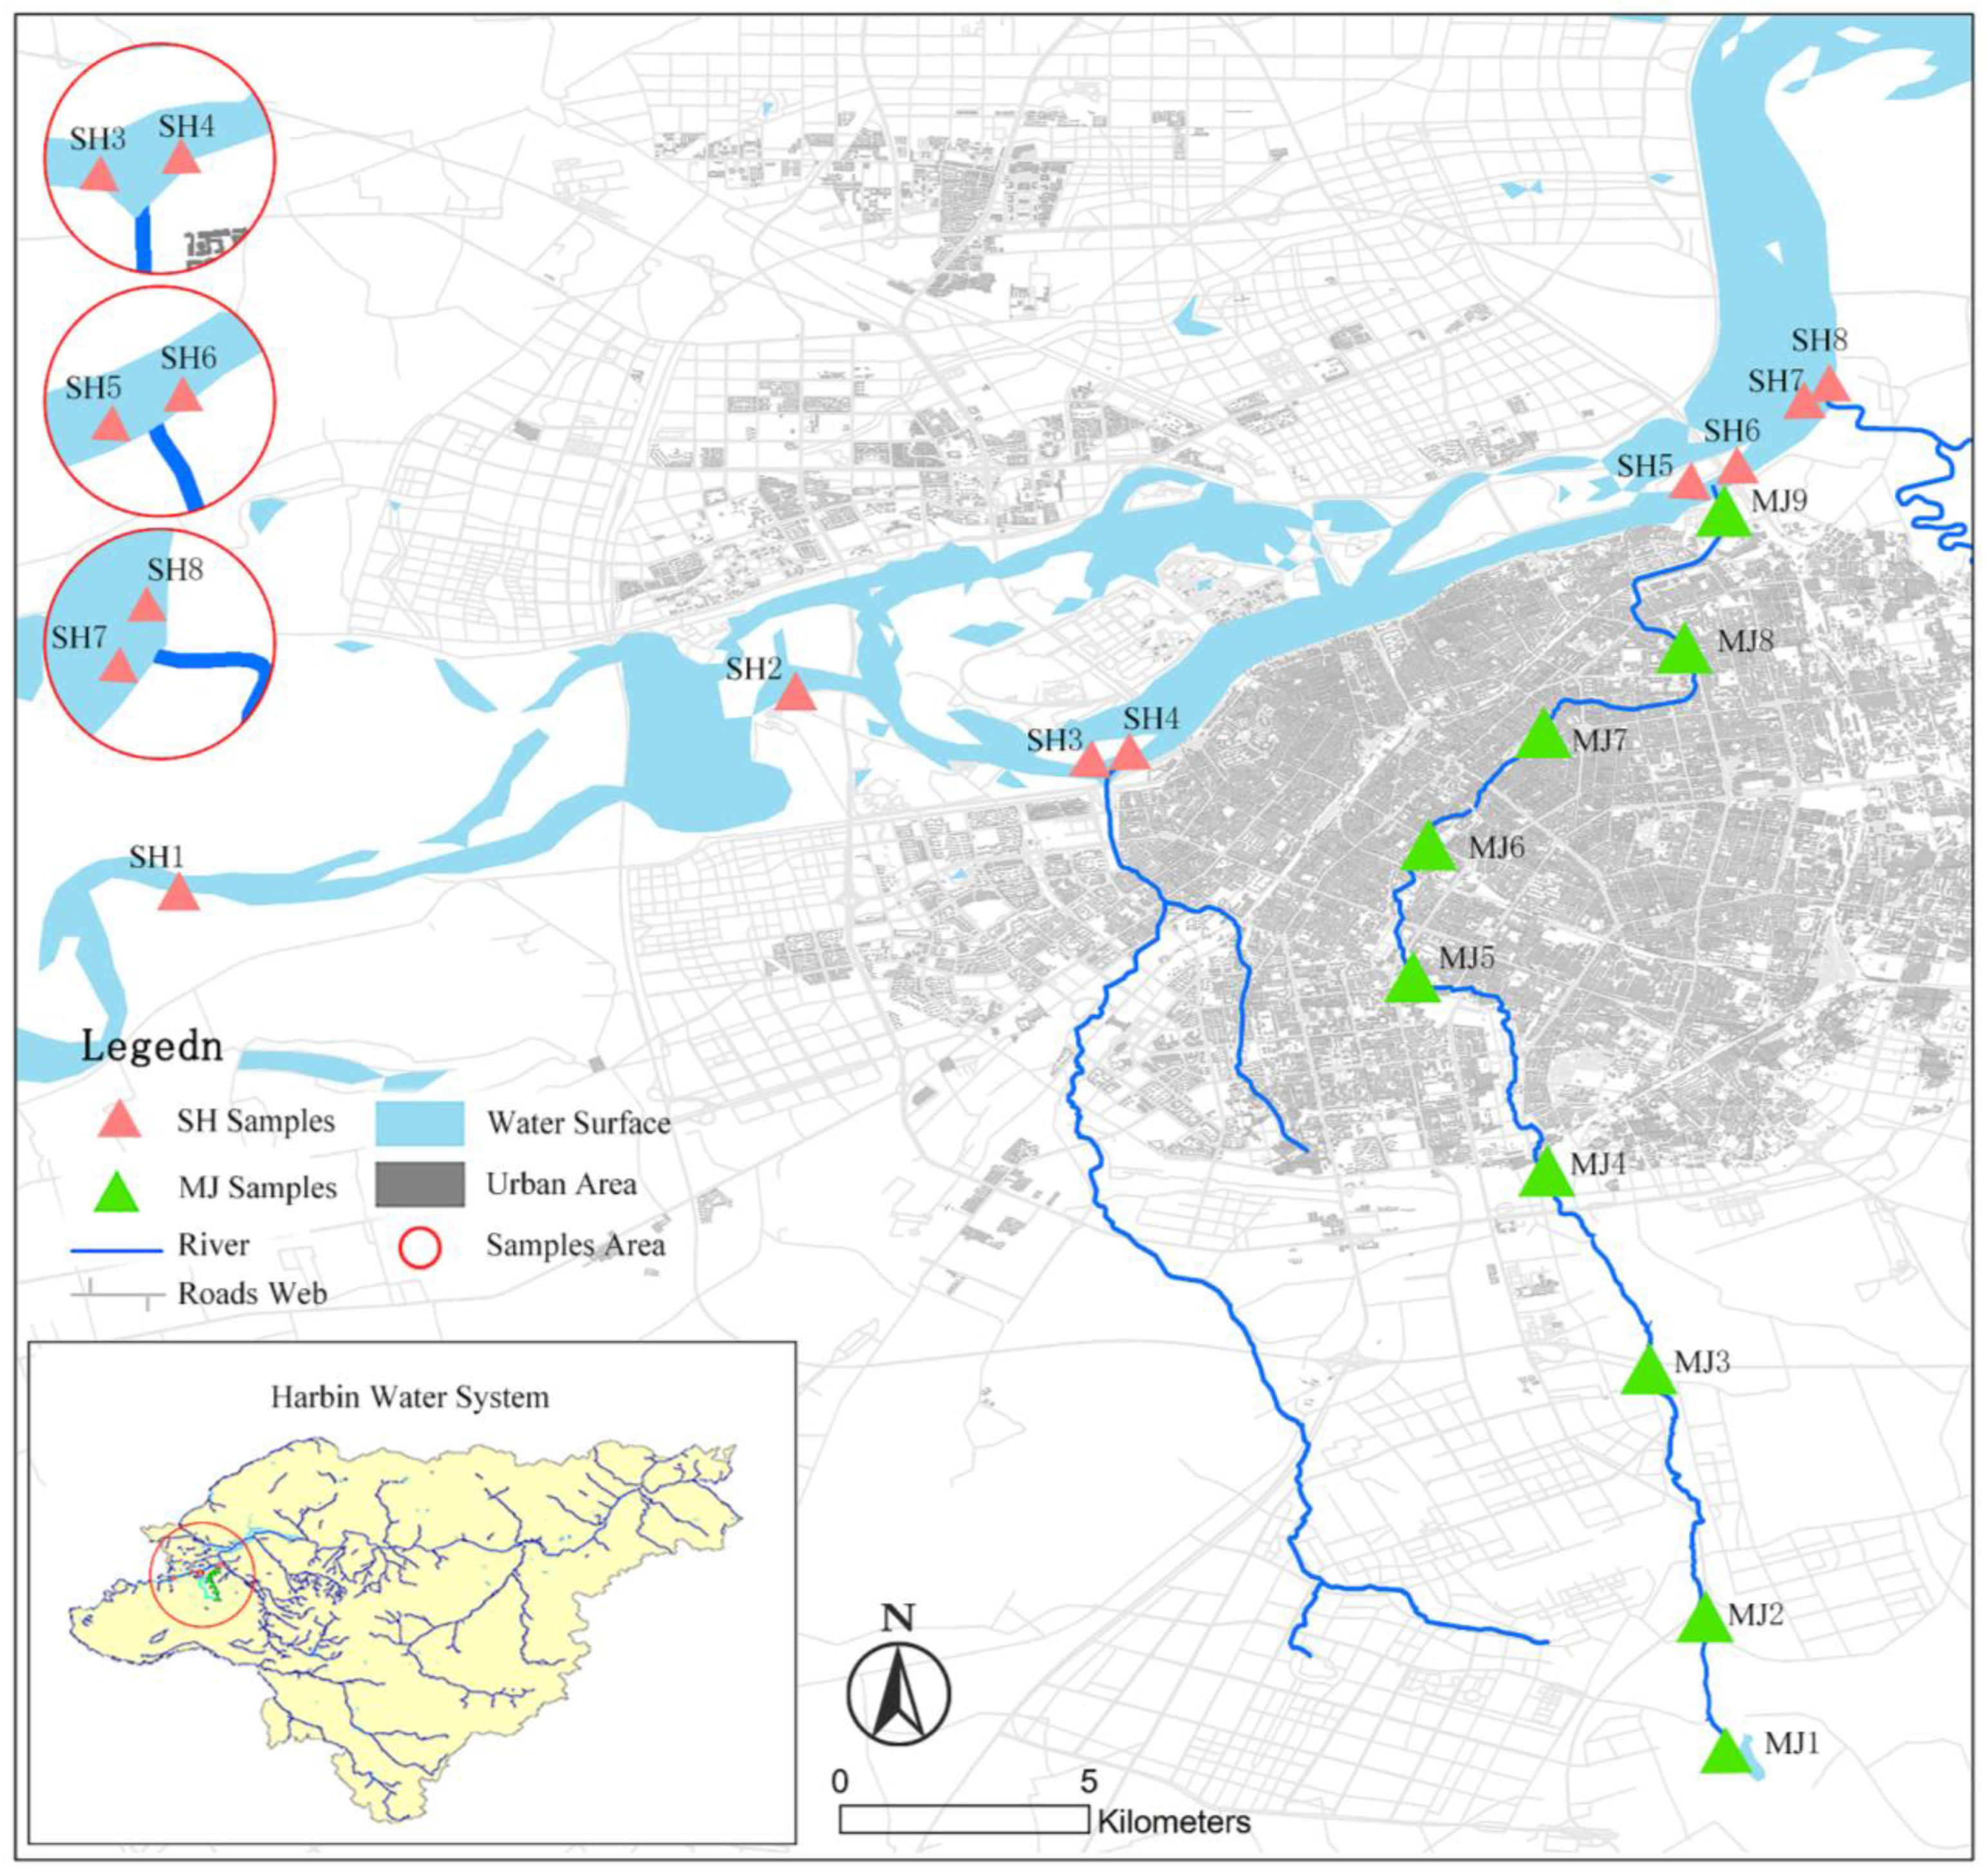
2.1. Study Area

The Songhua River is located in northeast China, with a basin area of 561,200 km2, making it one of the seven major water systems in China. As an important carrier of the economy and development of northeast China, the Songhua River plays an important role in providing drinking water and agricultural water for northeast China. Moreover, it is also the spare drinking water source of Harbin. Harbin is located between 44°04′–46°40′ N and 125°42′–130°10′ E, along the upstream Songhua River. With a permanent population of more than 5 million inhabitants, Harbin is a representative metropolis in the cold region of north China. Three tributaries in downtown all belong to the Songhua River system. In the spring flood season (April to May), the amount of snow and ice-melt water accounts for 20% of the annual runoff. From late November to March of the following year, the Songhua River enters the ice-covered periods, during which its discharge decreases significantly. The Songhua River is the water source of domestic water as well as industrial and agricultural production water for Harbin. It is also the receiving water source of the sewage and wastewater of Harbin city. Studying its pollution status is of great significance to the economic development and resident health of Harbin.
The Harbin section of the Songhua River basin was selected as the study area (Figure 1). This section mainly includes the main trunk stream (the mainstream of Songhua River between the Zhushuntun section and Dadingzishan section in Harbin, with a total length of 66 km), estuaries of three main tributaries (Hejiagou, Majiagou, and Ashi River in downtown Harbin), and the Majiagou tributary (44.3 km in length).

2.2. Sample Collection and MP Extraction

To explore the spatial distribution and characteristics of MPs in urban water and ice in winter, 87 samples were collected from 17 ice sample points and eight water sample points in the natural environment of the Harbin section of Songhua River on December 26. On that day, the average temperature was −17 °C, the weather was sunny, and the wind came from the southwest. On December 27, the average temperature was −19 °C, the weather was also sunny, and the wind came from the west. Eight samples were obtained from the Songhuajiang (SH) ice sheet and nine samples from the Majiagou (MJ) ice sheet. Songhuajiang (SH1, SH2, and SH3) has eight water bodies. The selection of sampling points is based on the different activities of humans living in the surrounding areas, including agricultural lands, factories, and different types of residential areas. The density of residents in the surrounding areas was used as a basis for selection, and there is no direct relationship between the sampling points. The MJ sample sites 5–9 are close to residential areas, while sites 1–4 are mainly agricultural and factory areas. During the ice sampling process, ice samples of 20 × 20 × 25 cm3 (length, width, and height) were cut using an ice saw, and a tape measure was used to ensure the correct size of the extracted ice samples. Then, the surface of the samples was cleaned with pure water, and ice samples were placed in a stainless-steel container. The sampling points are located in the middle of the river, and the water sampler collected water samples at different depths of 1 m, 2 m, and 3 m under the ice. Each sample size was 10 L. Samples were filtered through a 400-mesh (37 μm) stainless-steel mesh in the field and stored in aluminum boxes. The above steps were repeated three times. All samples were stored at −20 °C and transported back to the laboratory for further processing.
First, after the ice samples had completely melted at room temperature, the melt was shaken well, and the meltwater (10 L) was measured. A 400-mesh (37 μm) stainless-steel mesh was used for filtration. The filter mesh was placed in 400 mL of 1.2 g/cm3 NaCl solution for flotation [27]. To prevent adhesion, it was oscillated in an ultrasonic oscillation box for 15 min. After taking the supernatant, experimental samples were placed into a beaker containing 100 mL of 30% H2O2 solution to digest the organic matter. After settling for 24 h, the liquids in the beakers were filtered through a diaphragm vacuum pump (gm-0.5a, Jinteng, China). A polytetrafluoroethylene filter membrane with a pore diameter of 0.45 μm was used as a filter membrane, and the filter membranes were stored in Petri dishes in the dark before observations. The water samples were filtered through the stainless-steel mesh during collection, and the operation was the same as that of the ice samples. Finally, each filter membrane was placed in a Petri dish and dried in a constant-temperature drying oven at 40 °C for further detection and analysis.

2.3. Classification, Detection, and Identification of MP Samples

The MPs collected in this study were classified into four categories according to their types: fiber, film, debris, and pellets (also including spherical foam). The main colors were white, transparent, black, red, and blue. The plastics were divided into six categories according to their sizes: <0.1 mm, 0.1–0.5 mm, 0.5–1 mm, 1–2 mm, 2–3 mm, and >3 mm. A ZEISS stereomicroscope (SteREO Discovery V12, Oberkochen, BW, Germany) equipped with a camera function (Axiocam 506 color, ZEISS, Oberkochen, BW, Germany) was used to take photos and count the MP particles on a dry filter membrane. Then, ImageJ 1.53 software was used to measure the size of the MPs, and the maximum size of the MPs was defined as the length [11]. A Fourier transform micro-infrared spectrometer (Thermo, Nicolet iN10, Waltham, MA, USA) was used to scan typical MPs three times to obtain the spectrum. The obtained spectra were compared and analyzed using OMNIC software (version 9.2.86) and the spectrum library. If the similarity with the reference spectrum exceeded 70% and the characteristic peak could be identified, the MP type could be determined. Characteristics of surface weathering and the element distribution of typical MPs were analyzed using scanning electron microscopy and X-ray energy spectrometry (SEM-DES, JEOL JSM-7500F, Akishima-shi, Japan) [10,28]. The unit of MP abundance used in this study was “ p a r t i c l e s / L ”.

2.4. Quality Assurance and Control

Potential contamination during the sampling and experiment was prevented in accordance with the processing methods of ice samples [29]. The sampling equipment used in this study was thoroughly cleaned with pure water, and snow covering the surface of the sample points was removed during sampling. A blank control was included, which contained no MPs, to ensure the accuracy of sampling and analysis. All solutions used in the experiment were filtered through a 0.22 µm filter. During the experiment, a cotton lab coat and nitrile gloves were worn.

2.5. Ecological Risk Assessment of MP Pollution

The pollution risk caused by MPs has attracted increasing attention; however, unified standards for the effective evaluation of MP pollution have still not been developed. In this study, the pollution load index (PLI) proposed by Angulo was applied to explore the ecological risks associated with MP pollution in rivers [30]. The PLI has been widely employed in assessments of contamination levels in estuaries and other aquatic environments [8,31,32,33] and was calculated with the following formulae:
  C F i = C i C o
P L I = C F 1 × C F 2 × C F n n
P L I r i v e r = P L I 1 × P L I 2 × P L I n n
In Formula (1), CFi reflects the MP abundance factor for each sampling point, which is calculated by the quotient of MP abundance (Ci) and background abundance (C0) at each sampling point, including the ice sheet and water body. To improve the accuracy of the PLI, the lowest abundance of water samples in the environment is C0 (1.03 particles/L), according to previous experience. The lowest ice abundance is C0 (2.01 particles/L) [33,34]. In Formula (2), n is the number of sampling points. A sampling point is sampled three times in parallel to calculate the CFi, and finally, the PLI value of a sampling point is calculated. PLIriver reflects the MP load index of the whole basin, divided into SH and MJ. The classification standards of MP pollution load levels are shown in Table 1 [34,35].

2.6. Statistical Analysis

The distribution of MPs was mapped using ArcGIS10.2. Rstudio (version 4.1.1), which was also used for the statistical analysis and visualization of the results. All data are expressed as the mean ± SE, and a p < 0.05 was used as the threshold of significance. The data were tested for normal distribution, and the results showed that they did not conform to normal distribution; therefore, a non-parametric test (K–W test) was adopted to compare the differences in the abundance and concentrations of MPs at sampling points. Differences among MP morphologies and polymer types were analyzed by the post hoc Tukey’s multiple comparison test.

3. Results

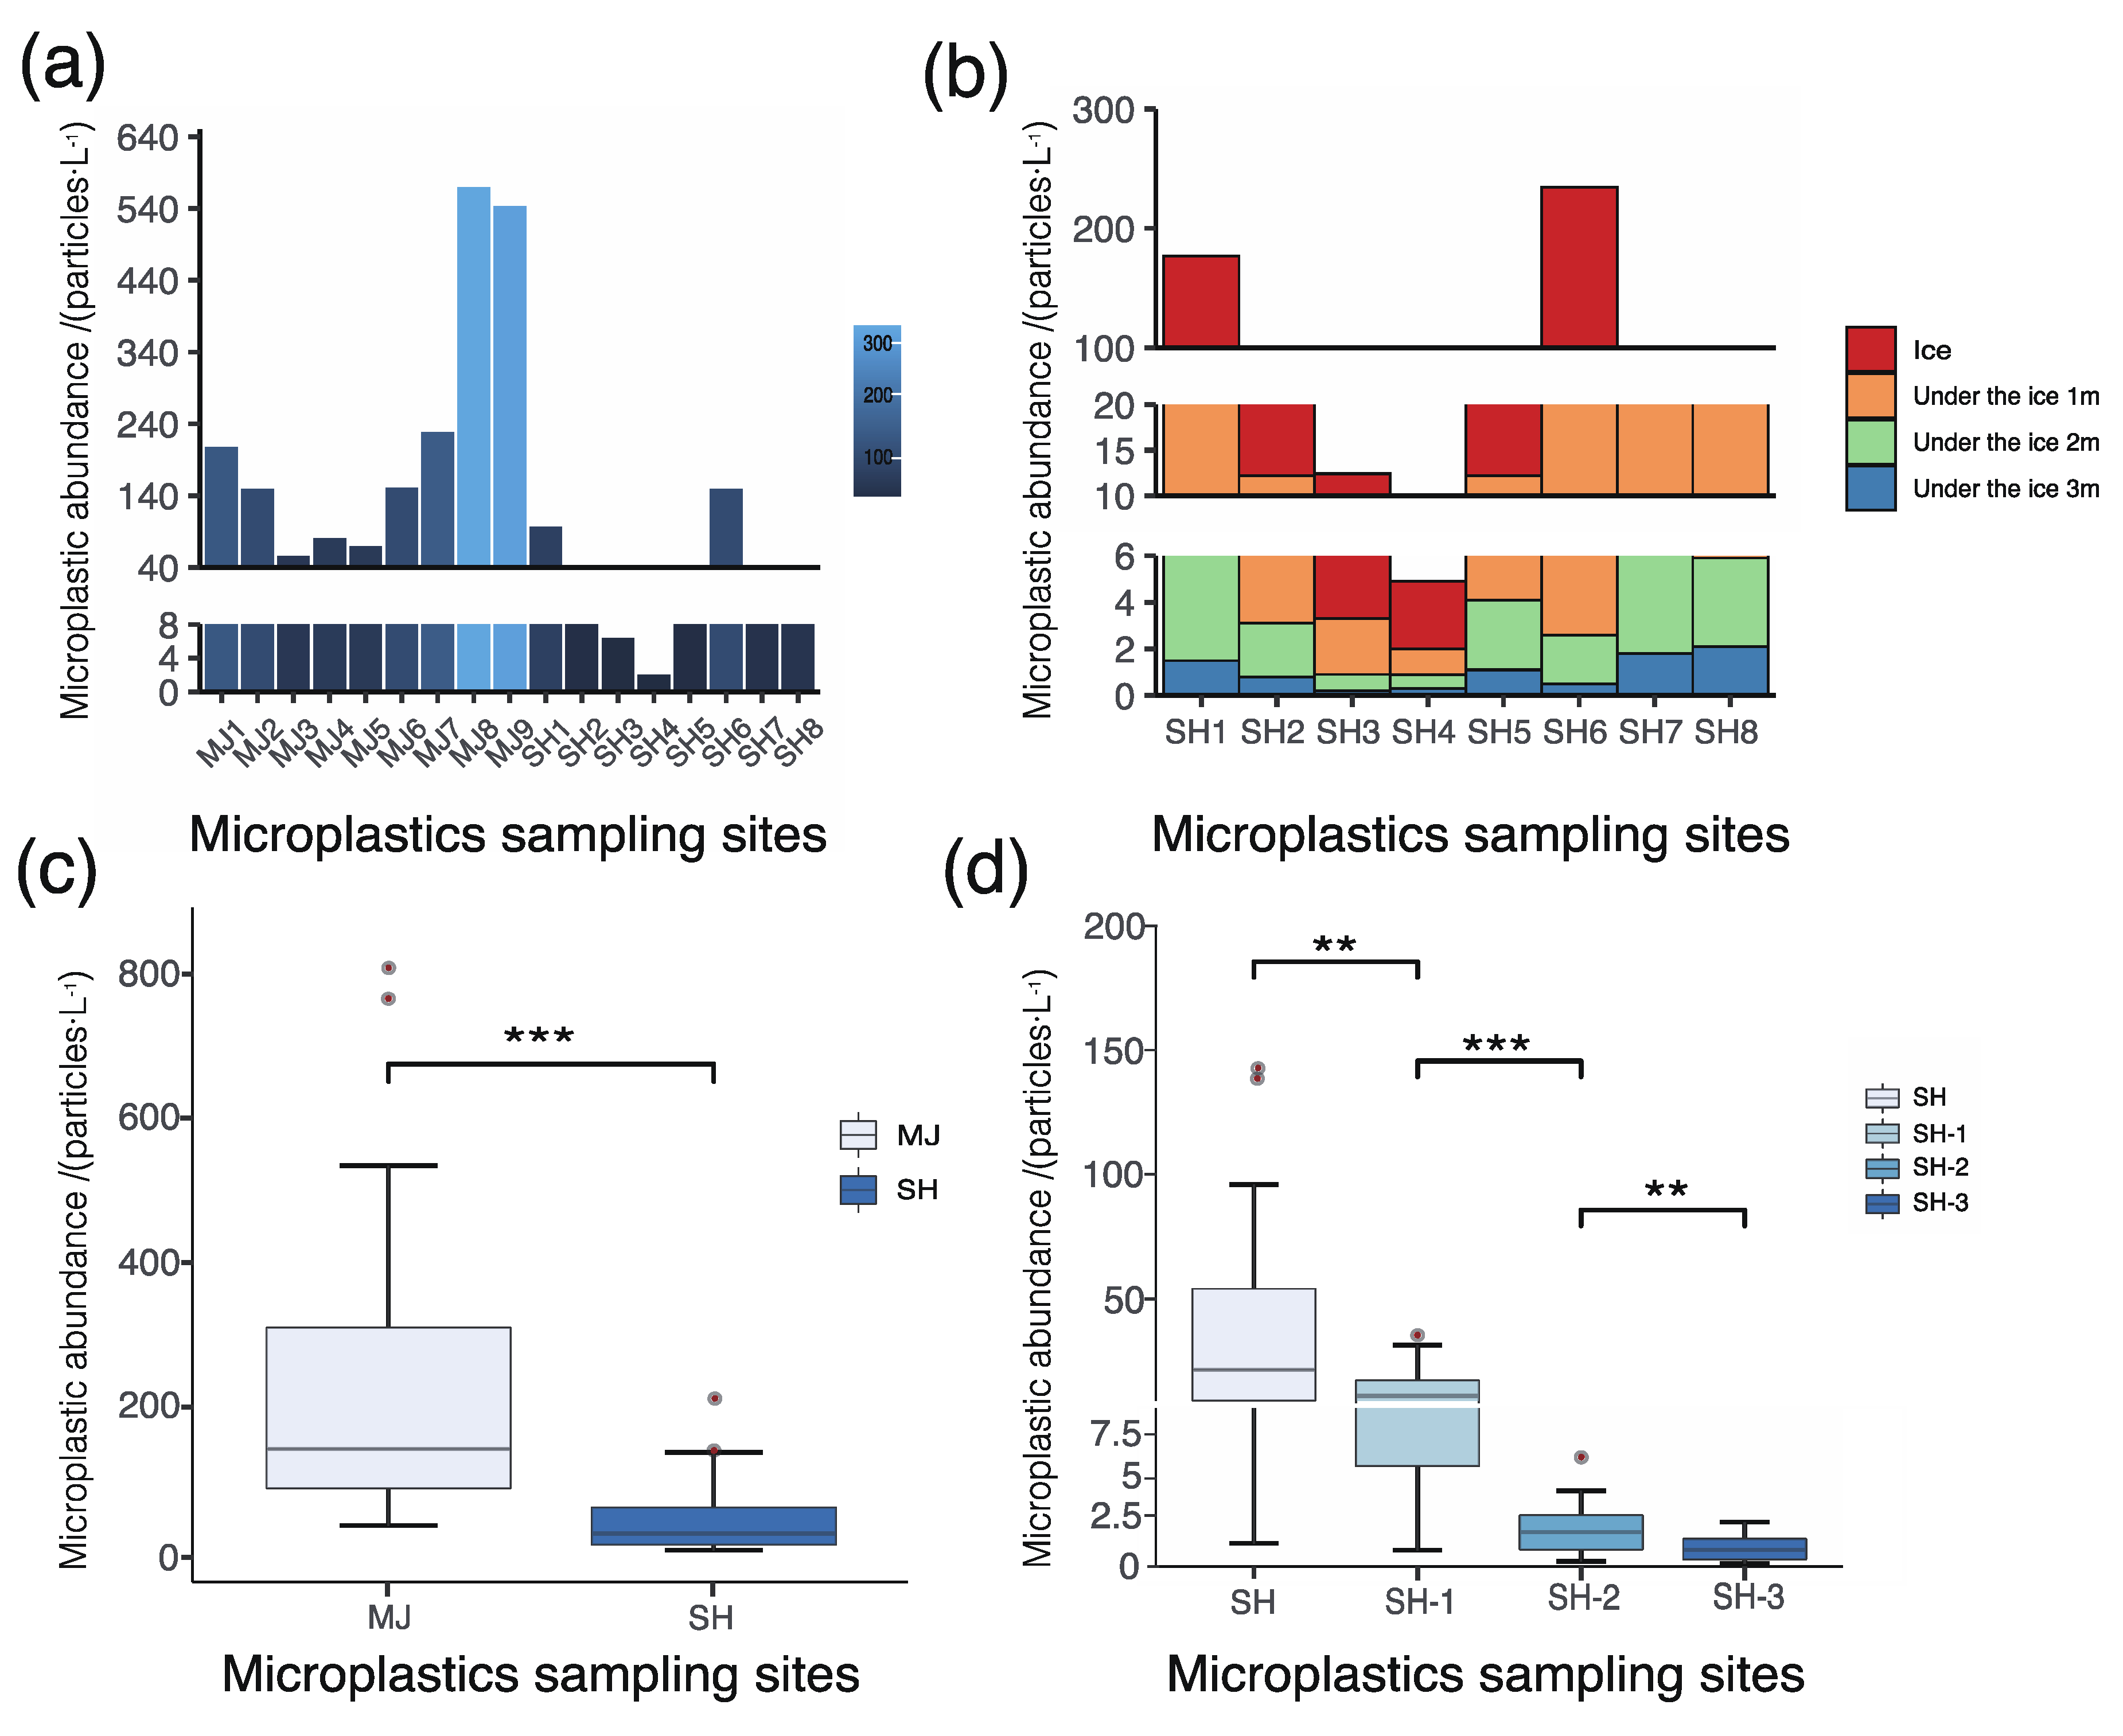
3.1. MPs in Ice of Urban Inland Rivers

MPs were detected in all nine sample sites collected from the urban inland rivers (MJ). The abundance of MPs ranged from 55.7 to 569.8 particles/L, with an average of 324.4 ± 261.5 particles/L. The abundance characteristics are shown in Figure 2a. Combined with the distribution of the sample points, significant spatial changes in the MPs were observed at all nine sites (p < 0.05). The abundance of MPs increased along MJ, and the amount of MPs at the urban sampling points (MJ5–MJ9) was much higher than at the suburban and agricultural areas (MJ1–MJ4). In particular, the MJ8 sample point in the city has the highest abundance of MPs because many residential areas are located around the sample point, including express delivery points, crowded supermarket places, and many drainage pipes [36]. MJ receives the largest amount of domestic sewage, and MJ1 is a reservoir. Although, as the source of MJ, its microplastic abundance should be the lowest, and its nonurban sampling points are the largest because of the many fishing grounds, farmhouses, and other activities in its surrounding area [36]; this leads to an increase in MP abundance at the source of MJ. MJ3 is the point with the least MPs among the MJ sampling points. MJ3 is located in an agricultural area, far away from human activities. In addition to the MPs carried upstream, a small sewage treatment plant has greatly reduced the amount of MPs, and most of the MPs still present are likely carried by snow or wind drift [37].
The urban inland river input greatly affected the abundance of MPs at SH5 and SH6 in the upstream and downstream Majiagou River estuary, resulting in a sharp increase in the abundance of MPs. The abundance was the highest at SH6 (369.5 ± 39.4 particles/L) and the lowest at SH4 (3.5 ± 2.2 particles/L). The abundance of MPs in the Harbin section of the Songhua River followed an overall increasing trend from the upstream to downstream regions. The reason that the abundance of MPs in Majiagou (a tributary) was higher than that in the Songhua River (the mainstream) was that Majiagou received MPs that had been discharged from domestic wastewater, production, and domestic plastic wastes, as well as from industrial and agricultural production from urban areas throughout the city center. The mainstream Songhua River has a large water flow, and because of this, MPs could not easily accumulate [38].

3.2. Abundance of MPs in Ice and Water of Mainstream Songhua River

Figure 2b shows the vertical gradient distribution of MPs from the SH sample in ice and water (p < 0.01). The abundance of MPs in ice ranged from 2.0 to 149.1 particles/L, with an average of 65.1 ± 68.2 particles/L. The abundance of microplastics in SH1 and SH6 ice is higher than at the other sampling sites. The abundance of MPs 1 m beneath the ice surface ranged from 1.1 to 30.8 particles/L, with an average of 12.8 ± 9.4 particles/L. The abundance of MPs 2 m beneath the ice surface ranged from 0.4 to 4.5 particles/L, with an average of 2.9 ± 1.8 particles/L. The abundance of MPs 3 m beneath the ice surface ranged from 0.2 to 2.1 particles/L, with an average of 1.0 ± 0.7 particles/L. The abundances of MPs at the vertical depths of 2 m and 3 m at SH3 and SH4 were lower than at the other sampling sites. Figure 2c shows that the abundance of MPs gradually decreases with the water depth (p < 0.05). If the abundance of MPs in the ice layer is low, their abundance in the vertical water body decreases more substantially, such as SH3 and SH4. This is more apparent than that in the sample points with a higher abundance of MPs in the ice layer.

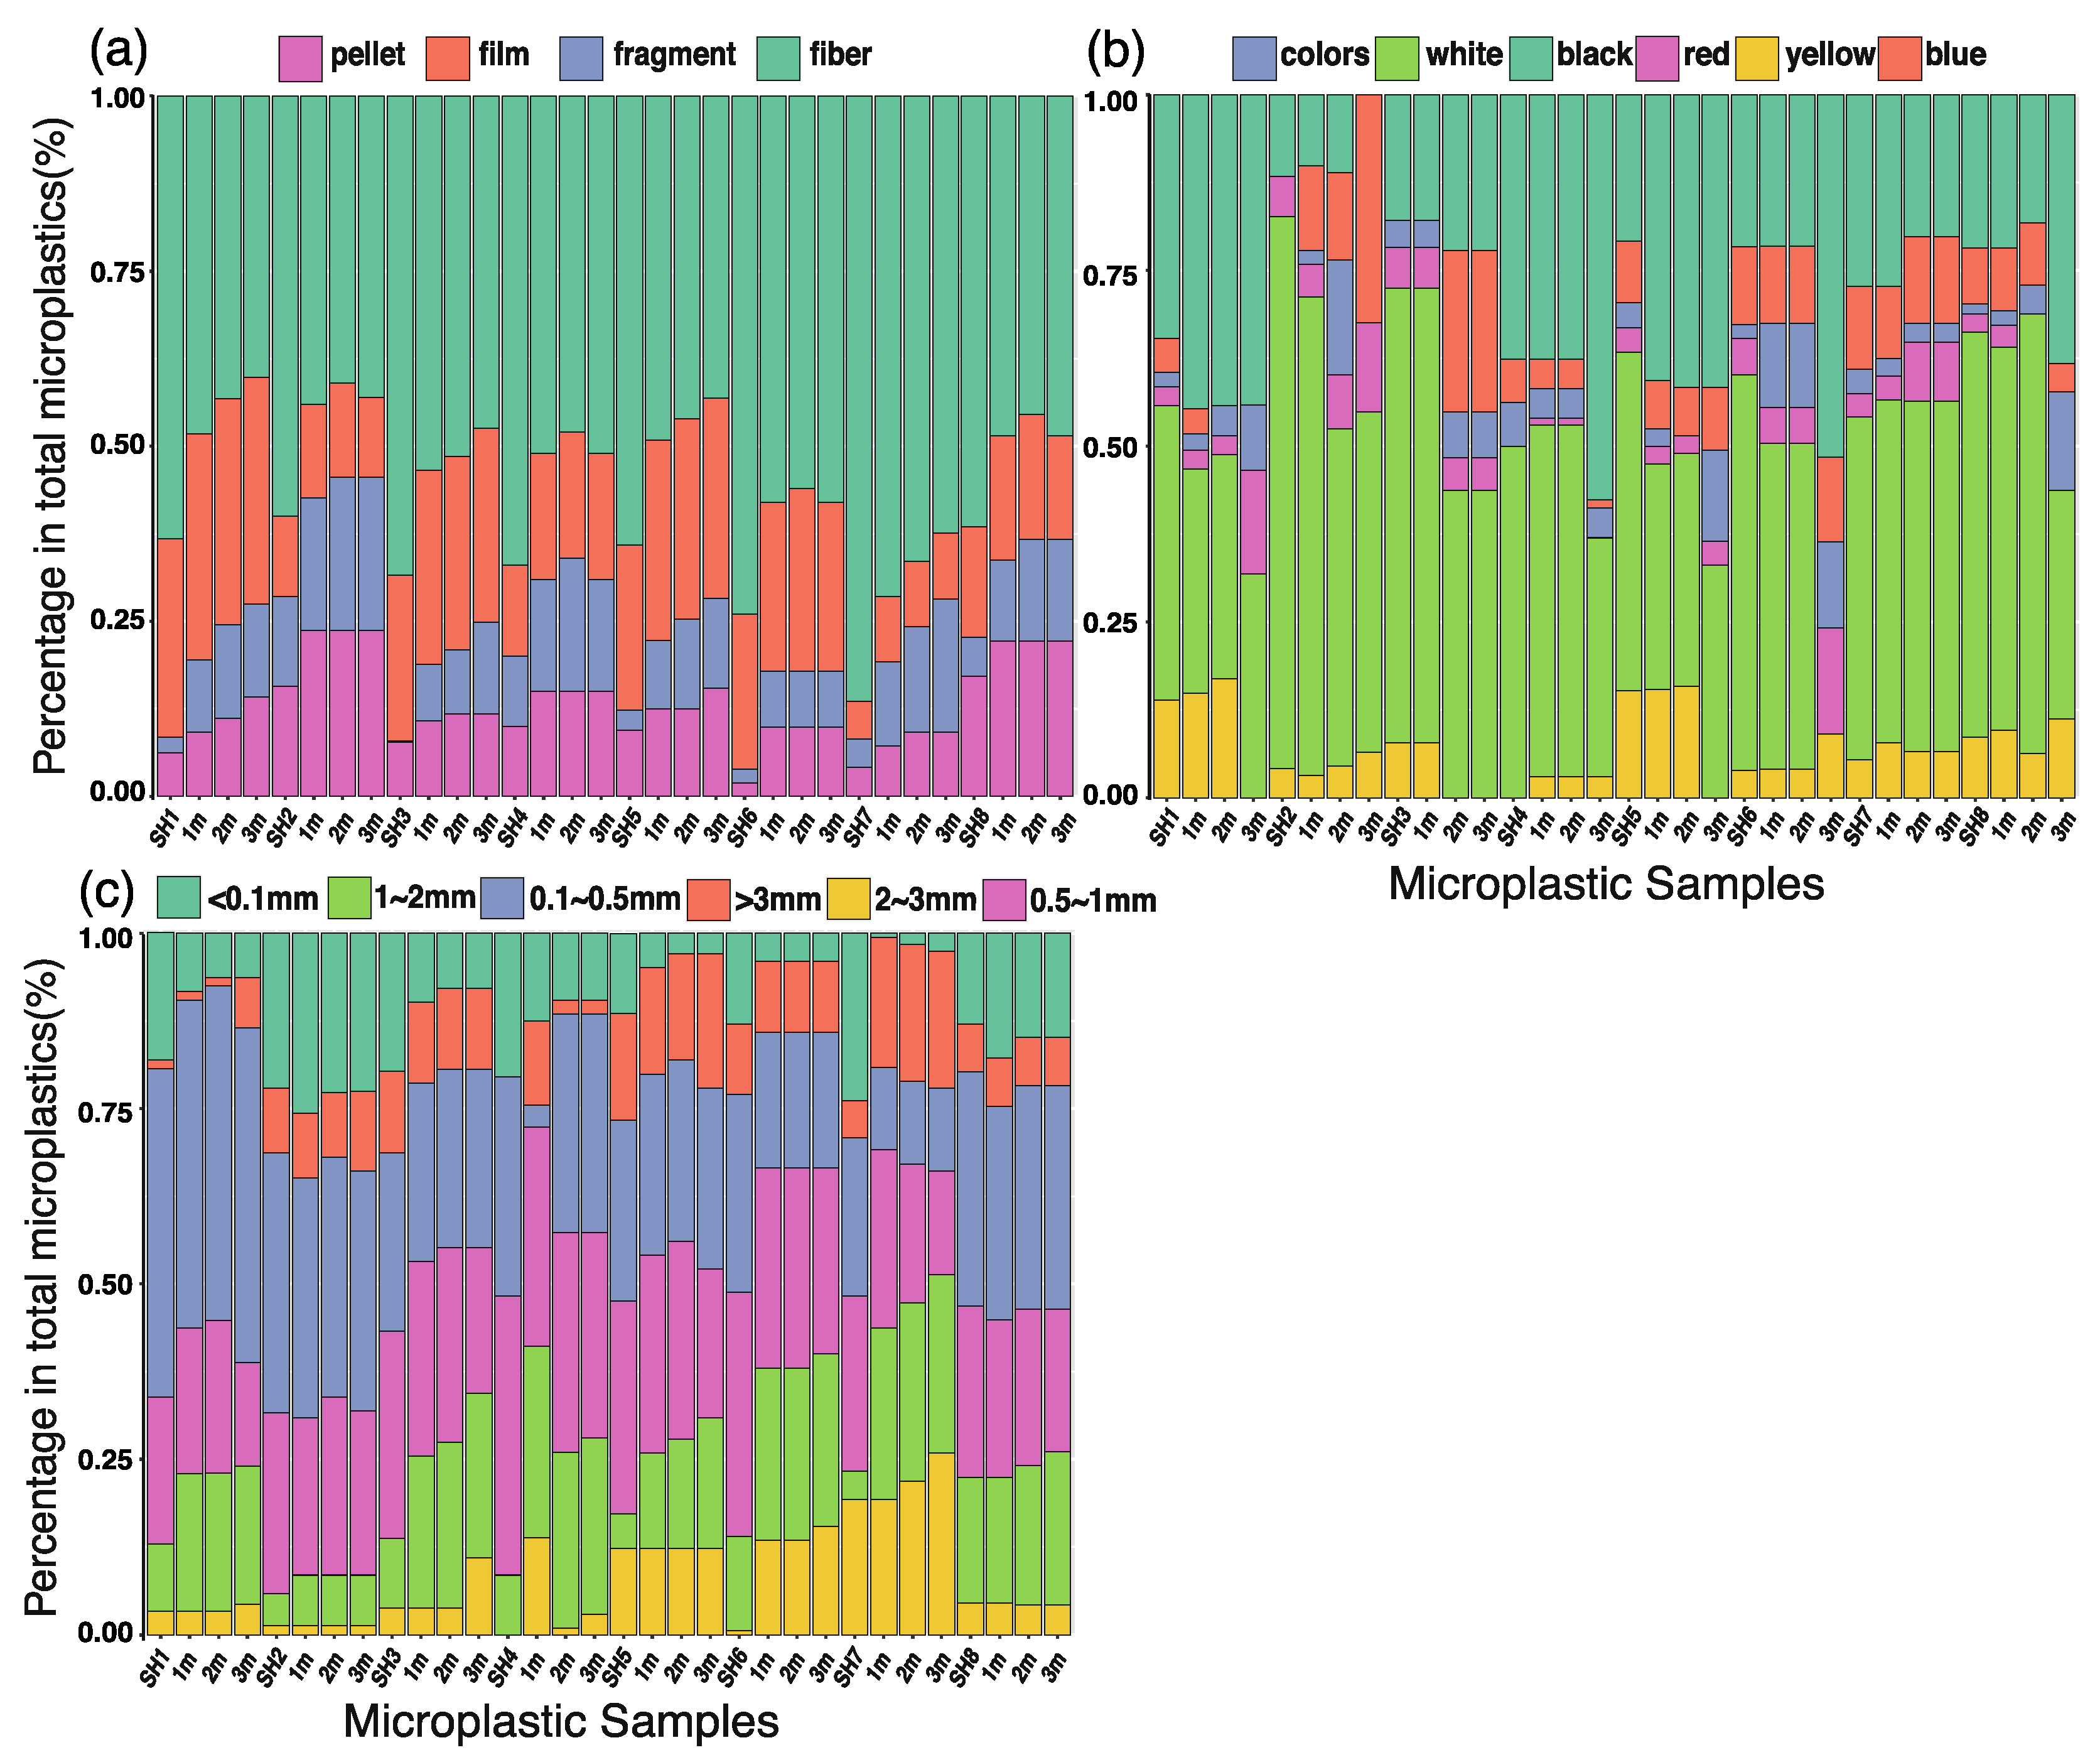
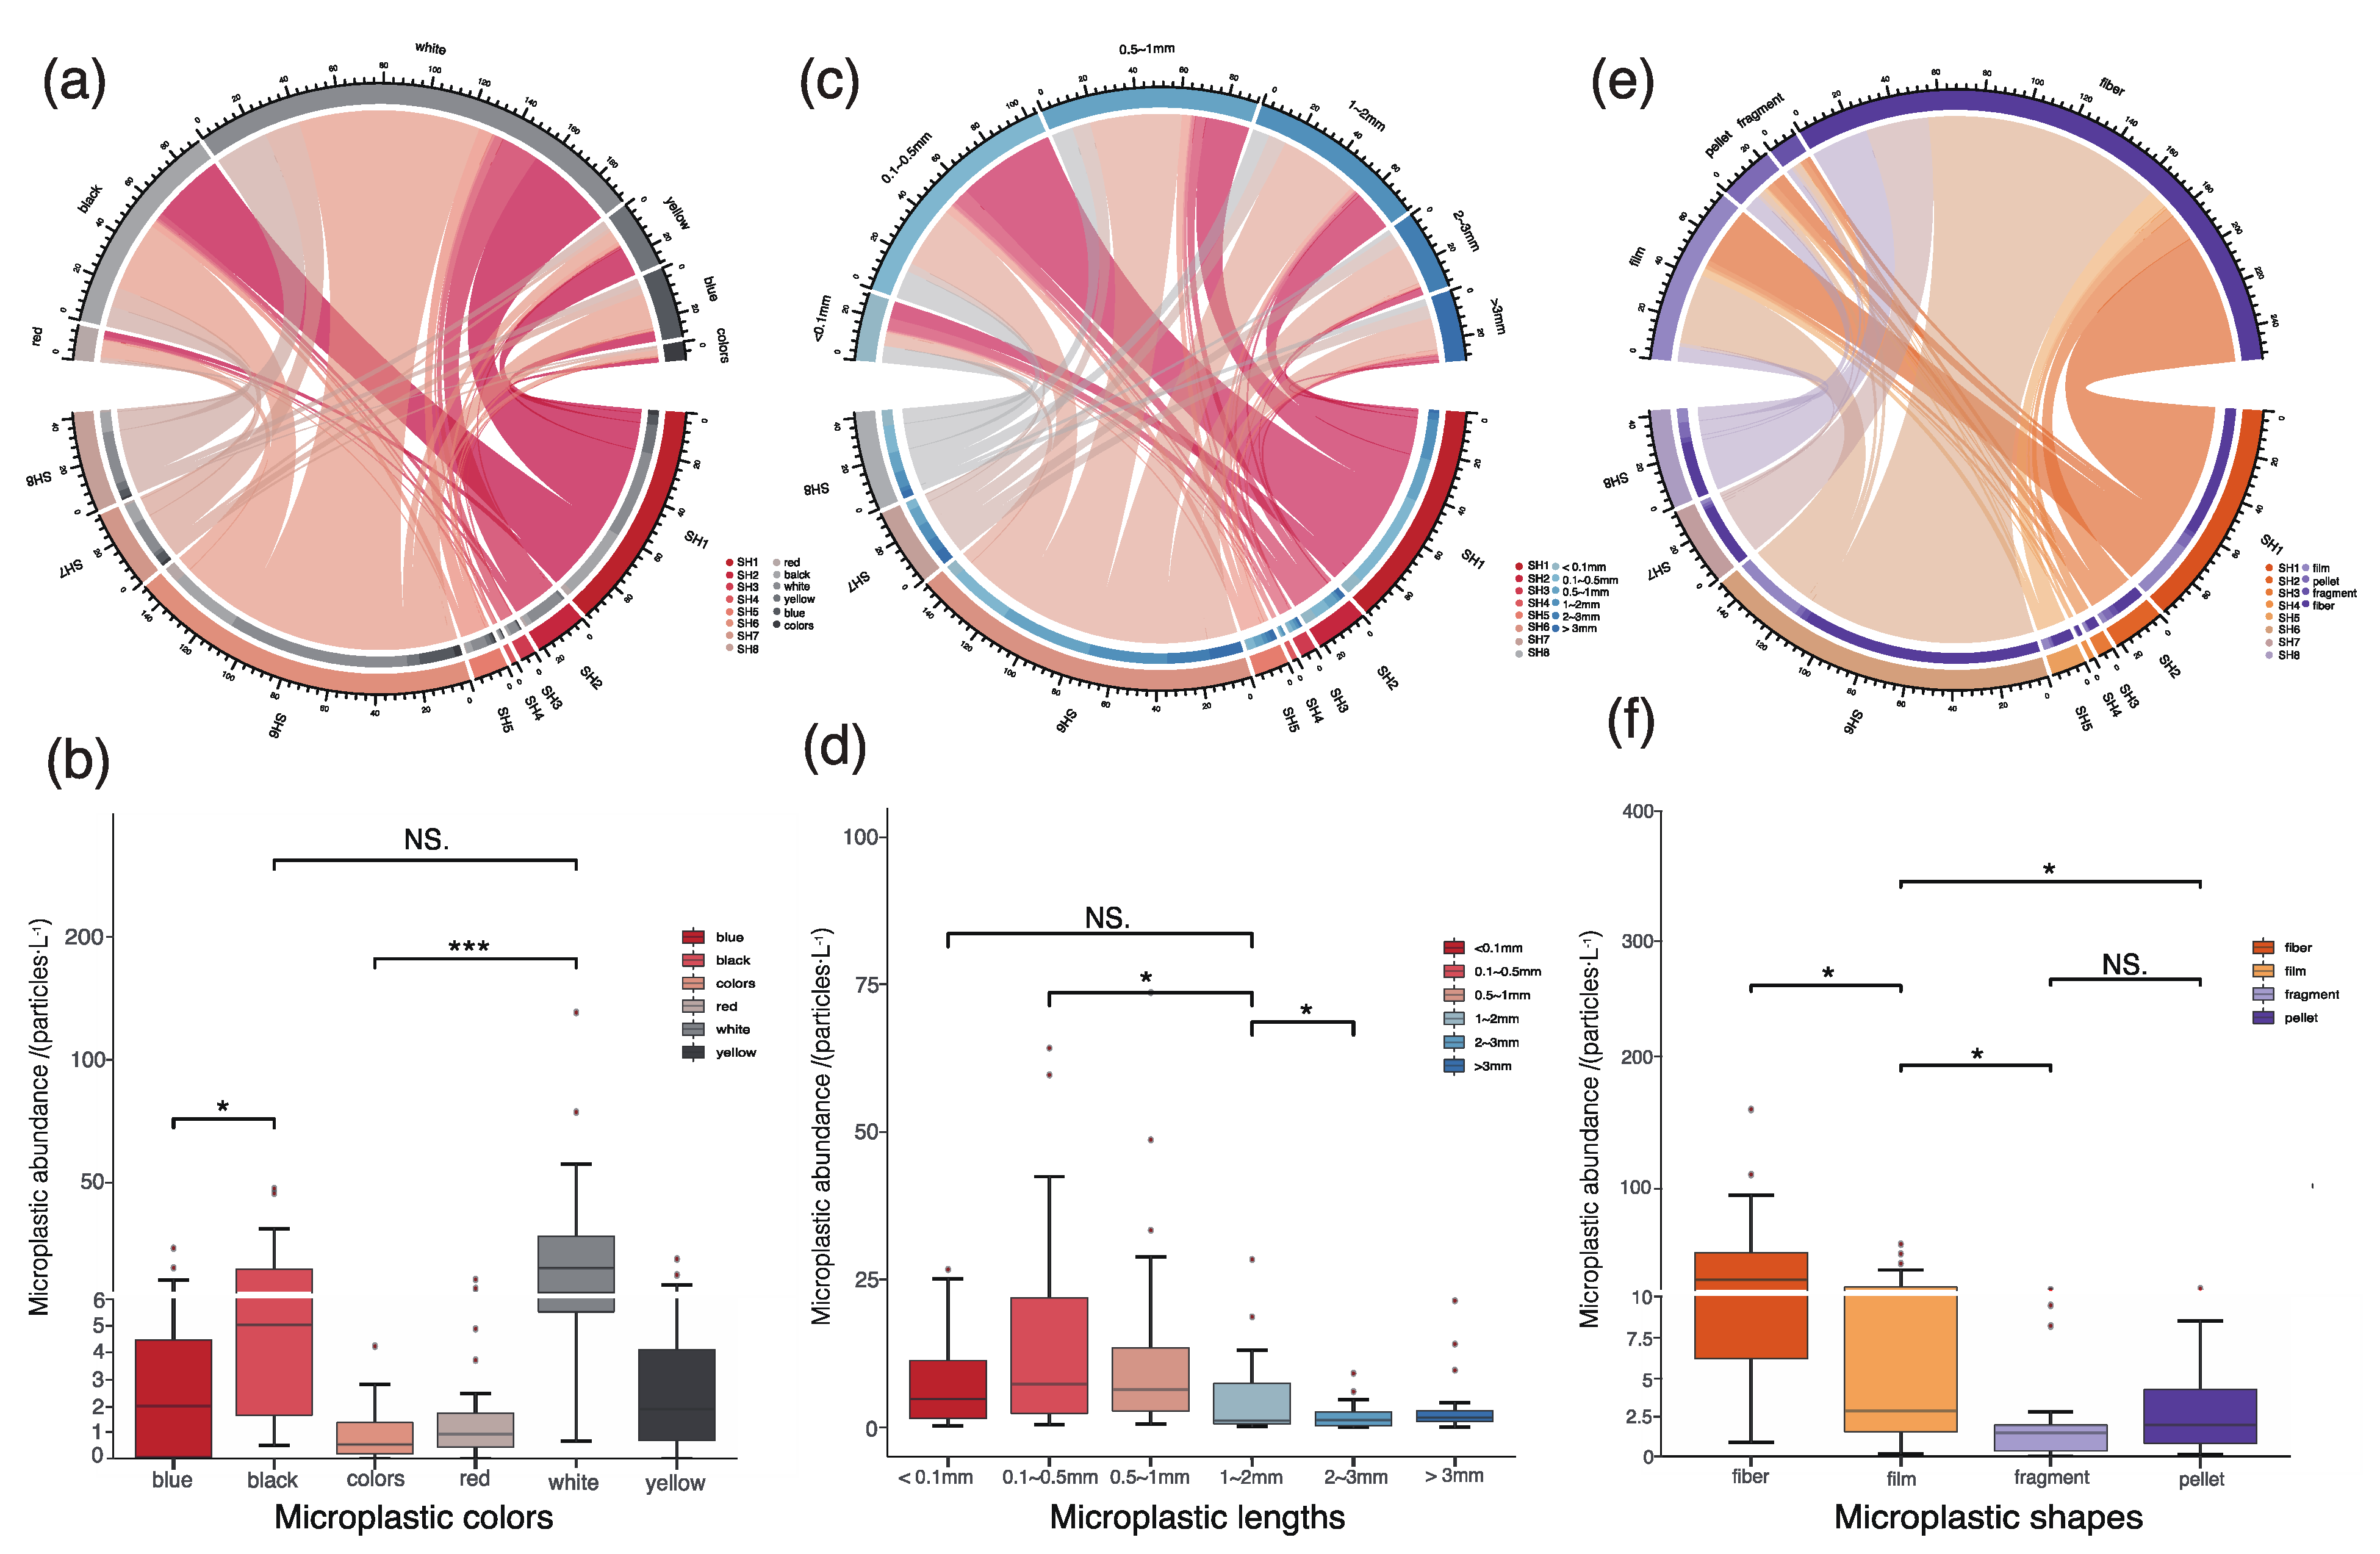
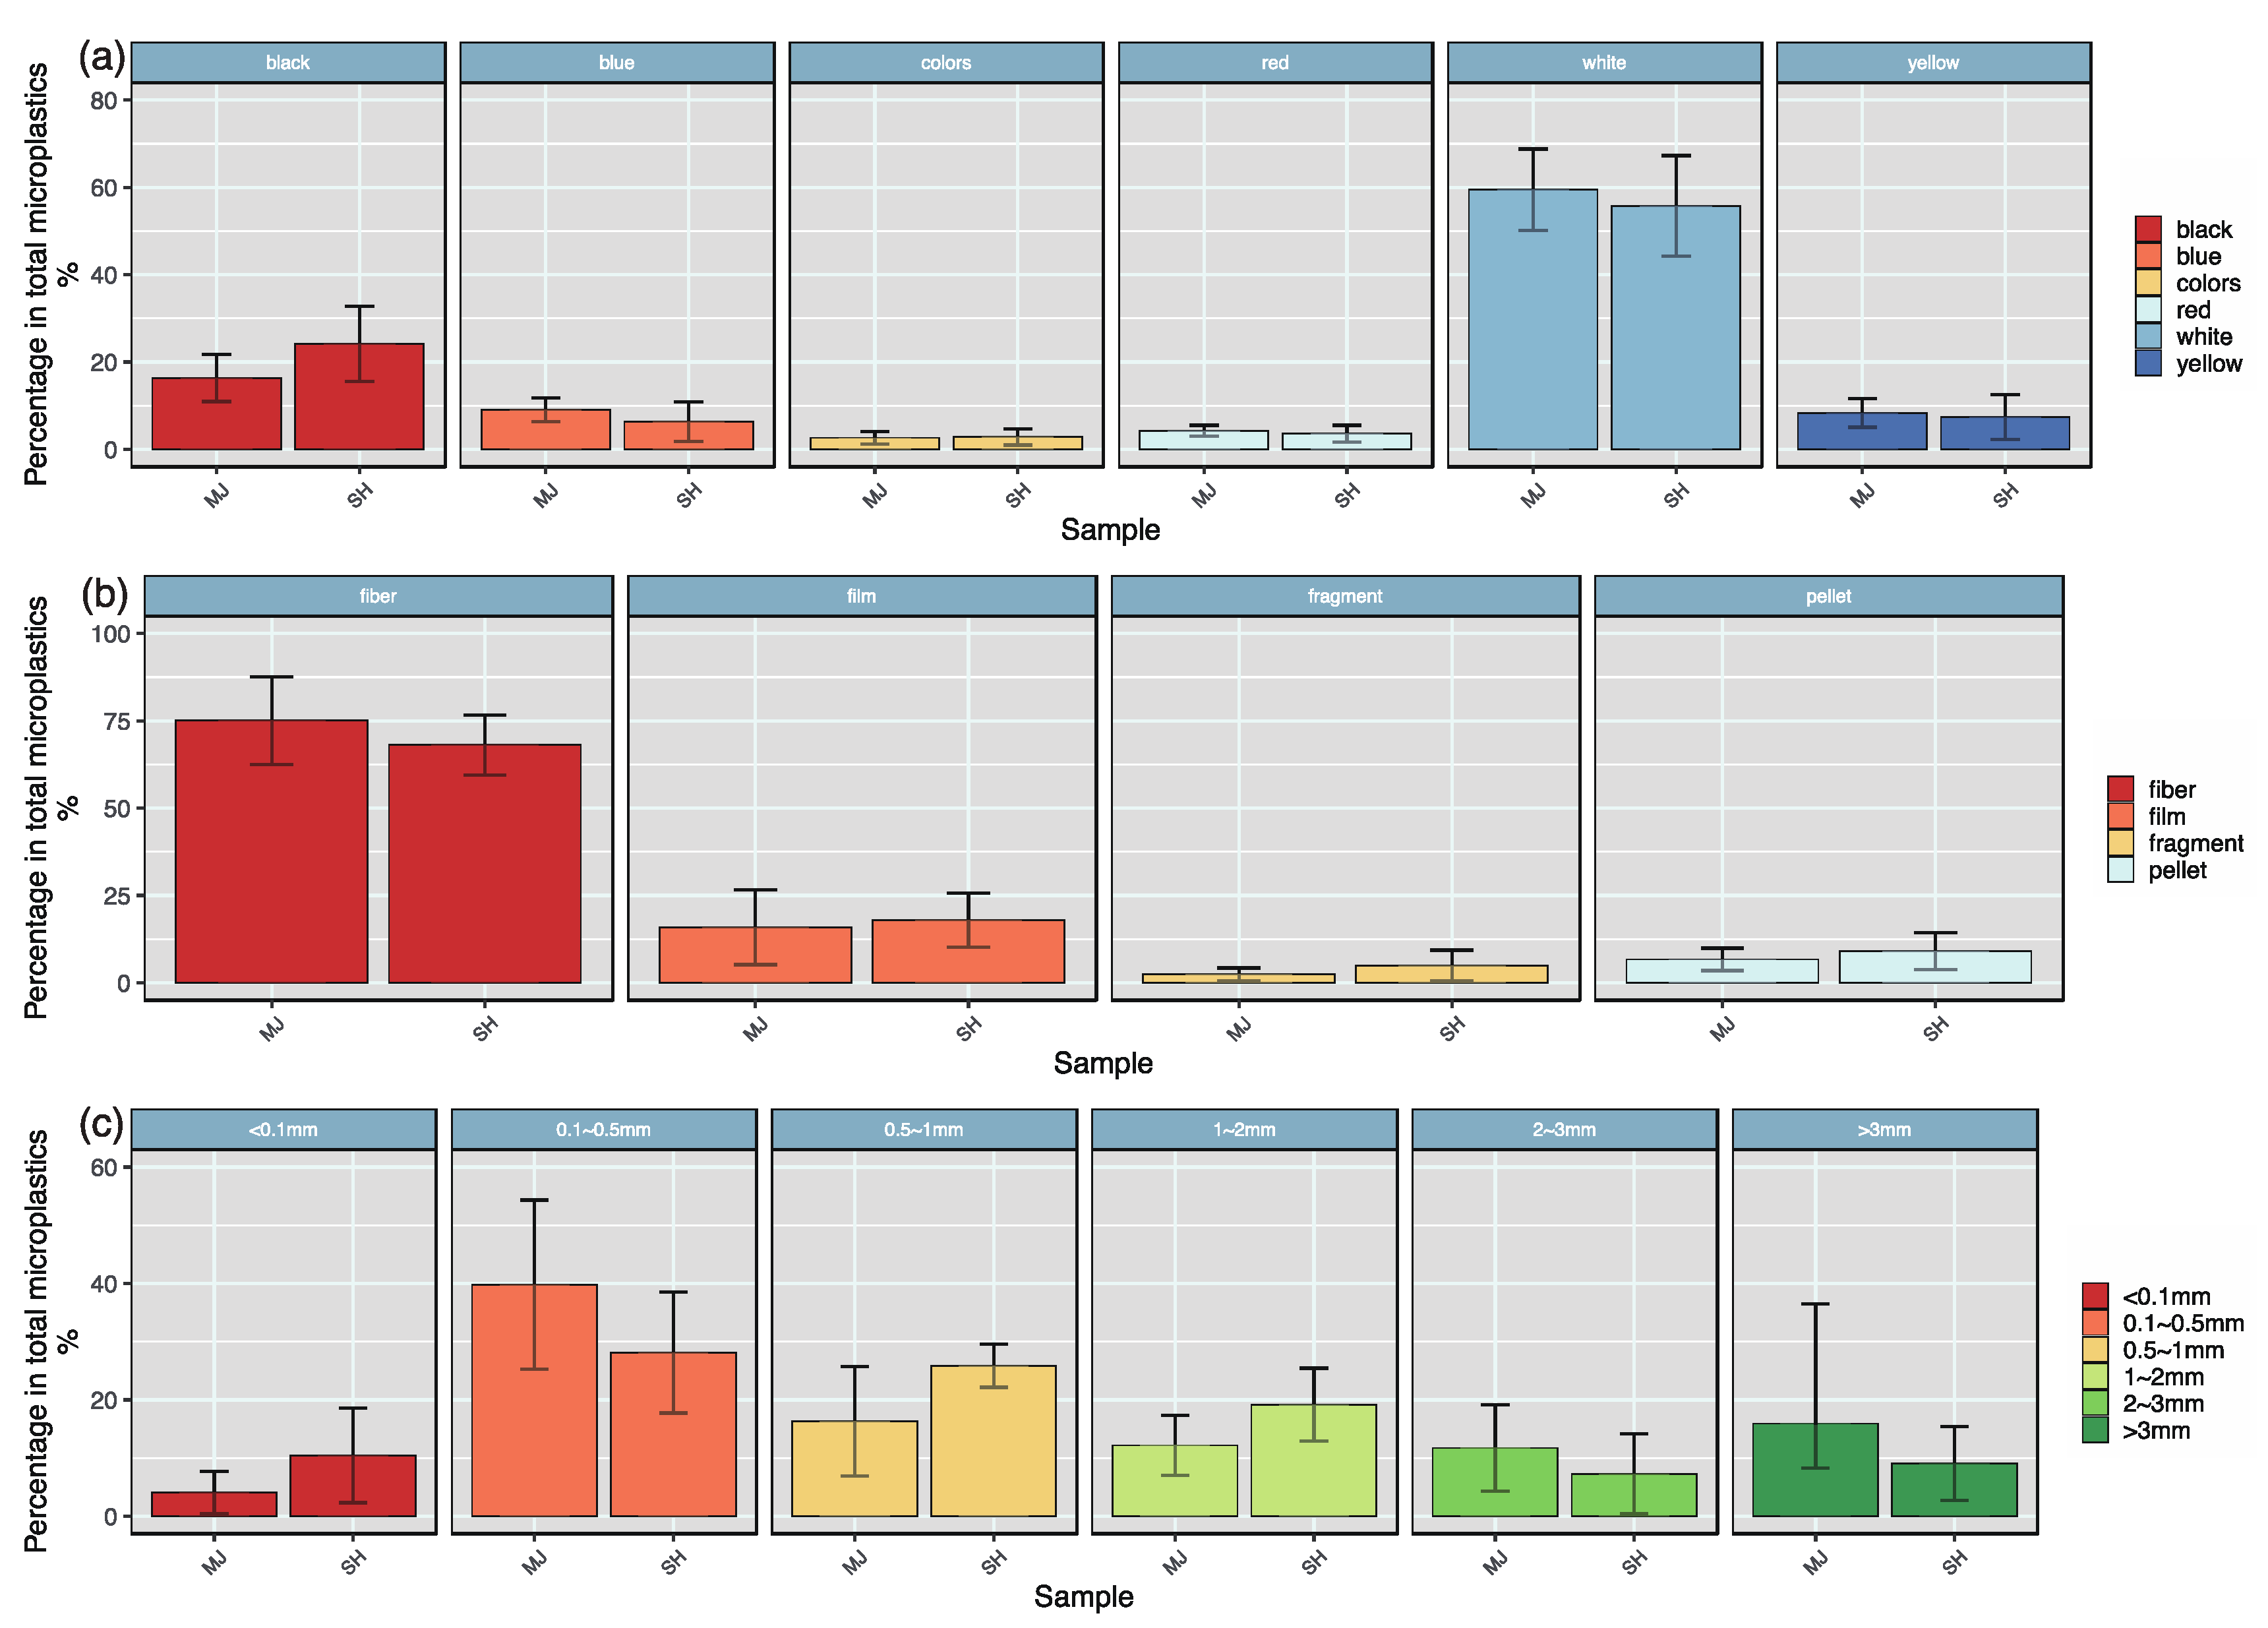
3.3. Classification of Size, Colors, and Shape of MPs in Water and Ice

In the MP samples collected from water, MPs of 0.1–0.5 mm and 0.5–1 mm were the main size types, accounting for 16.19–45.89% and 16.79–50.72% of all MPs, respectively. There was a significant difference in the abundance between them and other MPs (p < 0.01 Figure 3c,d). Regarding the size of the MPs, the proportion of MPs < 0.5 mm was the largest, both in ice and water. This implies that the fragmentation of plastic products is particularly serious, and MPs in the environment are mainly small, which is consistent with the results of other researchers. For example, in Figure A1c (Appendix A), among the MP samples collected in the SH water, 0.1–0.5 mm and 0.5–1.0 mm were the main size types of the MPs, accounting for 11.8–47.2% and 14.8–31.4% of all MPs, respectively. Their abundance was significantly different from that of the other MPs (p < 0.05). Figure A2b shows that the proportions of MPs smaller than 0.1–0.5 mm and 0.5–1.0 mm in ice and water were the largest. However, the amount and proportion of MPs < 0.1 mm in the ice layer were much larger than those of MPs < 0.1 mm in the water (p < 0.05), and the proportion of MPs gradually decreased with depth (Figure 4a,b). This situation also occurred in the ranges of 0.1–0.5 mm and 0.5–1.0 mm MPs. A size of more than 1 mm implies that the fragments of plastic products are particularly serious, and the MPs in the environment are mainly small. This is consistent with the results of other researchers [29,37,39]. According to the definition of MPs (<5 mm), the number of MPs smaller than 0.5 mm accounted for the largest proportion, which further confirms that freezing has a certain impact on the fracture of MPs.
Fiber plastics accounted for 40.2–68.4% of all MPs in water (Figure 3c,d p < 0.01), and film microplastics accounted for 9.4–32.3% of all MPs (Figure A1a). In addition, according to Figure A2a, the abundance of MP fragments in water was higher than in ice because the source of MP fragments is mainly polyethylene terephthalate (PET) and other high-density polymers, which are usually located below the water surface. The proportion of fibers in the ice layer was greater than in the water bodies.
In Figure A1c, white MPs accounted for 0–84.99% (p < 0.01), followed by black MPs, accounting for 9.28–53.79% of all MPs. According to Figure A2c, the abundance of white plastics decreased with depth, while plastics of other colors increased with depth. White MPs are related to fibers (R2 = 0.4385, p < 0.01). This matches the inference before this study. Most of the ice contained a low density of MPs, but many high-density MPs were found in the water.
White MPs accounted for 35.09–70.99% (p < 0.01), followed by black MPs, which accounted for 9.28–53.79% of all MPs (Figure 3a,b and Figure 4a,b). The microscopic observation showed that white and black MPs were mostly fiber and film, which further indicated that the source of MPs was mainly domestic wastes and wastewater, and the composition matched broken fishing nets [40,41]. In addition, oxidized and faded MPs were found in samples, which might be caused by residual bleach in domestic sewage or photooxidation in the environment; it can be verified by comparing the shape and color of MJ and SH microplastics (Figure 5b). These results indicate that the main source of MPs in the city environment is domestic waste, which accounted for a relatively large proportion. Thus, the treatment of domestic wastewater should be strengthened urgently, and residents’ awareness of environmental protection should be improved.

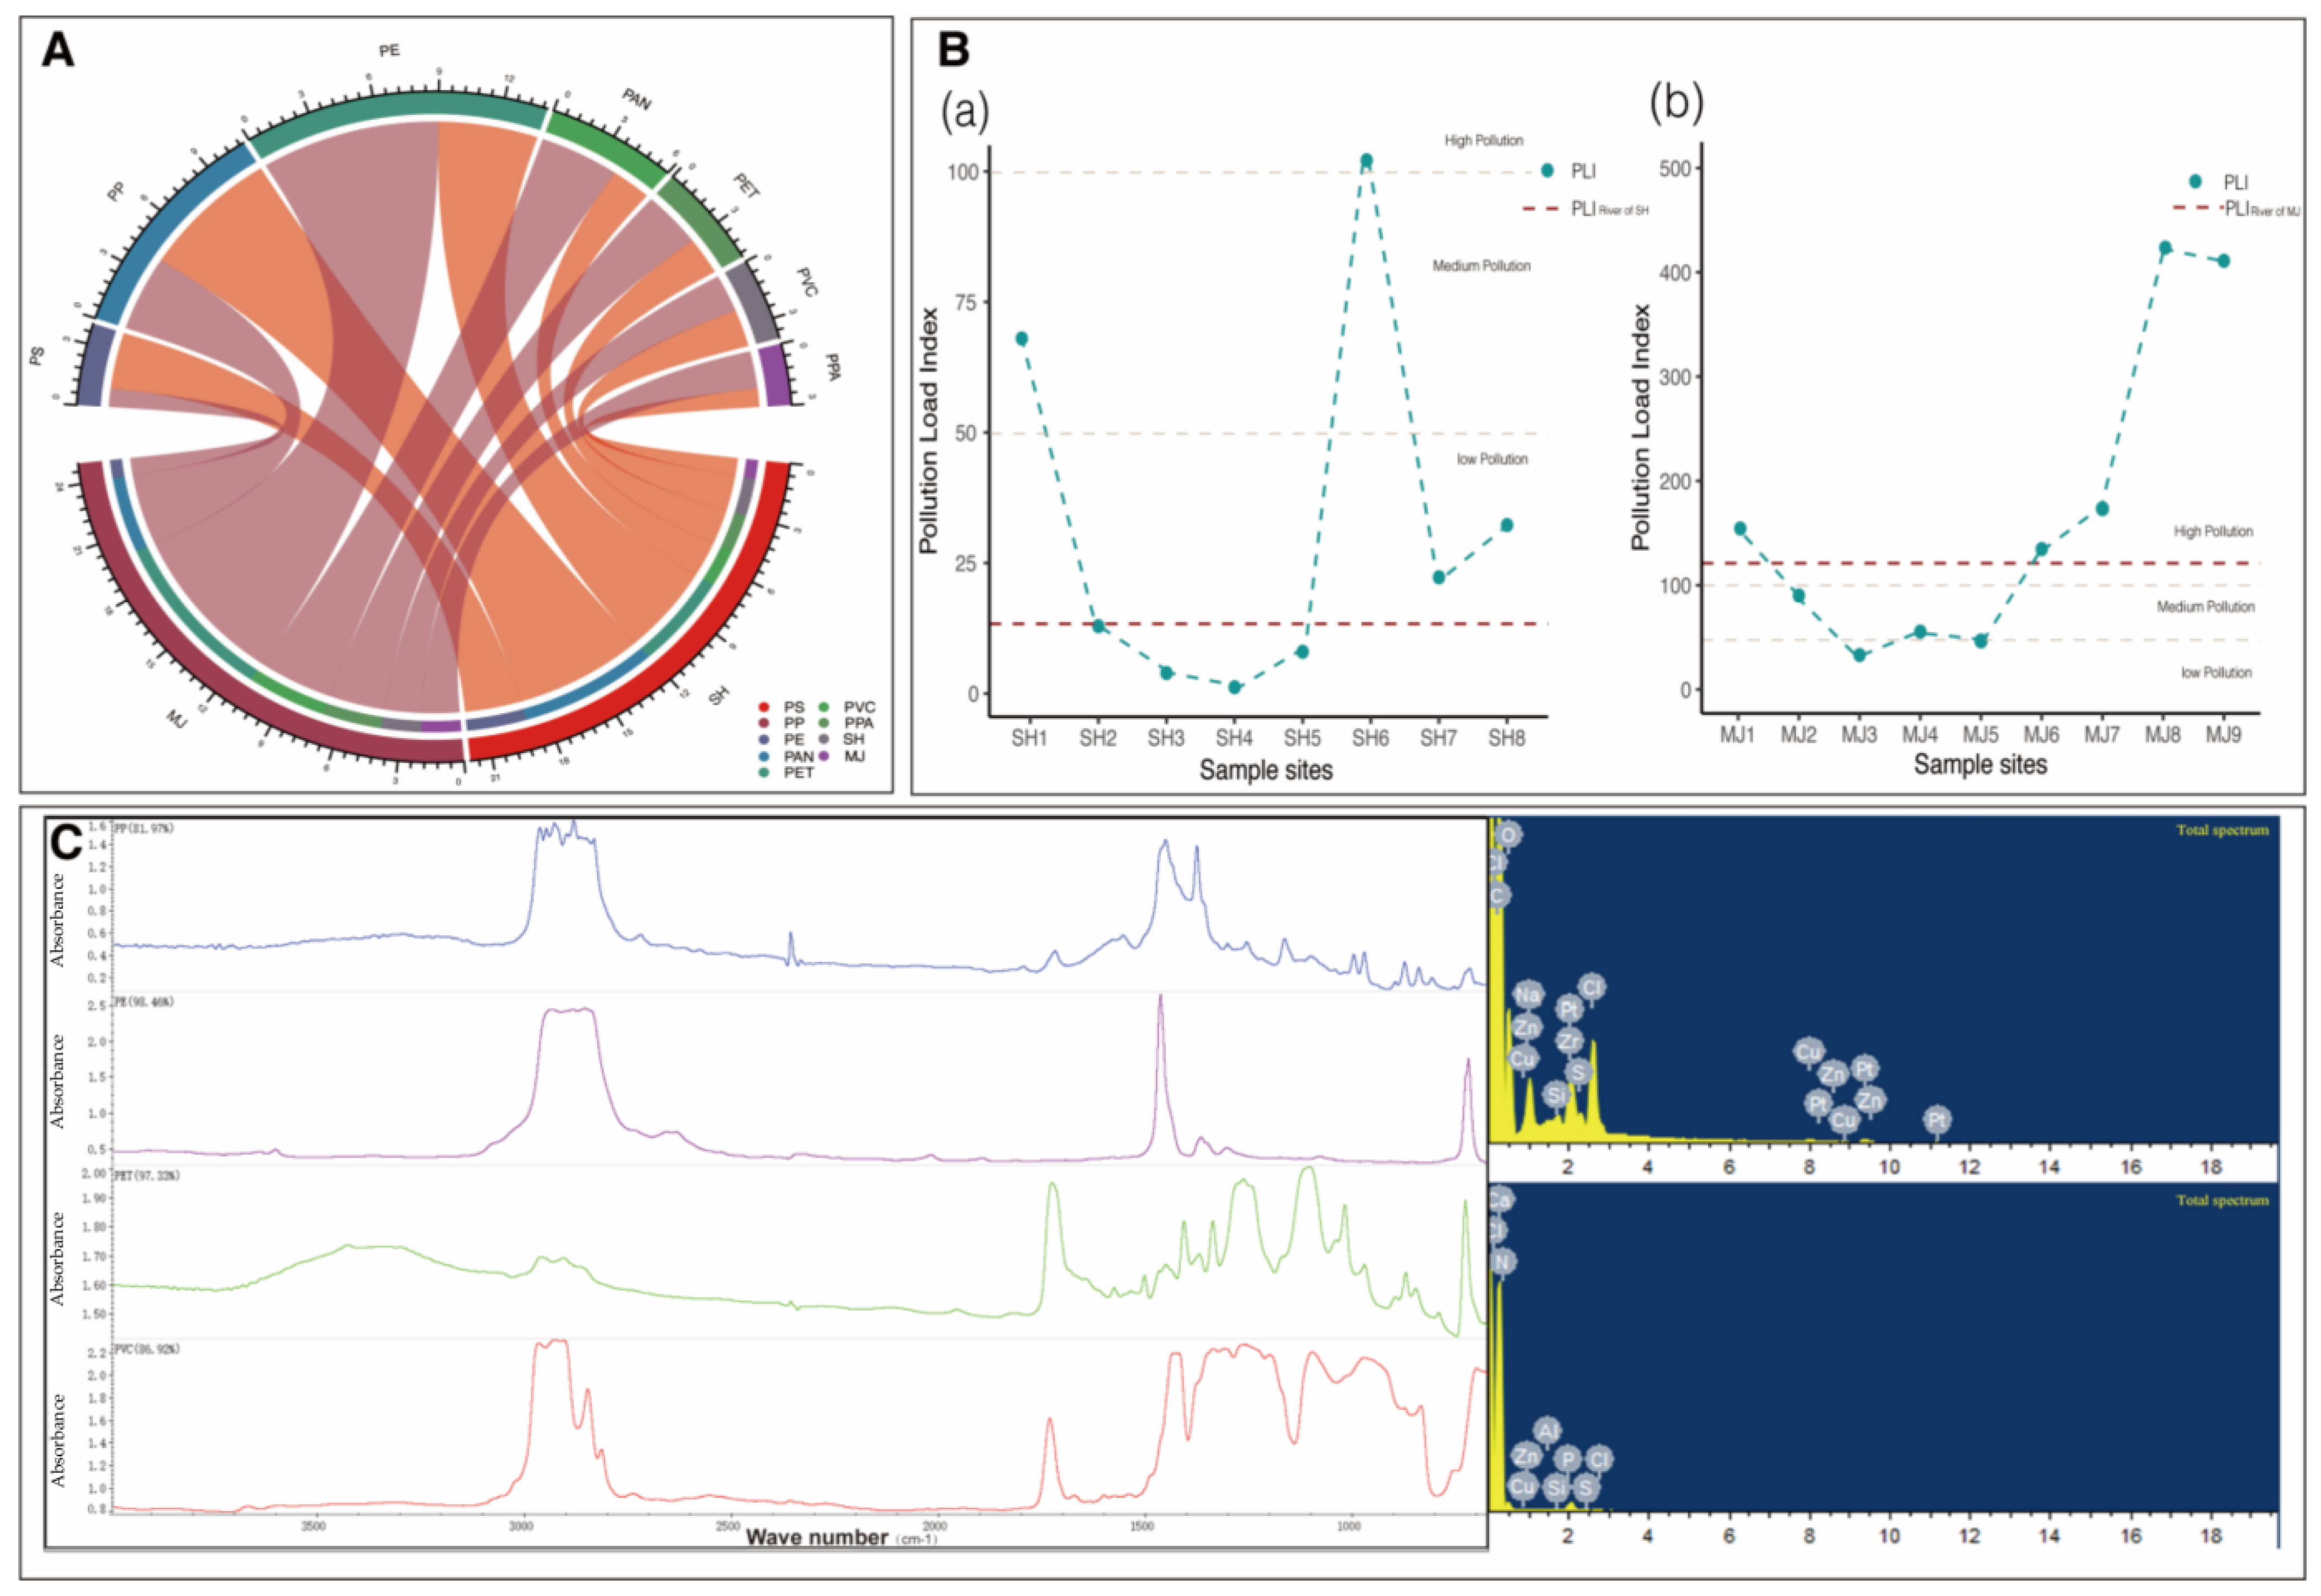
3.4. Polymer Types of MPs

According to the characteristics of fibers, films, fragments, and pellets of the MP samples collected from each sample point, 30 standard MP samples with larger volumes were selected for further analysis. The Fourier-infrared instrument was used to identify the polymer type of MP samples. The results are shown in (Figure 6A). Pollutants discharged during industrial production adhere to the surface of MPs [42], and residues of chemical pollutants such as plasticizers were found in this study. The Fourier-infrared spectra of selected MPs are shown in Figure 6C. In SH, PE is the main type (36%), followed by PP (16%), and PAN (16%). In MJ, PP (31.8%) and PE (22.7%) are the main types, and PET had a lower abundance (1.40 g/cm3). PE (0.941–0.960 g/cm3) is widely used in the manufacturing of films, hollow products, fibers, and commodities. PP (0.92 g/cm3) is used to produce agricultural films and fishing nets, and PAN (1.14–1.15 g/cm3) is widely used to replace wool or is blended with wool to make wool-like fabrics. PAN can also be used for outdoor fabrics, such as ski coats, sails, military canvas, and tents. These polymer types are also common MP pollutants in other areas, such as the Wuhan urban inland rivers and Da Nang, Vietnam [42,43,44,45].
The vertical distribution of MPs in the water column varies with different densities. The abundance of low-density MPs decreases with increasing water depth, while that of high-density MPs follows the opposite trend [46]. PP and PE have lower densities and thus tend to float on the water surface, also migrating with the current of rivers. PET, PAN, PPA (1.35 g/cm3), PVC (1.37 g/cm3), and PS (1.05–1.08 g/cm3) have higher densities and are mainly distributed below the water surface. The density of the MPs themselves is not a decisive factor in determining their vertical distribution. Because water is flowing and disturbed by various environmental factors, the vertical distribution of MPs with different densities in water fluctuates and migrates with the water flow. This also explains why high-density MPs were obtained when collecting MPs from ice [27,31,47].

3.5. Surface Fragmentation and Adsorption Properties of MPs

MPs in the environment are affected by biological or environmental effects, and therefore, their surface changes. By observing the surface condition of MPs, the weathering degree of MP samples can be determined. Both microscopic observation and SEM were used to assess the images and further analyze the weathering characteristics of four typical MPs. When observed under a microscope, MP pellets are slippery spheres or regular circles, as shown in Figure 7a. First, these particles are mostly used in daily necessities and commercial consumables, such as facial scrubs and facial cleansers in skin care products. MPs in water are subject to the physical effects of water motion or water freezing processes [48], resulting in surface cracks and breakage, as shown in Figure 7e,i. The appearance of fibers is slender and cylindrical, and the colors are diverse, as shown in Figure 7b,f,j. The corresponding SEM images are shown in Figure 7f,j, indicating that the fragmentation of the fiber surface was more serious, and there were many very small particles on the surface. Debris observed under the microscope was irregularly shaped and had a certain thickness. As shown in Figure 7c,g,k, cracks and pores were also found on the surface, which can absorb pollutants. The film is a thin and soft multi-colored material. As shown in Figure 7d,h,l, cutting cracks appeared at the edge of the film, and there were many cracks and serious fragmentation. According to the surface characteristics of the above four types, the surface weathering of MPs is serious. Therefore, under the same volume, expansion of the surface area provides good adsorption sites for both organisms and inorganics from the environment, which will further harm the environment.
In the production process, plastic will be mixed with heat stabilizers, colorants, and other additives that contain metal ions. MPs are severely broken and cracked by mechanical movement in the water environment and are the best carriers of pollutants such as microorganisms and heavy metals in the environment. Therefore, the surface of the MPs will adsorb metal ions from the environment [49,50]. MPs with severe surface breakage were selected for energy mass spectrometry detection. The abundance of the same metal ions in the same type of MPs differed, which was inferred to be largely related to the collection environment combined with the crushing situation. The energy dispersion spectrum in Figure 6C reflects the adsorption of heavy metals and was further analyzed. Common elements, such as chlorine (Cl), sodium (Na), silicon (Si), and calcium (Ca), as well as heavy metals such as zinc (Zn) and platinum (Pt), were detected on the surface of the MPs.

3.6. Occurrence of MPs in Representative Urban Inland Rivers

This study showed that the abundance of MPs in ice in the Harbin section of the Songhua River ranged from 12.9 ± 9 to 449.2 ± 156.4 particles/L, which is 2–3 orders of magnitude higher than that in the Shahe River, the Pearl River, and other urban inland rivers (as shown in Table 2). The main reason is that Majiagou is the main river running through the center of the city and also belongs to the city. Many residential areas have developed in its vicinity, resulting in a significant increase in sewage discharge. The Gulf of Mexico is a center of tourism, commerce, and entertainment. At the same time, there are many factories nearby [51]. That basin is mainly affected by residential life, industry, and commerce, resulting in a MP abundance that is also 1–2 orders of magnitude higher than in other urban areas. Human activities also affect the abundance of MPs in the Cumberland River in Nashville, which is one of the major rivers in the southeastern USA. This river is an important urban river because it is the source of drinking water for Nashville [52], a city with a resident population of over 1 million. Many factors, such as sewage treatment plants, lead to a wide distribution and high abundance of MPs [18]. In conclusion, human activities largely affect the abundance of MPs in urban inland rivers. In this study, urban inland rivers are also seriously disturbed by surrounding human factors. In the future, it is necessary to continuously pay attention to MPs in urban inland rivers and to further explore and analyze whether a coupling relationship exists between human activity factors and the abundance of MPs.

3.7. Pollution Risk Assessment

As an emerging global environmental problem, MP pollution is attracting increasing attention. Field studies detailed the accumulation of MPs in freshwater fish, most of which accumulate in intestinal organs, gills, and other visceral organs [8,26,61]. Ecological and environmental problems caused by MPs have also become a research hotspot. In this study, the risk assessment of MP pollution in the Harbin section of the Songhua River was modified in reference to a previous study [32]. The results are shown in Table 3. According to the previous classification, the PLI of each sampling point ranged from 1.49 to 416.09. Although the pollution degree varied across various areas, most areas showed mild pollution. The pollution degrees at SH1, SH6, MJ1, MJ6, MJ7, MJ8, and MJ9 were much higher than those at the other sampling points (Figure 6B), which belonged to moderate and severe pollution, and the source was mostly domestic plastic waste.

4. Discussion

As shown in Figure 1 and Figure 2a, the abundance of MPs in the Harbin section of the Songhua River showed an overall increasing trend from upstream to downstream. The content of SH6 was the highest (149.1 particles/L), and an MJ9 input from urban inland rivers had a great impact on the MP abundances at SH5 and SH6 in the upstream and downstream of the Majiagou estuary. Majiagou is an important river flowing through the main urban area of Harbin. This river not only receives input from the source reservoir but also obtains domestic sewage discharge, agricultural irrigation water, industrial wastewater discharge, rainwater, and other sources [58,62]. In addition, the population density around Majiagou is high, and there are many human impacts; therefore, the MP abundance of SH6 in the downstream area is far greater than at the other SH sample points, which led to a sharp increase in the abundance of MPs. During the sampling process, two points of the river between SH3 and SH4 were not frozen. The reason for this was that the drainage pipe of the upstream tributary was found to be in working condition, and therefore, the tributary always kept flowing. Because there was a continuous flow of water into the Songhua River, which affected the SH4 sample point (2.0 particles/L), the MP content at this point was the lowest. Interestingly, the MP abundance at the SH2 sample point (21.9 particles/L) was consistent with the expected results. It can be speculated that the MP abundance at SH2 is greatly affected by the SH1 located upstream. During the collection process, there was no sign of human activity around the sample point, which was difficult to reach. Although the amount of MPs can also increase by atmospheric sedimentation or snowfall [63], this increase can be ignored compared with the amount already in rivers; therefore, SH1 was the main reason for the collection of MPs at SH2. Although SH1 (96.7 particles/L) is located the farthest from the urban area of Harbin, the MP abundance is greater than the average value (65.0 particles/L) of the SH sample point. During the sampling process, an abandoned plastic greenhouse, fish pond, and other agricultural production areas were found around the sampling point. This indicates that there were traces of frequent living and agricultural activities here before, and a large number of abandoned fish cages remained [45].
As shown in Figure 2b,c, two results were found: first, the abundance of MPs in the ice layer is 5–10 times higher than that in water; second, the abundance of MPs in the water decreases with increasing depth. Industrial plastic products are usually divided into high-density and low-density to meet the needs of life and other aspects, but both densities are lower than the density of water. Therefore, the distribution of MPs on the vertical gradient decreases with increasing depth [64], which is consistent with the results obtained in this study, corroborating the physical properties of MPs. During the ice-sealing period, ice dams are formed in the narrow or shallow parts of rivers, and then ice blocks are rapidly frozen on the riverbank, and the river is iced against the current. The MPs on the water surface will be temporarily stored in ice. In addition, water is the only substance that expands between 0 °C and 4 °C. When the temperature decreases from 4 °C, water starts to expand, the volume becomes larger, the density becomes smaller, and the buoyancy increases. When the temperature reaches 0 °C, the water starts to freeze, thus isolating the temperature transmission under the ice. Therefore, under an ice layer, rivers will not freeze. From the ice surface to the water, the temperature becomes higher and higher, which further affects the density. Certain high-density MPs will sink, causing a precipitation reaction, which affects the amount of MPs stored in ice [65]. The ice–water mixture will have a slow superposition effect with the external temperature. Therefore, the approximate amount of MP materials stored in the ice layer depends on the material of the MPs in the environment, i.e., their density. In conclusion, the number of MPs in ice layers is greater than that in water, and this number decreases with increasing depth.
The abundance of MPs in Majiagou (tributary) is higher than that in Songhua River (trunk stream). The reasons are as follows: (1) Majiagou is relatively narrow compared with Songhua River, and its water flow is several orders of magnitude smaller. Moreover, the water volume of the Songhua River is large, while that of Majiagou is small. (2) Majiagou receives domestic sewage from the central urban area of the city. This sewage contains plastic products produced in the plant area, industrial wastes, and agricultural production wastewater discharged in the agricultural area, which is closely related to the population density [38]. In follow-up research, the effects of human activities on MPs will be examined.
As new carriers of environmental pollutants, heavy metals attached to the surface of MPs interact with chemicals in the aquatic environment, thus impacting the environment [19]. However, a further in-depth exploration of the relationship between MPs and environmental factors is still necessary. It remains unknown whether environmental factors such as the pH, nitrogen content, and temperature will interfere with the adhesion of pollutants such as heavy metals and organic substances to the surface of MPs. Potentially toxic elements usually exhibit a bivalent basic toxic behavior. At low abundances, they are essential micronutrients for life, while at higher abundances, they can impair the development of life. Heavy metal adsorption can potentially harm other organisms in the environment. In this regard, experiments will be designed in the future to explore the correlation between the adsorbed amounts of MPs and heavy metals and the emissions from human life and industry.
The reason why MPs adsorb heavy metals, antibiotics, and other environmental pollutants present in the environment is that they have just entered the water environment; here, oxygen-containing functional groups form on their surface, producing polar groups and changing the surface charge, thus affecting the adsorption characteristics of the MP surface [17,37,66]. The present study showed that these particles on the surface of MPs may be other pollutants from the environment, which may potentially impact other organisms in the environment in the long term. Because MPs are swallowed by aquatic organisms and accumulate in their bodies for a long time, if ingested by higher trophic levels (e.g., predators), they will enter the food chain and eventually affect the normal metabolism and reproduction of humans and various other organisms [14,16,67].
MPs are still a new form of pollutant that is difficult to decompose naturally. In addition, urban inland rivers are closely related to the water source of an urban area, and their pollution greatly impacts human health and is a potential source of harm [20]. In recent years, MPs have been found in human blood [68], indicating that blood can absorb MPs. To prevent further damage to the human body caused by MPs, it is necessary to strengthen the research on MP pollution in the future. Research methods of environmental MP ecotoxicology should be established, such as comprehensive monitoring and long-term impact assessment systems of MPs in the environment, to avoid serious pollution risks.

5. Conclusions

This study identified MP pollution in the ice and water of the Harbin and Songhua Rivers in the inland section of the city during the ice-sealing period. The abundance of MPs in ice was found to be about 11 times higher than in water. The surface of MPs is severely fractured. During the freezing process of the river in winter, the MP particles are easily fixed and sealed by the ice sheet, resulting in the breakage of MPs. As a result, the amount of smaller MPs in the ice is relatively large. MPs are mainly composed of polypropylene and polyethylene, while common elements and heavy metals have also been detected on the surface of MPs. The results of the risk assessment showed that the degree of MP pollution in the Harbin section of Songhua River and in most urban inland river areas was mild, while in certain areas, MP pollution was moderate or severe. However, it is not clear whether MPs affect downstream organisms or the environment or whether there is a relationship between the abundance of pollutants adsorbed on the surface of MPs and the physicochemical properties of the environment. Therefore, future research needs to focus on the potential risks that MP substances pose to the aquatic environment. Supervision of the water environment needs to be strengthened during the winter months to prevent the occurrence of pollution-damage events.

Author Contributions

L.C.: Investigation, methodology, analyses, writing the initial draft, and finalizing the manuscript; Y.L. (Yingfei Liao): Project administration and data curation; K.Z.: Reviewing and editing; Y.W.: Conceptualization, reviewing the initial draft, and finalizing the manuscript; Y.L. (Yongliang Li): Data curation and conceptualization; H.W.: Funding acquisition, supervision, reviewing the initial draft, and finalizing the manuscript. All authors have read and agreed to the published version of the manuscript.

Funding

This work was supported by the Fundamental Research Funds for the Central Universities (2572021BE03), the Natural Sciences Foundation of Heilongjiang Province (LH2021C004), and the Heilongjiang Postdoctoral Science Foundation (LBH-Z19102).

Institutional Review Board Statement

Not applicable.

Informed Consent Statement

Not applicable.

Data Availability Statement

Data will be available on request.

Conflicts of Interest

The authors declare no conflicts of interest.

Appendix A

Figure A1. Proportion of different characteristics of MPs (%), (a) The proportion of microplastics shape; (b) the proportion of microplastics color; (c) the proportion of microplastics size.
Sustainability 16 02731 g0a1
Figure A2. Comparison of color (a), size (b), and status quo (c) of MPs at different depths in Majiagou water.
Sustainability 16 02731 g0a2

References

  1. Thompson, R.C.; Olsen, Y.; Mitchell, R.P.; Davis, A.; Rowland, S.J.; John, A.W.; McGonigle, D.; Russell, A.E. Lost at sea: Where is all the plastic? Science 2004, 304, 838. [Google Scholar] [CrossRef] [PubMed]
  2. ISO 4484-1:2023(E); Textiles and Textile Products Microplastics from Textile Sources. International Organisation for Standardization (ISO): Geneva, Switzerland, 2023.
  3. Duis, K.; Coors, A. Microplastics in the aquatic and terrestrial environment: Sources (with a specific focus on personal care products), fate and effects. Environ. Sci. Eur. 2016, 28, 2. [Google Scholar] [CrossRef] [PubMed]
  4. Chen, Q.; Gundlach, M.; Yang, S.; Jiang, J.; Velki, M.; Yin, D.; Hollert, H. Quantitative investigation of the mechanisms of microplastics and nanoplastics toward zebrafish larvae locomotor activity. Sci. Total Environ. 2017, 584–585, 1022–1031. [Google Scholar] [CrossRef]
  5. Guo, Z.; Boeing, W.J.; Xu, Y.; Borgomeo, E.; Mason, S.A.; Zhu, Y.G. Global meta-analysis of microplastic contamination in reservoirs with a novel framework. Water Res. 2021, 207, 117828. [Google Scholar] [CrossRef] [PubMed]
  6. Yang, L.; Zhang, Y.; Kang, S.; Wang, Z.; Wu, C. Corrigendum to “Microplastics in soil: A review on methods, occurrence, sources, and potential risk”. Sci. Total Environ. 2021, 801, 149616. [Google Scholar] [CrossRef] [PubMed]
  7. Geyer, R.; Jambeck, J.R.; Law, K.L. Production, use, and fate of all plastics ever made. Sci. Adv. 2017, 3, e1700782. [Google Scholar] [CrossRef] [PubMed]
  8. Yan, Z.; Chen, Y.; Bao, X.; Zhang, X.; Nie, Y. Microplastic pollution in an urbanized river affected by water diversion: Combining with active biomonitoring. J. Hazard. Mater. 2021, 417, 126058. [Google Scholar] [CrossRef] [PubMed]
  9. Mani, T.; Burkhardt-Holm, P. Seasonal microplastics variation in nival and pluvial stretches of the Rhine River—From the Swiss catchment towards the North Sea. Sci. Total Environ. 2020, 707, 135579. [Google Scholar] [CrossRef]
  10. Eibes, P.M.; Gabel, F. Floating microplastic debris in a rural river in Germany: Distribution, types and potential sources and sinks. Sci. Total Environ. 2022, 816, 151641. [Google Scholar] [CrossRef] [PubMed]
  11. Lei, S.; Xue, Y.; Li, L.; Yang, D.; Shi, H. Microplastics in Taihu Lake, China. Environ. Pollut. 2016, 216, 711–719. [Google Scholar] [CrossRef]
  12. O’Brien, S.; Rauert, C.; Ribeiro, F.; Okoffo, E.D.; Burrows, S.D.; O’Brien, J.W.; Wang, X.Y.; Wright, S.L.; Thomas, K.V. There’s something in the air: A review of sources, prevalence and behaviour of microplastics in the atmosphere. Sci. Total Environ. 2023, 874, 162193. [Google Scholar] [CrossRef] [PubMed]
  13. Yin, K.; Wang, Y.; Zhao, H.; Wang, D.; Guo, M.; Mu, M.; Liu, Y.; Nie, X.; Li, B.; Li, J.; et al. A comparative review of microplastics and nanoplastics: Toxicity hazards on digestive, reproductive and nervous system. Sci. Total Environ. 2021, 774, 145758. [Google Scholar] [CrossRef]
  14. O’Connor, J.D.; Lally, H.T.; Koelmans, A.A.; Mahon, A.M.; O’Connor, I.; Nash, R.; O’Sullivan, J.J.; Bruen, M.; Heerey, L.; Murphy, S. Modelling the transfer and accumulation of microplastics in a riverine freshwater food web. Environ. Adv. 2022, 8, 100192. [Google Scholar] [CrossRef]
  15. Lusher, A. Microplastics in the Marine Environment: Distribution, Interactions and Effects; Springer International Publishing: Berlin/Heidelberg, Germany, 2015; pp. 245–307. [Google Scholar] [CrossRef]
  16. Okeke, E.S.; Okoye, C.O.; Atakpa, E.O.; Ita, R.E.; Nyaruaba, R.; Mgbechidinma, C.L.; Akan, O.D. Microplastics in agroecosystems-impacts on ecosystem functions and food chain. Resour. Conserv. Recycl. 2022, 177, 105961. [Google Scholar] [CrossRef]
  17. Zettler, E.R.; Mincer, T.J.; Amaral-Zettler, L.A. Life in the ‘Plastisphere’: Microbial Communities on Plastic Marine Debris. Environ. Sci. Technol. 2013, 47, 7137–7146. [Google Scholar] [CrossRef] [PubMed]
  18. Bertoldi, C.; Lara, L.Z.; Mizushima, F.A.L.; Martins, F.C.G.; Battisti, M.A.; Hinrichs, R.; Fernandes, A.N. First evidence of microplastic contamination in the freshwater of Lake Guaiba, Porto Alegre, Brazil. Sci. Total Environ. 2021, 759, 143503. [Google Scholar] [CrossRef]
  19. Sultana, M.; Rownok, M.H.; Sabrin, M.; Rahaman, M.H.; Alam, S.M.N. A review on experimental chemically modified activated carbon to enhance dye and heavy metals adsorption. Clean. Eng. Technol. 2022, 6, 100382. [Google Scholar] [CrossRef]
  20. Thandavamoorthy Rajeswari, I.; Iyyanar, A.; Govindarajulu, B. Microplastic pollution in Kolavai Lake, Tamil Nadu, India: Quantification of plankton-sized microplastics in the surface water of lake. Environ. Sci. Pollut. Res. 2023, 30, 94033–94048. [Google Scholar] [CrossRef] [PubMed]
  21. Hitchcock, J.N. Storm events as key moments of microplastic contamination in aquatic ecosystems. Sci. Total Environ. 2020, 734, 139436. [Google Scholar] [CrossRef] [PubMed]
  22. Mbedzi, R.; Cuthbert, R.N.; Wasserman, R.J.; Murungweni, F.M.; Dalu, T. Spatiotemporal variation in microplastic contamination along a subtropical reservoir shoreline. Environ. Sci. Pollut. Res. 2020, 27, 23880–23887. [Google Scholar] [CrossRef] [PubMed]
  23. Wang, G.; Lu, J.; Li, W.; Ning, J.; Zhou, L.; Tong, Y.; Liu, Z.; Zhou, H.; Xiayihazi, N. Seasonal variation and risk assessment of microplastics in surface water of the Manas River Basin, China. Ecotoxicol. Environ. Saf. 2021, 208, 111477. [Google Scholar] [CrossRef] [PubMed]
  24. Wong, G.; Lowemark, L.; Kunz, A. Microplastic pollution of the Tamsui River and its tributaries in northern Taiwan: Spatial heterogeneity and correlation with precipitation. Environ. Pollut. 2020, 260, 113935. [Google Scholar] [CrossRef] [PubMed]
  25. Hoffmann, L.; Eggers, S.L.; Allhusen, E.; Katlein, C.; Peeken, I. Interactions between the ice algae Fragillariopsis cylindrus and microplastics in sea ice. Environ. Int. 2020, 139, 105697. [Google Scholar] [CrossRef] [PubMed]
  26. Kelly, A.; Lannuzel, D.; Rodemann, T.; Meiners, K.M.; Auman, H.J. Microplastic contamination in east Antarctic sea ice. Mar. Pollut. Bull. 2020, 154, 111130. [Google Scholar] [CrossRef] [PubMed]
  27. Li, L.; Li, M.; Deng, H.; Cai, L.; Cai, H.; Yan, B.; Hu, J.; Shi, H. A straightforward method for measuring the range of apparent density of microplastics. Sci. Total Environ. 2018, 639, 367–373. [Google Scholar] [CrossRef] [PubMed]
  28. Cabernard, L.; Roscher, L.; Lorenz, C.; Gerdts, G.; Primpke, S. Comparison of Raman and Fourier Transform Infrared Spectroscopy for the Quantification of Microplastics in the Aquatic Environment. Environ. Scicence Technol. 2018, 52, 13279–13288. [Google Scholar] [CrossRef]
  29. Zhang, J.; Zhang, C.; Deng, Y.; Wang, R.; Ma, E.; Wang, J.; Bai, J.; Wu, J.; Zhou, Y. Microplastics in the surface water of small-scale estuaries in Shanghai. Mar. Pollut. Bull. 2019, 149, 110569. [Google Scholar] [CrossRef]
  30. Angulo, E. The Tomlinson Pollution Load Index applied to heavy metal, ‘Mussel-Watch’ data: A useful index to assess coastal pollution. Sci. Total Environ. 1996, 187, 19–56. [Google Scholar] [CrossRef]
  31. Mandour, A.; El-Sayed, M.K.; El-Gamal, A.A.; Khadr, A.M.; Elshazly, A. Temporal distribution of trace metals pollution load index in the Nile Delta coastal surface sediments. Mar. Pollut. Bull. 2021, 167, 112290. [Google Scholar] [CrossRef] [PubMed]
  32. Xu, P.; Peng, G.; Su, L.; Gao, Y.; Gao, L.; Li, D. Microplastic risk assessment in surface waters: A case study in the Changjiang Estuary, China. Mar. Pollut. Bull. 2018, 133, 647–654. [Google Scholar] [CrossRef] [PubMed]
  33. Yadav, A.; Yadav, P.K. Pollution Load Index (PLI) of field irrigated with wastewater of Mawaiya Drain in Naini suburbs of Allahabad District. Curr. World Environ. 2018, 13, 159–164. [Google Scholar] [CrossRef]
  34. Laju, R.L.; Jayanthi, M.; Jeyasanta, K.I.; Patterson, J.; Asir, N.G.G.; Sathish, M.N.; Edward, J.K.P. Spatial and vertical distribution of microplastics and their ecological risk in an Indian freshwater lake ecosystem. Sci. Total Environ. 2022, 820, 153337. [Google Scholar] [CrossRef] [PubMed]
  35. Prarat, P.; Hongsawat, P. Microplastic pollution in surface seawater and beach sand from the shore of Rayong province, Thailand: Distribution, characterization, and ecological risk assessment. Mar. Pollut. Bull. 2022, 174, 113200. [Google Scholar] [CrossRef] [PubMed]
  36. Yin, K.; Wang, D.; Zhao, H.; Wang, Y.; Guo, M.; Liu, Y.; Li, B.; Xing, M. Microplastics pollution and risk assessment in water bodies of two nature reserves in Jilin Province: Correlation analysis with the degree of human activity. Sci. Total Environ. 2021, 799, 149390. [Google Scholar] [CrossRef] [PubMed]
  37. Luo, W.; Su, L.; Craig, N.J.; Du, F.; Wu, C.; Shi, H. Comparison of microplastic pollution in different water bodies from urban creeks to coastal waters. Environ. Pollut. 2019, 246, 174–182. [Google Scholar] [CrossRef] [PubMed]
  38. Álvarez, P. The water footprint challenge for water resources management in Chilean arid zones. Water Int. 2018, 43, 846–859. [Google Scholar] [CrossRef]
  39. Zhao, S.; Zhu, L.; Li, D. Microplastic in three urban estuaries, China. Environ. Pollut. 2015, 206, 597–604. [Google Scholar] [CrossRef] [PubMed]
  40. Wu, P.; Tang, Y.; Dang, M.; Wang, S.; Jin, H.; Liu, Y.; Jing, H.; Zheng, C.; Yi, S.; Cai, Z. Spatial-temporal distribution of microplastics in surface water and sediments of Maozhou River within Guangdong-Hong Kong-Macao Greater Bay Area. Sci. Total Environ. 2020, 717, 135187. [Google Scholar] [CrossRef] [PubMed]
  41. Xu, Y.; Chan, F.K.S.; Johnson, M.; Stanton, T.; He, J.; Jia, T.; Wang, J.; Wang, Z.; Yao, Y.; Yang, J.; et al. Microplastic pollution in Chinese urban rivers: The influence of urban factors. Resour. Conserv. Recycl. 2021, 173, 105686. [Google Scholar] [CrossRef]
  42. Corami, F.; Rosso, B.; Sfriso, A.A.; Gambaro, A.; Mistri, M.; Munari, C.; Barbante, C. Additives, plasticizers, small microplastics (<100 mum), and other microlitter components in the gastrointestinal tract of commercial teleost fish: Method of extraction, purification, quantification, and characterization using Micro-FTIR. Mar. Pollut. Bull. 2022, 177, 113477. [Google Scholar] [CrossRef] [PubMed]
  43. Jiang, C.; Yin, L.; Li, Z.; Wen, X.; Luo, X.; Hu, S.; Yang, H.; Long, Y.; Deng, B.; Huang, L.; et al. Microplastic pollution in the rivers of the Tibet Plateau. Environ. Pollut. 2019, 249, 91–98. [Google Scholar] [CrossRef] [PubMed]
  44. Tran-Nguyen, Q.A.; Vu, T.B.H.; Nguyen, Q.T.; Nguyen, H.N.Y.; Le, T.M.; Vo, V.M.; Trinh-Dang, M. Urban drainage channels as microplastics pollution hotspots in developing areas: A case study in Da Nang, Vietnam. Mar. Pollut. Bull. 2022, 175, 113323. [Google Scholar] [CrossRef] [PubMed]
  45. Wang, G.; Lu, J.; Tong, Y.; Liu, Z.; Zhou, H.; Xiayihazi, N. Occurrence and pollution characteristics of microplastics in surface water of the Manas River Basin, China. Sci. Total Environ. 2020, 710, 136099. [Google Scholar] [CrossRef] [PubMed]
  46. Geilfus, N.X.; Munson, K.M.; Sousa, J.; Germanov, Y.; Bhugaloo, S.; Babb, D.; Wang, F. Distribution and impacts of microplastic incorporation within sea ice. Mar. Pollut. Bull. 2019, 145, 463–473. [Google Scholar] [CrossRef] [PubMed]
  47. Xu, C.; Zhou, G.; Lu, J.; Shen, C.; Dong, Z.; Yin, S.; Li, F. Spatio-vertical distribution of riverine microplastics: Impact of the textile industry. Environ. Res. 2022, 211, 112789. [Google Scholar] [CrossRef] [PubMed]
  48. Zhang, B.; Xu, D.; Wan, X.; Wu, Y.; Liu, X.; Gao, B. Comparative analysis of microplastic organization and pollution risk before and after thawing in an urban river in Beijing, China. Sci. Total Environ. 2022, 828, 154268. [Google Scholar] [CrossRef] [PubMed]
  49. Kutralam-Muniasamy, G.; Perez-Guevara, F.; Martinez, I.E.; Shruti, V.C. Overview of microplastics pollution with heavy metals: Analytical methods, occurrence, transfer risks and call for standardization. J. Hazard. Mater. 2021, 415, 125755. [Google Scholar] [CrossRef] [PubMed]
  50. Ta, A.T.; Babel, S. Microplastics pollution with heavy metals in the aquaculture zone of the Chao Phraya River Estuary, Thailand. Mar. Pollut. Bull. 2020, 161, 111747. [Google Scholar] [CrossRef] [PubMed]
  51. Sanchez-Hernandez, L.J.; Ramirez-Romero, P.; Rodriguez-Gonzalez, F.; Ramos-Sanchez, V.H.; Marquez Montes, R.A.; Romero-Paredes Rubio, H.; Sujitha, S.B.; Jonathan, M.P. Seasonal evidences of microplastics in environmental matrices of a tourist dominated urban estuary in Gulf of Mexico, Mexico. Chemosphere 2021, 277, 130261. [Google Scholar] [CrossRef] [PubMed]
  52. Said, L.; Heard, M.J. Variation in the presence and abundance of anthropogenic microfibers in the Cumberland River in Nashville, TN, USA. Environ. Sci. Pollut. Res. 2020, 27, 10135–10139. [Google Scholar] [CrossRef] [PubMed]
  53. Yin, L.; Jiang, C.; Wen, X.; Du, C.; Zhong, W.; Feng, Z.; Long, Y.; Ma, Y. Microplastic Pollution in Surface Water of Urban Lakes in Changsha, China. Int. J. Environ. Res. Public Health 2019, 16, 1650. [Google Scholar] [CrossRef] [PubMed]
  54. Lin, L.; Zuo, L.Z.; Peng, J.P.; Cai, L.Q.; Fok, L.; Yan, Y.; Li, H.X.; Xu, X.R. Occurrence and distribution of microplastics in an urban river: A case study in the Pearl River along Guangzhou City, China. Sci. Total Environ. 2018, 644, 375–381. [Google Scholar] [CrossRef] [PubMed]
  55. Wang, W.; Ndungu, A.W.; Li, Z.; Wang, J. Microplastics pollution in inland freshwaters of China: A case study in urban surface waters of Wuhan, China. Sci. Total Environ. 2017, 575, 1369–1374. [Google Scholar] [CrossRef] [PubMed]
  56. Zhou, G.; Wang, Q.; Zhang, J.; Li, Q.; Wang, Y.; Wang, M.; Huang, X. Distribution and characteristics of microplastics in urban waters of seven cities in the Tuojiang River basin, China. Environ. Res. 2020, 189, 109893. [Google Scholar] [CrossRef] [PubMed]
  57. Pico, Y.; Soursou, V.; Alfarhan, A.H.; El-Sheikh, M.A.; Barcelo, D. First evidence of microplastics occurrence in mixed surface and treated wastewater from two major Saudi Arabian cities and assessment of their ecological risk. J. Hazard. Mater. 2021, 416, 125747. [Google Scholar] [CrossRef] [PubMed]
  58. Jin, X.; Fu, X.D.; Lu, W.J.; Wang, H.T. Fugitive release and influencing factors of microplastics in urbanized watersheds: A case study of the central area of Suzhou City. Sci. Total Environ. 2022, 837, 155653. [Google Scholar] [CrossRef] [PubMed]
  59. Dahms, H.T.J.; van Rensburg, G.J.; Greenfield, R. The microplastic profile of an urban African stream. Sci. Total Environ. 2020, 731, 138893. [Google Scholar] [CrossRef] [PubMed]
  60. Gopinath, K.; Seshachalam, S.; Neelavannan, K.; Anburaj, V.; Rachel, M.; Ravi, S.; Bharath, M.; Achyuthan, H. Quantification of microplastic in Red Hills Lake of Chennai city, Tamil Nadu, India. Environ. Sci. Pollut. Res. 2020, 27, 33297–33306. [Google Scholar] [CrossRef] [PubMed]
  61. Perez-Guevara, F.; Kutralam-Muniasamy, G.; Shruti, V.C. Critical review on microplastics in fecal matter: Research progress, analytical methods and future outlook. Sci. Total Environ. 2021, 778, 146395. [Google Scholar] [CrossRef] [PubMed]
  62. Liu, S.; Chen, H.; Wang, J.; Su, L.; Wang, X.; Zhu, J.; Lan, W. The distribution of microplastics in water, sediment, and fish of the Dafeng River, a remote river in China. Ecotoxicol. Environ. Saf. 2021, 228, 113009. [Google Scholar] [CrossRef]
  63. Abbasi, S.; Alirezazadeh, M.; Razeghi, N.; Rezaei, M.; Pourmahmood, H.; Dehbandi, R.; Mehr, M.R.; Ashayeri, S.Y.; Oleszczuk, P.; Turner, A. Microplastics captured by snowfall: A study in Northern Iran. Sci. Total Environ. 2022, 822, 153451. [Google Scholar] [CrossRef] [PubMed]
  64. Wu, Y.; Wang, S.; Wu, L.; Yang, Y.; Yu, X.; Liu, Q.; Liu, X.; Li, Y.; Wang, X. Vertical distribution and river-sea transport of microplastics with tidal fluctuation in a subtropical estuary, China. Sci. Total Environ. 2022, 822, 153603. [Google Scholar] [CrossRef] [PubMed]
  65. Koutnik, V.S.; Leonard, J.; Brar, J.; Cao, S.; Glasman, J.B.; Cowger, W.; Ravi, S.; Mohanty, S.K. Transport of microplastics in stormwater treatment systems under freeze-thaw cycles: Critical role of plastic density. Water Res. 2022, 222, 118950. [Google Scholar] [CrossRef] [PubMed]
  66. Winkler, A.; Santo, N.; Ortenzi, M.A.; Bolzoni, E.; Tremolada, P. Does mechanical stress cause microplastic release from plastic water bottles? Water Res. 2019, 166, 115082. [Google Scholar] [CrossRef] [PubMed]
  67. Huang, W.; Song, B.; Liang, J.; Niu, Q.; Zeng, G.; Shen, M.; Deng, J.; Luo, Y.; Wen, X.; Zhang, Y. Microplastics and associated contaminants in the aquatic environment: A review on their ecotoxicological effects, trophic transfer, and potential impacts to human health. J. Hazard. Mater. 2021, 405, 124187. [Google Scholar] [CrossRef] [PubMed]
  68. Leslie, H.A.; van Velzen, M.J.M.; Brandsma, S.H.; Vethaak, A.D.; Garcia-Vallejo, J.J.; Lamoree, M.H. Discovery and quantification of plastic particle pollution in human blood. Environ. Int. 2022, 163, 107199. [Google Scholar] [CrossRef] [PubMed]
Figure 1. Distribution of sampling points: red is the Songhua River, and green is the Majiagou River and tributary.
Sustainability 16 02731 g001
Figure 2. Abundance of MPs: (a) Abundance of MPs at all sampling sites; (b) distribution of MPs in water and ice of Songhua River; (c) comparison of MPs abundance between Majiagou and Songhuajiang; (d) vertical comparison of Songhua River water. The stars (“**”, ”***”) indicate a significant difference.
Sustainability 16 02731 g002
Figure 3. Songhuajiang MPs color (a), size (b), and current situation (c) proportions: (df) for different factors comparison. The stars (“*”,”***”) indicate a significant difference, and (“NS”) indicates no significant difference.
Sustainability 16 02731 g003
Figure 4. Majiagou MPs color (a), size (b), and current situation (c) proportions: (df) for different factors comparison. The stars (“**”, ”***”) indicate a significant difference, and (“NS”) indicates no significant difference.
Sustainability 16 02731 g004
Figure 5. Comparison of color (a), status (b), and size (c) of MPs in Majiagou and Songhuajiang.
Sustainability 16 02731 g005
Figure 6. (A) The proportion of polymer in MPs in Majiagou and Songhuajiang; (B) (a): PLI pollution in Majiagou River, (b) PLI pollution in Songhua River; (C) Fourier-infrared image of MPs polymer and electron microscope surface metal adsorption.
Sustainability 16 02731 g006
Figure 7. Breakage of MPs under an electron microscope: (a) Particle, (b) fiber, (c) fragment, and (d) film; (el) surface breakage more than 1000 times under an electron microscope.
Sustainability 16 02731 g007
Table 1. MP pollution’s load grade classification standard.
Pollution Load Index (PLI)Low PollutionMedium PollutionHigh Pollution
degree of pollution≤5050–100≥100
Table 2. MP abundances in representative urban rivers globally.
Sampling SitesMean AbundanceReference
Shahe River, China1.7 ± 1.6–3.8 ± 2.5 × 10⁻³ particles/L[48]
Changsha, China2.4 ± 0.2–7 ± 1 × 10⁻³ particles/L[53]
Pearl River, China0.4–7.9 × 10⁻³ particles/L[54]
Han River, China1.6 ± 0.6–8.9 ± 1.5 × 10⁻³ particles/L[55]
Tuojiang River, China0.9 ± 0.2–3.4 ± 0.7 × 10⁻³ particles/L[56]
Riyadh, Al-Jubail, Saudi Arabia0.2–3.2 particles/L[57]
Tecolutla Estuary, Mexico151 particles/L[51]
Vistula River, Poland1.6–2.55 particles/L[58]
Braamfontein, Africa0.7 particles/L[59]
Red Hills Lake, India5.9 particles/L[60]
Cumberland River, USA0–195 particles/L[52]
Table 3. Pollution levels of MPs.
Sampling SitesPollution Load Index (PLI)Risk Category
SH170.61Medium Pollution
SH216.04Low Pollution
SH34.68Low Pollution
SH41.49Low Pollution
SH510.49Low Pollution
SH6108.88High Pollution
SH724.37Low pollution
SH830.95Low Pollution
MJ1151.78High pollution
MJ2109.24High pollution
MJ340.63Low Pollution
MJ458.73Medium Pollution
MJ550.73Medium Pollution
MJ6110.37High pollution
MJ7167.15High Pollution
MJ8416.09High Pollution
MJ9396.65High Pollution
Disclaimer/Publisher’s Note: The statements, opinions and data contained in all publications are solely those of the individual author(s) and contributor(s) and not of MDPI and/or the editor(s). MDPI and/or the editor(s) disclaim responsibility for any injury to people or property resulting from any ideas, methods, instructions or products referred to in the content.

