
Multi-Dimensional Impacts of Climate Change on China’s Food Security during 2002–2021

Abstract
:1. Introduction
2. Materials and Methods
2.1. Data Sources
2.2. Establishment of Food Security Indicator System
2.2.1. Detailed Explanation of the Indicators
- Grain Production Fluctuation Rate (%). It refers to the measure of changes in grain production over a specific period of time, indicating the stability or variability in grain production from year to year.
- Grain Yield per Unit Area (kg/hectare). It measures the grain production efficiency of a region.
- Per Capita Grain Production (kg). It refers to the average amount of grain produced per person in a given region or country.
- Pesticide Usage per Unit of Cultivated Area (kg/hectare). It measures the amount of pesticide applied to a specific area of land, reflecting the intensity of pesticide application.
- Fertilizer Usage per Unit of Cultivated Area (pure quantity, kg/hectare). It refers to the quantity of fertilizer applied to a specific land area. Fertilizer is known as the “food” of grain, mainly used to improve the soil fertility and land yield per unit area. However, the excessive application of fertilizer leads to a decrease in soil organic matter, soil hardening, a decrease in land quality, and the pollution of irrigation water.
- Grain Disaster Rate (%). It measures the impact and response capabilities of each province regarding diseases, pests, and climate disasters through the proportion of food crops affected by disasters.
- Consumer Price Index for Grain Products (previous year = 100). It is a measure that tracks changes in the prices of grain-related products consumed by the general population.
- Rural Residents’ Engel Coefficient (%). It refers to the proportion of food expenditure in the total consumption expenditure of rural households. This coefficient provides insights into the living standards and consumption patterns of rural residents.
- Cultivated Area Used per Unit of Grain Production (hectare/ton). It refers to the amount of land required to produce a certain quantity of grain. It is a measure that indicates the efficiency of land use in grain production.
- Water Resources Used per Unit of Grain Production (cubic meters/ton). It refers to the amount of water consumed in the production of a specific quantity of grain. This metric is crucial in assessing the water efficiency of agricultural systems and the sustainability of grain production practices.
2.2.2. Entropy Weight Method
2.3. Panel Data Analysis Method
3. Results
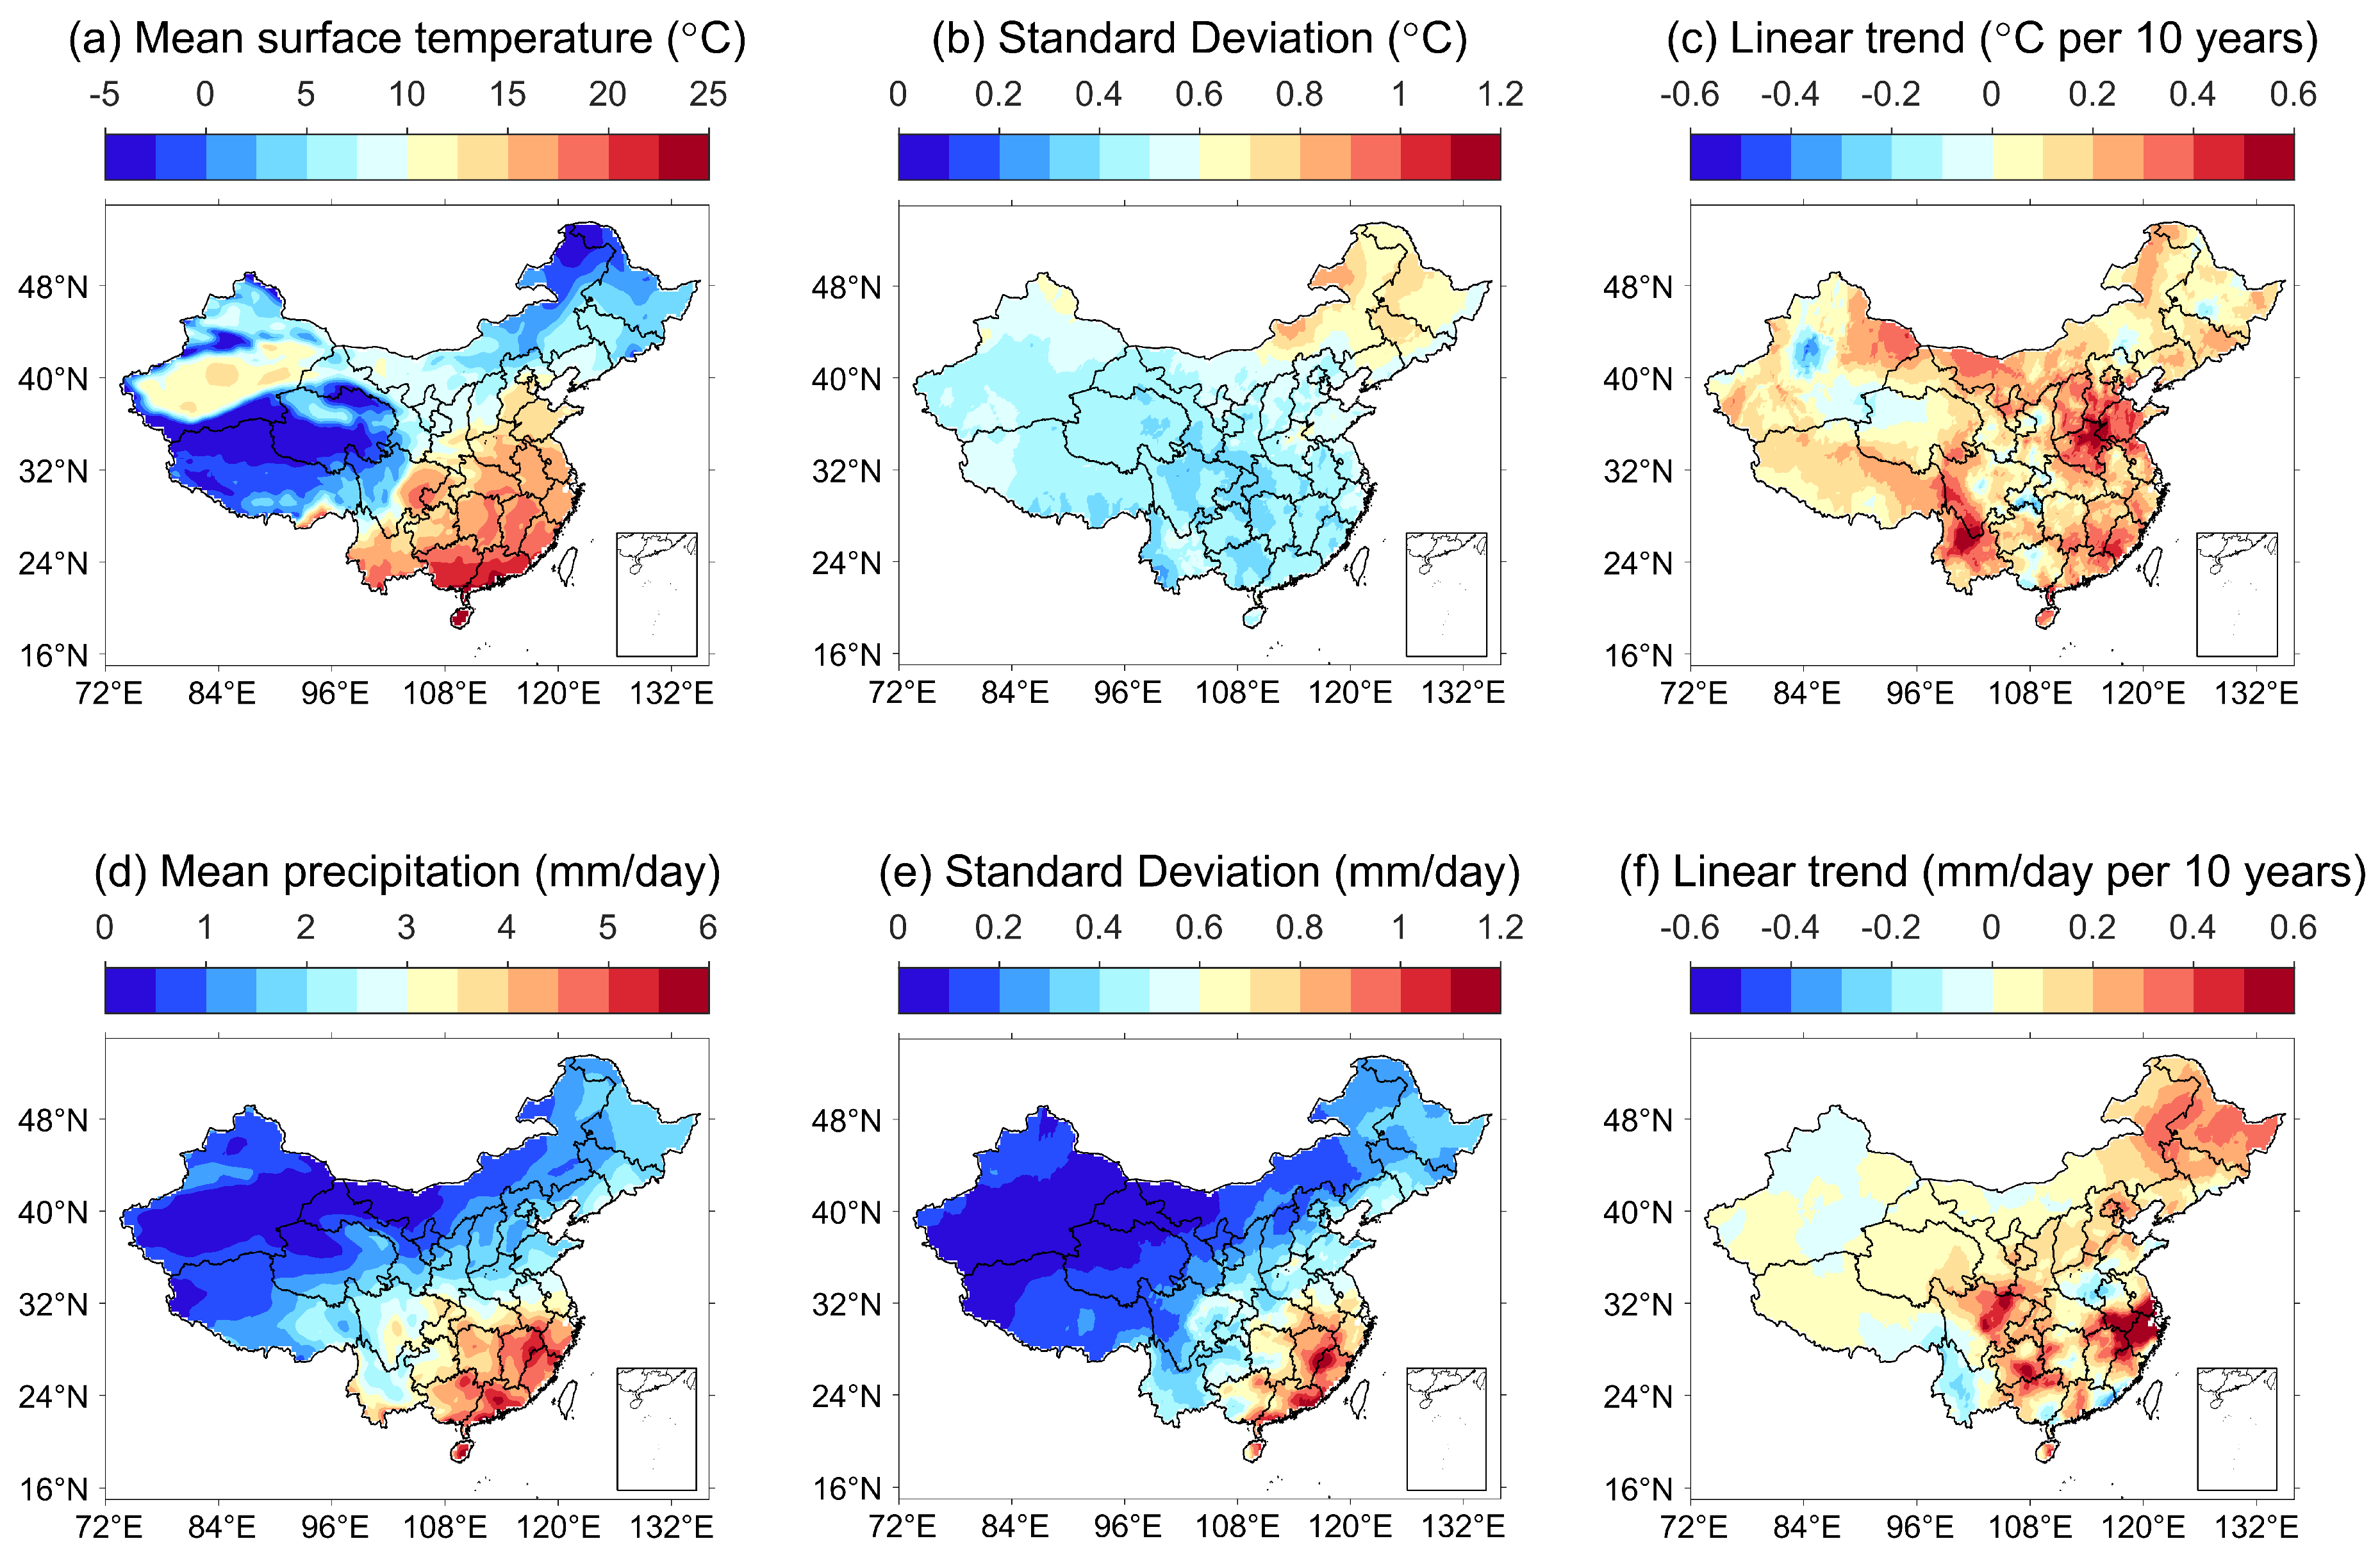
3.1. Climate Mean State and Variations
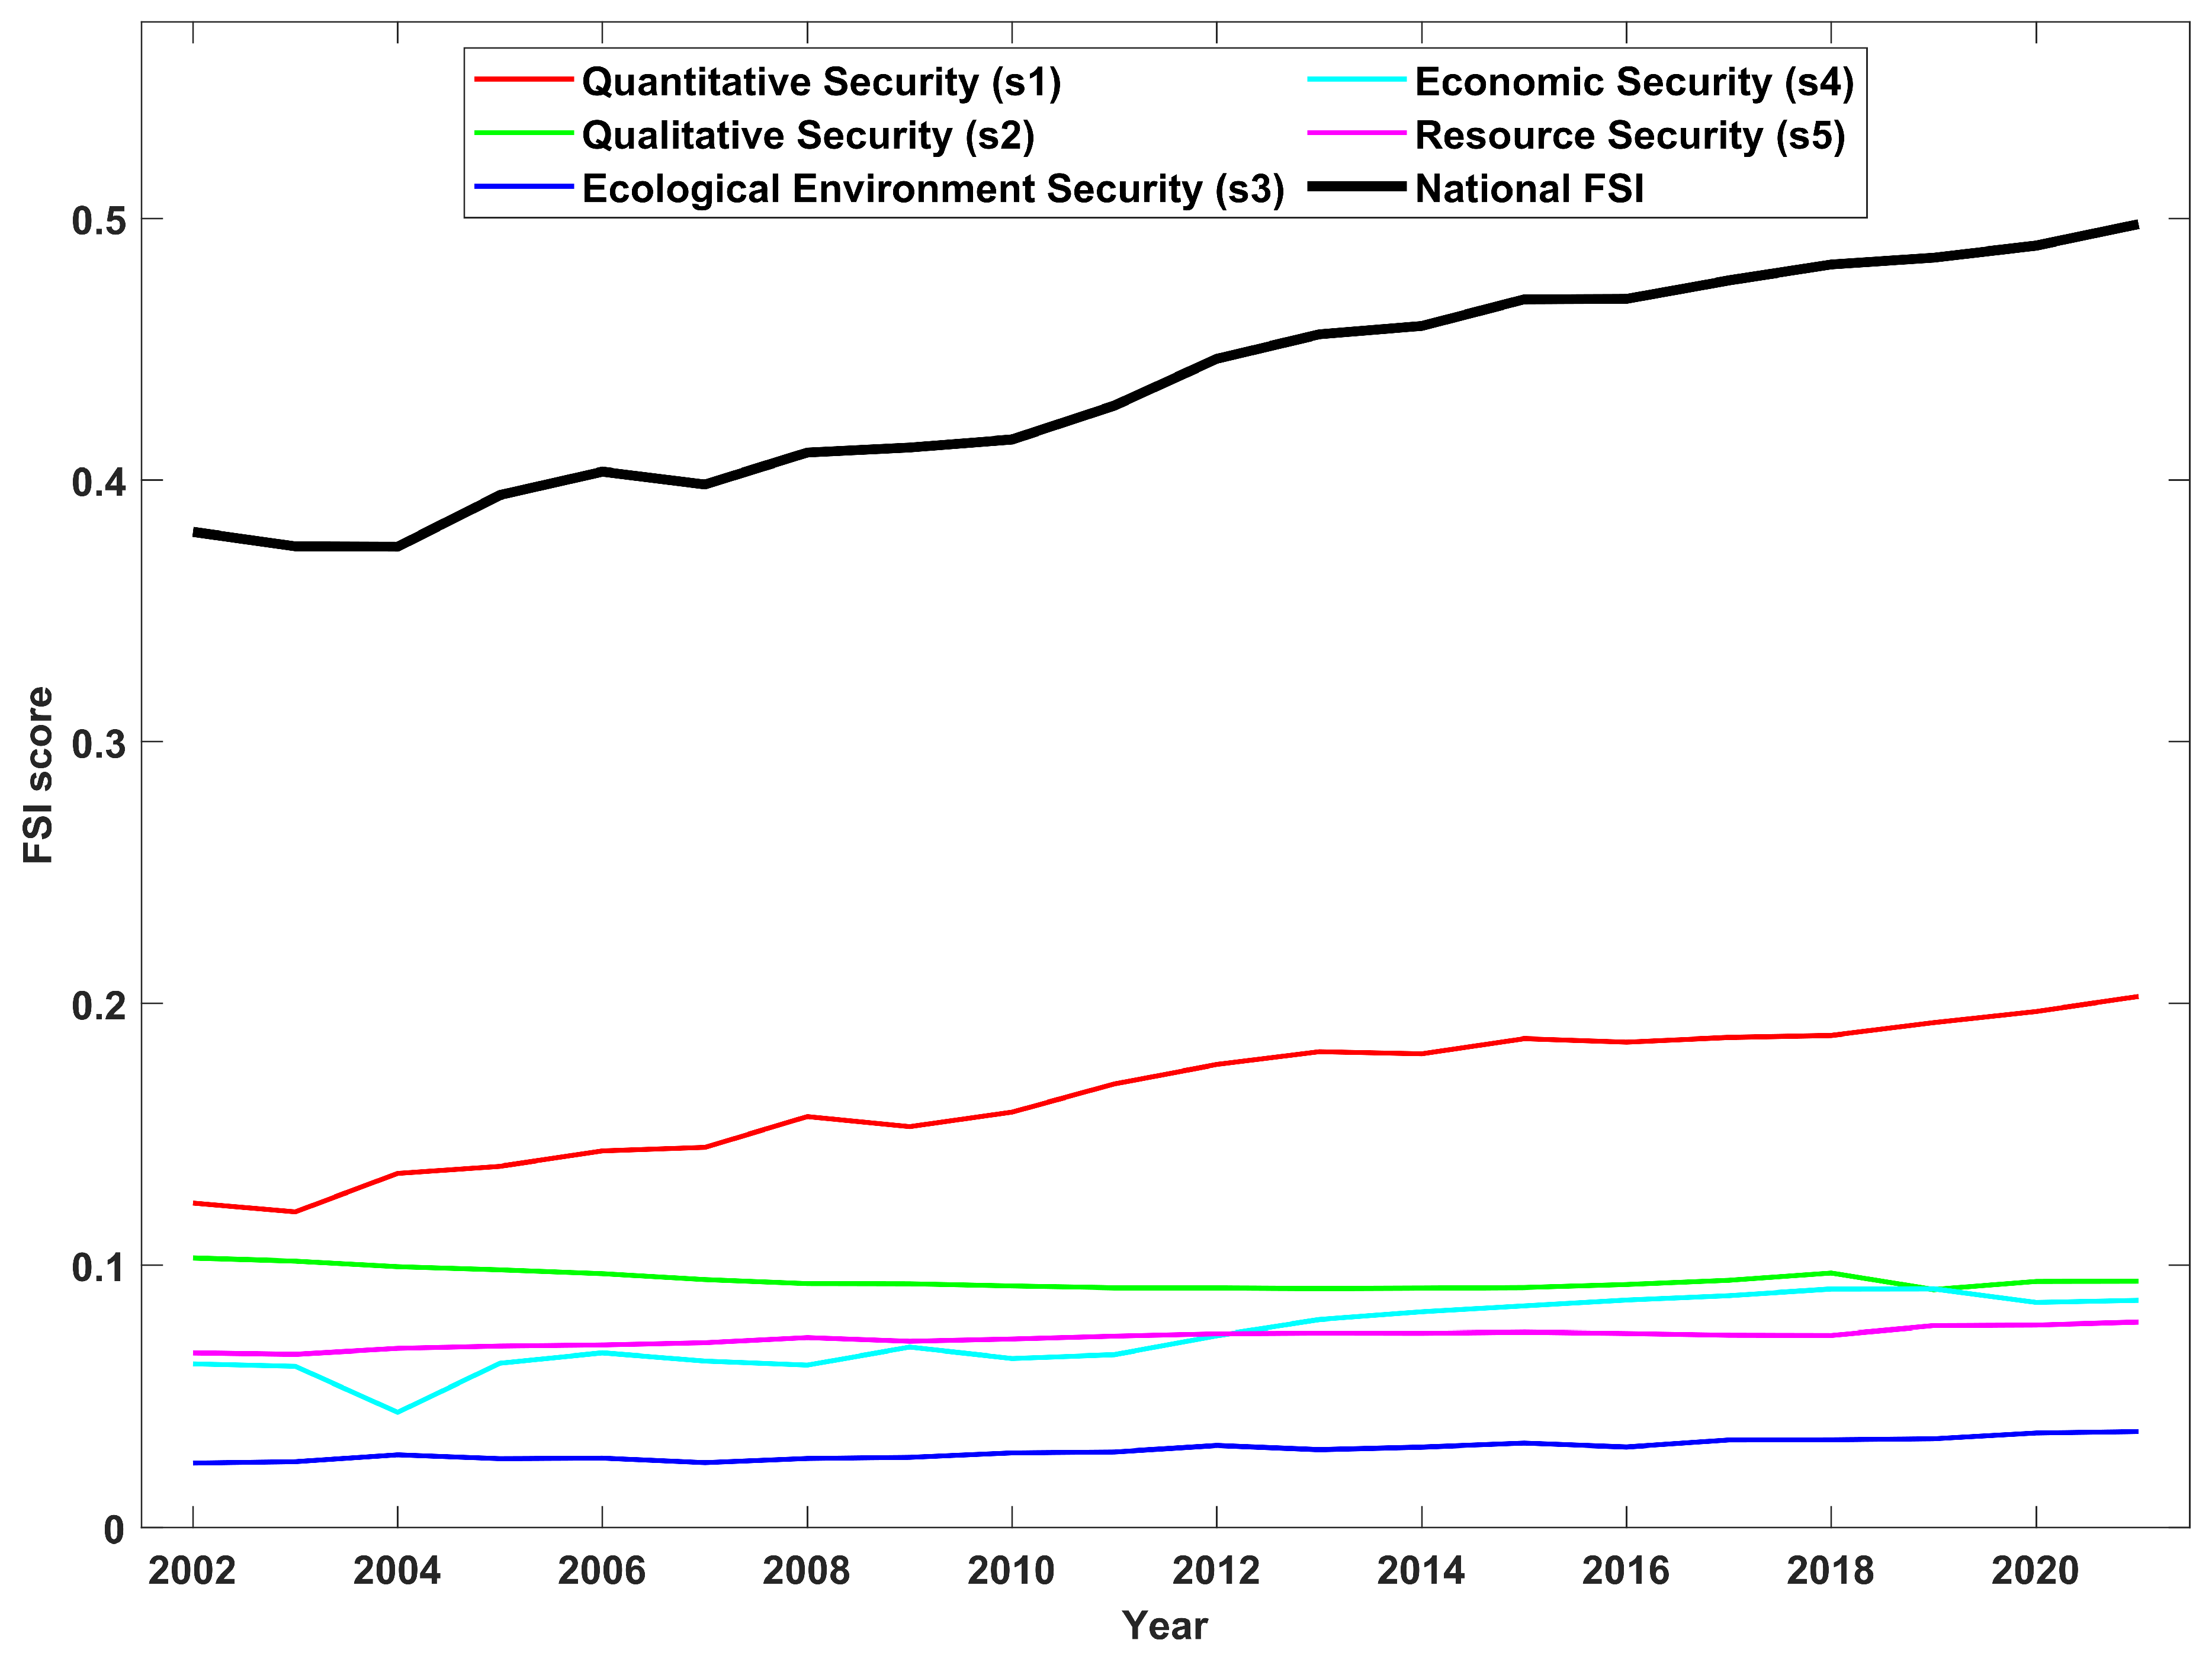
3.2. Food Security Evaluation
3.3. Empirical Analysis of the Impact of Climate Variations on China’s Food Security
3.3.1. Impact of Climate Mean State Variations on
3.3.2. Impact of Climate Extremes on
3.4. Regional Differences in the Impact of Climate Variations on
3.4.1. Impacts of Climate Mean State Variations
3.4.2. Impact of Climate Extremes
4. Discussion
4.1. Strengths and Limitations in the Food Security System
4.2. Risks of the Food Security Structure in China
4.3. Increasing Climate Risks to Food Security
5. Conclusions
Author Contributions
Funding
Institutional Review Board Statement
Informed Consent Statement
Data Availability Statement
Acknowledgments
Conflicts of Interest
Abbreviations
| Food security index | |
| Accumulated temperature above 10 C | |
| Precipitation, | |
| Percentage of days when daily maximum temperature th percentile | |
| Accumulation of precipitation when daily precipitation th percentile | |
| Fixed effects | |
| Cultivated land area | |
| Effective irrigation area | |
| Total agricultural machinery power | |
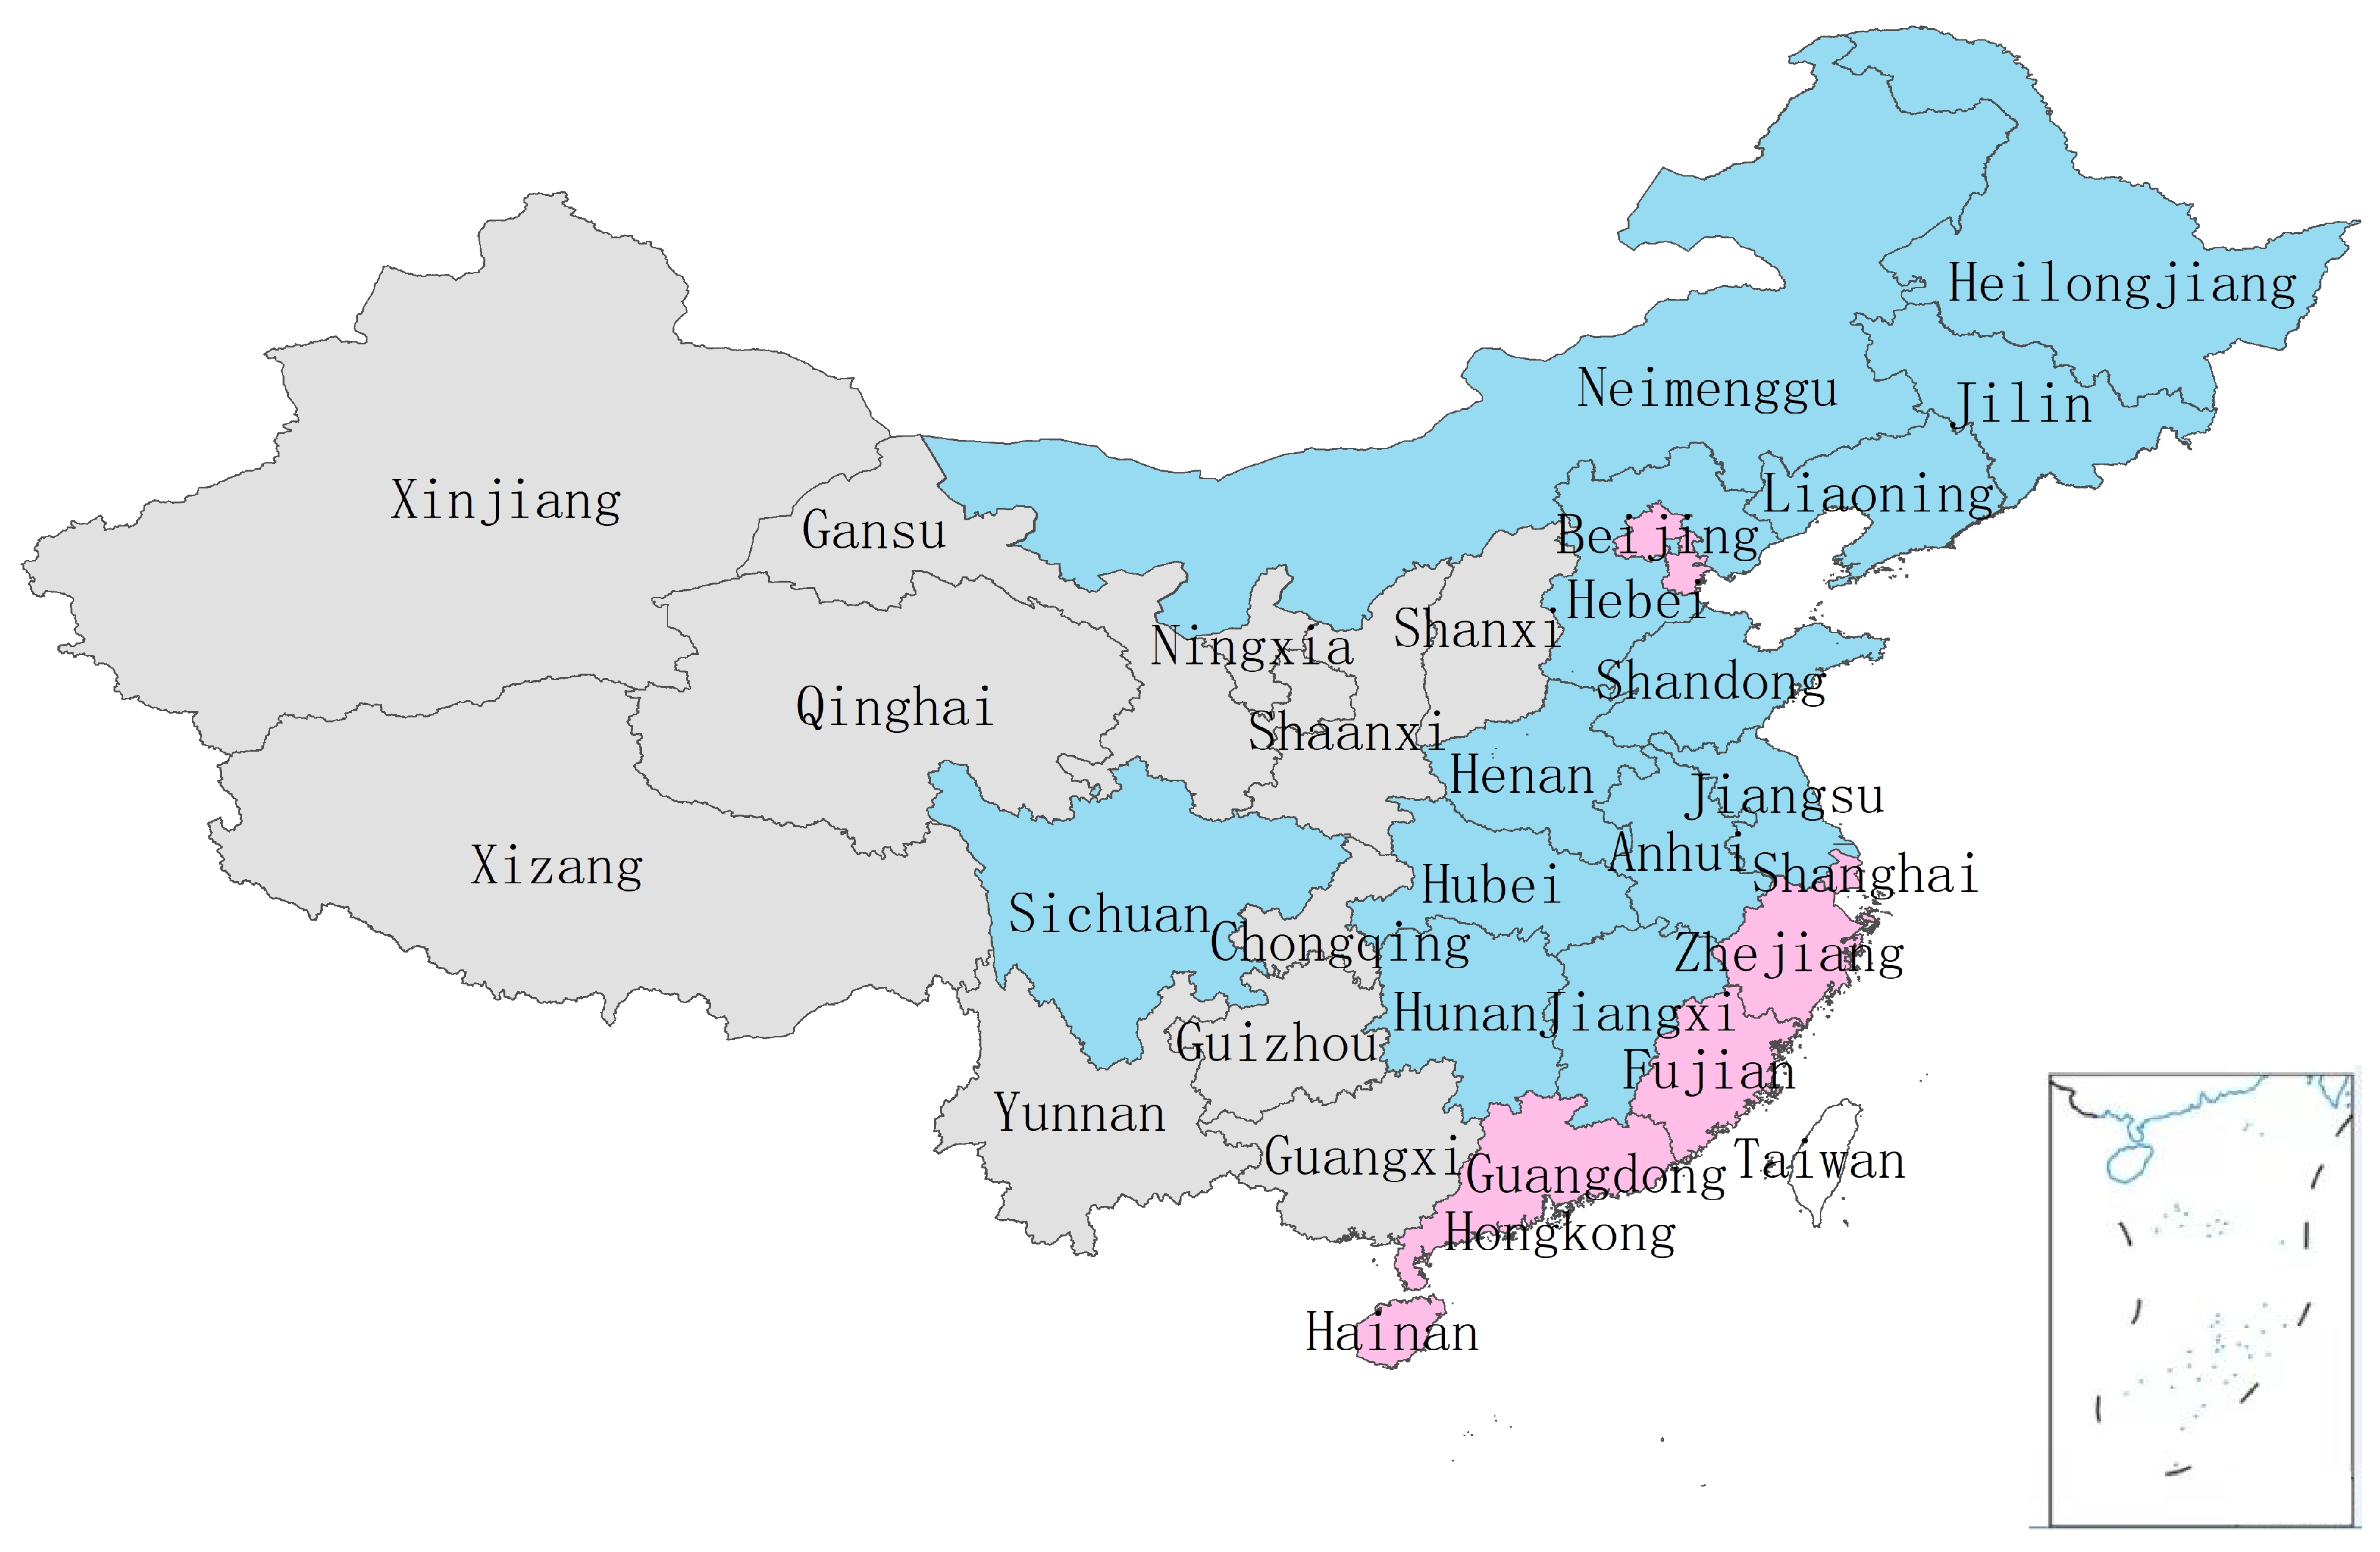
| MPA | Main grain production area |
| BA | Production–consumption balance area |
| MCA | Main grain consumption area |
Appendix A. Detailed information for the Methods
Appendix A.1. Performing the Entropy Weight Method to Composite FSI
Appendix A.2. Panel Data Analysis Model
References
- Ray, D.K.; West, P.C.; Clark, M.; Gerber, J.S.; Prishchepov, A.V.; Chatterjee, S. Climate change has likely already affected global food production. PLoS ONE 2019, 14, e0217148. [Google Scholar] [CrossRef] [PubMed]
- Dasgupta, S.; Robinson, E.J.Z. Attributing changes in food insecurity to a changing climate. Sci. Rep. 2022, 12, 4709. [Google Scholar] [CrossRef]
- Myers, S.S.; Zanobetti, A.; Kloog, I.; Huybers, P.; Leakey, A.D.B.; Bloom, A.J.; Carlisle, E.; Dietterich, L.H.; Fitzgerald, G.; Hasegawa, T.; et al. Increasing CO2 threatens human nutrition. Nature 2014, 510, 139–142. [Google Scholar] [CrossRef] [PubMed]
- Nelson, G.C.; Rosegrant, M.W.; Palazzo, A.; Gray, I.; Ingersoll, C.; Robertson, R.D.; Tokgoz, S.; Zhu, T.; Sulser, T.B.; Ringler, C.; et al. Food Security, Farming, and Climate Change to 2050: Scenarios, Results, Policy Options; Report; International Food Policy Research Institute: Washington, DC, USA, 2010. [Google Scholar] [CrossRef]
- Zaveri, E.; Russ, J.; Damania, R. Rainfall anomalies are a significant driver of cropland expansion. Proc. Natl. Acad. Sci. USA 2020, 117, 10225–10233. [Google Scholar] [CrossRef]
- Cordovil, C.M.d.S.; Bittman, S.; Brito, L.M.; Goss, M.J.; Hunt, D.; Serra, J.; Gourley, C.; Aarons, S.; Skiba, U.; Amon, B.; et al. Chapter 22—Climate-resilient and smart agricultural management tools to cope with climate change-induced soil quality decline. In Climate Change and Soil Interactions; Prasad, M.N.V., Pietrzykowski, M., Eds.; Elsevier: Amsterdam, The Netherlands, 2020; pp. 613–662. [Google Scholar] [CrossRef]
- Rosa, L.; Chiarelli, D.D.; Rulli, M.C.; Dell’Angelo, J.; D’Odorico, P. Global agricultural economic water scarcity. Sci. Adv. 2020, 6, eaaz6031. [Google Scholar] [CrossRef]
- Bebber, D.P.; Ramotowski, M.A.T.; Gurr, S.J. Crop pests and pathogens move polewards in a warming world. Nat. Clim. Chang. 2013, 3, 985–988. [Google Scholar] [CrossRef]
- Saccone, D.; Vallino, E. Food security in the age of sustainable development: Exploring the synergies between the SDGs. World Dev. 2022, 152, 105815–105819. [Google Scholar] [CrossRef]
- Puma, M.J.; Bose, S.; Chon, S.Y.; Cook, B.I. Assessing the evolving fragility of the global food system. Environ. Res. Lett. 2015, 10, 024007. [Google Scholar] [CrossRef]
- Sartori, M.; Schiavo, S. Connected we stand: A network perspective on trade and global food security. Food Policy 2015, 57, 114–127. [Google Scholar] [CrossRef]
- FAO; IFAD; UNICEF; WFP; WHO. The State of Food Security and Nutrition in the World 2022. Repurposing Food and Agricultural Policies to Make Healthy Diets More Affordable; Report; Food and Agriculture Organization: Rome, Italy, 2022. [Google Scholar] [CrossRef]
- Fan, M.; Shen, J.; Yuan, L.; Jiang, R.; Chen, X.; Davies, W.J.; Zhang, F. Improving crop productivity and resource use efficiency to ensure food security and environmental quality in China. J. Exp. Bot. 2012, 63, 13–24. [Google Scholar] [CrossRef]
- Qiao, L.; Wang, X.; Smith, P.; Fan, J.; Lu, Y.; Emmett, B.; Li, R.; Dorling, S.; Chen, H.; Liu, S.; et al. Soil quality both increases crop production and improves resilience to climate change. Nat. Clim. Chang. 2022, 12, 574–580. [Google Scholar] [CrossRef]
- Yao, G. China’s food news going forward. Nat. Sustain. 2021, 4, 1019–1020. [Google Scholar] [CrossRef]
- Fu, J.; Jian, Y.; Wang, X.; Li, L.; Ciais, P.; Zscheischler, J.; Wang, Y.; Tang, Y.; Müller, C.; Webber, H.; et al. Extreme rainfall reduces one-twelfth of China’s rice yield over the last two decades. Nat. Food 2023, 4, 416–426. [Google Scholar] [CrossRef]
- Lee, C.C.; Zeng, M.; Luo, K. How does climate change affect food security? Evidence from China. Environ. Impact Assess. Rev. 2024, 104, 107324. [Google Scholar] [CrossRef]
- Ortiz, A.M.D.; Chua, P.L.C.; Salvador, D.; Dyngeland, C.; Albao, J.D.G.; Abesamis, R.A. Impacts of tropical cyclones on food security, health and biodiversity. Bull. World Health Organ. 2023, 101, 152–154. [Google Scholar] [CrossRef] [PubMed]
- Akbari, M.; Foroudi, P.; Shahmoradi, M.; Padash, H.; Parizi, Z.S.; Khosravani, A.; Ataei, P.; Cuomo, M.T. The Evolution of Food Security: Where Are We Now, Where Should We Go Next? Sustainability 2022, 14, 3634. [Google Scholar] [CrossRef]
- Izraelov, M.; Silber, J. An assessment of the global food security index. Food Secur. 2019, 11, 1135–1152. [Google Scholar] [CrossRef]
- Li, F.; Ma, S.; Liu, X. Changing multi-scale spatiotemporal patterns in food security risk in China. J. Clean. Prod. 2023, 384, 135618. [Google Scholar] [CrossRef]
- Zhang, Z.; Shi, K.; Tang, L.; Su, K.; Zhu, Z.; Yang, Q. Exploring the spatiotemporal evolution and coordination of agricultural green efficiency and food security in China using ESTDA and CCD models. J. Clean. Prod. 2022, 374, 133967. [Google Scholar] [CrossRef]
- Chen, L.; Chang, J.; Wang, Y.; Guo, A.; Liu, Y.; Wang, Q.; Zhu, Y.; Zhang, Y.; Xie, Z. Disclosing the future food security risk of China based on crop production and water scarcity under diverse socioeconomic and climate scenarios. Sci. Total Environ. 2021, 790, 148110. [Google Scholar] [CrossRef]
- Liu, F.; Xiao, X.; Qin, Y.; Yan, H.; Huang, J.; Wu, X.; Zhang, Y.; Zou, Z.; Doughty, R.B. Large spatial variation and stagnation of cropland gross primary production increases the challenges of sustainable grain production and food security in China. Sci. Total Environ. 2022, 811, 151408. [Google Scholar] [CrossRef] [PubMed]
- Liu, L.; Wang, X.; Meng, X.; Cai, Y. The coupling and coordination between food production security and agricultural ecological protection in main food-producing areas of China. Ecol. Indic. 2023, 154, 110785. [Google Scholar] [CrossRef]
- Norse, D.; Ju, X. Environmental costs of China’s food security. Agric. Ecosyst. Environ. 2015, 209, 5–14. [Google Scholar] [CrossRef]
- Yang, S.; Cui, X. Large-scale production: A possible way to the balance between feed grain security and meat security in China. J. Agric. Food Res. 2023, 14, 100745. [Google Scholar] [CrossRef]
- Zhang, Y.; Liu, H.; Qi, J.; Feng, P.; Zhang, X.; Liu, D.L.; Marek, G.W.; Srinivasan, R.; Chen, Y. Assessing impacts of global climate change on water and food security in the black soil region of Northeast China using an improved SWAT-CO2 model. Sci. Total Environ. 2023, 857, 159482. [Google Scholar] [CrossRef] [PubMed]
- Headey, D.; Ecker, O. Rethinking the measurement of food security: From first principles to best practice. Food Secur. 2013, 5, 327–343. [Google Scholar] [CrossRef]
- Coates, J. Build it back better: Deconstructing food security for improved measurement and action. Glob. Food Secur. 2013, 2, 188–194. [Google Scholar] [CrossRef]
- Zhang, Y.; Liu, C.; Guo, L. Appraisal and Strategic Consideration on Food Security Status of China. China Rural Surv. 2015, 1, 2–15+29+93. (In Chinese) [Google Scholar]
- Wang, R.; Li, S.; Kong, F. Food Security Capacity: Connotation Characteristics, Index Measurement and Promotion Path. J. Sichuan Agric. Univ. 2022, 40, 910–919. [Google Scholar]
- Gao, M.; Zhao, X. Grain security from the perspective of agricultural power: Realistic foundation, problem challenges and promotion strategies. Res. Agric. Mod. 2023, 44, 185–195. [Google Scholar] [CrossRef]
- Liang, L.; Ridoutt, B.G.; Wang, L. Food Security and Climate Stabilization: Can Cereal Production Systems Address Both? Sustainability 2021, 13, 1223. [Google Scholar] [CrossRef]
- Wang, J.; Zhang, Z.; Liu, Y. Spatial shifts in grain production increases in China and implications for food security. Land Use Policy 2018, 74, 204–213. [Google Scholar] [CrossRef]
- Yin, C.; Li, G.; Gao, X. Impacts of climate change on China’s grain production—Empirical analysis based on provincial panel data. J. Arid Land Resour. Environ. 2016, 30, 89–94. [Google Scholar] [CrossRef]
- Yin, Y.y.; Tang, Q.; Liu, X. Impacts of future climate change on potential yields of major crops in China. Earth Syst. Dyn. Discuss. 2014, 5, 617–647. [Google Scholar]
- Ding, R.; Shi, W.; Lyu, C.; Lu, H.; Deng, X.; Shao, J.; Cui, J. The Impact of Climate Change on Grain Supply and Demand Balance in Tibet in the Future. Sci. Geogr. Sin. 2022, 42, 772–781. [Google Scholar]
- Zhuang, D.; Abbas, J.; Al-Sulaiti, K.; Fahlevi, M.; Aljuaid, M.; Saniuk, S. Land-use and food security in energy transition: Role of food supply. Front. Sustain. Food Syst. 2022, 6, 1053031. [Google Scholar] [CrossRef]
- Yang, S.; Li, D.; Liao, H.; Zhu, L.; Zhou, M.; Cai, Z. Analysis of the Balance between Supply and Demand of Arable Land in China Based on Food Security. Sustainability 2023, 15, 5706. [Google Scholar] [CrossRef]
- Karan, E.P.; Asgari, S.; Asadi, S. Resilience assessment of centralized and distributed food systems. Food Secur. 2023, 15, 59–75. [Google Scholar] [CrossRef]
- Cui, M.; Nie, C. Study on Food Security in China Based on Evaluation Index System. Bull. Chin. Acad. Sci. 2019, 34, 910–919. [Google Scholar] [CrossRef]
- Dong, W.; Chou, J.; Feng, G. A new economic assessment index for the impact of climate change on grain yield. Adv. Atmos. Sci. 2007, 24, 336–342. [Google Scholar] [CrossRef]
- Chou, J.; Dong, W.; Xu, H.; Tu, G. New Ideas for Research on the Impact of Climate Change on China’s Food Security. Clim. Environ. Res. 2022, 27, 206–216. (In Chinese) [Google Scholar] [CrossRef]
- Wu, J.; Gao, X.J. A gridded daily observation dataset over China region and comparison with the other datasets. Chin. J. Geophys. 2013, 56, 1102–1111. (In Chinese) [Google Scholar] [CrossRef]
- Wiebe, K.; Robinson, S.; Cattaneo, A. Chapter 4—Climate Change, Agriculture and Food Security: Impacts and the Potential for Adaptation and Mitigation. In Sustainable Food and Agriculture; Campanhola, C., Pandey, S., Eds.; Academic Press: Cambridge, MA, USA, 2019; pp. 55–74. [Google Scholar] [CrossRef]
- Wu, J.; Zhang, J.; Wang, S.; Kong, F. Assessment of Food Security in China: A New Perspective Based on Production-Consumption Coordination. Sustainability 2016, 8, 183. [Google Scholar] [CrossRef]
- Adriana, R.A.; Marta, G.R.F. Internationally-based indicators to measure Agri-food systems sustainability using food sovereignty as a conceptual framework. Food Secur. 2019, 11, 1321–1337. [Google Scholar] [CrossRef]
- Su, F.; Liu, Y.; Wang, S.; Shang, H. Impact of climate change on food security in different grain producing areas in China. China Popul. Resour. Environ. 2022, 32, 140–152. [Google Scholar]


| Category | Variable | Abbreviation | Source |
|---|---|---|---|
| Climate data | Annual mean temperature | Calculated using CN05.1 dataset | |
| Annual mean precipitation | Calculated using CN05.1 dataset | ||
| Accumulated temperature above 10 C | Calculated using CN05.1 dataset | ||
| Annual total precipitation | Calculated using CN05.1 dataset | ||
| Extreme high temperature index | Calculated using CN05.1 dataset | ||
| Extreme precipitation index | Calculated using CN05.1 dataset | ||
| Agricultural data | Grain Production Fluctuation Rate | j1 | China (Rural) Statistical Yearbook |
| Grain Yield per Unit Area | j2 | China (Rural) Statistical Yearbook | |
| Per Capita Grain Production | j3 | China (Rural) Statistical Yearbook | |
| Pesticide Usage per Unit of Cultivated Area | j4 | China (Rural) Statistical Yearbook | |
| Fertilizer Usage per Unit of Cultivated Area | j5 | China (Rural) Statistical Yearbook | |
| Grain Disaster Rate | j6 | China (Rural) Statistical Yearbook | |
| Consumer Price Index for Grain Products | j7 | China (Rural) Statistical Yearbook | |
| Rural Residents’ Engel Coefficient | j8 | China (Rural) Statistical Yearbook | |
| Cultivated Area Used per Unit of Grain Production | j9 | China (Rural) Statistical Yearbook | |
| Water Resources Used per Unit of Grain Production | j10 | China (Rural) Statistical Yearbook | |
| Control variables | Cultivated land area | China (Rural) Statistical Yearbook | |
| Effective irrigation area | China (Rural) Statistical Yearbook | ||
| Total agricultural machinery power | China (Rural) Statistical Yearbook |
| Tier 1 Indicator | Tier 2 Indicator | Tier 3 Indicator | Indicator Direction * |
|---|---|---|---|
| Food Security Index () | Quantitative Security (s1) | j1: Grain Production Fluctuation Rate (%) | Positive |
| j2: Grain Yield per Unit Area (kg/hectare) | Positive | ||
| j3: Per Capita Grain Production (kg) | Positive | ||
| Qualitative Security (s2) | j4: Pesticide Usage per Unit of Cultivated Area (kg/hectare) | Negative | |
| j5: Fertilizer Usage per Unit of Cultivated Area (Pure Quantity, kg/hectare) | Negative | ||
| Ecological Environment Security (s3) | j6: Grain Disaster Rate (%) | Negative | |
| Economic Security (s4) | j7: Consumer Price Index for Grain Products (Previous Year = 100) | Negative | |
| j8: Rural Residents’ Engel Coefficient (%) | Negative | ||
| Resource Security (s5) | j9: Cultivated Area Used per Unit of Grain Production (hectare/ton) | Negative | |
| j10: Water Resources Used per Unit of Grain Production (cubic meters/ton) | Negative |
| Tier 2 Indicator | Tier 3 Indicator | Weight |
|---|---|---|
| Quantitative Security (s1) | j1: Grain Production Fluctuation Rate | 2.54% |
| j2: Grain Yield per Unit Area | 19.15% | |
| j3: Per Capita Grain Production | 41.25% | |
| Qualitative Security (s2) | j4: Pesticide Usage per Unit of Cultivated Area | 5.64% |
| j5: Fertilizer Usage per Unit of Cultivated Area | 7.51% | |
| Ecological Environment Security (s3) | j6: Grain Disaster Rate | 3.78% |
| Economic Security (s4) | j7: Consumer Price Index for Grain Products | 3.08% |
| j8: Rural Residents’ Engel Coefficient | 7.67% | |
| Resource Security (s5) | j9: Cultivated Area Used per Unit of Grain Production | 6.09% |
| j10: Water Resources Used per Unit of Grain Production | 3.30% |
| Variables | s1 | s2 | s3 | s4 | s5 | |
|---|---|---|---|---|---|---|
| −0.553 *** | 0.137 | −0.272 | 0.418 *** | −0.175 * | −0.188 *** | |
| 0.063 * | 0.024 | 0.061 | −0.022 | 0.010 | 0.024 | |
| 0.242 *** | 0.478 *** | 0.114 | 0.002 | −0.066 * | 0.176 *** | |
| 0.261 *** | −0.267 *** | −0.020 | −0.016 | 0.187 *** | 0.087 *** | |
| −0.134 *** | −0.079 *** | −0.004 | 0.206 *** | −0.001 | −0.026 * | |
| Constant | −0.811 | −4.957 *** | −2.620 | −7.471 *** | −2.159 *** | −1.399 *** |
| Entity FE | Yes | Yes | Yes | Yes | Yes | Yes |
| Time FE | Yes | Yes | Yes | Yes | Yes | Yes |
| R2 | 0.652 | 0.381 | 0.366 | 0.859 | 0.298 | 0.758 |
| Observation | 620 | 620 | 620 | 620 | 620 | 620 |
| Variables | s1 | s2 | s3 | s4 | s5 | |
|---|---|---|---|---|---|---|
| −0.512 *** | 0.138 | −0.201 | 0.414 *** | −0.152 * | −0.166 *** | |
| 2.397 *** | 0.088 | 4.076 *** | −0.224 | 1.342 *** | 1.321 *** | |
| −0.173 *** | −0.005 | −0.297 *** | 0.015 | −0.099 *** | −0.096 *** | |
| 0.208 *** | 0.478 *** | 0.056 | 0.005 | −0.085 ** | 0.157 *** | |
| 0.253 *** | −0.267 *** | −0.035 | −0.016 | 0.182 *** | 0.082 *** | |
| −0.116 *** | −0.078 *** | 0.027 | 0.204 *** | 0.009 | −0.016 | |
| Constant | −8.755 *** | −5.174 *** | −16.288 *** | −6.781 *** | −6.693 *** | −5.814 *** |
| Entity FE | Yes | Yes | Yes | Yes | Yes | Yes |
| Time FE | Yes | Yes | Yes | Yes | Yes | Yes |
| R2 | 0.671 | 0.381 | 0.408 | 0.859 | 0.319 | 0.777 |
| Observation | 620 | 620 | 620 | 620 | 620 | 620 |
| Variables | s1 | s2 | s3 | s4 | s5 | |
|---|---|---|---|---|---|---|
| −0.069 *** | −0.028 | −0.155 *** | 0.020 | −0.054 *** | −0.041 *** | |
| 0.017 | 0.002 | −0.068 * | −0.024 | −0.015 | −0.005 | |
| 0.221 *** | 0.484 *** | 0.102 | 0.017 | −0.072 ** | 0.169 *** | |
| 0.250 *** | −0.265 *** | −0.020 | −0.007 | 0.183 *** | 0.083 *** | |
| −0.137 *** | −0.079 *** | −0.015 | 0.205 *** | −0.004 | −0.028 * | |
| Constant | −4.674 *** | −3.660 *** | −3.566 *** | −4.231 *** | −3.246 *** | −2.595 *** |
| Entity FE | Yes | Yes | Yes | Yes | Yes | Yes |
| Time FE | Yes | Yes | Yes | Yes | Yes | Yes |
| R2 | 0.642 | 0.381 | 0.379 | 0.853 | 0.304 | 0.758 |
| Observation | 620 | 620 | 620 | 620 | 620 | 620 |
| Variables | s1 | s2 | s3 | s4 | s5 | |
|---|---|---|---|---|---|---|
| 0.482 ** | 0.022 | −0.140 | −0.421 ** | 0.016 | 0.045 | |
| −0.126 ** | −0.011 | −0.005 | 0.101 *** | −0.016 | −0.020 | |
| 1.054 *** | 0.062 | 2.319 *** | −0.160 | 0.730 *** | 0.631 *** | |
| −0.086 *** | −0.005 | −0.197 *** | 0.012 | −0.062 *** | −0.053 *** | |
| 0.197 *** | 0.482 *** | 0.073 | 0.028 | −0.083 ** | 0.160 *** | |
| 0.247 *** | −0.265 *** | −0.042 | −0.012 | 0.177 *** | 0.078 *** | |
| −0.137 *** | −0.080 *** | −0.003 | 0.209 *** | −0.000 | −0.026 * | |
| Constant | −8.135 *** | −3.877 *** | −10.416 *** | −3.448 *** | −5.442 *** | −4.493 *** |
| Entity FE | Yes | Yes | Yes | Yes | Yes | Yes |
| Time FE | Yes | Yes | Yes | Yes | Yes | Yes |
| R2 | 0.658 | 0.382 | 0.428 | 0.855 | 0.325 | 0.773 |
| Observation | 620 | 620 | 620 | 620 | 620 | 620 |
| Variables | FSI in MPA | FSI in BA | FSI in MCA |
|---|---|---|---|
| −0.155 | −0.114 ** | 0.024 | |
| 0.042 * | 0.111 *** | −0.024 | |
| 0.169 *** | 0.125 *** | 0.121 ** | |
| 0.285 *** | 0.004 | 0.010 | |
| −0.029 | −0.063 *** | −0.071 * | |
| Constant | −3.348 *** | −1.443 ** | −1.503 |
| Entity FE | Yes | Yes | Yes |
| Time FE | Yes | Yes | Yes |
| R2 | 0.889 | 0.811 | 0.615 |
| Observations | 260 | 220 | 140 |
| Variables | FSI in MPA | FSI in BA | FSI in MCA |
|---|---|---|---|
| 3.321 | −1.233 | 5.616 | |
| ()2 | −0.208 | 0.078 | −0.330 |
| 1.866 *** | 0.242 | 1.424 *** | |
| ()2 | −0.135 *** | −0.010 | −0.104 *** |
| 0.123 *** | 0.128 *** | 0.129 ** | |
| 0.283 *** | −0.000 | −0.004 | |
| −0.025 | −0.059 *** | −0.038 | |
| Constant | −23.615 ** | 2.056 | −30.319 |
| Entity FE | Yes | Yes | Yes |
| Time FE | Yes | Yes | Yes |
| Observations | 260 | 220 | 140 |
| R2 | 0.905 | 0.813 | 0.646 |
| Variables | FSI in MPA | FSI in BA | FSI in MCA |
|---|---|---|---|
| −0.017 | −0.062 *** | −0.019 | |
| 0.019 | 0.028 | −0.031 | |
| 0.172 *** | 0.096 ** | 0.123 ** | |
| 0.281 *** | −0.003 | 0.012 | |
| −0.027 | −0.073 *** | −0.073 * | |
| Constant | −4.447 *** | −1.334 *** | −1.251 *** |
| Entity FE | Yes | Yes | Yes |
| Time FE | Yes | Yes | Yes |
| R2 | 0.888 | 0.815 | 0.620 |
| Observations | 260 | 220 | 140 |
| Variables | FSI in MPA | FSI in BA | FSI in MCA |
|---|---|---|---|
| −0.002 | −0.066 *** | −0.029 | |
| 1.359 *** | 0.233 * | 0.981 *** | |
| ()2 | −0.108 *** | −0.018 | −0.080 *** |
| 0.118 *** | 0.097 ** | 0.135 *** | |
| 0.274 *** | −0.009 | 0.022 | |
| −0.024 | −0.072 *** | −0.067 * | |
| Constant | −8.098 *** | −1.860 *** | −4.571 *** |
| Entity FE | Yes | Yes | Yes |
| Time FE | Yes | Yes | Yes |
| Observations | 260 | 220 | 140 |
| R2 | 0.905 | 0.817 | 0.655 |
Disclaimer/Publisher’s Note: The statements, opinions and data contained in all publications are solely those of the individual author(s) and contributor(s) and not of MDPI and/or the editor(s). MDPI and/or the editor(s) disclaim responsibility for any injury to people or property resulting from any ideas, methods, instructions or products referred to in the content. |
© 2024 by the authors. Licensee MDPI, Basel, Switzerland. This article is an open access article distributed under the terms and conditions of the Creative Commons Attribution (CC BY) license (https://creativecommons.org/licenses/by/4.0/).
Share and Cite
Zhou, H.; Cao, N.; Yang, L.; Xu, J. Multi-Dimensional Impacts of Climate Change on China’s Food Security during 2002–2021. Sustainability 2024, 16, 2744. https://doi.org/10.3390/su16072744
Zhou H, Cao N, Yang L, Xu J. Multi-Dimensional Impacts of Climate Change on China’s Food Security during 2002–2021. Sustainability. 2024; 16(7):2744. https://doi.org/10.3390/su16072744
Chicago/Turabian StyleZhou, Huanhuan, Ning Cao, Lihua Yang, and Jianjun Xu. 2024. "Multi-Dimensional Impacts of Climate Change on China’s Food Security during 2002–2021" Sustainability 16, no. 7: 2744. https://doi.org/10.3390/su16072744
APA StyleZhou, H., Cao, N., Yang, L., & Xu, J. (2024). Multi-Dimensional Impacts of Climate Change on China’s Food Security during 2002–2021. Sustainability, 16(7), 2744. https://doi.org/10.3390/su16072744