Abstract
Power batteries, the core component of the rapidly evolving electric vehicle industry, have increasingly become a focal point of attention. Recycling power batteries can mitigate environmental pollution and utilize resources efficiently, which is crucial for fostering a low-carbon economy and achieving sustainable development. Utilizing prospect theory, this study proposes a tripartite game model for low-carbon innovation in power battery recycling, involving government agencies, power battery manufacturers, and recycling enterprises. This paper initially identifies the evolutionary stability strategy, subsequently simulates the evolutionary process through parameter assignment, and explores parameter sensitivity along with comparative effects. This study indicates the following: (i) Government incentives are pivotal in motivating manufacturers and recyclers towards low-carbon innovation. (ii) Reducing technology costs and enhancing spillovers significantly boost low-carbon innovation’s appeal. (iii) Moderate carbon taxes can encourage businesses to engage in low-carbon innovation, while excessively high taxes may increase operating costs and hinder investment in innovation. Lastly, policy recommendations are made in order to support environmental preservation and the industry’s sustainable growth in the power battery recycling sector.
1. Introduction
Reducing low-carbon emissions has emerged as a pivotal goal for the international community in the context of global climate change and environmental preservation. The issue of carbon emissions, particularly within the transportation sector, has garnered significant attention [1,2,3]. Recent data indicate that China’s carbon dioxide emissions reached 1147.8 million tonnes in 2022, positioning it as the world’s largest emitter of carbon dioxide [4]. Significantly, emissions from the transportation sector are on an upward trajectory, contributing to over 10% of the nation’s total carbon emissions [5,6]. Projections suggest that by 2050, China’s transportation industry could account for more than 3.3 billion tonnes of carbon emissions, representing 33% of the country’s total emissions [7].
Power batteries, a crucial component of new energy vehicles, are witnessing a surge in popularity in China alongside the rise in sales of these vehicles. The recycling and disposal of decommissioned power batteries pose significant challenges for China, particularly because a power battery’s capacity reduction to below 80% substantially decreases its range, rendering it unsuitable for electric vehicles and necessitating its retirement [8]. In 2020, China reached a recycling milestone of 100,000 tons of power batteries, setting an initial benchmark for recycling efforts. However, the recycling rate remains at approximately 20% [9]. To tackle environmental concerns, China has implemented the “Electric Vehicle Power Battery Recycling Regulations” among other policies. These regulations establish the industry’s primary responsibilities, including the development of an information management platform and a traceability system [10]. Currently, China boasts 117 certified battery recycling companies, marking the preliminary formation of a closed-loop industrial chain for battery utilization [11].
To combat climate change, enhance environmental sustainability, advance the energy system’s transformation, and encourage green economic development, innovation in low-carbon power battery recycling is essential. This strategic shift is poised to reduce greenhouse gas emissions, facilitate resource recycling, and stimulate the emergence of new businesses and technologies, thereby injecting fresh momentum into economic growth.
Industry leaders primarily drive innovation in low-carbon technologies, yet small- and medium-sized enterprises (SMEs) or those new to technology innovation face numerous challenges. The technological complexities involved in the power battery recycling process represent a significant hurdle. Power batteries, characterized by their intricate structures and diverse materials such as lithium, cobalt, and nickel, require an ongoing development and optimization of effective separation and purification technologies [12]. Moreover, the high costs associated with recycling power batteries, coupled with the low market value of recovered components, render the recycling process economically unsustainable. Particularly, the recycling value of batteries with fewer precious metals may not offset the recycling costs [13,14]. Despite China’s enactment of laws and policies to foster the power battery recycling industry’s growth, there remains a need for stronger policy implementation, standard harmonization, and regulatory mechanisms [15,16]. Faced with these challenges, companies may lack the incentive to engage in low-carbon innovation. Consequently, the sustainable development of the waste power battery recycling industry necessitates a collaborative approach, emphasizing technological innovation, cost management, policy support, and other critical factors.
We developed a tripartite game theory model to overcome the technical, economic, and policy challenges within the power battery recycling industry. This model incorporates the government, power battery manufacturers, and recycling companies. Through an examination of the strategic behaviours of these stakeholders, we identified key factors influencing participation in the battery recycling process and analysed the sensitivity of these factors. Our findings offer valuable insights for enhancing the environmentally sustainable development of battery technology, which is crucial for facilitating the global energy transition and securing long-term environmental sustainability.
The innovation of this article is as follows: (1) Integrating prospect theory with evolutionary game theory, this study introduces a novel lens to examine stakeholder decision making in the power battery recycling industry under uncertainty, enhancing our grasp of complex interactive decision processes. (2) Through a tripartite game model involving governments, manufacturers, and recyclers, this research captures the comprehensive dynamics and incentives in the power battery recycling sector, offering a holistic understanding of industry decision-making mechanisms. (3) This paper investigates how policy incentives, costs, and technology spillovers affect stakeholders’ low-carbon innovation willingness, providing new insights into driving sustainable development in the power battery recycling industry.
2. Literature Review
2.1. Research on Power Battery Recycling
Power battery recycling initially concentrated on fundamental recycling technologies and methods, with early research targeting the effective separation and extraction of valuable materials from batteries, such as lithium and cobalt. Li et al. [17] proposed recovering lithium and cobalt from waste lithium-ion batteries through processes involving burning adhesives and leaching with water, sulfuric acid, and hydrogen peroxide. These technologies underscore the focus on material recycling and recycling efficiency. Ganter et al. [18] developed an innovative method for recycling lithium-ion batteries that refunctionalises the cathode to reinstate its original electrochemical performance. While these studies have established a foundation for more advanced recycling approaches, they have also highlighted the challenges of high costs, low efficiency, and significant environmental impacts.
As research progressed, scholars began to explore more integrated and efficient recycling options. Liu et al. analysed the recycling and decision-making strategies for new energy vehicle power batteries. They proposed three recycling models: industrial alliance, self-operated, and third-party enterprises. By establishing a recycling profit function model, the study found the profit relationship and influencing factors under different recycling modes [19]. Through the lens of game theory, Li and their team investigated the superior collective recycling approach for electric vehicle manufacturers. The study compared four collaborative recycling strategies and found that implementing a deposit–refund mechanism significantly enhances the recycling efficiency, and the integrated alliance model is the best alliance model in the fierce recycling competition [20]. Zan et al. examined the best lead–acid battery recycling route under China’s extended producer responsibility scheme. The study considered three recycling channel structures and found that the recycling rate was the largest under the independent recycling model, but the highest profitability could be obtained by entrusting the recycling to the alliance [21].
The study of the power battery recycling mode is an evolving process, and in addition to the study of the recycling mode, the factors affecting power battery recycling are also an important topic studied by scholars. Power battery recycling is influenced by factors such as technology, economy, and politics [22]. According to Zhang [23], the technical ability of enterprises determines the performance of products, including the purity of recycled raw materials and the safety and reliability of gradient utilisation products. Therefore, the level of technology is a decisive factor for the power battery recycling and reuse industry to achieve a competitive advantage. At the economic level, government financial incentives can significantly improve recycling efficiency [24,25]. For firms with low current profits but high potential for future earnings, the government should provide higher subsidies at an early stage and gradually reduce the incentives as the firm’s potential earnings grow [26]. Regarding policy implications, Richter et al. [27] discovered that extended producer responsibility enhances product waste management. Similarly, Hou et al. [28] found that adopting a recycling responsibility model for recycling firms to maintain e-waste recycling is more sustainable in terms of economic and social benefits.
2.2. Research on Evolutionary Games in the Field of Recycling
Evolutionary game theory combines the concept of evolution in biology with traditional game theory, focusing on how to achieve equilibrium in the absence of the assumption of complete rationality through the evolution of strategies in the process of imitation and adaptation [29].
Evolutionary game theory is currently used in a number of areas. Based on herd behaviour, Li et al. [30] developed a three-way evolutionary game model to analyse the evolutionary mechanism of cement companies’ adoption of green product certification and to identify the factors affecting this evolution. The study found that five evolutionarily stable strategies emerged, influenced by cement companies’ rent-seeking preferences, the distance of cement products transported, the intensity of governmental regulation, and the success rate of regulation. Using evolutionary game theory, Jamali et al. [31] provide insights into manufacturers’ pricing decisions and the adoption of long-term strategies through a case study of the Iranian cement, steel, and paper industries. It is found that industries with high annual electricity consumption, such as steel, adapt more quickly to technology switching strategies than other industries, as influenced by subsidy allocation and electricity demand.
There are numerous applications of evolutionary game theory in the recycling field. In the earliest days, Heap and Varoufakis extended game theory to scenarios such as repeated games, bargaining games, and evolutionary games among stakeholders in recycling, thus enhancing strategic decision making in waste management and resource allocation [32]. In recent years, the application of game theory in recycling has become more nuanced, with studies employing evolutionary game models and differential game theory to study competitive dynamics and stakeholder behaviour in waste recycling. For example, Qi et al. [33] used evolutionary game models to explore the competitive dynamics between manufacturing firms and retailers in waste electronics recycling, highlighting the factors that influence the likelihood of choosing cooperative strategies. Similarly, Yang et al. [34] conducted a comparative analysis of courier packaging waste recycling models based on differential game theory, delving into the behavioural strategies of multiple stakeholders.
The application of an evolutionary game theory in recycling offers insights for the management of power batteries. Yao et al. constructed a technological synergistic game model for PBR firms and analysed the synergistic effects of network embedding and knowledge spillovers on the technological innovation of PBR firms [35]. Further progress in applying game theory to power battery recycling involves the development of dynamic models to account for changing stakeholder strategies and environmental impacts. Based on a combination of system dynamics and dynamic game modelling, Li et al. created a multi-channel recycling decision framework for electric vehicle batteries. The practical applications of game theory in power battery recycling have also been explored, with studies focusing on technology integration and optimization [36]. For example, Yao et al. proposed a stochastic general sum game theoretical framework for managing shared battery resources among users in an electricity market. This framework aimed to achieve equilibrium and optimal control policies, demonstrating the potential of game theory to contribute to efficient battery management and recycling [37].
2.3. Research on Prospect Theory
Prospect theory is a theory that describes how people make decisions in the face of uncertainty, with particular emphasis on asymmetric evaluations of losses and gains and probabilistic distortions in decision making [38].
In recent years, the applications of prospect theory have continued to expand in a number of areas, including decision support, behavioural economics, and transport system analyses. Leoneti and Gomes [39] demonstrate the application of prospect theory in decision support by analysing the fit of the TODIM method with prospect theory and point out the need for further research to improve the predictive power. In addition, Lang [40] highlights the role of prospect theory in understanding boundedly rational behaviour under uncertainty in transport systems by examining a prospect-theory-based model of route choice. Werner and Zank [41] present a method for identifying prospect theory reference points based on revealed behaviour, thereby improving the empirical measurement capabilities and falsifiability of the model.
Prospect theory, which is suitable for the assumption of restricted rationality in evolutionary games, can provide insight into how players make decisions compared to the normative economics’ expected utility theory [42]. Some academics have blended evolutionary game theory with prospect theory. In terms of waste resource utilization, Wang et al. [43] integrated prospect theory into the trilateral evolutionary game theory to analyse the utilization process of construction waste resources by local governments, construction companies, and the public. Zhang et al. [44] combined prospect theory and evolutionary games and found that residents’ participation benefits are higher, participation costs and opportunity costs are lower, and reasonable direct benefit distribution coefficients can help increase the participation rate in waste classification. In terms of carbon emission reduction, Zhang et al. [45] used the two-party evolutionary game model of prospect theory to study the interactive relationship between local governments and port enterprises in the context of green port construction. Sun et al. [46] established an evolutionary game model between the government and enterprises based on prospect theory. This study considered the strategic choices of the government and enterprises under different risk levels of air quality deterioration, and found that under low-risk conditions, the government tends to adopt passive supervision. Instead of adopting passive supervision, enterprises prefer traditional production methods.
Currently, research in the field of power battery recycling is predominantly focused on recycling technologies and methodologies. However, the critical importance of economic, policy, and strategic behaviour aspects remains underexplored. While evolutionary game theory is frequently applied in analysing recycling environments, its utilization in the specific context of power battery recycling—particularly in investigating technological collaboration and the dynamic interactions between stakeholders—is notably scarce. Prospect theory holds significant promise for enhancing our understanding of strategic interactions within the recycling industry, especially given the dynamic and uncertain landscape of power battery recycling. Yet, the full potential of this theory in this domain has yet to be realized.
Considering these limitations, our model explores decision-making behaviour under uncertainty and risk, comprehensively considering participants’ risk preferences and value perceptions. Moreover, we broaden the application of evolutionary game theory in recycling, uncovering the long-term effects of this theory on stakeholders’ strategic decisions by integrating dynamic perspectives of collaborative innovation and policy shifts. Additionally, by innovatively incorporating key parameters such as cost–benefit sharing and technological spillovers, our analysis illuminates the strategic interactions among stakeholders in the power battery recycling industry and underscores the significance of these interactions in promoting low-carbon innovation.
3. Three-Party Evolutionary Game Model Based on Prospect Theory
3.1. Description of the Model
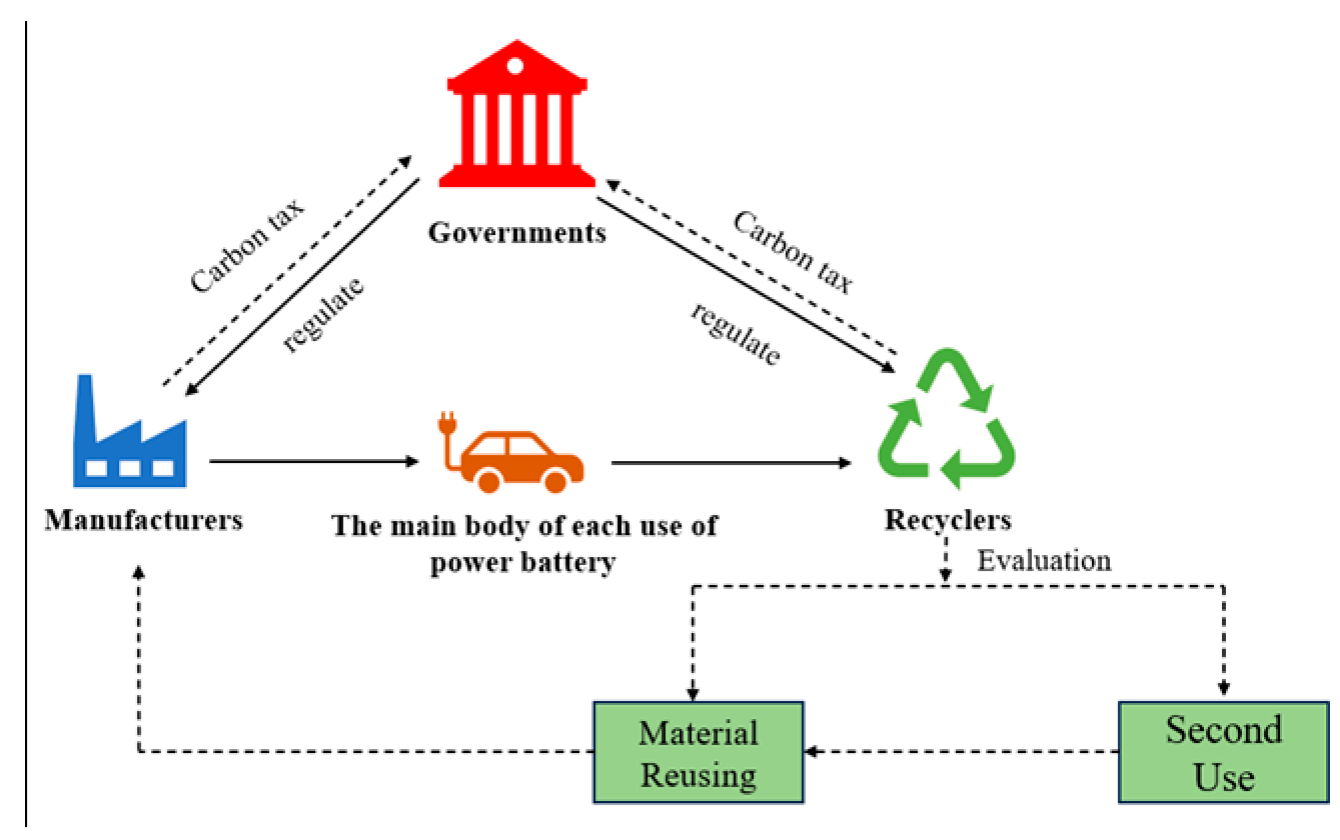
In a three-party game, each player selects a strategy to optimize their interests and adjusts their approach based on the outcomes to achieve strategic equilibrium. NEV (new energy vehicle) manufacturers aim to boost their market competitiveness through low-carbon innovations, relying on government incentives and the development of essential infrastructure to expand their market presence. Recyclers, meanwhile, focus on advancing battery recycling. Their goal is to collaborate with manufacturers to establish an environmentally friendly recycled power battery system. This system aims to recycle and reuse old batteries, benefiting the environment and potentially generating profits. Governments bear the responsibility to lower emissions and foster environmental sustainability. They can fulfil this role by offering incentives and imposing penalties to steer businesses towards proactive innovation, culminating in green socio-economic development.
Recycling aged and end-of-service-life batteries from electric vehicles is essential for advancing low-carbon progress and fostering a circular economy, where managing a closed-loop supply chain for power batteries is pivotal in achieving economic and environmental sustainability. To promote ecologically friendly recycling methods, governments must enact green legislation for the disposal of spent power batteries. The decision-making process in environmentally friendly battery recycling involves three primary stakeholders: manufacturers, recyclers, and governments. Governments face a choice between strict regulation and deregulation. Manufacturers and recyclers have the options of ‘participating in low-carbon innovation’ (PI) or ‘not participating in low-carbon innovation’ (NI). Engagement in low-carbon innovation can enhance the reuse efficiency and environmentally responsible treatment of batteries, thereby reducing environmental pollution and resource depletion. Furthermore, manufacturers can avail themselves of low-carbon subsidies from the government by adopting sustainable materials and energy-efficient production technologies. Recyclers can contribute to low-carbon innovation by improving used batteries’ sorting and treatment processes and employing advanced material recovery technologies. Conversely, failing to adopt low-carbon innovation may result in increased environmental pollution and the depletion of metal resources, without the advantage of government subsidies. The recycling process of power batteries is shown in Figure 1.
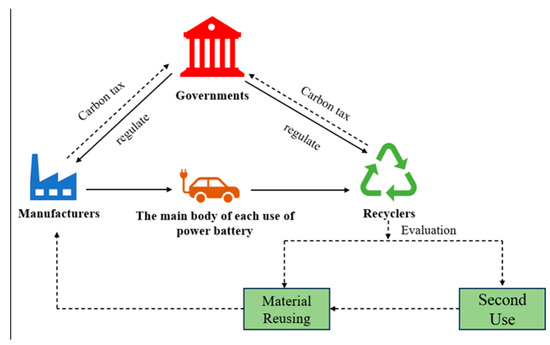
Figure 1.
Process of recycling power batteries.
3.2. Game Model Assumptions
Assumption 1.
Prospect theory. The government, manufacturers, and recyclers are all finite rational, and the players’ strategic choices are based on their own perceptions of the value of gains and losses rather than actual utility. The participants are the government, the manufacturer, and the recycler. The three parties are subjects of a finite rational game and their information is asymmetric. Over time, the strategy choices of the participants evolve into optimal strategies. Value v(ΔU) is perceived when the game’s parties are uncertain about gain or loss ΔU. It is calculated using the following formula:
The difference between the gain at the reference point and the gain attained by the subject’s behavioural strategy is represented by Equations (1) through (3). Δπ ≥ 0 indicates the value of the decision maker’s subjective perceived gain from the strategy; the opposite is a loss. α, β (0 ≤ α, β ≤ 1) denote the risk preference coefficients of the decision maker’s perceived gain and loss value functions, with larger values indicating that the decision maker is more inclined to take risks. The symbol λ (λ ≥ 1) represents the decision maker’s sensitivity to losses, with higher values indicating a stronger aversion to losses. w(p) denotes the weight of the event, p denotes the true probability of the event, and r denotes the decision impact coefficient. In this research, the traditional measures of gains and losses are substituted with their respective deviations from a baseline, setting the value function’s reference point at zero.
Assumption 2.
Strategic choice. The government’s strategy choice is (strict regulation, deregulation) whose regulatory probability is denoted by (x,1 − x); the manufacturer’s strategy choice is (PI, NI), with event probability denoted by (y,1 − y); and the recycler’s strategy choice is (PI, NI), with event probability denoted by (z,1 − z), where x, y, z ∈ [0,1].
Assumption 3.
Regulatory strategy. The regulatory cost is GK1 when the government controls severely; there is no regulatory cost if the government decides not to regulate the technique.
Assumption 4.
Incentives and penalties. When the government strictly regulates, the government grants carbon emission reduction subsidies and tax incentives to manufacturers and recyclers participating in low-carbon innovation as GM and GR, respectively, with m denoting the absorptive capacity of the manufacturer in terms of support, and n denoting the absorptive capacity of the recycler in terms of support. If manufacturers and recyclers do not participate in low-carbon innovation, excess carbon emissions will be generated, and the government will impose a carbon tax on companies generating excess carbon emissions under strict regulation, with the excess carbon emissions of manufacturers and recyclers being QM and QR, and the carbon tax rate being r.
Assumption 5.
Costs and benefits. The costs of low-carbon innovation for manufacturers and recyclers are C1 and C2, respectively, and the perceived benefits of co-innovation are ΔR. Due to the government’s involvement, the government provides assistance to both parties to reduce the cost of their technological innovations, and the cost reduction is denoted by S. The manufacturer’s co-benefit sharing coefficient and cost-sharing coefficient are a, b. The recycler’s co-benefit sharing coefficient and cost-sharing coefficient are 1 − a,1 − b where 0 < a, b < 1. Government participation also results in excess profits, and the perceived benefit to the government is GR1. η denotes the coefficient of the government’s perceived benefit; when both parties innovate collaboratively, η = 1, and the government’s perceived benefit is GR1; when both parties do not innovate collaboratively, the government’s perceived benefit is ηGR1. Without synergies, the manufacturer receives a normal benefit, CR1, and the recycler receives a benefit, SR1.
Assumption 6.
Spillover effect. If one party participates in a low-carbon innovation and one party does not, the non-participating party receives an additional benefit, i.e., a spillover benefit, from the participating party. d1 and d2 denote the spillover coefficients for the manufacturer and the recycler, respectively, and R1 and R2 denote the benefits that manufacturers and recyclers receive when they innovate independently, respectively.
Assumption 7.
Perceived and deterministic parameters.
Perceived gains refer to an expected gain based on the subject’s subjective perception and assessment of gain or loss. In this paper, the benefits (GR1, GM, GR, ΔR, R1, R2) to governments, manufacturers, and recyclers when engaging in low-carbon innovations are treated as perceived rather than deterministic benefits because they are influenced by each party’s subjective expectations, mental attitudes, and risk preferences for future benefits, rather than directly quantifiable economic benefits.
Deterministic parameters, on the other hand, are those that can be directly quantified and predicted, usually based on actual economic activity and changes in the external environment. In this paper, the costs and ordinary benefits generated by the government, manufacturers, and recyclers (GK1, C1, C2, S, CR1, SR1); carbon emissions (QR, QM); carbon tax rate (r); spillover coefficients (d1, d2); and absorptive capacity (m, n) can be considered as deterministic parameters. This is because they represent specific economic impacts faced by participants that can be explicitly calculated and foreseen.
3.3. Construction of Payoff Matrix
Based on the above assumptions, we can obtain a matrix of benefits for the government, manufacturers, and recyclers. The payoff matrix is shown in Table 1.

Table 1.
Payoff matrix of the tripartite game.
4. Model Resolution and Stability Strategy Analysis
4.1. Dynamic Equations and Stability Analysis of Replication in Government
From the benefit matrix, the expected prospective values of the government’s strategy of strict regulation and no regulation are U11, U12. The average expected future value is 1.
U11 = yz[V(GR) − GK1 − mV(GM) − nV(GR)] + y(1 − z)[V(GR1) − GK1 − mV(GM) + rQR)] + (1 − y)z[V(GR1) − GK1 − nV(GR) + rQM] + (1 − y)(1 − z)[rQM + rQR − GK1]
U12 = yz[ηV(GR1)] + y(1 − z)[ηV(GR1) + rQR] + (1 − y)z[ηV(GR1) + rQM]
The government’s equation for replication dynamics is the following:
F(x) = x(1 − x)[rQR + rQM + (1 − η)V(GR1) − GK1 − znV(GR) − ymV(GM)]
According to the evolutionary game theory and the stability principle of the differential equation, when F(x) = 0, , x* is an evolutionary stable strategy for the replicated dynamic equation; on the contrary, it is not a stable strategy. When F(x) = 0, x* = 0, x* = 1, y* = .
The first-order partial derivatives are then computed for the government replication dynamic equations:
Let G(y) = rQR + rQM + (1 − η)V(GR1) − GK1 − znV(GR) − ymV(GM), since < 0, G(y) is a decreasing function. Due to the uncertainty in the magnitude of the replicated dynamic equations, they are discussed in the following scenarios:
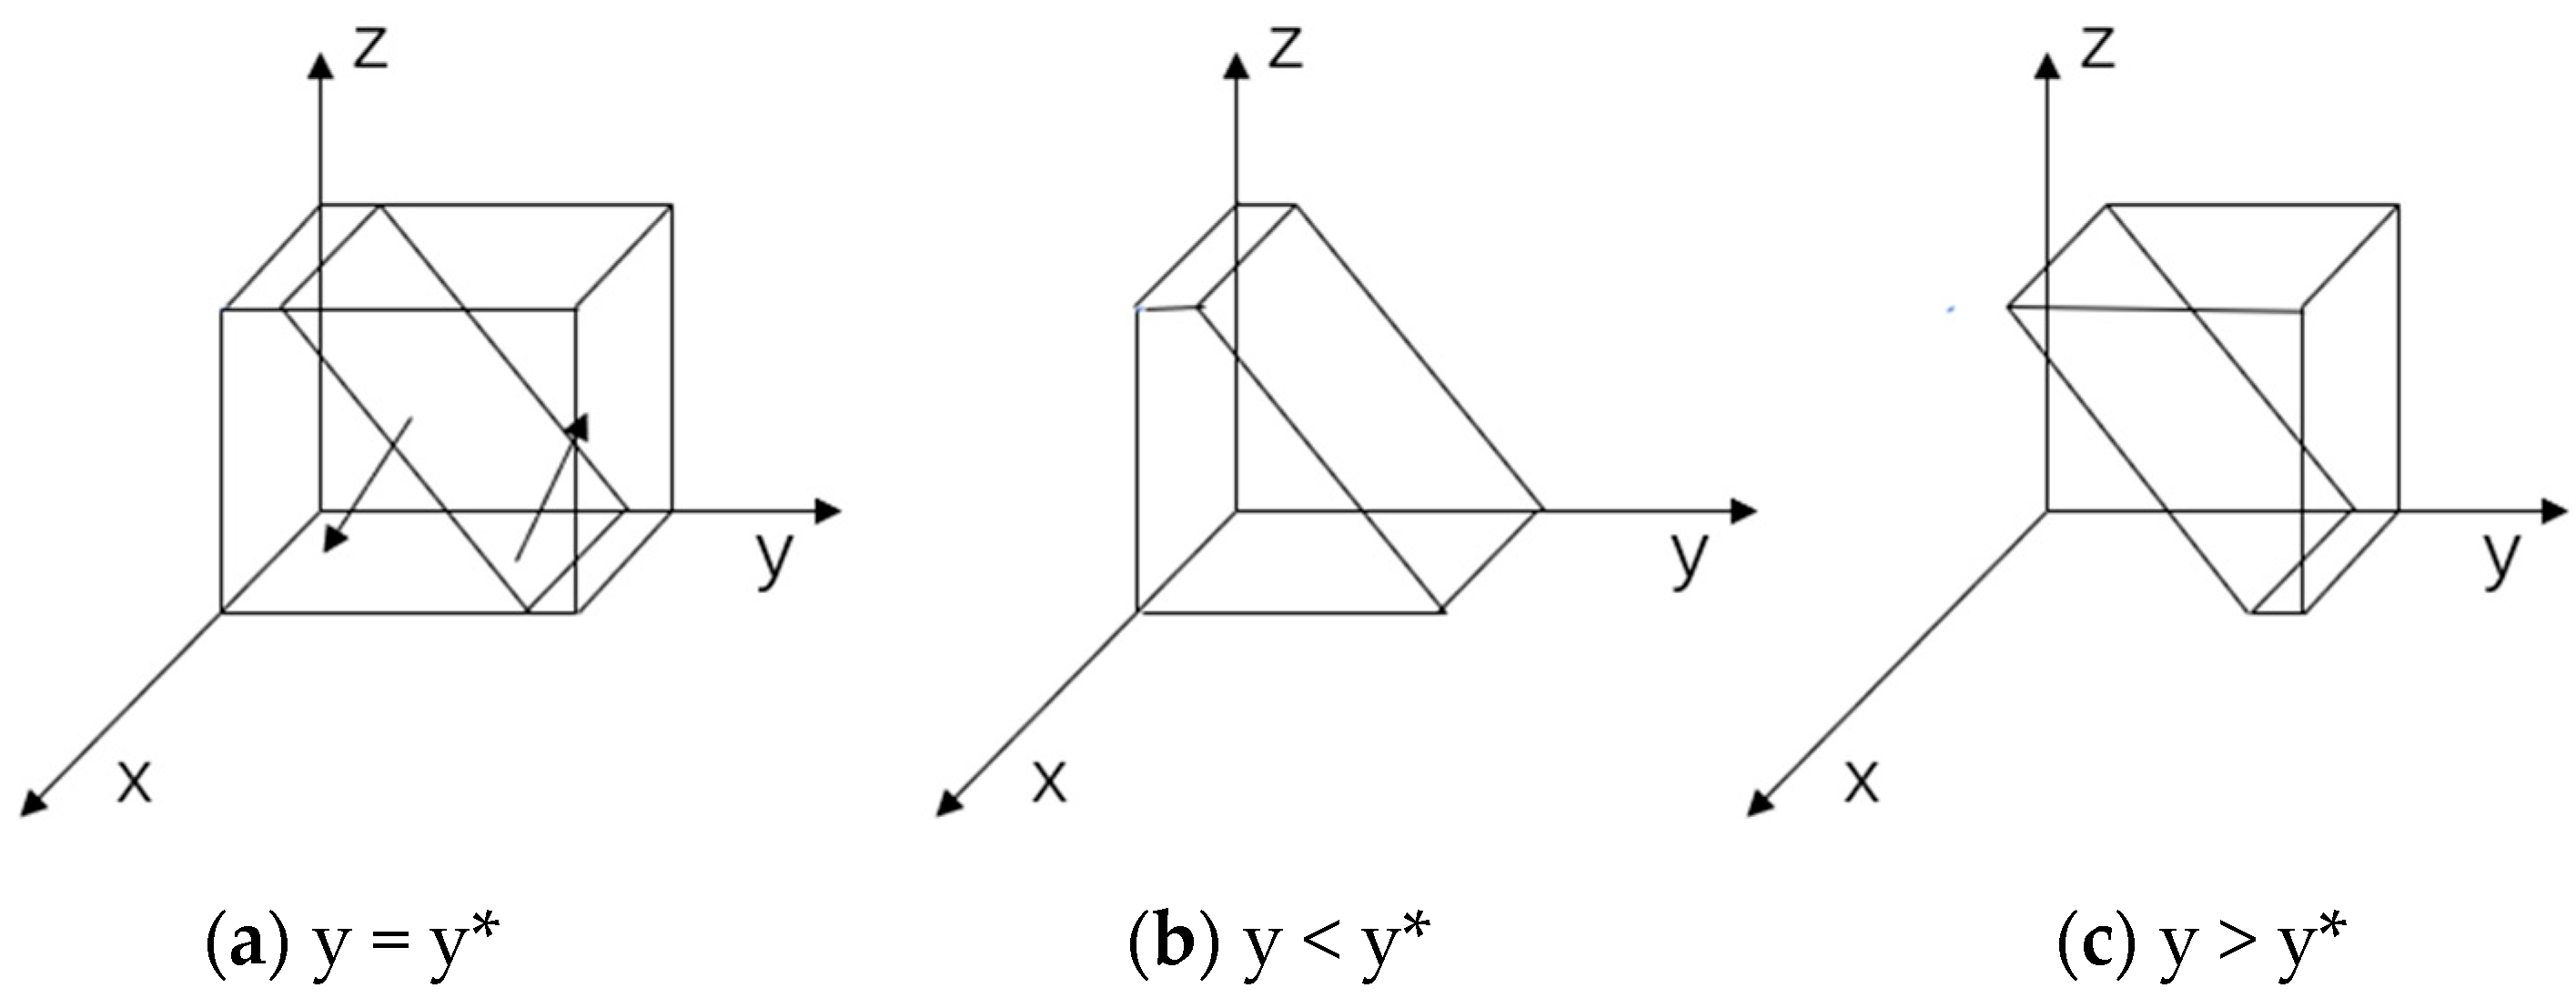
When y = y*, F(x) ≡ 0; that is, when the probability of low-carbon innovation by manufacturers is y*, the government’s strategy is stable and the proportion of strategy choices does not change over time, as shown in Figure 2.

Figure 2.
Government replication of dynamic phase diagrams.
4.2. Dynamic Equations and Stability Analysis of Replication in Manufacturers
According to the benefit matrix, the expected prospective value of the manufacturer’s participation and non-participation in low-carbon innovation is U21 and U22. The average expected future value is 2.
U21 = zx[CR1 + aV(ΔR) − b(C1 + C2 − 2S) + mV(GM)] + (1 − z)x[CR1 + mV(GM) − (C1 − S) + V(R1)] + z(1 − x)[CR1 + aV(ΔR) − b(C1 + C2)] + (1 − x)(1 − z)[CR1 + V(R1) − (C1 − S)]
U22 = zx[CR1 − rQM + d1V(R2)] + (1 − z)x[CR1 − rQM] + z(1 − x)[CR1 + d1V(R2) − rQM] + (1 − z)(1 − x)CR1
The manufacturer’s equation for replication dynamics is the following:
F(y) = y(1 − y)[x(rQM + bS + mV(GM)) + z(aV(ΔR) − V(R1) − d2V(R1) − C1) + d2V(R1) − (C1 + C2)b]
According to the evolutionary game theory and the stability principle of the differential equation, when F(y) = 0, , y* is an evolutionary stable strategy for the replicated dynamic equation; on the contrary, it is not a stable strategy. When F(y) = 0, y* = 0, y* = 1, x* = .
The first-order partial derivatives are then computed for the manufacturer replication dynamic equations:
Let G(x) = x(rQM + bS + mV(GM)) + z(aV(ΔR) − C1 − V(R1) − d2V(R1)) + d2V(R1) − (C1 + C2)b, since > 0, G(x) is an increasing function. Due to the uncertainty in the magnitude of the replicated dynamic equations, they are discussed in the following scenarios:
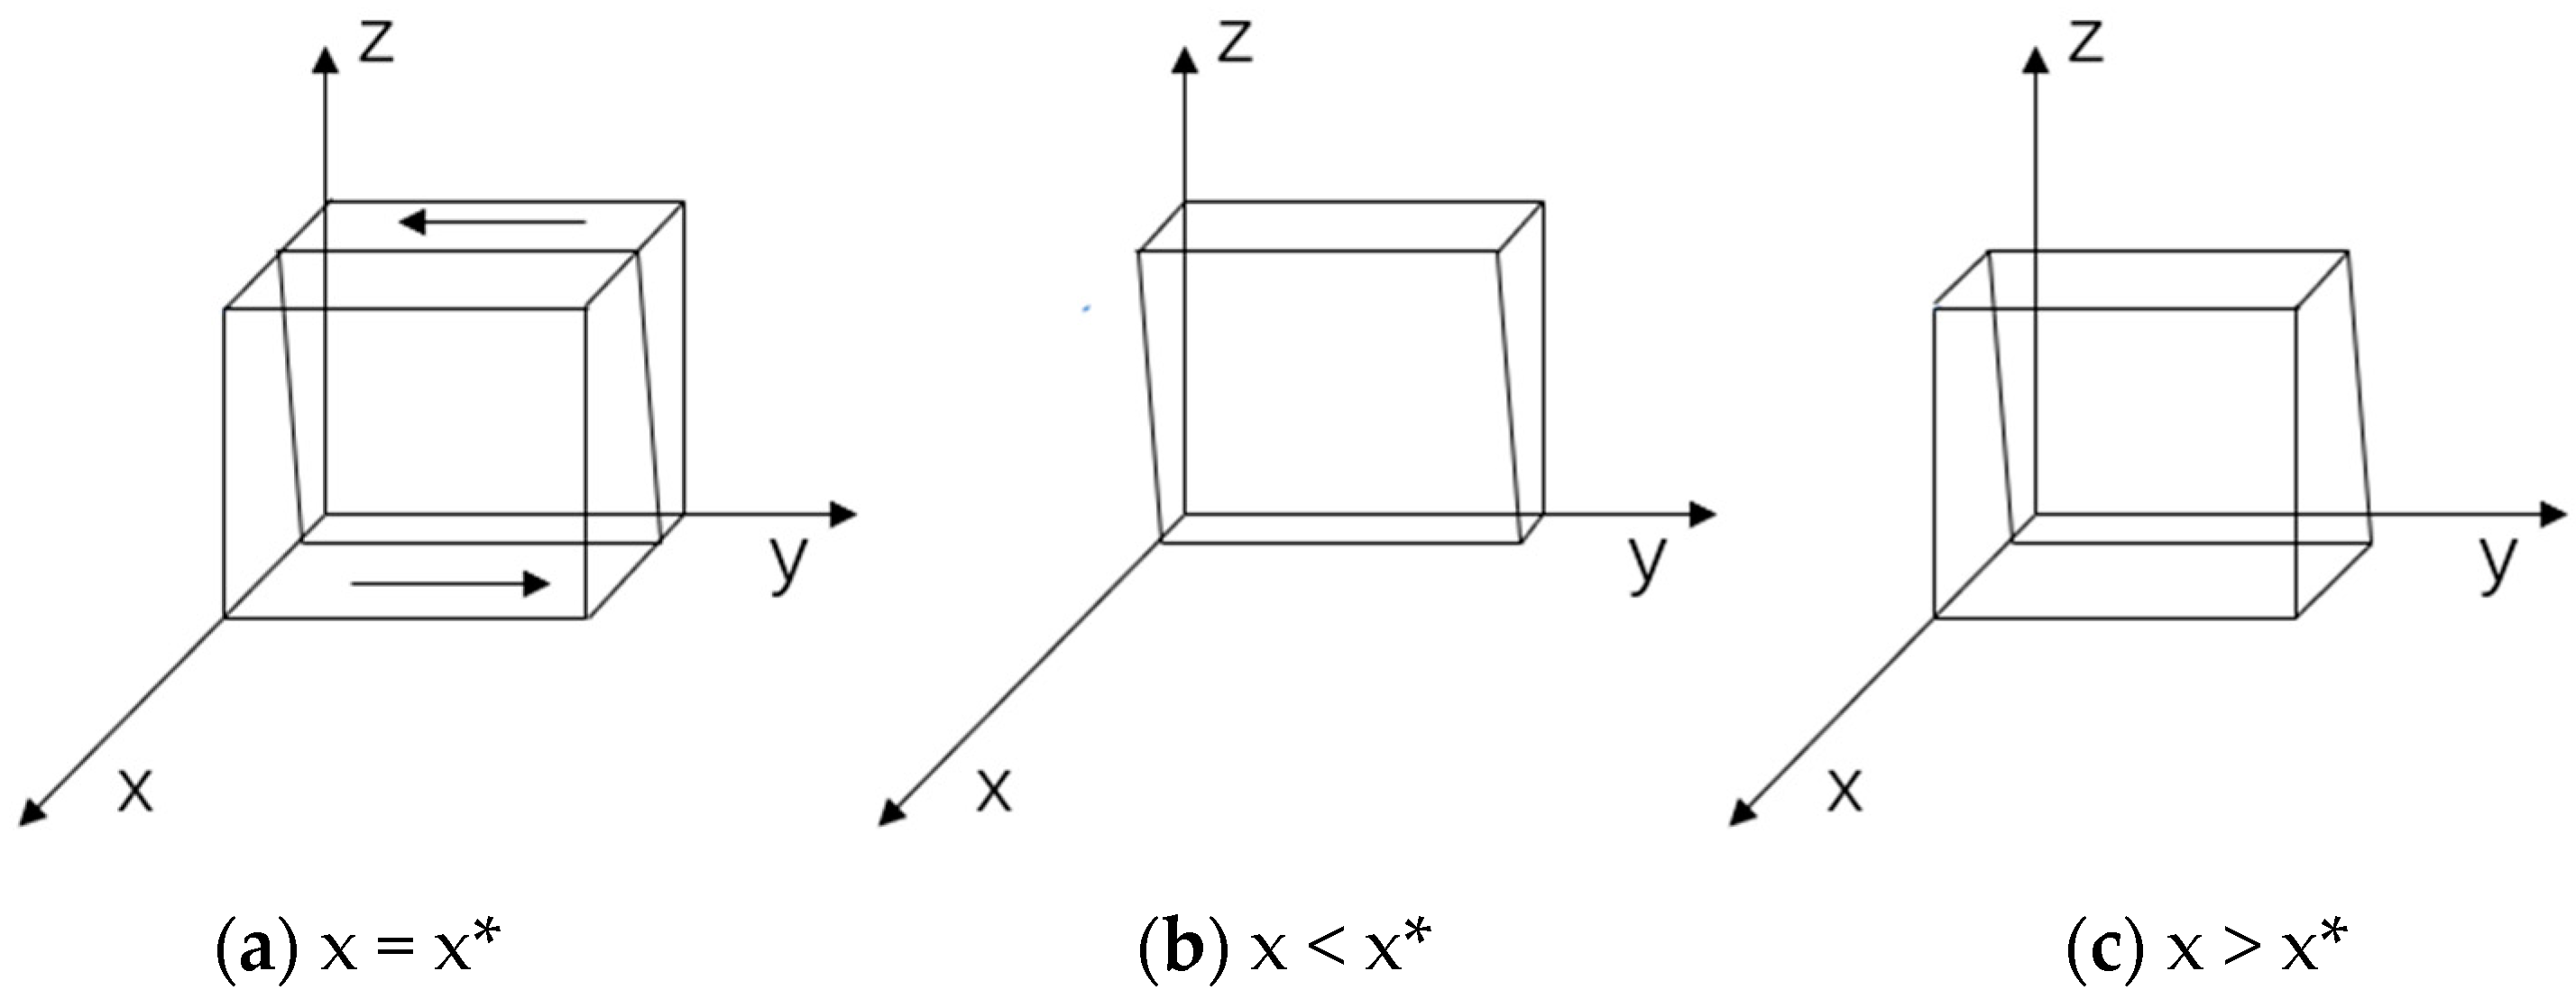
When x = x*, F(y) ≡ 0; that is, when the probability of rigorous regulation by the government is x*, the manufacturer ‘s strategy is stable and the proportion of strategy choices does not change over time, as shown in Figure 3.
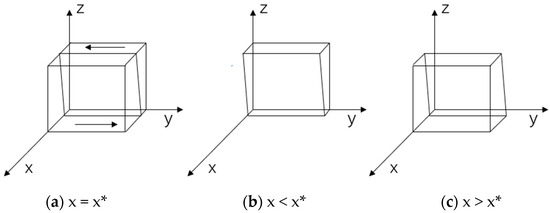
Figure 3.
Manufacturer replication of dynamic phase diagrams.
If 0 < x < x*, G(x) < 0, then the equilibrium stable strategy is y* = 0.
If x > x* > 0, G(x) > 0, then the equilibrium stable strategy is y* = 1.
If (C1 + C2)b − d2V(R1) − z(aV(ΔR) − V(R1) − d2V(R1) − C1) < 0, mV(GM) + bS > 0, x* < 0, point x* is meaningless, and stability points are y* = 0, y* = 1. Therefore, when x > 0 > x*, G(x) > 0, <0, y* = 1 is the manufacturer ‘s evolutionary stabilisation strategy.
4.3. Dynamic Equations and Stability Analysis of Replication in Recyclers
According to the benefit matrix, the expected prospective value of the recycler’s participation and non-participation in low-carbon innovation is U31 and U32. The average expected future value is 3.
U31 = xy[SR1 + (1 − a)V(ΔR) − (1 − b)(C1 + C2 − 2S) + nV(GR)] + x(1 − y)[CR1 − rQM + d1V(R2)] + (1 − x)y[SR1 + (1 − a)V(ΔR) − (1 − b)(C1 + C2)] + (1 − x)(1 − y)[SR1 + V(R2) − (C2 − S)]
U32 = xy(SR1 − rQR + d2V(R1)) + x(1 − y)[SR1 − rQR] + (1 − x)y[SR1 + d2V(R1) − rQR] + (1 − x)(1 − y)SR1
The recycler’s equation for replication dynamics is the following:
F(z) = z(1 − z)[x((1 − b)S + nV(GR)) + y((1 − a)V(ΔR) + rQM − rQR − V(R2) − d1V(R2)) − (1 − b)(C1 + C2) + d1V(R2)]
According to the evolutionary game theory and the stability principle of the differential equation, when F(z) = 0, , z* is an evolutionary stable strategy for the replicated dynamic equation; on the contrary, it is not a stable strategy. When F(z) = 0, z* = 0, z* = 1, x* = .
The first-order partial derivatives are then computed for the recycler replication dynamic equations:
Let G(x) = x((1 − b)S + nV(GR)) + y((1 − a)V(ΔR) + rQM − rQR − V(R2) − d1V(R2)) − (1 − b)(C1 + C2) + d1V(R2), since > 0, G(x) is a increasing function. Due to the uncertainty in the magnitude of the replicated dynamic equations, they are discussed in the following scenarios:
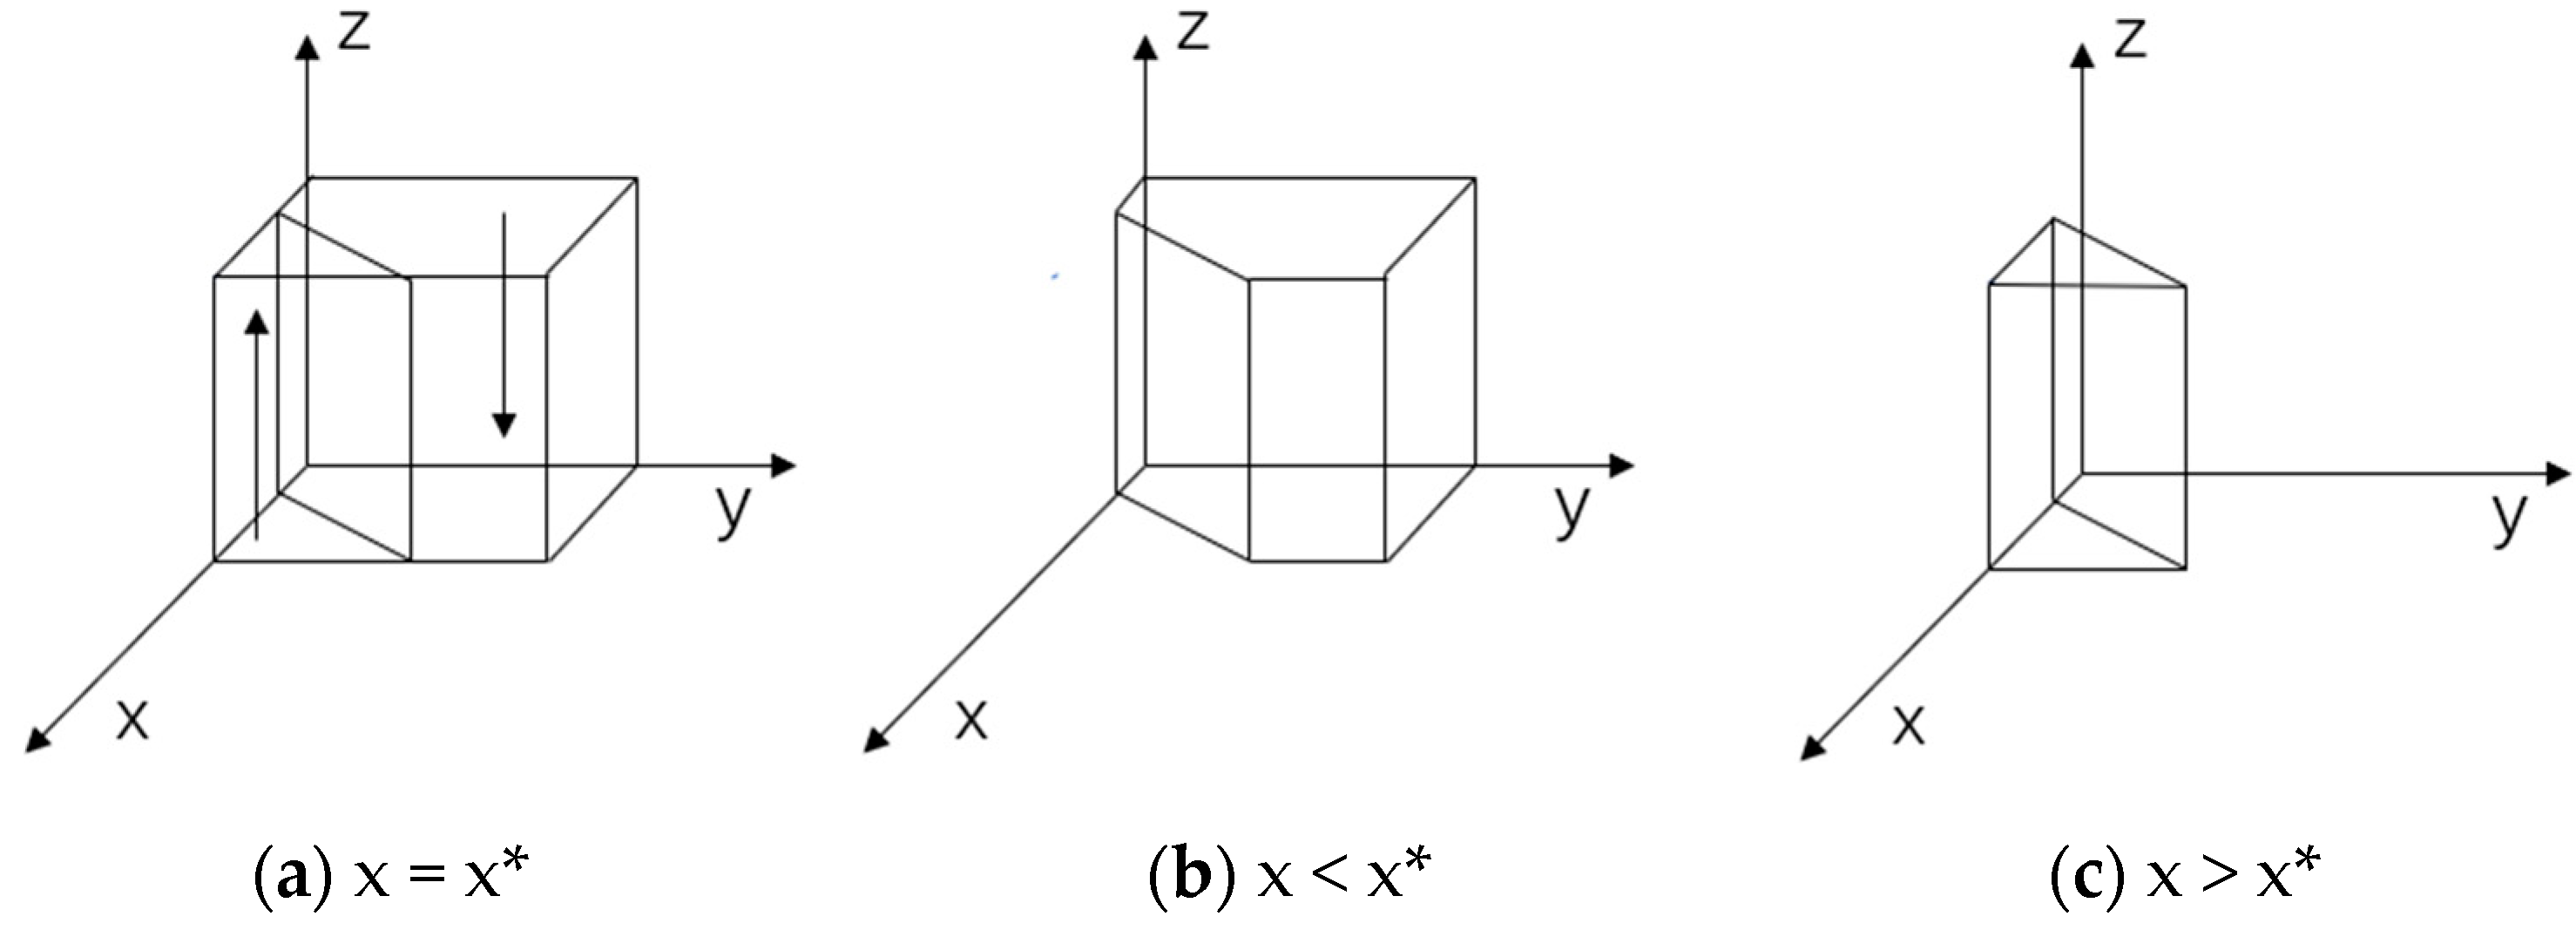
When x = x*, F(y) ≡ 0; that is, when the probability of rigorous regulation by the government is x*, the recycler’s strategy is stable and the proportion of strategy choices does not change over time, as shown in Figure 4.

Figure 4.
Recycler replication of dynamic phase diagrams.
If 0 < x < x*, G(x) < 0, then z* = 0 is the equilibrium stable strategy.
If x > x* > 0, G(x) > 0, then z* = 1 is the equilibrium stable strategy.
If −y((1 − a)V(ΔR) + rQM − rQR − V(R2) − d1V(R2)) + (1 − b)(C1 + C2) − d1V(R2) < 0, (1 − b)S + nV(GR) > 0, z* < 0, point z* is meaningless, and stability points are z* = 0, z* = 1. Therefore, when x > 0 > x*, G(x) > 0, < 0, z* = 1 is the manufacturer’s evolutionary stabilisation strategy.
4.4. System Stability Analysis of Three-Party Game
We apply the indirect methodology of Lyapunov to analyse the stability of the system. For additional study, we introduce the evolutionary game’s Jacobi matrix. The Jacobian matrix is shown in Equation (4).
By setting F(x), F(y), and F(z) all to zero, the equilibrium points of the evolutionary game are determined, resulting in eight distinct equilibrium points and one mixed strategy equilibrium within the domain D = {0 ≤ x ≤ 1, 0 ≤ y ≤ 1, 0 ≤ z ≤ 1}. These points are identified as E1(0,0,0), E2(1,0,0), E3(0,1,0), E4(0,0,1), E5(1,0,1), E6(1,1,0), E7(0,1,1), and E8(1,1,1). Weibull established that for evolutionary games involving two or more groups, evolutionarily stable strategies (ESSs) must be strict Nash equilibria and pertain solely to pure strategies [47]. Given that the mixed strategy equilibrium does not meet the criteria for a strict Nash equilibrium, this study focuses exclusively on the pure strategy equilibria. Next, Equation (4) incorporates the pure strategic equilibrium points, which are E1–E8. After determining the eigenvalues of the Jacobian matrix, the outcomes are presented in Table 2.
Table 2.
Eigenvalue matrix of the equilibrium points.
According to Lyapunov’s law, eigenvalues all less than 0 are ESS stable points. The analysis reveals that the eigenvalues λ1 for points E3(0,1,0) and E4(0,0,1) are positive, indicating that these points are unstable. In addition, depending on the situation, the sum of the costs plus the original benefits of the manufacturer’s choice of the two strategies should be greater than the benefits arising from the manufacturer’s participation in co-innovation, i.e., C1 + R1 + bC1 + bC2 − aV(ΔR) > 0; therefore, the eigenvalue λ1 of point E7(0,1,1) is positive, and E7 is also an unstable point. Therefore, only the remaining five points are discussed. The equilibrium points are judged as shown in Table 3.
Table 3.
Equilibrium points’ local stability.
The following three scenarios can be inferred from the Jacobian matrix’s eigenvalues:
Scenario 1.
V(GR1) − GK1 + rQM + rQR − tV(GR1) < 0; if the government does not regulate the activities of producers and recyclers, the only stabilisation strategy for recyclers and manufacturers is E1(0,0,0) (deregulation, NI,NI). In this case, the condition V(GR1) − GK1 + rQM + rQR − tV(GR1) < 0 must be satisfied, namely that the costs of regulation outweigh the benefits it gains from low-carbon innovation and the carbon tax it imposes on manufacturers and recyclers. In this scenario, the government lacks motivation to enforce regulation, as the regulatory costs exceed the potential gains from low-carbon innovation and carbon taxes. Concurrently, without government incentives or mandates, manufacturers and recyclers might conclude that the expenses associated with low-carbon innovation surpass its anticipated benefits, leading them to prefer the status quo over pursuing low-carbon innovation.
Scenario 2.
V(GR1) − GK1 + rQM + rQR − tV(GR1) > 0; bS − bC2 − bC1 + d1V(R2) − rQM + mV(GM) < 0; S − C2 − C1 + bC1 + bC2 − bS + d2V(R1) + nV(GR) < 0, and the equilibrium point in this case is E2(1,0,0). When the cost of regulation is less than the benefits to be gained from low-carbon innovation and the carbon tax on manufacturers and recyclers, the government chooses to regulate strictly, i.e., V(GR1) − GK1 + rQM + rQR − tV(GR1) > 0. According to the inequality bS − bC2 − bC1 + d1V(R2) − rQM + mV(GM) < 0, it can be seen that when the manufacturer’s cost of innovation under government regulation, b(C1 + C2 − S), and the carbon tax rQM it pays is greater than the spillover benefits from the recycler’s innovations, V(R2)d1, and the subsidy the manufacturer receives from the government, mV(GM), the manufacturer will choose the “NI” strategy. Meanwhile, when the recycler’s cost of innovation under government regulation, (1 − b)(C1 + C2 − S), is greater than the spillover benefits from the manufacturer’s innovations, V(R1)d2, and the subsidy the recycler receives from the government, nV(GR), the recycler will choose the “NI” strategy. In this scenario, where regulatory costs for governments are lower and the benefits derived from low-carbon innovation and carbon taxes are higher, governments possess a strong incentive to implement stringent regulation. However, even with such incentives, manufacturers and recyclers might still opt out of engaging in low-carbon innovation if they perceive that the associated costs surpass the government incentives and the potential benefits from innovation. This reluctance could stem from immediate cost pressures and uncertainties regarding the innovation outcomes, which may overshadow the prospects of long-term gains.
Scenario 3.
V(GR1) − GK1 + rQM + rQR − tV(GR1) > 0; C1 − V(R1) + bC1 + bC2 − bS − aV(ΔR) + rQM − mV(GM) < 0; (1 − b)(C1 + C2 − S) − R2 − (1 − a)V(ΔR) − rQM +rQR − nV(GR) < 0, and the equilibrium point in this case is E8(1,1,1). When the cost of regulation is less than the benefits to be gained from low-carbon innovation and the carbon tax on manufacturers and recyclers, the government chooses to regulate strictly, i.e., V(GR1) − GK1 + rQM + rQR − tV(GR1) > 0. According to the inequality C1 − V(R1) + bC1 + bC2 − bS − aV(ΔR) + rQM − mV(GM) < 0, the manufacturer opts for the “PI” strategy when the combined costs of participating and not participating in low-carbon innovation are lower than the total of its initial revenue, anticipated government incentives, and the gains from joint innovation. Similarly, a recycler will opt for the “participate in low-carbon innovation” (PI) strategy when the cost of engaging in low-carbon innovation is offset by the combination of government incentives, inherent benefits, and co-innovation revenue. In this context, the low regulatory costs and the substantial benefits of low-carbon innovation and carbon taxes encourage governments to adopt stringent regulatory actions. For manufacturers and recyclers, the incentives from the government decrease the costs and enhance the benefits of participating in low-carbon innovation. This participation is driven by the prospect of gaining a competitive edge in the market, achieving technological advancement, and aligning with future market trends facilitated by low-carbon innovation.
5. Simulation and Analysis
Currently, China’s power battery recycling industry is witnessing rapid growth, with latest forecasts predicting a compound annual growth rate exceeding 30%, and the sector’s value is expected to surpass CNY 37 billion by 2025 [9]. The industry has established a preliminary industrial chain framework, involving government agencies, power battery manufacturers, and recycling companies as key stakeholders. Within this framework, relevant government departments are actively fostering industrial upgrading and circular economy development through policy formulation, financial subsidies, and other initiatives aimed at reducing the costs associated with power battery recycling and reuse. These efforts also serve to encourage technological innovation and instil environmental protection values among the populace. Therefore, based on the actual situation of cooperation in the power battery recycling industry, assumptions are made about the parameters of the perceived benefit matrix: r = 0.5, QM = 4, QR = 3, η = 0.5, GK = 5, GR1 = 40, GR = 5, GM = 5, m = 0.8, n = 0.8, b = 0.4, S = 10, a = 0.5, ΔR = 80, R1 = 30, R2 = 25, C1 = 10, C2 = 10, d1 = 0.5, d2 = 0.5; units are standardised to million USD. Prospect theory has three coefficients: loss aversion coefficient λ and risk attitude coefficients α and β. According to the experimental measurements of Tversky et al. [47], the risk attitude coefficient is α = β = 0.88, and the loss aversion coefficient λ = 2.25.
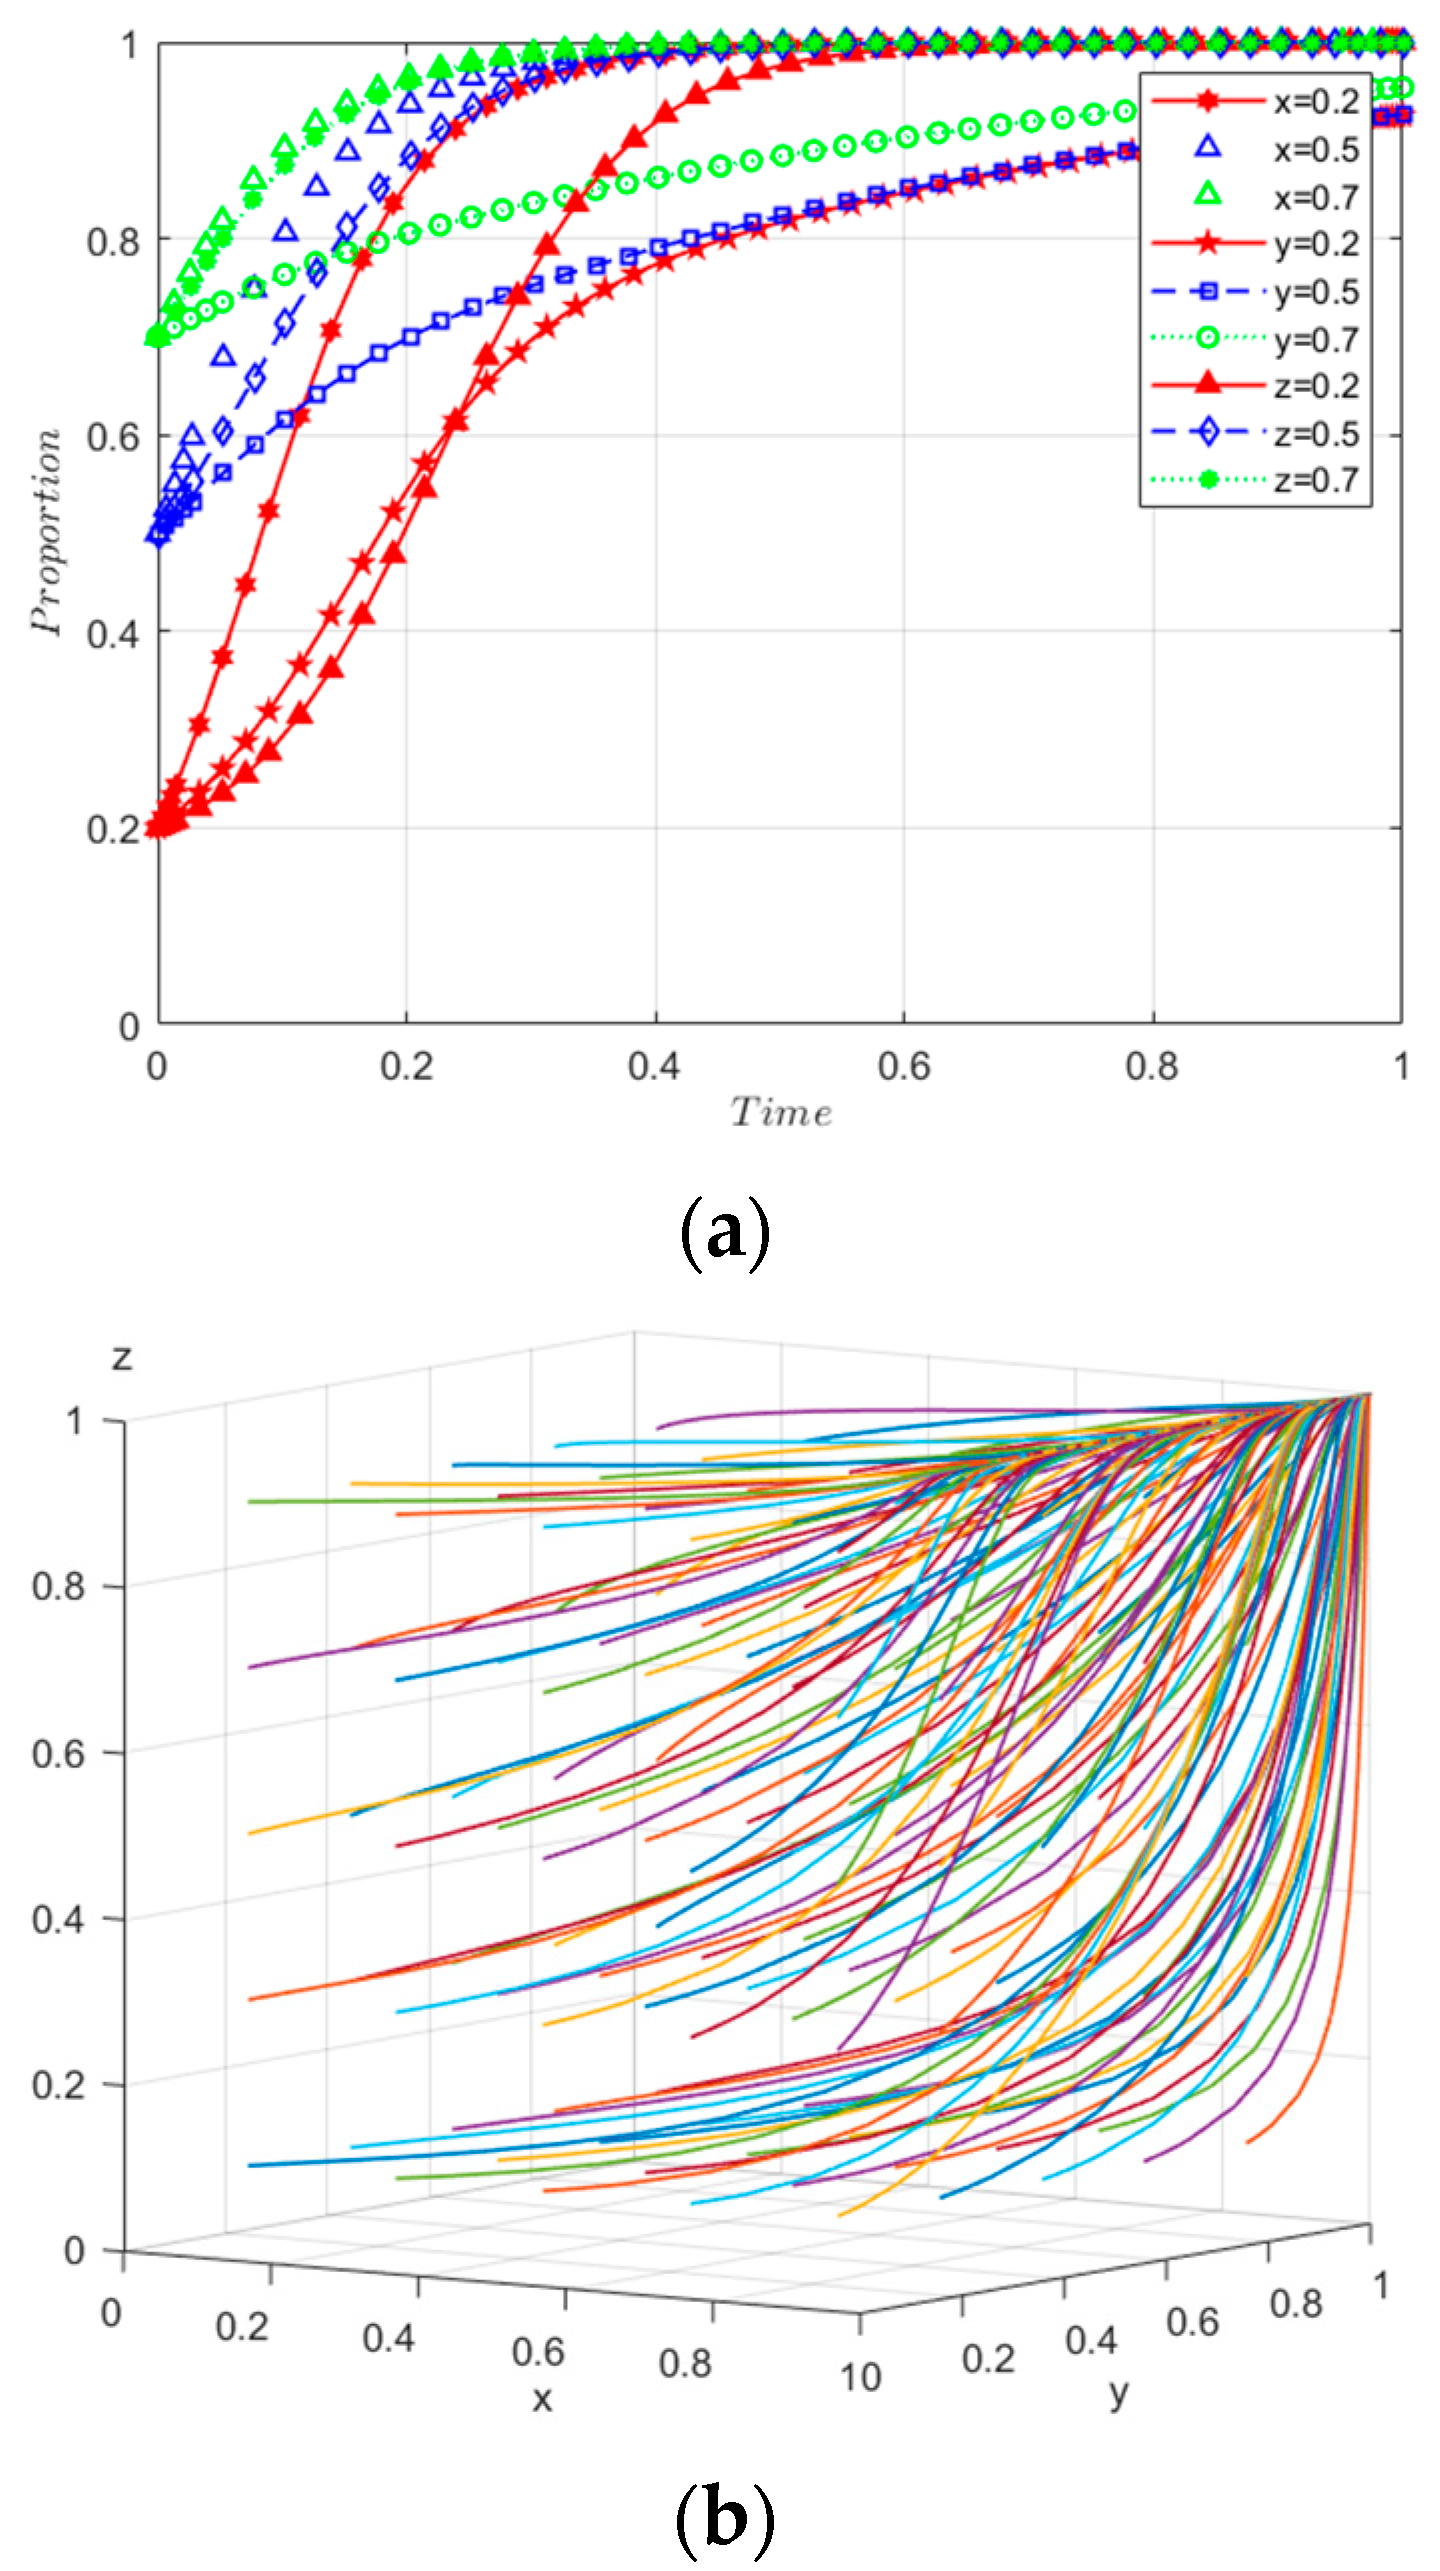
5.1. Initial Evolutionary Paths Analysis
Keeping other variables constant, the effect of varying the initial willingness of the three key participants—government, manufacturers, and recyclers—on the adoption of collaborative innovation strategies is explored through simulation. Represented by the variables x, y, and z, the strategies of the government, manufacturer, and recycler, respectively, start with an initial willingness of 0.2, 0.5, and 0.7. According to the results depicted in Figure 5, irrespective of the initial probabilities, the strategic choices of the three parties evolve to unanimously converge at (1,1,1). The evolutionary outcome of the initial path presented in this study diverges from prior research in the field of power battery recycling. In the work of Hu et al., the system initially evolves into a closed loop around a central point, displaying a cyclical behavioural pattern among the game’s main players [48]. In our analysis, factors such as policy incentives, subsidies, and synergies may be more compelling or attractive than in previous studies, prompting all stakeholders to prefer low-carbon innovation strategies from the beginning.
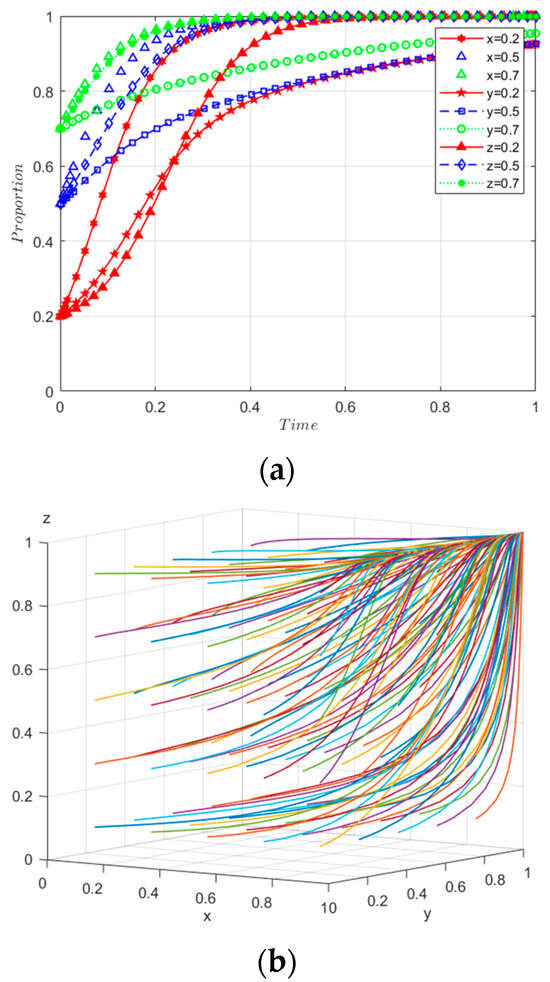
Figure 5.
Initial evolution paths. (a) Initial willingness simulation evolution diagram. (b) Result of array 1 evolving 50 times.
5.2. Sensitivity Analysis
5.2.1. Sensitivity Analysis of Government Incentives
Initially, the parameter GM is simulated with the assumption that all three parties have an initial willingness of 0.5. Simulations are conducted with GM values of 5, 10, and 15; the outcomes are depicted in Figure 6. As government incentives (GM) increase, their impact on governmental decision making appears minimal in the short term. However, at higher GM levels, there is a deceleration in government support for low-carbon innovation. For manufacturers, a rise in government incentives markedly enhances their motivation for low-carbon innovation. Recyclers’ strategic decisions show limited sensitivity to changes in GM. Governments with consistent revenue streams are more inclined to augment support for the power battery recycling sector. While manufacturers’ innovative efforts are hampered by technological, financial, and policy obstacles, existing government support, albeit not fully satisfying innovation needs, still fosters technological development among enterprises. Consequently, amplifying government intervention is imperative to bolster technological progress within the power battery recycling industry through the development of a robust institutional framework.
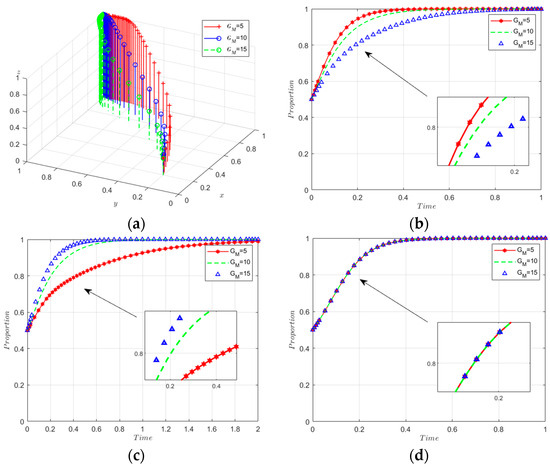
Figure 6.
Sensitivity analysis of GM. (a) Sensitivity analysis of 3D evolutionary maps. (b) The evolutionary path of x. (c) The evolutionary path of y. (d) The evolutionary path of z.
Then, the parameter GR is simulated. Assuming that the initial willingness of all three participants is set to 0.5, then let GR = 5, 10, 15 for the simulation analysis; the evolutionary results are shown in Figure 7. The sensitivity of GR to the government is similar to the sensitivity of GM to the government; within reason, changes in GR do not affect the government’s overall strategy, but as GR increases, the government evolves to 1 more slowly. But GR’s sensitivity to manufacturers and recyclers is the opposite of GM’s. For recyclers, increased government incentives significantly boost their willingness to engage in low-carbon innovation. Manufacturers’ strategy choices are less sensitive to GR values. Therefore, the government should support recyclers and promote technological innovation to improve battery recycling capacity. It is worth noting that the government should not unilaterally give preferences to one party. Instead, it should integrate the incentives of both manufacturers and recyclers, facilitating the choice of low-carbon innovation strategies by both.
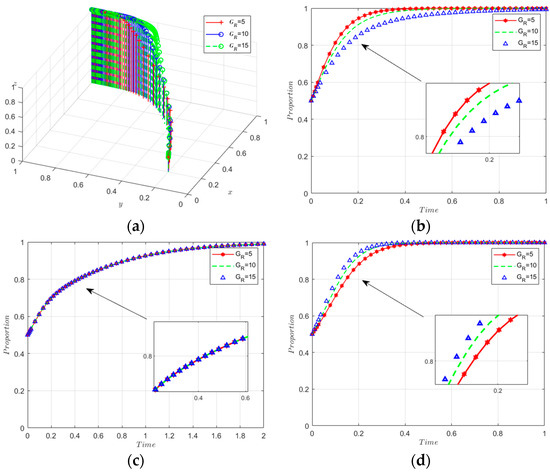
Figure 7.
Sensitivity analysis of GR. (a) Sensitivity analysis of 3D evolutionary m. (b) The evolutionary path of x. (c) The evolutionary path of y. (d) The evolutionary path of z.
In deepening the above analyses, it is necessary to compare and discuss our findings with similar results in the existing literature. According to existing studies, government incentives play an important role in driving industry participants to adopt environmental protection strategies, as shown by Wang [49] and Li [50]. However, our results shed further light on how the government can be more effective in promoting low-carbon innovation across the industry by balancing these incentives among different types of incentives.
5.2.2. Sensitivity Analysis of Government Penalties
This section examines the impact of government regulatory costs on the power battery recycling process. When the discrepancy between the costs of government regulation and its benefits is minimal, the government may opt to forgo its regulatory strategy. If regulatory costs constitute only a small fraction of government revenue and remain within a certain range, increasing regulatory costs will lead to a gradual shift towards stricter regulation. However, surpassing a certain cost threshold prompts governments to alter their strategies, as depicted in Figure 8. Inadequate regulation by local governments and the utilization of obsolete technologies by manufacturers and recyclers can lead to environmental pollution in production and operations. The mining and processing of raw materials for batteries may contaminate water sources, carbon emissions exceeding accepted standards can pollute the air, and improperly managed recycling of used batteries can degrade the soil. Such pollution not only poses a threat to public health but also impedes the sustainable growth of the electric vehicle industry. Consequently, the government is tasked with enhancing regulatory measures, encouraging technological advancements among companies, and collaboratively ensuring environmental protection.

Figure 8.
Sensitivity analysis of GK. (a) Sensitivity analysis of 3D evolutionary maps. (b) The evolutionary path of x. (c) The evolutionary path of y. (d) The evolutionary path of z.
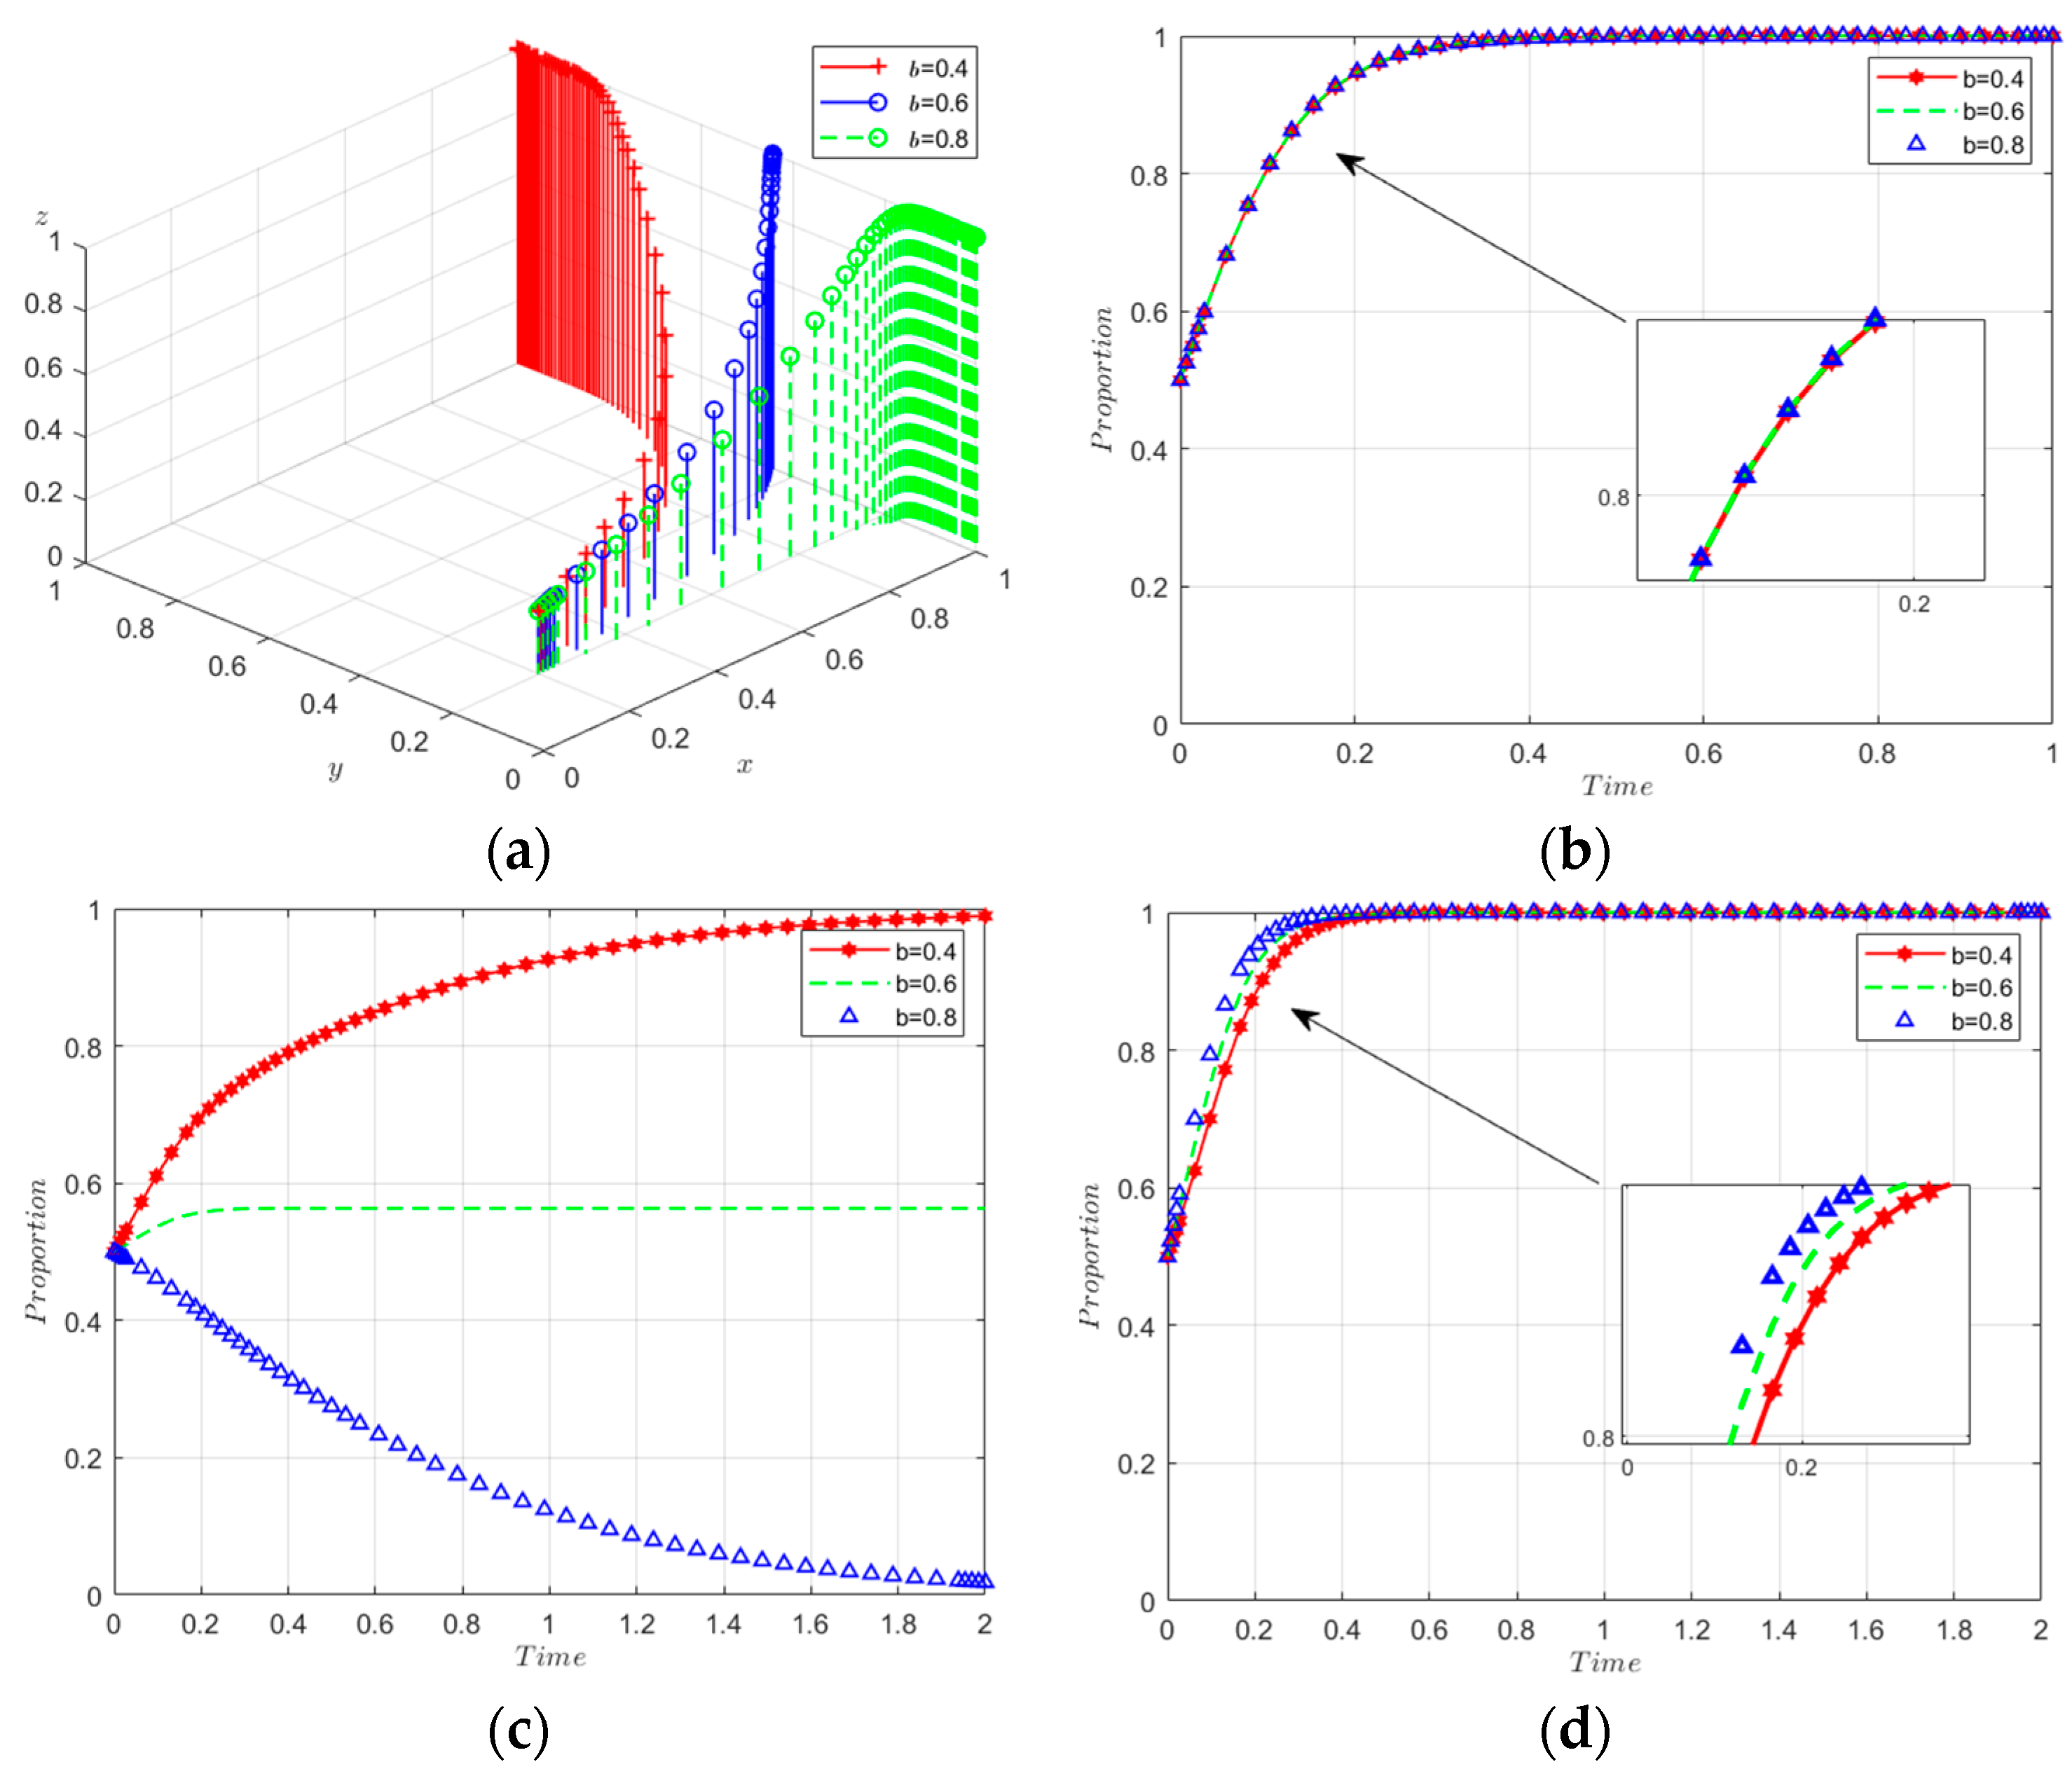
5.2.3. Sensitivity Analysis of Co-Benefit Sharing Coefficient and Cost-Sharing Coefficient
In power battery recycling, the allocation of benefits between manufacturers and recyclers significantly influences collaborative cooperation. Yet, disputes over benefit distribution commonly arise in practical cooperation scenarios. To address this challenge effectively, analysing the impact of variations in benefit and cost coefficients on system stability is critical. With benefit sharing coefficients set at 0.4, 0.6, and 0.8, and maintaining all other parameters as constant, as illustrated in Figure 9, an increase in the share of synergistic benefits notably enhances manufacturers’ willingness to participate in low-carbon innovation. Conversely, a larger benefit share for manufacturers results in diminished returns for recyclers, thereby potentially reducing their enthusiasm for low-carbon innovation activities and risking their withdrawal. Notably, government sensitivity to these adjustments is minimal.
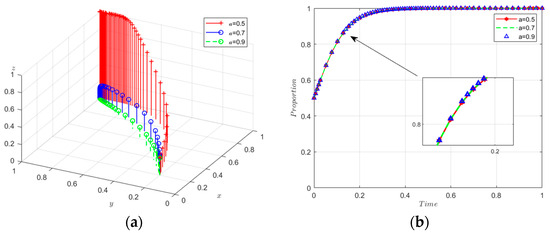
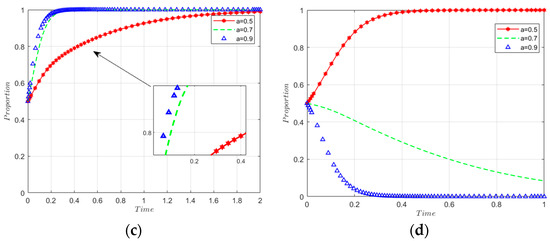
Figure 9.
Sensitivity analysis of a. (a) Sensitivity analysis of 3D evolutionary maps. (b) The evolutionary path of x. (c) The evolutionary path of y. (d) The evolutionary path of z.
When the cost-sharing coefficients are set at 0.4, 0.6, and 0.8, Figure 10 demonstrates that an increase in co-innovation costs results in a reduced willingness among manufacturers to engage in low-carbon innovations, with all other parameters held constant. Recyclers experience a similar impact. This reduction in willingness is attributable to higher co-innovation costs amplifying both manufacturers’ and recyclers’ resource and financial burdens, thereby diminishing their motivation to undertake low-carbon innovations that necessitate further investment and incur additional costs. Governments, in contrast, remain unaffected by this parameter.
Figure 10.
Sensitivity analysis of b. (a) Sensitivity analysis of 3D evolutionary maps. (b) The evolutionary path of x. (c) The evolutionary path of y. (d) The evolutionary path of z.
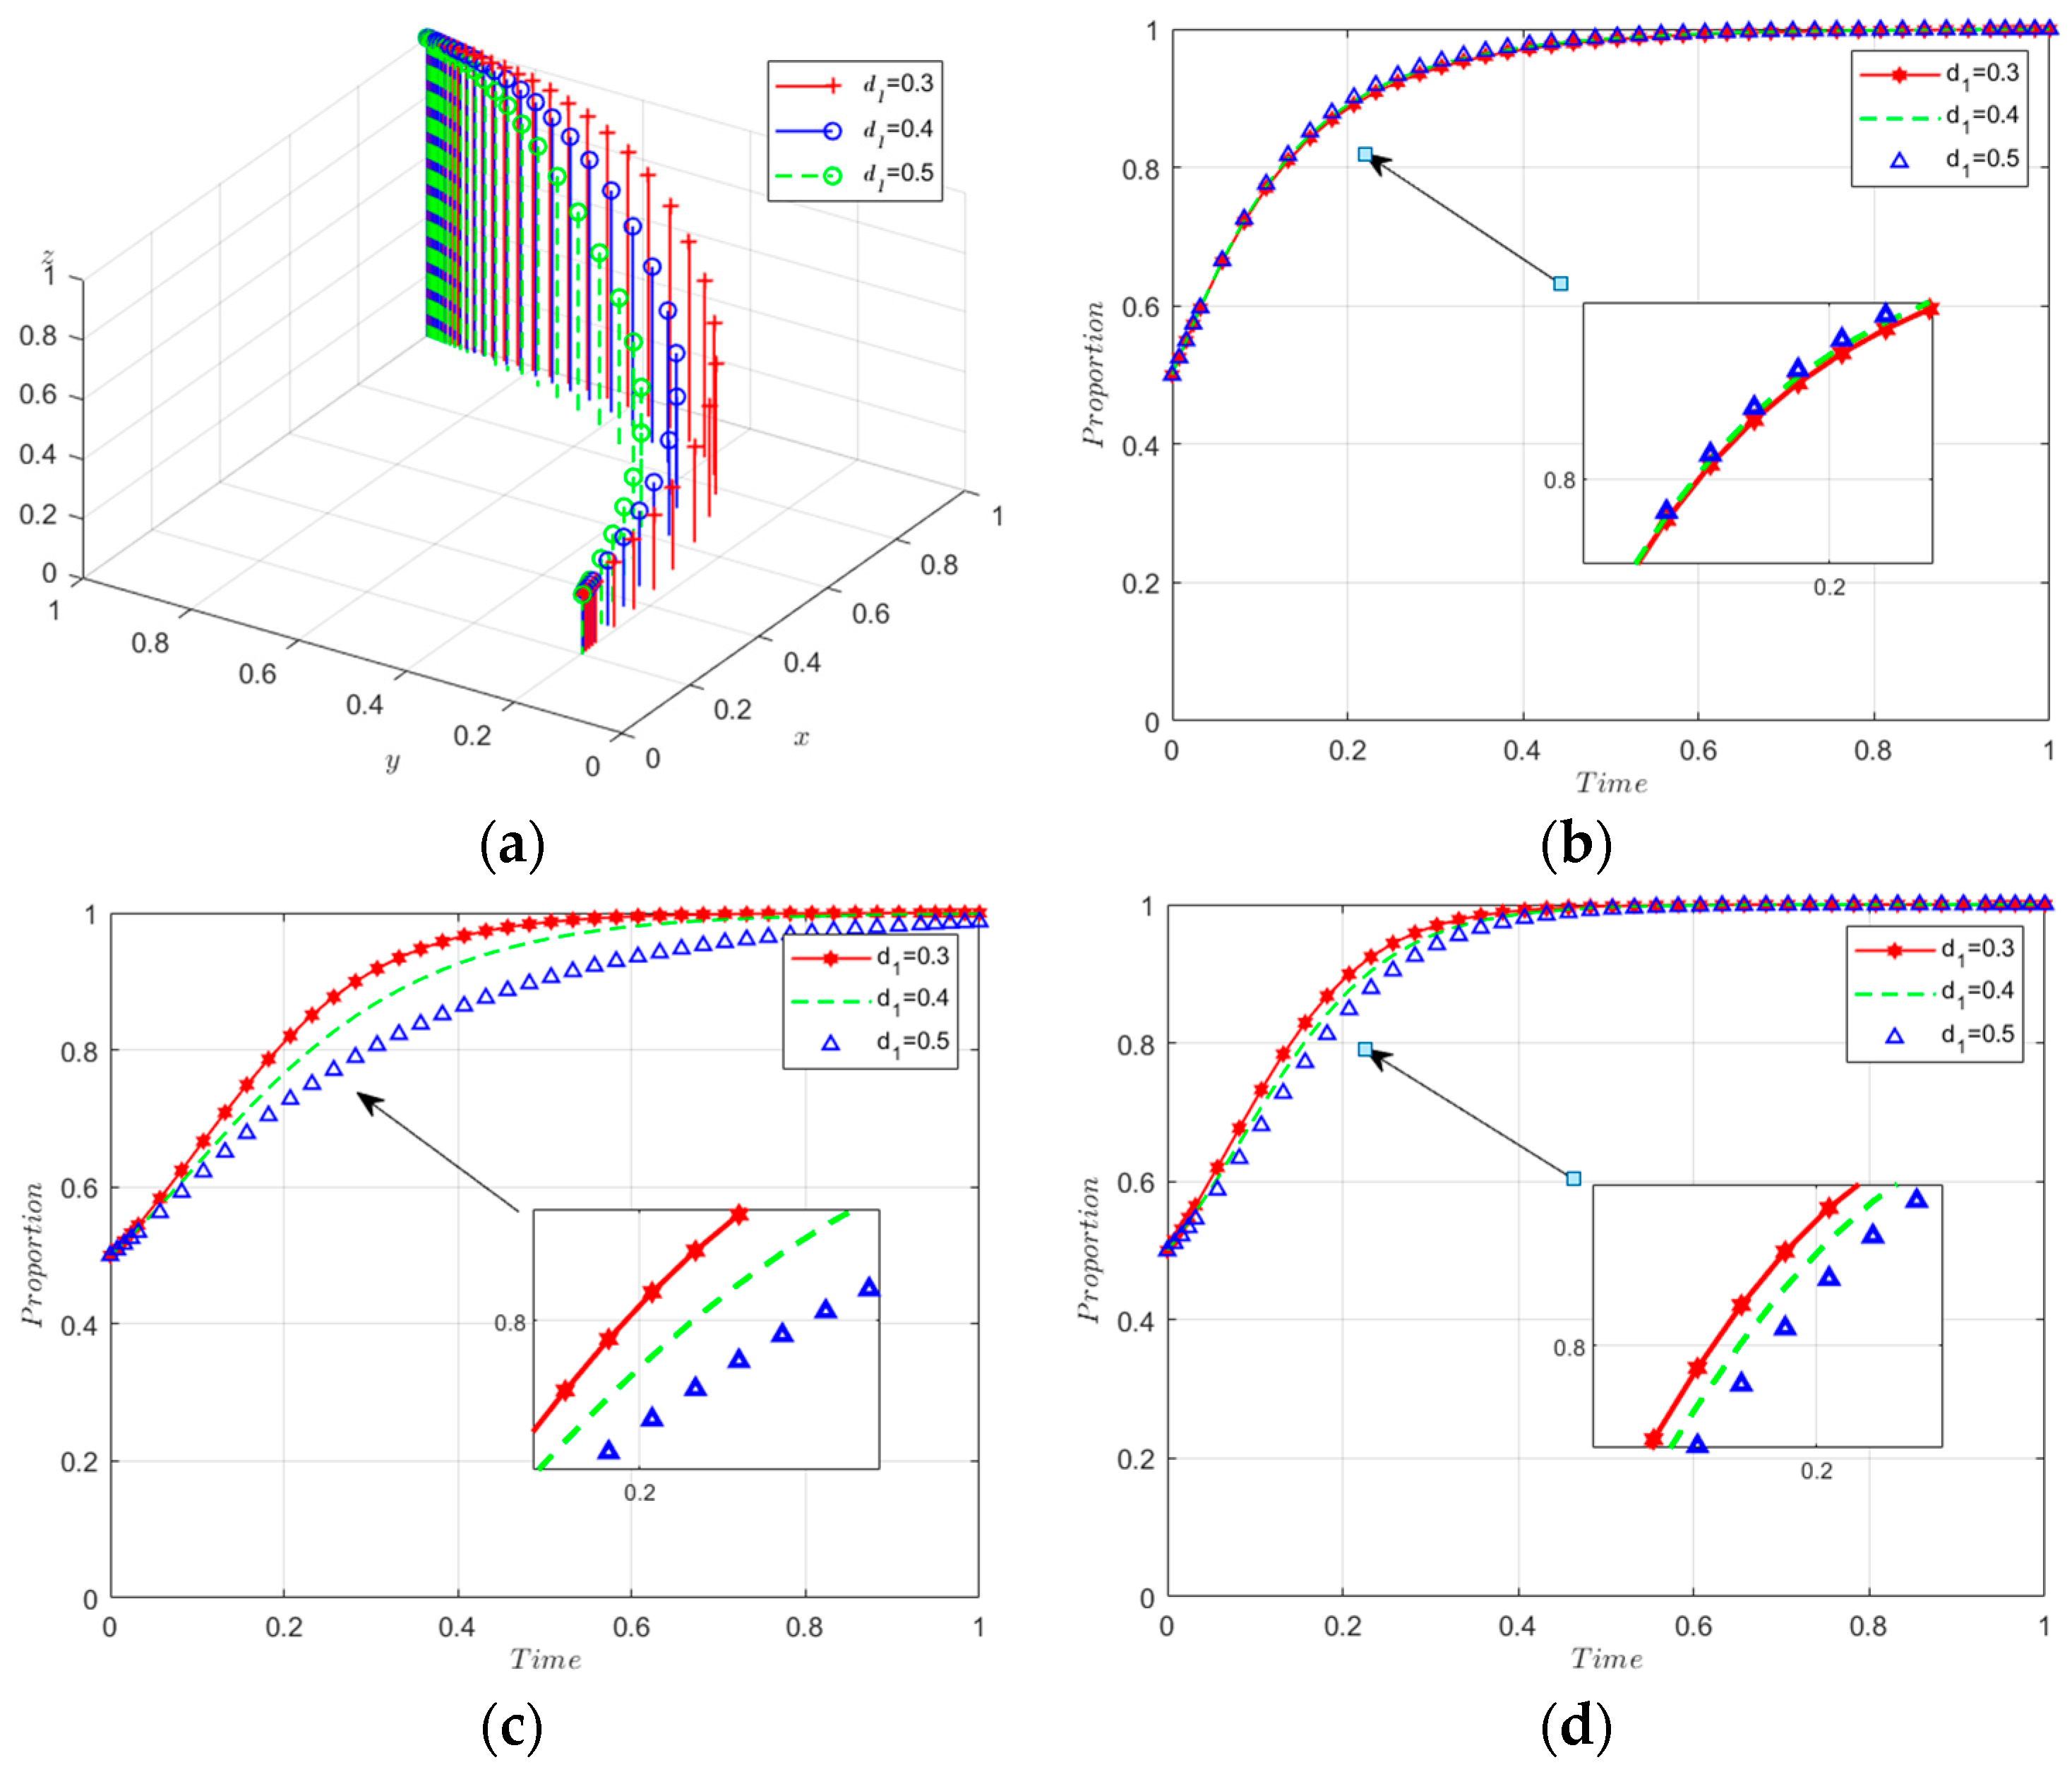
5.2.4. Sensitivity Analysis of Spillover Effects
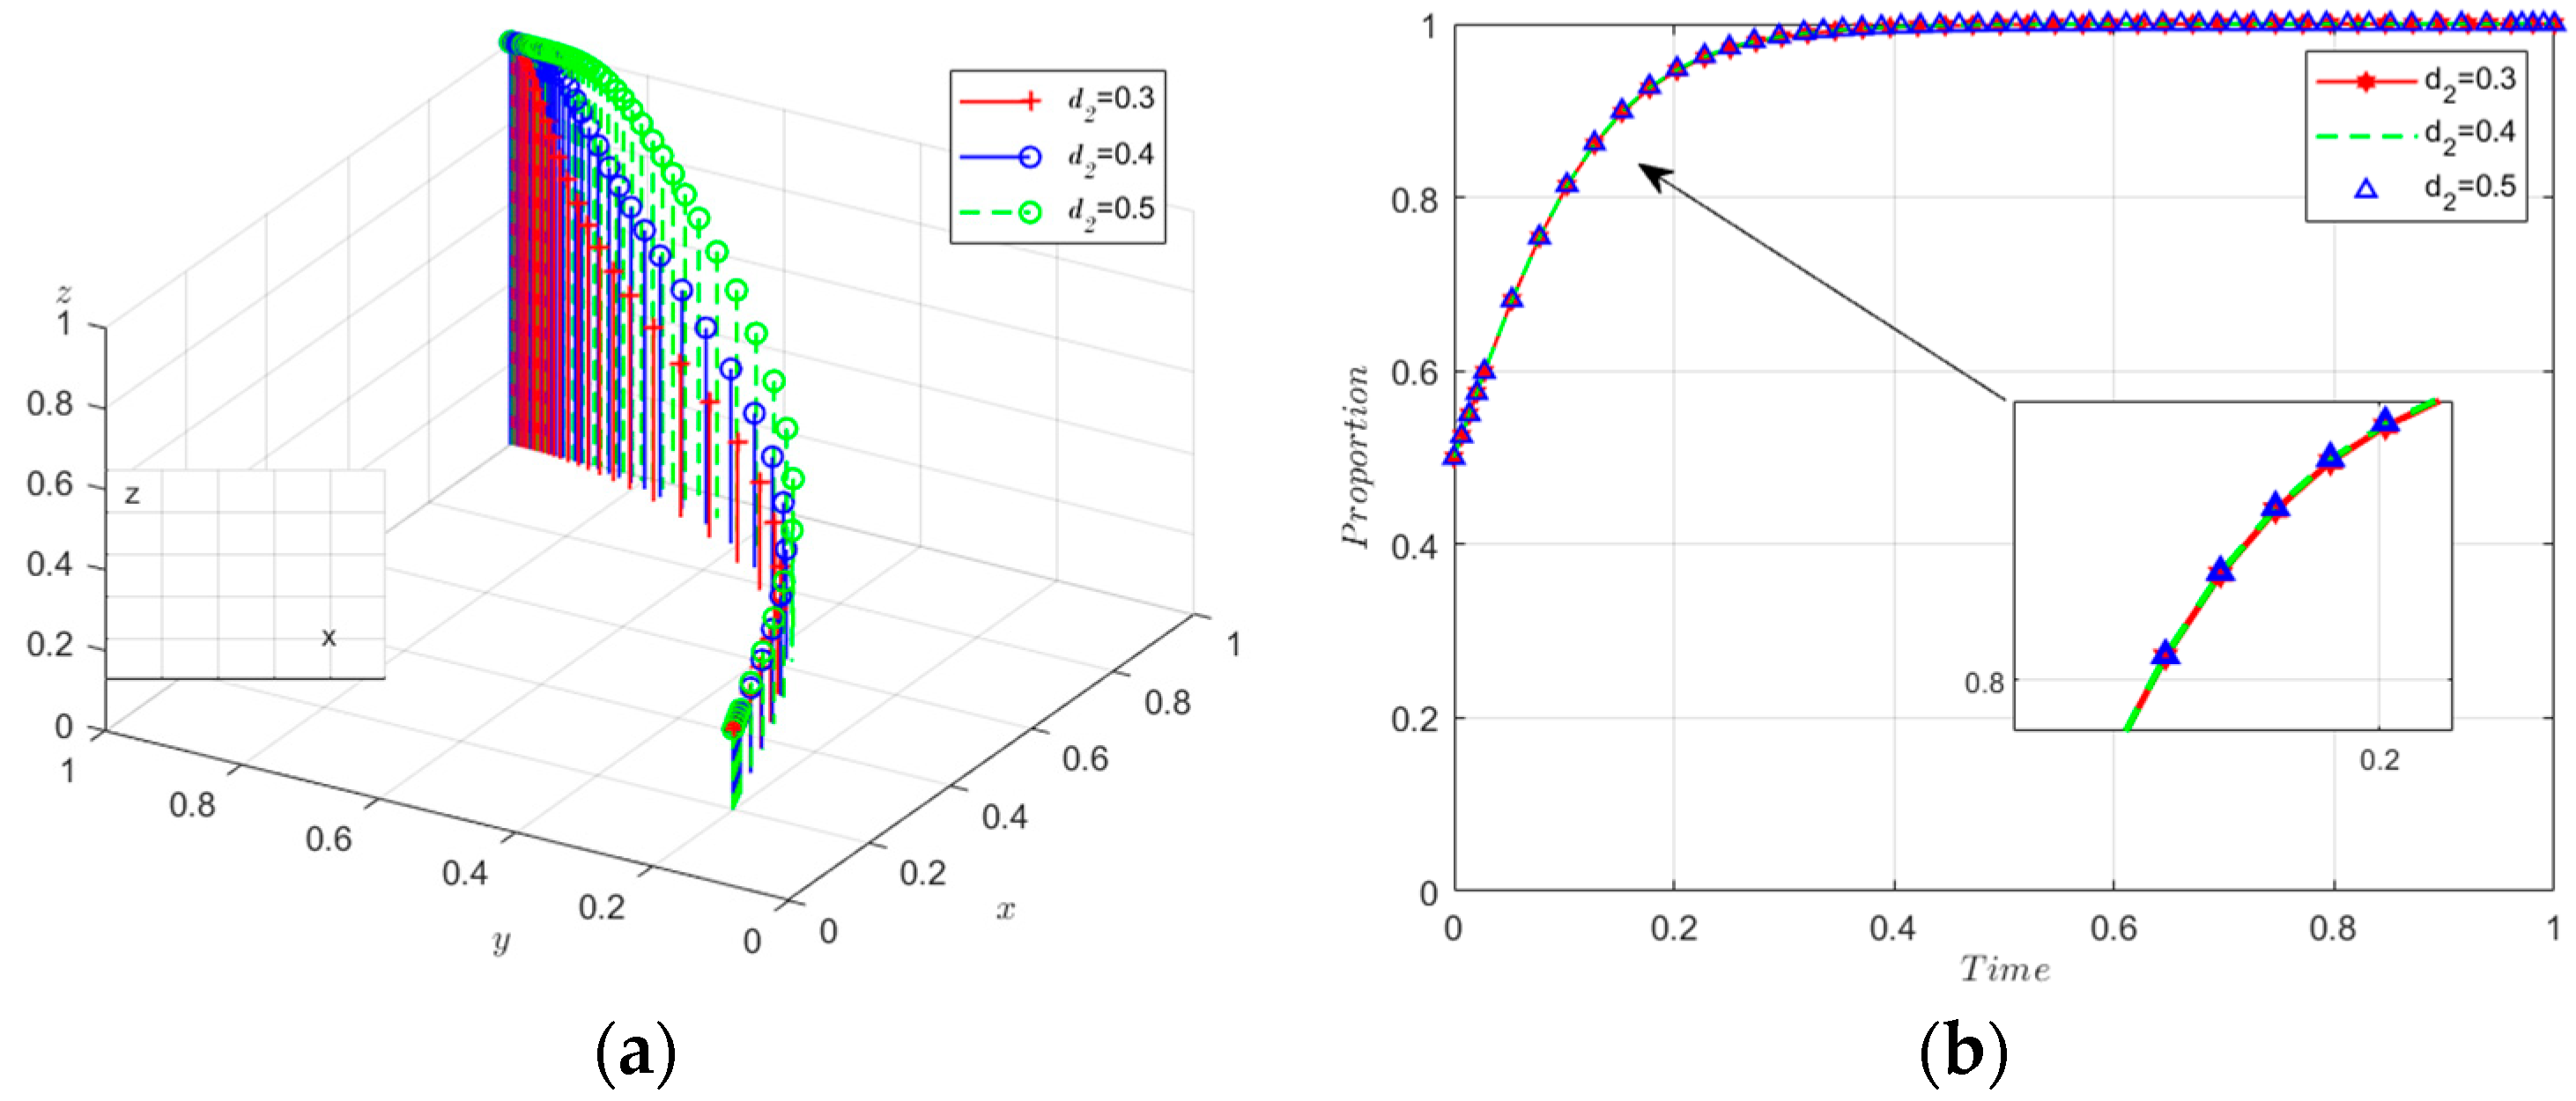
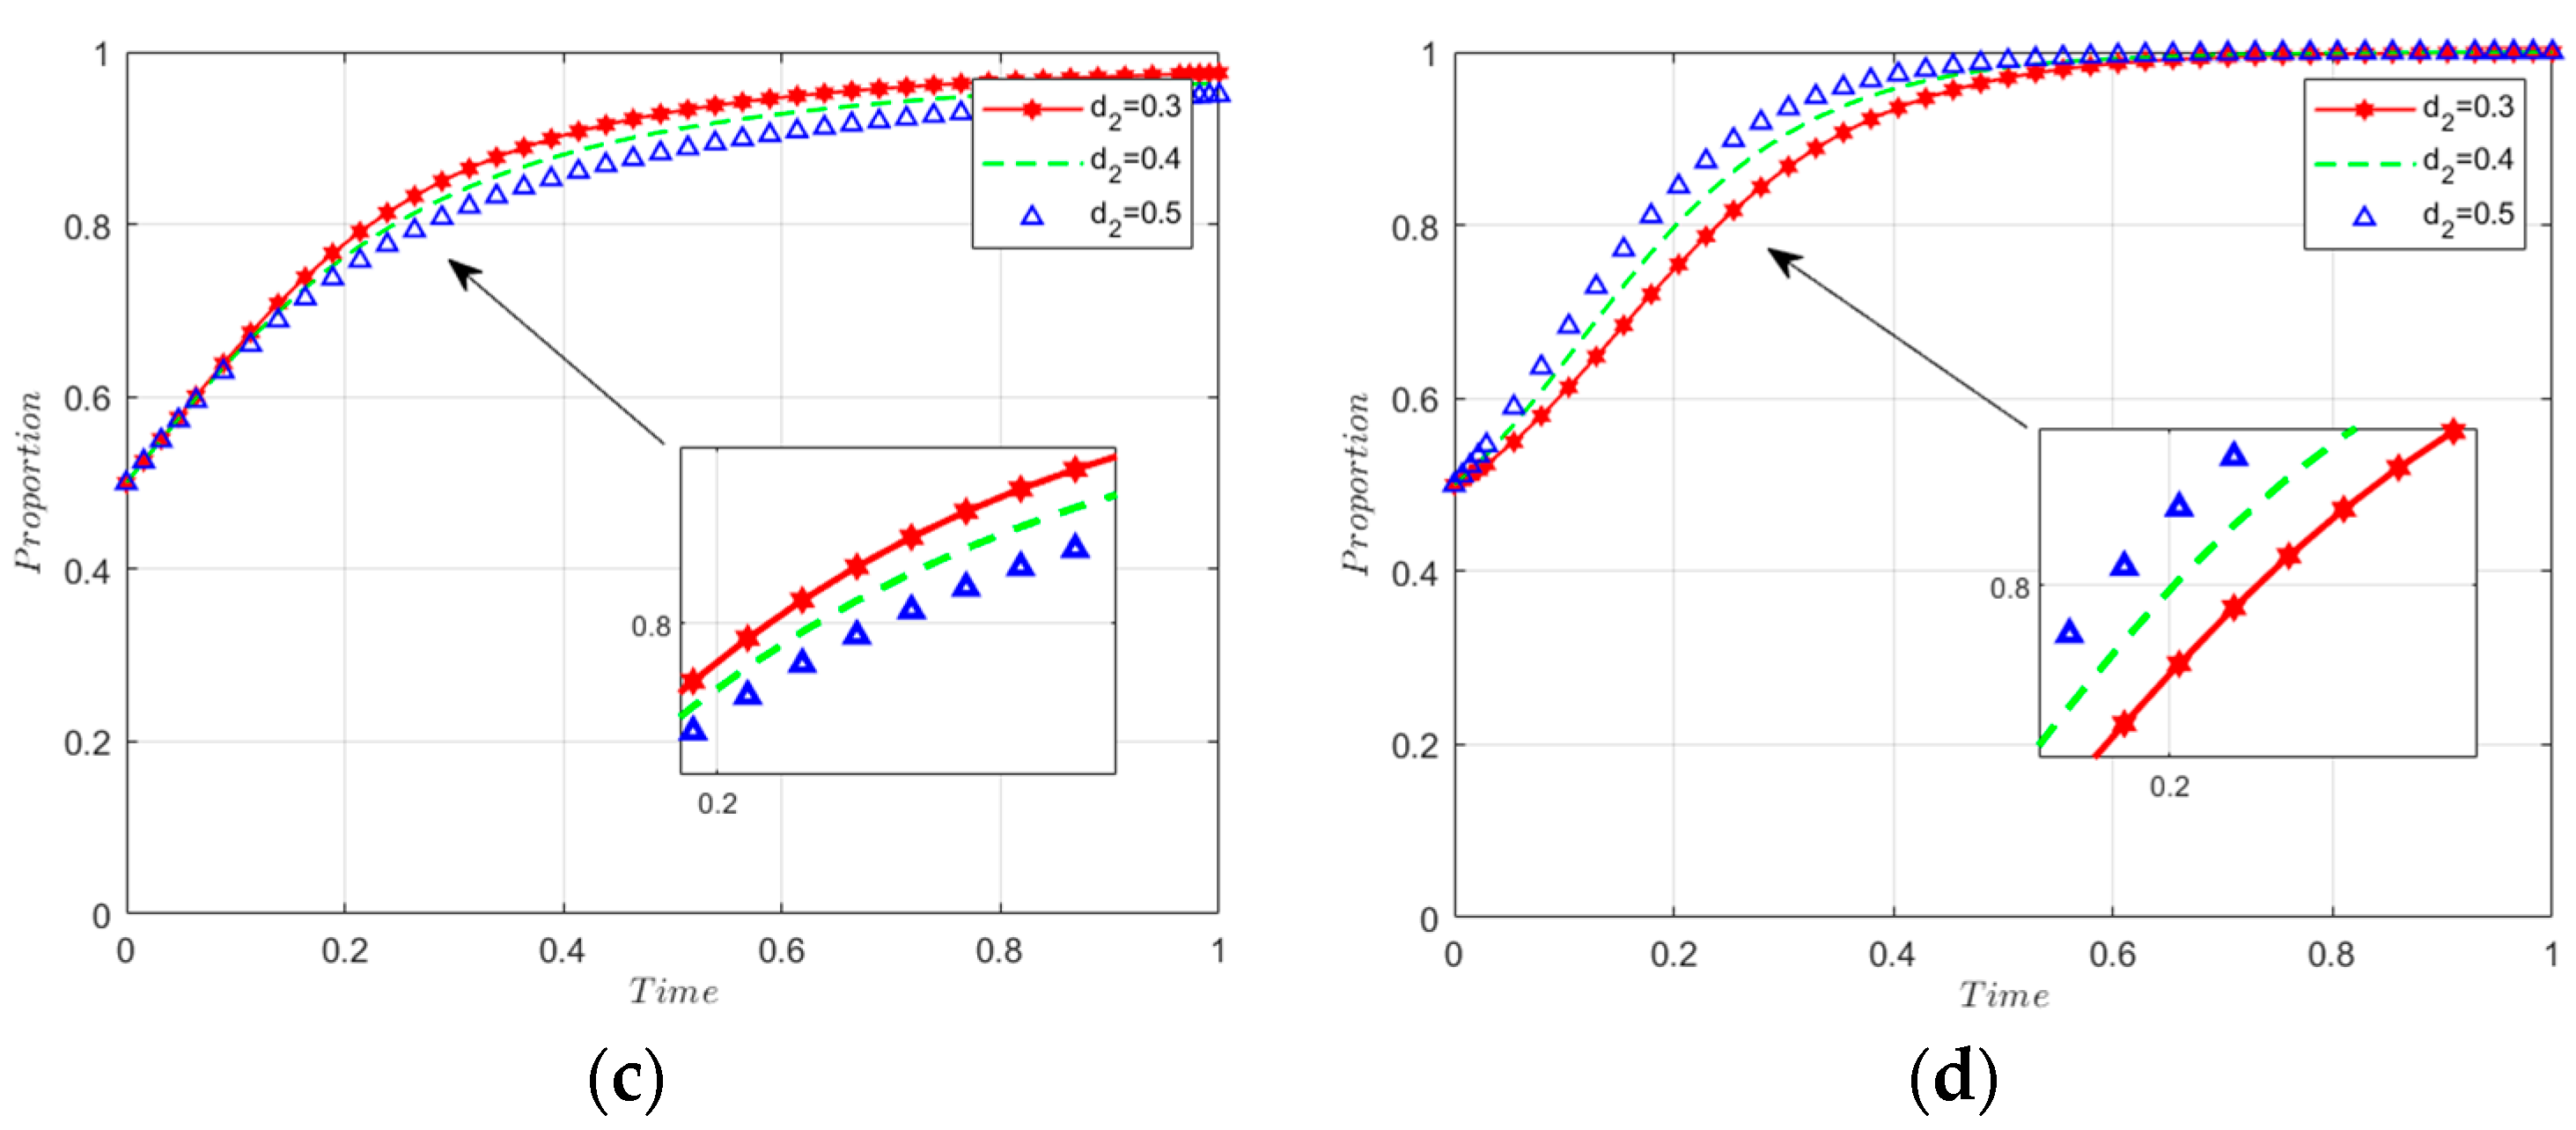
In the power battery recycling industry, technological innovation and spillovers between manufacturers and recyclers are particularly critical. The background of technological innovation and spillovers is due to the close technological and economic interactions between manufacturers and recyclers, where the product design and manufacturing process of manufacturers determine the ease and cost of battery recycling, while the innovative technologies of recyclers can improve the recycling efficiency and the material recovery rate, which in turn affects the efficiency and product design of manufacturers. When d1 increases, meaning that the technological spillovers received by the manufacturer from the recycler increase, the manufacturer may become reliant on the recycler’s investment in innovation. This reliance may lead the manufacturer to expect to receive more benefits through the recycler’s innovation, and as a result, the manufacturer may slow down its low-carbon innovation in the short term, as shown in Figure 11. Likewise, when d2 increases, meaning the technological spillovers that recyclers receive from manufacturers increase, recyclers decelerate their pace of low-carbon innovation, as shown in Figure 12.
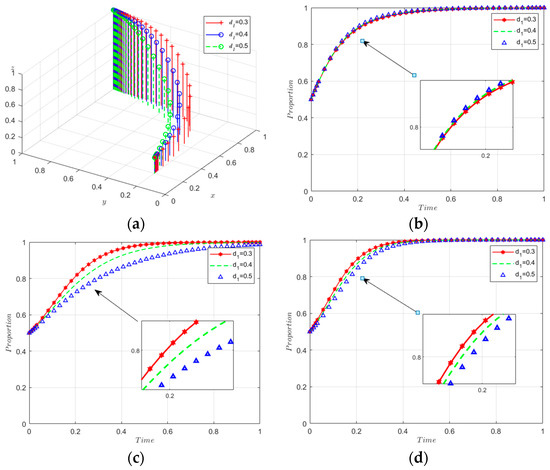
Figure 11.
Sensitivity analysis of d1. (a) Sensitivity analysis of 3D evolutionary maps. (b) The evolutionary path of x. (c) The evolutionary path of y. (d) The evolutionary path of z.
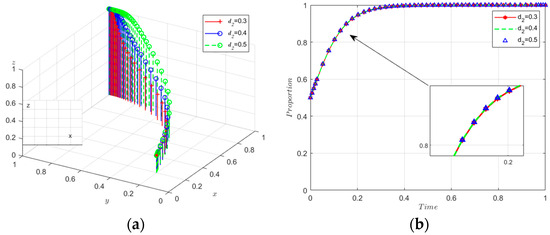

Figure 12.
Sensitivity analysis of d2. (a) Sensitivity analysis of 3D evolutionary maps. (b) The evolutionary path of x. (c) The evolutionary path of y. (d) The evolutionary path of z.
5.2.5. Sensitivity Analysis of Carbon Tax Rates
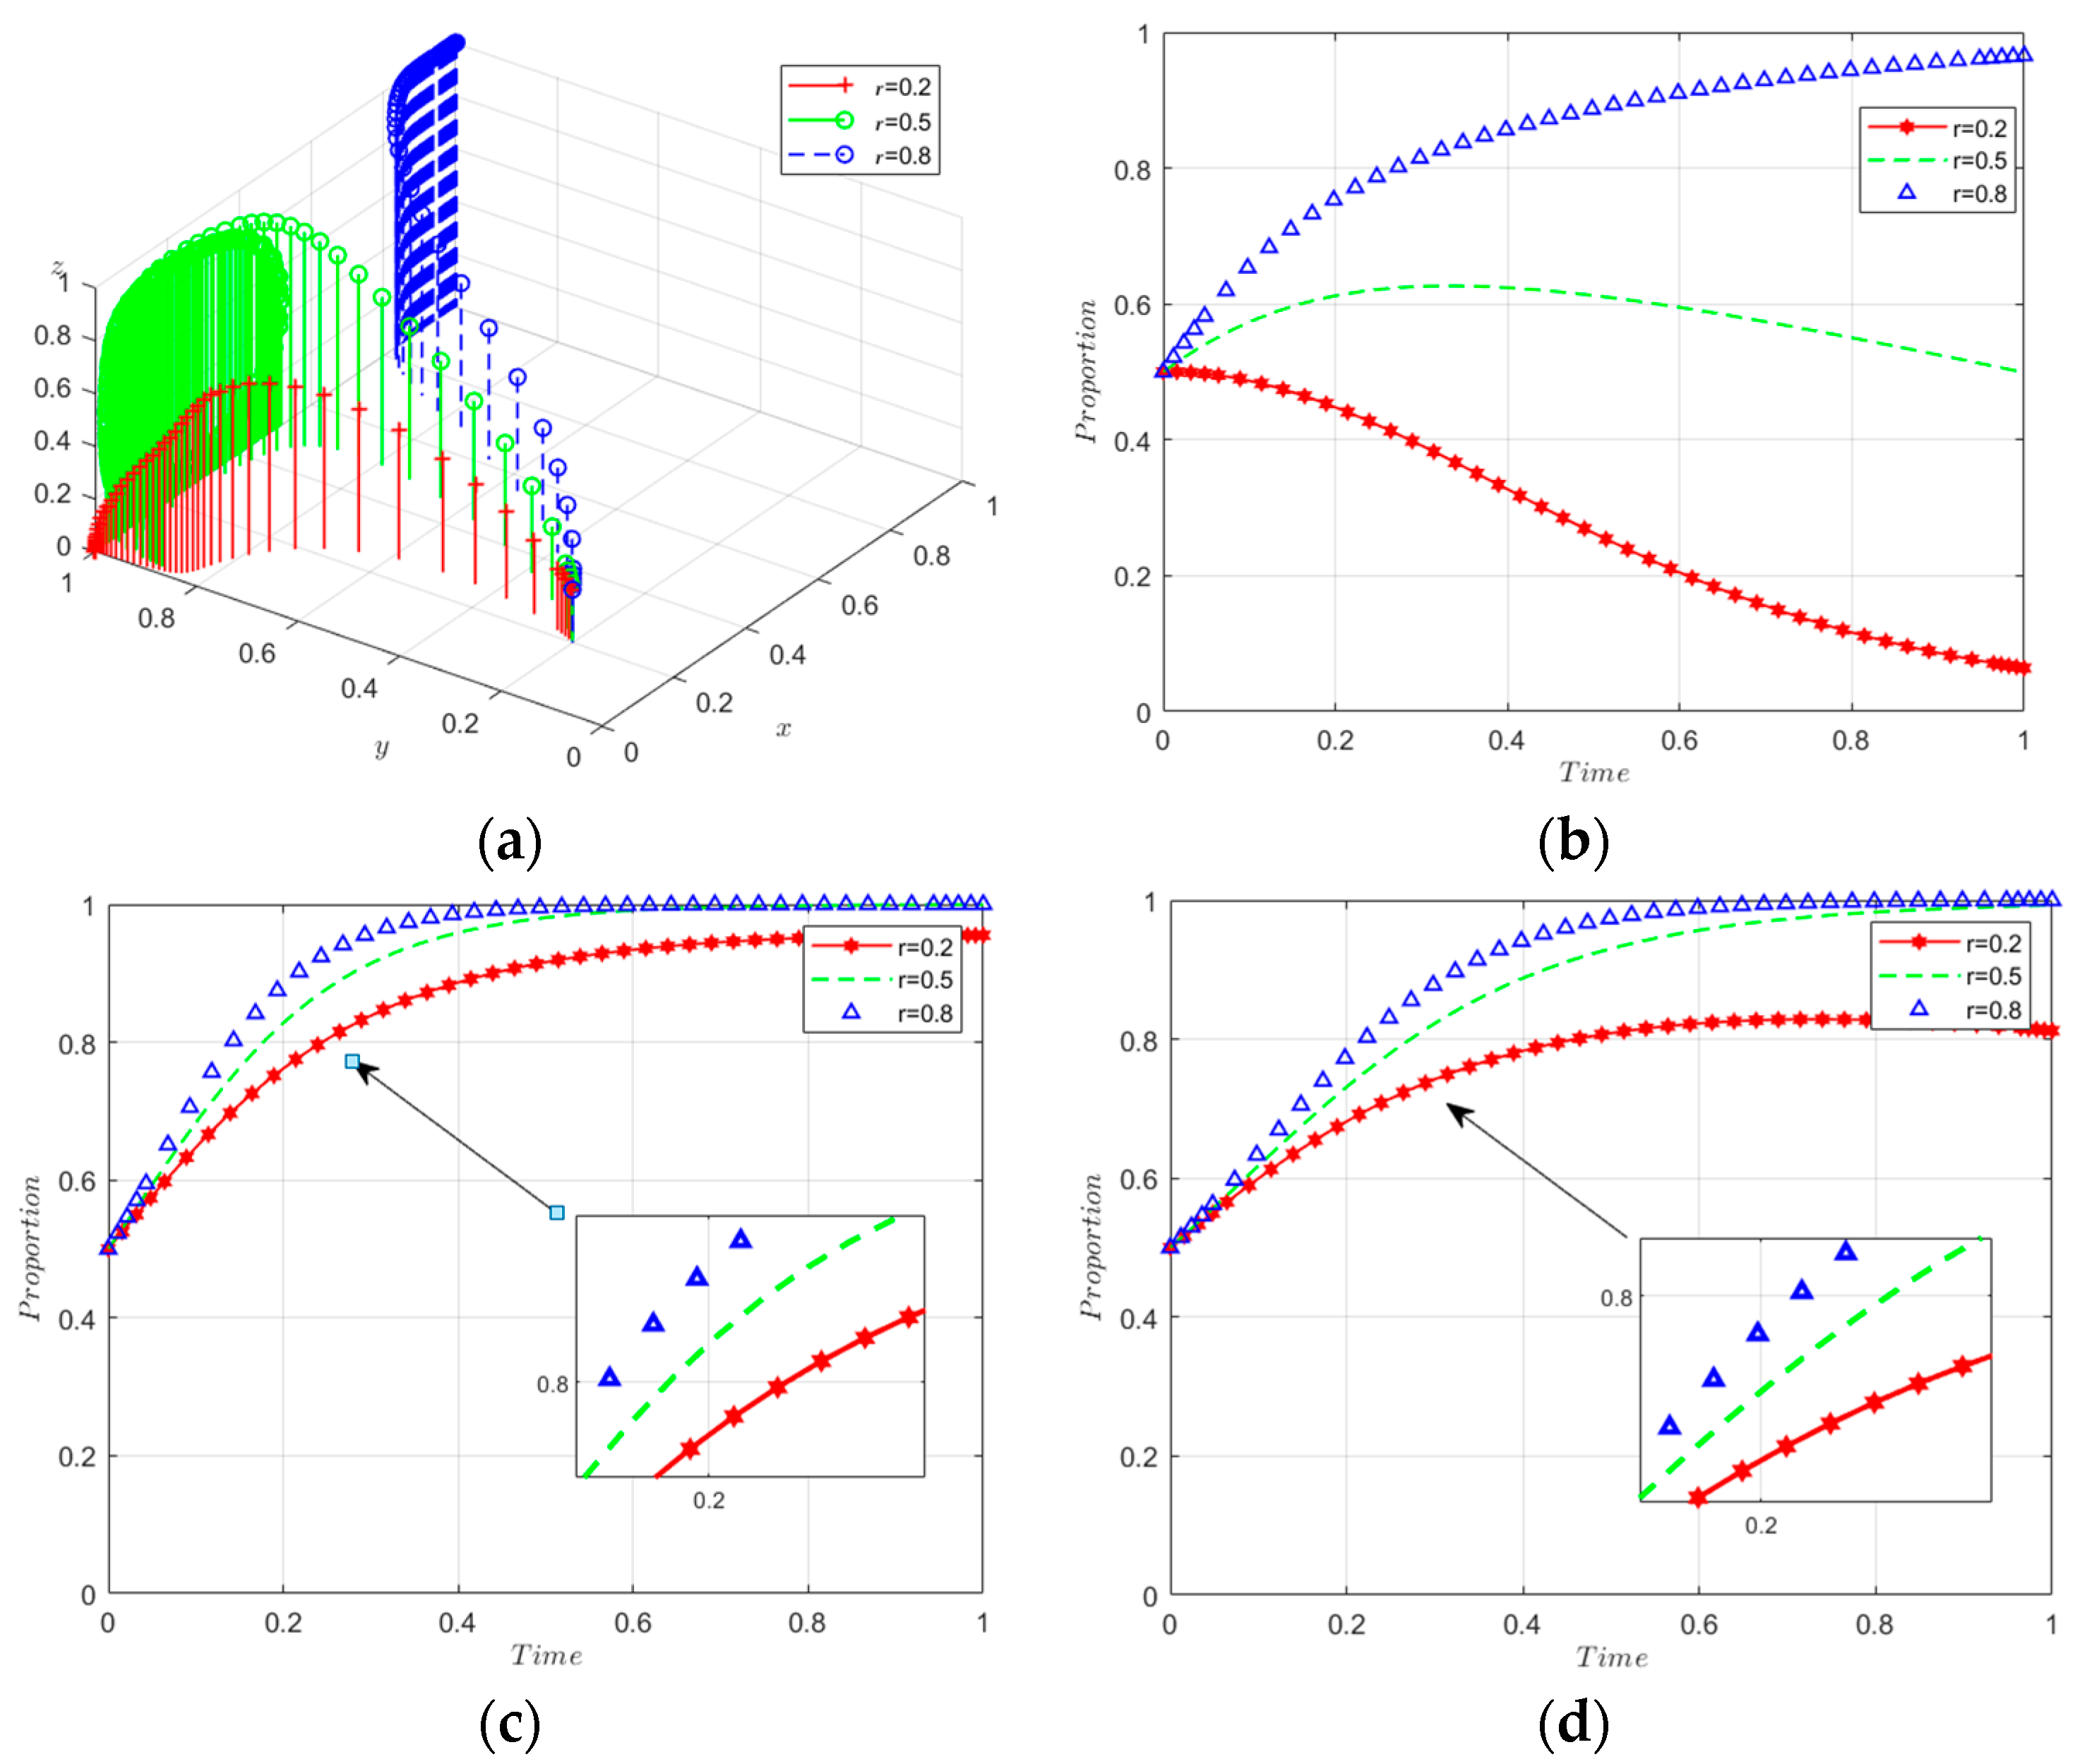
Figure 13 shows that as the carbon tax rate r increases, there is a gradual shift from strict government regulation to no regulation, while manufacturers and recyclers become more likely to engage in low-carbon innovation as r increases. The economic impact of a higher carbon tax rate makes it unnecessary for governments to enforce low-carbon innovation through strict regulations. However, manufacturers and recyclers are incentivised to engage in low-carbon innovation as the carbon tax increases; this conclusion is also well supported by the study of Zheng [51]. This makes reducing carbon emissions an effective way to lower the tax burden and improve competitiveness. Therefore, the introduction of a carbon tax can effectively guide enterprises towards low-carbon innovation and investment, ultimately reducing carbon emissions.
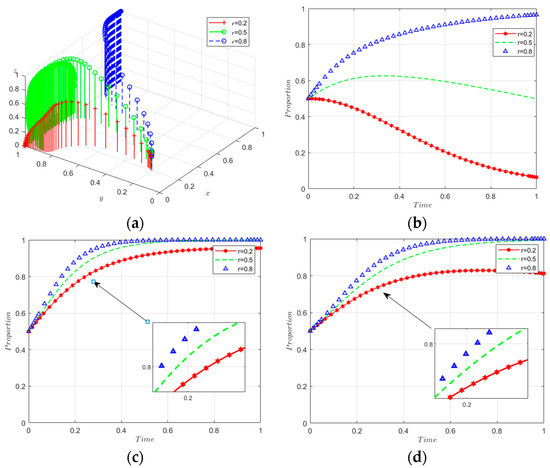
Figure 13.
Sensitivity analysis of r. (a) Sensitivity analysis of 3D evolutionary maps. (b) The evolutionary path of x. (c) The evolutionary path of y. (d) The evolutionary path of z.
6. Conclusions and Recommendations
6.1. Conclusions
Drawing on the principles of prospect theory and employing an evolutionary game theoretical framework, this research delves into the decision-making processes among government entities, manufacturers, and recyclers concerning low-carbon innovations within the realm of power battery recycling. Additionally, this study scrutinizes the stability of the system’s evolutionary strategy. Utilizing a stability analysis as a foundation, numerical simulations were carried out with MATLAB R2022a software to evaluate how different elements influence the decision-making paradigm. These elements include government incentives, the distribution of benefits and costs, technology spillover coefficients, and carbon tax rates. The principal findings of this study are outlined below:
- (1)
- The analysis reveals that the shared goal of maximizing benefits under bounded rationality guides all stakeholders—governments, producers, and recyclers—toward a unified low-carbon innovation strategy. This approach aligns with environmental goals and confers competitive advantages by enhancing efficiency and adhering to escalating environmental standards, thereby fostering a collective incentive for sustainable development.
- (2)
- Government incentives, though not the primary driver, significantly influence the engagement of manufacturers and recyclers in low-carbon initiatives. An increase in subsidies boosts their willingness to innovate sustainably, whereas rising regulatory costs tend to deter strict enforcement by the government.
- (3)
- Adjustments in benefit and cost-sharing coefficients significantly influence the innovation willingness of manufacturers and recyclers. A higher benefit share for manufacturers boosts their innovation drive, whereas greater cost responsibility reduces it, affecting recyclers inversely. These coefficients minimally impact government decision making.
- (4)
- Technology spillovers, while not drastically changing decision-making dynamics, show discernible effects; enhanced spillovers result in a transient reduction in stakeholders’ low-carbon innovation activities.
- (5)
- A higher carbon tax rate propels manufacturers and recyclers towards more active low-carbon innovation participation by enhancing the cost-effectiveness of reducing emissions, potentially leading to decreased government regulatory measures as the tax itself incentivizes eco-friendly practices.
6.2. Recommendations
In essence, environmental policy strives to harmonize economic growth, social well-being, and environmental protection. However, current policies on power battery recycling fall short of achieving this balance, highlighting areas for improvement. The complexity and uncertainties within the battery recycling sector require continuous efforts and research to refine policies. This situation emphasizes the need for actionable recommendations for both government and corporate stakeholders in crafting and executing policies that promote sustainable development of the industry. Such policies should ensure environmental preservation and efficient resource utilization. The following are the conclusions:
- (1)
- In the pursuit of low-carbon innovations within the power battery recycling sector, adopting a refined approach to policy enhancement and economic incentives is crucial. This involves creating performance-oriented government incentives and regulatory frameworks designed to motivate compliance and drive innovation among all stakeholders, while avoiding excessive financial strains. Additionally, the adoption of flexible carbon tax schemes, which can be adjusted based on technological progress and economic shifts, is vital. Such schemes are intended to encourage eco-friendly practices and ensure the sector’s competitive edge and sustainability. Furthermore, establishing collaborations across various sectors is essential for resource sharing, knowledge exchange, and strategy synchronization on low-carbon innovation. Encouraging cooperative synergies between governments, industry, academia, and NGOs paves the way for a sustainable, efficient, and competitive recycling industry, in harmony with overarching goals of environmental conservation and sustainable development.
- (2)
- Within the scholarly discussion on sustainable practices in power battery recycling, the focus on technological innovation and collaboration stands out as a key theme. Promoting focused research and development investments in areas with potential for technological spillovers is crucial, highlighting the importance of creating an ecosystem that nurtures innovation and leverages the secondary benefits of these advancements. Moreover, the creation of platforms for collaborative innovation is recommended to enable the fluid exchange of breakthroughs, research outcomes, and best practices among a wide range of stakeholders. These platforms aim not only to accelerate the adoption of innovative, sustainable technologies but also to establish channels for knowledge sharing that extend beyond conventional industry limits. This strategy advocates for a unified effort to adopt sustainable technologies, utilizing the collective synergy of shared objectives and expertise to propel the industry toward enhanced environmental responsibility and innovation efficacy.
- (3)
- In the academic analysis of low-carbon initiatives within the power battery recycling industry, the strategic handling of benefits and costs is identified as a crucial factor. Developing innovative mechanisms for sharing benefits is essential, aiming to guarantee a fair distribution of advantages among all stakeholders, thus enhancing their long-term commitment to low-carbon innovation. Furthermore, crafting detailed strategies for cost management and sharing is vital, possibly through creating cooperative platforms or forming joint ventures. These methods seek to mitigate the financial hurdles linked to innovation, promoting a more inclusive setting for stakeholders to participate in and contribute to the low-carbon economy. This viewpoint supports a balanced approach to managing financial risks and rewards, underlining the significance of strategic financial planning and collaboration to address the fiscal obstacles encountered in shifting toward more sustainable industrial practices.
6.3. Limitations
This study investigates low-carbon innovations in power battery recycling through the lenses of evolutionary game theory and prospect theory, while recognizing certain limitations, including the dependence on theoretical assumptions, absence of empirical validation, and limited generalizability. Future research avenues involve broadening the model’s parameters to better capture the wider economic and technological landscape, empirically substantiating theoretical predictions, extending comparisons across various industries and on an international scale to bolster generalizability, monitoring changes over time via longitudinal analyses, and evaluating the effects of specific policies. These endeavours seek to improve sustainability practices within the power battery recycling domain and beyond by enriching our understanding.
Author Contributions
Conceptualization, Y.L. and J.Z.; methodology, Y.L.; software, J.Z.; validation, Y.L. and J.Z.; formal analysis, Y.L.; investigation, J.Z.; resources, J.Z.; data curation, Y.L.; writing—original draft preparation, Y.L. and J.Z.; writing—review and editing, Y.L. and J.Z.; visualization, Y.L.; supervision, Y.L.; project administration, Y.L.; funding acquisition, Y.L. All authors have read and agreed to the published version of the manuscript.
Funding
This research was funded by National Natural Science Foundation of China (51604216), The Ministry of Education of Humanities and Social Science project (23XJC630011 and 21YJA630050), and Xi’an Social Science Planning Fund Project (22GL38).
Institutional Review Board Statement
Not applicable.
Informed Consent Statement
Not applicable.
Data Availability Statement
The data presented in this study are available on request from the corresponding author.
Conflicts of Interest
The authors declare no conflicts of interest.
References
- Sporkmann, J.; Liu, Y.; Spinler, S. Carbon emissions from European land transportation: A comprehensive analysis. Transp. Res. Part D Transp. Environ. 2023, 121, 103851. [Google Scholar] [CrossRef]
- Li, S.J.; Liu, J.G.; Wu, J.J.; Hu, X.Y. Spatial spillover effect of carbon emission trading policy on carbon emission reduction: Empirical data from transport industry in China*. J. Clean. Prod. 2022, 371, 123906. [Google Scholar] [CrossRef]
- Zhao, C.; Wang, K.; Dong, X.; Dong, K. Is smart transportation associated with reduced carbon emissions? The case of China. Energy Econ. 2022, 105, 105715. [Google Scholar] [CrossRef]
- Carbon Dioxide Emissions in China 1960–2022. Available online: https://www.statista.com/statistics/239093/co2-emissions-in-china/#statisticContainer (accessed on 16 March 2024).
- Zhu, C.; Wang, M.; Yang, Y. Analysis of the Influencing Factors of Regional Carbon Emissions in the Chinese Transportation Industry. Energies 2020, 13, 1100. [Google Scholar] [CrossRef]
- Hussain, Z.; Khan, M.K.; Xia, Z.Q. Investigating the role of green transport, environmental taxes and expenditures in mitigating the transport CO2 emissions. Transp. Lett. Int. J. Transp. Res. 2023, 15, 439–449. [Google Scholar] [CrossRef]
- Huo, H.; Wang, M.; Johnson, L. Projection of Chinese motor vehicle growth, oil demand, and CO2 emissions through 2050. Transp. Res. Rec. 2007, 2038, 69–77. [Google Scholar] [CrossRef]
- Zou, R.; Liu, Q. Current situation and Countermeasures of power battery recycling industry in China. Conf. Ser. Earth Environ. Sci. 2021, 702, 012013. [Google Scholar] [CrossRef]
- He, H.; Hu, S.; Wang, P. A Prediction Model for Recycling Amount of Recycled Metal from Waste Power Battery. J. Phys. 2023, 2463, 012056. [Google Scholar] [CrossRef]
- Wang, D. Research on policies of power batteries recycle in China from the perspective of life cycle. J. Environ. Eng. Landsc. Manag. 2021, 29, 135–149. [Google Scholar] [CrossRef]
- Hu, L.; Wei, X.; Ma, J. Research on Power Battery recovery Mode of New Energy Electric vehicles in China under Circular economy. Conf. Ser. Earth Environ. Sci. 2021, 651, 042029. [Google Scholar] [CrossRef]
- Sun, Y. Lithium-Ion Battery Recycling: Challenges and Opportunities. Highlights Sci. Eng. Technol. 2023, 58, 365–370. [Google Scholar] [CrossRef]
- Zorin, A.; Song, T.; Gastol, D. Acid-Assisted Separation of Cathodic Material from Spent Electric Vehicle Batteries for Recycling. Metals 2023, 13, 1276. [Google Scholar] [CrossRef]
- Cattaneo, P.; Callegari, D.; Merli, D. Sorting, Characterization, Environmentally Friendly Recycling, and Reuse of Components from End-of-Life 18650 Li Ion Batteries. Adv. Sustain. Syst. 2023, 7, 2300161. [Google Scholar] [CrossRef]
- Wang, M.; Liu, K.; Yu, J. Challenges in Recycling Spent Lithium-Ion Batteries: Spotlight on Polyvinylidene Fluoride Removal. Glob. Chall. 2023, 7, 2200237. [Google Scholar] [CrossRef] [PubMed]
- Zheng, S.; Wang, X.; Gu, Z. Advances and challenges on recycling the electrode and electrolyte materials in spent lithium-ion batteries. Mater. Lab. 2022, 1, 220036-1–220036-17. [Google Scholar]
- Li, Y.; Guo, R.; Zhang, Y. Study on Reuse of Power Lithium Ion Battery Recycling. Adv. Mater. Res. 2014, 937, 515-519. [Google Scholar] [CrossRef]
- Ganter, M.; Landi, B.; Babbitt, C. Cathode refunctionalization as a lithium ion battery recycling alternative. J. Power Sources 2014, 256, 274–280. [Google Scholar] [CrossRef]
- Liu, J.; Ye, J.; Yang, C. Power Battery Recycling Mode and Decision-making Model for New Energy Vehicles Under the Background of Dual Carbon. Strateg. Plan. Energy Environ. 2022, 41, 457–476. [Google Scholar] [CrossRef]
- Li, X.; Du, J.; Liu, P. Optimal choice of power battery joint recycling strategy for electric vehicle manufacturers under a deposit-refund system. Int. J. Prod. Res. 2023, 61, 7281–7301. [Google Scholar] [CrossRef]
- Zan, X.; Zhang, D. Analysis on the optimal recycling path of Chinese lead-acid battery under the extended producer responsibility system. Sustainability 2022, 14, 4950. [Google Scholar] [CrossRef]
- Chen, P.; Wu, M.; Wang, P. Suggestions and Effect Evaluation Model for Automobile Manufacturers’ Deployment of Power Battery Recycling and Utilization under the Dual-Carbon Target. In Proceedings of the 2022 IEEE International Conference on Electrical Engineering, Big Data and Algorithms (EEBDA), Changchun, China, 25–27 February 2022; IEEE: Piscataway, NJ, USA, 2022; pp. 257–260. [Google Scholar]
- Zhang, Q. Gain Competitive Advantage in the Recycling Industry with Technology and Supply Chain-Based on a Case Study of GEM. J. Syst. Manag. 2023, 1–11. Available online: http://kns.cnki.net/kcms/detail/31.1977.N.20230821.1512.002.html (accessed on 17 March 2024).
- Wang, W.; Zhang, Y.; Zhang, K. Reward–penalty mechanism for closed-loop supply chains under responsibility-sharing and different power structures. Int. J. Prod. Econ. 2015, 170, 178–190. [Google Scholar] [CrossRef]
- Chang, X.; Wu, J.; Li, T. The joint tax-subsidy mechanism incorporating extended producer responsibility in a manufacturing-recycling system. J. Clean. Prod. 2019, 210, 821–836. [Google Scholar] [CrossRef]
- Ren, M. Optimal Designment of Incentive Mechanism Based on the Implementation of Extended Producer Responsibility of Electronic Manufacturer. Syst. Eng. 2009, 27, 116–120. [Google Scholar]
- Richter, J.; Koppejan, R. Extended producer responsibility for lamps in Nordic countries: Best practices and challenges in closing material loops. J. Clean. Prod. 2016, 123, 167–179. [Google Scholar] [CrossRef]
- Hou, J.; Zhang, Q.; Hu, S. Evaluation of a new extended producer responsibility mode for WEEE based on a supply chain scheme. Sci. Total Environ. 2020, 726, 138531. [Google Scholar] [CrossRef] [PubMed]
- Mailath, G.J. Introduction: Symposium on evolutionary game theory. J. Econ. Theory 1992, 57, 259–277. [Google Scholar] [CrossRef]
- Li, X.; He, J. Evolutionary mechanism of green product certification behavior in cement enterprises: A perspective of herd behavior. Environ. Technol. Innov. 2024, 33, 103508. [Google Scholar] [CrossRef]
- Jamali, M.B.; Rasti-Barzoki, M.; Khosroshahi, H. An evolutionary game-theoretic approach to study the technological transformation of the industrial sector toward renewable electricity procurement: A case study of Iran. Appl. Energy 2022, 318, 119083. [Google Scholar] [CrossRef]
- Hargreaves-Heap, S.; Varoufakis, Y. Game Theory: A Critical Introduction; Routledge: London, UK, 2004. [Google Scholar]
- Qi, J.; Sun, B.; Feng, M. Research on Evolutionary Game Model of Waste Electronic Product Recycling Behavior from the Perspective of Competition and Cooperation. In Proceedings of the 5th International Conference on Control, Robotics and Cybernetics (CRC), Wuhan, China, 16–18 October 2020; IEEE: Piscataway, NJ, USA, 2020; pp. 76–80. [Google Scholar]
- Yang, J.; Long, R.; Chen, H. A comparative analysis of express packaging waste recycling models based on the differential game theory. Resour. Conserv. Recycl. 2021, 168, 105449. [Google Scholar] [CrossRef]
- Yao, S.; Wu, L.; Yu, D. Synergy between Electric Vehicle Manufacturers and Battery Recyclers through Technology and Innovation: A Game Theory Approach. Sustainability 2023, 15, 13726. [Google Scholar] [CrossRef]
- Li, X.; Mu, D.; Du, J. Multi-channel recycling decisions of electric vehicle battery based on SD-dynamic game model. In Proceedings of the 15th International Conference on Service Systems and Service Management (ICSSSM), Hangzhou, China, 21–22 July 2018; IEEE: Piscataway, NJ, USA, 2018; pp. 1–6. [Google Scholar]
- Yao, J.; Venkitasubramaniam, P. Stochastic games of end-user energy storage sharing. In Proceedings of the IEEE 55th Conference on Decision and Control (CDC), Las Vegas, NV, USA, 12–14 December 2016; IEEE: Piscataway, NJ, USA, 2016; pp. 4965–4972. [Google Scholar]
- Kai-Ineman, D.; Tversky, A. Prospect theory: An analysis of decision under risk. Econometrica 1979, 47, 363–391. [Google Scholar]
- Leoneti, A.; Gomes, L.F.A.M. Comparative analysis of the todim method adherence to prospect theory. Indep. J. Manag. Prod. 2021, 12, 1935–1947. [Google Scholar] [CrossRef]
- Lang, G. Review of route choice based on prospect theory. Conf. Ser. Earth Environ. Sci. 2020, 545, 012036. [Google Scholar] [CrossRef]
- Werner, K.M.; Zank, H. A revealed reference point for prospect theory. Econ. Theory 2019, 67, 731–773. [Google Scholar] [CrossRef]
- Friedman, D. On economic applications of evolutionary game theory. J. Evol. Econ. 1998, 8, 15–43. [Google Scholar] [CrossRef]
- Wang, Y.; Wang, C.; Deng, X. Evolutionary game analysis of the utilization of construction waste resources based on prospect theory. Sustainability 2023, 15, 2577. [Google Scholar] [CrossRef]
- Zhang, L.; Jiang, Y.; Wu, J. Evolutionary game analysis of government and residents’ participation in waste separation based on cumulative prospect theory. Int. J. Environ. Res. Public Health 2022, 19, 14589. [Google Scholar] [CrossRef] [PubMed]
- Zhang, X.; Meng, Y.P. Research on the evolutionary game of port emission reduction based on prospect theory. In Advances in Energy, Environment and Chemical Engineering; CRC Press: Boca Raton, FL, USA, 2022; Volume 1, pp. 137–145. [Google Scholar]
- Sun, H.; Gao, G.; Li, Z. Evolutionary game analysis of enterprise carbon emission regulation based on prospect theory. Soft Comput. 2022, 26, 13357–13368. [Google Scholar] [CrossRef]
- Tversky, A.; Kahneman, D. Advances in prospect theory: Cumulative representation of uncertainty. J. Risk Uncertain. 1992, 5, 297–323. [Google Scholar] [CrossRef]
- Hu, J.; Wang, T. Strategies of Participants in the Carbon Trading Market—An Analysis Based on the Evolutionary Game. Sustainability 2023, 15, 10807. [Google Scholar] [CrossRef]
- Zhang, J.; Guan, J. The time-varying impacts of government incentives on innovation. Technol. Forecast. Soc. Chang. 2018, 135, 132–144. [Google Scholar] [CrossRef]
- Li, H.; Qi, H.; Cao, H.; Yuan, L. Industrial Policy and Technological Innovation of New Energy Vehicle Industry in China. Energies 2022, 15, 9264. [Google Scholar] [CrossRef]
- Gerlagh, R.; Lise, W. Carbon taxes: A drop in the ocean, or a drop that erodes the stone? The effect of carbon taxes on technological change. Ecol. Econ. 2005, 54, 241–260. [Google Scholar] [CrossRef]

Disclaimer/Publisher’s Note: The statements, opinions and data contained in all publications are solely those of the individual author(s) and contributor(s) and not of MDPI and/or the editor(s). MDPI and/or the editor(s) disclaim responsibility for any injury to people or property resulting from any ideas, methods, instructions or products referred to in the content. |
© 2024 by the authors. Licensee MDPI, Basel, Switzerland. This article is an open access article distributed under the terms and conditions of the Creative Commons Attribution (CC BY) license (https://creativecommons.org/licenses/by/4.0/).