

Port Access Fluidity Management during a Major Extension Project: A Simulation-Based Case Study

Abstract
:1. Introduction
2. Literature Review
- Comprehensive Port Access Data Analysis: The work stands out by meticulously analyzing port access data, including vehicle type distinctions and the chronological sequencing of access operations. By capturing realistic time variations, we offer a detailed and accurate model for managing port access, particularly during construction phases.
- Refined Simulation Parameters: The approach used employs spatial and temporal dynamics in simulation configurations, allowing for an accurate representation of varying traffic and service levels across the port. This methodology effectively identifies peak and waiting times, enhancing the realism of truck arrival and departure simulations.
- Dynamic Scenario Design: This study leverages scenario-based planning coupled with stakeholder engagement to derive practical recommendations. This structured analysis progresses from basic assessments to complex scenario explorations, ensuring that recommendations are feasible and grounded in operational realities.
3. Materials and Methods
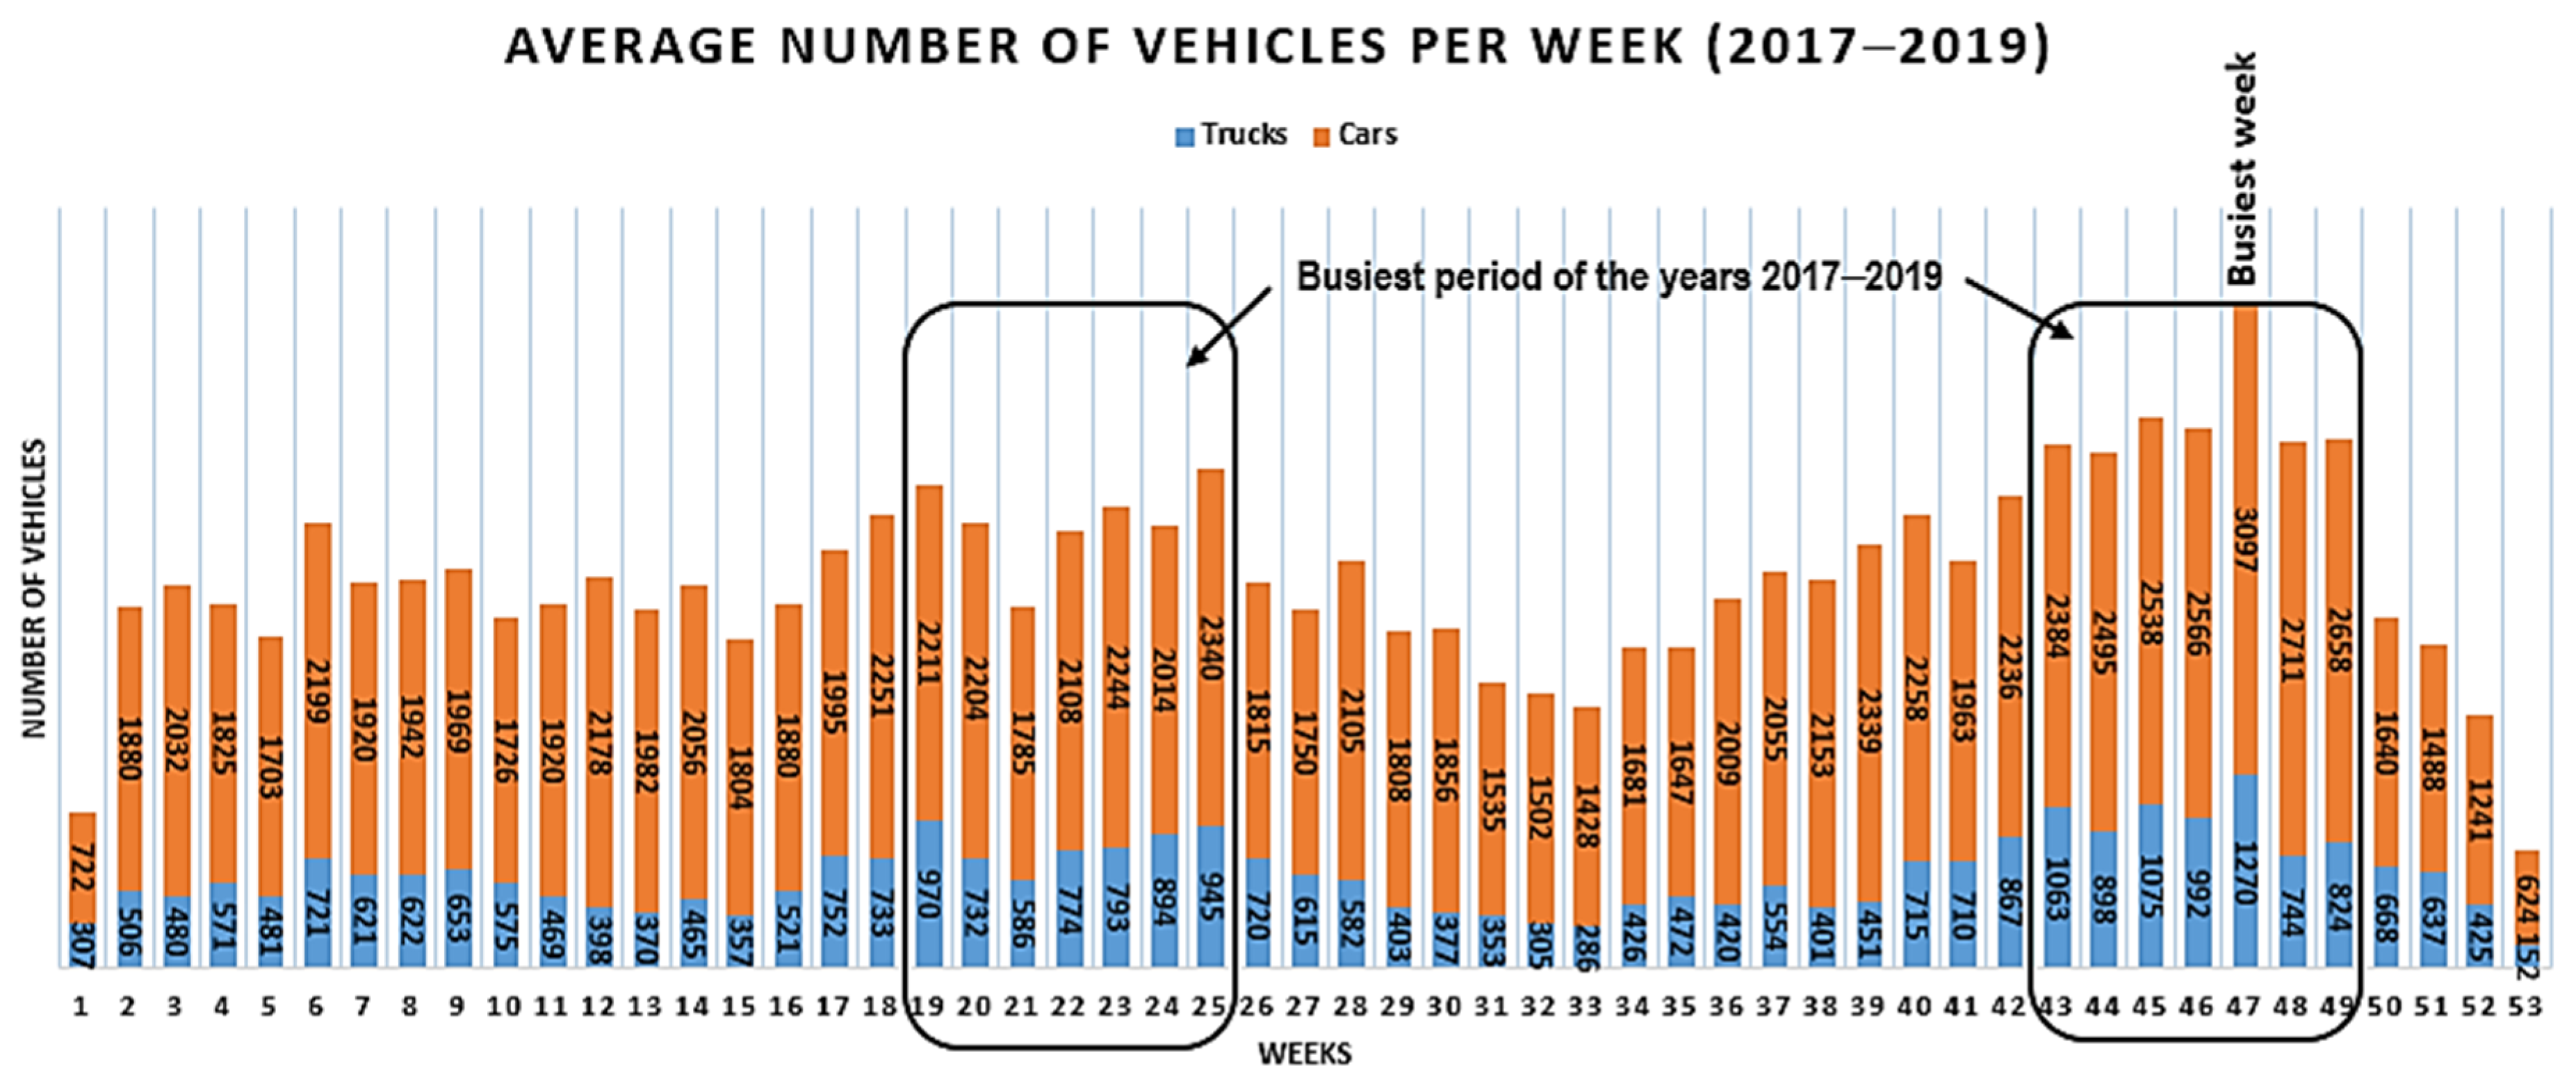
3.1. Data Collection and Processing
3.1.1. Data Collection
3.1.2. Data Processing
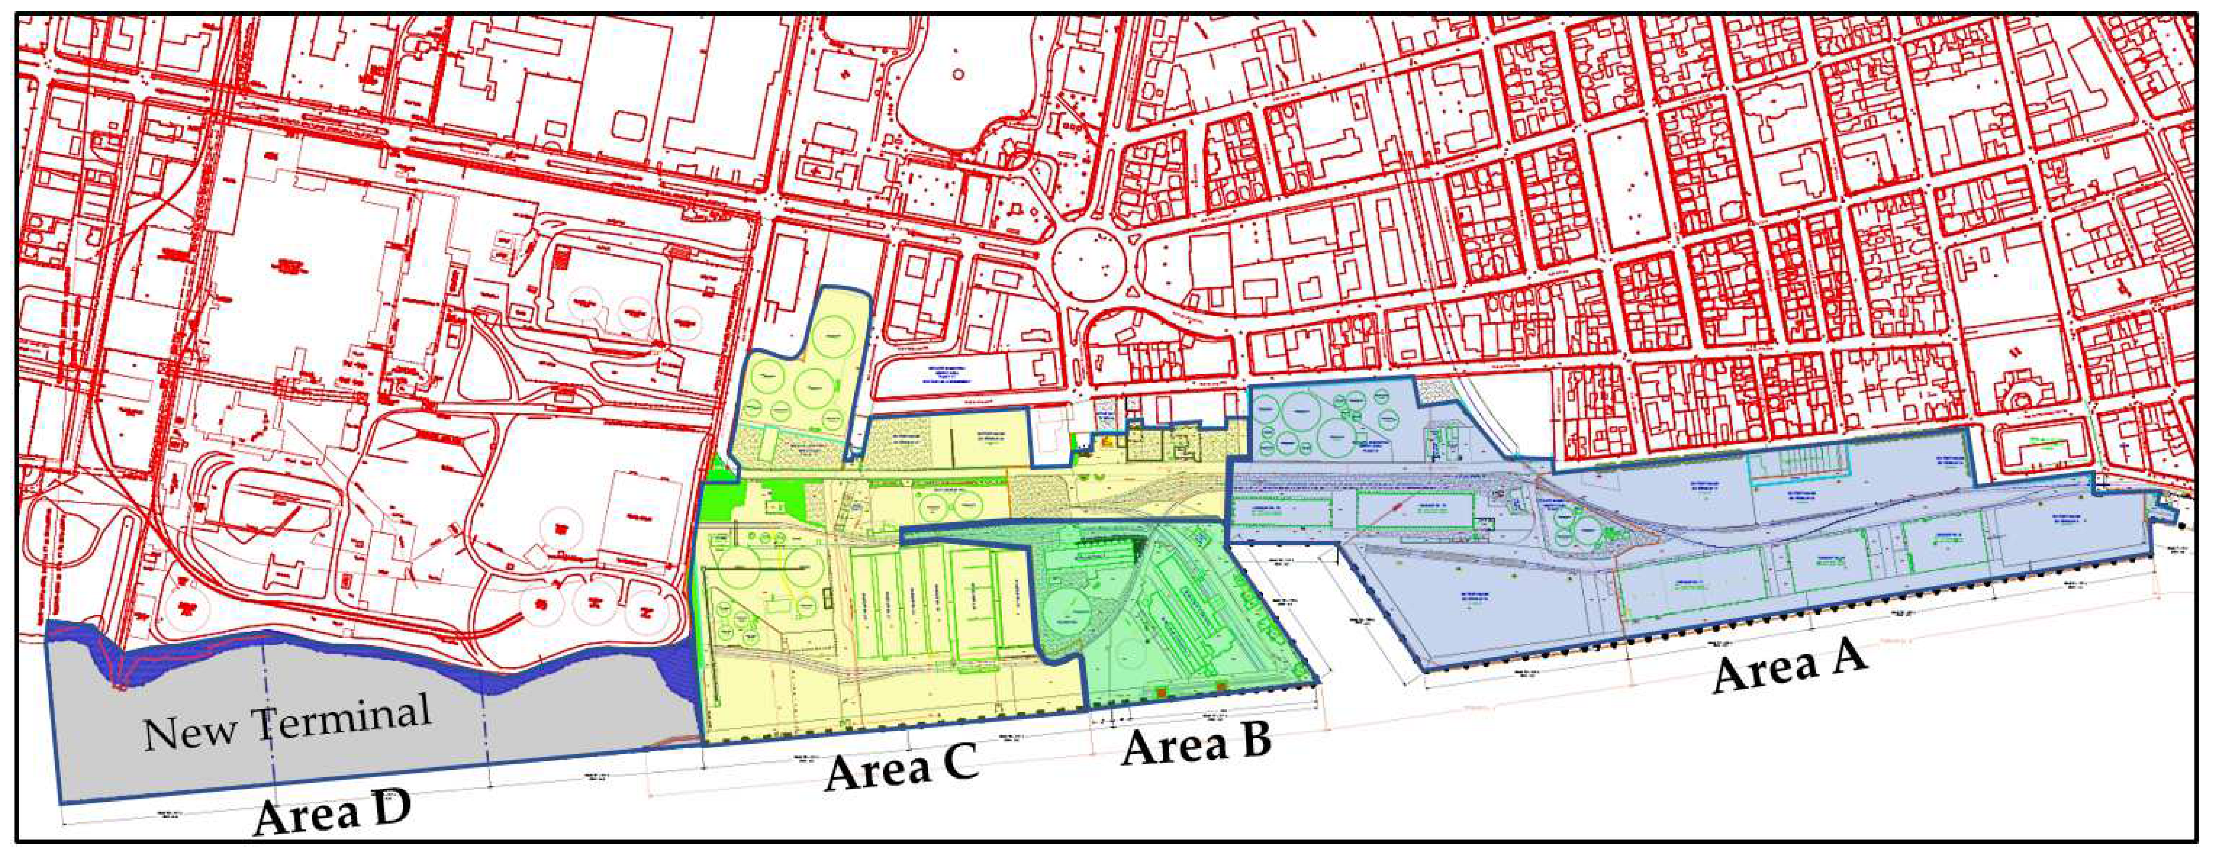
- Segmentation of the Port into Four Areas
- Time in the System
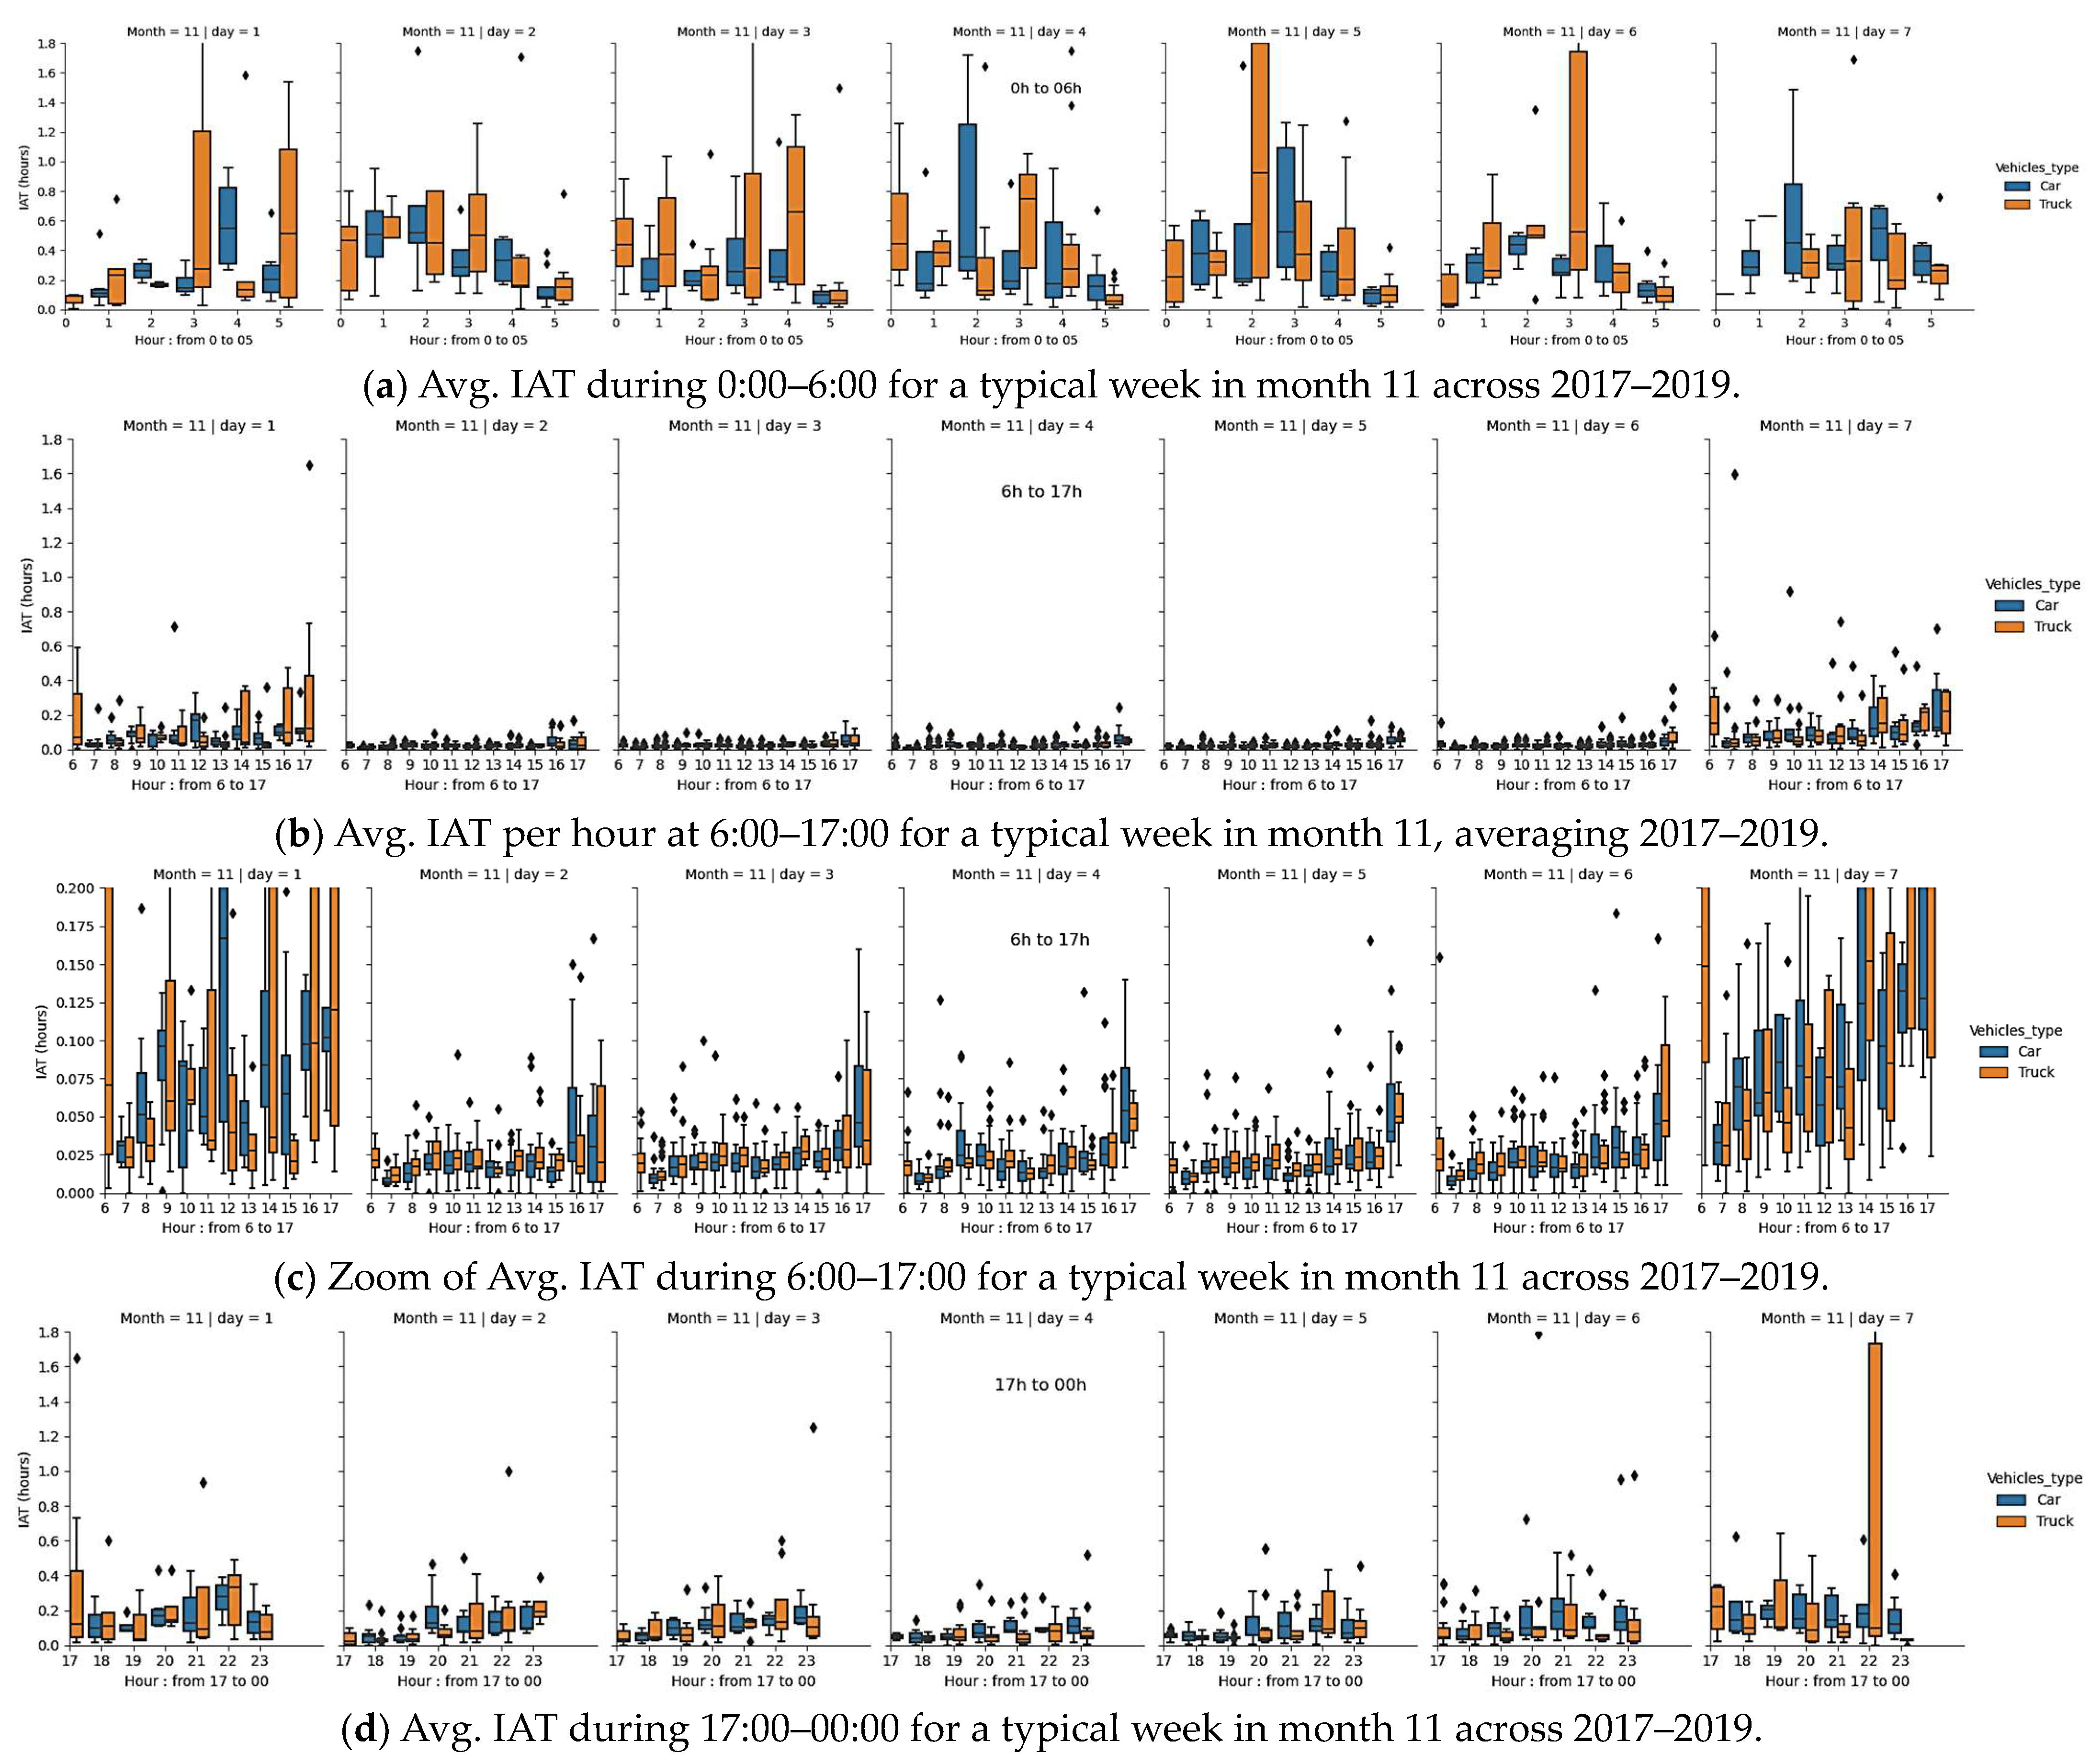
- Inter-Arrival Time
- Access Registration Time
- Parameters related to area D (new terminal)
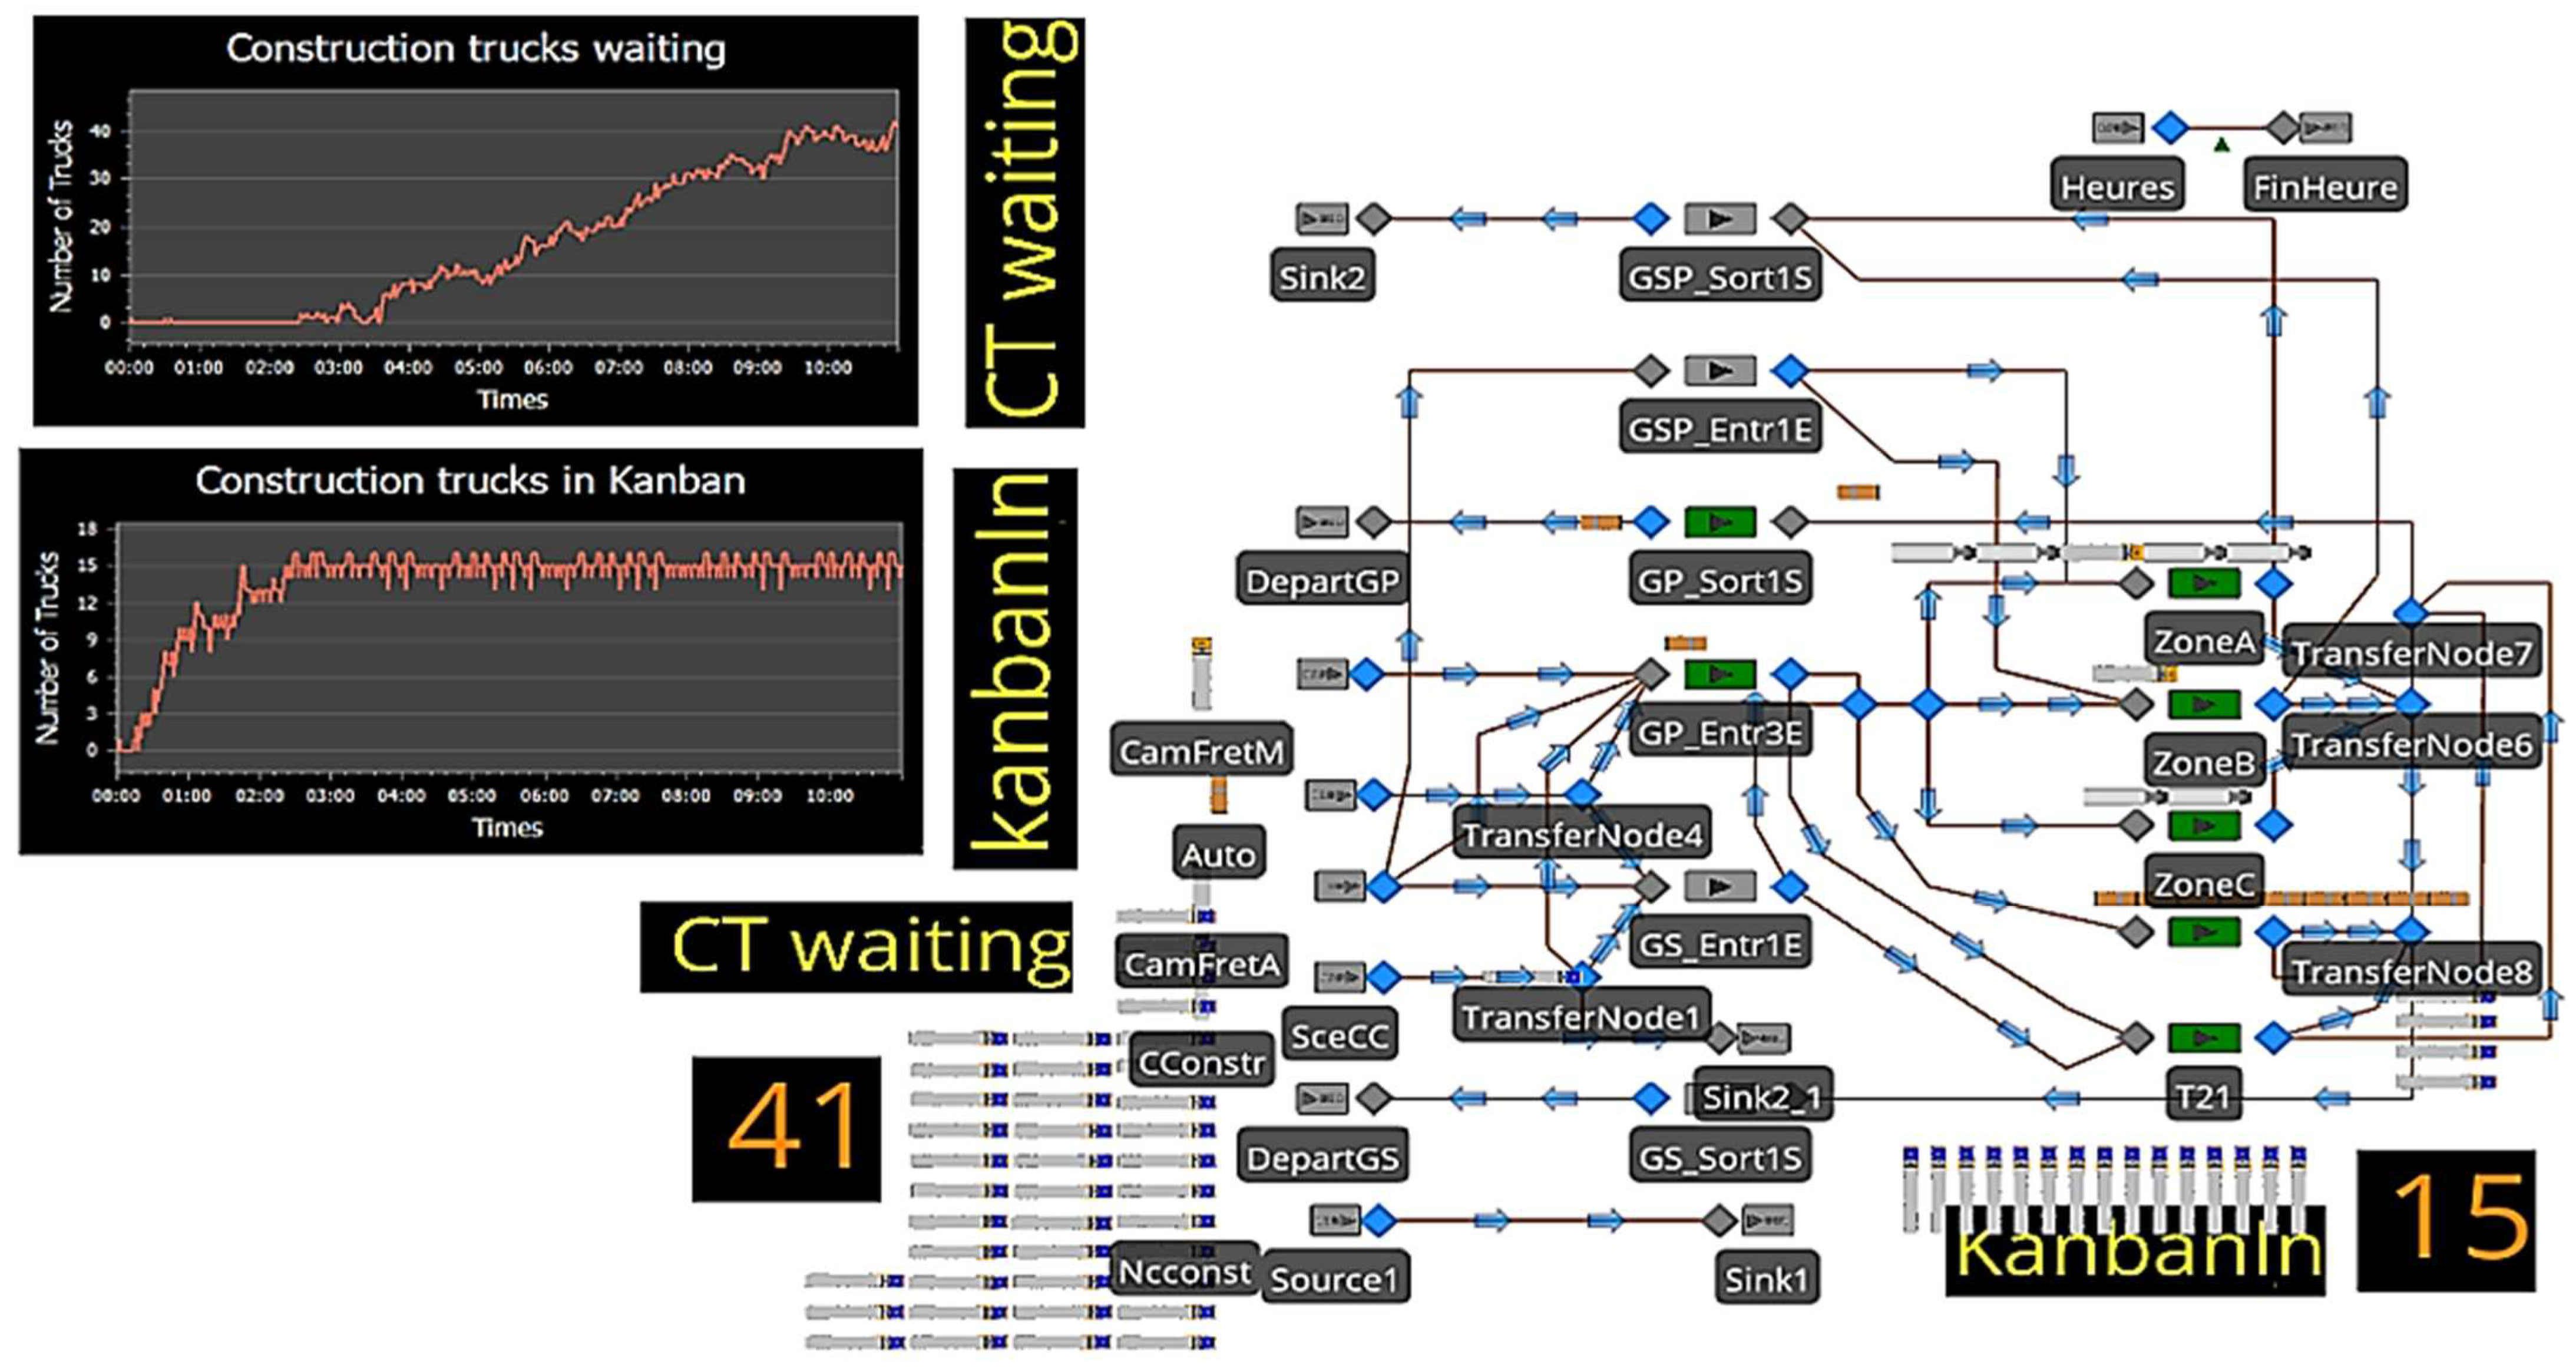
3.2. Simulation Model Design and Validation
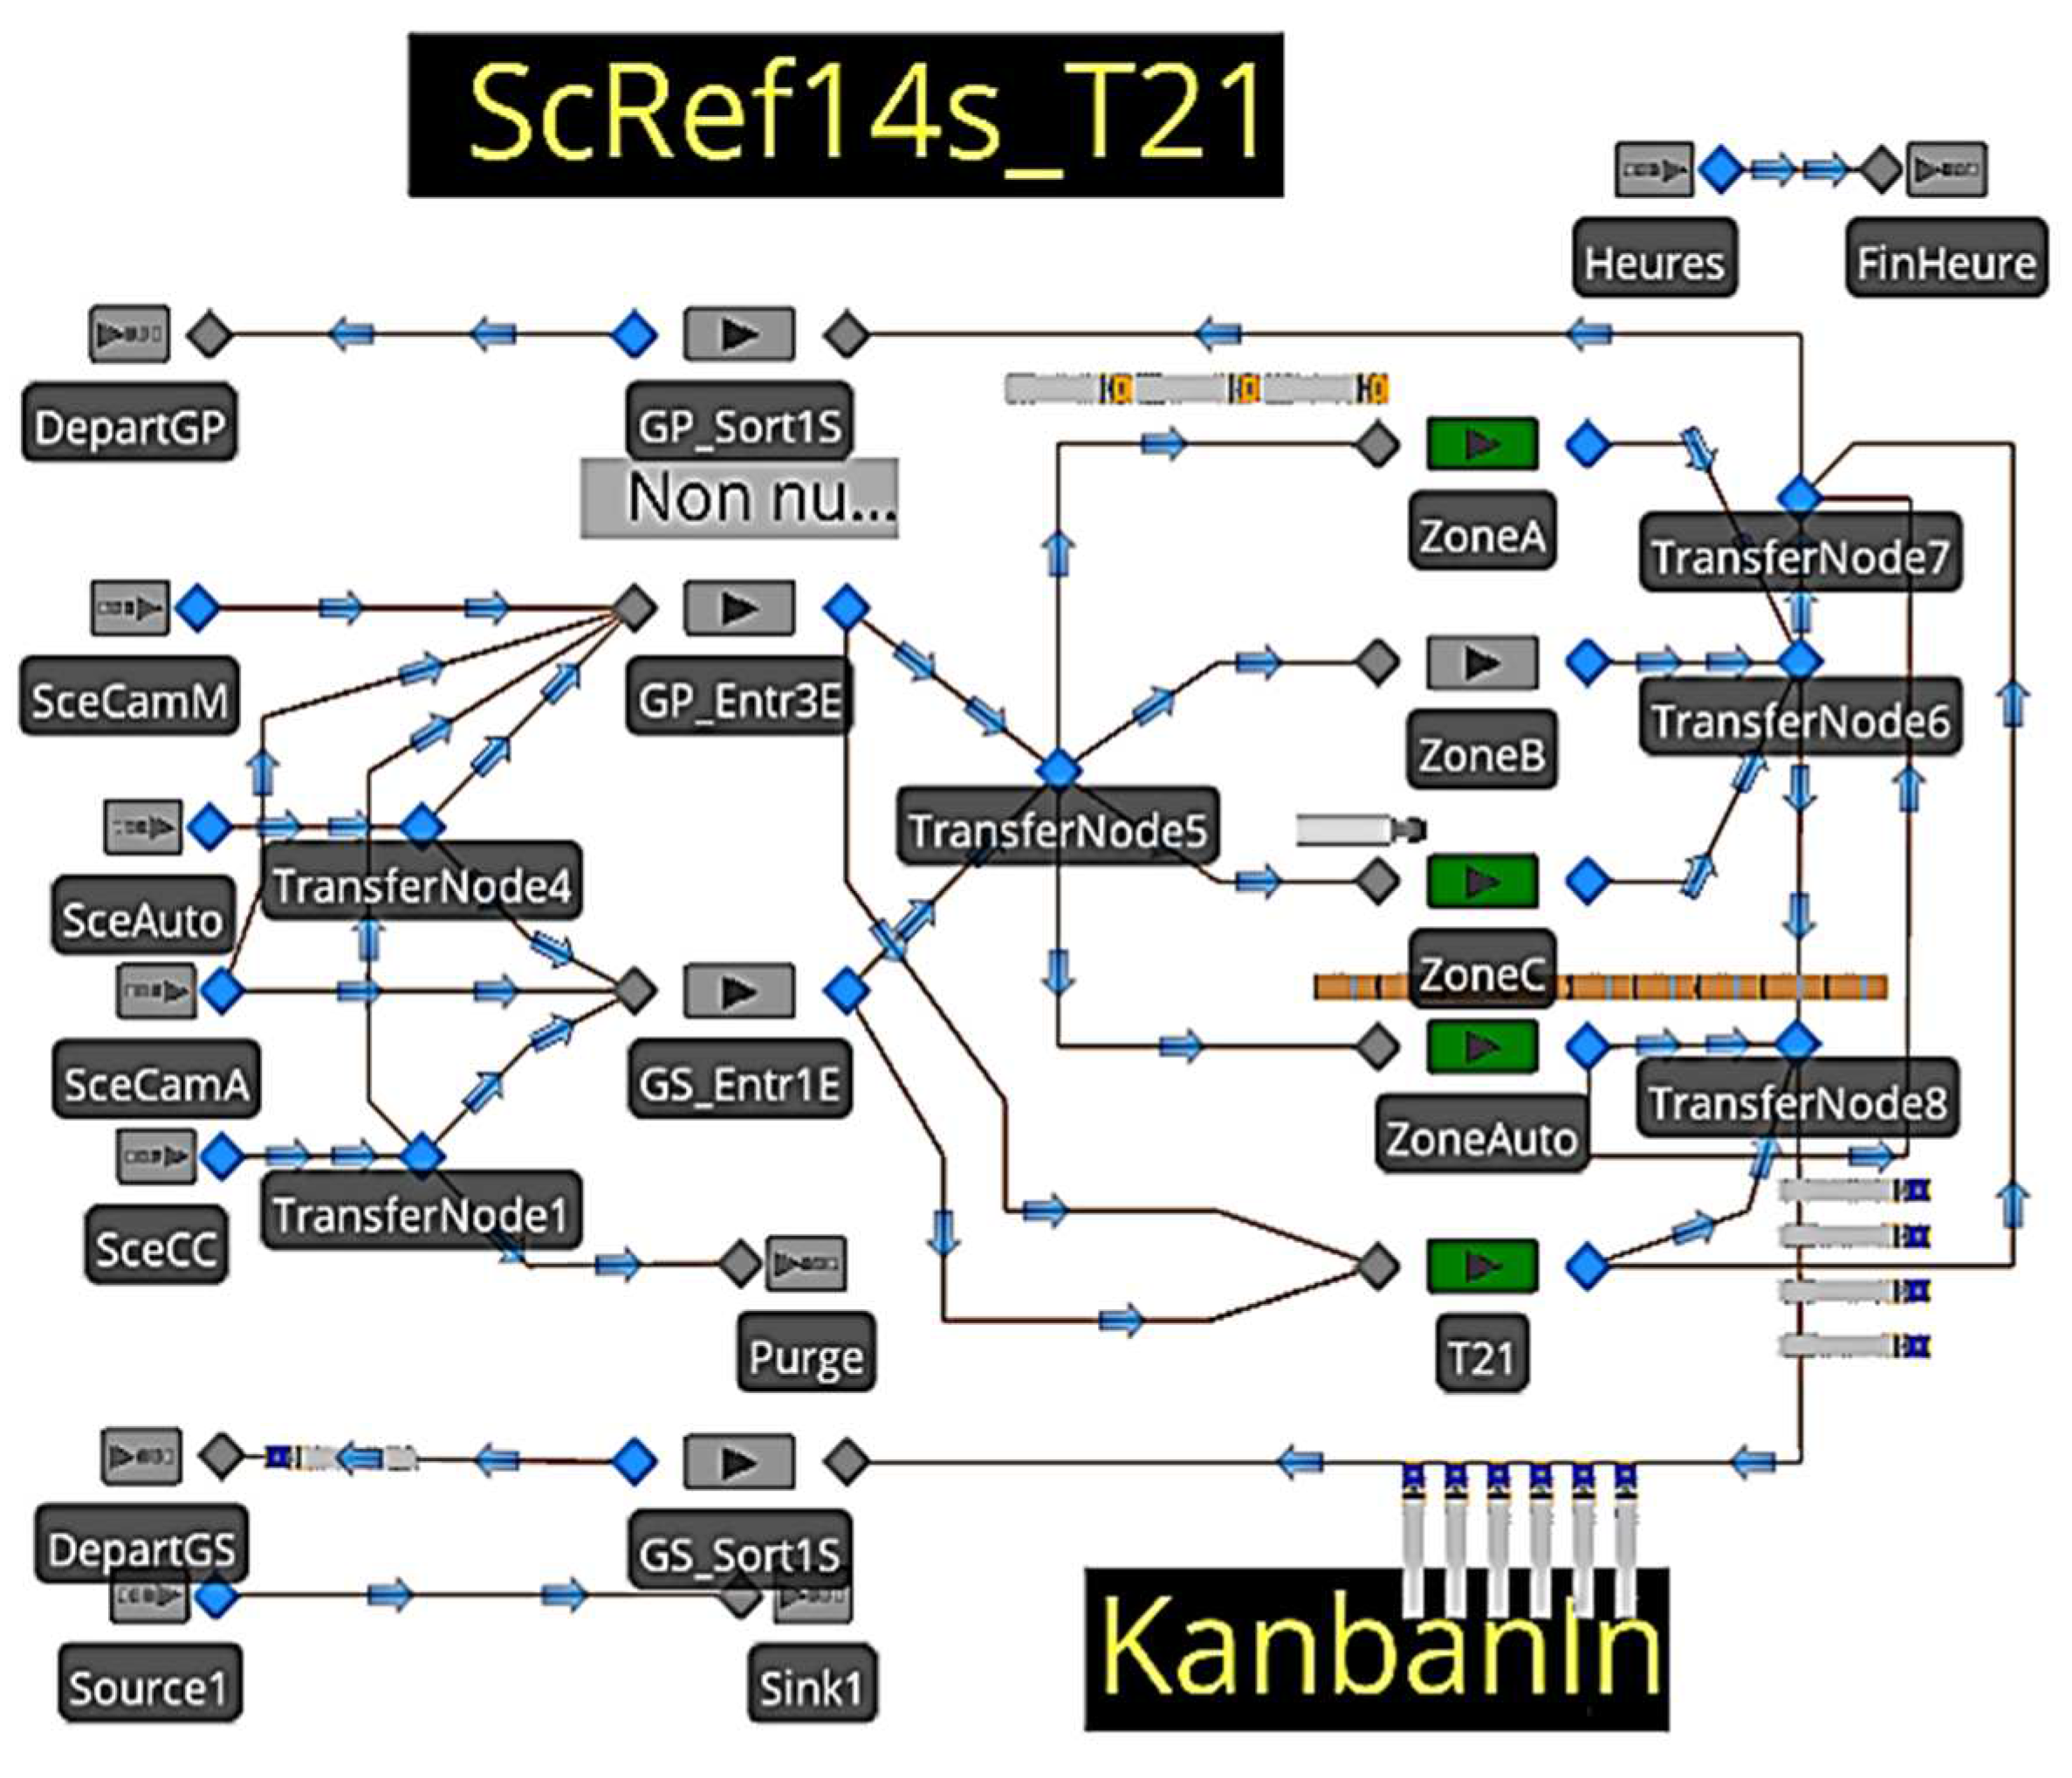
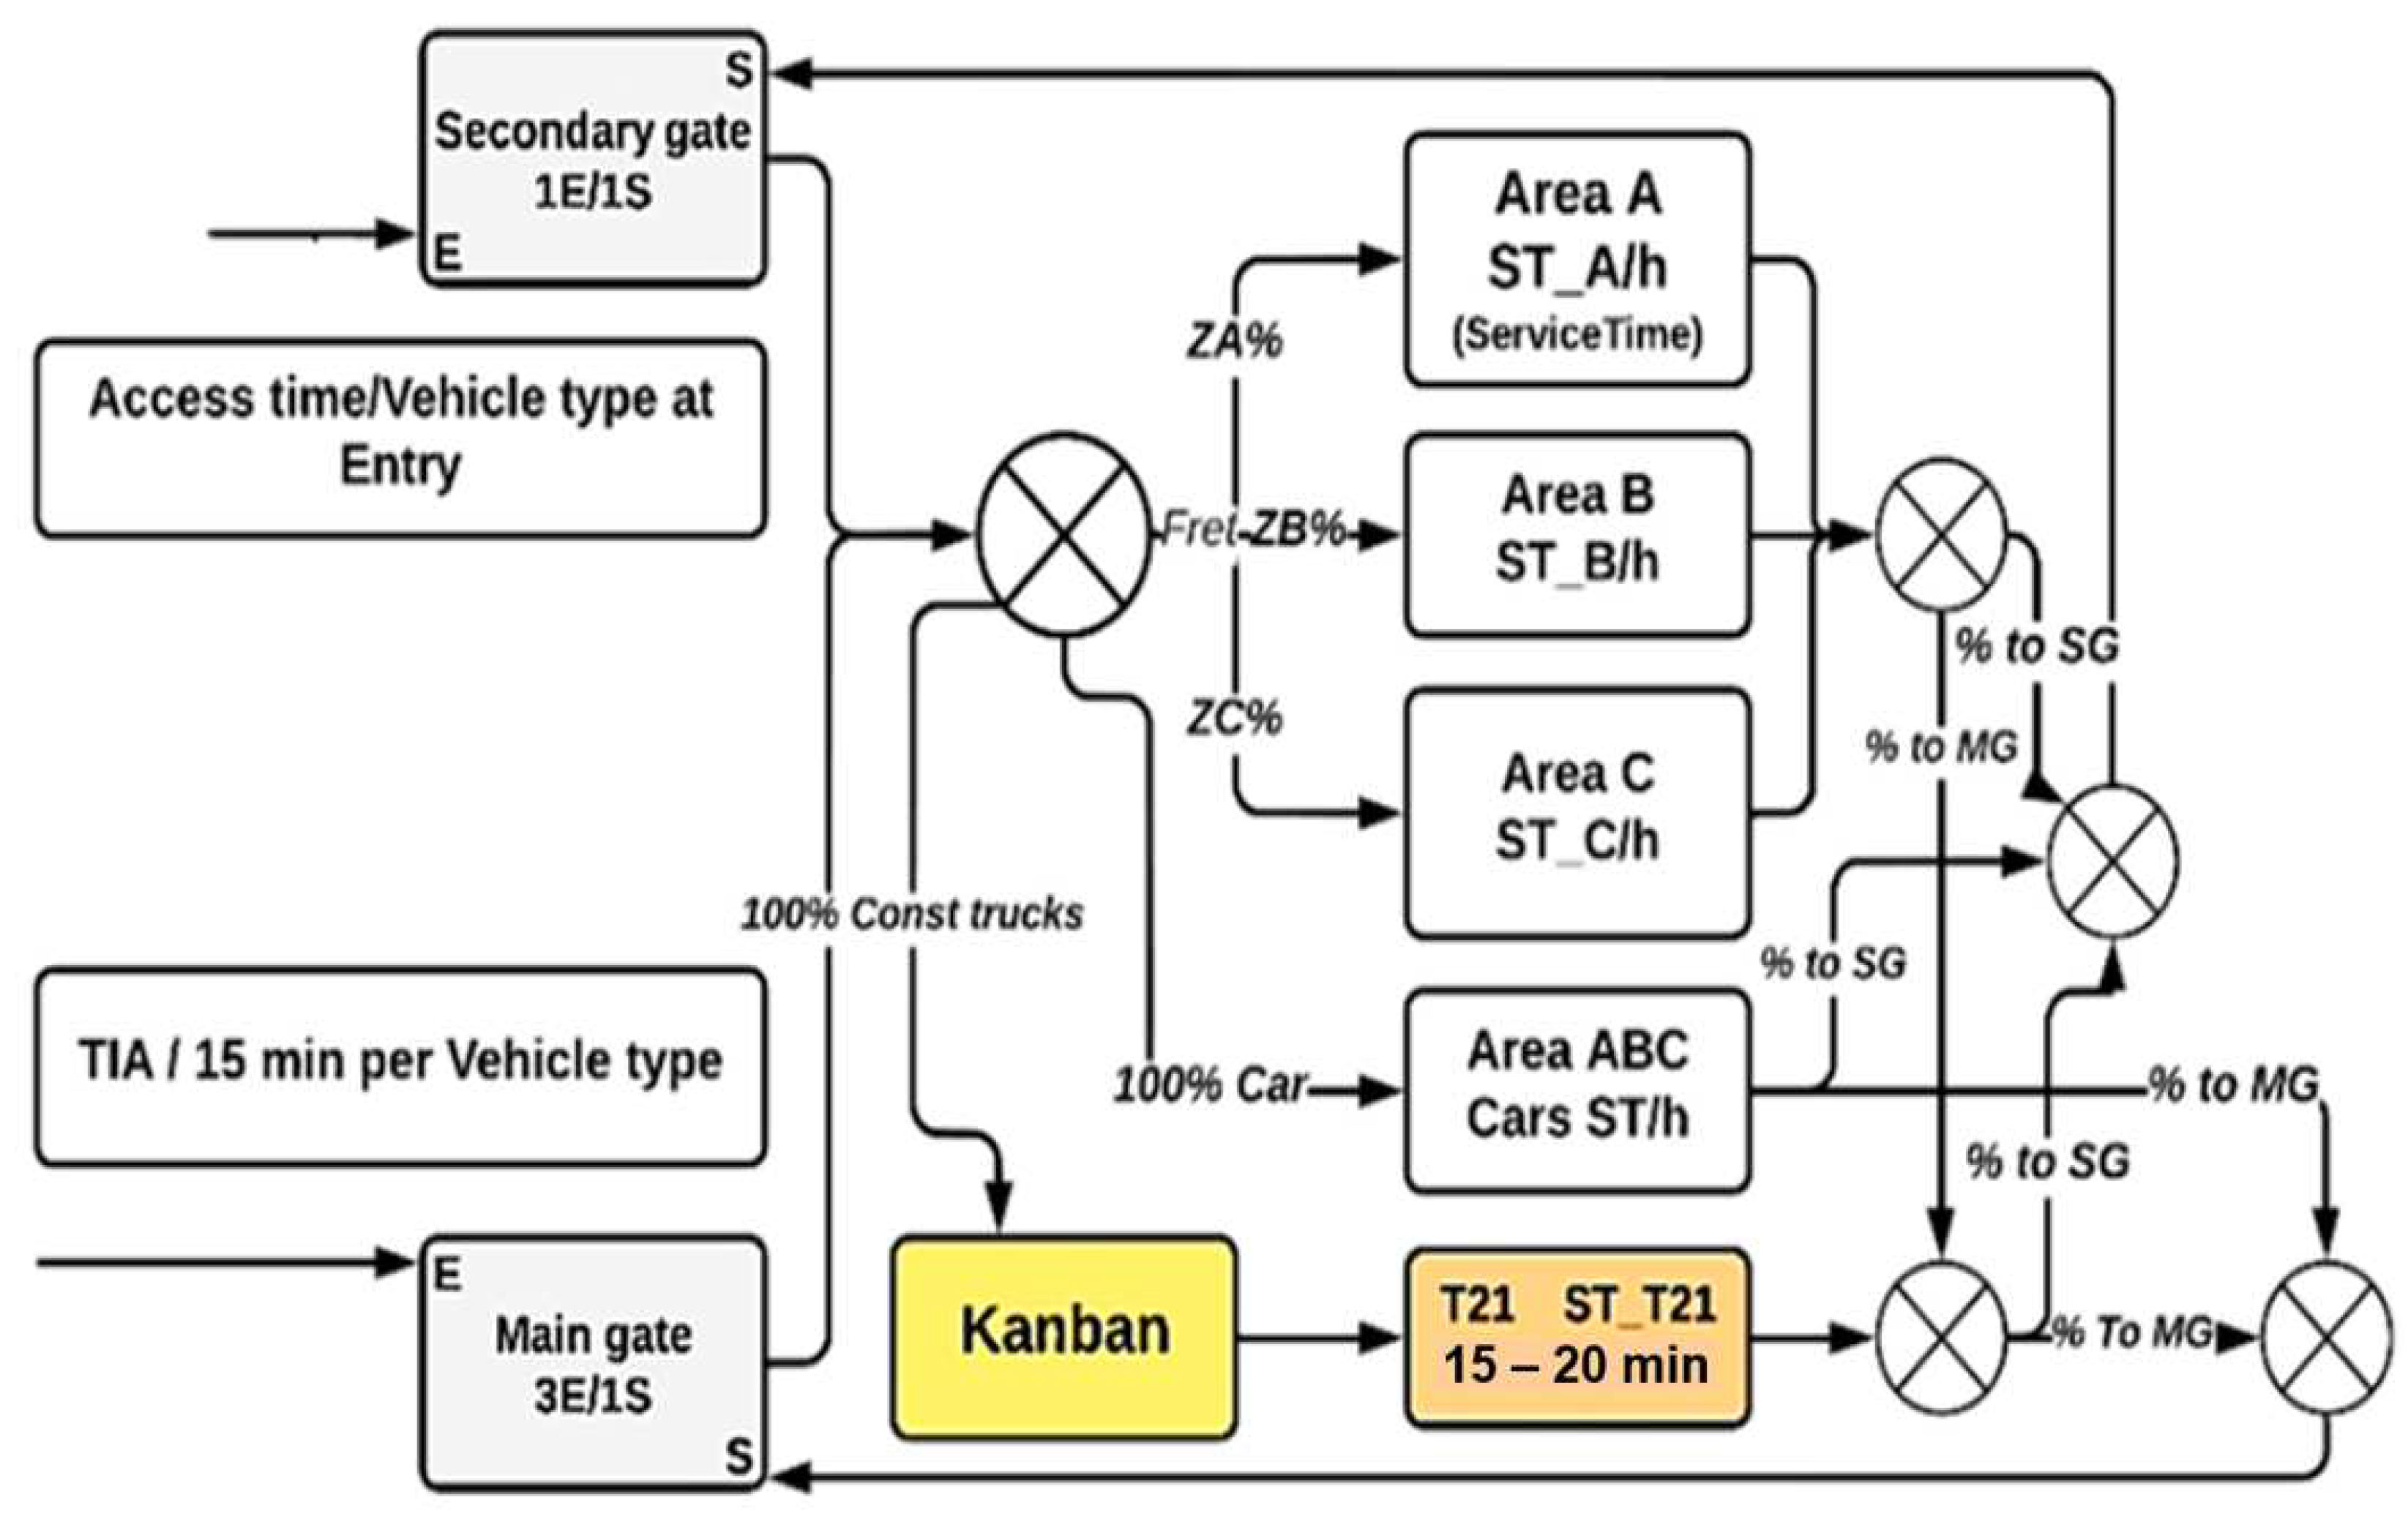
- Four flow sources for various vehicles types (manual access trucks, automatic access trucks, construction trucks, and cars), connected to current and potential access gates;
- A rate table is utilized to generate a flow of entities every 15 min, based on historical flow data. This table allows for the simulation model to capture the variability of IAT accurately, ensuring that the flow of entities aligns with historical trends;
- Stochastic entry and exit ART specific to each vehicle type, as illustrated in Table 3;
- Allocation of each vehicle to a destination area based on a stochastic flow and a specific stochastic TS;
- A Kanban zone designed to hold up to 15 trucks awaiting unloading. This Kanban system increases as incoming trucks find no available unloading service and decreases using the FIFO (First In, First Out) method whenever an unloading station becomes available in the construction area;
- After completing their stay, vehicles leave the port through a specifically designated exit gate based on the exit flows drawn from historical data of the reference period;
- The simulated period is from 6:00 am to 5:00 pm daily, with a replication of 44 days to achieve a state of convergence for stochastic parameters;
- Construction trucks that exceed operational capacity are purged from the system and recorded for analysis.
3.3. Performance Indicators
3.4. Scenario-Based Analysis Approach
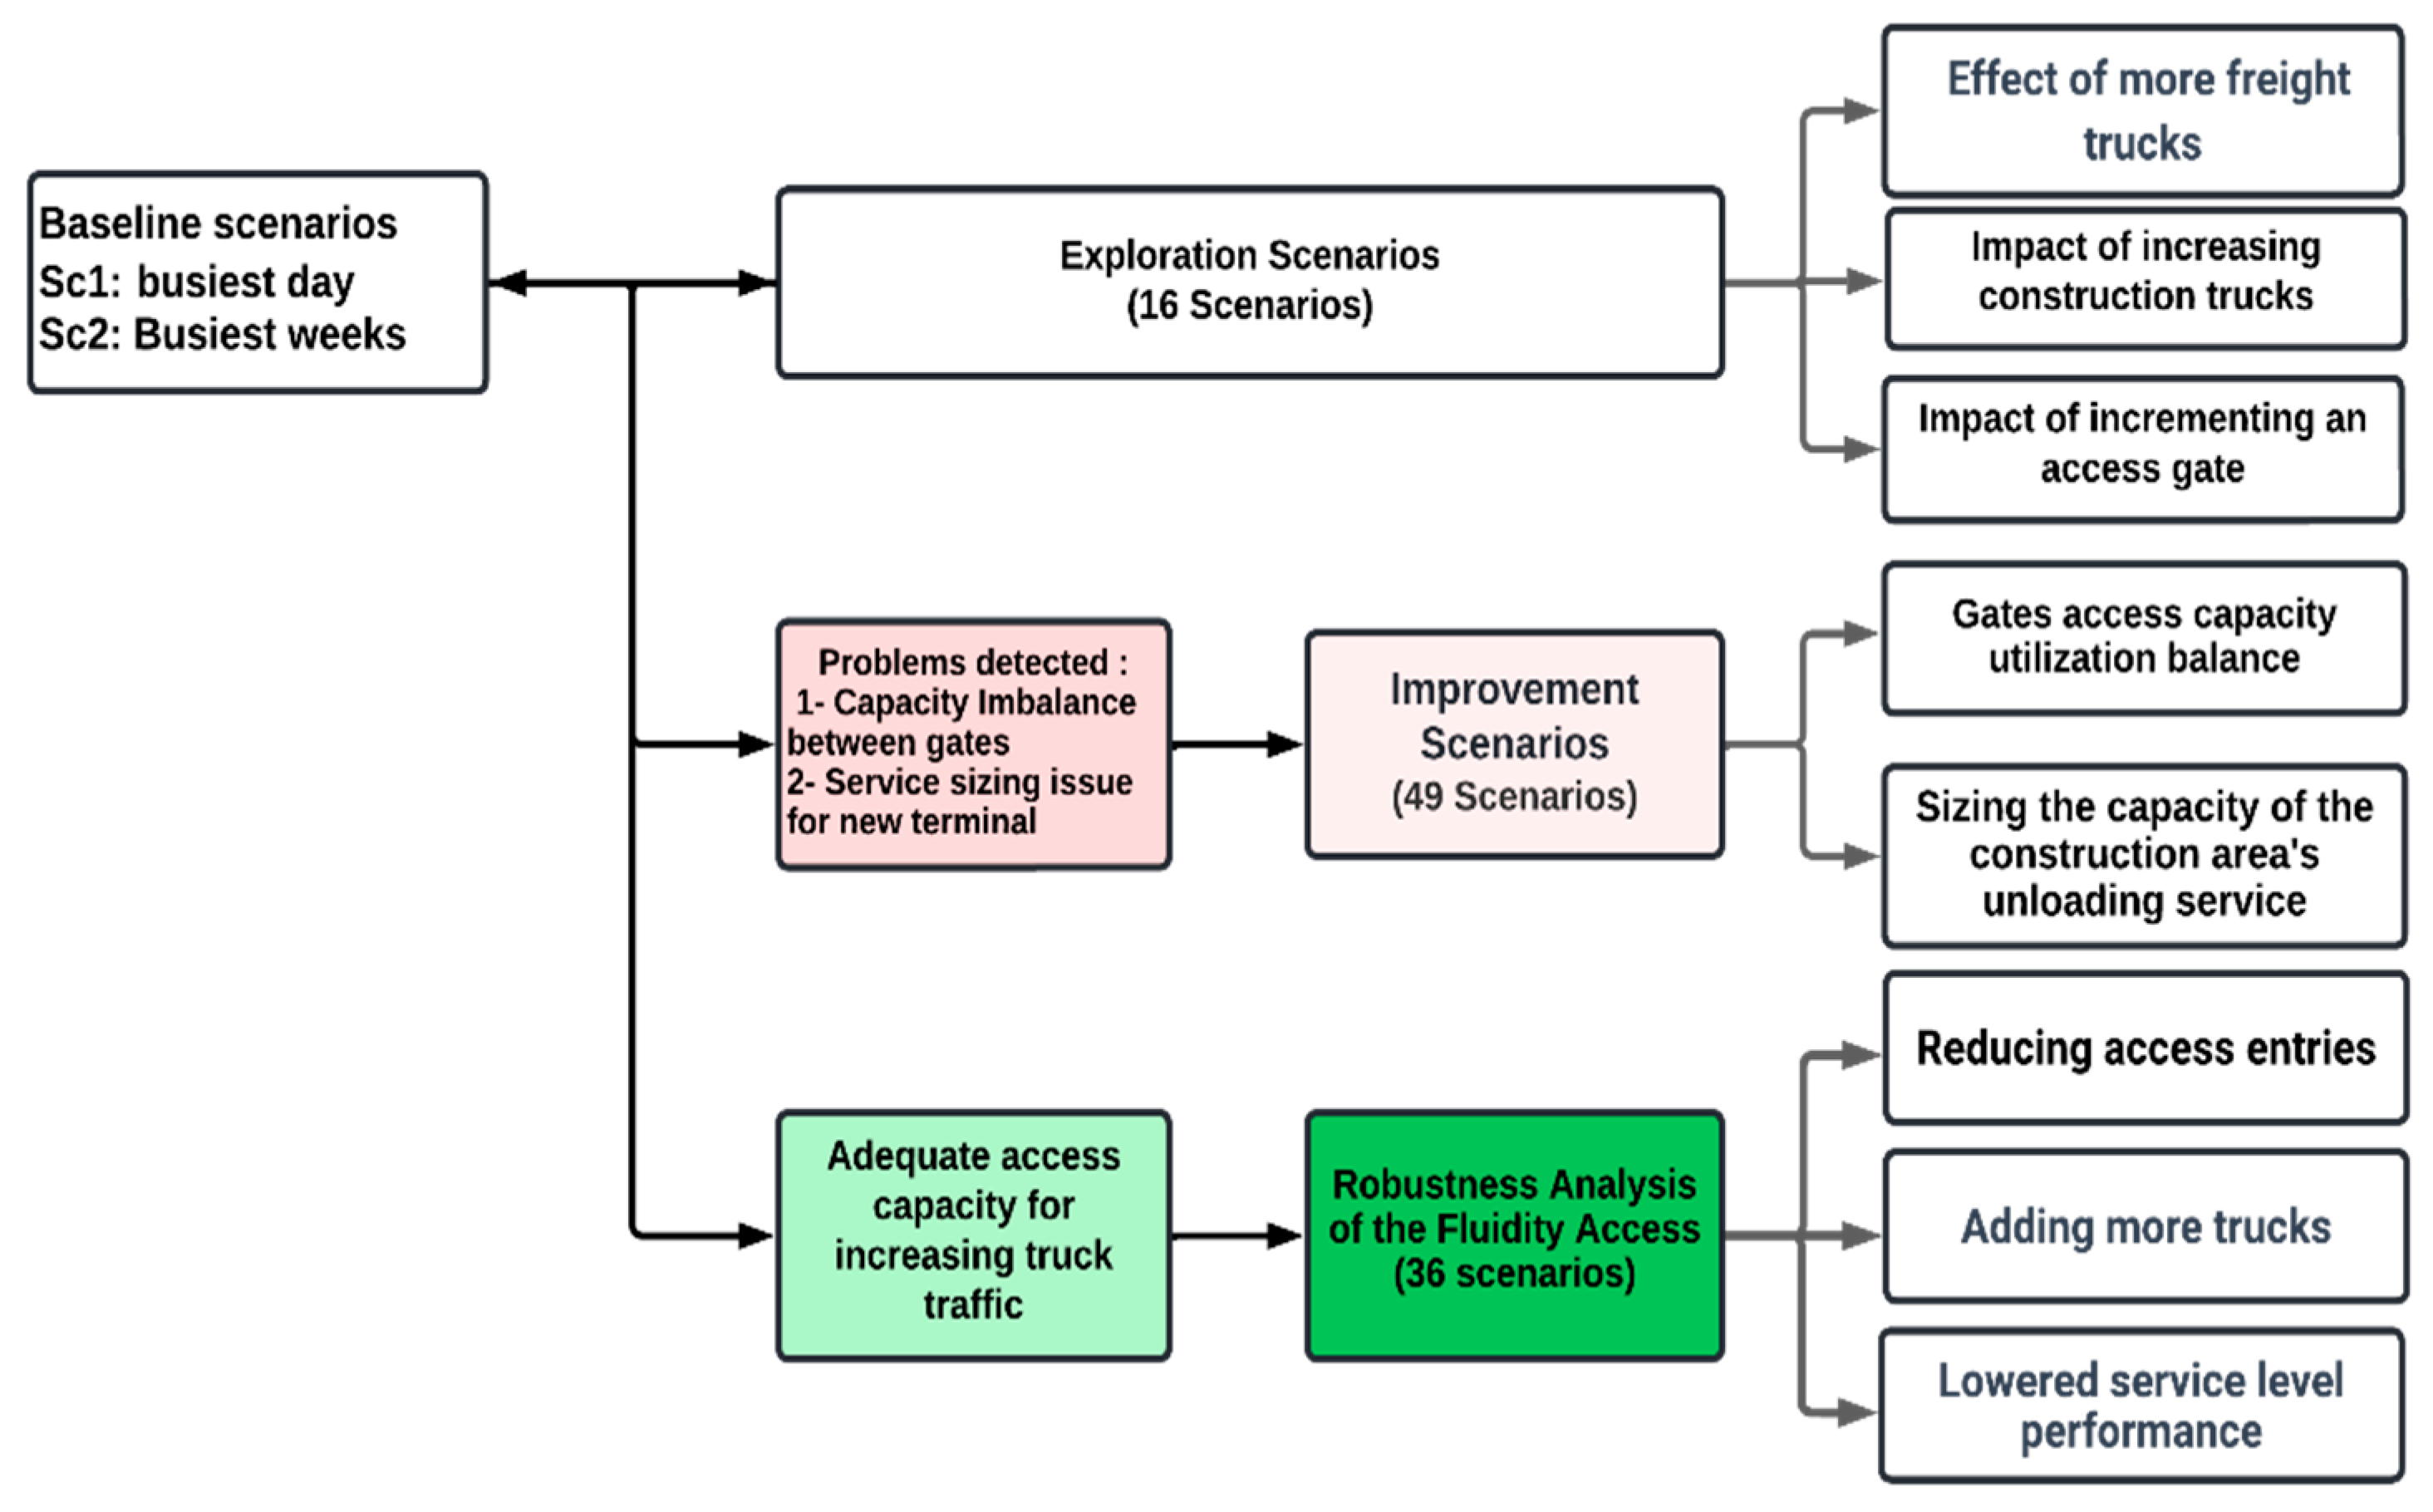
3.4.1. Reference Scenarios
3.4.2. Exploration Analysis
3.4.3. Improvement Analysis
3.4.4. Robustness Analysis of the Main Gate Access Fluidity
4. Results and Interpretations
4.1. Results Analysis
4.1.1. Baseline Scenario Analysis Results
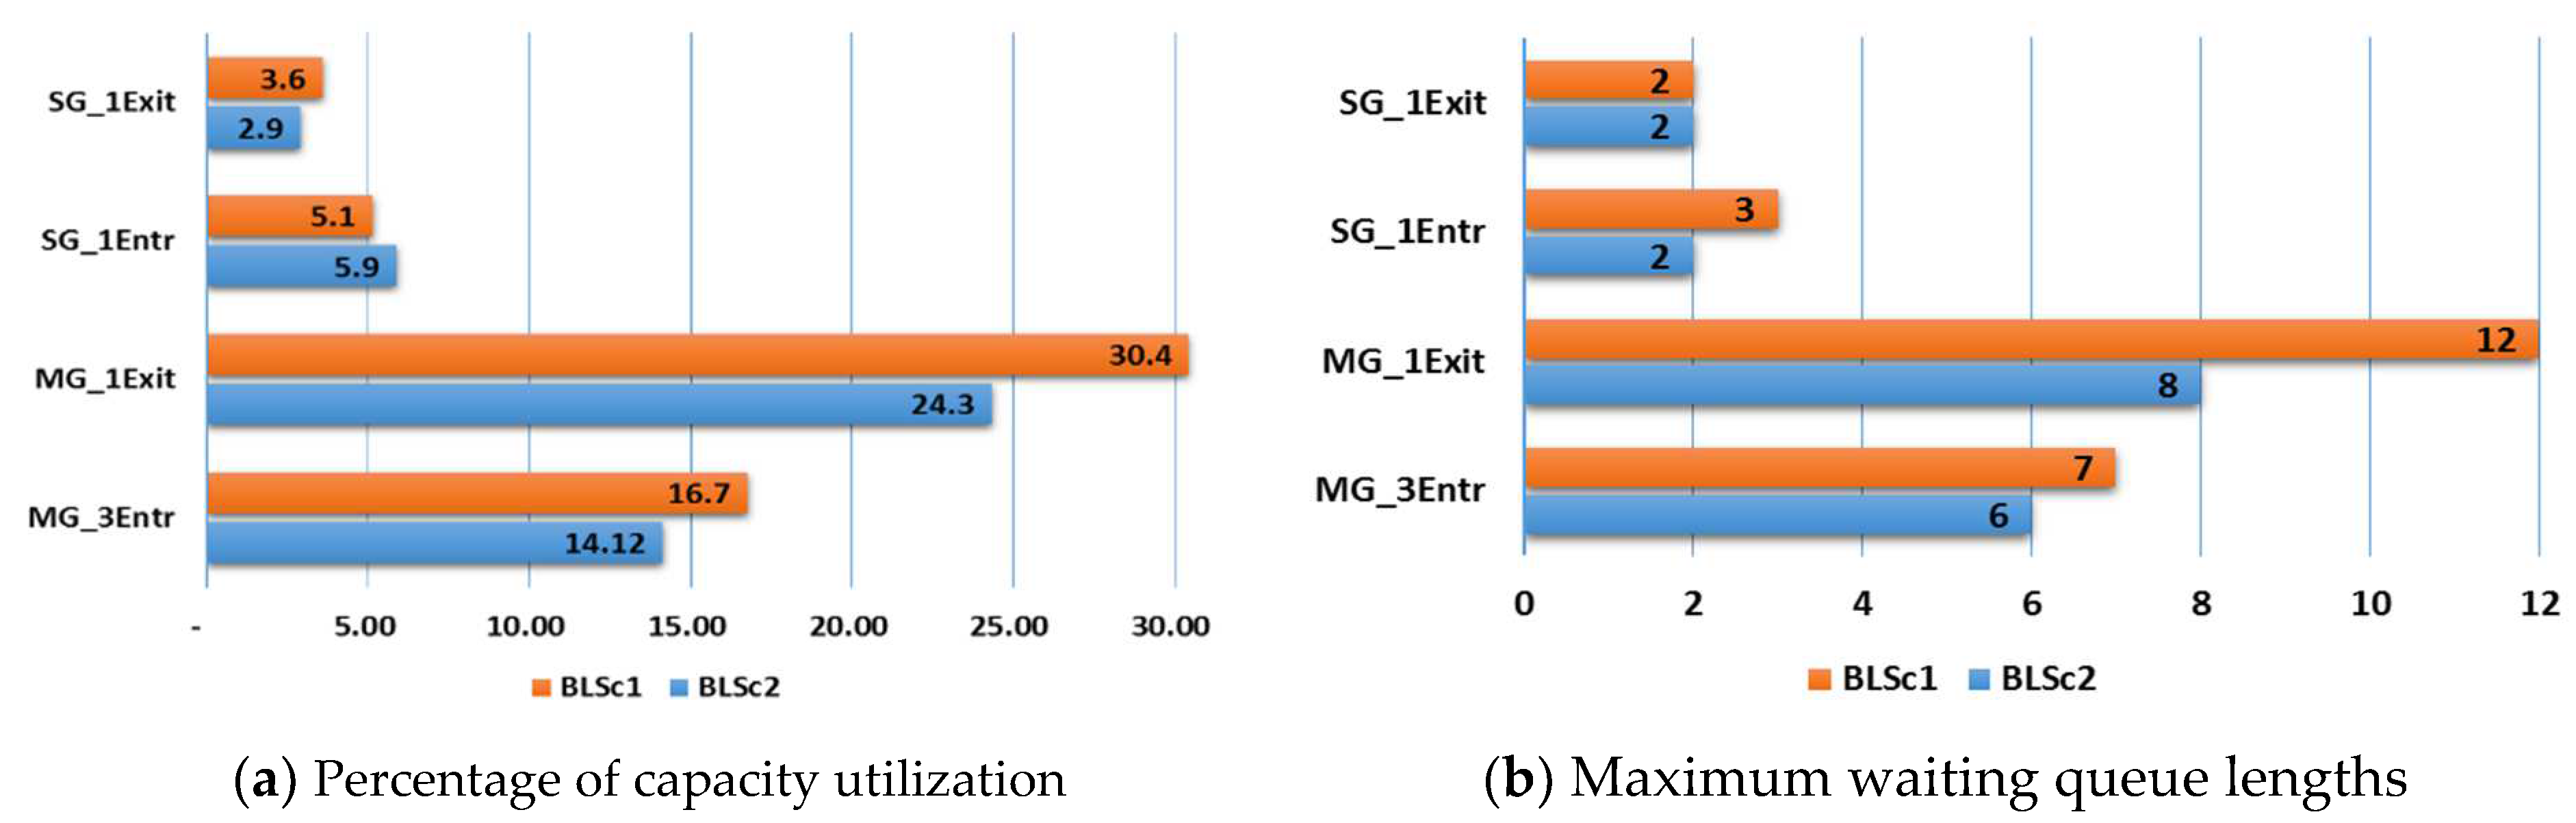
- The access capacity is largely underutilized, especially in the case of the SG, where the entry/exit used capacity does not exceed 4% to 6%. The crowding observed in practice is primarily attributable to inadequate planning of truck arrivals;
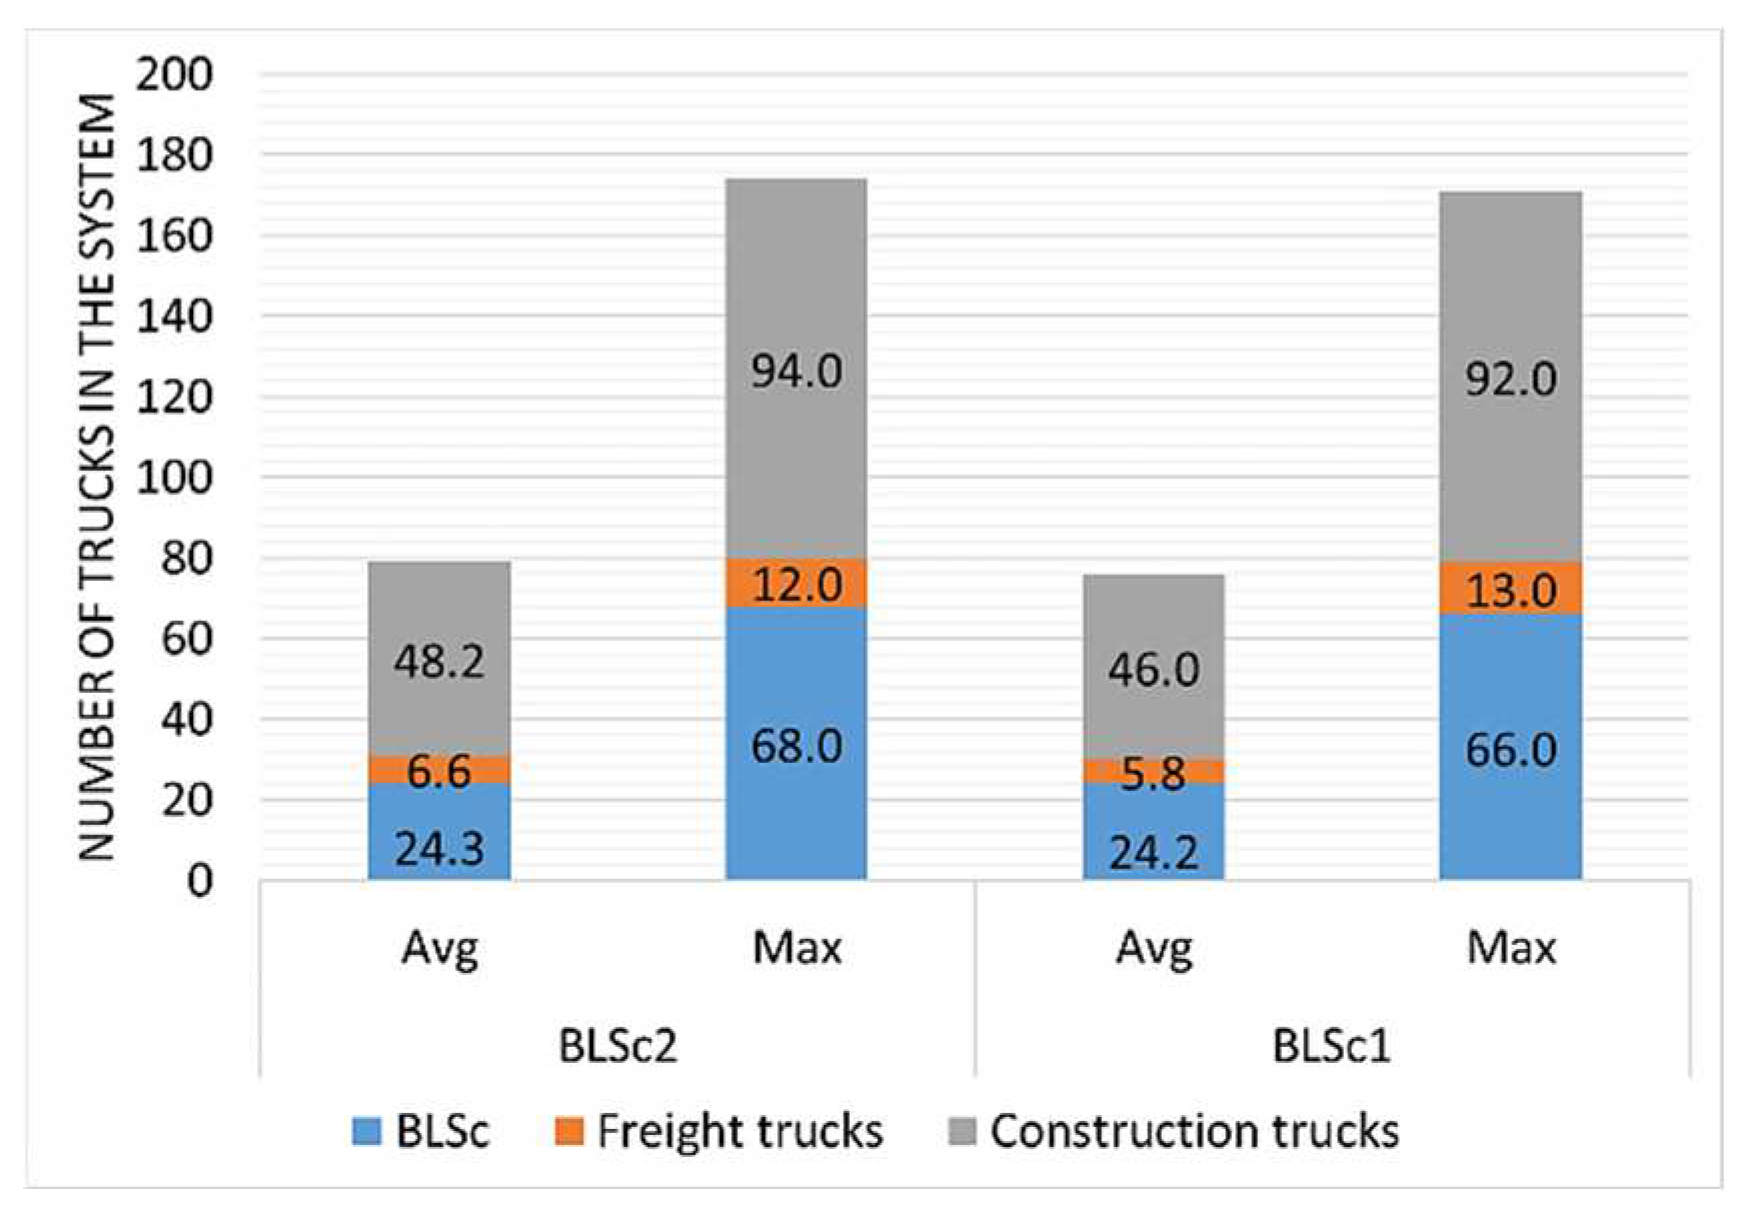
- The used capacity between the MG and SG is imbalanced. Figure 9a depicts the utilization capacity of the two access gates. The historical capacity shows that the port can accommodate more than 300 cars and 76 trucks at the same time;
- The time system is 1.23 h on average and 2.87 h as a maximum for freight trucks, while the TS is 3.38 h on average for cars;
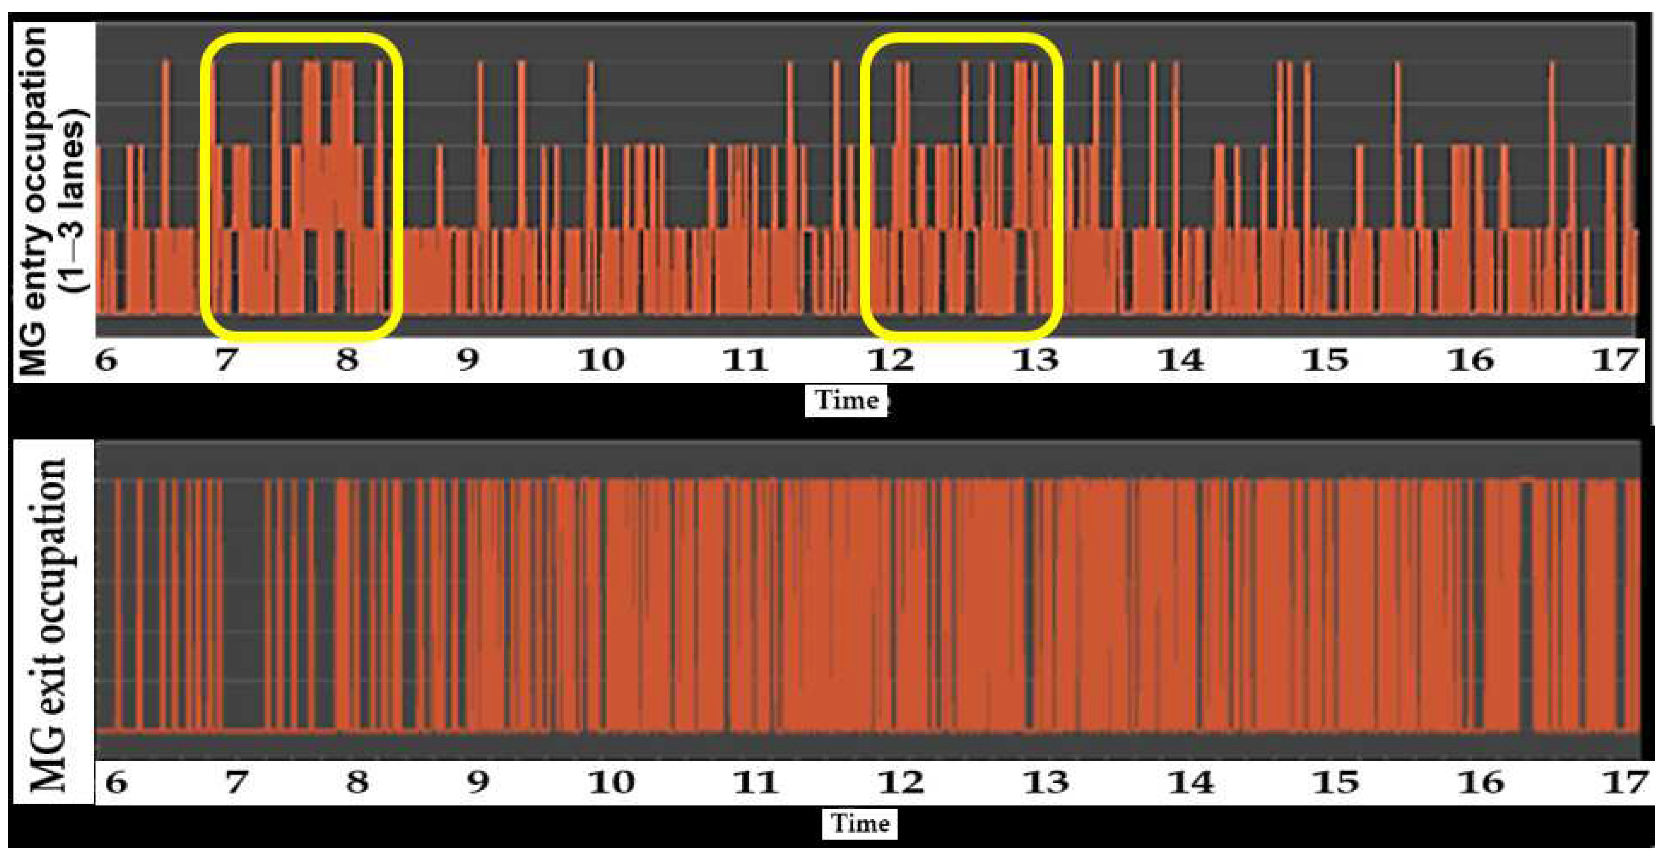
- Regarding the MG, queues at the entrance can reach up to 6 to 7 vehicles, while the maximum number of vehicles at the exit is 8 to 12 for scenarios 1 and 2. As for the SG, the maximum number of vehicles waiting to access does not exceed three, as illustrated in Figure 9b.
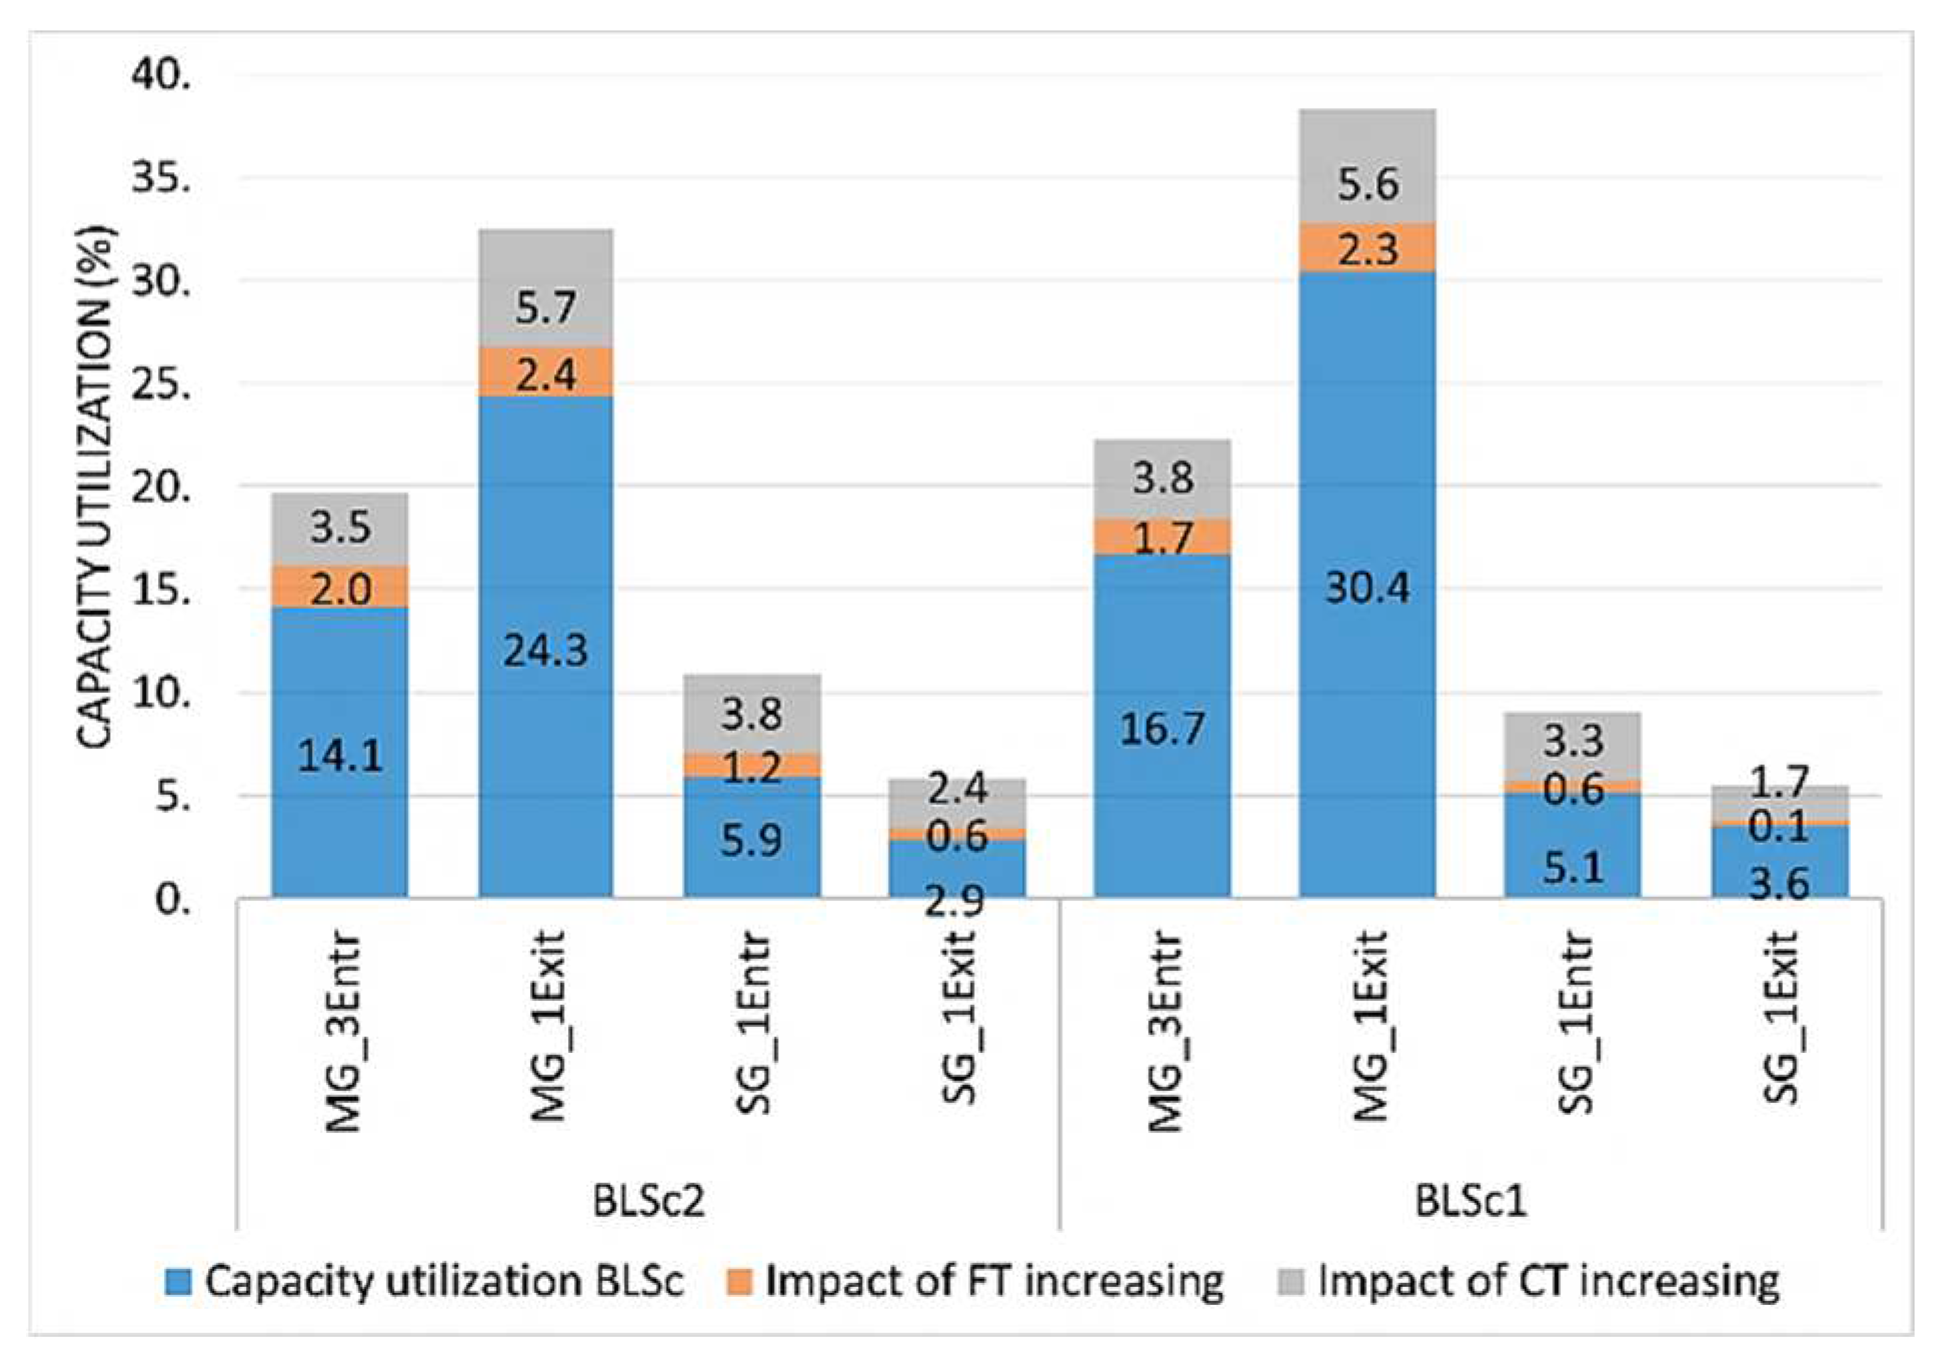
4.1.2. Results of Exploratory Scenario Analysis
Two Access Gates
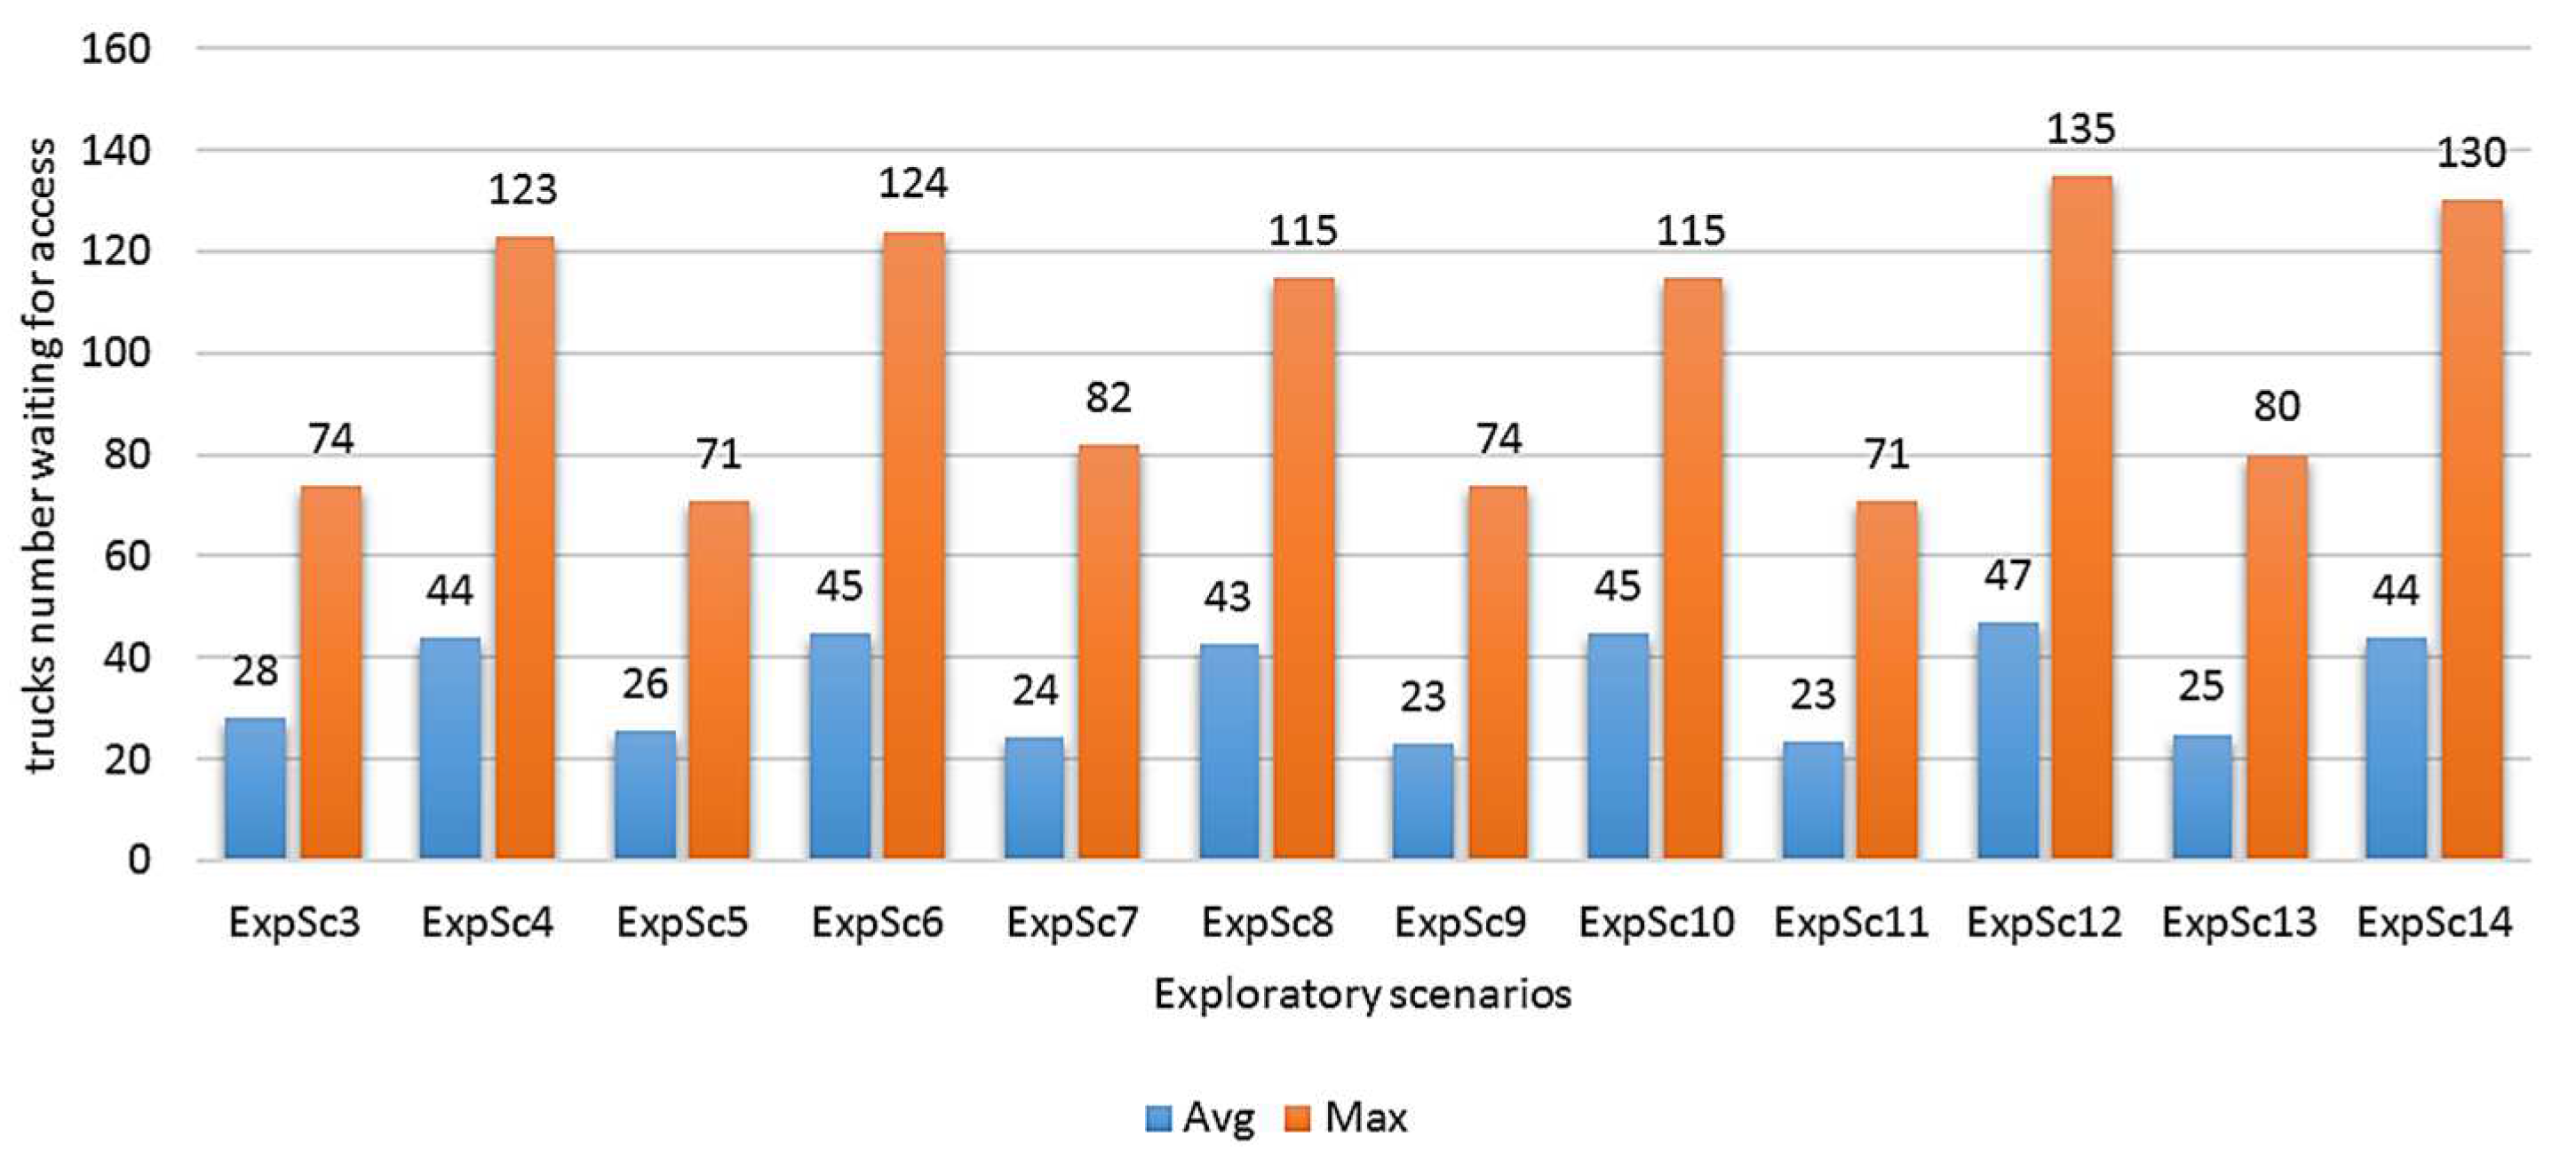
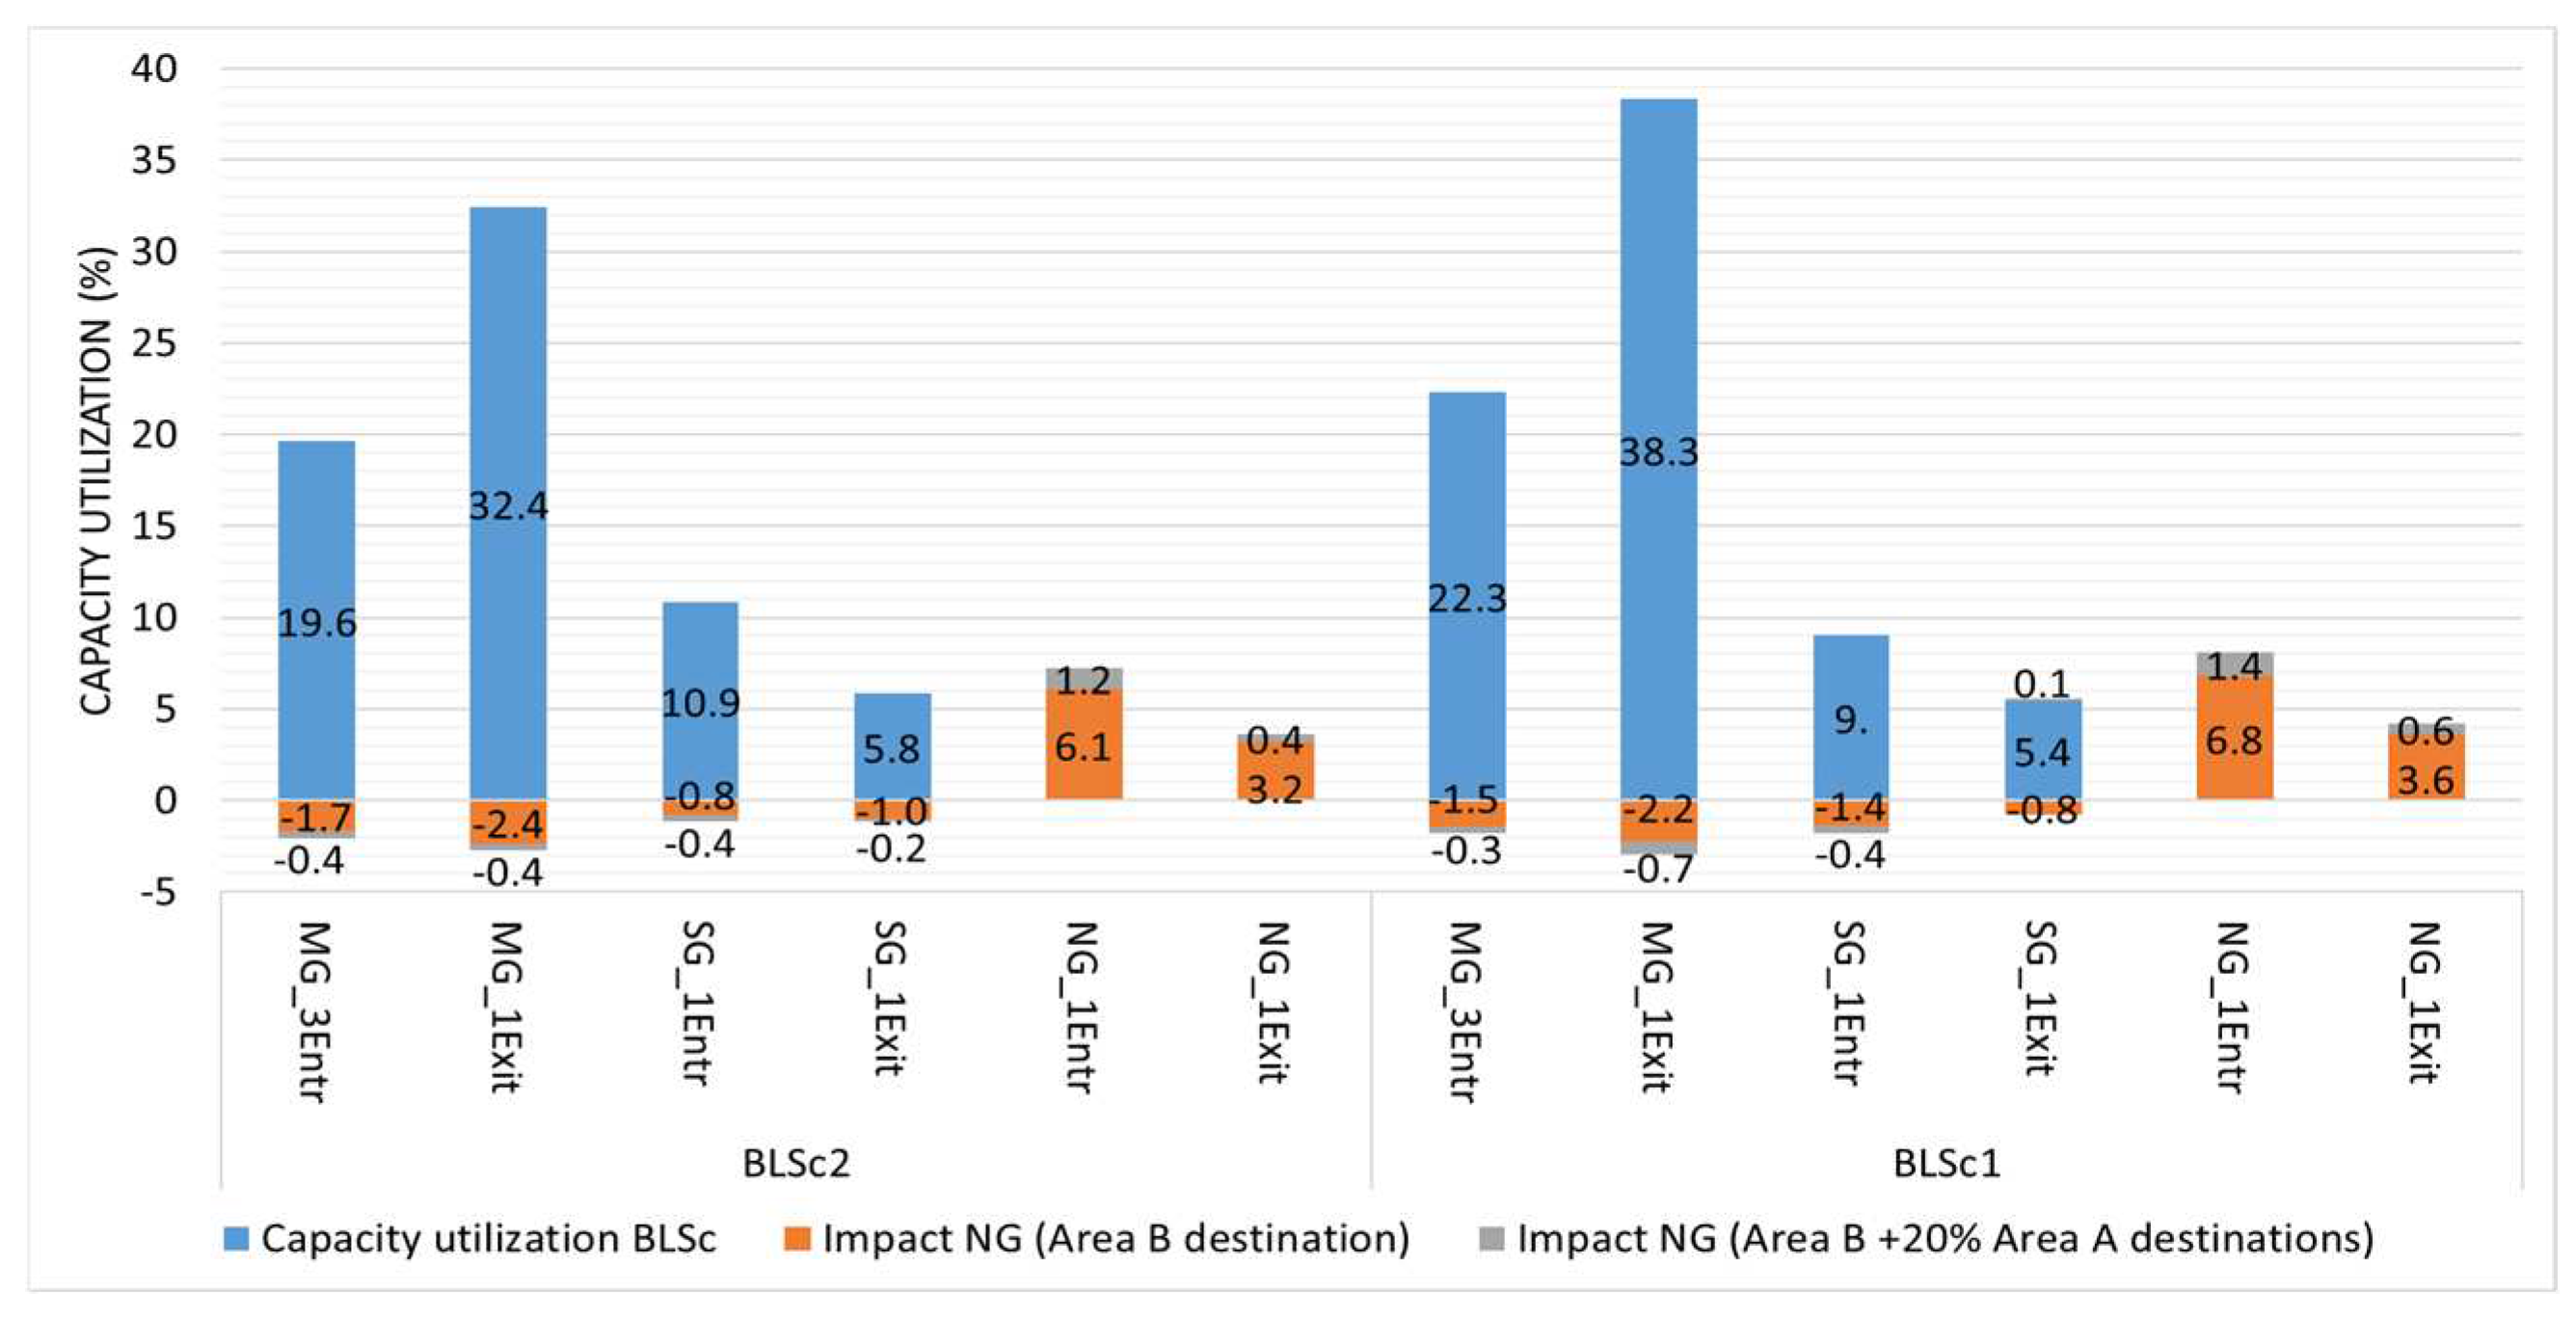
Three Gates Exploratory Scenario Analysis Results
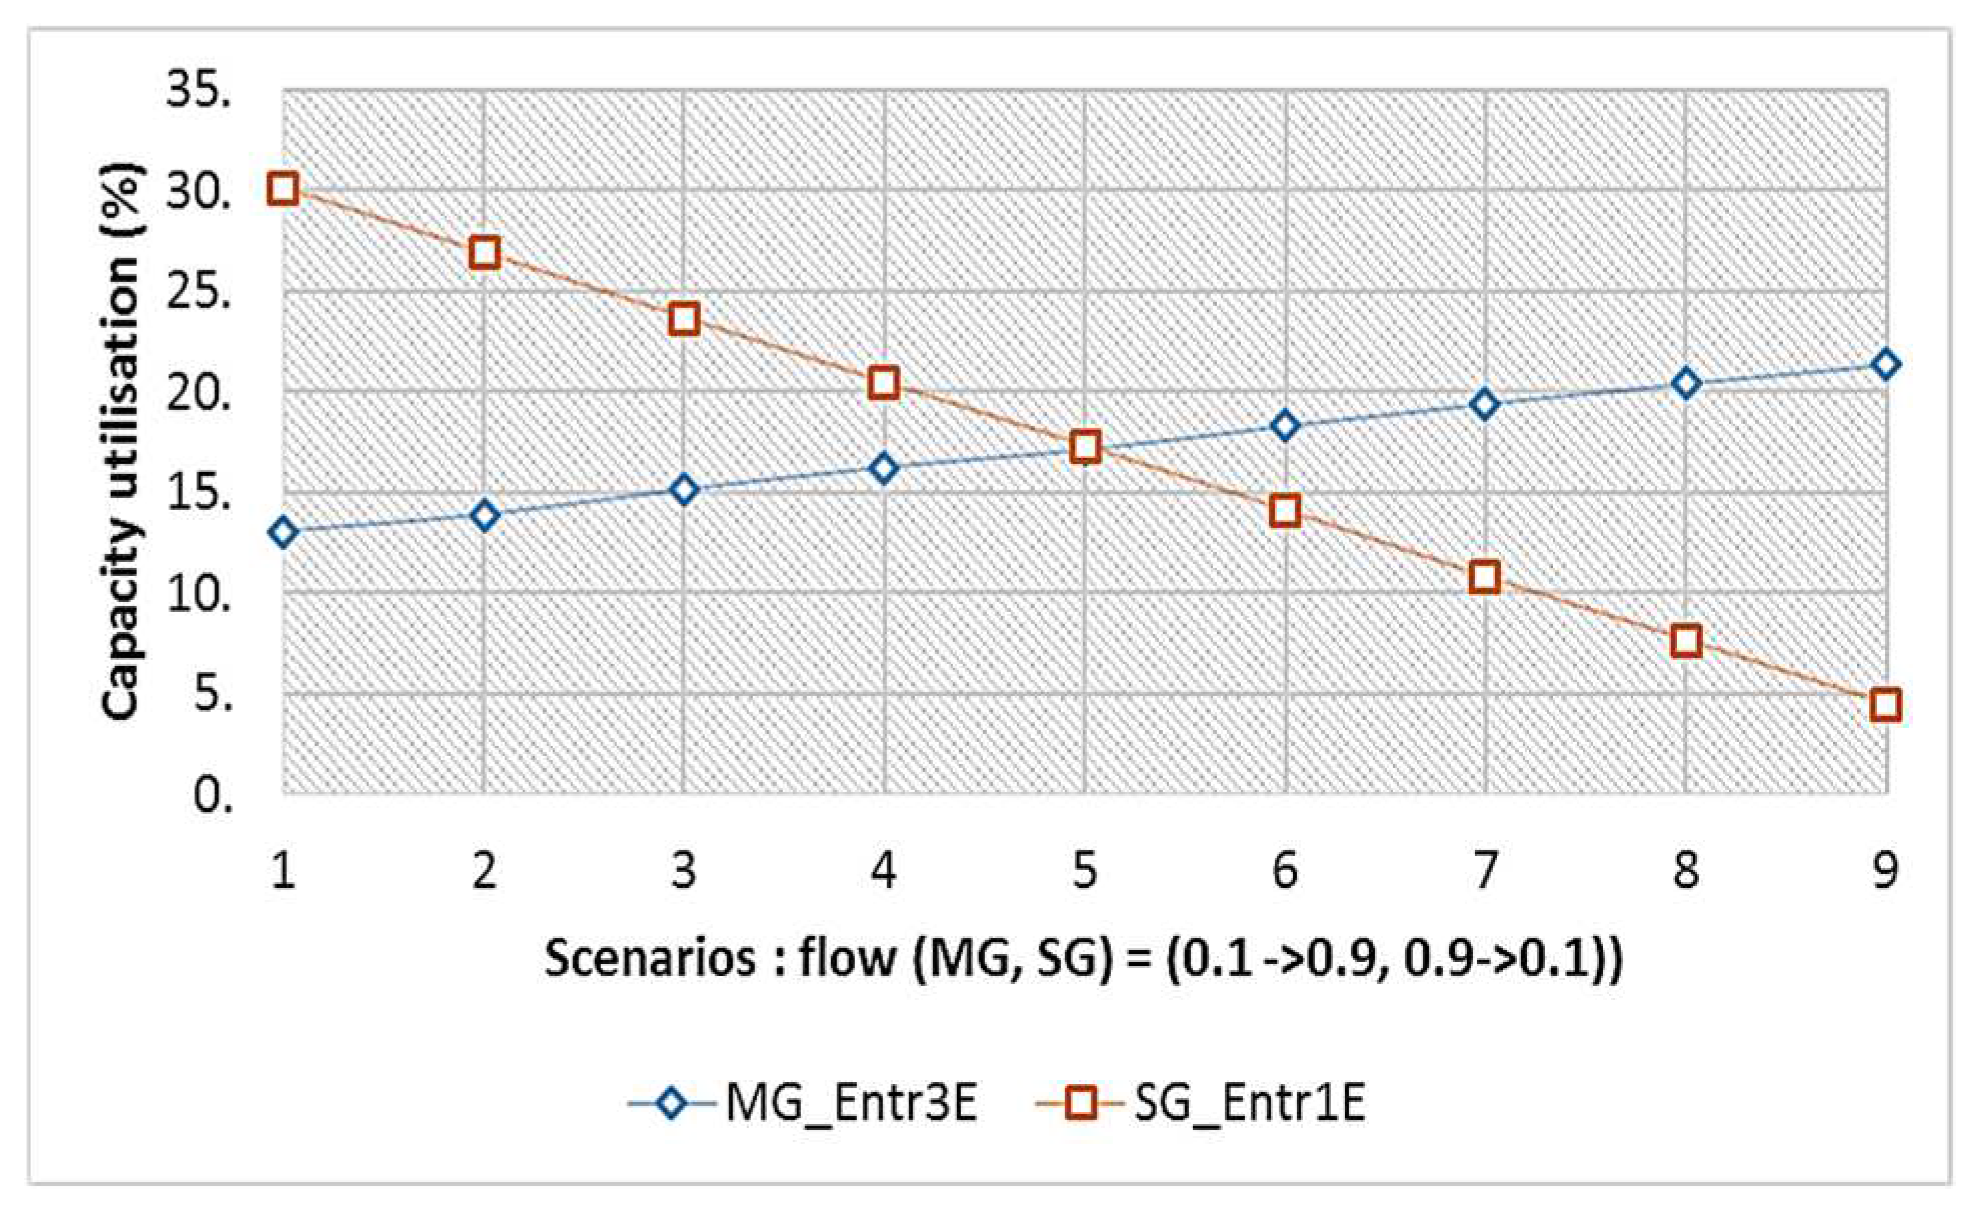
4.1.3. Analysis Results of Improvement Scenarios
4.1.4. Assessing the Resilience of Main Gate Access Flow
- Access Service Degradation Scenarios (Sc1 to Sc24 in Table 9): This set aimed to explore the effects of potential service degradation—due to adverse weather conditions, delays, registrar training, or technological failures—across 24 scenarios. By varying the degree of slowdown (from low to high) and the number of entrances (from one to three), the study sought to understand how different levels of service impairment, their frequencies, and the availability of simultaneous entrances influence access fluidity.
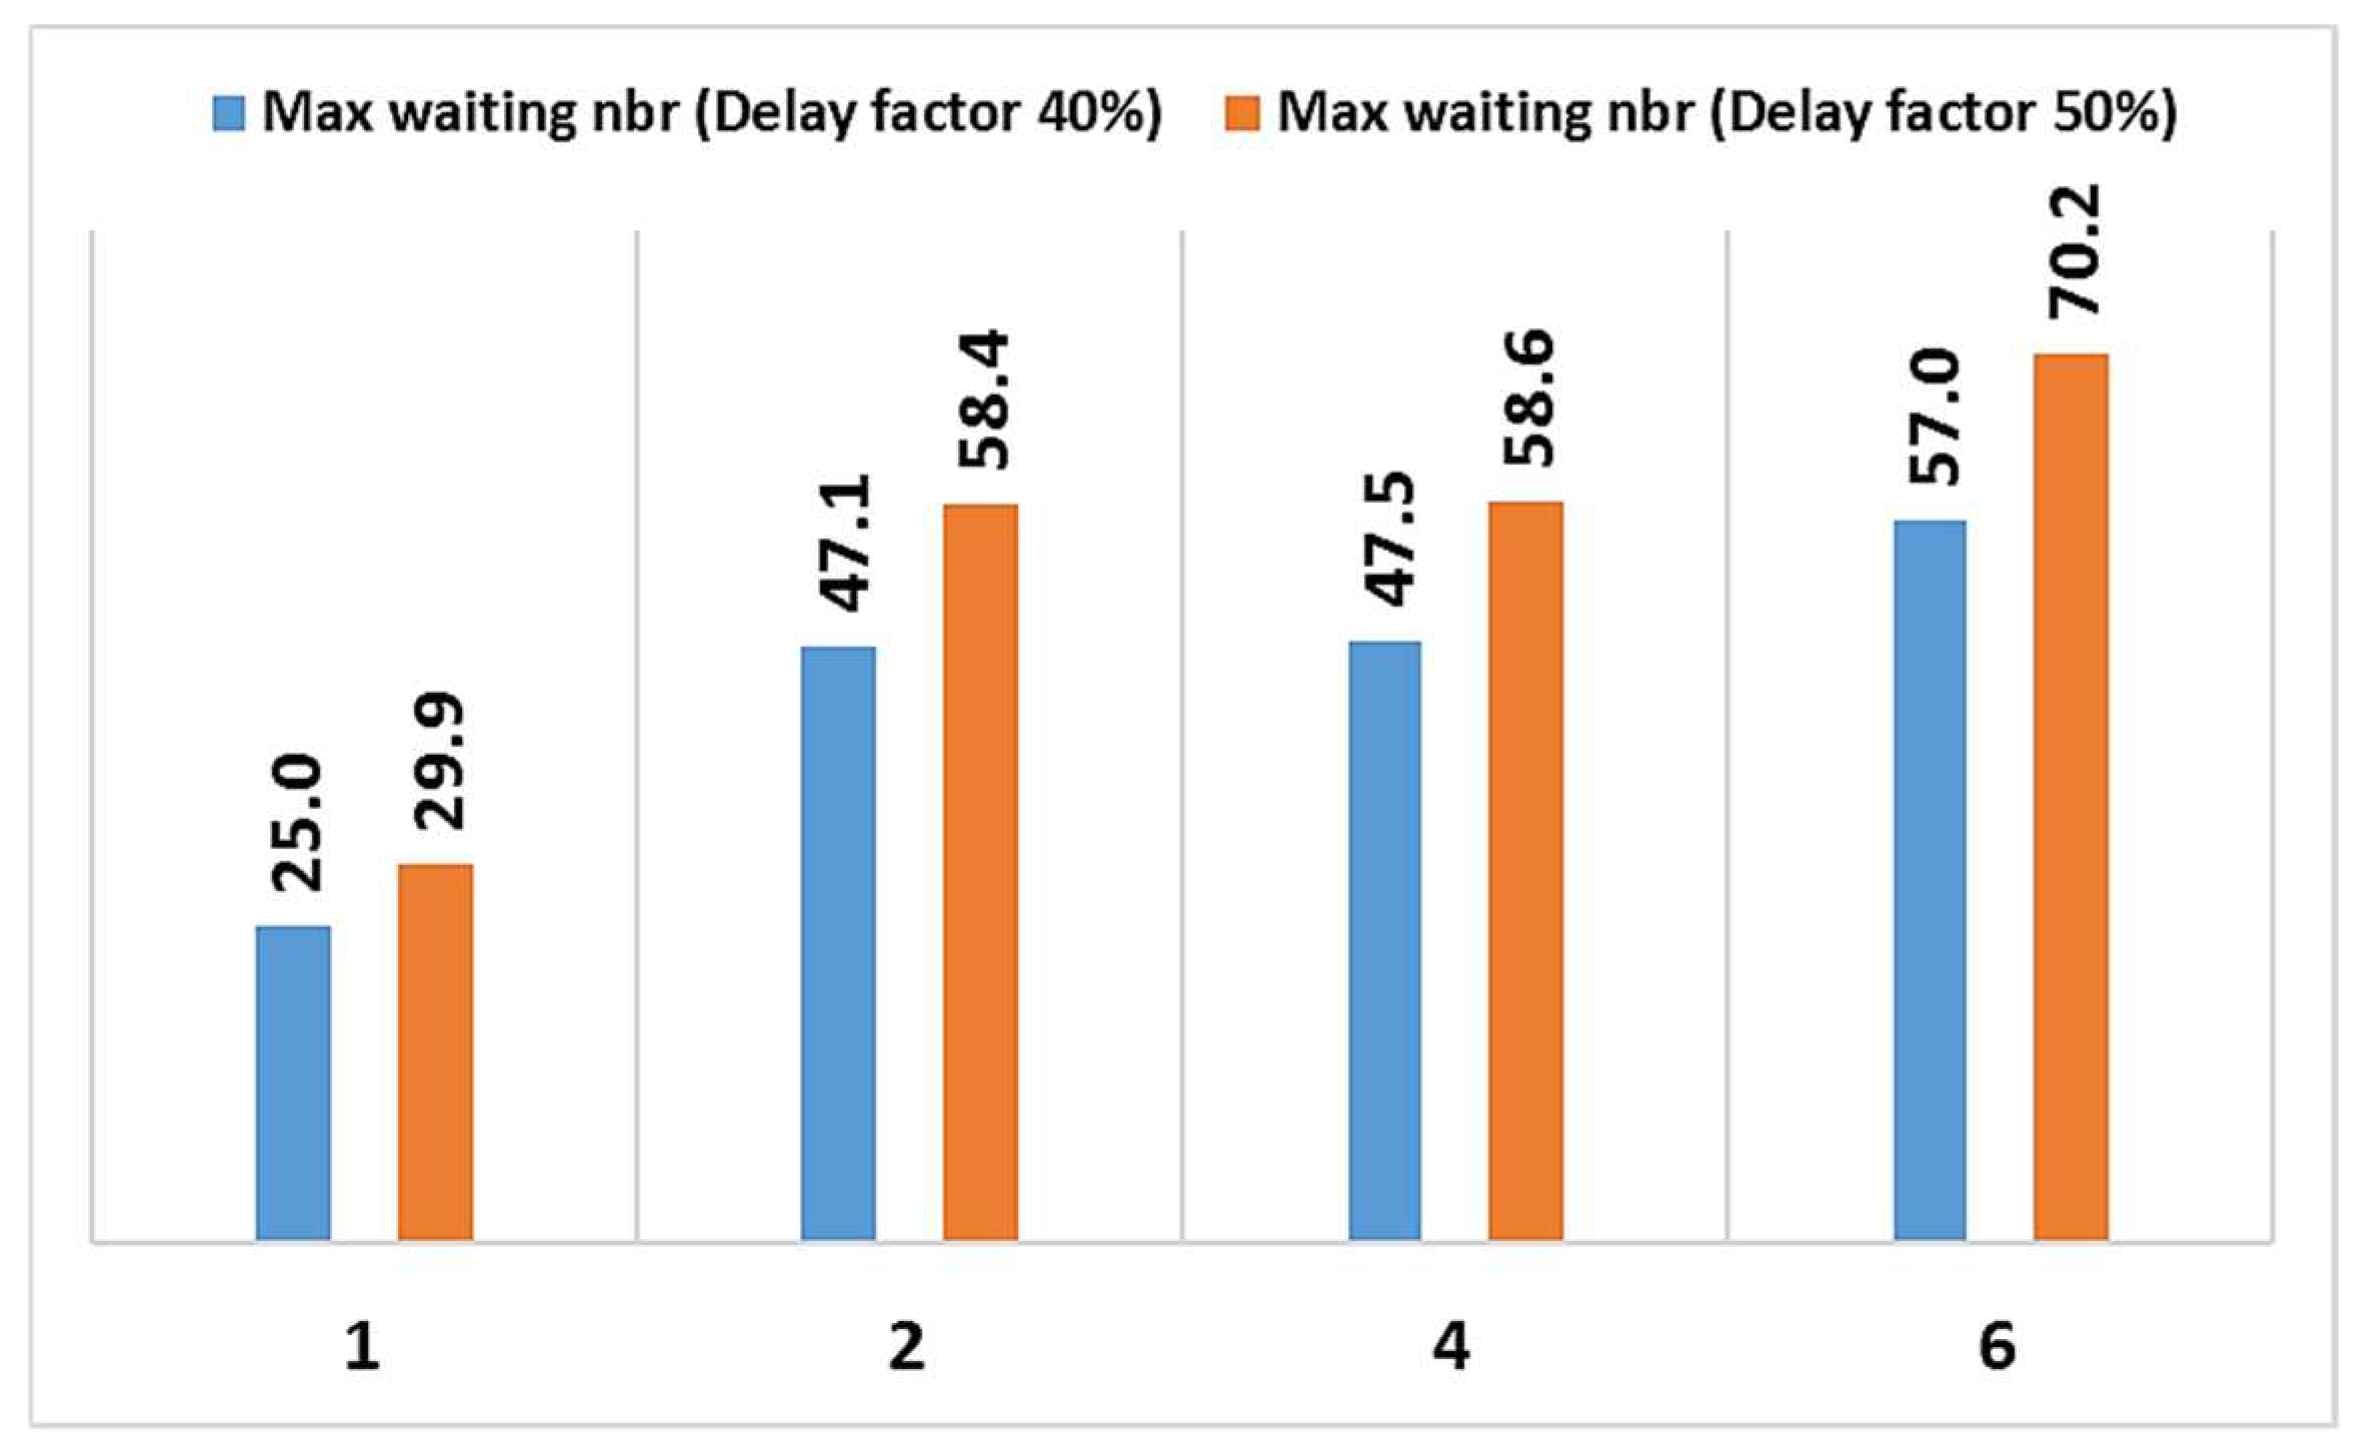
- Extreme Access Condition Scenarios (Sc25 to Sc28 and Sc33 to Sc36 in Table 9): Focused on evaluating the system under extreme conditions, this batch of eight scenarios considered operating with only one entrance available and slowdown factors of 40% and 50%, with frequencies of occurrence ranging from one to six times per hour. The objective was to examine the resilience of the access system under severe restrictions on entrance availability, high slowdown rates, and varying frequencies of these slowdowns.
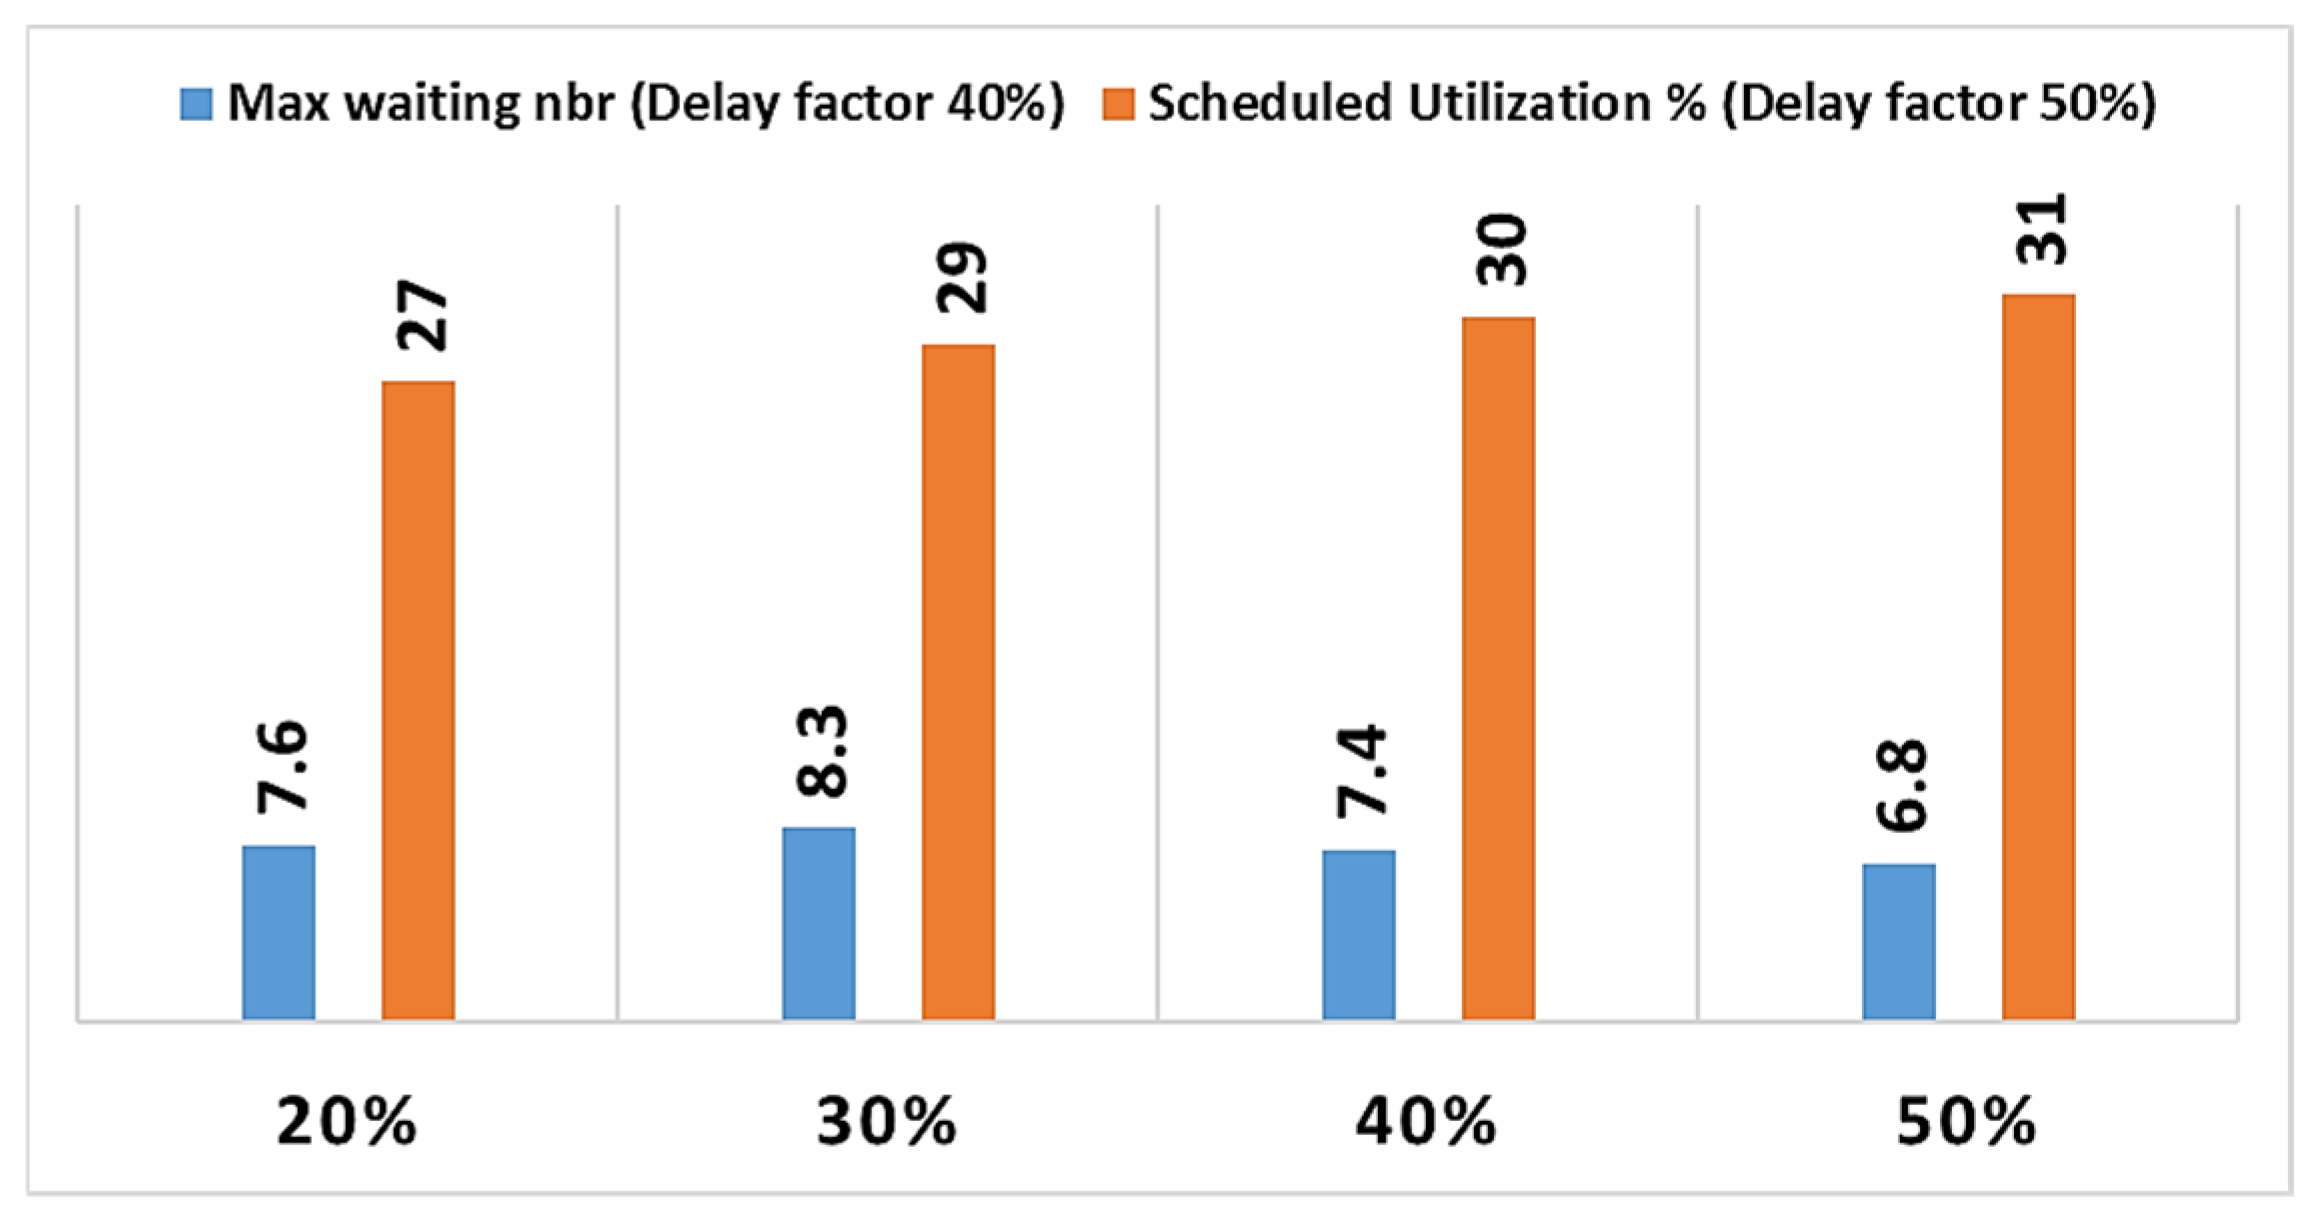
- Increased Truck Volume Scenarios (Sc29 to Sc32 in Table 9): The last four scenarios were designed to assess the effects of an unpredictable increase in truck volumes—from 20% to 50%—while dealing with significant, continuous service degradation (40%) and operating with three entrances. Given the unpredictable nature of construction activities and the potential fluctuation in truck numbers depending on the subcontractor involved, it is essential to consider how changes in truck volume could affect port access fluidity. These scenarios specifically aim to understand the potential effects of varying truck volumes on port operations and efficiency.
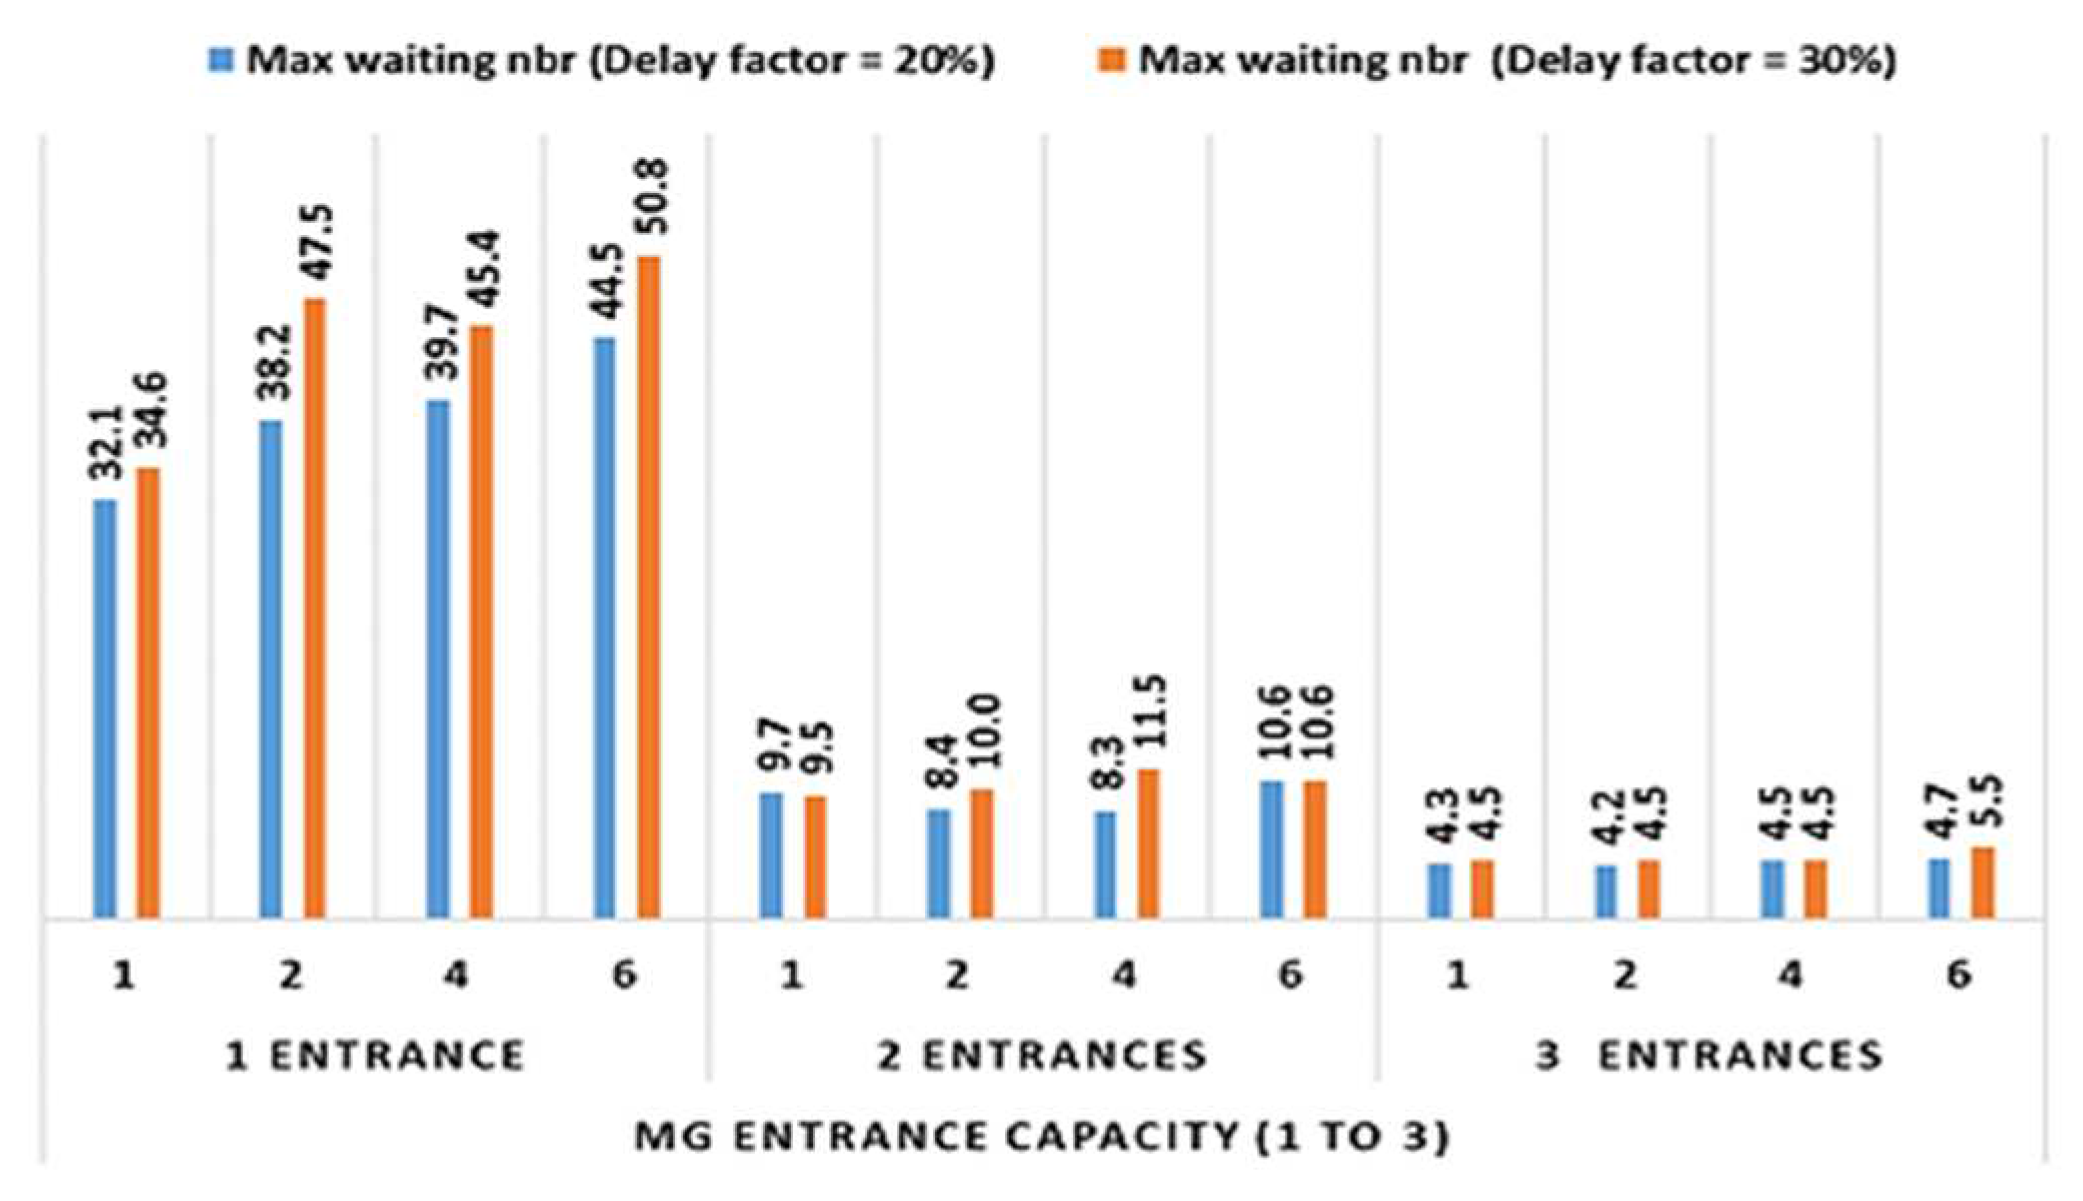
- Reducing the entrances from three to two increases capacity utilization by 50%, and decreasing to a single entrance triples the capacity used. This has a substantial impact on system fluidity, especially during peak times. Both the extent of the slowdown and its frequency lead to higher capacity use. A rise in slowdown factor from 20% to 30% results in a 5% boost in capacity utilization, as depicted in Figure 17 for a 20% delay factor.
- The adjustment from two entrances to one critically effects and can significantly disrupt access fluidity. Figure 18 shows that the peak number of waiting vehicles quintuples when comparing one entrance to two. Conversely, the quantity of waiting vehicles doubles when the number of entrances is reduced from three to two. Slowdowns in service also have a marked impact on the system’s performance.
- As shown in Figure 19, with just one entrance and high slowdown factors of 40% and 50%, the peak queue of waiting vehicles becomes notably large. An increase in the slowdown factor from 40% to 50% has a pronounced impact on the peak number of waiting vehicles, adding up to 13 more vehicles in scenarios with frequent slowdowns.
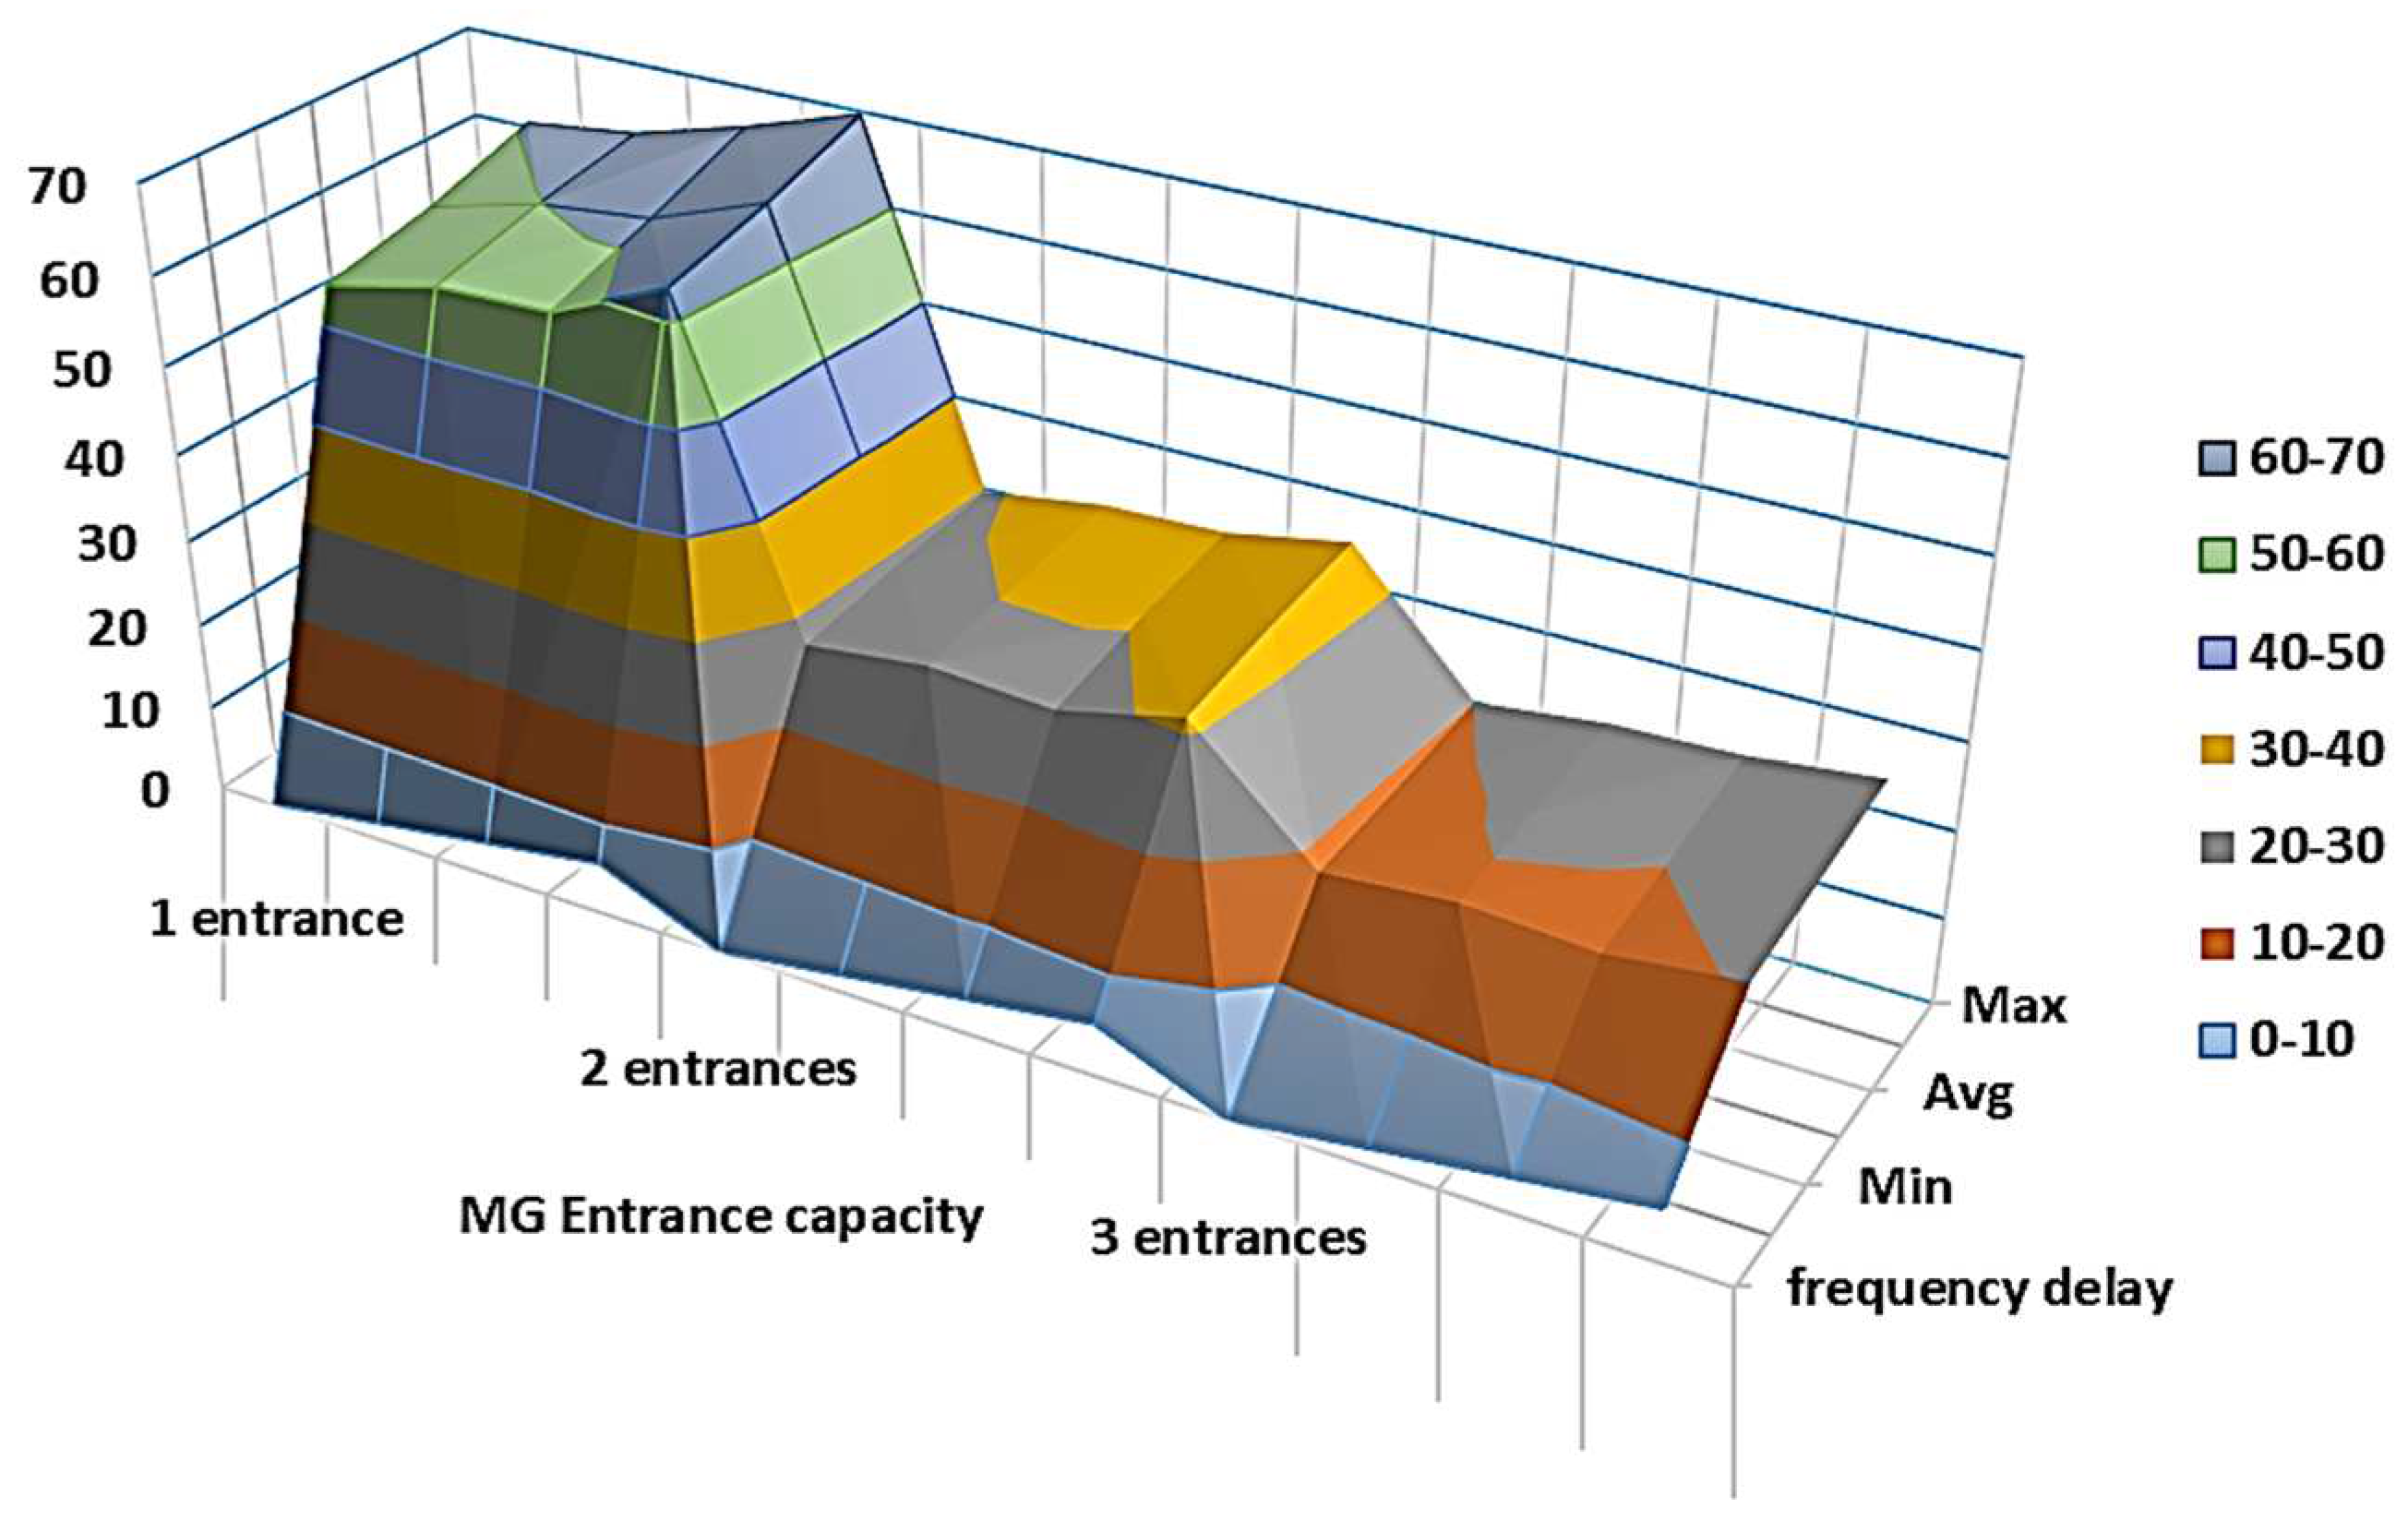
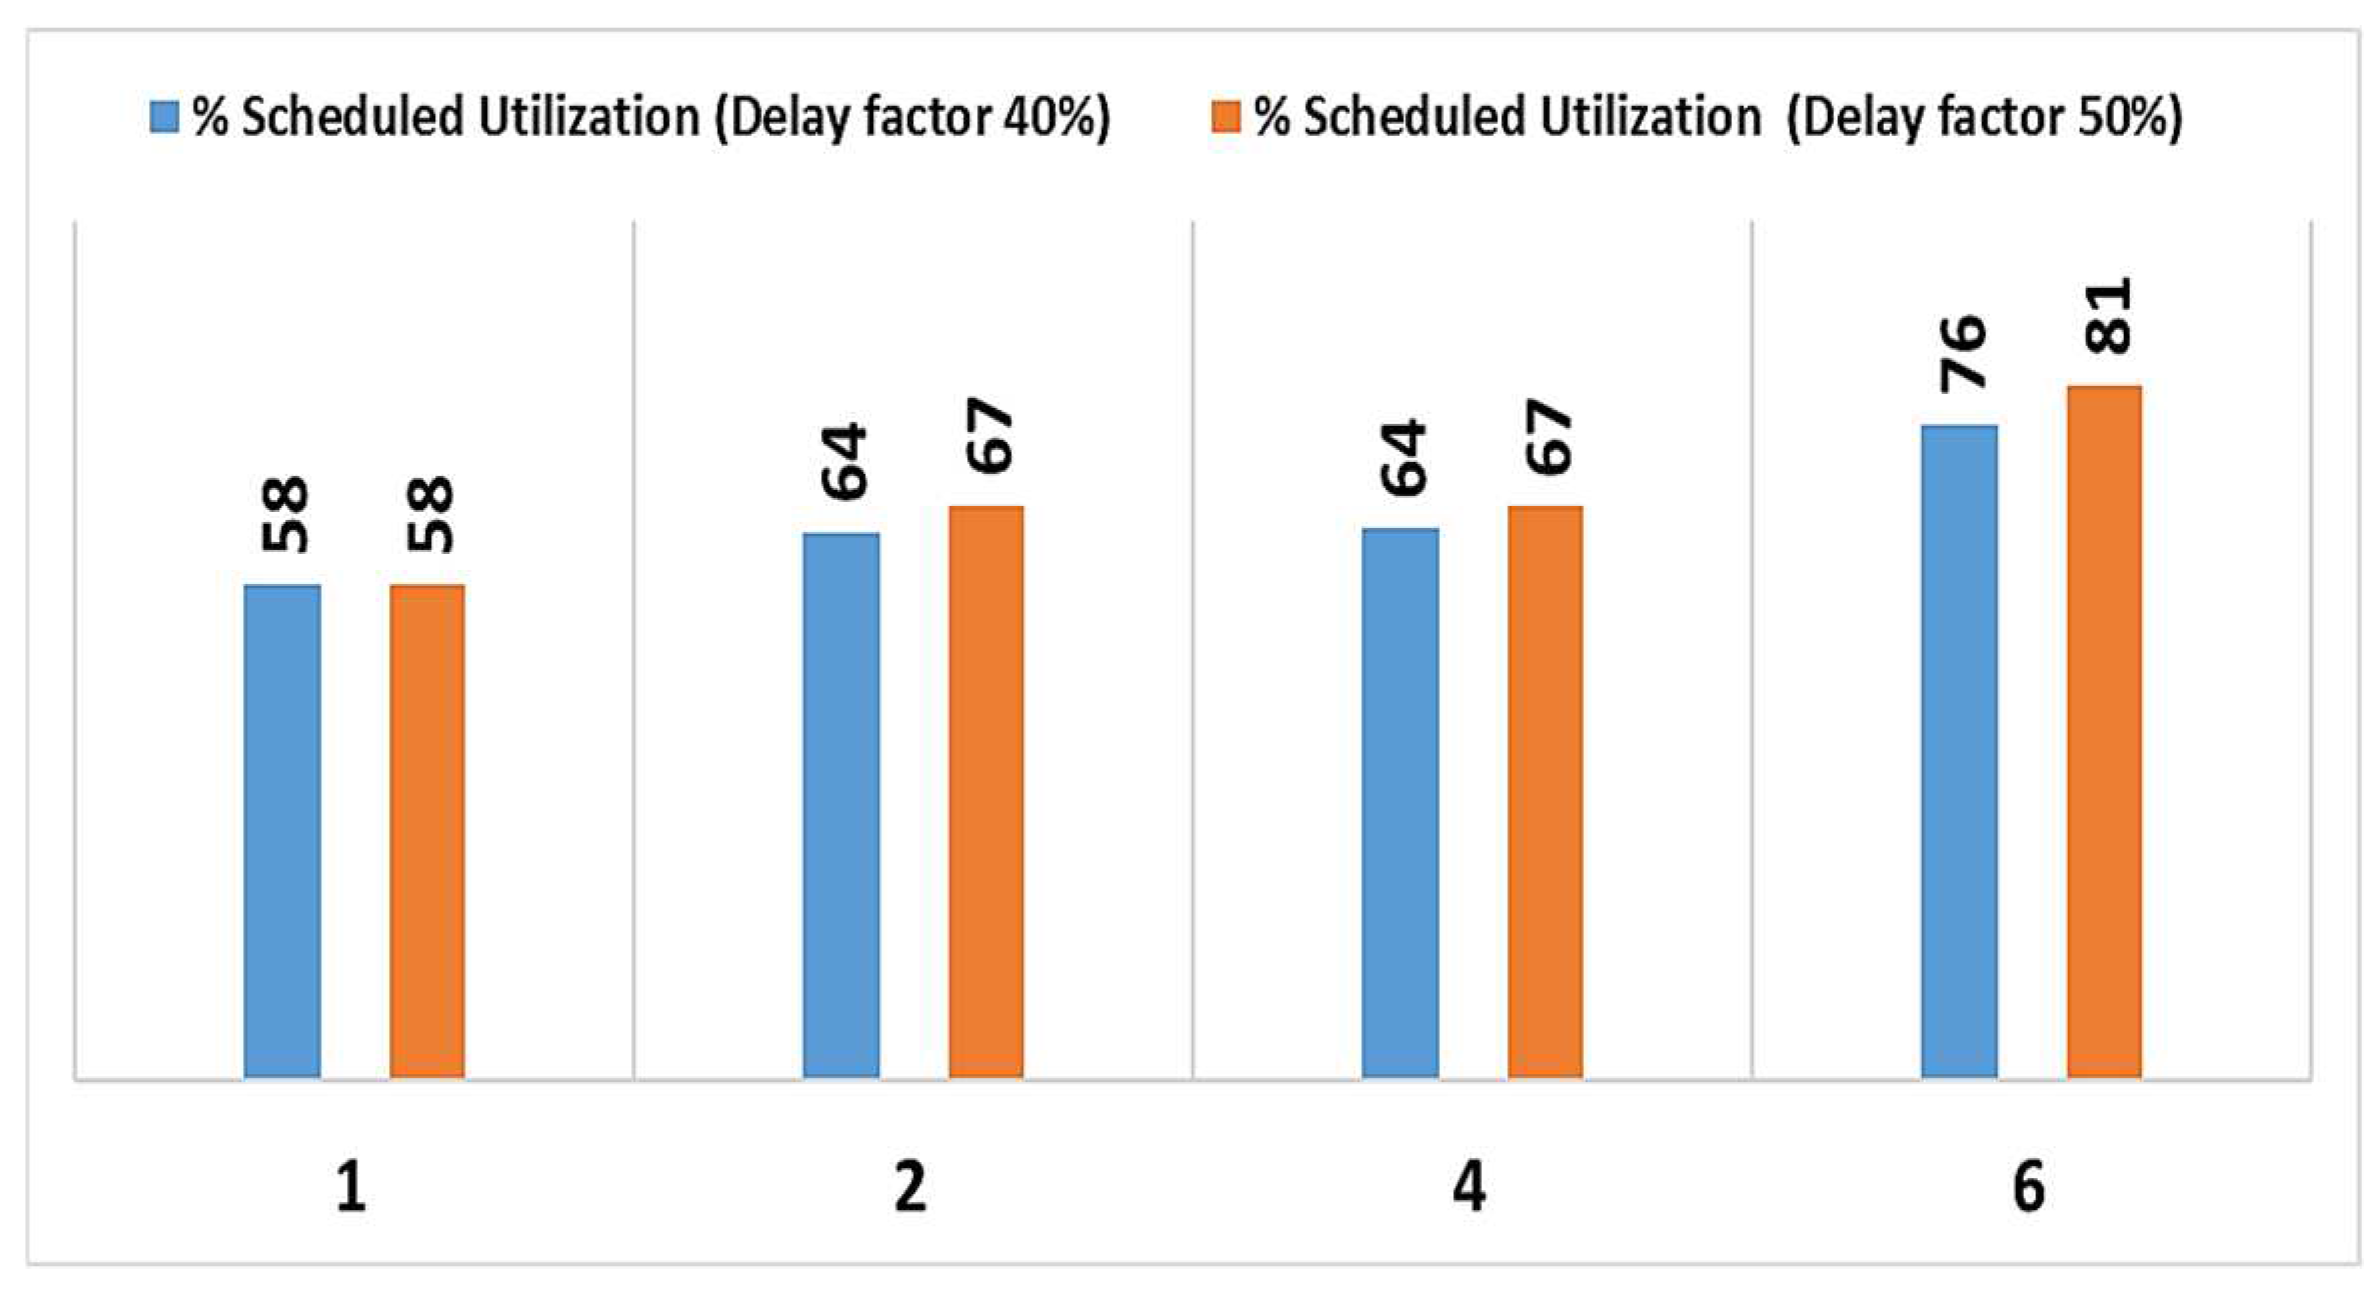
- The capacity utilization in these scenarios falls short of adequate. At a 58% utilization rate, the gate faces congestion for a significant portion of the operational time. Notably, the peak number of waiting vehicles reaches 25 with a 40% slowdown occurring once every hour for a duration of 10 min. Figure 20 highlights the utilization rates of the MG.
4.2. Discussion
4.2.1. Summary of Key Findings in Relation to the Study’s Objectives
4.2.2. Discussion of Study Limitations and Methodological Challenges
- Regarding the data, selecting the historical period between 2017 and 2019 may not accurately reflect the current traffic behavior at the port. However, the projection of an increase in the number of freight trucks during the construction period was provided by the industrial partner based on an internal study.
- The distribution of trucks between zones is historically accurate in terms of the overall number provided by the partner. However, the allocation of 55% of the trucks to zones was approached randomly, using a significant number of replications to minimize errors. Applying more sophisticated models, especially Machine Learning or Deep Learning models that can perform supervised classification by training on the 45% of well-categorized data, could improve this.
- Assuming the truck’s registration time in historical data as its arrival time may obscure actual queue times at the moment of registration. While addressing this issue may not be straightforward, we used reference scenarios relative to the busiest contexts to mitigate the effects of this assumption. The queue time and number results were confirmed by the industrial partner as being close to reality, lending further confidence to our findings.
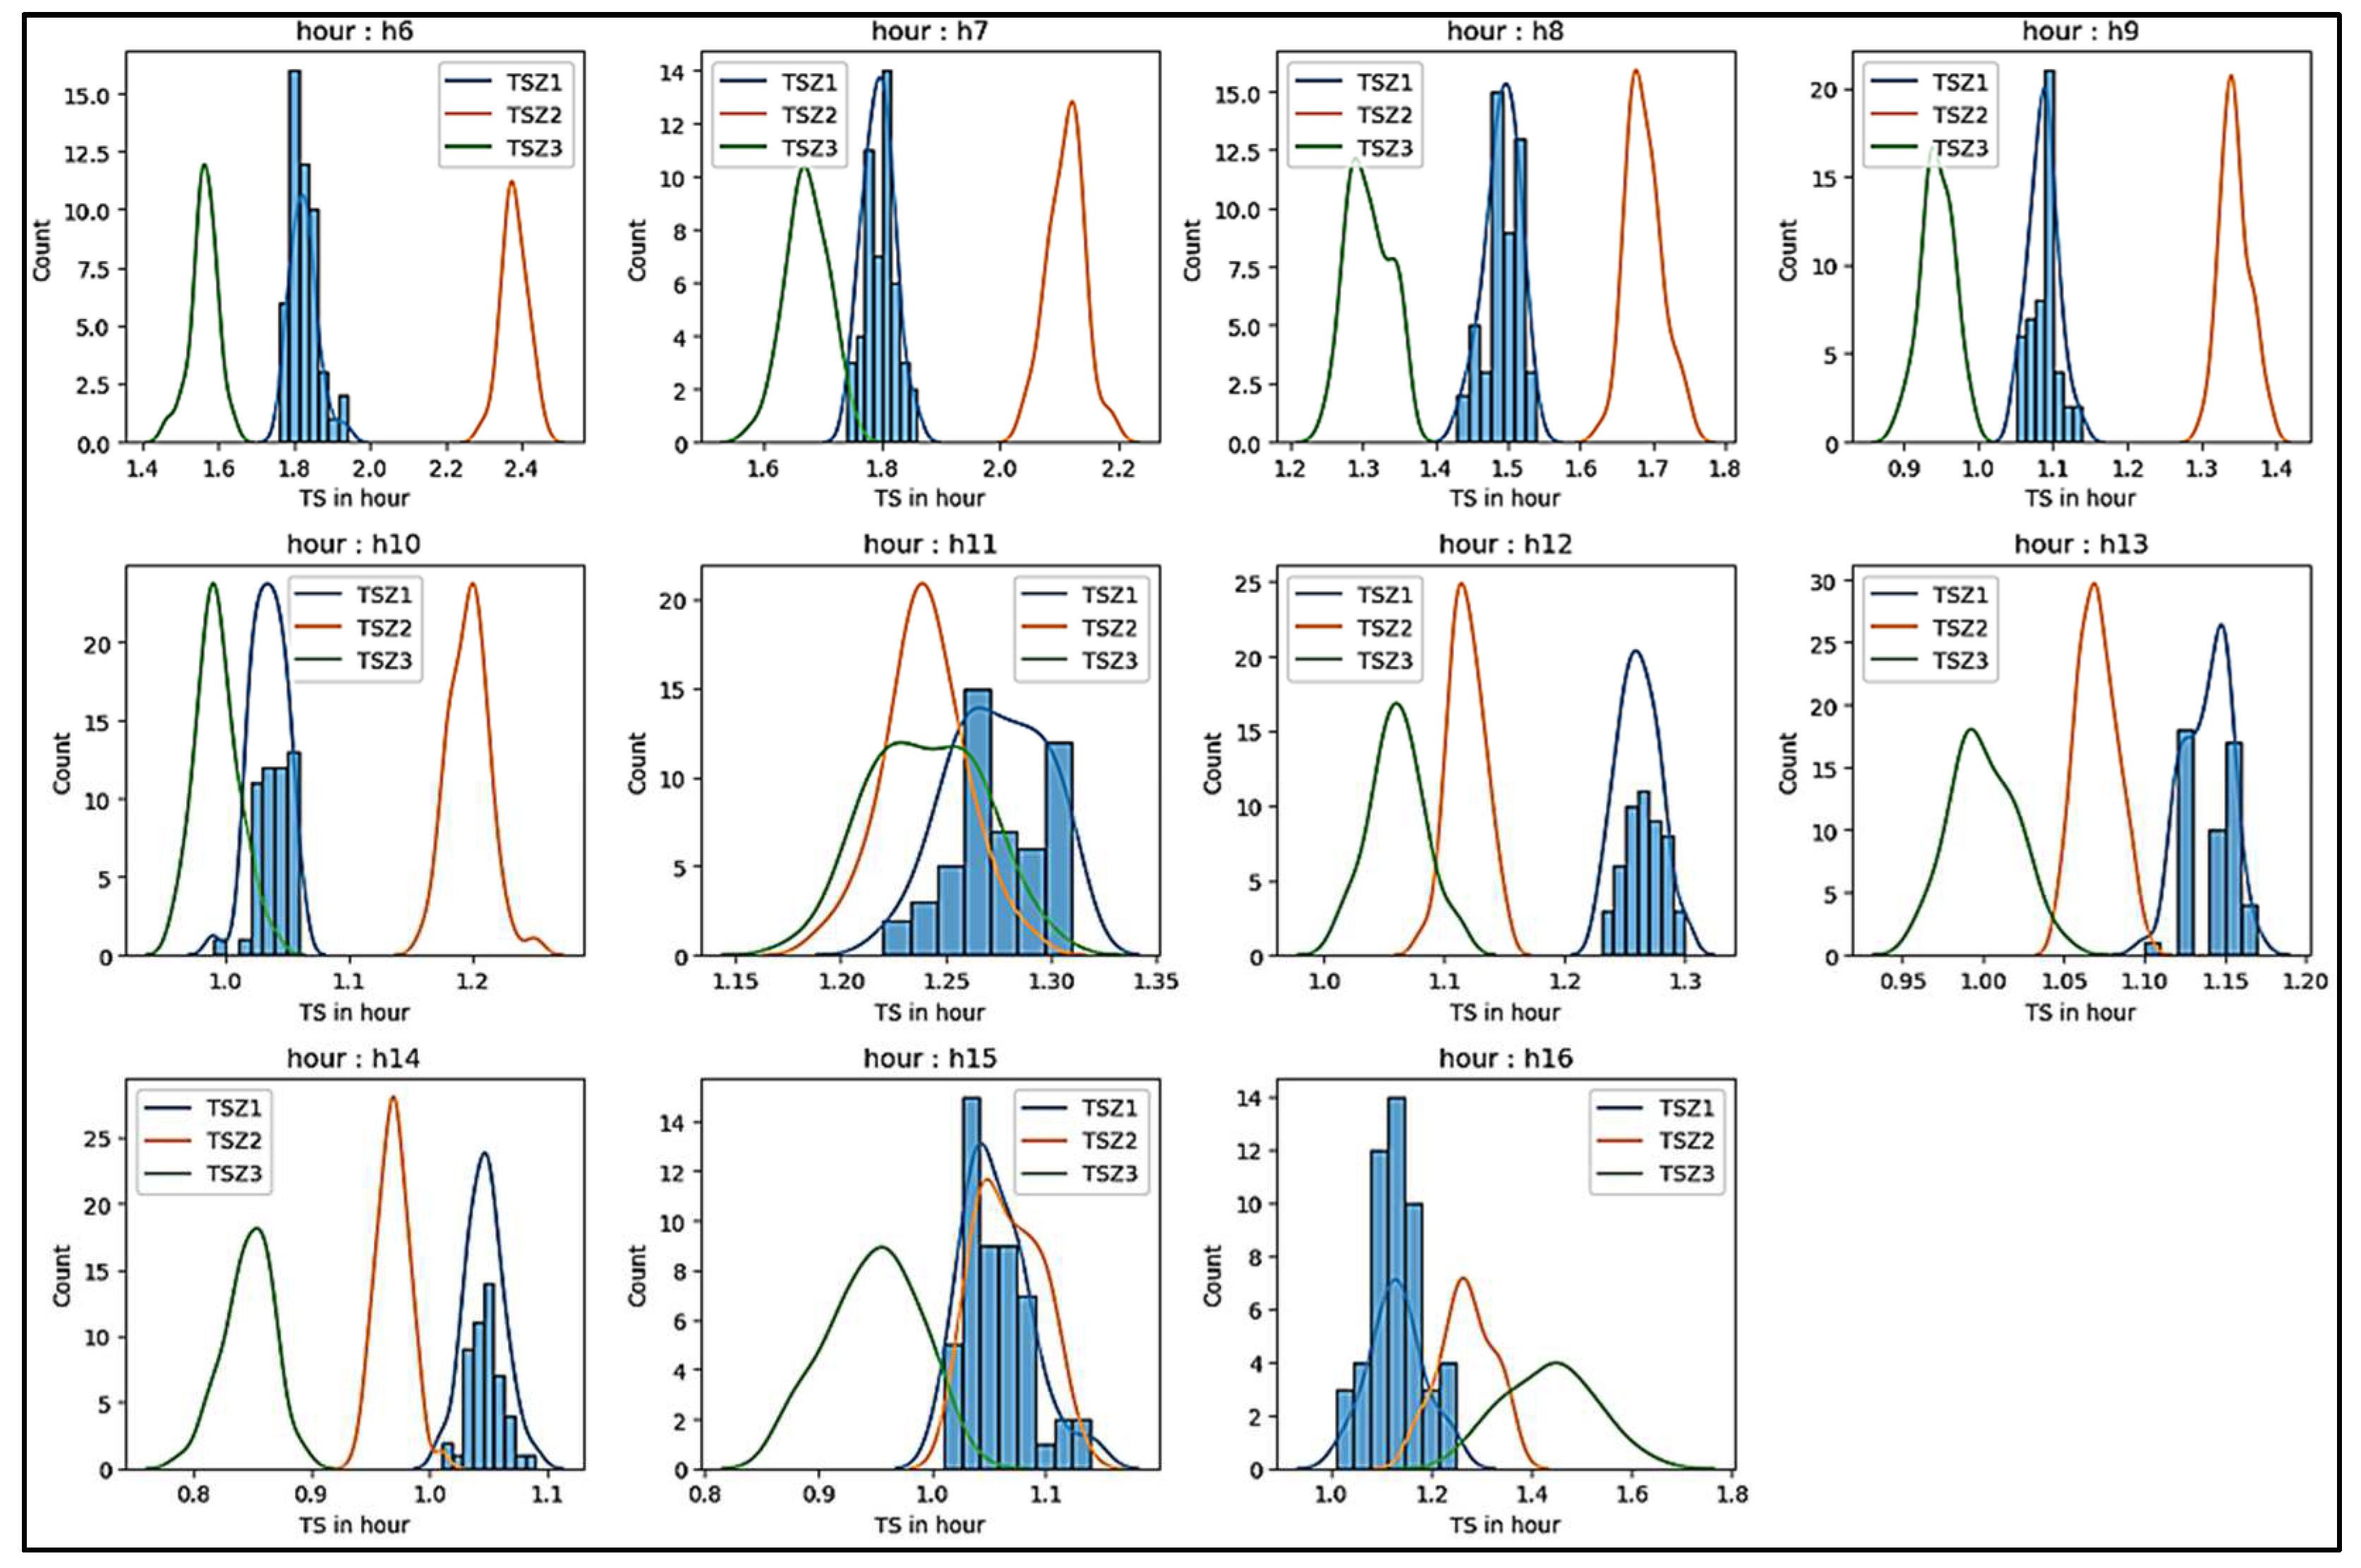
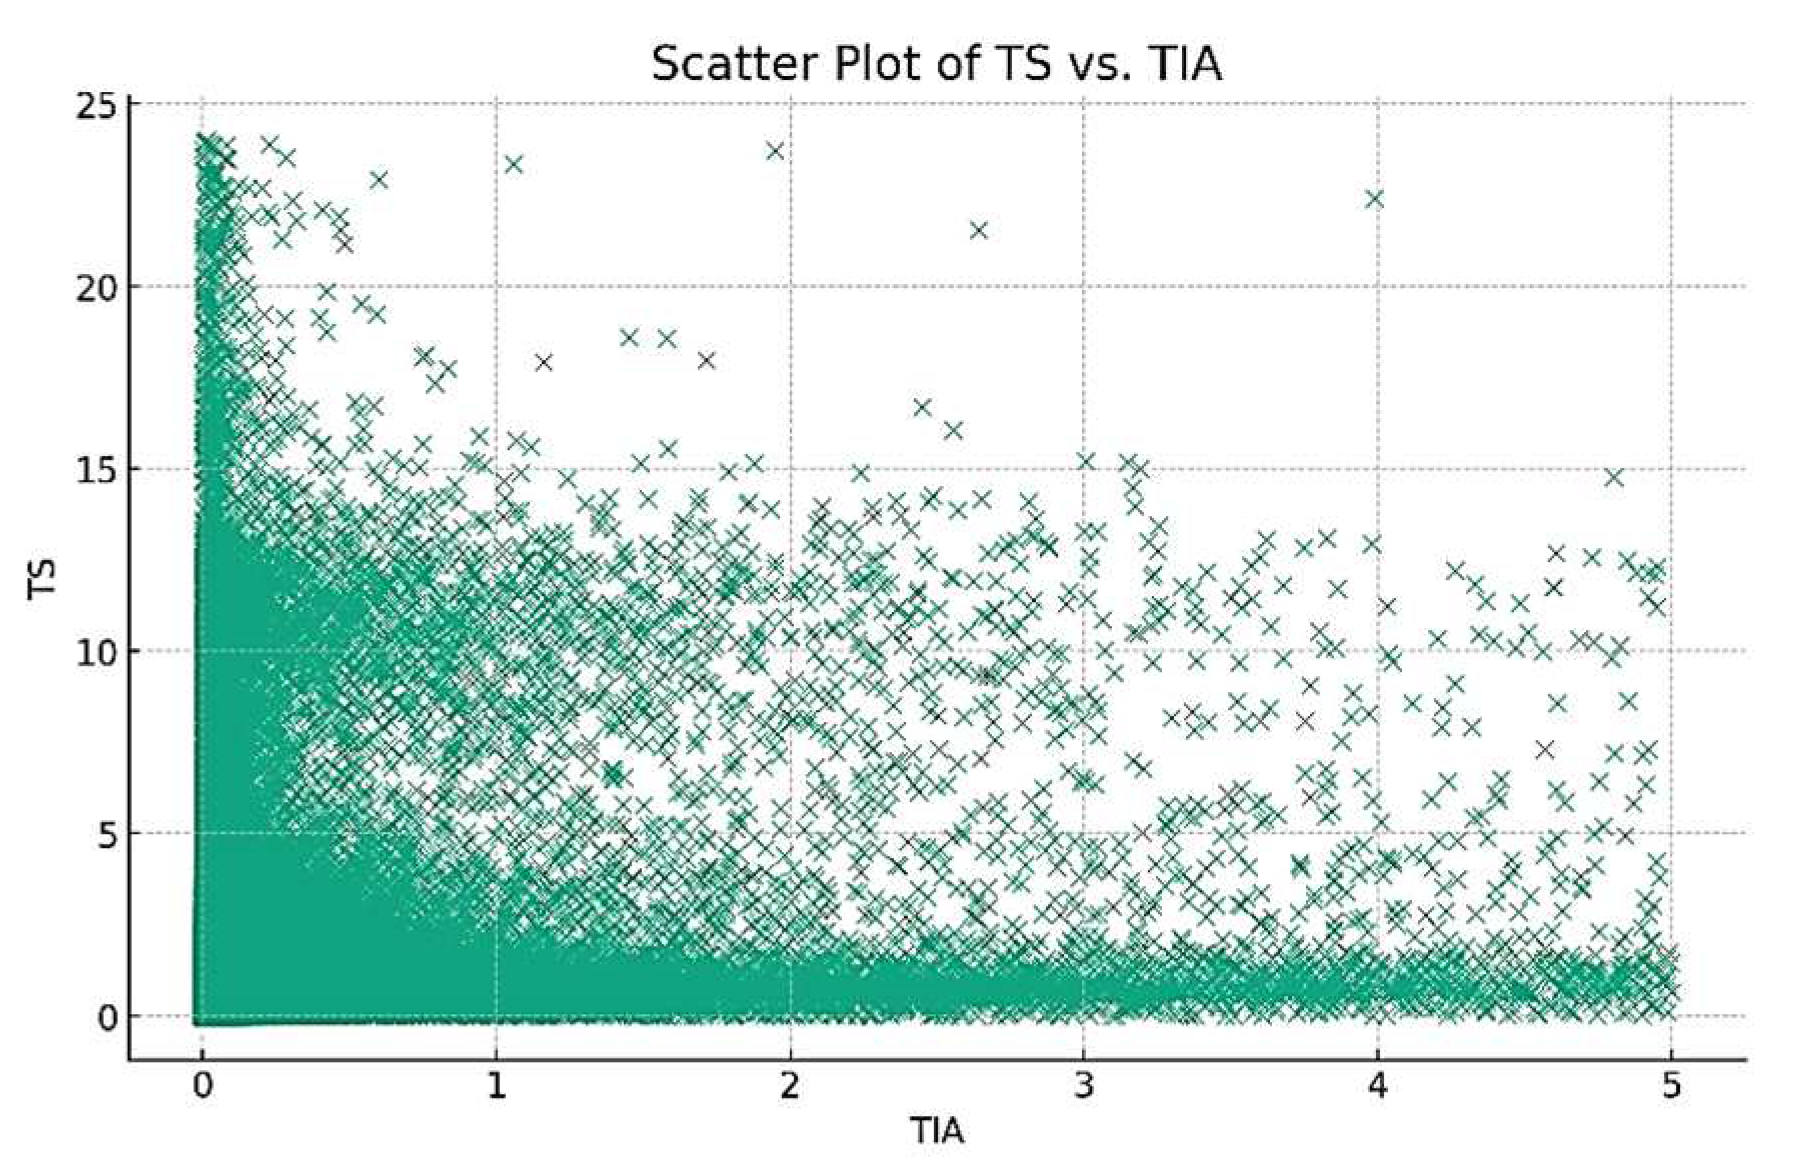
- The freight truck TS negatively correlates with the IAT, as previously demonstrated. This context was corrected by adopting TS per hour to reflect this correlation. However, the experiments focusing on scenarios with an increased number of trucks did not consider how this increase affects the throughput TS. Yet, the industrial partner believes that profitability constraints, aimed at reducing the trucks’ dwell time in the port, ensure that the service level remains managed. This uncertainty may create a slight shift in truck exit times. An AI-based model could more accurately determine the correlation between TS and service level, which would allow for better management of truck exit times.
- Our simulation model validation involved 44 replicas, meaning a day would be simulated over 44 days for the simulation parameters to converge towards their average. However, we did not set a Seed for the experiments, which could slightly increase the uncertainty of the results. This increase should not compromise the analyses, especially since the stochastic parameters converge to an uncertainty of less than 2%. Similarly, during validation, we carried out 44 validation replicas in the experiments for each of the 10 replicas allocated to each scenario, with a warm-up time of 10 h before starting the experiments. Khondaker [32] incorporates the Seed factor into the study to mitigate the impact of randomness on the simulation outcomes. Using different Seed values and averaging results help stabilize outcomes and reduce the impact from stochastic parameters, particularly when some converge with notable uncertainty.
- Another limitation related to the proposed solutions arises from the nature of our research (applied research). Being practically oriented and aimed at addressing a specific issue through active collaboration with our industrial partner, our focus was on devising solutions that are not only feasible but also align with the partner’s constraints and capabilities to ensure implementability.
4.2.3. Comparative Analysis with Recent Studies
- Regarding Infrastructure Investment
- Regarding the Management of Access from Existing Infrastructure
- -
- Truck Arrival Scheduling or Appointment System
- -
- Cooperation and Synchromodality
- -
- Collaboration Between Urban and Port Authorities and Road Network Centrality Management
- New Trends in Logistics Planning
5. Conclusions
Author Contributions
Funding
Institutional Review Board Statement
Informed Consent Statement
Data Availability Statement
Acknowledgments
Conflicts of Interest
References
- Zhang, Q.; Wang, W.; Guo, Z.; Zhang, J. Evolution of Port Ecological Carrying Capacity Based on SD Model. In Proceedings of the 2016 International Conference on Computational Intelligence and Applications (ICCIA), Jeju, Republic of Korea, 27–29 August 2016; pp. 78–82. [Google Scholar] [CrossRef]
- Meersman, H.; Van De Voorde, E. Port Capacity Extension. A Trade-Off Between Public Investment and Shipping Companies’ Time Losses; Working Papers, 2014009; University of Antwerp, Faculty of Business and Economics: Antwerp, Belgium, 2014. [Google Scholar]
- Ricard, N. Il est décédé d’une manière subite et inattendue: Les enquêtes du coroner du district judiciaire de Trois-Rivières, 1850–1950. Rev. Hist. Am. Fr. 2019, 72, 69–93. [Google Scholar] [CrossRef]
- Cermakian, J. L’Infrastructure et le trafic du port de Trois-Rivières. Cah. Géographie Québec 1972, 17, 171–191. [Google Scholar] [CrossRef]
- Fleming, M.; Huynh, N.; Xie, Y. Agent-Based Simulation Tool for Evaluating Pooled Queue Performance at Marine Container Terminals. Transp. Res. Rec. J. Transp. Res. Board 2013, 2330, 103–112. [Google Scholar] [CrossRef]
- Kulkarni, K.; Tran, K.T.; Wang, H.; Lau, H.C. Efficient gate system operations for a multipurpose port using simulation-optimization. In Proceedings of the 2017 Winter Simulation Conference (WSC), Las Vegas, NV, USA, 3–6 December 2017; pp. 3090–3101. [Google Scholar] [CrossRef]
- Maneno, F.H. Assessment of Factors Causing Port Congestion: A Case of the Port Dar es Salaam. Master’s Thesis, World Maritime University, Malmo, Sweden, 2019. [Google Scholar]
- Guan, C.Q.; Liu, R. Modeling Gate Congestion of Marine Container Terminals, Truck Waiting Cost, and Optimization. Transp. Res. Rec. 2009, 2100, 58–67. [Google Scholar] [CrossRef]
- Palmer, J.G., Jr.; Mcleod, M.; Leue, M.C. Simulation modeling of traffic access for port planning. Transp. Res. Circ. 1996, 459, 180–186. [Google Scholar]
- Dragović, B.; Tzannatos, E.; Park, N.K. Simulation modelling in ports and container terminals: Literature overview and analysis by research field, application area and tool. Flex. Serv. Manuf. J. 2016, 29, 4–34. [Google Scholar] [CrossRef]
- Vadlamudi, J.C. How a Discrete Event Simulation Model can Relieve Congestion at a RORO Terminal Gate System: Case Study: RORO Port Terminal in the Port of Karlshamn. Master’s Thesis, Faculty of Computing, Blekinge Institute of Technology, Karlskrona, Sweden, 2016. [Google Scholar]
- Chamchang, P.; Niyomdecha, H. Impact of service policies on terminal gate efficiency: A simulation approach. Cogent Bus. Manag. 2021, 8, 1975955. [Google Scholar] [CrossRef]
- Li, B.; Tan, K.W.; Tran, K.T. Traffic simulation model for port planning and congestion prevention. In Proceedings of the 2016 Winter Simulation Conference (WSC), Arlington, VI, USA, 11–14 December 2016; pp. 2382–2393. [Google Scholar] [CrossRef]
- Kemp, M. Simulation Model of Smart Port; Bentham Books: Potomac, MD, USA, 2022; pp. 102–129. [Google Scholar] [CrossRef]
- Lakhmas, E.A.K. Using the AIS Data to enhance smart port congestion optimizing model Subtitle as needed (paper subtitle). Turk. J. Comput. Math. Educ. TURCOMAT 2021, 12, 1592–1599. [Google Scholar] [CrossRef]
- Kourounioti, I.; Polydoropoulou, A. Application of aggregate container termi-nal data for the development of time-of-day models predicting truck arrivals. Eur. J. Transp. Infrastruct. Res. 2018, 18. [Google Scholar] [CrossRef]
- Lange, A.-K.; Schwientek, A.K.; Jahn, C. Reducing truck congestion at ports—Classification and trends. In Digitalization in Maritime and Sustainable Logistics: City Logistics, Port Logistics and Sustainable Supply Chain Management in the Digital Age Proceedings of the Hamburg International Conference of Logistics (HICL); epubli GmbH: Berlin, Germany, 2017; Volume 24, pp. 37–58. [Google Scholar] [CrossRef]
- Potgieter, L. Risk Profile of Port Congestion: Cape Town Container Terminal Case Study. Ph.D. Thesis, Stellenbosch University, Stellenbosch, Sweden, 2016. [Google Scholar]
- Abu Aisha, T.; Ouhimmou, M.; Paquet, M. Optimization of Container Terminal Layouts in the Seaport—Case of Port of Montreal. Sustainability 2020, 12, 1165. [Google Scholar] [CrossRef]
- Huynh, N.; Walton, C.M. Improving Efficiency of Drayage Operations at Sea-port Container Terminals Through the Use of an Appointment System. In Handbook of Terminal Planning, Operations Research/Computer Science Interfaces Series; Böse, J.W., Ed.; Springer: New York, NY, USA, 2011; pp. 323–344. [Google Scholar] [CrossRef]
- Chen, G.; Govindan, K.; Yang, Z.-Z.; Choi, T.-M.; Jiang, L. Terminal appointment system design by non-stationary M(t)/Ek/c(t) queueing model and genetic algorithm. Int. J. Prod. Econ. 2013, 146, 694–703. [Google Scholar] [CrossRef]
- Torkjazi, M. New Models for Truck Appointment Problem and Extensions. Ph.D. Thesis, University of South Carolina, Columbia, SC, USA, 2020. [Google Scholar]
- Ramírez-Nafarrate, A.; González-Ramírez, R.G.; Smith, N.R.; Guerra-Olivares, R.; Voß, S. Impact on yard efficiency of a truck appointment system for a port terminal. Ann. Oper. Res. 2017, 258, 195–216. [Google Scholar] [CrossRef]
- Goudreau, É. Analyses des Impacts de l’Implantation d’un Système de Ren-dez-Vous Sur le Trafic Routier Dans un Port Manutentionnant des Produits non Conte-Neurisés. Master’s Thesis, Université du Québec à Trois-Rivières, Trois-Rivières, Canada, 2018. [Google Scholar]
- Guo, X.; Huang, S.Y.; Hsu, W.J.; Low, M.Y.H. Dynamic yard crane dispatching in container terminals with predicted vehicle arrival information. Adv. Eng. Inform. 2011, 25, 472–484. [Google Scholar] [CrossRef]
- Kim, K.; Lee, K.; Hwang, H. Sequencing delivery and receiving operations for yard cranes in port container terminals. Int. J. Prod. Econ. 2003, 84, 283–292. [Google Scholar] [CrossRef]
- Moszyk, K.; Deja, M.; Dobrzynski, M. Automation of the Road Gate Operations Process at the Container Terminal—A Case Study of DCT Gdańsk SA. Sustainability 2021, 13, 6291. [Google Scholar] [CrossRef]
- Yi, S.; Scholz-Reiter, B.; Kim, T.; Kim, K.H. Scheduling appointments for container truck arrivals considering their effects on congestion. Flex. Serv. Manuf. J. 2019, 31, 730–762. [Google Scholar] [CrossRef]
- Brooks, M.R.; Schellinck, T. Measuring Port Effectiveness: Does Supply Chain Partner Performance Measurement Matter? Transp. Res. Rec. J. Transp. Res. Board 2015, 2479, 42–48. [Google Scholar] [CrossRef]
- Brooks, M.R.; Schellinck, T. Measuring port effectiveness in user service delivery: What really determines users’ evaluations of port service delivery? Res. Transp. Bus. Manag. 2013, 8, 87–96. [Google Scholar] [CrossRef]
- Neagoe, M.; Hvolby, H.-H.; Taskhiri, M.S.; Turner, P. Using discrete-event simulation to compare congestion management initiatives at a port terminal. Simul. Model. Pract. Theory 2021, 112, 102362. [Google Scholar] [CrossRef]
- Khondaker, B. Analysis of Capacity Drop at Congestion: A Simulation Study. In Proceedings of the Calgary 2013—The Many Faces of Transportation, Calgary, AB, Canada, 7–10 April 2013. [Google Scholar]
- Ambrosino, D.; Sciomachen, A. Impact of Externalities on the Design and Management of Multimodal Logistic Networks. Sustainability 2021, 13, 5080. [Google Scholar] [CrossRef]
- White, I.R.P. Use of waiting line theory in planning expansion of port facilities. In Dock and Harbour Authority; Foxlow Publications Limited: London, UK, 1972; Volume 52. [Google Scholar]
- Netto, J.F.; Botter, R.C.; Medina, A.C. Analysis of capacity associated to levels of service at port terminals using systemic approach and simulation of discrete events. In Proceedings of the 2015 Winter Simulation Conference (WSC), Huntington Beach, CA, USA, 6–9 December 2015; pp. 3426–3437. [Google Scholar]
- Yıldırım, M.S. Quantifying the Operational Benefits of Dry Port Integrated Cooperation in Port Clusters: A Microsimulation Study. Sustainability 2023, 15, 4990. [Google Scholar] [CrossRef]
- Kim, J.; Anderson, M.; Sarder, M.D.; Miller, C. Multimodal Freight Distribution & Economic Development due to International Capacity Expansion. J. Traffic Transp. Eng. 2014, 4, 60–74. [Google Scholar]
- Russo, A.; Campisi, T.; Bouhouras, E.; Basbas, S.; Tesoriere, G. Sustainable Maritime Passenger Transport: A Network Analysis Approach on a National Basis; Springer: Berlin/Heidelberg, Germany, 2023; pp. 195–207. [Google Scholar] [CrossRef]
- Zhang, X.; Wang, B.; Chen, Y.; Wang, C. Effect of Road Network Centrality on Land Use Intensity of Port Cities. Available online: https://ssrn.com/abstract=4451139 (accessed on 26 December 2023).
- Song, C.; Liu, Q.; Song, J.; Yang, D.; Jiang, Z.; Ma, W.; Niu, F.; Song, J. The Interactive Relationship between Street Centrality and Land Use Intensity—A Case Study of Jinan, China. Int. J. Environ. Res. Public Health 2023, 20, 5127. [Google Scholar] [CrossRef]
- Frémont, A. Geography of metropolitan gateways: Maritime metropolises, inland maritime corridors, and maritime regions and ranges. In Maritime Ports, Supply Chains and Logistics Corridors; Routledge: London, UK, 2024; pp. 17–30. [Google Scholar]
- Lehmacher, W.; Lind, M.; Poikonen, J.; Meseguer, J.; Cárcel Cervera, J.L. Reducing port city congestion through data analysis, simulation, and artificial intelligence to improve the well-being of citizens. J. Mega Infrastruct. Sustain. Dev. 2022, 2, 65–82. [Google Scholar] [CrossRef]
- Jugović, A.; Sirotić, M.; Peronja, I. Sustainable Development of Port Cities from the Perspective of Transition Management. Trans. Marit. Sci. 2021, 10, 466–476. [Google Scholar] [CrossRef]
- Islam, S.; Olsen, T. Factors affecting seaport capacity: Managerial implications for a simulation framework. In Proceedings of the 22nd National Conference of the Australian Society for Operations Research, Adelaide, Australia, 1–6 December 2013. [Google Scholar]
- Metcalfe, B.; Boshuizen, H.C.; Bulens, J.; Koehorst, J.J. Niveaux de maturité des jumeaux numériques: Un cadre théorique pour définir les capacités et objectifs dans les sciences de la vie et environnementales. F1000Research 2023, 12, 961. [Google Scholar] [CrossRef]
- Bedogni, L.; Chiariotti, F. A Web of Things Architecture for Digital Twin Creation and Model-Based Reinforcement Control. arXiv 2023, arXiv:2301.12761v1. [Google Scholar]
- Klar, R.; Fredriksson, A.; Angelakis, V. Digital Twins for Ports: Derived from Smart City and Supply Chain Twinning Experience. IEEE Access 2023, 11, 71777–71799. [Google Scholar] [CrossRef]
- Bergeron, E.; Audy, J.-F.; Forget, P. Visibility Performance Assessment: Simulation of a Digital Shadow in a Port. J. Mar. Sci. Eng. 2023, 11, 927. [Google Scholar] [CrossRef]


| Data Type | Observations and Attributes | Period |
|---|---|---|
| Vehicles access data | 796,000 records with entry/exit time, vehicle type, destination, freight, subcontractors | 2015–2020 (Selected period for analysis: 2017–2019) |
| Summarized activity data by port area | Tables with areas, load/unload quantities, truck count, and types of freight | |
| Access gate surveillance videos | 96 h of streaming video from which was obtained the vehicle service time at gate | Four days of July 2019 |
| Projected construction parameters | Civil engineering pre-feasibility study with a forecast of the number of construction trucks per day, unloading time, and the number of available unloading stations. | Construction period |
| Area | 2017 | 2018 | 2019 | Total | % |
|---|---|---|---|---|---|
| A | 13,511 | 13,493 | 14,918 | 41,922 | 32% |
| B | 13,600 | 17,506 | 15,126 | 46,232 | 36% |
| C | 14,845 | 15,366 | 11,202 | 41,413 | 32% |
| Total trucks | 41,956 | 46,365 | 41,246 | 129,567 | 100% |
| Total cars | 100,219 | 117,963 | 105,488 | Avg: 107,890 | - |
| Vehicle Entry and Exit Modes | ART Distributions | Avg. Times (Seconds) |
|---|---|---|
| Automated truck entry | JohnsonSB (0.16, 0.70, 12.00, 59.27) | 33.65 |
| Manual truck entry | JohnsonSB (1.19, 0.59, 69.20, 390.37) | 133.29 |
| Automated truck exit | Norm (17.444, 5.0472) | 17.42 |
| Manual truck exit | JohnsonSB (1.79, 0.57, 27.76, 243.13) | 50.26 |
| Car entry | JohnsonSB (7.70, 0.94, 4.90, 28.00, 610.99) | 18.59 |
| Car exit | JohnsonSB (7.96, 1.21, 4.52, 4975.24) | 14.3 |
| Baseline Scenarios | Gate Number | Data | Truck Flow MG | Truck Flow SG | Reference |
|---|---|---|---|---|---|
| BSc1 | 2 | 2017–2019 | 78% | 22% | Busiest day |
| BSc2 | 2 | 2017–2019 | 67% | 33% | 14 busiest weeks |
| Exploratory Scenarios | Number of Gates | Unloading Time for CT in min | Reference Flow | Impact to Be Evaluated |
|---|---|---|---|---|
| ExpSc1 | 2 | - | BSc2 | Increase in FTs |
| ExpSc2 | - | BSc1 | ||
| ExpSc3 | 15 | BSc2 | Increase in FTs and CTs | |
| ExpSc4 | 20 | |||
| ExpSc5 | 15 | BSc1 | ||
| ExpSc6 | 20 |
| Exploratory Scenarios | Number of Gates | Unloading Time for Construction Truck | NG (Truck Destination) | Reference Flow |
|---|---|---|---|---|
| ExpSc7 | 3 | 15 | Area B | BLSc2 |
| ExpSc8 | 20 | |||
| ExpSc9 | 15 | BLSc1 | ||
| ExpSc10 | 20 | |||
| ExpSc11 | 15 | Area B and 20% Area A | BLSc2 | |
| ExpSc12 | 20 | |||
| ExpSc13 | 15 | BLSc1 | ||
| ExpSc14 | 20 |
| Scenarios | Number of Gates | No. of CTs Unloaded Simultaneously | Unloading Time | NG Flow | MG Flow | SG Flow | No. of Scenarios |
|---|---|---|---|---|---|---|---|
| ImpSc1 | 2 | 4 | - | - | 0.1–0.9 | 0.9–0.1 | 9 |
| ImpSc2 | 15 | - | |||||
| ImpSc3 | 3 | ZA | |||||
| ImpSc4 | ZA + 20% ZB | ||||||
| ImpSc5 | 2 | 4/5/6 | - | 0.67 | 0.33 | 3 | |
| ImpSc6 | 4/5/6/7/8 | 20 | - | 5 | |||
| ImpSc7 | 5/6/7/8/9 | 25 | - | 5 |
| Batch Sc | Slowdown Duration | Slowdown Factor | Slowdown Freq. per Hour | Entrance Number | Outlook Number of Trucks | Number of Scenarios |
|---|---|---|---|---|---|---|
| 1 | 10 min | 20% and 30% | 1, 2, 4, 6 | 1–2–3 | construction period | 24 |
| 2 | 10 min | 40% and 50% | 1, 2, 4, 6 | 1 | construction period | 8 |
| 3 | 10 min | 40% | 6 | 3 | construction period + 20 to 50% | 4 |
| Sc | MG Capacity | Delay Factor | Delay Frequency (h) | Avg. No. Vehicles Waiting | Max. No. Vehicles Waiting | Avg. Waiting Time (min) | Max. Waiting Time (min) | Scheduled Utilization (%) | Processing Time (%) |
|---|---|---|---|---|---|---|---|---|---|
| Sc1 | 1 | 0.2 | 1 | 1.82 | 32.1 | 1.80 | 15.8 | 57 | 57 |
| Sc2 | 2 | 2.56 | 38.2 | 2.56 | 19.4 | 60 | 60 | ||
| Sc3 | 4 | 2.82 | 39.7 | 2.76 | 23.7 | 61 | 61 | ||
| Sc4 | 6 | 3.40 | 44.5 | 3.35 | 26.8 | 66 | 66 | ||
| Sc5 | 2 | 1 | 0.10 | 9.7 | 0.09 | 3.3 | 29 | 43 | |
| Sc6 | 2 | 0.12 | 8.4 | 0.11 | 3.6 | 30 | 45 | ||
| Sc7 | 4 | 0.11 | 8.3 | 0.11 | 4.3 | 30 | 45 | ||
| Sc8 | 6 | 0.16 | 10.6 | 0.16 | 4.5 | 33 | 48 | ||
| Sc9 | 3 | 1 | 0.01 | 4.3 | 0.01 | 1.1 | 19 | 42 | |
| Sc10 | 2 | 0.01 | 4.2 | 0.01 | 1.2 | 21 | 45 | ||
| Sc11 | 4 | 0.01 | 4.5 | 0.01 | 1.3 | 20 | 44 | ||
| Sc12 | 6 | 0.02 | 4.7 | 0.02 | 1.5 | 22 | 47 | ||
| Sc13 | 1 | 0.3 | 1 | 1.96 | 34.6 | 1.93 | 17.4 | 57 | 57 |
| Sc14 | 2 | 3.44 | 47.5 | 3.39 | 27.9 | 62 | 62 | ||
| Sc15 | 4 | 3.46 | 45.4 | 3.41 | 27.2 | 63 | 63 | ||
| Sc16 | 6 | 4.88 | 50.8 | 4.80 | 30.1 | 71 | 71 | ||
| Sc17 | 2 | 1 | 0.10 | 9.5 | 0.10 | 3.1 | 29 | 43 | |
| Sc18 | 2 | 0.15 | 10.0 | 0.15 | 4.1 | 31 | 45 | ||
| Sc19 | 4 | 0.17 | 11.5 | 0.16 | 5.3 | 32 | 46 | ||
| Sc20 | 6 | 0.18 | 10.6 | 0.18 | 4.9 | 36 | 51 | ||
| Sc21 | 3 | 1 | 0.01 | 4.5 | 0.01 | 1.3 | 19 | 42 | |
| Sc22 | 2 | 0.01 | 4.5 | 0.01 | 1.3 | 21 | 45 | ||
| Sc23 | 4 | 0.02 | 4.5 | 0.02 | 1.4 | 21 | 44 | ||
| Sc24 | 6 | 0.03 | 5.5 | 0.03 | 2.0 | 24 | 49 | ||
| Sc25 | 1 | 0.4 | 1 | 1.61 | 25.0 | 1.59 | 13.4 | 58 | 58 |
| Sc26 | 2 | 4.15 | 47.1 | 4.10 | 32.6 | 64 | 64 | ||
| Sc27 | 4 | 4.38 | 47.5 | 4.36 | 32.7 | 64 | 64 | ||
| Sc28 | 6 | 7.99 | 57.0 | 7.83 | 41.7 | 76 | 76 | ||
| Sc29 | 3 (*) | 0.4 | 6 | 0.05 | 7.6 | 0.04 | 2.3 | 27 | 54 |
| Sc30 | 6 | 0.07 | 8.3 | 0.06 | 3.0 | 29 | 56 | ||
| Sc31 | 6 | 0.06 | 7.4 | 0.05 | 2.8 | 30 | 58 | ||
| Sc32 | 6 | 0.06 | 6.8 | 0.05 | 2.7 | 31 | 59 | ||
| Sc33 | 1 | 0.5 | 1 | 1.82 | 29.9 | 1.80 | 16.6 | 58 | 58 |
| Sc34 | 2 | 6.26 | 58.4 | 6.08 | 45.2 | 67 | 67 | ||
| Sc35 | 4 | 6.34 | 58.6 | 6.26 | 47.0 | 67 | 67 | ||
| Sc36 | 6 | 11.53 | 70.2 | 11.42 | 51.1 | 81 | 81 |
Disclaimer/Publisher’s Note: The statements, opinions and data contained in all publications are solely those of the individual author(s) and contributor(s) and not of MDPI and/or the editor(s). MDPI and/or the editor(s) disclaim responsibility for any injury to people or property resulting from any ideas, methods, instructions or products referred to in the content. |
© 2024 by the authors. Licensee MDPI, Basel, Switzerland. This article is an open access article distributed under the terms and conditions of the Creative Commons Attribution (CC BY) license (https://creativecommons.org/licenses/by/4.0/).
Share and Cite
Ben Daya, B.; Audy, J.-F. Port Access Fluidity Management during a Major Extension Project: A Simulation-Based Case Study. Sustainability 2024, 16, 2834. https://doi.org/10.3390/su16072834
Ben Daya B, Audy J-F. Port Access Fluidity Management during a Major Extension Project: A Simulation-Based Case Study. Sustainability. 2024; 16(7):2834. https://doi.org/10.3390/su16072834
Chicago/Turabian StyleBen Daya, Bechir, and Jean-François Audy. 2024. "Port Access Fluidity Management during a Major Extension Project: A Simulation-Based Case Study" Sustainability 16, no. 7: 2834. https://doi.org/10.3390/su16072834