1. Introduction
Corporations and investors are increasingly considering Environmental, Social, and Governance issues (ESG) in their business models [
1,
2]. A report by PwC predicts that managers worldwide will increase their ESG-related assets under management (AuM) from USD 18.4 trillion in 2021 to USD 33.9 trillion by 2026. This amount is projected to represent 21.5% of total assets under management (AuM). Thus, companies are investing increasing amounts of resources to improve their performance on ESG issues, whereas regulators seek to comprehend how ESG information flows to the market and how capital market participants respond to such information [
3]. In light of the potential impact of ESG factors on corporate market value, our research problem is to determine the extent to which ESG-related news items influence the market value of corporations, especially considering the role of the stock market as a mechanism for market participants to incentivize or sanction companies based on their ESG performance.
Extreme ESG events, like toxic substance leaks, racism scandals, and accounting fraud, have a negative effect on the market value of a company. This is well known in the academic literature [
4]. However, such studies have limitations: they focus on a few events and do not consider the ordinary daily operations of companies that may employ ESG practices, thereby ignoring investor reactions to such practices [
5]. Therefore, regular news can be a way to find out about companies’ ESG practices and their consequences, not just about extreme events. Furthermore, unlike other ESG information sources, such as company reports, certifications, or ESG ratings from specialized agencies, news allows for high-frequency analysis with low time delay. News is also less susceptible to “greenwashing” than company reports, which can be manipulated to please investors [
3]. Furthermore, ESG ratings from different agencies lack standardization and are generally updated infrequently, resulting in discrepancies between agencies [
4,
6,
7].
The purpose of our research is to evaluate how ESG news, classified according to a novel Dictionary of ESG Terms, affects the stock prices of leading companies in Brazil, thereby shedding light on the significance of ESG factors in investment decisions and corporate valuation in the Brazilian market context. Our main objectives are:
To assess the impact of ESG news on stock prices: determine how ESG-related news, both positive and negative, influences the stock prices of major Brazilian companies;
To develop an automatized mechanism for news categorization: create comprehensive tools for selecting, classifying, and analyzing ESG news according to the five dimensions and 26 categories as defined by the Sustainability Accounting Standards Board (SASB);
To explore the concept of financial materiality in ESG news: investigate whether investors differentiate between financially material and immaterial ESG news in their investment decisions and how this affects stock prices;
To provide evidence from the Brazilian market: offer insights into the ESG news impact on stock prices within the specific context of the Brazilian economy, contributing to the global discussion on ESG factors in corporate valuation.
Our main research tasks are:
Creating a Dictionary of ESG Terms: formulate a dictionary that categorizes ESG news into dimensions and categories as defined by SASB, alongside traditional ESG dimensions;
Developing a Sentiment Dictionary: assign polarities (positive or negative) to the terms in the ESG Dictionary, supplemented by terms from the Harvard-IV Sentiment Dictionary, for accurate sentiment analysis;
Selecting and classifying ESG news: use the Dictionary of ESG Terms to filter and categorize news articles from Valor Econômico between 2014 and 2022;
Identifying positive and negative news sets: apply the Sentiment Dictionary to classify the selected news articles into positive and negative news categories;
Analyzing the daily impact on stock prices and the issue of financial materiality: Conduct an empirical analysis using a firm-day panel to quantify the daily effects of ESG news on the market value of companies. This analysis focuses not only on stock returns and the influence of positive versus negative news but also examines the role of financial materiality in shaping market responses to ESG news.
Studies providing a useful list of ESG-related words are nearly non-existent [
8], with those available focusing exclusively on the three classic ESG dimensions. There are no dictionaries providing more comprehensive and detailed classifications, such as in the dimensions and categories defined by SASB. Therefore, our first contribution is proposing a dictionary that enables news selection and classification according to SASB’s standards.
By using the SASB standard, we can separate news that is considered financially material from that which is not considered financially material. The definition of materiality by the Securities and Exchange Commission (SEC), as interpreted by the U.S. Supreme Court and employed by the Public Company Accounting Oversight Board (PCAOB) [
9], is “information that presents a substantial likelihood that the disclosure of the omitted fact would have significantly altered the total mix of information made available”. In simpler terms, “materiality refers to the relevance of information for stakeholder analysis and decision-making” [
10]. Within the realm of ESG reporting or news, the criterion of financial materiality specifically targets ESG issues likely to significantly impact a company’s operational performance or financial health, thereby deeming these issues of greater importance to investors [
9,
10]. However, ESG information disclosed in reports or media about a particular company may hold different values for investors compared to the general public, who do not own shares in the company [
11]. Additionally, the value of ESG information may vary depending on each company’s industry sector [
9]. In this context, SASB has developed specific standards for different industry sectors to assist companies in determining which topics are materially relevant to them. Therefore, by using the SASB standard as a basis to classify news items—unlike other studies that only filter news within the three classic ESG dimensions [
5,
12,
13,
14,
15,
16]—our approach evaluates whether investors respond to ESG news considered financially material, financially immaterial, or to all ESG news. This method enables us to explore whether the concept of financial materiality is significant or if investors react for reputational or non-pecuniary reasons, potentially clarifying the mixed results found in the existing literature—whereas some studies report a significant stock price response to ESG news in general, others do not.
We demonstrate, for the Brazilian case, that stock prices react to ESG news. Unlike [
5,
16], we found positive price reaction to positive news, and unlike [
3], we found negative price reaction to negative news using only one news source. We also find that the SASB concept of materiality is important: investors react only to financially material news, as classified by SASB. This means that they do not react merely to reputational or non-pecuniary issues. In addition, there are distinct reactions to the news based on the SASB dimension: for news in the Environment dimension, the reaction occurs for both positive and negative news, whereas for the Leadership and Governance dimension, a significant price reaction only occurs for negative news.
Recent studies investigating the relationship between ESG news and companies’ market value on a daily basis use Big Data solutions for filtering, processing, and sentiment attribution to ESG news [
3,
5]. However, such solutions are proprietary and not publicly accessible, and therefore non-transparent. In contrast, our solution is open and straightforward, and can be used, supplemented, and modified by any researcher who wishes to select ESG news in any news database.
Existing research either focuses on other economies or only analyzes the largest global companies. However, our study is the first to explore the Brazilian economy in this context. Brazil offers a unique scenario for examining the effects of ESG-related news on company market values due to its specific Environmental, Social, and Governance challenges and opportunities. As one of the most biodiverse countries in the world and a key player in the global agricultural and energy markets, the environmental policies and practices of Brazil play a crucial role in worldwide sustainability efforts [
17]. The Amazon rainforest stands at the center of environmental ESG issues, with deforestation and conservation efforts attracting close attention from international investors and environmentalists [
18,
19].
Recent years have witnessed tragic dam disasters in Brazil, notably the Mariana dam disaster in 2015 and the Brumadinho dam collapse in 2019. These catastrophic events caused immense environmental destruction and loss of human life and underscored the vital need for stringent environmental and safety standards, as well as corporate accountability and governance within the country. The aftermath of these incidents increased scrutiny from national and international stakeholders, including investors, regulators, and the general public, on the mining and energy sectors’ ESG practices [
20]. Consequently, Brazil has shifted notably towards stronger ESG commitments, with government, companies and investors increasingly recognizing the importance of assessing and mitigating environmental risks, enhancing safety protocols, and improving governance structures to prevent future tragedies [
21]. These events have significantly raised ESG awareness in Brazil, making it an urgent and concrete concern that directly influences investment decisions and corporate strategies.
On the social front, Brazil faces deep inequality, labor rights issues, and the need for inclusive economic growth [
22]. The country’s large population, spanning a broad spectrum of socio-economic backgrounds, creates a complex environment for companies in terms of social responsibility and impact. Aspects like workforce diversity and social inequality are becoming more relevant to investors examining the social dimension of ESG [
23,
24].
Governance in Brazil has received intense scrutiny, especially following high-profile corruption scandals involving some of the country’s largest companies and political figures. These events have raised awareness and concern over governance practices [
25], making governance a critical element of ESG evaluation for investors. The demand for transparency, accountability, and ethical business practices is paramount in rebuilding investor confidence and promoting sustainable economic development.
Additionally, Brazil’s emerging market status introduces an additional layer of complexity to ESG considerations. Although ESG awareness among Brazilian companies and investors is increasing, the integration of ESG factors into investment and business decisions is still in progress. This offers both challenges and opportunities for researching ESG impacts on market values in the Brazilian setting. By centering on Brazil, our study seeks to enrich the understanding of how ESG factors are perceived and acted upon in emerging markets.
To address the evolving landscape of non-financial disclosure in Brazil, it is pertinent to note the recent regulatory advancements by the Brazilian Securities and Exchange Commission (CVM). On 20 October 2023, the CVM introduced a resolution regarding the ESG risk report, which mandates its implementation for publicly traded companies starting in 2026. The reports will adhere to the International Sustainability Standards Board (ISSB) standards. Starting in 2024, companies, investment funds, and securitization companies will have the option to publish these reports voluntarily, aiming to provide the market with sustainability-related financial information. This initiative represents a significant move towards structured ESG disclosure, emphasizing the importance of transparency in Environmental, Social, and Governance practices.
However, until 2026, ESG disclosures remain optional for publicly traded companies in Brazil, contrasting with the more stringent or widespread reporting requirements observed in other economies. For instance, in Europe, the Corporate Sustainability Reporting Directive (CSRD) mandates comprehensive ESG disclosures for large companies, providing a structured framework for reporting. Similarly, in the United States, the SEC requires all public companies to disclose information that may be material to investors, including information on ESG-related risks. These examples highlight a global shift towards more standardized and obligatory ESG reporting practices, a trend from which Brazil has been relatively detached until now. This disparity in ESG disclosure practices underscores the significance of utilizing news as a primary source of ESG-related information in our study, especially in the Brazilian context where formal ESG reporting is still in its infancy.
The paper is structured as follows. In
Section 2, we provide a brief introduction to the literature. In
Section 3, we describe the database, the creation process for the Dictionary of ESG Terms, and we present the methodology used to verify the reaction of stock prices to ESG news.
Section 4 and
Section 5 present and discuss our main findings. Finally,
Section 6 concludes.
2. Literature Review and Hypotheses Development
The term ESG was first used officially in 2004, in the UN Global Compact Initiative’s “Who Cares Wins” report. This report was the result of a joint initiative of 20 financial institutions in response to a request by Kofi Annan, Secretary-General of the United Nations, to develop guidelines and recommendations on how to better integrate environmental, social, and governance issues into companies’ business models [
1]. The Environmental (E) dimension quantifies the effect of a company’s actions on natural ecosystems. It includes everything from greenhouse gas emissions to making products that are better for the environment. The Social (S) dimension addresses the company’s relationship with its workforce, consumers, and society as a whole, including everything from talent retention initiatives to the company’s collaboration for the development of the communities in which it operates. Governance (G) refers to the mechanisms that ensure a company’s management acts in its shareholders’ best interests, such as its codes of conduct and business principles, as well as the implementation of policies to prevent illegal practices such as fraud and bribery [
26].
The relationship between ESG practices and the financial performance of companies is widely studied in the finance field [
24,
27,
28,
29,
30]. Even before the term ESG was coined, studies were already seeking to establish a relationship between environmental news and the market value of companies [
12,
13], using the Event Study methodology. Subsequently, studies began to consider more than one ESG dimension [
16]. The selection of ESG news moved from manual filtering in print newspapers [
12], to searches in news databases based on keywords related to the ESG context [
13,
15,
16,
31,
32]. The determination of news sentiment was initially performed manually, until the news databases themselves began to provide sentiment classification, as is the case with the KLD database (now part of MSCI) [
16]. In general, studies were conducted on hundreds of news items each, and it was not until 2015 that research methodologies advanced to the point of dealing with over a thousand news items [
16]. Recent studies [
3,
5] use proprietary Big Data solutions for ESG news classification and sentiment determination. These solutions allow for the evaluation of more than 10,000 to 100,000 news items per study, using natural language processing and machine learning techniques to determine news sentiment from news sources. The Covalence EthicalQuote and TrueValue Labs solutions [
3,
5] are examples of such solutions. However, these solutions are closed and proprietary, making them non-transparent.
The initial conclusions are that positive (negative) ESG news generates positive (negative) impacts on companies’ stock returns [
13,
14,
15]. However, a divergent view is introduced [
16] suggesting that positive news can have a negative effect on companies’ market value, providing evidence for an agency problem in relation to ESG practices (a situation where company managers adopt ESG practices to gain a good reputation with some of the key stakeholders, such as politicians, labor unions, media, at the expense of shareholders. Thus, shareholders would receive positive news about ESG practices negatively). On the other hand, a divergent conclusion is reached [
5] regarding positive news: it does not have an impact on companies’ market value, whereas negative news has a negative impact. Meanwhile, no negative price reaction to negative ESG events is found [
32]. Divergent outcomes also seem to be influenced by the geographical region of the study (US, Europe, and Asia-Pacific) [
33], suggesting that ESG news is interpreted differently across various global areas. Thus, the question of how ESG news influences the market value of companies remains open. Our first hypothesis is:
Hypothesis 1. The capital market reacts to both positive and negative ESG-related news.
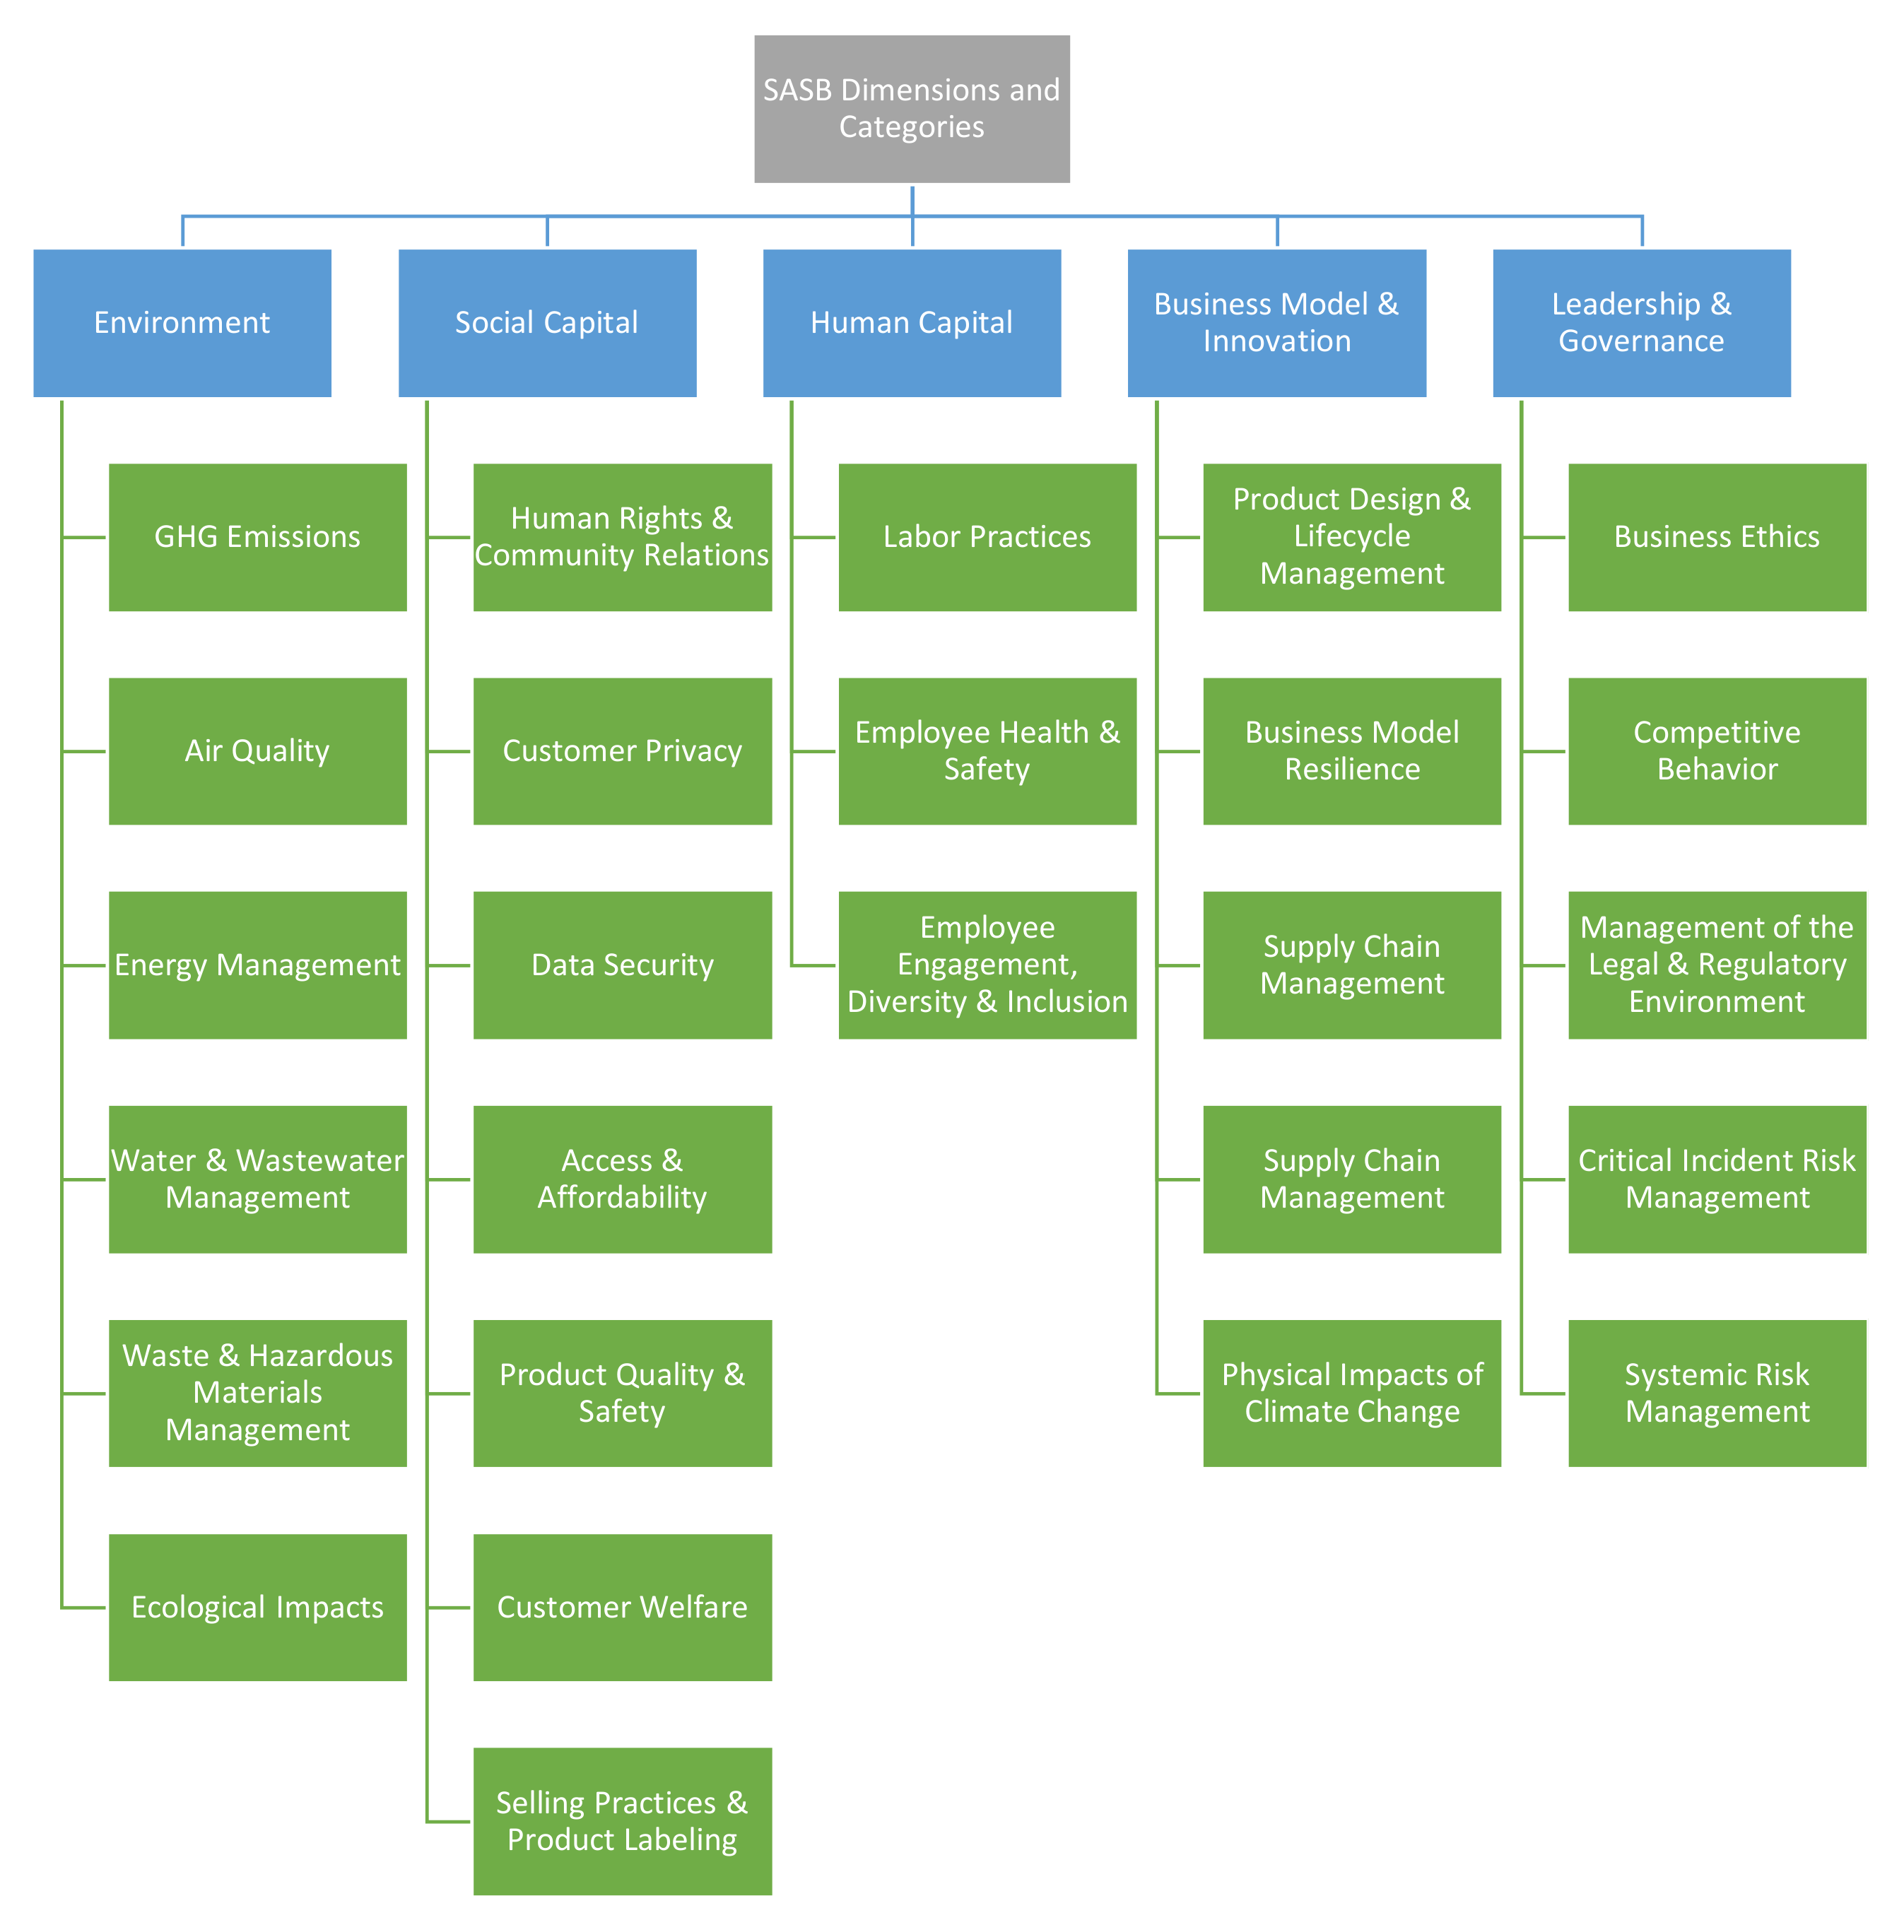
The Sustainability Accounting Standards Board is a non-profit organization that establishes specific standards for ESG reporting by companies. It identifies 26 categories of ESG issues organized along five major dimensions: Environment, Social Capital, Human Capital, Business Model and Innovation, and Leadership and Governance [
34].
Appendix A Figure A1 presents these 26 categories organized within the five dimensions. The SASB standard specifies, for each of the 77 industrial sectors, which of its ESG categories are financially material, meaning they must be relevant to investors’ decision-making [
35]. For instance, Greenhouse Gas Emissions is a category considered financially material for the Oil and Gas Exploration industry, whereas the Customer Welfare category is not. Conversely, Customer Welfare is financially material to the Processed Foods industry, unlike the Greenhouse Gas Emissions category. The distinction between material and immaterial issues in ESG [
36] highlights that investments in material sustainability issues can enhance shareholder value, whereas investments in immaterial sustainability issues have little to no positive or negative value implications. Material ESG disclosures enhance stock price informativeness [
9]. Firms disclosing more SASB-identified ESG information exhibit greater price informativeness [
37], whereas disclosures not identified by SASB do not impact informativeness. Financial materiality can improve the informative value of ESG scores and rankings in the Morgan Stanley Capital International (MSCI) ESG Ratings [
10].
Regarding the assessment of financial materiality on ESG news and its impact on company stocks, a recent study [
3] demonstrates that there is no significant relationship between ESG news and stock returns when considering only news classified as not financially material. A significant relationship exists only for news classified as material by SASB. This raises the question of whether investors differentiate between financially material and immaterial ESG news in their investment decisions, and how this distinction affects stock prices.
Hypothesis 2. The capital market reaction is stronger to news related to financially material ESG issues.
The presence of divergent results across different industries to which firms belong has been observed [
38]. This study found that companies in the alcohol, tobacco, and gaming sectors are not impacted by negative news. Furthermore, secondary and tertiary industries might exhibit a stronger reaction to news, as well as private companies when compared to public ones [
39]. Additionally, the specific ESG dimension being evaluated appears to play a role in the outcome [
40], where no price reaction is observed in response to the Environmental dimension. Therefore, it raises the question of whether the ESG dimension of the news influences the extent of investors’ reactions, if certain dimensions have more significant impacts than others, and whether the findings are consistent in a country like Brazil. Our third hypothesis is:
Hypothesis 3. The capital market reacts differently to news related to different dimensions of ESG performance.
Although our study uses news as a source of information on companies’ ESG practices, there is a range of studies that use company reports [
41,
42] and ESG ratings from specialized agencies [
43,
44,
45,
46,
47] to analyze the impact of ESG practices on firms’ market value. Although the Event Study methodology is predominant in this topic, some studies use other techniques, such as constructing “good” and “bad” ESG portfolios using ESG controversy measures and comparing the performance of both portfolios to investigate the impact of ESG performance on financial performance of companies [
48,
49].
There are only two works that provide dictionaries for filtering ESG topics [
8,
50]. A recent work [
51] employs ESG vocabulary to filter ESG news for predicting stock volatility. However, the author does not disclose the specific ESG Dictionary used and does not utilize the SASB classification.
In light of the preceding literature review, this study aims to address several critical areas where existing research has either been limited or has presented divergent findings. These areas of inquiry, identified as methodological and empirical research gaps, underscore the necessity for further investigation into the nuanced impacts of ESG-related news on corporate market values, particularly within the evolving context of the Brazilian market. Below, we delineate the specific research gaps that this study aims to bridge:
Methodological Gaps:
- -
Lack of an Open Mechanism for News Filtering and Classification: there is an absence of an automatic, transparent, and accessible mechanism for filtering and classifying ESG-related news within a big data environment according to the SASB standards.
- -
Absence of Comprehensive Dictionaries: previous studies have not provided dictionaries that classify ESG news according to the detailed dimensions and categories defined by SASB, limiting the depth of analysis possible.
Empirical Gaps:
- -
Varied Impact of ESG News on Market Value: existing studies offer divergent perspectives on whether ESG news has a positive or negative impact on the market value of companies, suggesting a need to explore if the inclusion of financially non-material news contributes to this inconsistency.
- -
Geographical and Dimensional Specificity of Market Reactions: Prior research has not reached a consensus on whether market reactions to ESG news are consistent across all ESG dimensions, specific to certain dimensions, or vary depending on the geographical context. Notably, there is a lack of studies focused on the Brazilian market.
Our work is most similar to [
3], as we aim to classify news according to SASB standards and investigate whether financial materiality matters. However, we distinguish ourselves by providing a simpler and more open solution for news classification and sentiment determination. Additionally, we analyze the theme for the Brazilian scenario. To the best of our knowledge, our dictionary is the first to classify news along the SASB dimensions and categories, in addition to the three classic ESG categories. Our work differs from other works [
8,
50,
51] by enabling classification according to the SASB dimensions and categories. Moreover, we focus on ESG news, whereas the dictionaries available in some recent works [
8,
50] are focused on annual reports from companies. It is essential that dictionaries be customized for the particular context, and researchers should consider the intended purpose of the dictionary [
52]. We hope that our ESG Dictionary can be utilized and enhanced in research that requires the selection and classification of ESG news, whether according to the SASB standard or not.
3. Data and Methods
3.1. Data
The methodology adopted for company selection and news categorization is as follows:
3.1.1. Company Selection Criteria
Our study focuses on companies listed on Brazil’s B3 stock exchange, specifically those included in the Ibovespa index or the B3’s Corporate Sustainability Index (ISE) or Carbon Efficient Index (ICO2). The selection criteria were based on the following key considerations:
Market Representation: companies included in the Ibovespa index represent approximately 80% of the trade volume on B3, providing a comprehensive overview of the Brazilian market’s dynamics;
ESG Commitment: Inclusion in the ISE and ICO2 indices served as a proxy for the companies’ commitment to ESG practices. The ISE index features companies with outstanding sustainability performance, whereas the ICO2 index focuses on carbon efficiency, signaling a commitment to reducing carbon emissions;
Availability of Data: Only companies with available news data from January 2014 to December 2022 were considered. This criterion ensured the analysis was grounded in sufficient historical context.
3.1.2. Data Collection and Filtering Process
Our study utilized news from the ’Companies’ section of the Valor Econômico portal. A novel Dictionary of ESG Terms, developed specifically for this research, was applied to filter ESG news items and classify them according to SASB’s categories (we demonstrate the process of creating the dictionary in
Section 3.2). This approach ensured a targeted identification of ESG-related news impacting the selected companies. The data collection and filtering process involved the following steps:
News Extraction: News items featuring the selected companies were systematically extracted based on the presence of terms from our ESG Dictionary within the articles. This method ensured that only news containing ESG-related terms and mentioning any of this study’s companies within the first two paragraphs were retained [
53];
Proper Name Filtering: to improve the precision of company mentions within news articles, we compiled a list of terms for company identification and applied additional filters to exclude common names or terms that might lead to false positives, such as “Vale” being confused with “Vale do Silício” (Silicon Valley);
Exclusion Criteria: News items mentioning the stock exchange were excluded to eliminate market reports or stock performance summaries that could introduce bias into the analysis. Additionally, potential duplicate news articles were filtered out.
Final Dataset: the final dataset comprised news items linked to the companies and classified according to the SASB dimensions and categories.
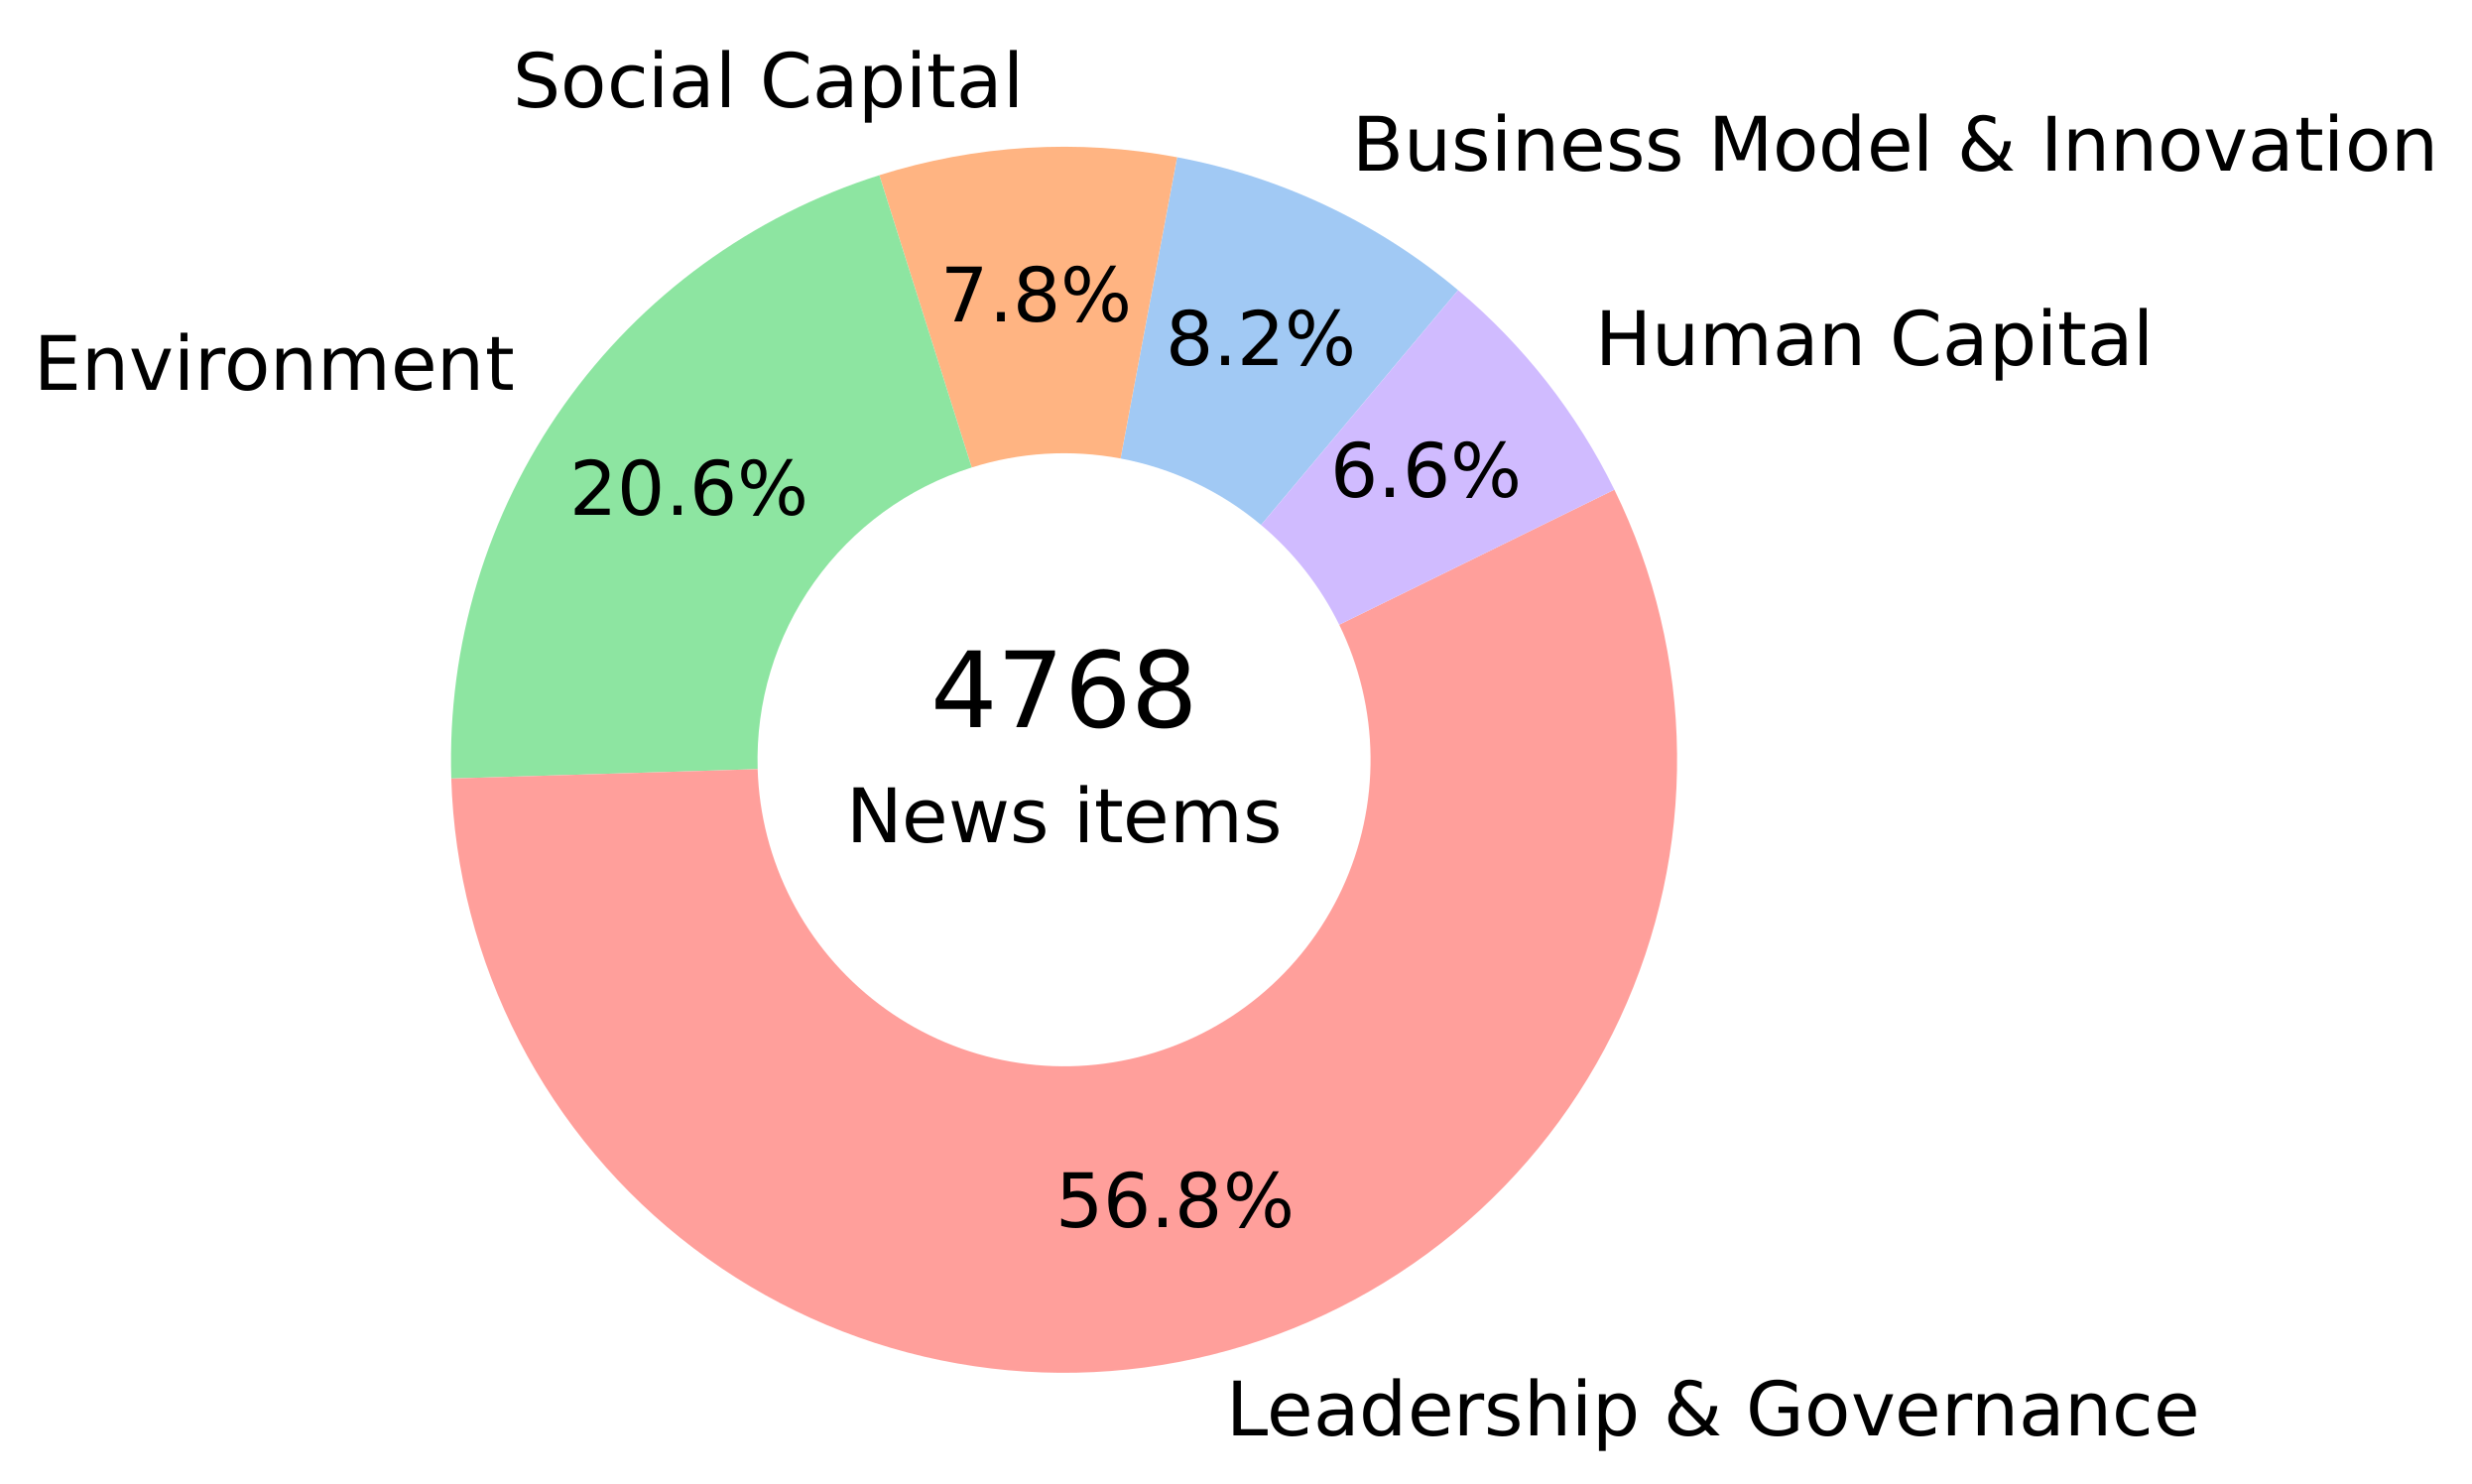
Figure 1 presents the percentage of news from each SASB dimension. The categories of Leadership and Governance and Environment accounted for 57% and 21%, respectively, of the ESG news, and the remaining dimensions each accounted for up to 8%.
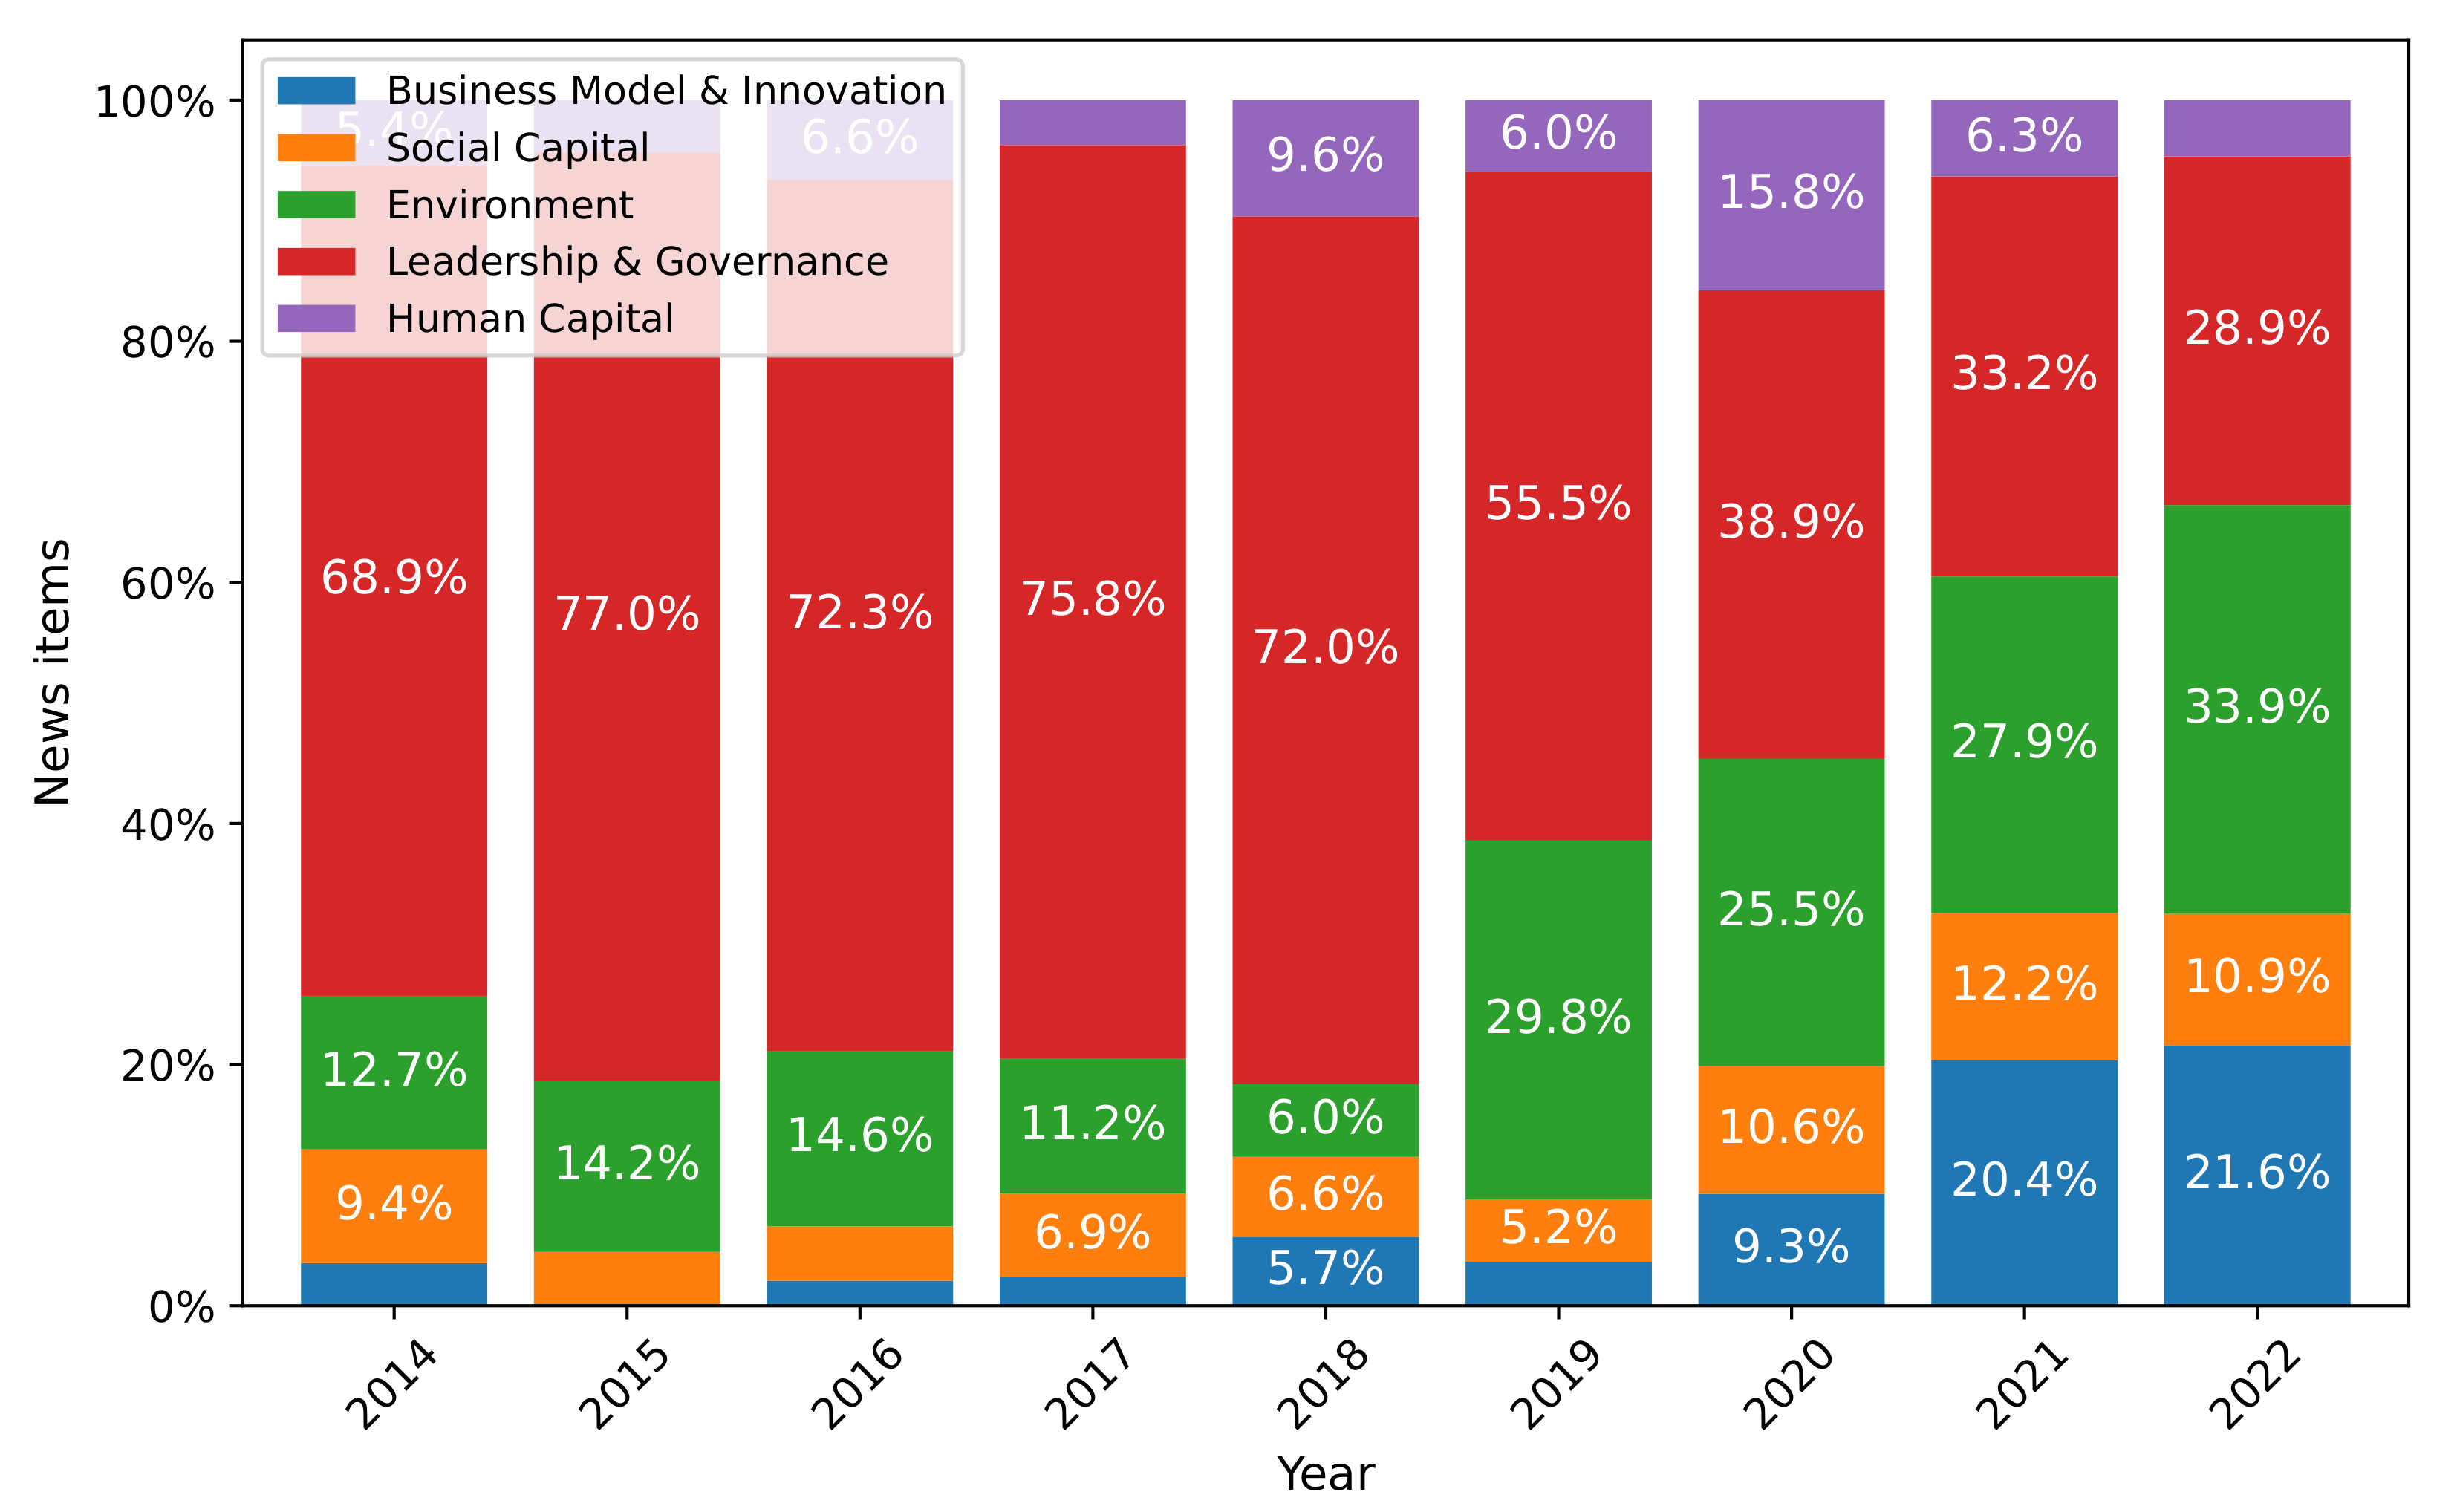
Figure 2 presents the year-on-year percentage evolution of each dimension, and explains the high number of news items classified in Leadership and Governance: we can observe the peaks of news in this dimension between 2014 and 2018. These were the years when the country closely followed the developments of the Lava-Jato operation, which primarily investigated corruption cases involving Brazil’s largest company, Petrobras.
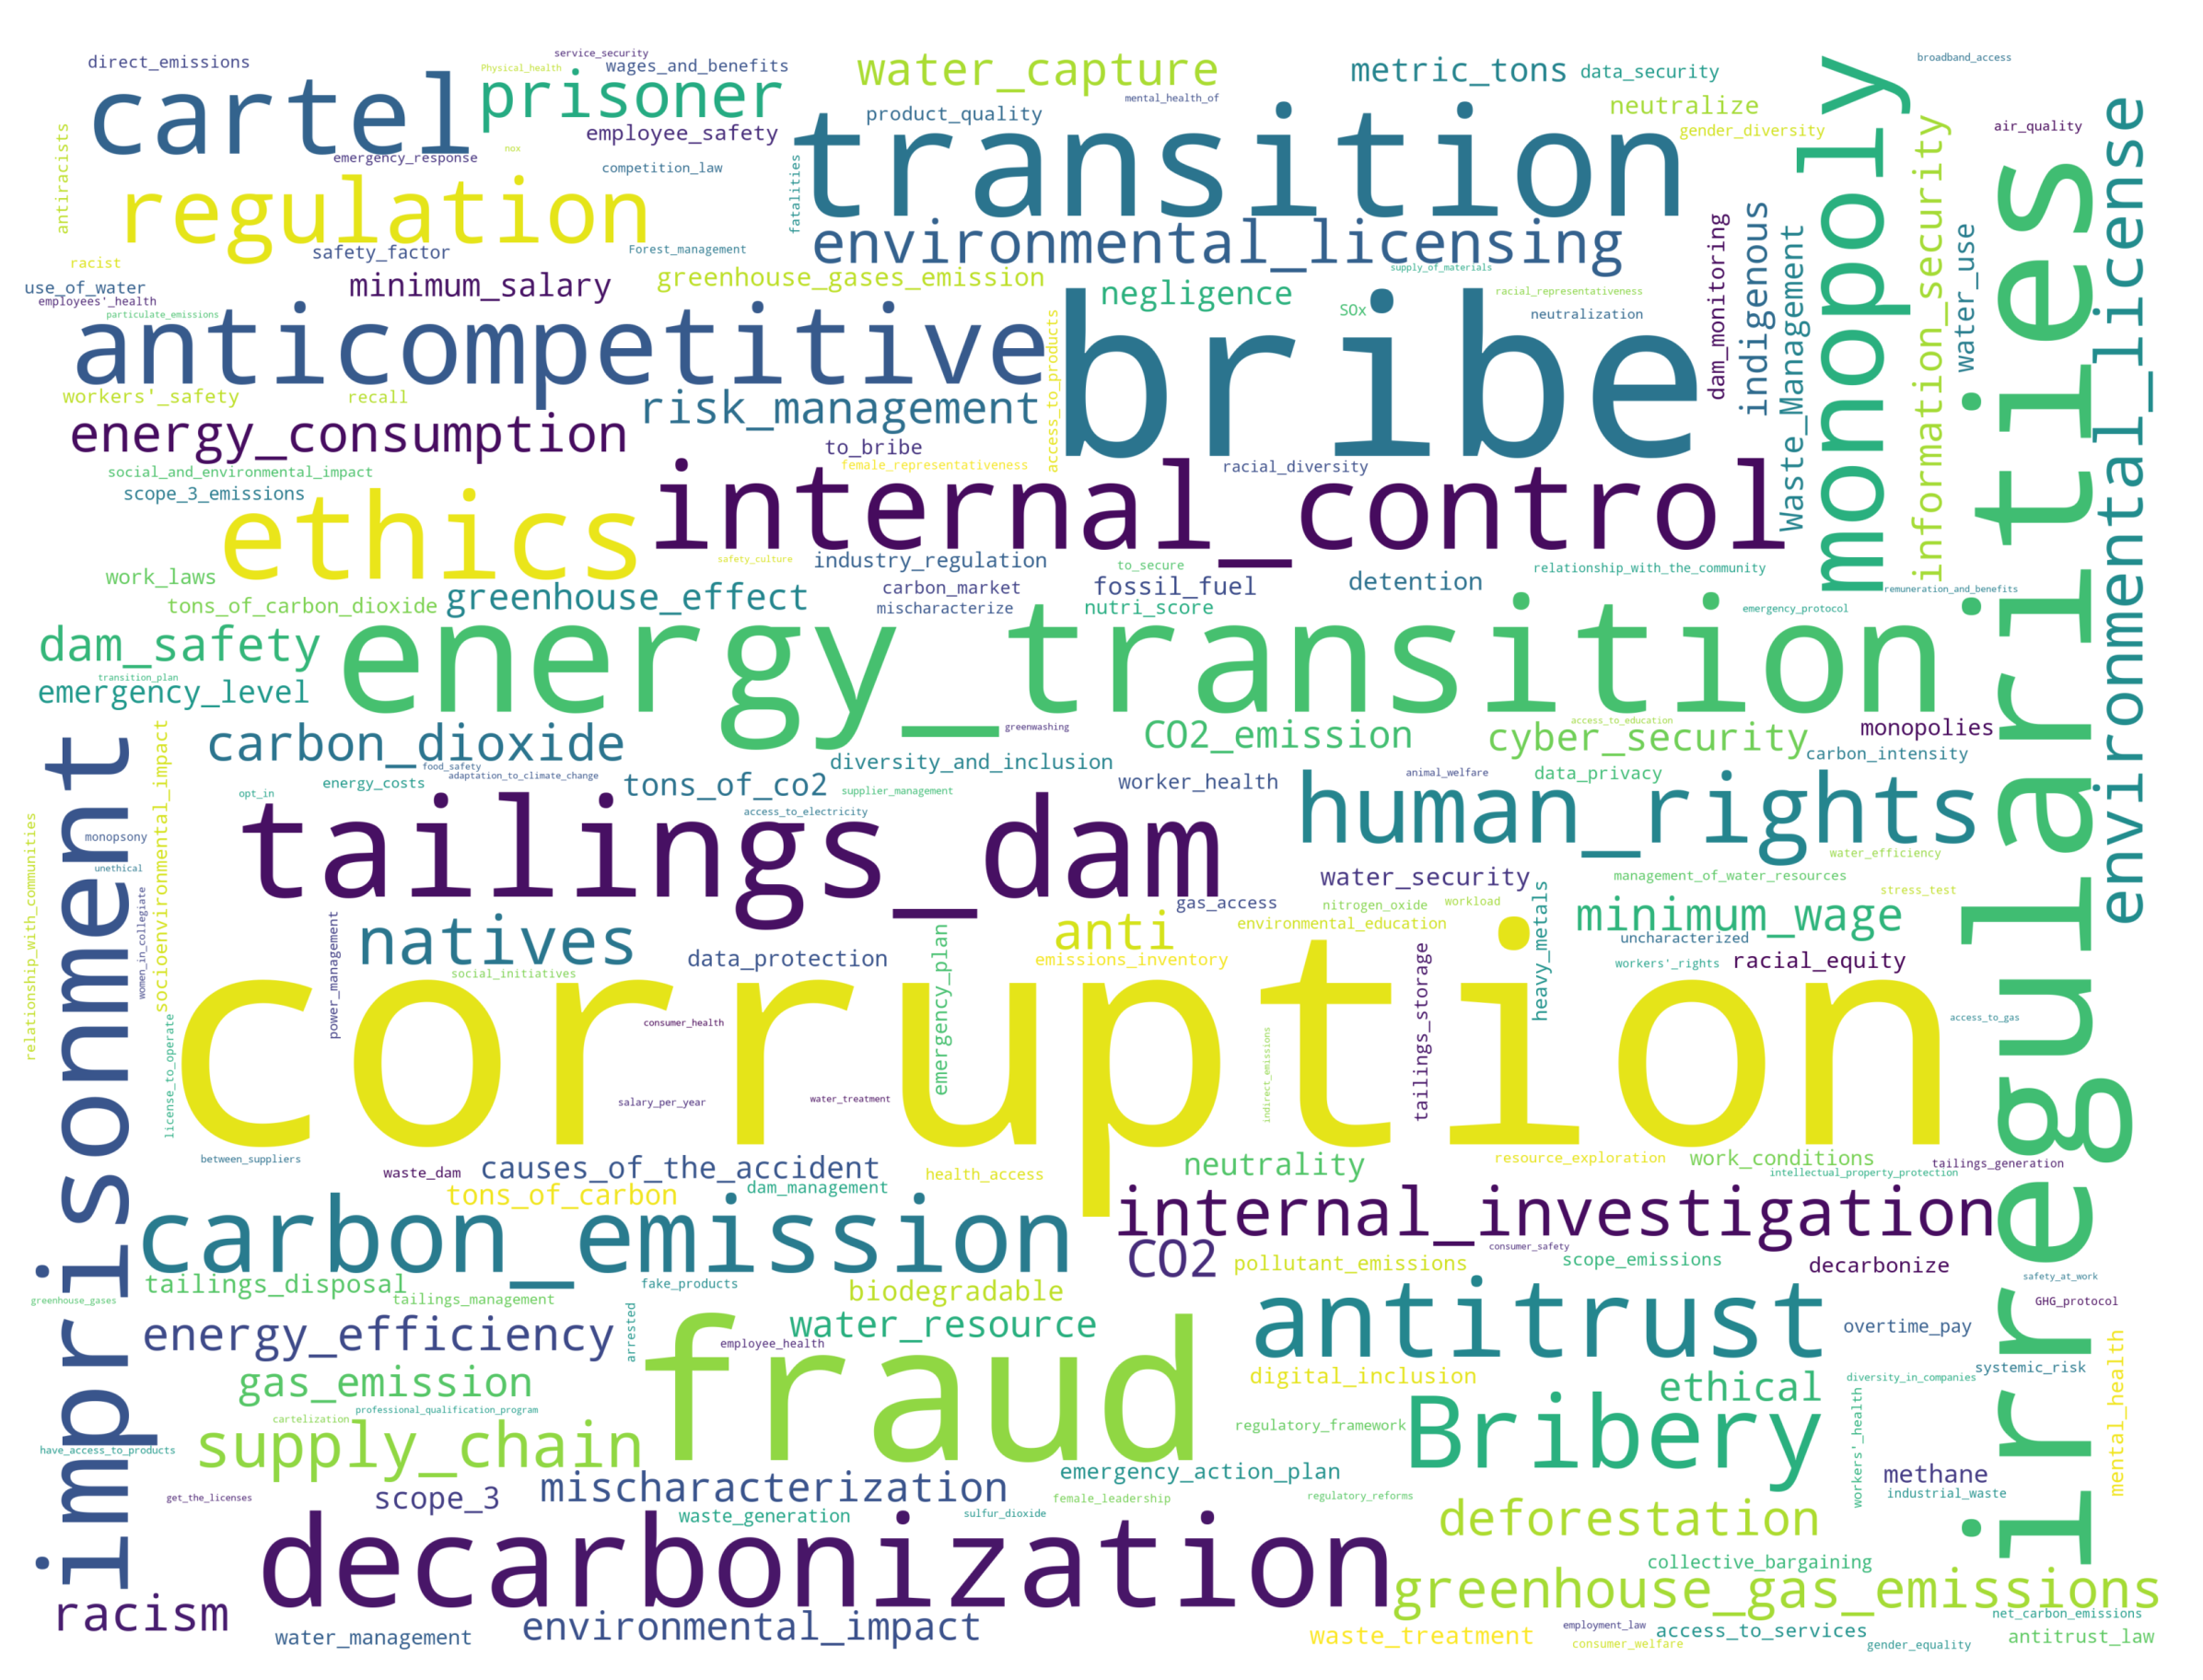
Table 1 shows the number of news articles for each of the 26 SASB categories. This table shows a high volume of news articles related to corruption in the Business Ethics category. Furthermore,
Figure 3 presents terms related to the ESG categories, where we see the predominance of corruption-related terms such as corruption itself, bribe, and fraud.
Regarding the financial data of the companies, we obtained the closing prices of the stocks from Bloomberg.
3.2. Dictionary Construction
We create the Dictionary of ESG Terms through an iterative process. First, we generate a list of terms for each SASB category based on our interpretation of the generic categories description provided by SASB (each term also receives a classification in the classic ESG three dimensions). For example, the term `Carbon Emissions’ is associated with the `GHG Emissions’ category of SASB (and also with `Environment’ in the classic classification of the three ESG dimensions, Environment, Social, and Governance).
Second, based on the evaluation of a sample of ESG news articles from Valor Econômico, we augment our dictionary with a list of generic ESG terms that do not have a specific classification in SASB categories. We use a generic category for these terms. They are important for selecting ESG news items that may refer to SASB categories for which we do not yet have specific terms in our dictionary. By evaluating the news items after selection, it is possible to extract the specific terms from these categories. For example, the term `ESG’ itself is a generic term that will appear in news items about ESG, but this term alone is not associated with a specific SASB category. However, this term is useful for filtering ESG news items, and from the individual analysis of each filtered news item, we can identify which SASB category it pertains to. After identifying the news category, we check which specific terms should be included in our dictionary so that, in the filtering process, we can associate the news items with the SASB category to which they belong.
Third, we filter approximately 500 news items that contain at least one term from our initial dictionary and evaluate the performance of the classification of the news items into SASB categories, according to our judgment of the SASB classification, along with the three traditional ESG dimensions. We evaluate news by news, which terms we may add to the dictionary for each category/dimension, which ones we should modify, and which we should omit. Then, we update the dictionary and repeat the procedure twice, each time evaluating approximately 150 news items. Thus, in total, we evaluate a sample of around 800 news items to compose the dictionary. The proposed final ESG Dictionary is available at
https://doi.org/10.5281/zenodo.7789973 (accessed on 6 February 2024).
Creating and designing a dictionary that covers ESG terms is a challenging endeavor. One problem is dealing with terms that can be related to ESG but are generic enough to not be related to ESG in certain news articles. For example, the term ’neutrality’ can refer to neutrality in terms of greenhouse gas emissions, but is not specific enough to only appear in ESG-related news (such as news about fiscal neutrality in taxation). Another example is the term ’salary’, which can appear in news articles unrelated to ESG (such as the effect of high inflation on salaries) or refer to the implementation of fair wage policies, falling under the Labor Practices SASB category.
The second problem is dealing with terms that are specific to the ESG context but, without treatment, can be classified under more than one SASB category. For instance, the term `pollute’ can refer to both air and water pollution, indicating that it can fall under at least two distinct SASB categories.
To address these problems, we have two possible solutions that can be used individually or in combination. The first solution uses what we call conditional terms: terms that must appear in the same paragraph as the term being evaluated so that we classify the news into a specific category. For example, in order to classify a piece of news with the term `neutrality’ as news about Greenhouse Gas Emissions, we require that the same paragraph contain terms such as carbon, CO2 and carbon dioxide.
The second solution is to use compound terms instead of single terms. For instance, we use the term ’fair wage’ and some of its variations instead of the single term `salary’. Or, to identify news items that deal with the mental health of employees, we can use the compound term ’mental health’ together with the conditional terms `employees’ and `workers’ to classify the news item in the SASB Employee Health and Safety category.
A third problem is terms that belong to the ESG context but are also used in proper names. For instance, the term “CH4” (methane) falls under the SASB Greenhouse Gas Emissions category. However, there is a Brazilian company called CH4 Energia, and without proper treatment, we misclassify news about this company as belonging to an SASB category. As a solution, we create a list of proper names that we ignore in the process of classifying news into ESG/SASB categories.
After defining the Dictionary of ESG Terms, we assign a positive, negative, or neutral polarity to each term based on our experience evaluating ESG news. Then, we attach Portuguese translations of positive and negative terms from the Harvard IV-4 dictionary. Due to potential nuances lost in translation, we manually evaluate each term and suggest changes to conform to the ESG context when we deem it necessary. In our dictionary, 2876 terms are categorized as positive and 2856 as negative.
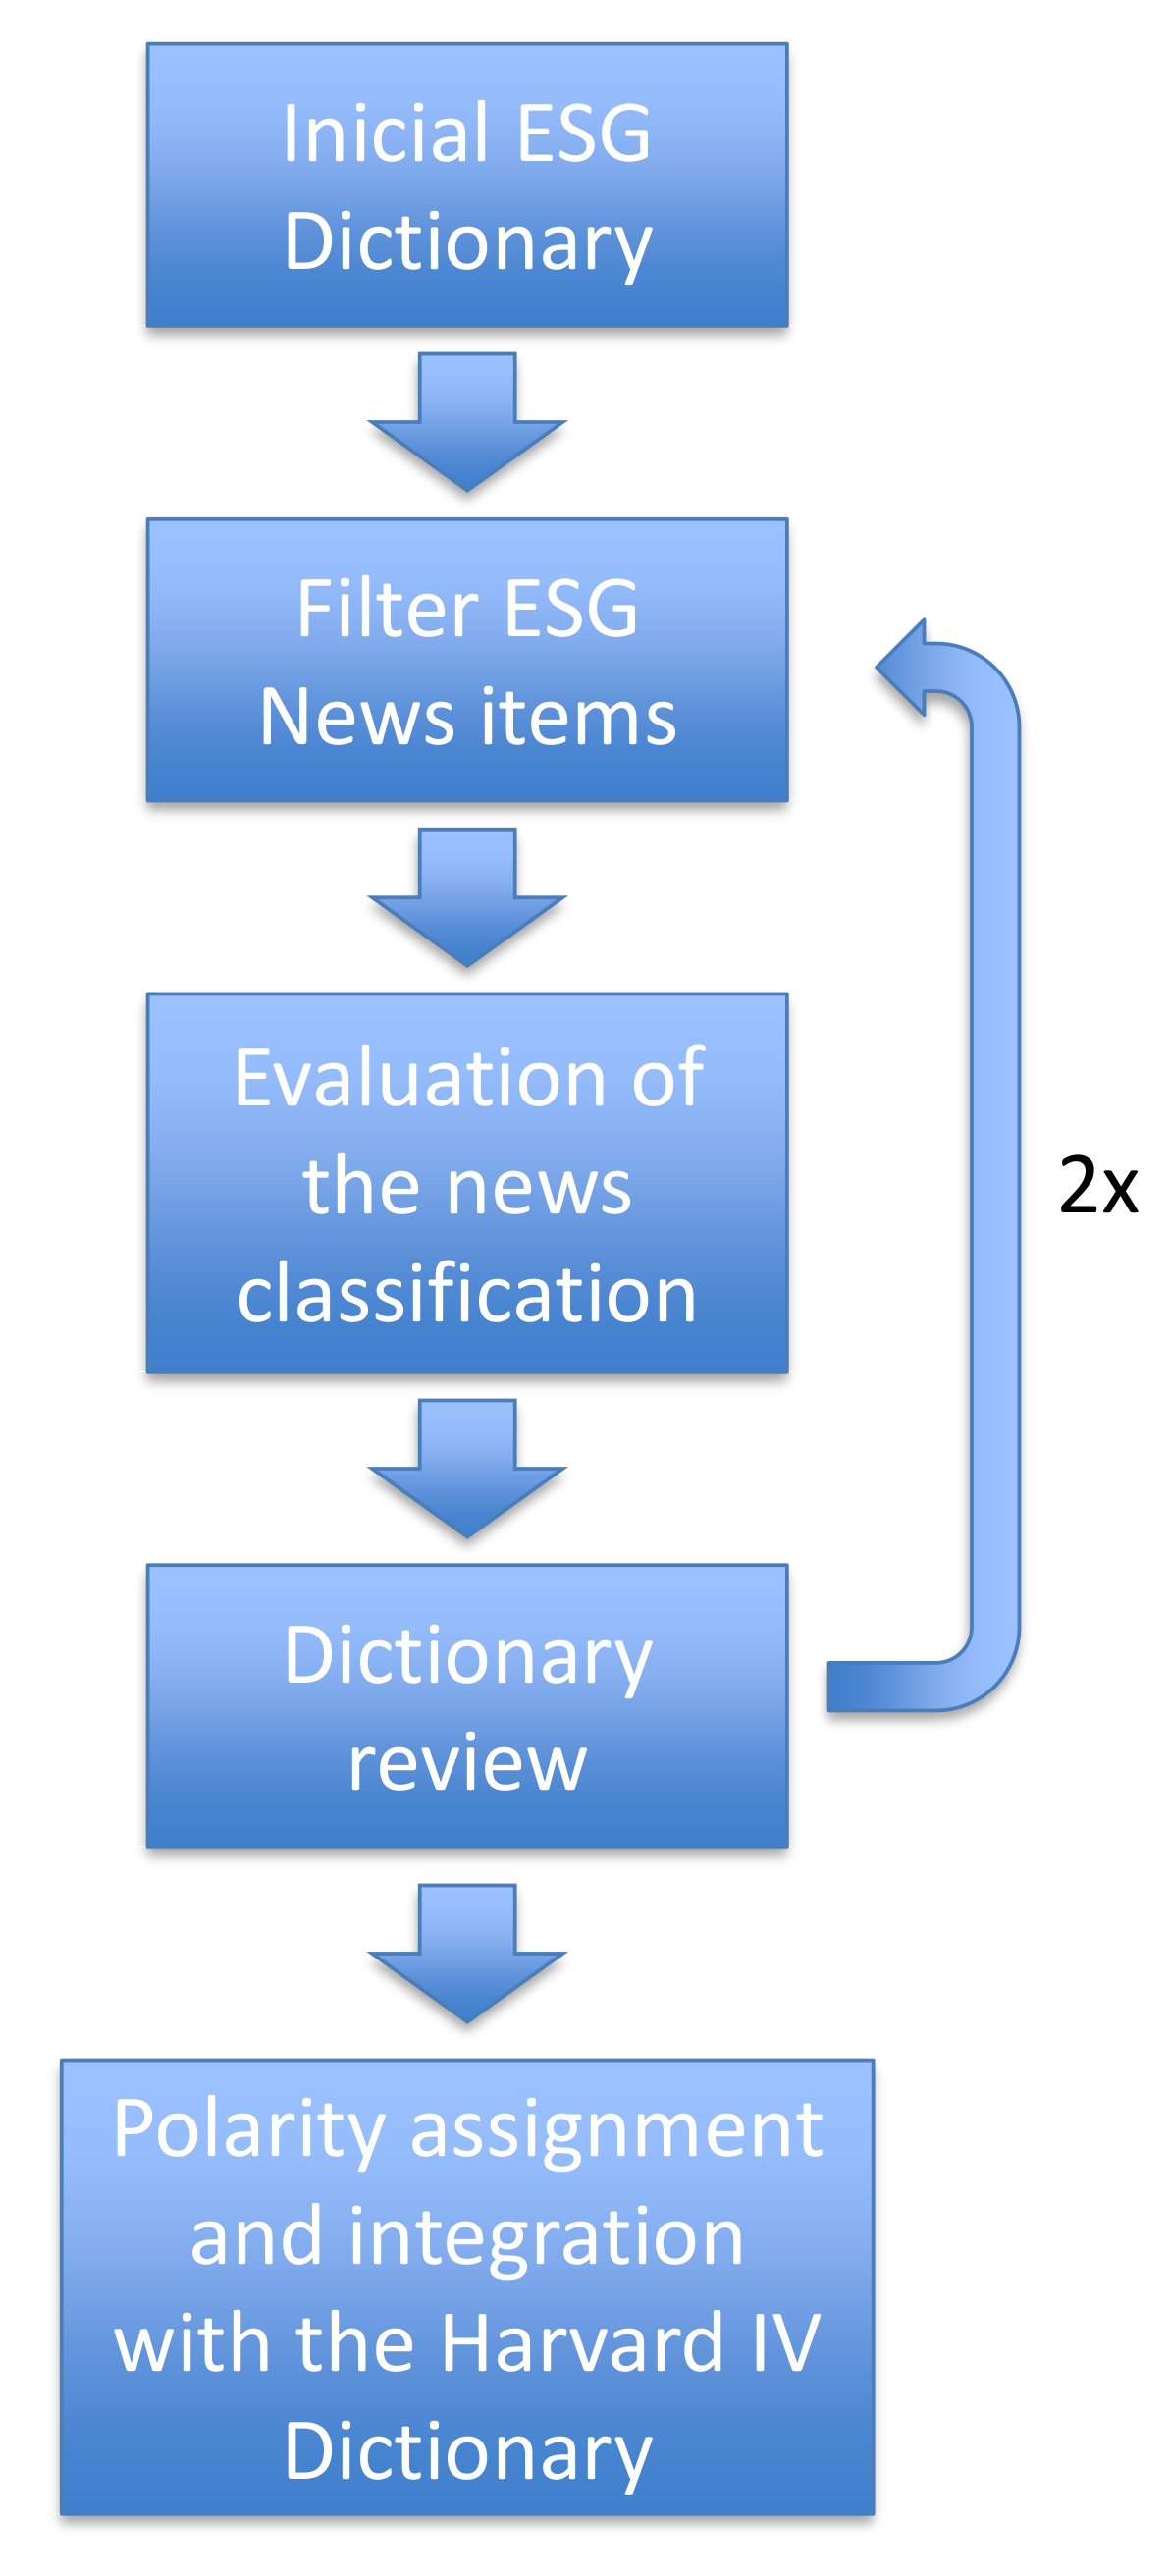
Figure 4 systematically illustrates the dictionary construction process.
3.3. Calculation of Abnormal Returns
We estimate the abnormal return
(or market-adjusted return) on day
t for each company
i as:
where
is the log return on the stock company
i in
t; that is,
, with
being the company
i stock closing price in
t, and
the log return of the Ibovespa index.
Consider that a news item is published at time t. The impact of ESG news on stock returns may not occur only at t. If the market has access to the information before the news is published, the market’s response may occur before t. Alternatively, even if the news is timely, the market may respond only in the days following the news publication, meaning that the stock response may occur after t. Thus, for news at time t, we also evaluate market-adjusted returns at and , and the cumulative abnormal returns from to and from to ( and , where , ). Therefore, we can evaluate the returns in these windows around the release date t of the news.
We exclude stocks worth less than R
$ 2.00 on the last sample date to avoid extreme abnormal returns [
16].
3.4. Definition of News Polarity
Using terms from the Sentiment Dictionary, we calculate the total number of positive and negative terms for each ESG news article. For this, we only consider the paragraphs that contain ESG terms [
31] or mentions of the company in question. We do this to capture the sentiment surrounding the ESG topic and the specific company while excluding any irrelevant noise from other parts of the news article that may not be related to the ESG topic.
We calculate the following sentiment index for each news story
j, where
refers to the total number of terms present in paragraphs that mention either the ESG topic or the company:
Table 2 provides descriptive statistics for the number of positive, negative, and total number of terms in paragraphs containing ESG terms or company mentions in each news item
j, as well
.
As shown in Equation (
2), we standardize
by subtracting it from its mean and dividing it by its standard deviation
We define positive news as news in the top quartile of the
distribution and negative news as in the bottom quartile [
53].
We know the exact minute of publication for each news item. We update what we call “news reference date” in accordance with stock exchange closing times. If the stock exchange closes at 5:00 p.m. on day t, then we consider news published after that time as news of day . We use the same method on weekends and holidays. If news comes out after the stock market closes on a Friday or the day before a holiday, the reference date will be the next business day of the stock exchange.
We then group the news by the reference date. We consider a date to be a positive (or negative) news date if it contains one or more positive (or negative) news stories. When there is at least one positive and one negative news item for the same company on the same date, we exclude the news (since the expected direction for stock returns would be ambiguous). This gives us the final set of news considered positive and negative for each SASB dimension, as shown in
Table 3. We can see that the Business Model and Innovation dimension has a very small number of negative news items. This is due to the fact that news about design and product lifecycle management, business model resilience, supply chain management, material sourcing, and efficiency tend to be overwhelmingly positive, whereas news about physical impact of climate change in the Brazilian context is still almost nonexistent. Concerning the Environment, Human Capital, and Social Capital dimensions, we classify approximately
of the news items as positive. In contrast, the Leadership and Governance dimension contains 70% of negative news, given the number of corruption-related stories.
Table 4 presents the news set, positive and negative, by industrial group. We can see that the statistics are in line with our previous conclusion: the lowest percentage of positive news is in the Extractives and Mineral Processing group, given the negative news regarding the Lava-Jato operation related to Petrobras.
Table 5 presents the descriptive statistics for the variables
,
,
,
,
relating to the final news set.
3.5. Data Panel
To estimate the reaction of companies’ stock prices to ESG news, we use a panel regression of Equation (
3) [
54]:
Our dependent variable, , is the abnormal return (market-adjusted return) for company i at t. and are our main independent variables, which indicate whether on day t company i had positive or negative ESG news. We control the unobserved industry-specific factors that might affect the abnormal return of a company with industry fixed effects () and we control for external events or conditions affecting all companies on a particular day with date fixed effects (). For industry fixed effects, we consider classification into SASB industry groups.
We include several control variables obtained from Bloomberg to account for other factors that might influence the abnormal market-adjusted return of a company’s stock. These variables are: Current Market Cap (log), which is the logarithm of the company’s total market value and reflects its size; Price to Book Ratio, a financial ratio that compares a company’s market price to its book value, indicating the market’s valuation of the company relative to its actual worth; Return on Common Equity, which measures a company’s profitability by revealing how much profit it generates with the money shareholders have invested, indicating efficiency in generating profits; Total Debt/Total Assets, a ratio that shows the proportion of a company’s assets that are financed by debt, indicating the level of financial leverage; Capital Expenditures/Property, Plant and Equipment, a ratio that indicates how much a company is investing in its physical assets, reflecting growth and maintenance strategies; Selling, General and Administrative Expense/Sales Revenue, a measure of operational efficiency that shows what percentage of sales revenue is consumed by selling, general, and administrative expenses; Advertising Expenses/Sales Revenue, which reveals how much of the sales revenue is being spent on advertising, indicating the company’s investment in market presence; and R&D Expense/Sales Revenue, a measure of how much of the sales revenue is invested back into research and development, reflecting the company’s commitment to innovation.
Consider that news about company
i is published at time
t. If the market has access to the information before the news publication, any stock reaction, if there is one, may be observed before
t. Alternatively, even when the news is published timely, the market’s reaction may occur after the news publication date at
t. Therefore, to capture the full impact of ESG news on stock returns, we also evaluate market-adjusted returns at
and
, and from
to
and
to
; that is, we consider
,
,
and
replacing
in Equation (
3).
4. Results
Table 6 displays the regression results of Equation (
3) for the set of positive and negative news. Price reactions are directly proportional to the news sentiment. In other words, positive (negative) price reactions are statistically significant in response to positive (negative) ESG news. Thus, we found evidence that investors care about ESG issues, both positively and negatively. On average, the price reaction to positive news is 21 basis points on the release date, 53 basis points in the 2-day window between the day before the release of the news (
) and the day of the release (
t), and 75 basis points in the window from
to
t. As for negative news, the average price reaction on the date of release is minus 24 basis points, and minus 69 basis points in the 2-day window between the previous day and the date of release.
Similarly to [
3], we rerun the panel regression of Equation (
3) for the news set containing material topics and for the news set excluding material topics.
Table 7 shows the results. There are statistically significant directly proportional price reactions to both positive and negative news in the news set containing only material topics. The average price reaction to positive news is 28 basis points on the release date and 68 basis points between
and
t. As for negative news, the average price reaction on news release date
t is minus 31 basis points, minus 75 points over the 2-day period from
to
t, and minus 117 basis points over the 5-day period from
to
t. However, as shown in Panel B of
Table 7, there is no statistically significant price reaction to news that does not contain topics deemed material by SASB, regardless of whether the news is positive or negative.
We perform another exercise in which we divide the news by SASB dimension and run separately a regression for each dimension. Panels A and B of
Table 8 and
Table 9 present the results for the Environment and Leadership and Governance dimensions, taking into account all news of the dimension and only news with material topics. It is worth noting that the average price reaction for the Environment dimension is similar to the previous result: prices react directly proportional to the news sentiment. In absolute terms, however, the coefficients are on average greater than when we evaluate all dimensions collectively.
As for the Leadership and Governance dimension, an interesting result emerges: only negative news causes a price reaction. Positive news does not result in a statistically significant price increase. As Panel B of
Table 9 demonstrates, this result holds true when considering only news with material topics.
As shown in
Figure 1, Social Capital, Business Model and Innovation, and Human Capital do not account for more than eight percent of each of the total news. Due to the limited number of observations, we grouped news from these three dimensions for a new regression, which is presented in Panel C of
Table 8 for all news and
Table 9 for news with material topics. We find statistically significant price reactions for this grouping only when considering the set of news with material topics: in this case, on the date
t for positive news and on the date
for negative news.
We also ran the regressions for a sample of news with financially material content, but excluding news from Operation Lava-Jato. The results are presented in
Appendix B. As we can see, the results are similar to the general results presented in Panel A of
Table 7: the reaction of stock prices is directly proportional to the sentiment of the news, both positive and negative.
The SASB standard was officially launched in November 2018 after six years of discussion. We then divide the sample into two periods, from 2014 to 2018 and from 2019 to 2022, to assess whether there are differences in price reactions pre and post-disclosure of the standards. We show the results of the regressions for news with financially material content in
Appendix C. We were able to replicate our previous results in the period from 2019 to 2022, where positive and negative news have a directly proportional impact on stock prices. However, for the period from 2014 to 2018, we found statistically significant results only for price reactions to negative news. We believe in three possible explanations for this outcome:
Reducing the sample size may have decreased the statistical test’s power;
Negative information is processed more thoroughly than positive information [
55], and generally, humans have a bias towards giving greater weight to negative events [
56]. Therefore, investors might react more strongly to negative news than to positive news [
13], which could explain the results of Panel A of
Table A2;
The SASB standard might have influenced investors’ perceptions of what should be considered financially material, thereby increasing market sensitivity to positive news in the period following the introduction of the SASB standard. Moreover, the growing awareness and interest of investors in ESG issues, partly stimulated by the introduction of the SASB standard, might have changed how news, especially positive news, impacts stock prices.
Due to the limitation of our sample size, we are unable to refute the first statement and thus provide more evidence in favor of the third statement. Therefore, we suggest that future work using larger databases explore this interesting issue.
5. Discussion
Recent research has sought to establish a causal link between ESG practices and companies’ market value, whereas there are many sources of information on companies’ ESG practices, news stands out for its timeliness and frequency. However, recent research in this area relies on commercial and non-transparent Big Data solutions. To address this gap, we propose a new ESG Dictionary that researchers can use to filter ESG news from regular ones, define news sentiment, and classify news based on SASB’s dimensions and categories. We evaluate the dictionary in the classification of news from 2014 to 2022 on the Valor Econômico portal. For the Brazilian case, we demonstrate that companies’ stock prices react directly proportional to ESG news sentiment, both to positive news (positive price reaction) and to negative news (negative price reaction). This result differs from [
16], who observes a negative price reaction to positive news, and [
5], who finds no price reaction to positive news.
We explore one advantage of our Dictionary of ESG Terms: the ability to classify news into SASB’s 26 categories and thus distinguish which news is related to topics considered financially material by SASB and which is not, for each industry group, and to determine whether there are differences in the stock returns of the companies. We also reach the same conclusion as [
3]: price reaction would only be significant when the news contains financially material information. In other words, we do not support the hypothesis that all ESG news is relevant to investors’ decision-making processes; investors would not react for reputational or non-financial reasons alone. However, unlike [
3], we found a negative reaction to negative news using only one news source.
The stock price responses of companies to news considered financially material show that ESG is important for companies if they feel a financial impact from their actions in this area. Therefore, if society believes it is important for companies to care about a specific ESG topic, it would be crucial for companies to explicitly feel some financial impact. Furthermore, this can be achieved through regulation, incentives, or penalties associated with violations. In other words, as an implication of the results found in this study, the government would have the power to direct companies’ initiatives within the ESG universe.
When we investigate the source of our result by SASB dimension, we find that the Leadership and Governance dimension did not exhibit a statistically significant price response to positive news. It is interesting to note that the Business Ethics category dominates this dimension, as shown in
Table 1, which captured a significant number of corruption-related news stories, particularly those pertaining to the Lava-Jato operation. Thus, there is evidence that investors respond negatively to corruption-related news, but not positively to positive news in this dimension of Governance. In other words, the results may vary depending on the set of ESG topics considered in each study, which may explain a portion of the discrepancy between previous works.
We also investigated the behavior of stock prices in a sample of news with financially material content, but excluding news about Operation Lava-Jato, seeking to verify if the Governance dimension is more important than the other dimensions in the context of ESG news in Brazil. However, the results in
Appendix B remain similar to previous ones, indicating that the response to news, whether positive or negative, persists even without the corruption news. Therefore, we did not find evidence that the Governance dimension “drives” the result in relation to the other dimensions.
Since the SASB standard was officially launched in November 2018, we divided the sample into two periods: from 2014 to 2018 and from 2019 to 2022. We then reran the financially material content regressions, as shown in
Appendix C. We were able to replicate our previous results for the period from 2019 to 2022. However, for the period from 2014 to 2018, we found statistically significant results only for price reactions to negative news. Unfortunately, it is difficult to ascertain whether this is due to a loss in statistical power or if the SASB standard has influenced investors’ perceptions.
Generally, in our findings, given that the news release date is t, the reaction occurs in t, or in some cases to t or to t. This indicates that a portion of the news is “old” or stale, implying that the market sometimes incorporates the information one or more days before its release. This is an interesting observation, and we believe that one hypothesis to explain this result is that some of the information of interest to investors, including ESG information, may be released earlier through platforms such as the Bloomberg and Reuters terminals. However, we are not aware of studies that investigate potential delays in news dissemination in traditional outlets, such as Valor Econômico, and specialized platforms aimed at market professionals like the Bloomberg and Reuters terminals. Therefore, this presents an interesting area for future research.
6. Conclusions
We chose the word list (dictionary) approach to filter news due to its simplicity and transparency compared to other methods (although it is laborious to construct and verify). It can be easily complemented for further research if needed, and as our results indicate, this method is effective in classifying ESG news.
To construct the Sentiment Dictionary, we attached the Harvard-IV dictionary to our dictionary, given that it is a generic dictionary. We believe it is a more conservative approach than using a finance-specific dictionary since the ESG context can be different from finance in general. We also addressed this issue by manually selecting words that we deemed most appropriate for our purpose.
Our dictionary was originally created in Portuguese, based on the evaluation of news in Portuguese. We have made available an English version of the dictionary. However, our dictionary has not been tested in languages other than Portuguese. To adapt it to other languages, some terms may need to be changed or added, depending on the language-specific nuances of ESG terminology. Nonetheless, we believe that using our dictionary as a starting point can significantly reduce the cost and effort required to build a similar dictionary from scratch.
Another limitation of our study is that our Dictionary of ESG Terms is based on our understanding of each SASB category’s generic description. Consequently, the dictionary is generic as opposed to industry-specific. Furthermore, the decision of which terms should be related to which SASB classification depends on the researcher’s evaluation and understanding of ESG news and SASB classification. A suggestion for future work is to compare our approach with another methodology of news classification, like a machine learning algorithm trained on a large corpus of news articles.
It is important to note that our analysis focuses on the impact on the market value of firms in the very short term, and we do not address the question of whether the market adequately rewards or punishes companies for their ESG practices over the long term (for a discussion of this topic, see [
4,
40,
57,
58]).
We do not use, as the dependent variable, industry-adjusted returns, because if news about a certain company also affects other companies in the same industry, we could be controlling for an effect that we are actually trying to capture [
3]. However, this approach could be interesting as a robustness test to deal with industry effects not captured by fixed effects of industry, date, and other control variables. However, we were unable to construct the industry return indices with only the sample used in this study, which contains 111 companies: ideally, its computation would use all the companies listed on B3. We also consider that the ideal would be the use of the SASB industry classification for the construction of the industry return indices. We suggest this as one of the possible future works.
We selected Valor Econômico as the news source for this study due to its leadership position as the largest economy, finance, and business newspaper in Brazil, extensively covering ESG topics in its reporting. Although the use of a single data source may introduce some bias into the results, we believe that merely increasing the number of sources does not necessarily imply a reduction in bias, given that other outlets may follow a similarly biased editorial line. Our choice, however, was a media outlet that strives to maintain an impartial editorial line. Furthermore, we believe that the information published by this news source is widely regarded and absorbed by the market. Thus, we follow the same approach as [
59], which uses only one news source to study the impact of news on stock price returns.
In fact, many other digital media sources in the country often replicate what they consider to be the most significant news from Valor Econômico. However, in our case, the inclusion of this type of media would not have an impact, as we use dummies in our regression for cases where there are positive or negative news items on a given day, unless we filter for a minimum number of news sources that have published news about a particular company and ESG topic on the same day, as in [
3]. This strategy could help filter news considered most relevant by the general media itself. Nevertheless, such an approach may introduce some bias in news selection, potentially favoring certain companies or specific types of news, such as negative developments on a particular ESG topic. This is a topic that we believe warrants further exploration in future studies.


