
Spatial-Performance Evaluation of Primary Health Care Facilities: Evidence from Xi’an, China


Abstract
1. Introduction
2. Methods and Materials
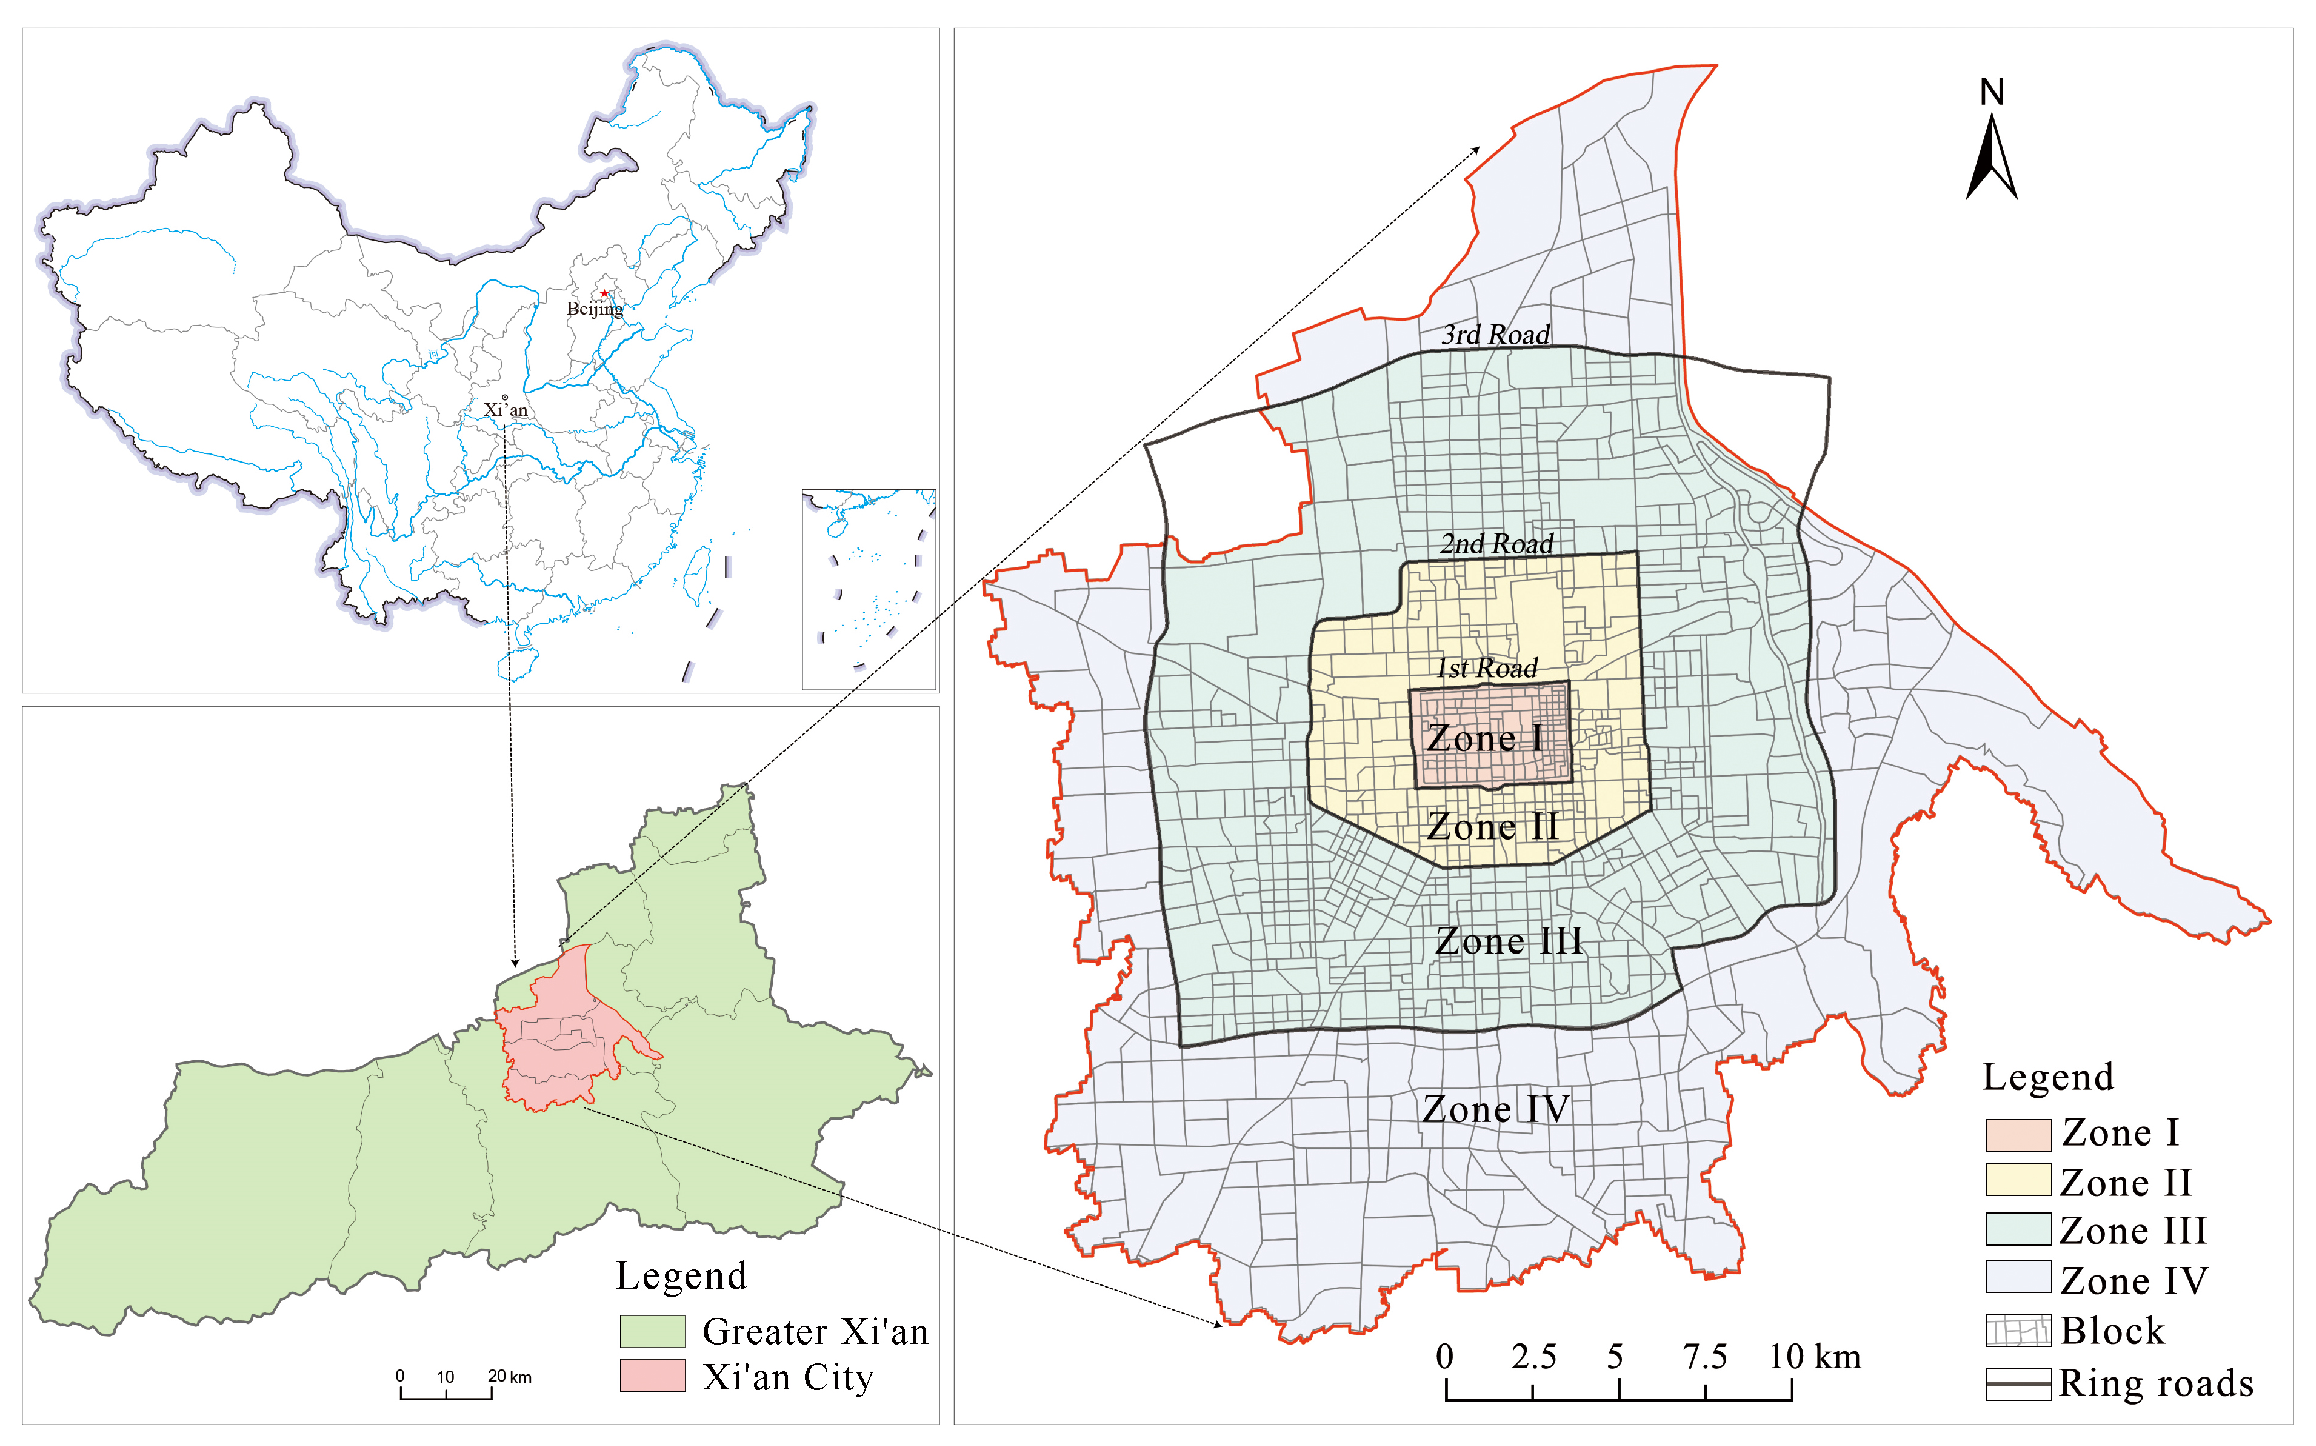
2.1. Study Area
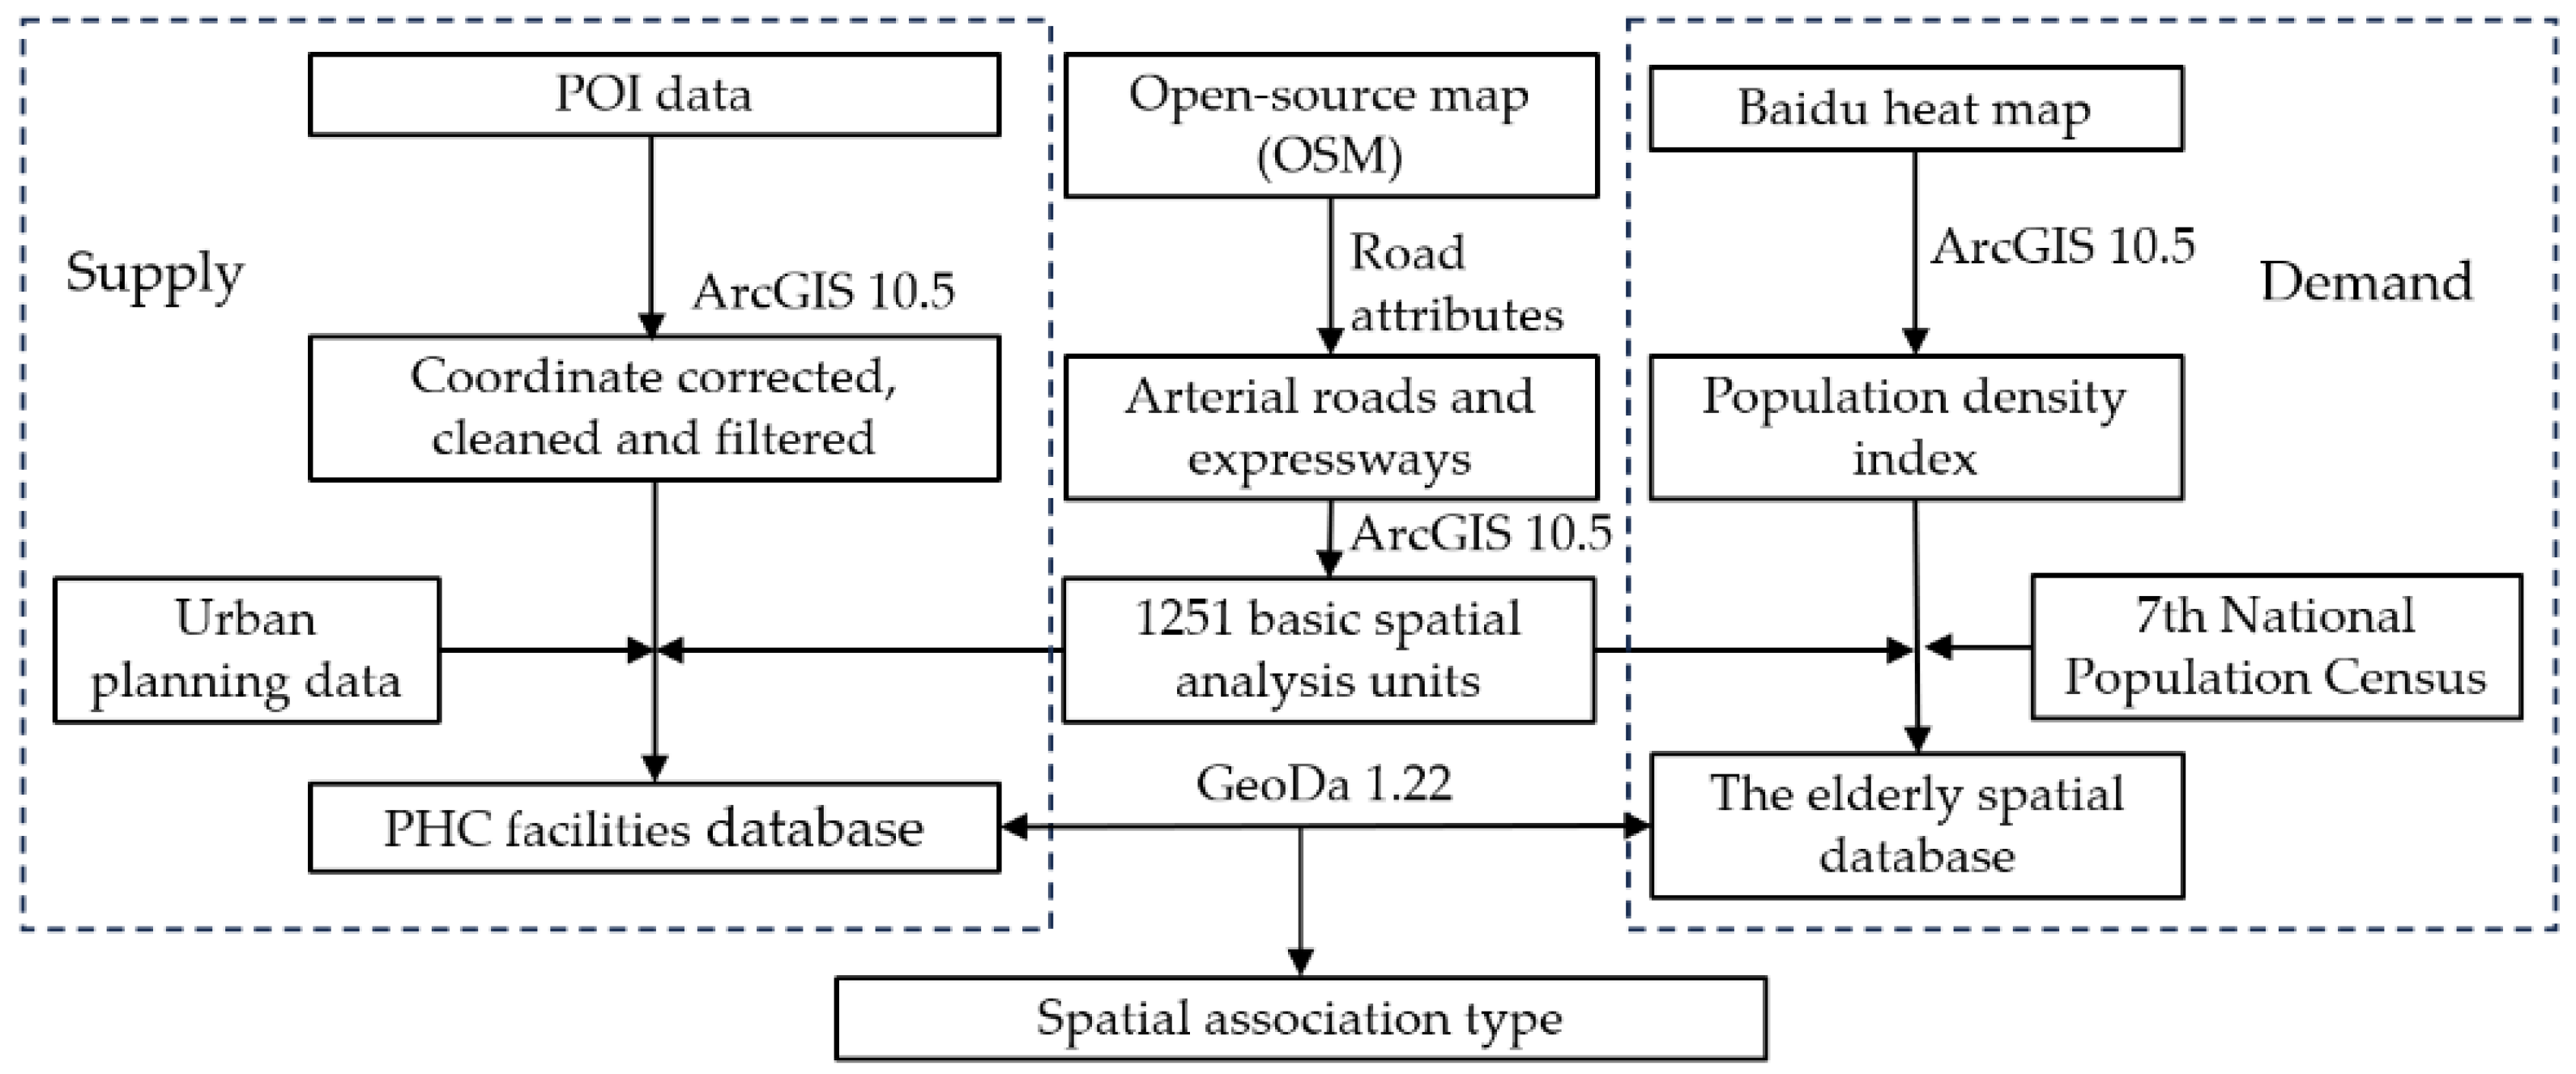
2.2. Data Sources
2.3. Methods
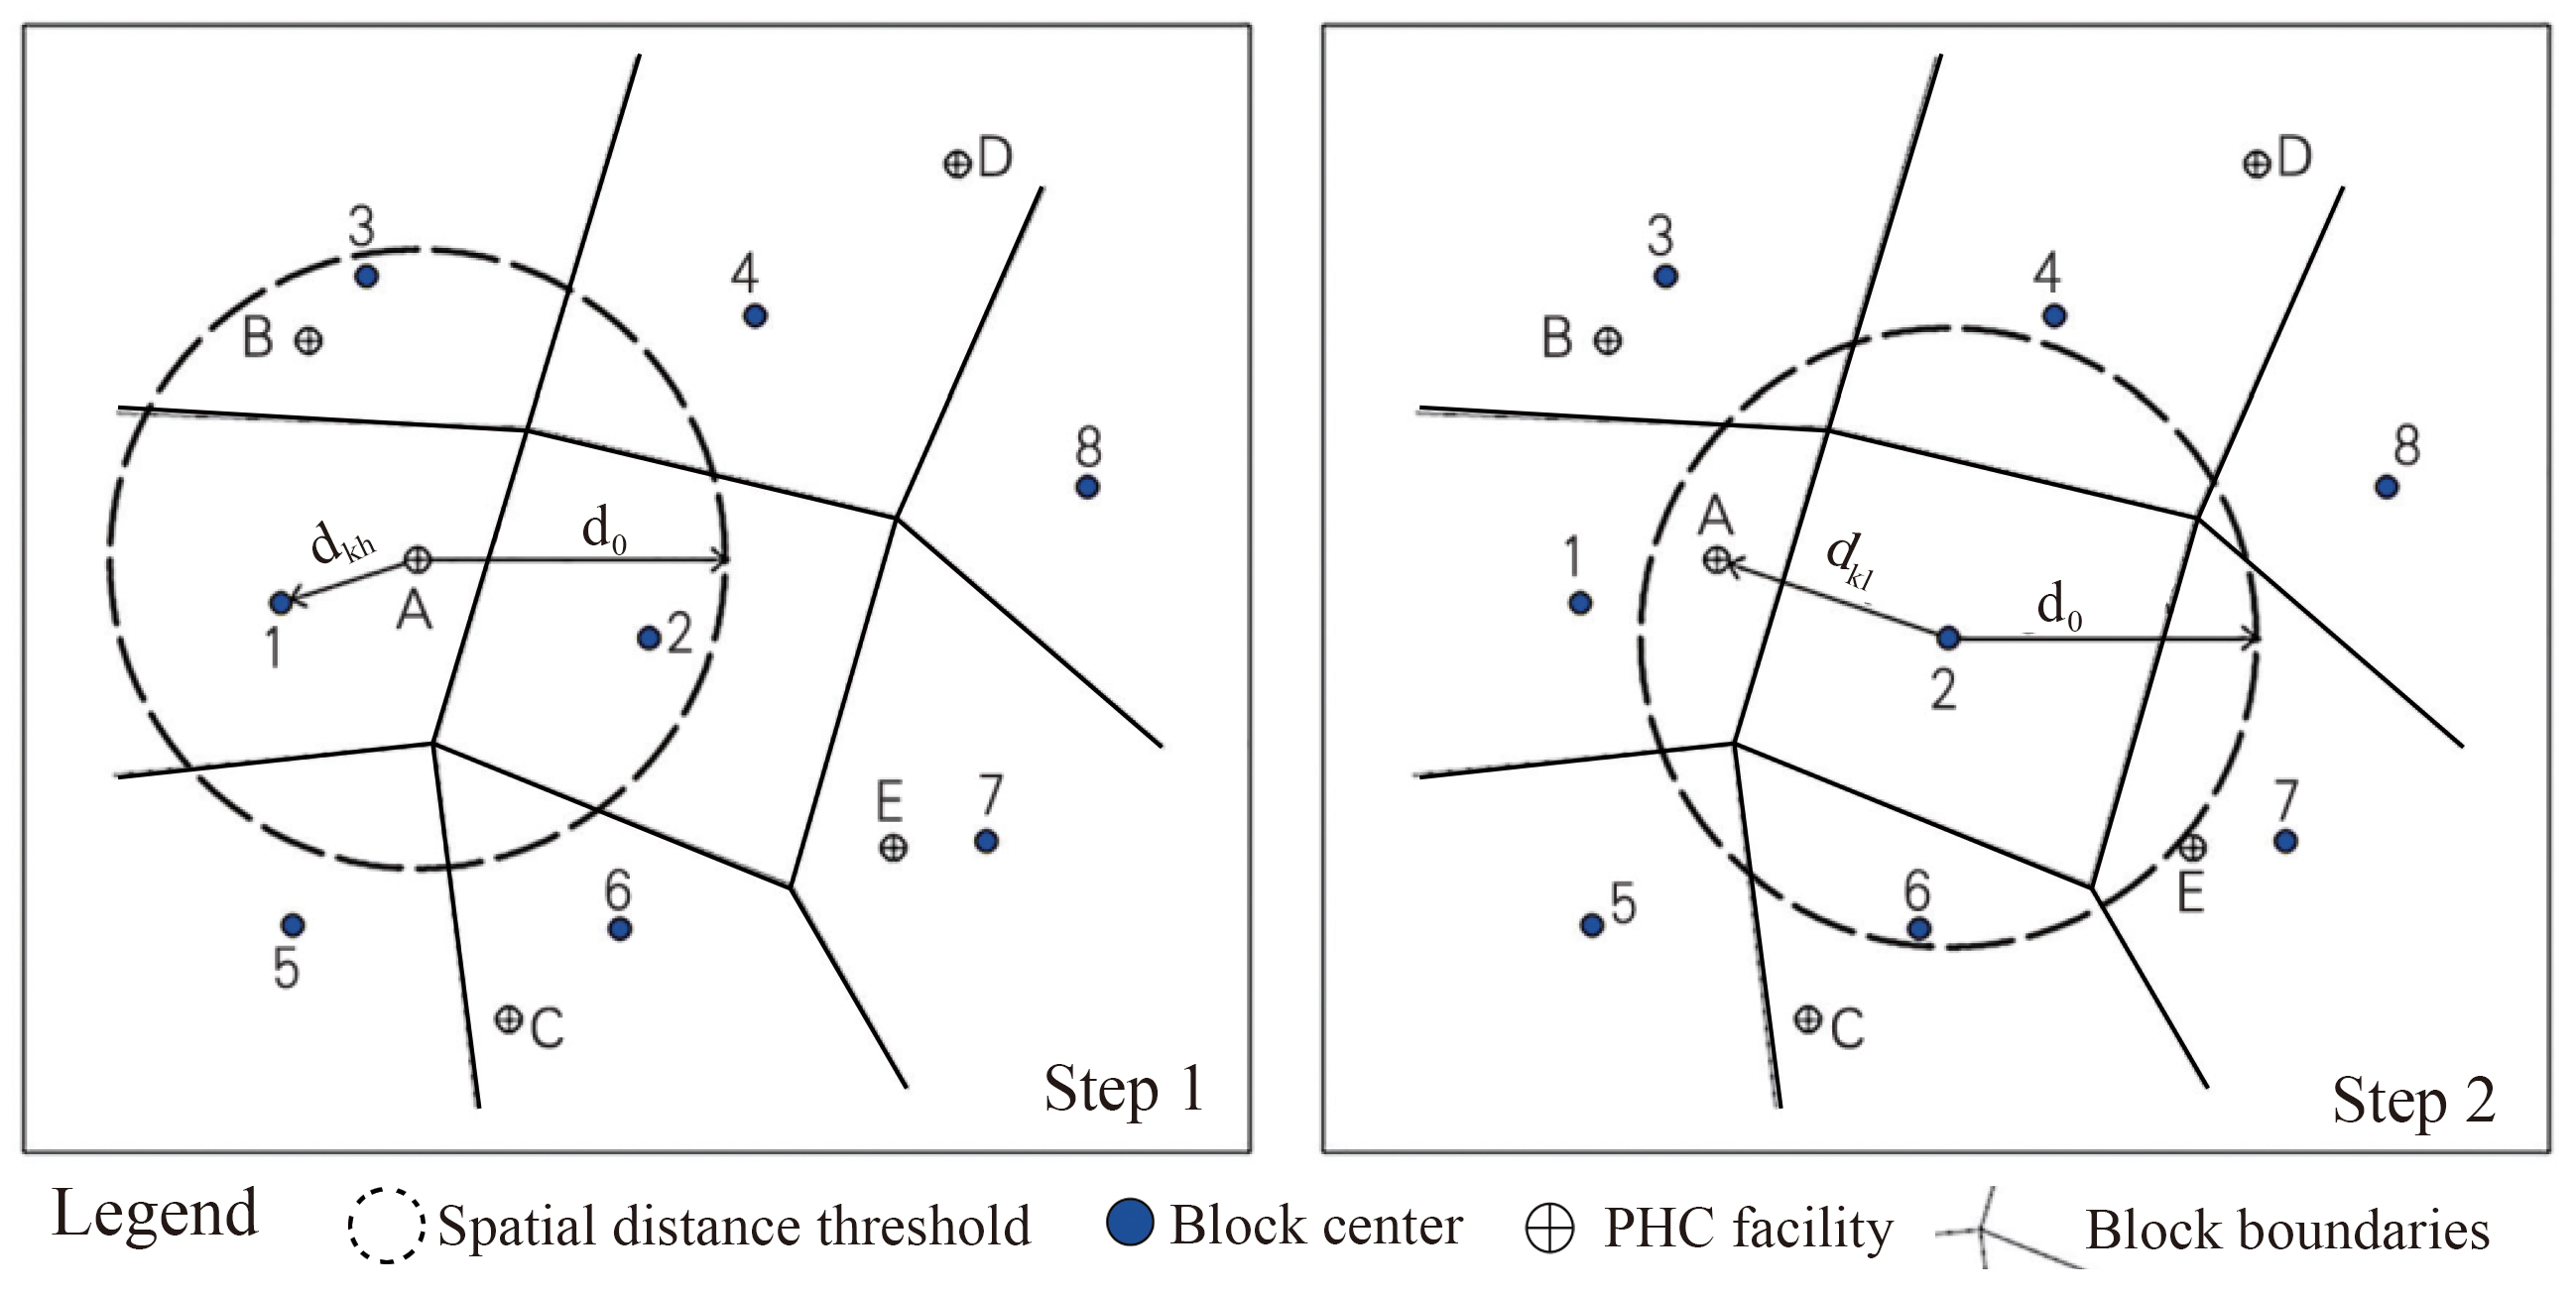
2.3.1. Ga2SFCA
2.3.2. Spatial Autocorrelation
3. Results
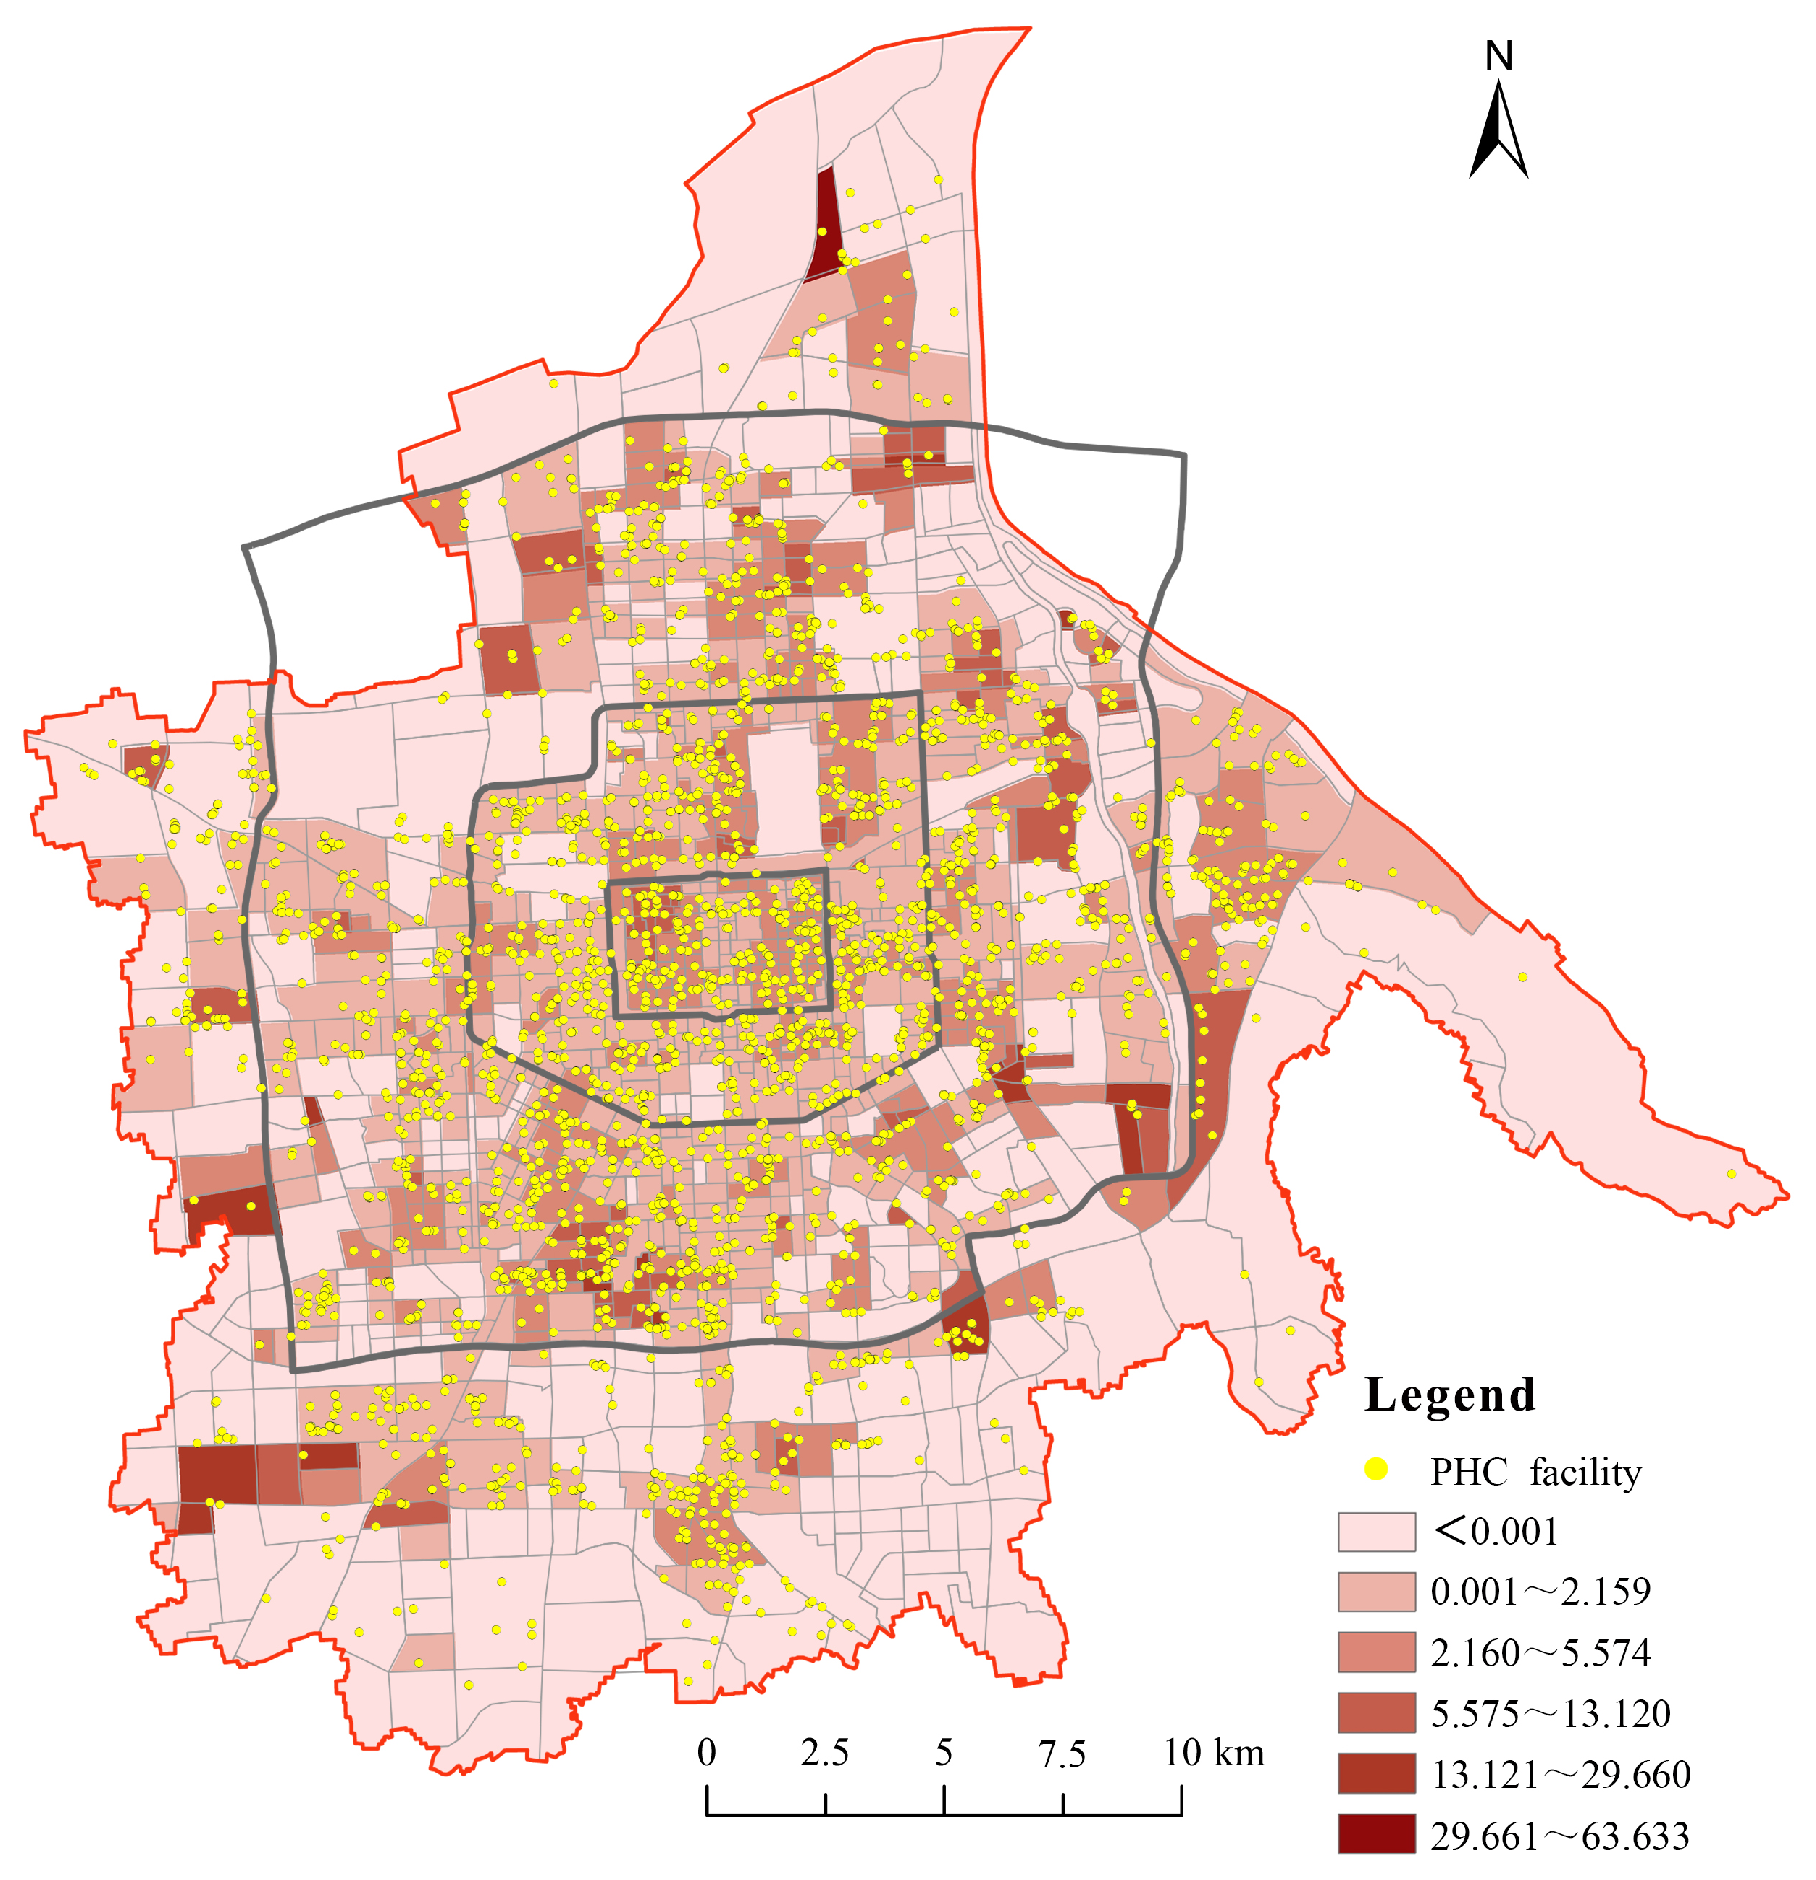
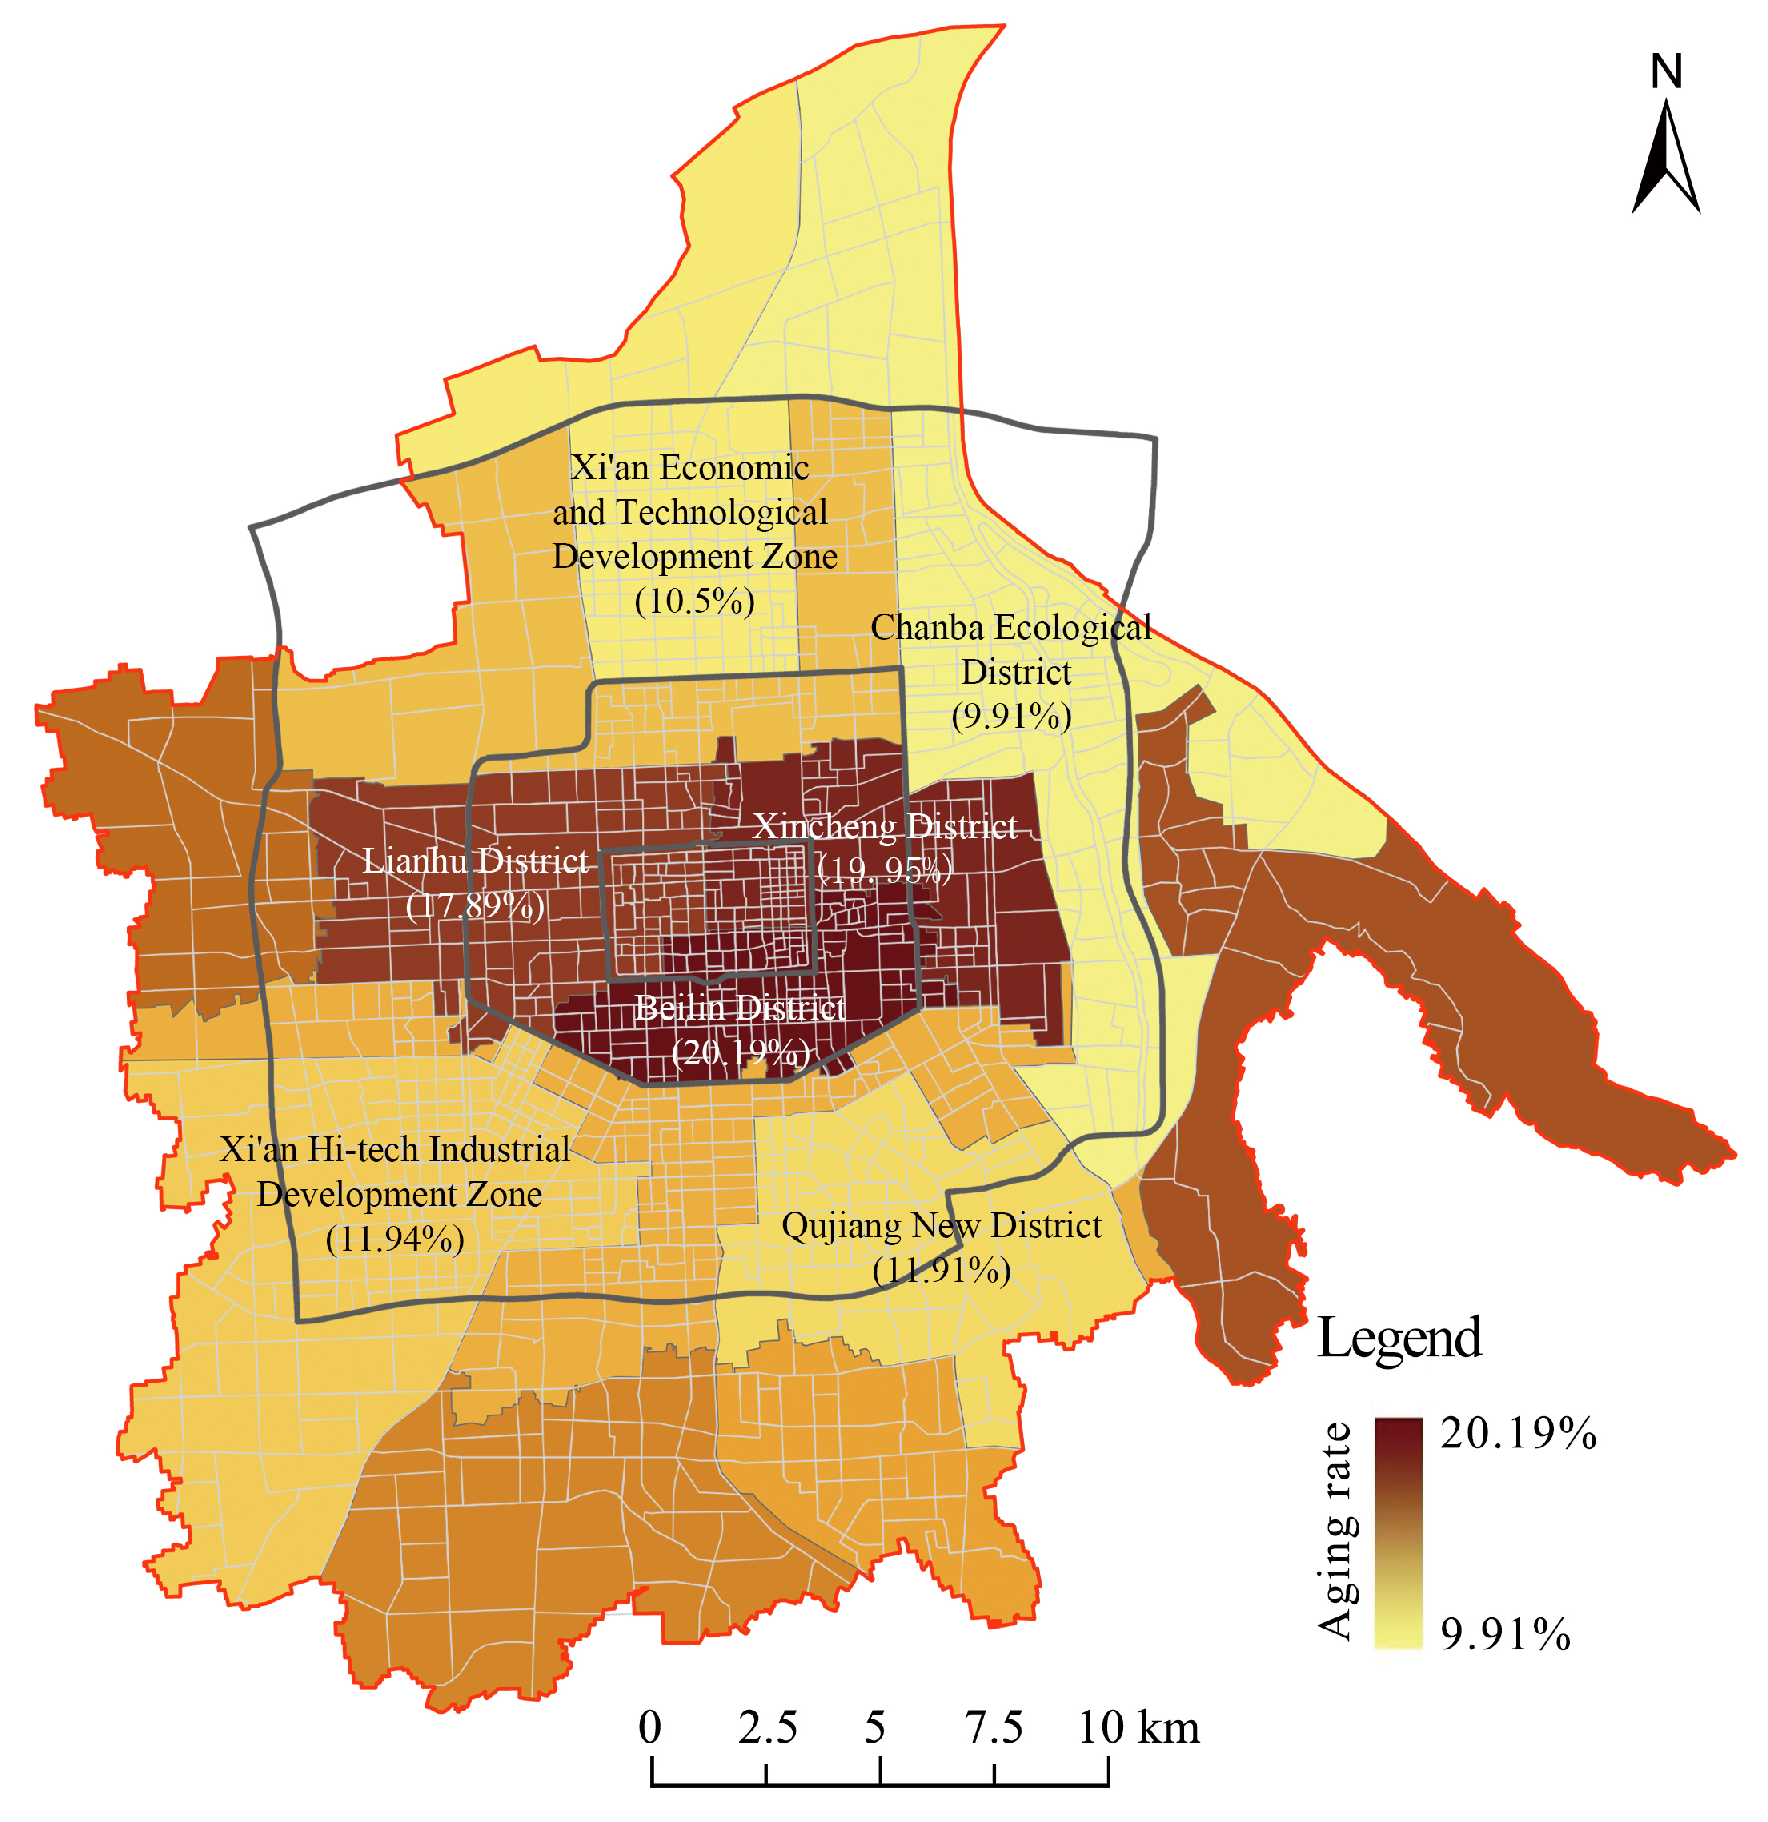
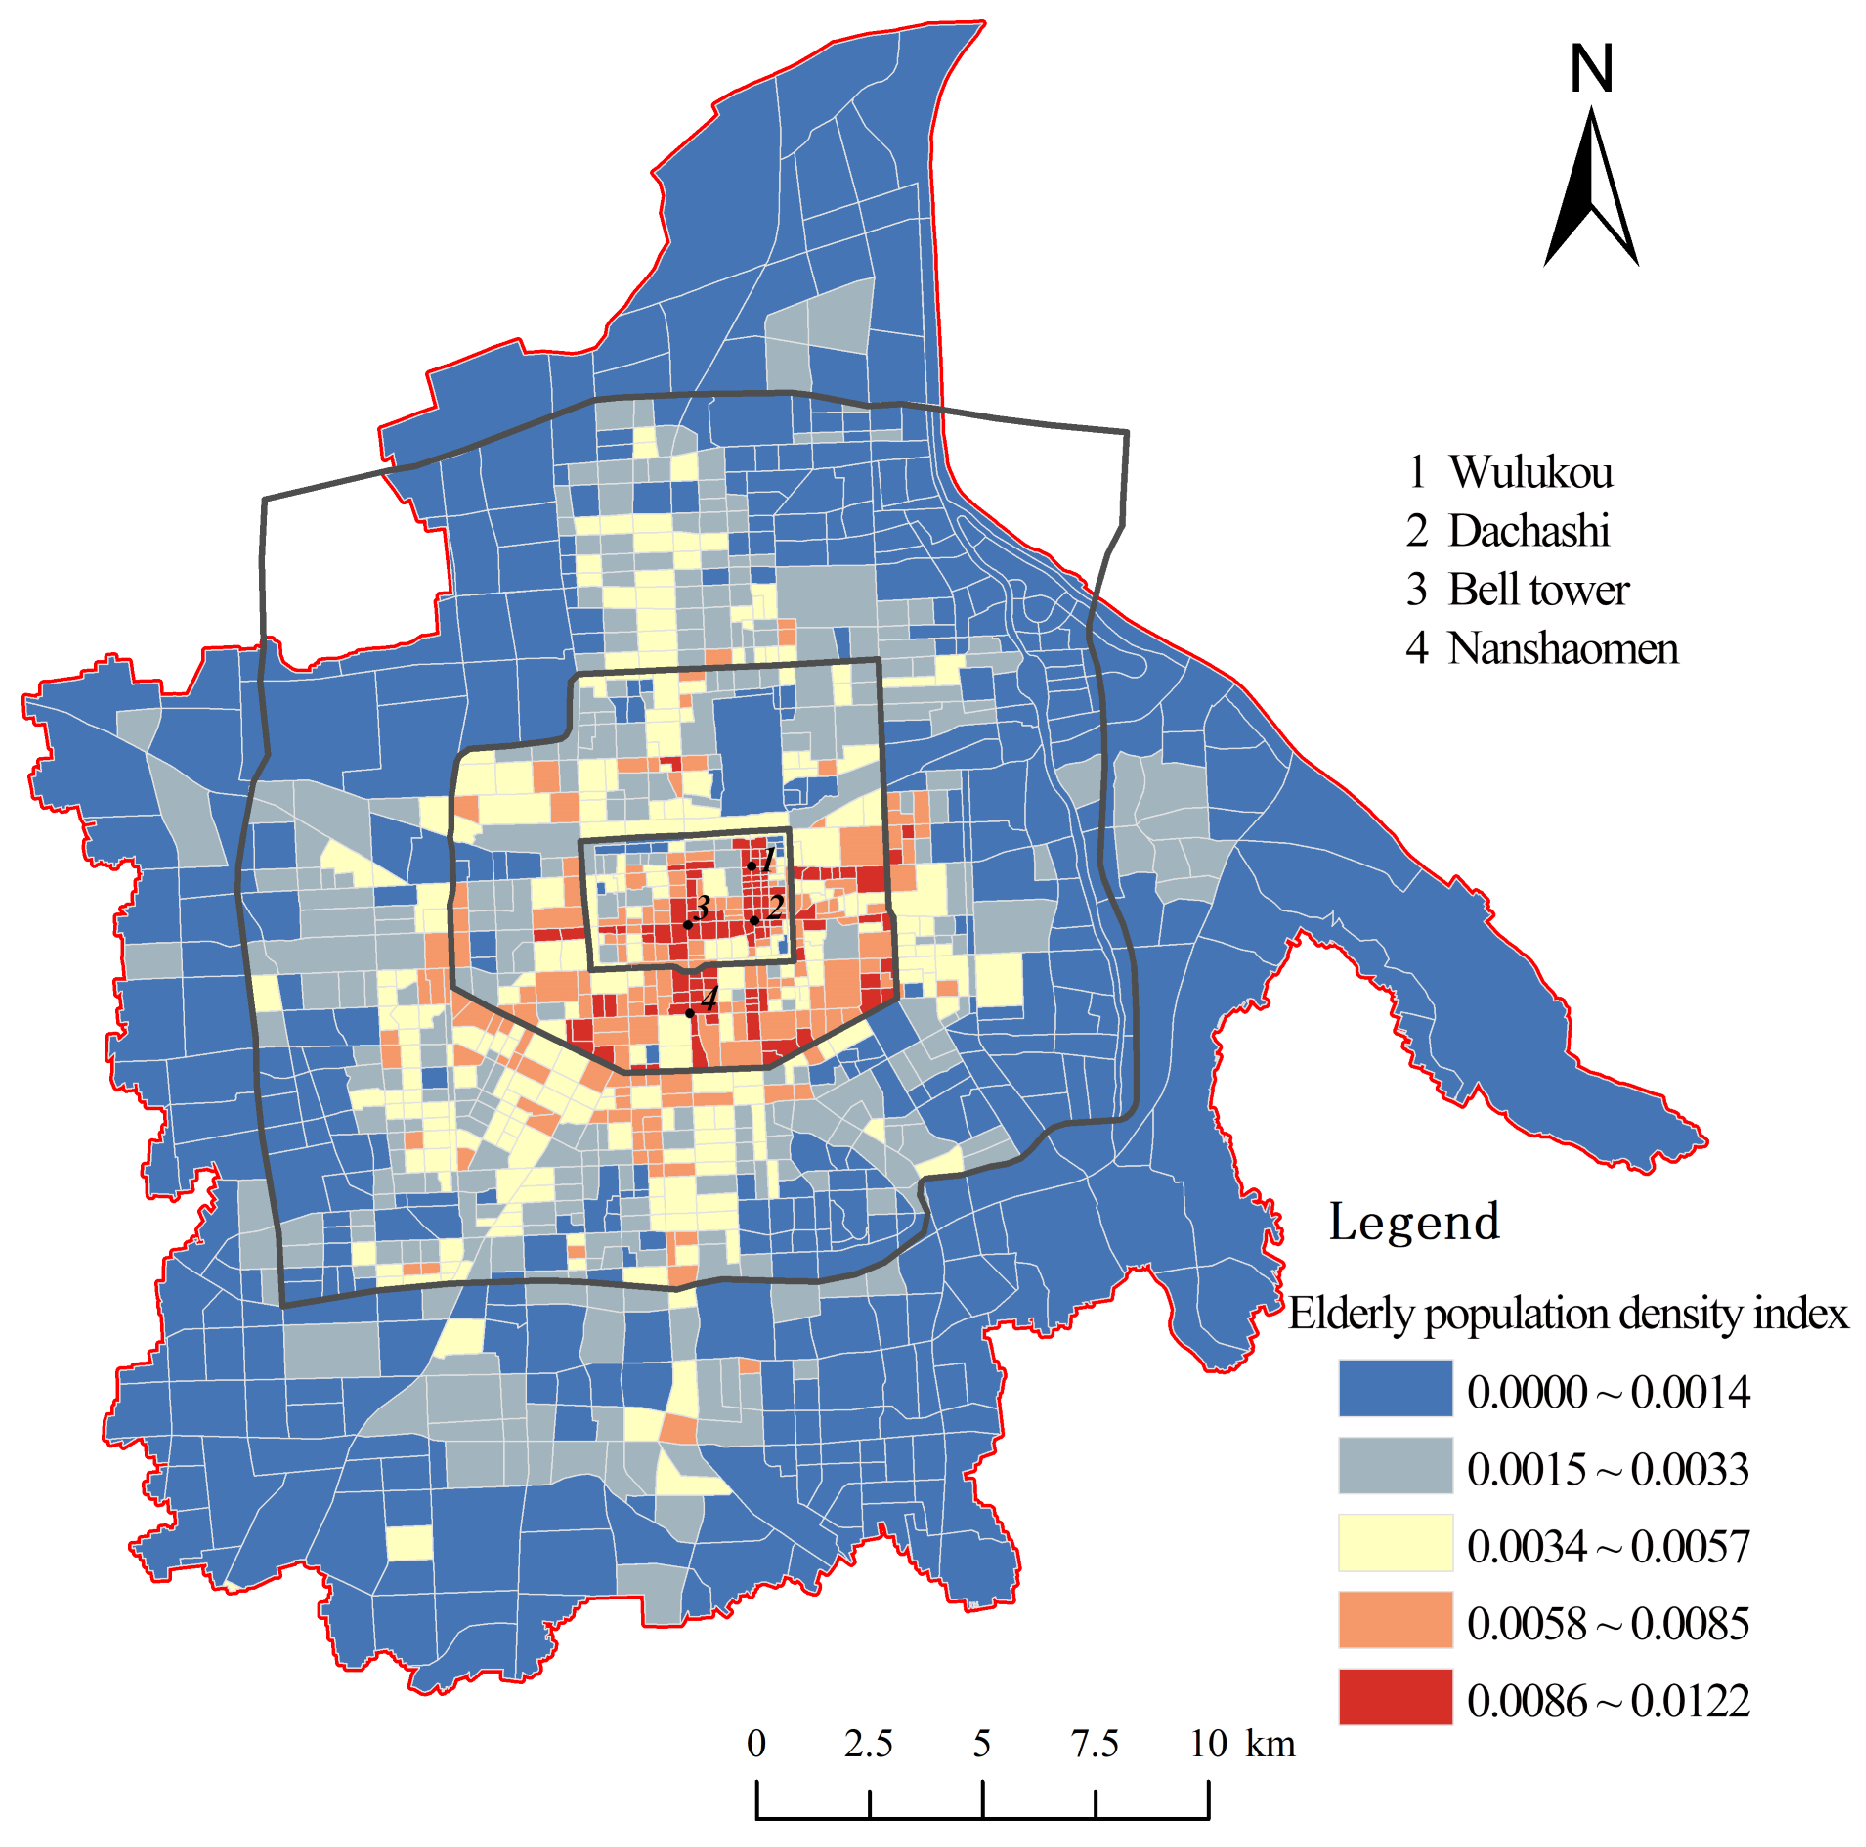
3.1. Spatial Characteristics of the Elderly Population
3.2. Spatial Characteristics of PHC Facilities’ Accessibility
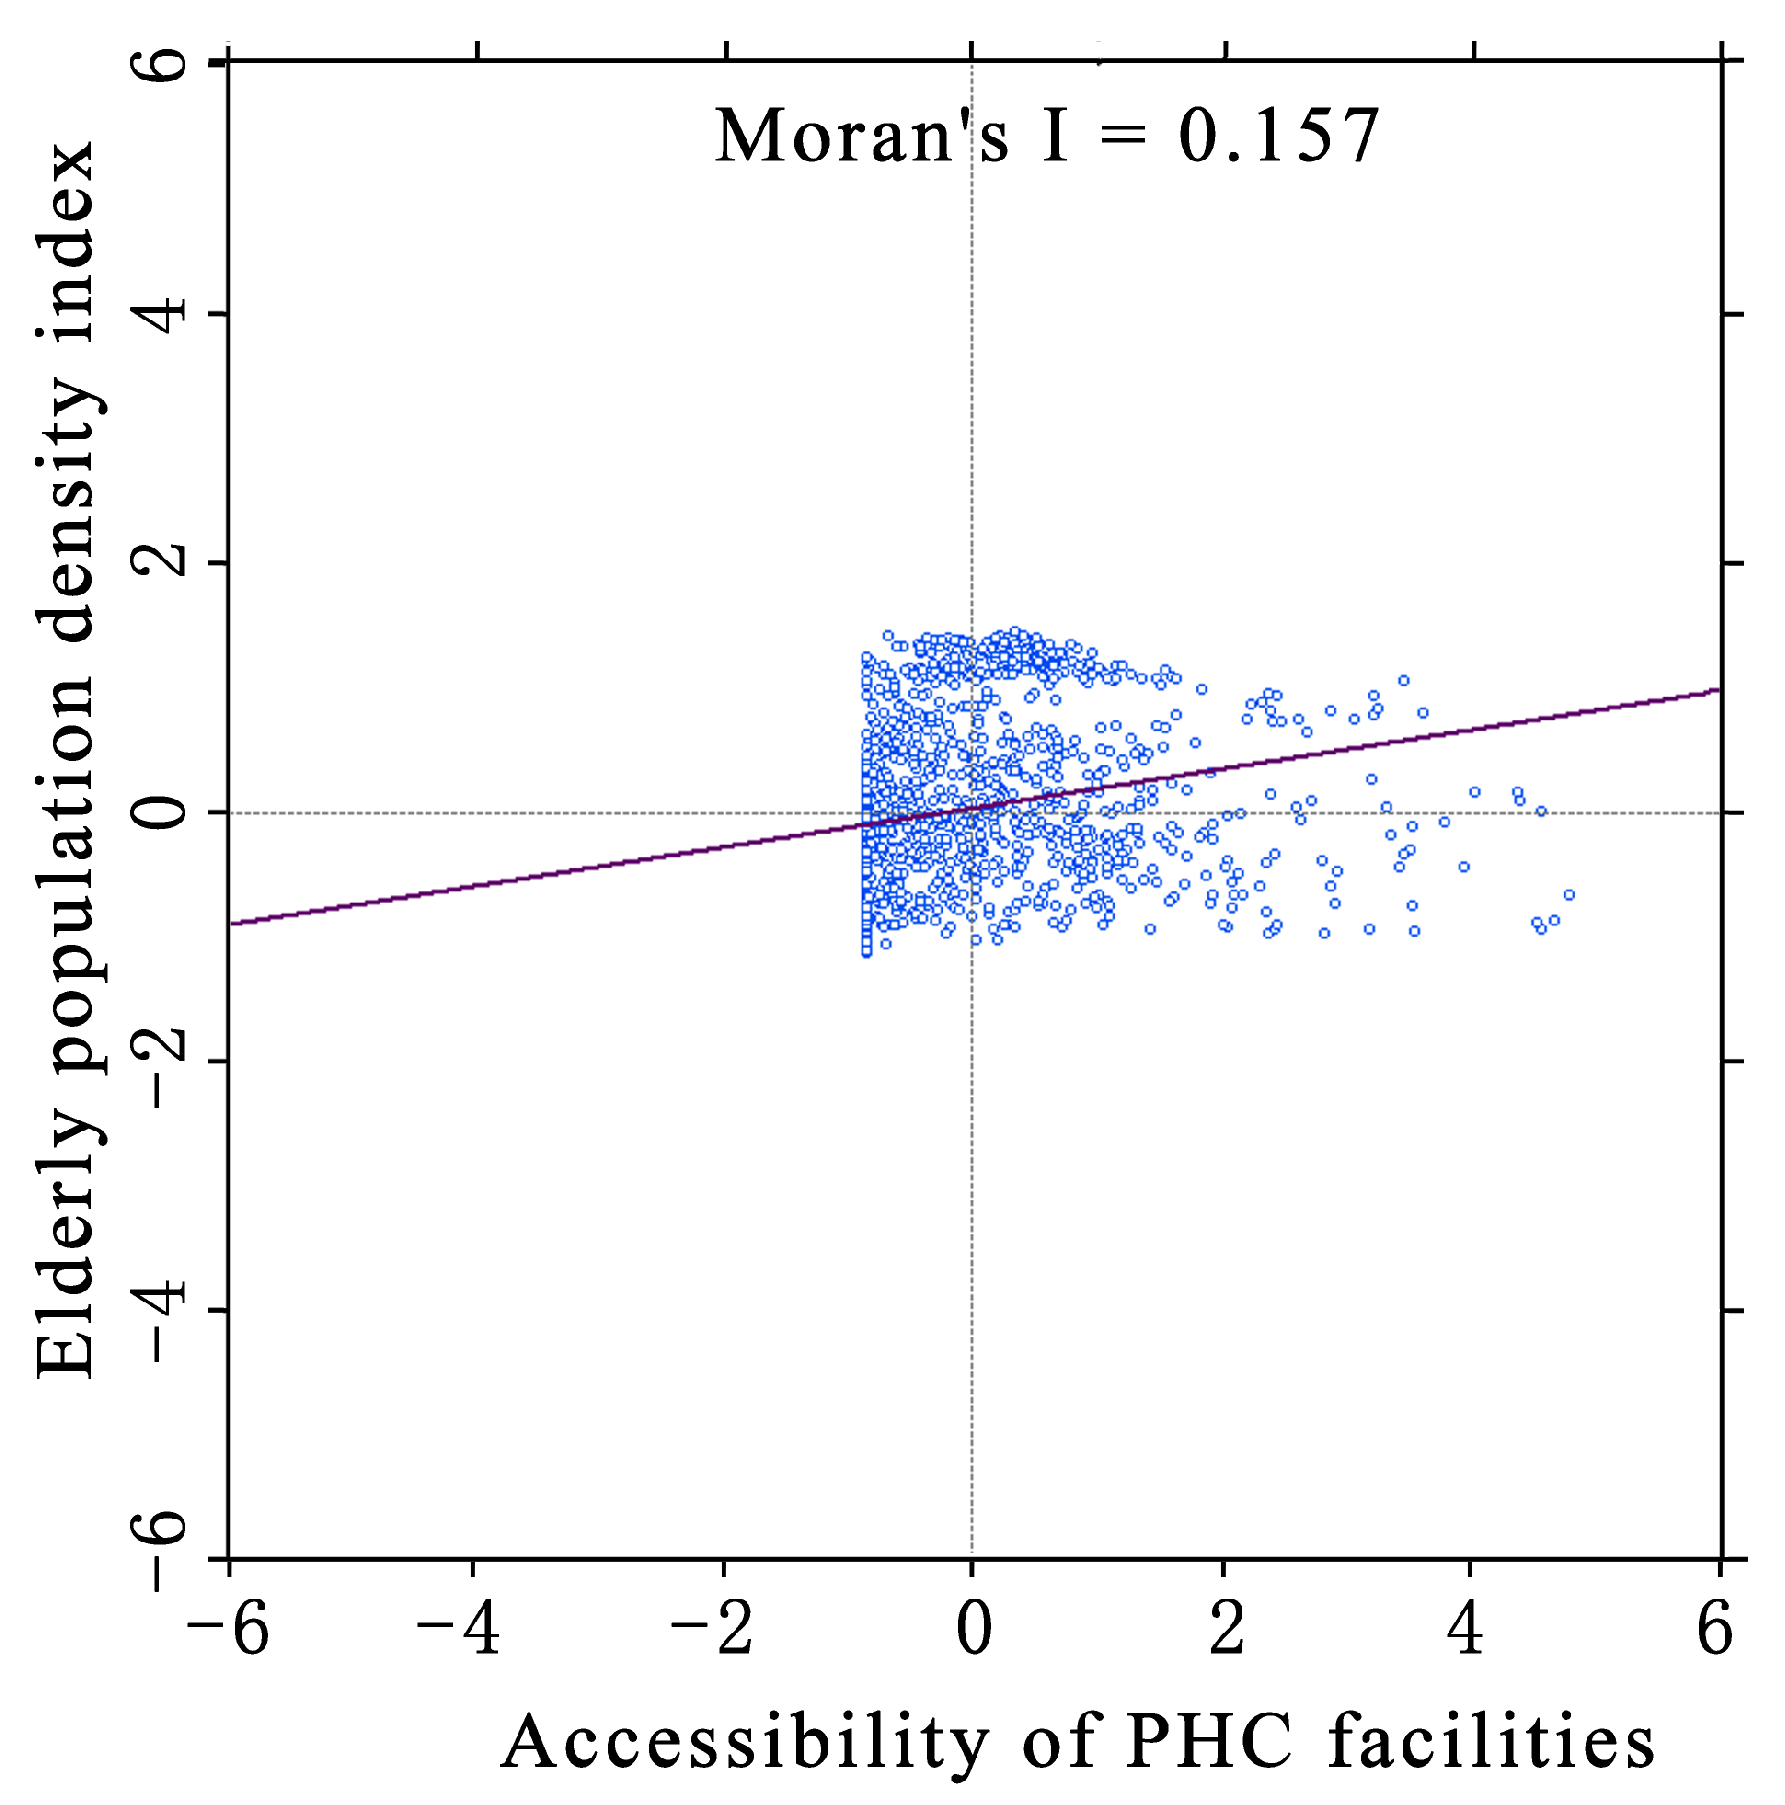
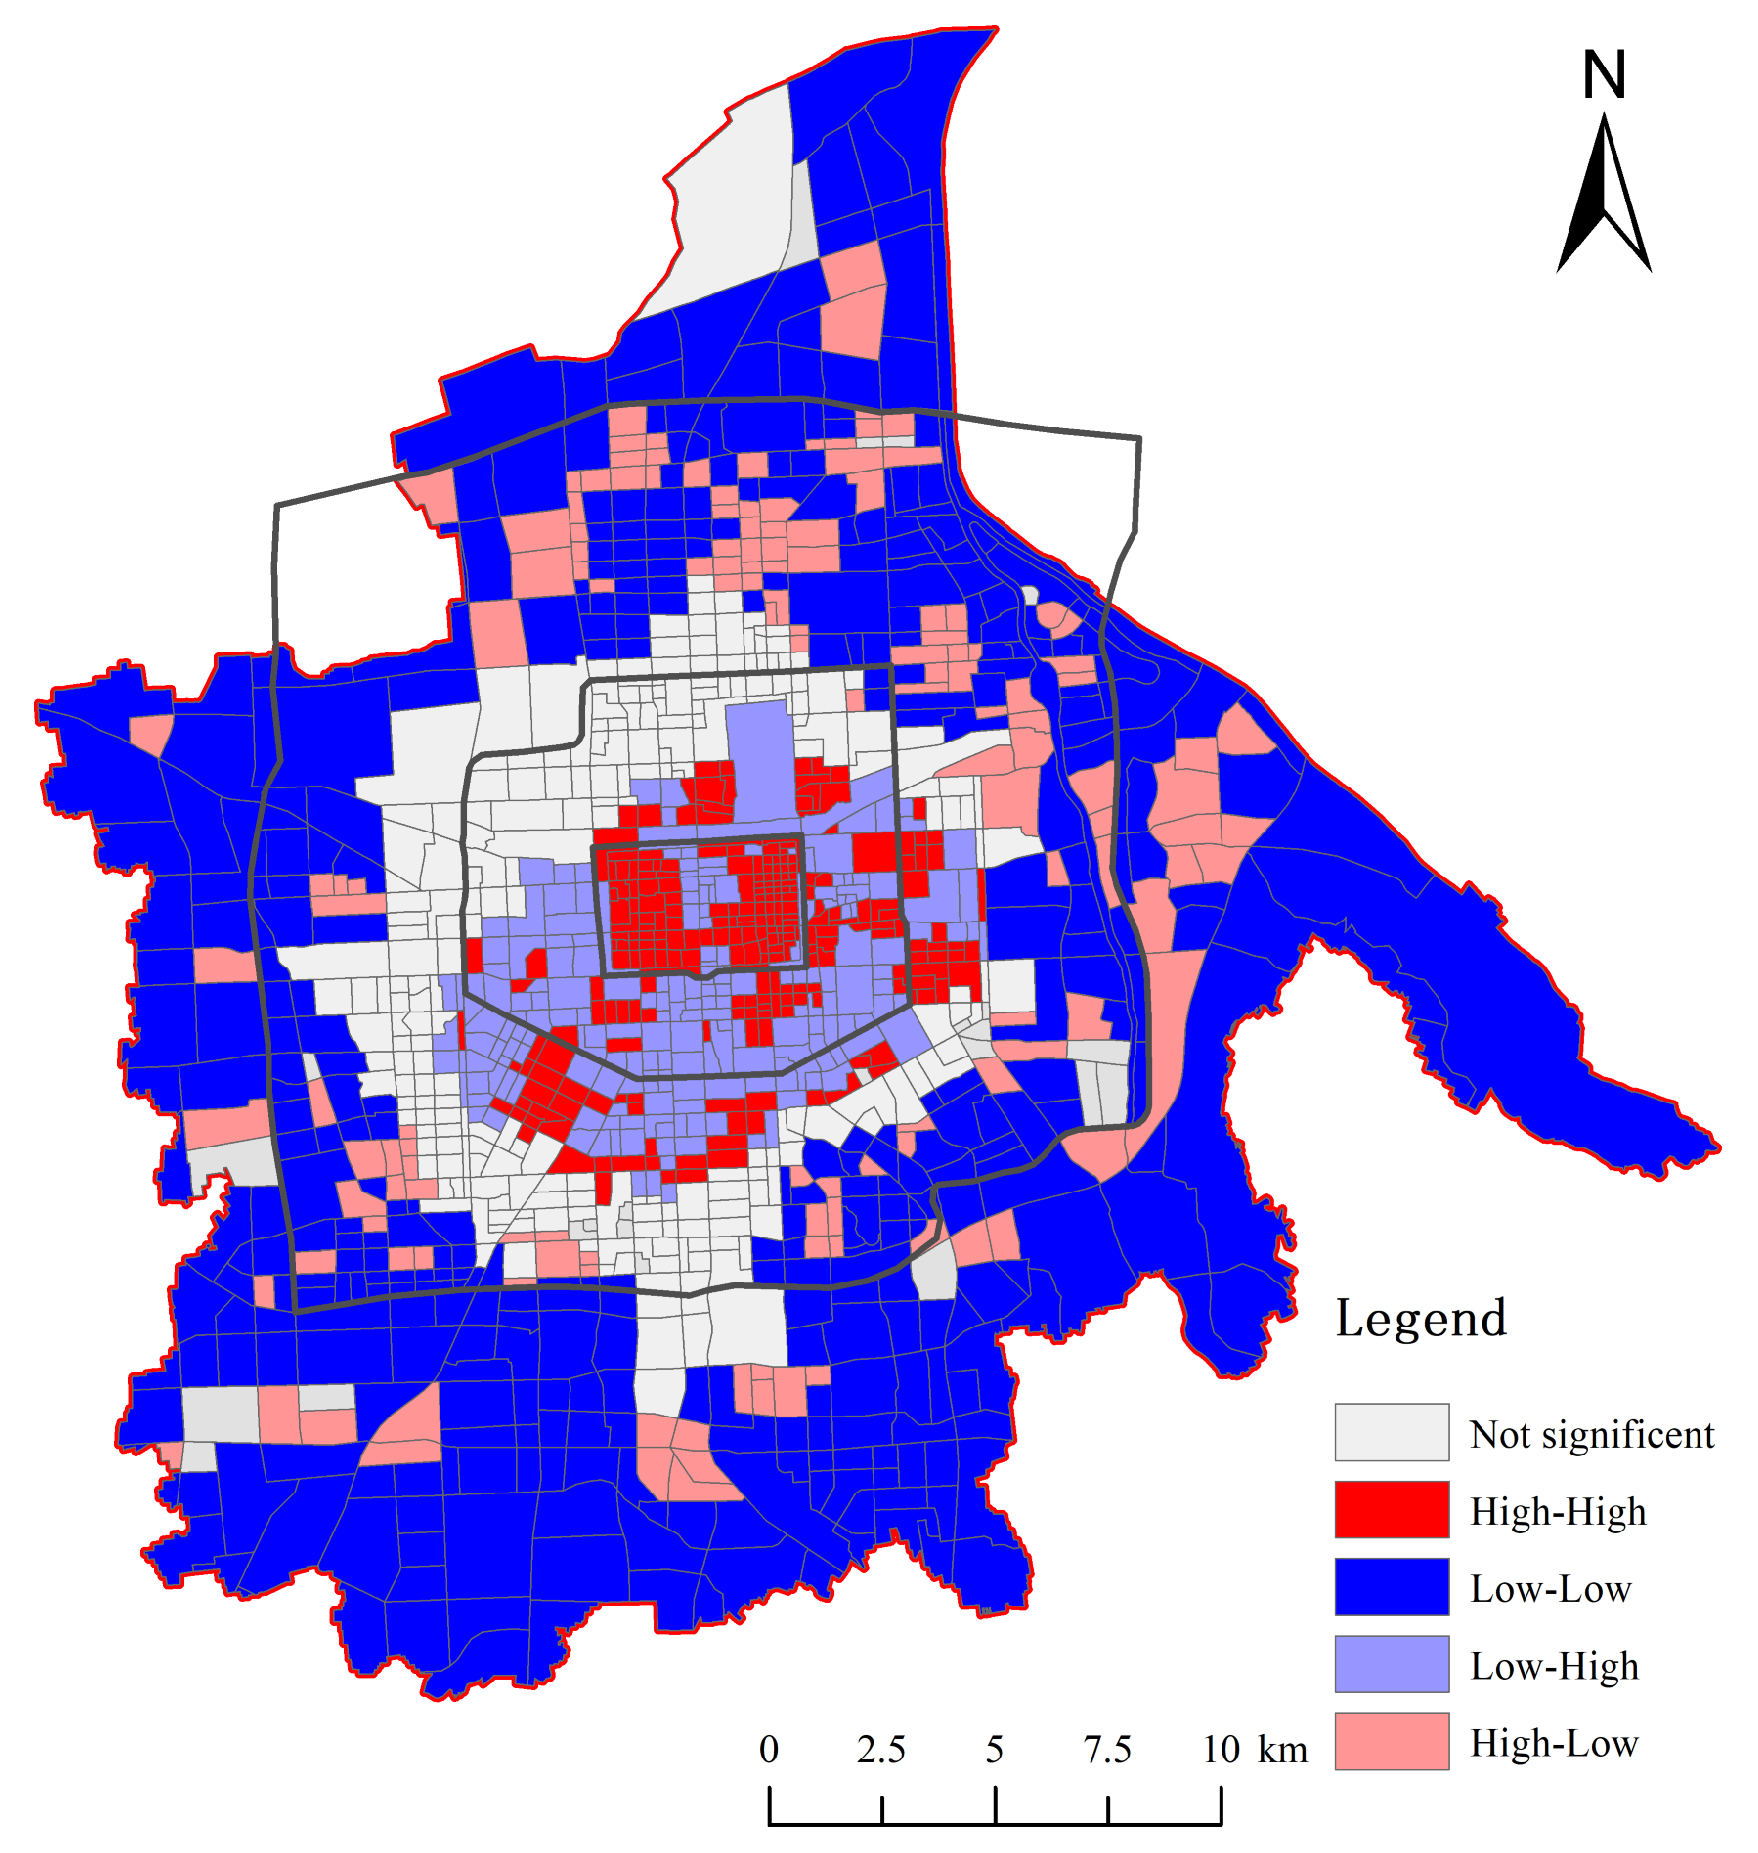
3.3. Spatial Relationship
4. Discussion
5. Conclusions
Author Contributions
Funding
Institutional Review Board Statement
Informed Consent Statement
Data Availability Statement
Conflicts of Interest
References
- Gong, S.; Gao, Y.; Zhang, F.; Mu, L.; Kang, C.; Liu, Y. Evaluating healthcare resource inequality in Beijing, China based on an improved spatial accessibility measurement. Trans. GIS 2021, 25, 1504–1521. [Google Scholar] [CrossRef]
- Siegel, M.; Koller, D.; Vogt, V.; Sundmacher, L. Developing a composite index of spatial accessibility across different health care sectors: A German example. Health Policy 2016, 120, 205–212. [Google Scholar] [CrossRef]
- Cheng, L.; Yang, M.; De Vos, J.; Witlox, F. Examining geographical accessibility to multi-tier hospital care services for the elderly: A focus on spatial equity. J. Transp. Health 2020, 19, 100926. [Google Scholar] [CrossRef]
- Frochen, S.; Ailshire, J.; Rodnyansky, S. Residential care in Los Angeles: Evaluating the spatial distribution of facilities and neighbourhood access to care among older adults. Local Environ. 2019, 24, 274–288. [Google Scholar] [CrossRef] [PubMed]
- Jia, P.; Wang, Y.; Yang, M.; Wang, L.; Yang, X.; Shi, X.; Yang, L.; Wen, J.; Liu, Y.; Yang, M.; et al. Inequalities of spatial primary healthcare accessibility in China. Soc. Sci. Med. 2022, 314, 115458. [Google Scholar] [CrossRef] [PubMed]
- Xu, J.; Yan, Z.; Hu, S.; Pu, C. The spatial distribution and optimization of medical and health land from the perspective of public service equalization: A case study of Urumqi city. Sustainability 2022, 14, 7565. [Google Scholar] [CrossRef]
- Li, J.; Li, J.; Shao, L.; Sun, S. Evaluation of spatial matching between urban green space and population: Dynamics analysis of population data in Xi’an. J. Urban Plan. Dev. 2021, 147, 05021012. [Google Scholar] [CrossRef]
- Chen, L.; Zhang, Z. Social stratification and spatial equity of educational facilities in a complex urban core in Lanzhou, China. J. Urban Plan. Dev. 2023, 149, 05023023. [Google Scholar] [CrossRef]
- Carpentieri, G.; Guida, C.; Masoumi, H.E. Multimodal accessibility to primary health services for the elderly: A case study of Naples, Italy. Sustainability 2020, 12, 781. [Google Scholar] [CrossRef]
- Kotavaara, O.; Nivala, A.; Lankila, T.; Huotari, T.; Delmelle, E.; Antikainen, H. Geographical accessibility to primary health care in Finland—Grid-based multimodal assessment. Appl. Geogr. 2021, 136, 102583. [Google Scholar] [CrossRef]
- Kang, J.Y.; Wong, S.; Park, J.; Lee, J.; Aldstadt, J. Exploring spatial mismatch between primary care and older populations in an aging country: A case study of South Korea. ISPRS Int. J. Geol. Inf. 2023, 12, 255. [Google Scholar] [CrossRef]
- Kelobonye, K.; Zhou, H.; McCarney, G.; Xia, J. Measuring the accessibility and spatial equity of urban services under competition using the cumulative opportunities measure. J. Transp. Geogr. 2020, 85, 102706. [Google Scholar] [CrossRef]
- Peng, J.; Liu, Y.; Ruan, Z.; Yang, H. Study on the optimal allocation of public service facilities from the perspective of living circle—A case study of Xiangyang High-Tech Zone, China. J. Urban Manag. 2022, 12, 344–359. [Google Scholar] [CrossRef]
- Cheng, T.; Liu, C.; Yang, H.; Wang, N.; Liu, Y. From service capacity to spatial equity: Exploring a multi-stage decision-making approach for optimizing elderly-care facility distribution in the city centre of Tianjin, China. Sustain. Cities Soc. 2022, 85, 104076. [Google Scholar] [CrossRef]
- Zhang, F.; Li, D.; Ahrentzen, S.; Zhang, J. Assessing spatial disparities of accessibility to community-based service resources for Chinese older adults based on travel behavior: A city-wide study of Nanjing, China. Habitat Int. 2019, 88, 101984. [Google Scholar] [CrossRef]
- Du, M.; Zhao, S. An equity evaluation on accessibility of primary healthcare facilities by using V2SFCA method: Taking Fukuoka city, Japan, as a case study. Land 2022, 11, 640. [Google Scholar] [CrossRef]
- Pugh, R.J.; Bailey, R.; Szakmany, T.; Al Sallakh, M.; Hollinghurst, J.; Akbari, A.; Griffiths, R.; Battle, C.; Thorpe, C.; Subbe, C.P.; et al. Long-term trends in critical care admissions in Wales. Anaesthesia 2021, 76, 1316–1325. [Google Scholar] [CrossRef] [PubMed]
- Shi, J.; Chi, C.; Gong, X.; Chen, C.; Yu, W.; Huang, J.; Zhou, L.; Chen, N.; Yang, Y.; Liu, Q.; et al. Examining health disparities and characteristics in general practice utilization: Based on outpatient data from 2014–2018 in Shanghai. BMC Fam. Pract. 2020, 21, 74. [Google Scholar] [CrossRef]
- Li, J.; Li, G.; Li, J.; Liu, A. Integrating conformance and performance for the evaluation of urban planning implementation from a goal-oriented perspective. Environ. Plan. B-Urban Anal. City Sci. 2021, 49, 737–753. [Google Scholar] [CrossRef]
- Ashik, F.R.; Mim, S.A.; Neema, M.N. Towards vertical spatial equity of urban facilities: An integration of spatial and aspatial accessibility. J. Urban Manag. 2020, 9, 77–92. [Google Scholar] [CrossRef]
- dos Anjos Luis, A.; Cabral, P. Geographic accessibility to primary healthcare centers in Mozambique. Int. J. Equity Health 2016, 15, 173. [Google Scholar] [CrossRef] [PubMed]
- Huerta Munoz, U.; Källestål, C. Geographical accessibility and spatial coverage modeling of the primary health care network in the western province of Rwanda. Int. J. Health Geogr. 2012, 11, 40. [Google Scholar] [CrossRef] [PubMed]
- Shi, Y.; Yang, J.; Keith, M.; Song, K.; Li, Y.; Guan, C. Spatial accessibility patterns to public hospitals in Shanghai: An improved gravity model. Prof. Geogr. 2022, 74, 265–289. [Google Scholar] [CrossRef]
- Schuurman, N.; Berube, M.; Crooks, V.A. Measuring potential spatial access to primary health care physicians using a modified gravity model. Can. Geogr. 2010, 54, 29–45. [Google Scholar] [CrossRef]
- Charland, K.M.; de Montigny, L.; Brownstein, J.S.; Buckeridge, D.L. Clinic accessibility and clinic-level predictors of the geographic variation in 2009 pandemic influenza vaccine coverage in Montreal, Canada. Influenza Other Respir. Viruses 2014, 8, 317–328. [Google Scholar] [CrossRef] [PubMed]
- Rong, P.; Zheng, Z.; Kwan, M.P.; Qin, Y. Evaluation of the spatial equity of medical facilities based on improved potential model and map service API: A case study in Zhengzhou, China. Appl. Geogr. 2020, 119, 102192. [Google Scholar] [CrossRef]
- Zhang, J.; Han, P.; Sun, Y.; Zhao, J.; Yang, L. Assessing spatial accessibility to primary health care services in Beijing, China. Int. J. Environ. Res. Public Health 2021, 18, 13182. [Google Scholar] [CrossRef] [PubMed]
- Dewulf, B.; Neutens, T.; De Weerdt, Y.; de Weghe, N.V. Accessibility to primary health care in Belgium: An evaluation of policies awarding financial assistance in shortage areas. BMC Fam. Pract. 2013, 14, 122. [Google Scholar] [CrossRef] [PubMed]
- Langford, M.; Higgs, G.; Fry, R. Multi-modal two-step floating catchment area analysis of primary health care accessibility. Health Place 2016, 38, 70–81. [Google Scholar] [CrossRef]
- Wang, F. Measurement, optimization, and impact of health care accessibility: A methodological review. Ann. Assoc. Am. Geogr. 2012, 102, 1104–1112. [Google Scholar] [CrossRef]
- Xu, W.; Zhang, F.; Zeng, B.; Yang, T.; Wang, H. Spatial access to medical services in the underdeveloped region of northwestern China: A case study in Lanzhou City. Sustainability 2019, 11, 6786. [Google Scholar] [CrossRef]
- Bell, S.; Wilson, K.; Bissonnette, L.; Shah, T. Access to primary health care: Does neighborhood of residence matter? Ann. Assoc. Am. Geogr. 2013, 103, 85–105. [Google Scholar] [CrossRef]
- Delamater, P.L. Spatial accessibility in suboptimally configured health care systems: A modified two-step floating catchment area (M2SFCA) metric. Health Place 2013, 24, 30–43. [Google Scholar] [CrossRef] [PubMed]
- Liu, S.; Wang, Y.; Zhou, D.; Kang, Y. Two-step floating catchment area model-based evaluation of community care facilities’ spatial accessibility in Xi’an, China. Int. J. Environ. Res. Public Health 2020, 17, 5086. [Google Scholar] [CrossRef] [PubMed]
- Qian, T.; Chen, J.; Li, A.; Wang, J.; Shen, D. Evaluating spatial accessibility to general hospitals with navigation and social media location data: A case study in Nanjing. Int. J. Environ. Res. Public Health 2020, 17, 2752. [Google Scholar] [CrossRef]
- Bryant, J.; Delamater, P.L. Examination of spatial accessibility at micro- and macro-levels using the enhanced two-step floating catchment area (E2SFCA) method. Ann. GIS 2019, 25, 219–229. [Google Scholar] [CrossRef]
- Zhou, L.; Wang, S.; Xu, Z. A multi-factor spatial optimization approach for emergency medical facilities in Beijing. ISPRS Int. J. Geo-Inf. 2020, 9, 361. [Google Scholar] [CrossRef]
- Ouko, J.J.O.; Gachari, M.K.; Sichangi, A.W.; Alegana, V. Geographic information system-based evaluation of spatial accessibility to maternal health facilities in Siaya County, Kenya. Geogr. Res. 2019, 57, 286–298. [Google Scholar] [CrossRef]
- Ni, L.; Qie, M.; Zhou, Z. Research on the age-friendly layout of community health service facilities based on the accessibility for the elderly: A case study on the central city of Tianjin. Urban Probl. 2022, 42–51. [Google Scholar] [CrossRef]
- Freitas, Â.; Rodrigues, T.C.; Santana, P. Assessing urban health inequities through a multidimensional and participatory framework: Evidence from the EURO-HEALTHY project. J. Urban Health 2020, 97, 857–875. [Google Scholar] [CrossRef]
- Tan, P.Y.; Samsudin, R. Effects of spatial scale on assessment of spatial equity of urban park provision. Landsc. Urban Plan. 2017, 158, 139–154. [Google Scholar] [CrossRef]
- Mouratidis, K.; Yiannakou, A. COVID-19 and urban planning: Built environment, health, and wellbeing in Greek cities before and during the pandemic. Cities 2021, 115, 103491. [Google Scholar] [CrossRef] [PubMed]
- Hasan, S.M.; Borces, K.G.; Bhattacharyya, D.S.; Ahmed, S.; Ali, A.; Adams, A. Healthcare systems strengthening in smaller cities in Bangladesh: Geospatial insights from the municipality of Dinajpur. Health Serv. Insights 2020, 13, 1–10. [Google Scholar] [CrossRef]
- Liu, L.; Zhao, Y.; Lyu, H.; Chen, S.; Tu, Y.; Huang, S. Spatial accessibility and equity evaluation of medical facilities based on improved 2SFCA: A case study in Xi’an, China. Int. J. Environ. Res. Public Health 2023, 20, 2076. [Google Scholar] [CrossRef] [PubMed]
- Pakzad, E.; Salari, N. Measuring sustainability of urban blocks: The case of Dowlatabad, Kermanshah city. Cities 2018, 75, 90–100. [Google Scholar] [CrossRef]
- Li, J.; Li, J.; Yuan, Y.; Li, G. Spatiotemporal distribution characteristics and mechanism analysis of urban population density: A case of Xi’an, Shaanxi, China. Cities 2019, 86, 62–70. [Google Scholar] [CrossRef]
- Wei, F.; Wang, X. Measuring spatial accessibility to physical activity spaces in Hangzhou using 2SFCA method. City Plan. Rev. 2019, 43, 112–119. [Google Scholar]
- GB50180-2018; Standard for Urban Residential Area Planning and Design. Chinese Standard: Beijing, China, 2018.
- Hu, S.; Song, W.; Li, C.; Lu, J. A multi-mode gaussian-based two-step floating catchment area method for measuring accessibility of urban parks. Cities 2020, 105, 102815. [Google Scholar] [CrossRef]
- Li, J.; Li, J.; Huang, J. Research on the equity and optimal allocation of basic medical services in Guangzhou in the context of COVID-19. Int. J. Environ. Res. Public Health 2022, 19, 14656. [Google Scholar] [CrossRef]
- Luan, J.; Tian, Y.; Jim, C.; Liu, X.; Yan, M.; Wu, L. Assessing spatial accessibility of community hospitals for the elderly in Beijing, China. Int. J. Environ. Res. Public Health 2023, 20, 890. [Google Scholar] [CrossRef]
- Shin, K.; Lee, T. Improving the measurement of the Korean emergency medical system’s spatial accessibility. Appl. Geogr. 2018, 100, 30–38. [Google Scholar] [CrossRef]
- Lättman, K.; Olsson, L.E.; Friman, M. A new approach to accessibility—Examining perceived accessibility in contrast to objectively measured accessibility in daily travel. Res. Transp. Econ. 2018, 69, 501–511. [Google Scholar] [CrossRef]
- Kanuganti, S.; Sarkar, A.K.; Singh, A.P. Quantifying accessibility to health care using two-step floating catchment area method (2SFCA): A case study in Rajasthan. Transp. Res. Procedia 2016, 17, 391–399. [Google Scholar] [CrossRef]
- Pan, X.; Kwan, M.; Yang, L.; Zhou, S.; Zuo, Z.; Wan, B. Evaluating the accessibility of healthcare facilities using an integrated catchment area approach. Int. J. Environ. Res. Public Health 2018, 15, 2051. [Google Scholar] [CrossRef] [PubMed]
- Qi, L.; Zhou, S.; Yan, X. Endpoint attractive factors of medical facilities’ accessibility: Based on GPS floating car data in Guangzhou. Sci. Geogr. Sin. 2014, 34, 580–586. [Google Scholar]
- Huang, J.; Zhang, R.; Hu, G. A research of the elderly’s daily life circle based on spatial-temporal behaviors: Analysis of place recognition and spatial features. Urban Plan. Forum 2019, 87–95. [Google Scholar] [CrossRef]
- Zhao, W.; Fang, G.; Wang, H. Creating a senior friendly pedestrian space system from life circle viewpoint. Planners 2019, 35, 69–78. [Google Scholar]
- Preda, A. ‘Justice in health or justice (and health)?’—How (not) to apply a theory of justice to health. Public Health Ethics 2018, 11, 336–345. [Google Scholar] [CrossRef]


| Category | Datasets | Format | Sources |
|---|---|---|---|
| PHC facilities data | POI | Vector (Point) | Baidu Map Services, China |
| Urban-planning data | Raster | Urban Master Plan of Xi’an (2008–2020) | |
| Urban roads data | Urban road network | Vector (Polygon) | Open-source map |
| The elderly population data | Baidu heat map | Raster | Baidu Map Services, China |
| Population Census data | Table | 7th National Population Census |
| Zone | Area (km2) | Number of Block Units | PHC Facilities | |
|---|---|---|---|---|
| Number | Density (per km2) | |||
| I | 13.24 | 143 | 197 | 14.88 |
| II | 62.73 | 250 | 681 | 10.86 |
| III | 246.56 | 632 | 1441 | 5.84 |
| IV | 318.42 | 226 | 644 | 2.02 |
| Total | 640.95 | 1251 | 2963 | |
| Spatial Relationship | H-H | L-L | L-H | H-L | None |
|---|---|---|---|---|---|
| Number | 253 | 391 | 205 | 143 | 259 |
| Proportion (%) | 20.22 | 31.26 | 16.39 | 11.43 | 20.70 |
Disclaimer/Publisher’s Note: The statements, opinions and data contained in all publications are solely those of the individual author(s) and contributor(s) and not of MDPI and/or the editor(s). MDPI and/or the editor(s) disclaim responsibility for any injury to people or property resulting from any ideas, methods, instructions or products referred to in the content. |
© 2024 by the authors. Licensee MDPI, Basel, Switzerland. This article is an open access article distributed under the terms and conditions of the Creative Commons Attribution (CC BY) license (https://creativecommons.org/licenses/by/4.0/).
Share and Cite
Zhao, D.; Shao, L.; Li, J.; Shen, L. Spatial-Performance Evaluation of Primary Health Care Facilities: Evidence from Xi’an, China. Sustainability 2024, 16, 2838. https://doi.org/10.3390/su16072838
Zhao D, Shao L, Li J, Shen L. Spatial-Performance Evaluation of Primary Health Care Facilities: Evidence from Xi’an, China. Sustainability. 2024; 16(7):2838. https://doi.org/10.3390/su16072838
Chicago/Turabian StyleZhao, Dan, Liu Shao, Jianwei Li, and Lina Shen. 2024. "Spatial-Performance Evaluation of Primary Health Care Facilities: Evidence from Xi’an, China" Sustainability 16, no. 7: 2838. https://doi.org/10.3390/su16072838
APA StyleZhao, D., Shao, L., Li, J., & Shen, L. (2024). Spatial-Performance Evaluation of Primary Health Care Facilities: Evidence from Xi’an, China. Sustainability, 16(7), 2838. https://doi.org/10.3390/su16072838