Article

Reduction of Nitrous Oxide Emissions from Urine Patches from Grazed Dairy Pastures in New Zealand: A Preliminary Assessment of ORUN® as an Alternative to the Use of Nitrification Inhibitor Dicyandiamide (DCD)

by
Iduh Jonathan Joseph Otene
1,*,
Mike J. Hedley
2 and
Peter Bishop
2
1
Department of Soil & Environmental Management, Kogi State University, Anyigba P.M.B. 1008, Nigeria
2
Soil and Earth Sciences Group, School of Agriculture and Environment, Massey University, Private Bag 11222, Palmerston North 4442, New Zealand
*
Author to whom correspondence should be addressed.
Sustainability 2024, 16(7), 2843; https://doi.org/10.3390/su16072843
Submission received: 25 January 2024 / Revised: 10 March 2024 / Accepted: 21 March 2024 / Published: 28 March 2024

Abstract

:
Agriculture plays a significant role in economic development and livelihood and is a key contributor to food security and nutrition. However, global concerns regarding the sustainability of the agricultural sector (mainly environmental damage) is linked to agricultural activities such as greenhouse gas (GHG) emissions, water pollution, and loss of biodiversity. The aim of this study was to assess the effectiveness of ORUN® (a formulated agricultural chemical mixture) to reduce N2O emissions from urine patches and to improve pasture yield, pasture N uptake, and soil mineral N concentrations. The field trials were conducted during the spring of 2015 on dairy urine patches at Massey University, New Zealand. Treatments consisted of control nil urine, control nil urine + ProGibb®, urine only, urine + ProGibb®, urine + ORUN®, and urine + ORUN PLUS® replicated four times in a randomized complete block design. At 31 days after treatment (DAT), analysis of soil samples in 0–5 cm soil profiles showed that urine + ProGibb® significantly (p = 0.0041) increased the soil nitrate concentration (121.40 kgN/ha) compared with 48.15 kgN/ha from urine only. The urine + ProGib® treatment produced significantly lower herbage N recovery (35% of applied N) compared with the urine only. Throughout the trial period, the urine patches treated with ProGibb® and ORUN® produced significantly higher N2O fluxes compared with urine only and urine + ORUN PLUS®, as well as higher surface soil nitrate and mineral N concentrations.

1. Introduction

Environmental sustainability from agricultural activities is a major global concern despite the contribution of agriculture to food security, nutrition (human and livestock nutrition), economic development, and livelihood. Greenhouse gas (GHG) emissions, water pollution, and loss of biodiversity by deforestation and bush clearing are associated with agricultural activities [1,2,3]. The agricultural sector constitutes the largest anthropogenic source of nitrous oxide (N2O) emissions [4,5]. Analysis by Gaugler et al. [6] showed that large populations per unit areas, including their dietary needs (particularly from animal production), indicated a higher level of GHG emissions, especially CH4 and N2O.
Nitrous oxide is a potent anthropogenic GHG with a global warming potential 298 times higher than carbon dioxide (CO2) over a 100-year time horizon [7]. It is also a dominant stratospheric ozone-depleting substance [8]. In the phase of increasing human population with changing diet and bioenergy demand, the challenges for mitigating N2O emissions differ greatly from GHGs like CO2 and methane (CH4) because nitrogen (N) inputs are very important for food production [9,10]. Nitrous oxide production from agricultural soils results from the transformation of available mineral N (mainly NH4+ and NO3) by microbiological processes of nitrification and denitrification [11,12]. Nitrification is an aerobic process that oxidizes NH4+ or NH3 to NO3 via NO2 by two groups of microorganisms referred to as NH3 and NO2 oxidizers, while denitrification, an anaerobic process, is the stepwise reduction of NO3 to N2 by denitrifiers [11]. A by-product of nitrification is also N2O, while in denitrification, N2O is an obligatory intermediate [13]. The sequence of climate and soil conditions and the concentration of available mineral N dictate the rate of N2O oxide production. For example, with the application of fertilizer urea or deposition of animal urine, urea hydrolysis creates zones of soil with raised NH4+ concentrations. In warm moist aerobic conditions, rapid nitrification of NH4+ to NO3 (1–7 days) occurs. If the daily rainfall exceeds evapotranspiration rates, drainage may occur or the soil may become progressively water-logged, leading to anaerobic conditions. Therefore, some NO3 may be leached and some may be denitrified to N2 or traces of N2O. In microaerophilic conditions, which occur in moist soils, more trace gas N2O is produced.
Agriculture, particularly pastoral farming, plays a substantial role in New Zealand’s economy, providing about 50% of total export value [14,15]. The significant contribution of agriculture to the total GHG emissions of New Zealand has focused the country’s research efforts on mitigation strategies to reduce CH4 and N2O emissions from this sector. New Zealand’s commitment to the Kyoto protocol has undertaken reduction targets below 1990 levels, i.e., 50% long-term target by 2050 [16,17]. Agricultural soils constitute the largest source of N2O emissions, with a contribution of 8453.4 kt CO2-e (93.4%) to the country’s total N2O emissions in 2013. From the 1990 level of 7294.7 kt CO2-e, N2O emissions increased by 24.1% (1758.1 kt CO2-e) in 2013 as a result of increases in urine and dung deposited by grazing livestock and the use of synthetic nitrogen fertilizers in the agriculture sector [18].
The major inputs of N in New Zealand pastoral agriculture are urea and biologically fixed N from pasture plants, especially white clover (Trifolium repens). New Zealand’s pastoral agriculture, which is the country’s prevalent industry, and land use is characterized by year-round grazing of grass–clover pastures [19]. Annually, the largest input/ha to soil arises from continued recycling of N via grazing and animal excreta (urine and dung) return. Urine-affected soil (urine patches) is the major contributor to gaseous N emissions (NH3, N2, N2O) and leaching losses (NO3) rather than N fertilizer in grazed dairy pastures [20]. Saggar et al. [21] reported that in New Zealand, the N applied by fertilizers (0.31 Tg) is five times less compared with N (1.5 Tg) excreted by animals yearly. Approximately 60–75% of the dietary N ingested is excreted in the urine, containing about 70% urea [20]. The N load in urine and dung is between 50 and 200 g m−2 and 20 and 80 g m−2, respectively [22]. The urine patch concentrations commonly exceed the plant uptake demand of the pasture. After 7–14 days, urine patches develop high nitrate (NO3) concentrations of about 418 mg N kg−1 soil compared with 1 to 11 mg N kg−1 soil from non-urine areas [23]. During the spring calving season in New Zealand, the population of dairy cattle can be about 7 million [24]. As the intensity of dairy farming increases, through more productive pastures and supplementary feeding of cows, the number of cows and urine patches per hectare increase, thus N loss to water and atmosphere increases [20].
The adoption of mitigation technology for N2O emissions from agricultural soils requires the considerations of its effects on pasture yield, soil mineral N concentrations, and plant N uptake. Therefore, it is important that the development of effective management systems for the reduction of N2O emissions from grazed dairy pastures should incorporate the understanding and quantification of N sources, transformation processes, and effects of soil and climatic conditions on N2O emissions. The interrelationships between soil physical and chemical properties, soil microbiological populations, climate, and animal management practices are used to mitigate N2O emissions [25]. Strategies trialed for the reduction of N2O emissions from pastoral agriculture in New Zealand include spraying gibberellins on pasture [25], reducing urinary N concentrations, modifying nitrification by introducing plantain swards (Plantago lanceolata L.) [26,27,28,29,30,31,32,33], improving production efficiency [34,35,36,37], adjusting the time of grazing [38,39,40,41], reducing the N intake of animals/managing animal diets, reducing the N concentration of individual urination [27,42,43,44,45,46], and using N process inhibitors to improve the efficiency of plant N use.
Maximizing N use efficiency in pasture systems via the use of N process inhibitors such as urease and nitrification inhibitors (NIs) is an effective approach for decreasing NH3 volatilization and NO3 leaching, increasing N uptake by grass, and reducing N2O emissions. Nitrification inhibitors such as dicyandiamide (DCD), 3,4-dimethylpyrazole phosphate (DMPP), and 2-chloro-6-(trichloromethyl) pyridine (nitrapyrin) have been effectively used to decrease NH3 volatilization and NO3 leaching, increase N uptake by grass, and reduce N2O emissions in pasture systems [47,48,49,50]. Between 50 and 60% direct reduction of N2O emissions by the addition of NIs to N inputs in grazing systems has been reported [50]. The review of Adhikari et al. [46] showed reductions of 44 ± 2%, 28 ± 38%, and 28 ± 5%, (average ± s.e.) of N2O emissions from urine patches by using NIs (DCD, DMPP, and nitrapyrin, respectively). The laboratory incubation studies of Chibuike et al. [48] revealed reductions of 43–47% with DCD, 19–46% with DMPP, and 45–59% with nitrapyrin of N2O emissions from two urine-amended pasture soils under different amounts of clay and organic matter content.
Dicyandiamide was sprayed on grazed pastures in New Zealand to reduce nitrate leaching and nitrous oxide emission from urine patches [51,52,53]. Separately, the urease inhibitor N-(n-butyl) thiophosphoric triamide (NBPT) was used in a coating to decrease NH3 loss from urea fertilizer applications [54]. Detecting [55] and spraying urine spots in pastures with NBPT has been researched as a method of N loss reduction [56]. Nonetheless, the use of NIs in urine patches has the risk of NI entry into the food chain [47]. In early 2012, there was a voluntary withdrawal of DCD for use on dairy grazed pasture in New Zealand because of the detection of its residues in milk. However, NBPT is less mobile in soil and does not pose the same risk [57].
Building on this earlier research, ORUN® was developed as a potential alternative to nitrification inhibitors like DCD. ORUN® is combination of urease inhibitor N-(n-butyl) thiophosphoric triamide (NBPT) and growth stimulant gibberellin (GA3) [58]. This combination is designed to reduce urine N loss from soils by allowing more time for the movement of urine and urea in the soil before chemical transformation to NH3 and NH4+. Dilution of NH3 in a greater volume of soil will reduce NH3 volatilization and allow greater uptake of N by gibberellin-stimulated plant growth. The aim of this study was to assess the effectiveness of ORUN® to slow the hydrolysis of urea-N to NH4+ and nitrification NO3 in soil under urine patches and increase plant N uptake, thereby reducing N leaching and N2O emissions.

2. Materials and Methods

2.1. Trial Site

The trial was conducted on grazed dairy pastures located at the No.1 Dairy Unit (latitude −40.383757, longitude 175.610145), Massey University, New Zealand. The recent soil was Manawatu mottled fine sandy loam [59]—a fluvent [60]. The profile for available water was estimated at 142 mm to 1 m depth via https://smap.landcareresearch.co.nz/ (accessed on 19 February 2024).

2.2. Treatments and Experimental Design
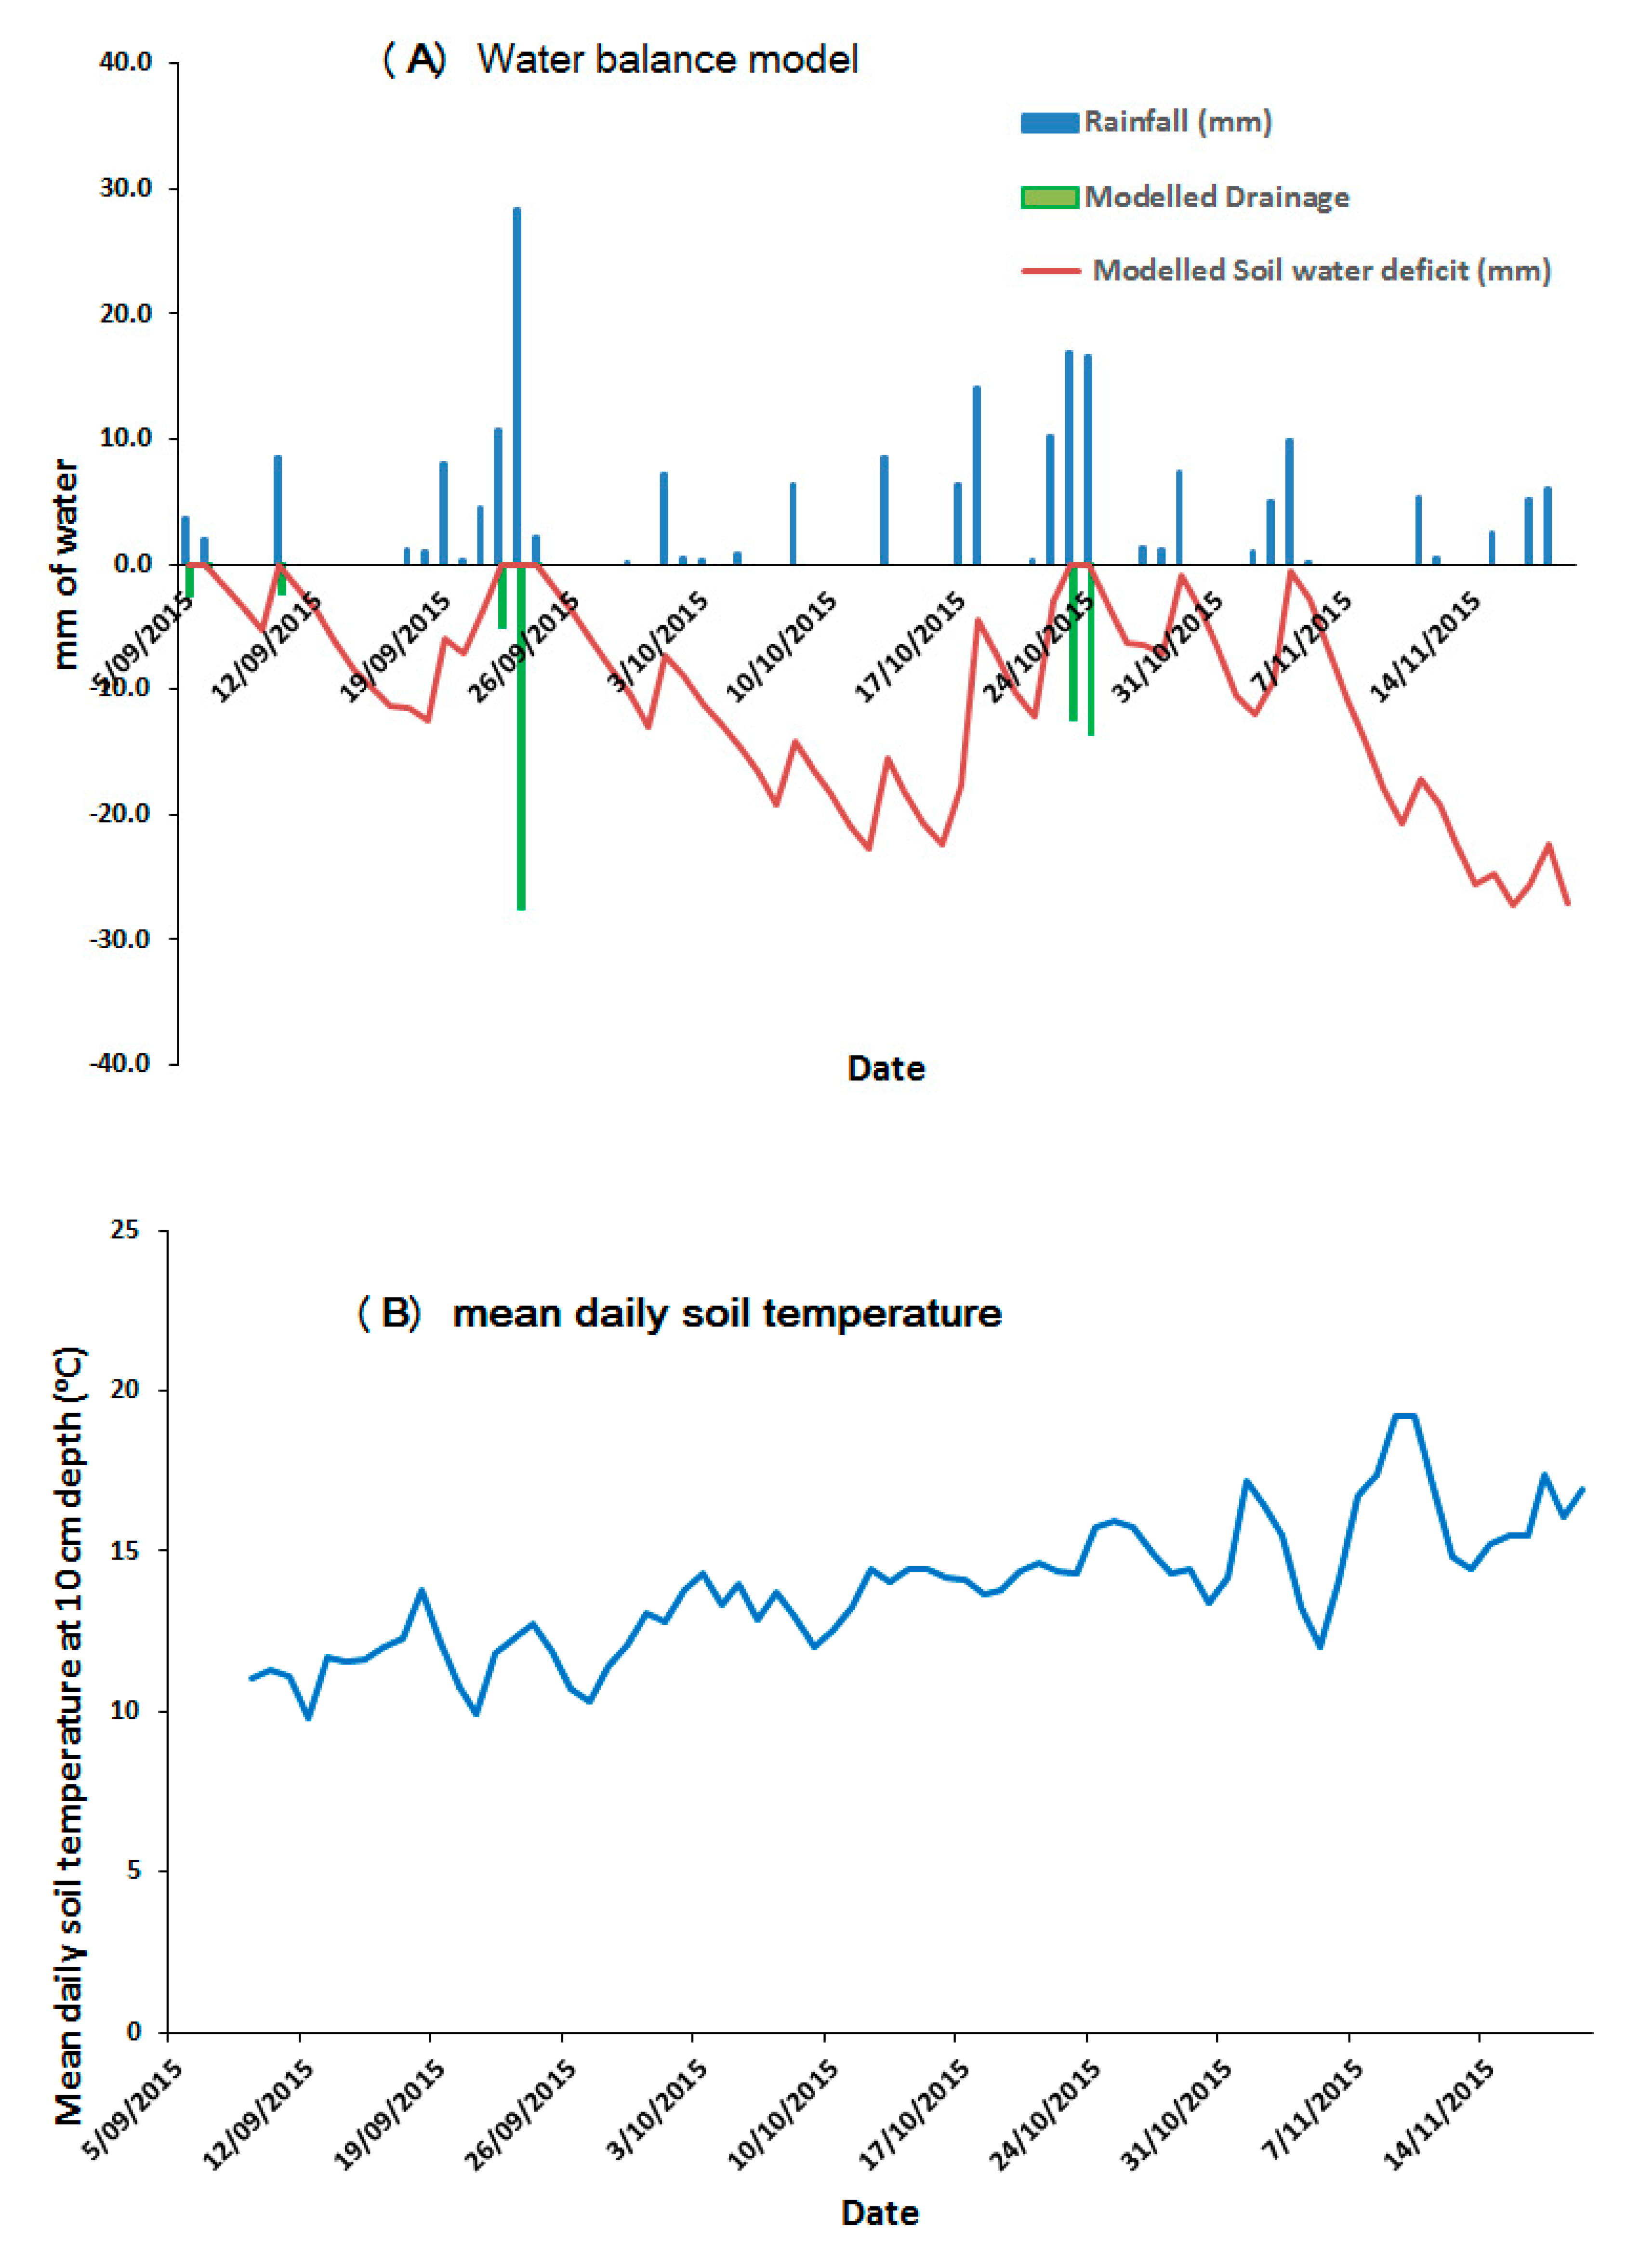
The area for the trial was cleared of stock (3 September 2015), fenced, and mown to a cover of about 1200 kg dry matter/ha (estimation using a rising plate meter). The trial plots were 1 square meter (m2). On 9 September 2015, the following treatments were applied: (a) control nil urine (Cnil U), (b) control nil urine + ProGibb® (CnilU + PrGb), (c) urine only (U0), (d) urine + ProGibb® (U + PrGb), (e) urine + ORUN® (U + O), and (f) urine + ORUN PLUS® (U + OPLUS). Treatments were replicated 4 times in a randomized complete block design (RCBD). The urine treatments (fresh cow urine collected 4 h earlier) consisted of 5090 mg N/L at a rate of 549 kgN/ha, which was confined during application using a 40 cm diameter infiltration ring. Three hours after urine application, ORUN® was sprayed over a 1 m2 area covering the circular cow urine patches of 20 cm radius. The treatments contained the active ingredients of ORUN® (3.2 mg GA3 m−2, 100 mg NBPT m−2), ORUN® PLUS (3 mg GA3 m−2, 100 mg NBPT m−2, and 600 mg AlpHa Na m−2 (sodium salt of polymaleic acid)), and ProGibb® (3 mg GA3 m−2) applied in 60 mL m−2 of water.

2.3. Climate Data

The climatic data, including rainfall and estimated drainage, were gathered via the https://cliflo.niwa.co.nz (accessed on 19 February 2024) database accessing the NIWA/AgResearch weather station positioned 300 m north of the trial site. Cumulative rainfall (mm) and average soil temperature per day (°C) at 10 cm depth were computed from the available rainfall data and hourly soil temperature, respectively.

2.4. Soil Mineral N

A 43 mm diameter core was used for taking soil samples (0–5 and 0–60 cm depth) from the urine patch areas (10 to 15 cm from the center). The resulting holes from 0 to 60 cm coring were sealed by driving in 50 mm diameter × 50 cm depth PVC tubes to prevent artificial aeration and drainage by bypass flow. The soil core sections were stored at 4 °C for 24 h. Soil water content was determined and subsamples were taken for mineral N analysis (2 M KCl extraction for NO3N and NH4+ N) using the autoanalyzer method adapted from Kamphake et al. [61].

2.5. Herbage Analysis

Pasture samples from the 1 m2 plots were harvested (cut to a cover of 1200 kgDM/ha) twice over the period of the trial (15 October 2015 and 19 November 2015, representing 36 and 71 days after treatment application). The herbage samples were dried at 65 °C for five days to determine dry matter yield, milled to <1 mm particle size, and subsamples (0.1 g) were digested in 5 mL of Kjeldahl mixture for 3 h at 350 °C, then the NH4+ N concentration in the digest was measured by a Technicon 11 autoanalyzer (SEAL Analytical, Albany, Auckland New Zealand), as described by Blakemore et al. [62].

2.6. Measurement of Nitrous Oxide Flux

Nitrous oxide flux measurements were carried out at 5 days interval during 71 days of the trial, regardless of rainfall events. Static gas chambers with a diameter of 19 cm (20 cm high) were installed in the center of the urine patches. The lower 10 cm of the chamber was pressed into the soil to ensure a good seal between the soil–air interfaces. Gas samples were taken with a 60 mL plastic syringe and a 20-gauge hypodermic needle. Nitrous oxide samples were collected at 0, 30, and 60 min (i.e., over one hour to have a linear build-up of the concentration of the gas being measured) after placing the lids on the chambers. The gas samples were immediately transferred to 12 mL evacuated vials for N2O analysis by gas chromatography–electron capture detector (GC-ECD, SpectraLab Scientific Inc., Markham, ON, Canada) as described by Zaman et al. [63].
N2O fluxes were calculated from the increase in concentration during chamber closure and the volume of the chamber enclosing surface area. The following closed-chamber equation [64,65] was used:
f(gas) = V/A·∆C/∆t
where f is the N2O gas flux (g gas m−2 s−1), V is the volume of chamber headspace (m3 gas volume), A is the soil surface area, and ∆C/∆t is the change in N2O gas concentration per unit of time within the chamber.
The cumulative N2O emissions in g/ha for the urine patch area were calculated by integration and accumulation of individual flux measurements over time.

2.7. Statistical Analysis

The treatment effects from the trial were tested using analysis variance (ANOVA) using SAS software Version 9.4. Significant means were separated using Duncan’s multiple range test (DMRT) at p = 0.10.

3. Results and Discussion

3.1. Climatic Data

The climatic data (amount of rainfall, cumulative rainfall, and daily mean soil temperature per day at 10 cm depth and soil moisture deficit) at the trial site are shown in Figure 1. Peak rainfall (23, 15, and 21 mm) occurred on 23 September 2015, 23 October 2015, and 24 October 2015, respectively (Figure 1A). Cumulative rainfall for these dates was 36, 93, and 114 mm, respectively, while, at the end of the trial (19 November 2015), a cumulative amount of 147 mm was recorded. The water balance model (Figure 1A) indicated that field capacity (where soil moisture deficit = 0) occurred on 5 September 2015; 10 September 2015; 22, 23, and 24 September 2015; and 23 and 24 October 2015. On the soil sampling days (1, 4, 17, 19, 22, 25, 31, 37, and 76), the soil moisture content (g water/g soil) of the surface soil (0–5 cm) ranged between 0.5 and 0.3, approximately 100% and 50% of field capacity, respectively. By 16 October 2015 (37 DAT), there had been 38 mm of cumulative drainage, followed by a further 26 mm on 23 and 24 October 2015 and no further drainage until after 24 November 2015 (76 DAT). Cumulative drainage after urine application totaled 64 mm.
The lowest (10 °C) mean daily soil temperature at 10 cm depth was recorded on 12 September 2015, 21 September 2015, and 27 September 2015, while the highest (19 °C) was recorded on 9 November 2015 and 10 November 2015 (Figure 1B). On day 1, the soil moisture content near field capacity after urine application was optimal for the diffusion of inhibitors into the soil surface [66].

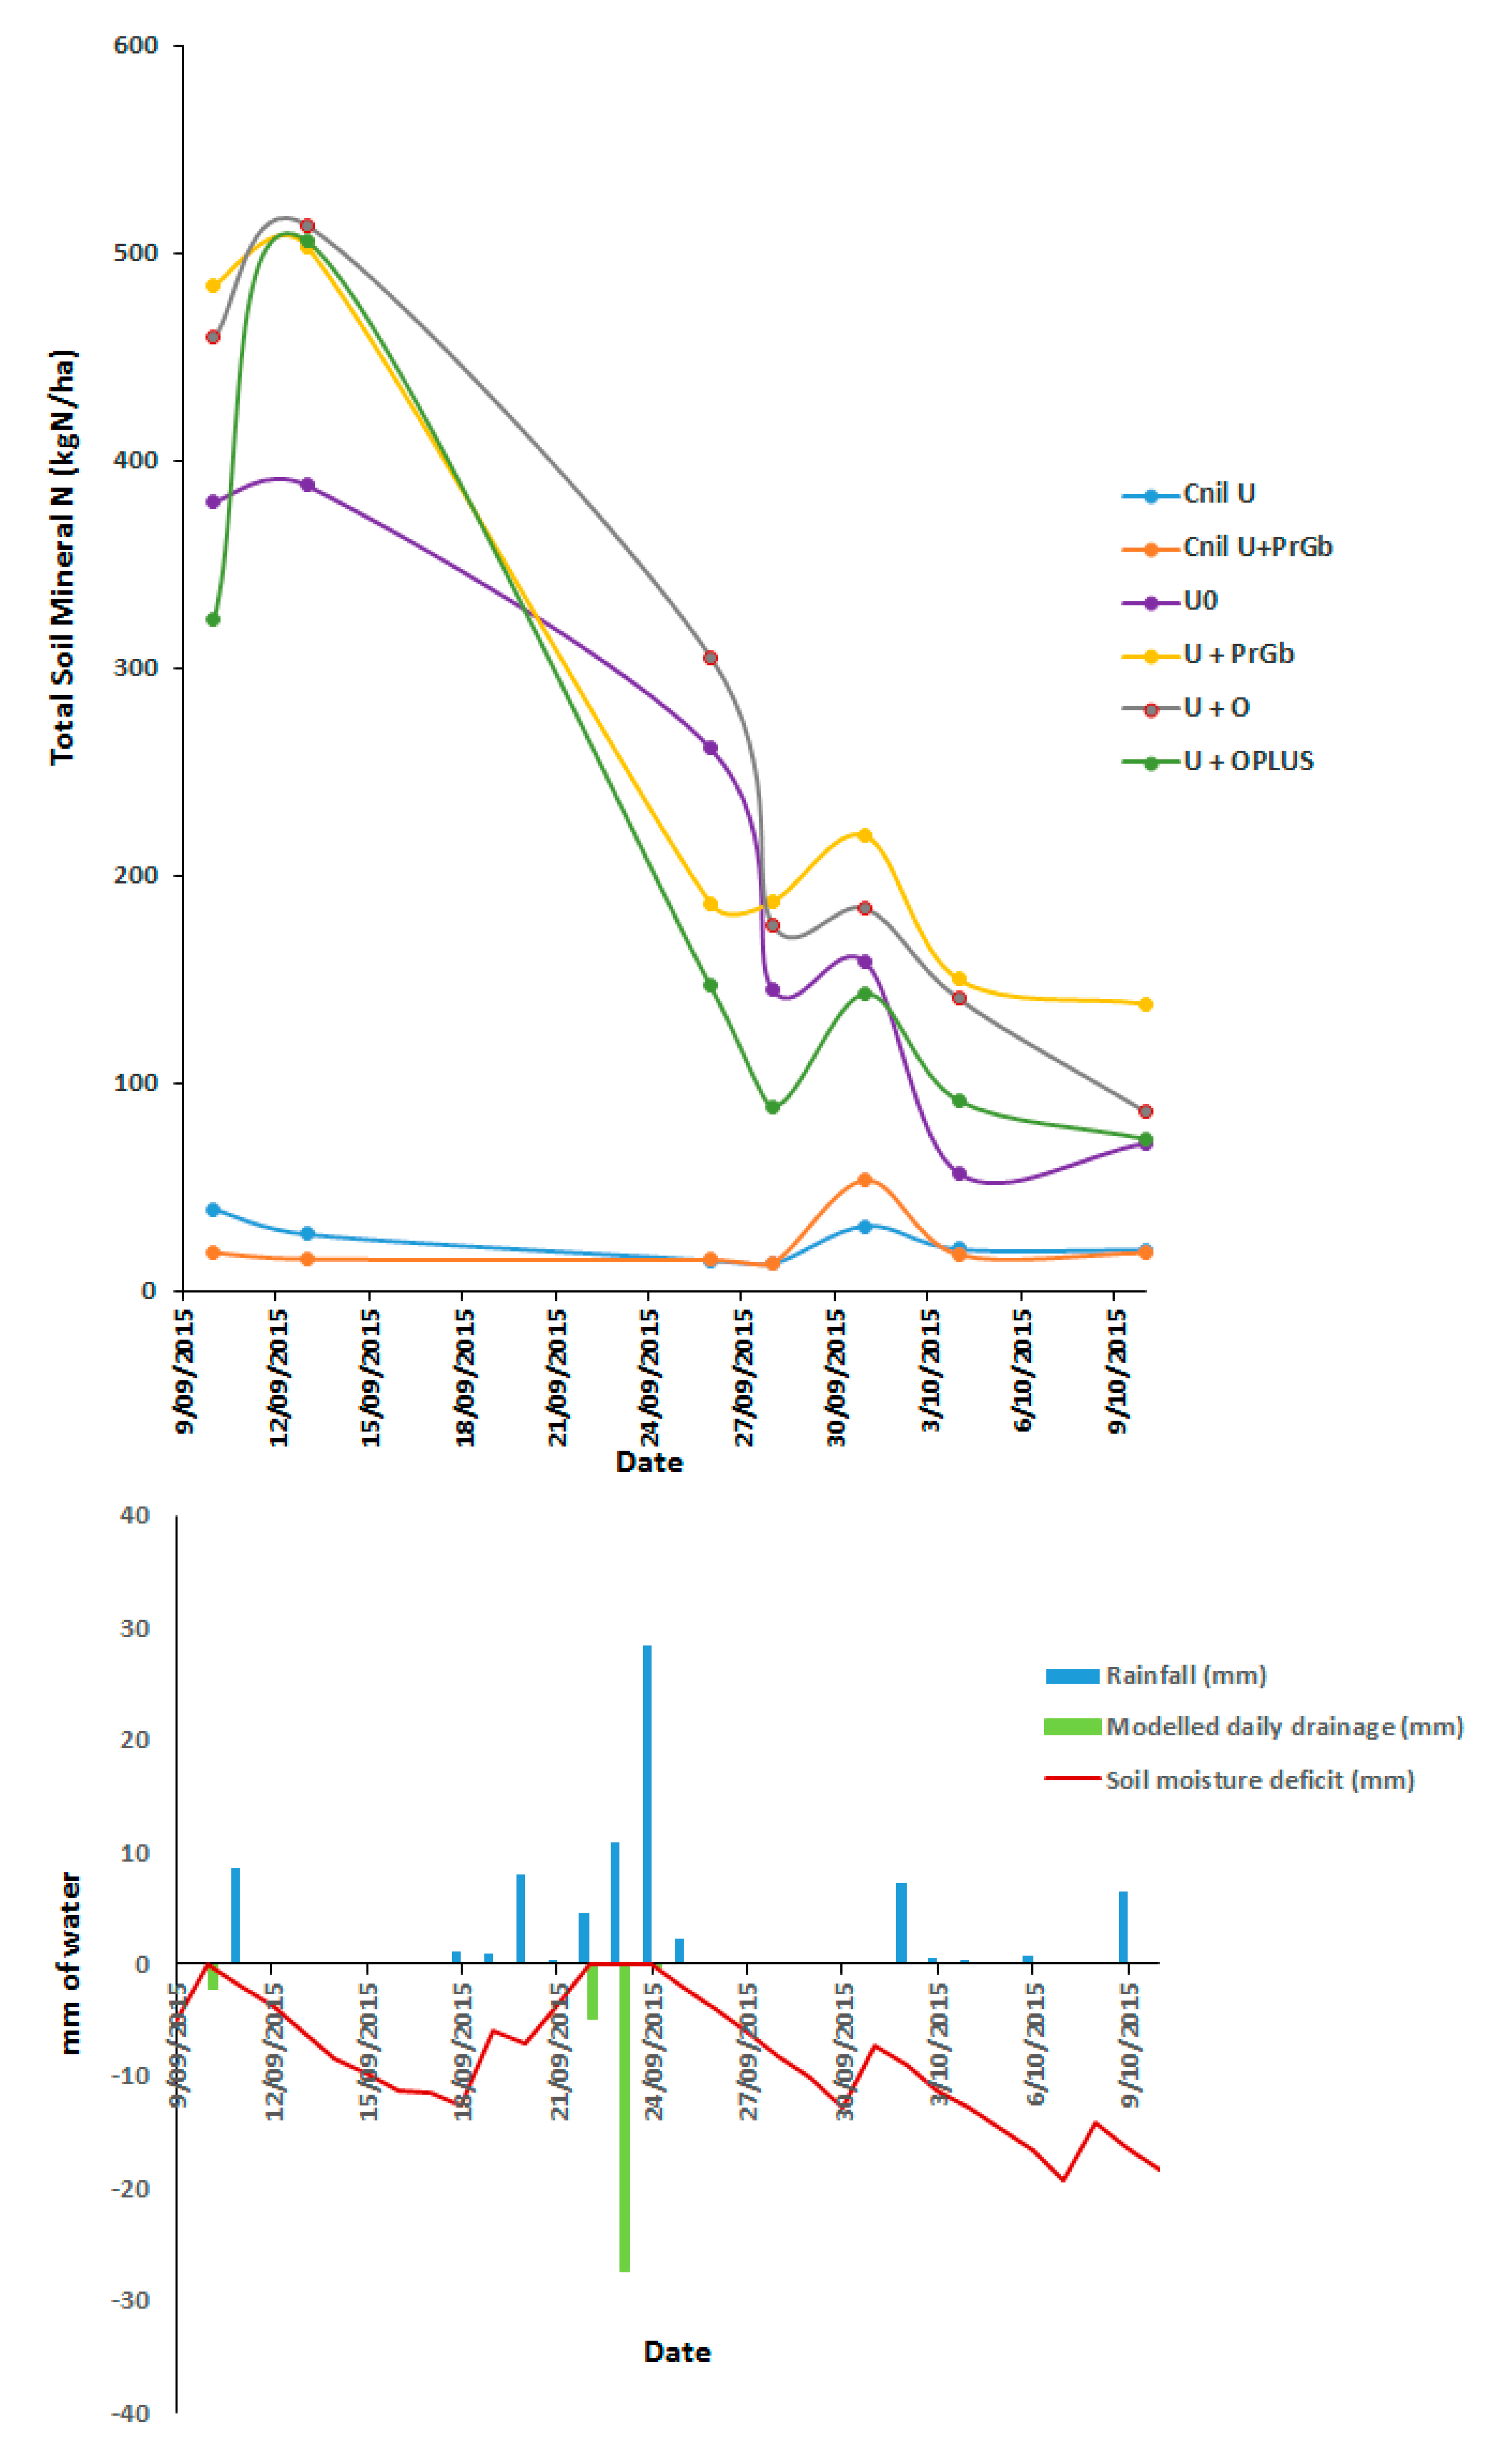
3.2. Soil Mineral N Concentration

3.2.1. Ammonium N and Nitrate N (0–5 cm Depth)

Analysis of soil extractable ammonium-N (NH4+ N) and nitrate-N (NO3 N) in the 0–5 cm depth over the trial period is shown in Table 1 and Table 2, respectively There was no significant difference in NH4+ N in urine patches treated with or without ORUN®, ProGibb®, or ORUN® PLUS until 17 days after application treatment (DAT). On Day 4, the difference in extractable NH4+ N concentrations between the control and the urine treatments ranged from 364 to 490 kg NH4+ N (Table 1), but there was no elevation of extractable NO3 N above the control (Table 2). N loss by NH3 volatilization would also have occurred over this period [22]. The increase in soil NH4+ concentrations alone indicated that urine/urea hydrolysis was at least between 66 and 89% complete by day 4. The urease inhibitor spray treatments ORUN®, ORUN® PLUS, and ProGibb® had the highest NH4+ N concentrations, leading to the conclusion that the inhibitors had not come into contact with a significant quantity of the urine-affected soil. This problem with urease inhibitor sprays applied post-urination was identified in this research and that of Adhikari et al. [66] and researched further by Rodriguez et al. [56]. Both studies evaluated the effectiveness of NBPT sprays in reducing NH3 volatilization from urine patches. The results of Adhikari et al. [66] suggested that the limitations with the low volume (equivalent to 0.06 mm of rainfall) fine sprays were the retention of the inhibitor on the pasture leaves and lack of penetration into drier soils, i.e., below 50% field capacity moisture content. Rodriguez et al. [56] had similarly high soil NH4+ concentrations (200–350 mgN/kg soil) 1–5 days after urine application, leading to 14% of the urine- N being volatilized as NH3 by day 10. Rodriguez et al. [56] found that only NBPT sprayed on pasture 3 to 5 days before urine deposition significantly reduced NH3 volatilization. Both in our study (Table 1) and that of Rodriguez et al. [56], soil extractable NH4+ concentrations in the urine-treated soil (0–5 cm) fell to near background levels (that of the control) after 30 days. In our study, soil extractable NO3 concentrations in the urine-treated soil increased to a peak (92–167 kgN/ha) at 22 days. By 76 days, however, soil extractable NO3 concentrations in the urine-treated soil (0–5 cm) had returned to near background levels (that of the control, Table 2). Similar patterns of delayed nitrification and rate of NO3N increase to 22 DAT were seen in the urine patches of Adhikari et al. [66] and Rodriguez et al. [56]. These were both shorter studies, <30 days, and soil extractable NO3 concentrations did not return to background levels by the end of soil sampling.

3.2.2. Total (NH4+ N + NO3 N) Soil Mineral N (0–5 cm and 0–60 cm)

The analysis of extractable soil mineral N (kgN/ha) from soil profiles of 0–5 cm (Figure 2) showed no significant difference in urine-treated plots between 10 September 2015 and 13 September 2015 (1 to 13 DAT, respectively). However, rainfall events of 9, 11, and 28 mm on 10 September 2015 (2 DAT), 22 September 2015 (13 DAT), and 23 September 2015 (14 DAT), respectively, resulted in field capacity on 22 September 2015 and 23 September 2015 and created 33 mm of drainage (Figure 2). This contributed to leaching of mineral N (mainly nitrate). At this point, ORUN® PLUS significantly (p < 0.001) had lower N (146.6 kgN/ha) compared with 261.2 and 305.2 kgN/ha for urine only and urine + ORUN®, respectively. On the 28 September 2015 (19 DAT), ORUN® PLUS significantly (p = 0.002) had lower N (88.6 kg/ha) compared with 176.1 and 187.5 kgN/ha for urine + ORUN® and urine + ProGibb®, respectively. There was no significant difference (p = 0.102) in soil mineral N between all treatments on the 1 October 2015 (22 DAT). Urine + ProGibb® and urine + ORUN® significantly (p = 0.001) had highest soil mineral N (149.70 and 140.33 kg/ha) on 4 October 2015.
The analysis of soil samples taken on the final date in Figure 2 (10 October 2015, (31 DAT)) revealed that ProGibb® had the highest N (138 kgN/ha) compared with 70, 86, and 73 kgN/ha for urine only, urine +ORUN®, and urine + ORUN® PLUS, respectively. When these values (for the 0–5 cm depth) were compared with the amounts of total soil mineral N (37 DAT) in the 0–60 cm soil profiles of 326, 245, 293, and 305 kgN/ha (Table 3) for urine only, urine + ProGibb®, urine +ORUN®, and urine + ORUN® PLUS, respectively, it was clear that at least 14–37% of the applied urine N had now leached to depths lower than 5 cm. Approximately 80% of the total mineral N in the 0–60 cm depth was in the form of NO3 N, and analysis of the individual depths indicated that 50% of the extractable NO3 N was deeper than 10 cm in the soil profile. This depth of urine-derived N (solute front) was consistent with a cumulative drainage of 38 mm by 37 DAT (15 October 2015, Figure 1) in a soil that had approximately 23 mm of available water in the top 10 cm. By 76 DAT (Table 3), even the total mineral N in the 0–60 cm depth had returned to near background levels (that of the control) following a cumulative drainage of 64 mm (24 November 2015, Figure 1A). A cumulative drainage volume of 64 mm was insufficient to push a nitrate leaching front beyond 60 cm depth and the front would be expected to be found around 30 to 40 cm depth. This suggests that the major pathway for loss of nitrogen from the 0–60 cm depth between DAT 37 and 76 was not leaching but denitrification (see later discussion on the low recovery of urine N by plant uptake).

3.3. Herbage Analysis from Spring Urine Patches Treated with and without ProGibb®, ORUN®, and ORUN® PLUS from Manawatu Mottled Fine Sandy Loam

Herbage analysis (dry matter yields, herbage N and P) is shown in Table 4.

3.3.1. Dry Matter Yields

The dry matter (DM) yields from the first harvest showed that plots treated with urine + ORUN® PLUS significantly (p = 0.042) produced higher DM yield (2386 kg/ha) compared with the urine only and the control nil urine (2052 and 1820 kg/ha), respectively. There was no significant difference in dry matter yield between plots treated with control nil urine + ProGibb®, urine + ProGibb®, urine + ORUN®, and urine only (2186, 2183, 2312, and 2052 kg/ha, respectively).
At the second harvest, the urine only significantly (p < 0.001) produced the highest DM (2801 kg/ha) compared with all treatments applied (control nil urine, control nil urine+ ProGibb®, urine + ProGibb®, urine + ORUN®, and urine + ORUN® PLUS with 2262, 1448, 2263, 2126, and 2086 kg/ha, respectively). Control nil urine + ProGibb® had the lowest (1448 kg/ha) DM yield, while no significant difference in DM yield was observed between control nil urine, urine + ProGibb®, urine + ORUN®, and urine + ORUN® PLUS.
Similarly, the cumulative DM yield over both harvests showed that plots treated with urine only produced a significantly (p < 0.001) higher DM yield (4854 kg/ha) compared with all treatments applied (control nil urine, control nil urine+ ProGibb®, urine + ProGibb®, urine + ORUN®, and urine + ORUN® PLUS with 3881, 3634, 4446, 4438, and 4471 kg/ha, respectively). Furthermore, there was no significant difference in cumulative DM yields between urine + ProGibb®, urine + ORUN®, and urine + ORUN® PLUS.

3.3.2. Herbage N

Herbage N analysis at the first harvest showed that all urine treatments significantly increased herbage N above the nil urine control (55.82 kgN/ha). Urine + ORUN® PLUS significantly (p < 0.001) produced higher herbage N uptake (85.18 kg/ha) compared with the urine + ProGibb® treatment (73.15 kgN/ha), while no significant difference was observed between urine only, urine + ORUN®, and urine + ORUN® PLUS. At the second harvest, the nil urine + ProGib® control produced significantly lower herbage N compared with all other treatments. Urine only produced significantly (p = 0.007) higher herbage N (67.11 kgN/ha) compared with the urine + ORUN® and urine + ORUN® PLUS treatments (55.25 and 53.29 kgN/ha, respectively). There was no significant difference observed between the urine only and urine + ProGibb®. The cumulative herbage N over both harvests revealed a significant (p < 0.0001) difference between urine only (147.72 kg/ha) and urine + ProGibb® (131.29 kgN/ha), with no significant difference between plots treated with urine only, urine + ORUN, and urine + ORUN® PLUS. The cumulative additional herbage N recovered from the urine treatment areas (minus control) ranged from 24.8 to 41.2 kgN/ha for urine + ProGib® and urine only, respectively. This additional plant uptake over 76 days (2.5 months) accounted for 4.6 and 7.6% of the applied urine N, respectively. These values for urine N recovery by the grass sward were lower than those measured by Adhikari et al. [66], which ranged from 13.5 to 18% over a growth period of 3.5–4 months after urine deposition.

3.3.3. Herbage P

The herbage P (% P) in all treatments was above 0.3% w/w and only just lower than the optimal range of 0.38–0.48% P for dairy and within the optimal range of 0.3–0.45% P for dry stock pasture [67]. The plant P uptake at first harvest showed no significant difference (p = 0.5324) between all treatments applied, while, at second harvest, plots treated with urine only significantly (p = 0.022) had higher herbage P (9.60 kg/ha) compared with 7.45, 7.60, and 7.01 kgP/ha for urine + ProGibb®, urine + ORUN, and urine + ORUN® PLUS, respectively. There was no significant difference in herbage P between plots with urine only and control nil urine. The cumulative P over the two harvests showed that plots treated with urine only significantly (p = 0.079) had higher cumulative P (18.29 kg/ha) compared with 15.65 and 16.00 kgP/ha from urine + ProGibb® and urine + ORUN® PLUS, respectively, while no significant difference in cumulative P was observed between control nil urine, urine only, and urine + ORUN® treatments.

3.4. Nitrous Oxide Emissions from Combined Effects of Climatic Data of Trial Site and the Application of ProGibb, ORUN®, and ORUN® PLUS to Spring Urine Patches from Manawatu Mottled Fine Sandy Loam
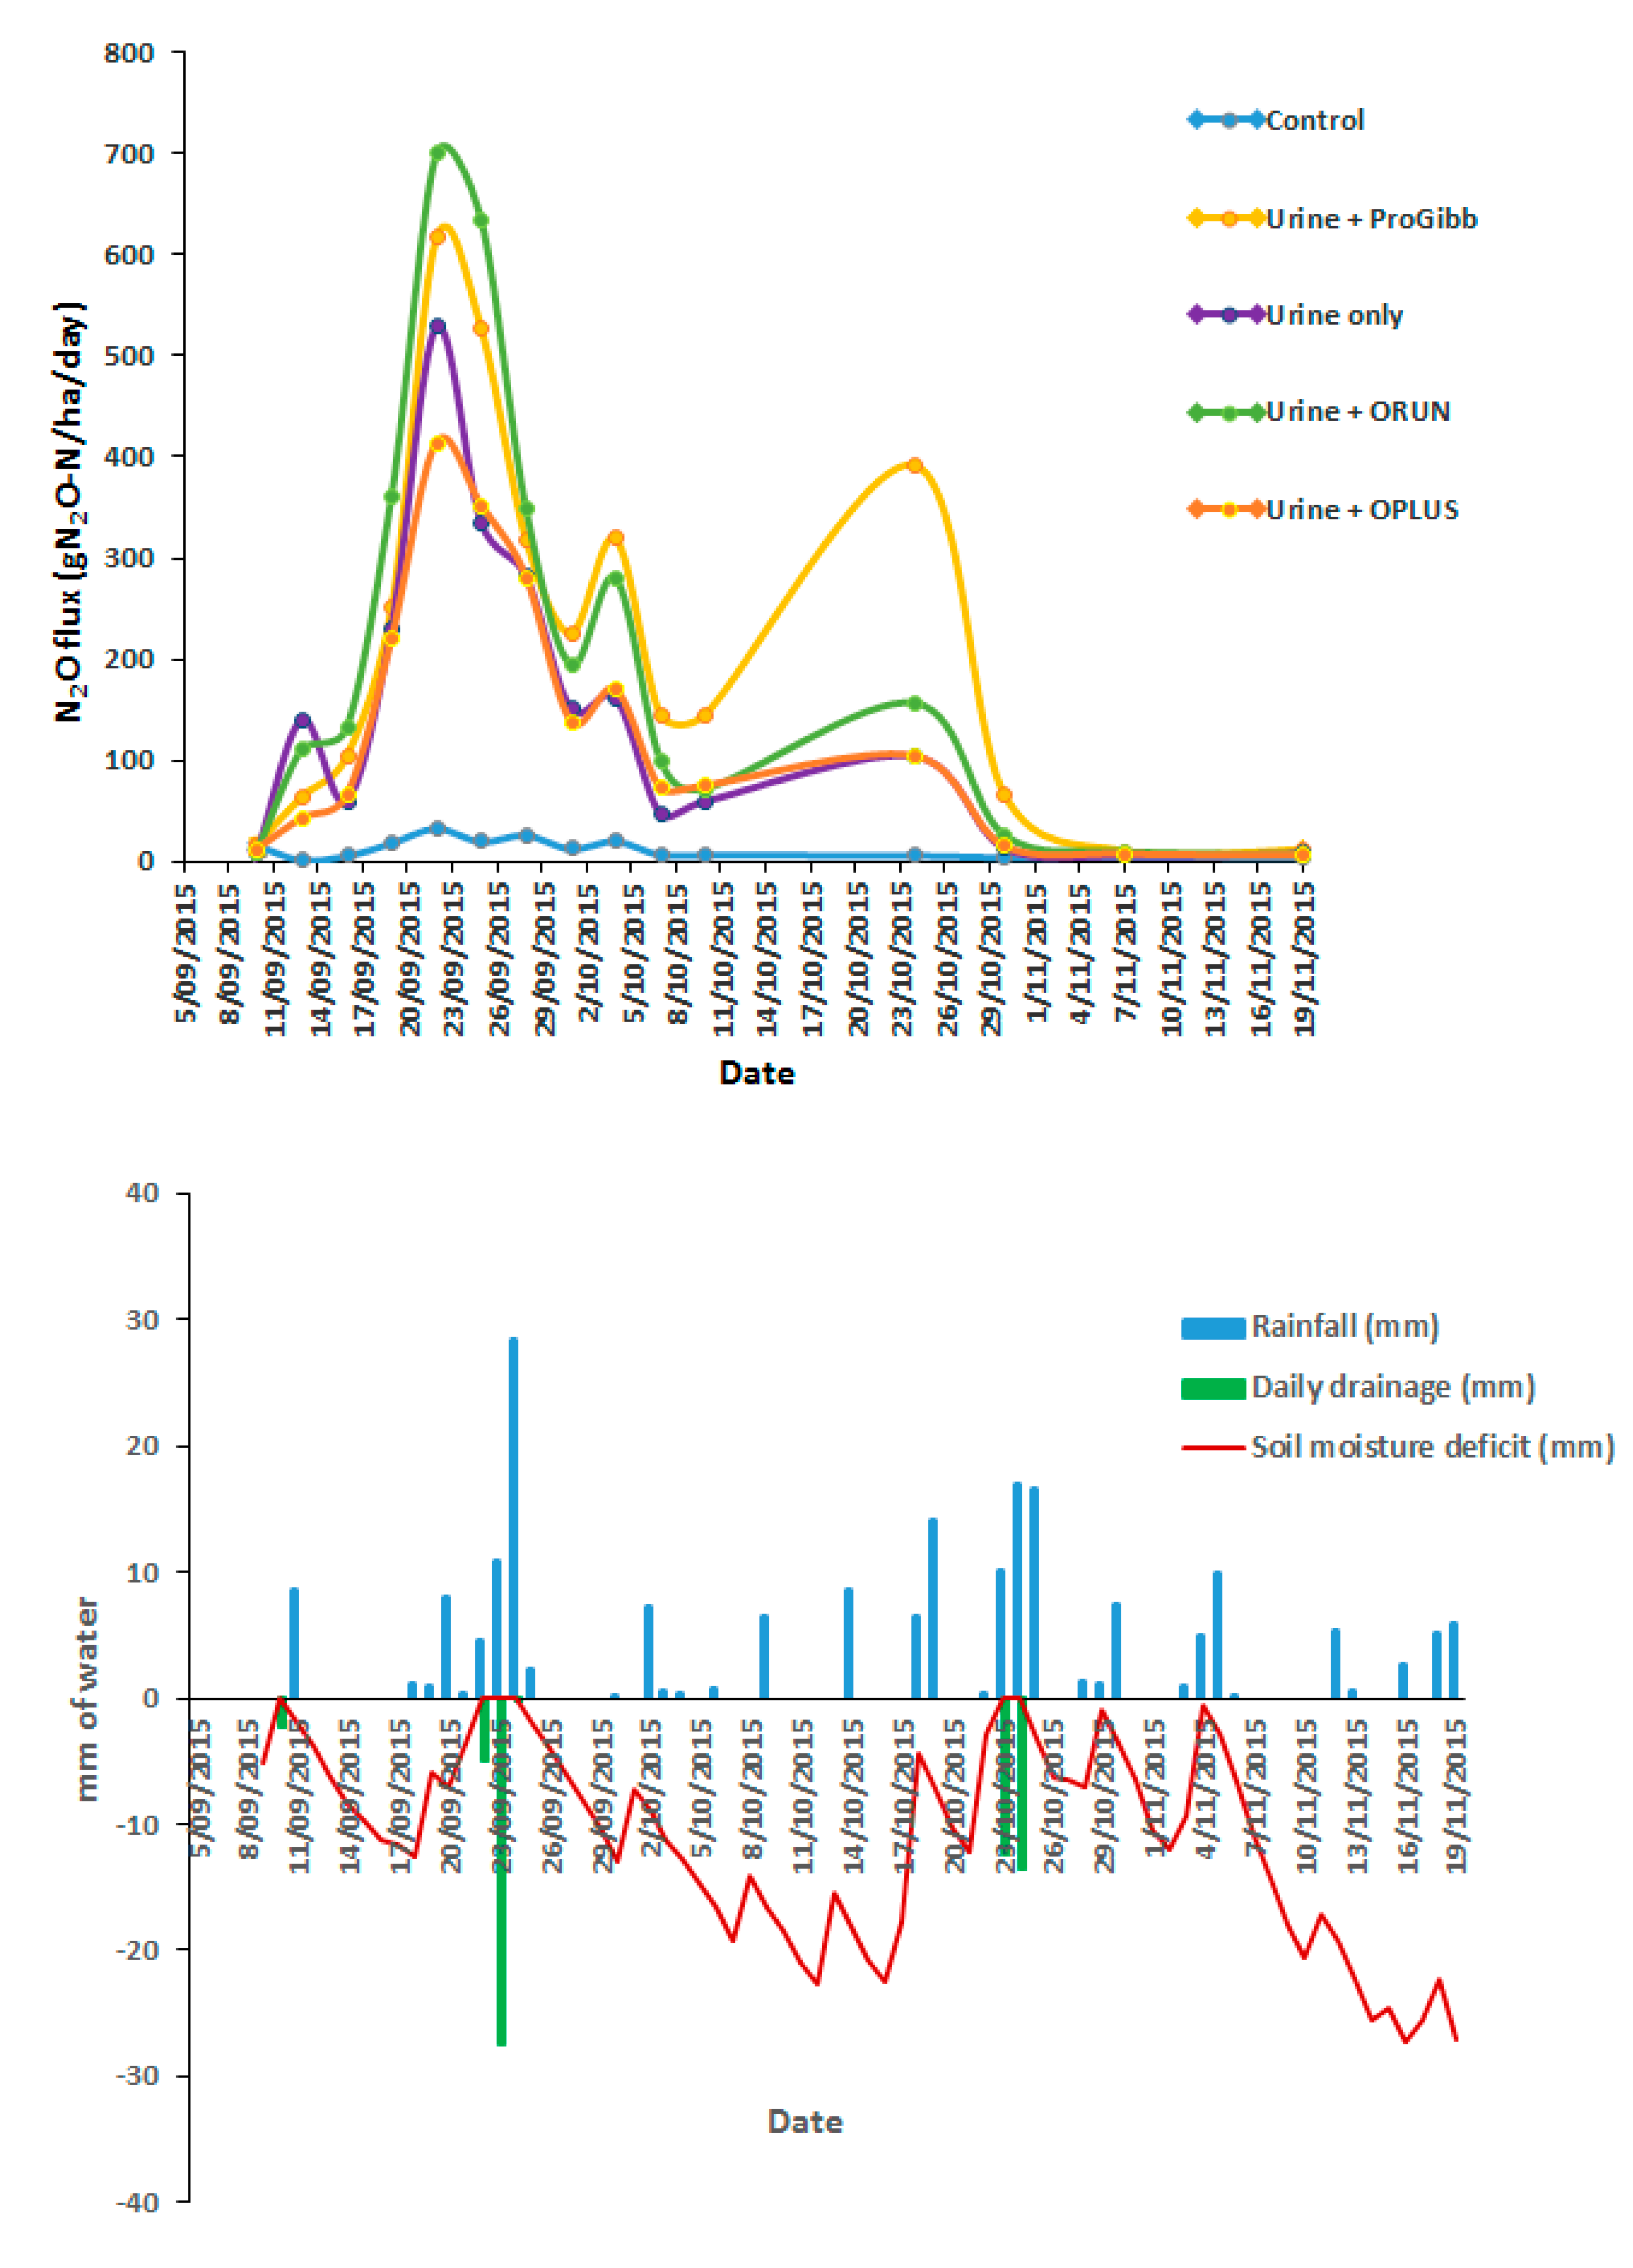
3.4.1. N2O Flux

Figure 3 shows nitrous oxide flux per day influenced by the combined effects of climatic data of the trial site and the application of ProGibb®, ORUN®, and ORUN® PLUS to spring urine patches on the Manawatu mottled fine sandy loam. Peak N2O flux occurred for all urine treatments on 23 September 2015 following a major rainfall event of 28 mm during the day prior to gas sampling. Following the peak N2O flux on the 23 September 2015, N2O fluxes decreased as the soil moisture deficit increased.
Significant differences in N2O flux between urine treatments occured in the period following 4 DAT, with urine + ProGibb® and urine + ORUN® PLUS (p = 0.0268) producing lower N2O flux (63.69 and 43.08 gN2O N/ha/d, respectively) compared with 140.40 gN2O N/ha/d from urine only, while no significant difference in N2O flux was observed between urine + ProGibb®, urine + ORUN®, and urine + ORUN® PLUS. On 13 DAT, plots treated with urine + ProGibb® and urine + ORUN® produced significantly (p < 0.0001) higher N2O flux (527.73 and 634.79 gN2O N/ha, respectively) compared with plots with urine only (334.72 gN2O N/ha). However, there was no significant difference in N2O flux between urine only and urine + ORUN® PLUS treatments, which was consistent with the differences between surface (0–5 cm) nitrate concentrations. A continuous decrease in N2O flux per day was observed until 25 DAT (4 October 2015). On DAT 25, following a series of rainfall events that lowered the soil moisture deficit to between 4 and 14 mm, the urine + ProGibb® and urine + ORUN® treatments produced significant (p = 0.0010) increases in N2O flux (319.35 and 279.93 gN2O N/ha/d, respectively) compared with 162.04 gN2O N/ha/d from urine only. Urine + ProGibb® treatment continued to produce significantly (p = 0.0033) higher N2O flux (391.89 gN2O N/ha/d) compared with urine only (104.20 gN2O-N/ha), while no significant difference in N2O flux was observed between urine only, urine + ORUN®, and urine + ORUN® PLUS treatments, following rainfall on 45 DAT (22, 23, and 24 October 2015). From 51 to 71 DAT, a remarkable decrease in N2O flux was observed, with no significant difference in N2O flux between urine patches treated with or without ProGibb®, ORUN®, and ORUN® PLUS at 71 DAT. This period recorded the highest (19 °C) mean daily soil temperature and highest (65 mm) highest (27 mm) soil moisture deficit. The fluctuations in N2O flux recorded in our experiments were consistent with other field trial research, in which soil moisture and temperature were identified as key drivers for soil N2O emissions [24,68,69,70,71,72]. In the absence of other limiting factors, an increase in soil temperature could result in an increase in soil–atmosphere exchange of N2O [70]. Soil temperatures of 15–20 °C are suitable for N2O production [72]. Soil aeration has an inverse relationship with soil moisture, precipitation, soil temperature, and available mineral N (ammonium, NH4+; nitrate, NO3; nitrite, NO2), which are major factors that influence N2O emissions from the soil [11,73]. In previous studies on N2O emissions from temperate grassland systems in the Southern and Northern Hemispheres (New Zealand and Germany, respectively), N2O emissions by denitrification were highest with water-filled pore space values of about 80% at relatively low NO3 concentrations, while N2O emissions by nitrification resulted from high NH4+ levels shortly after N application at soil temperatures around 10 °C [73]. Our highest flux rates (15–17 DAT) in a similar range of 650–700 g N2O-N ha–1 day–1 from spring-applied urine were reported in previous studies [51,52], which were associated with higher urine-N application rates of up to 1000 kgNha–1 and the application of irrigation.

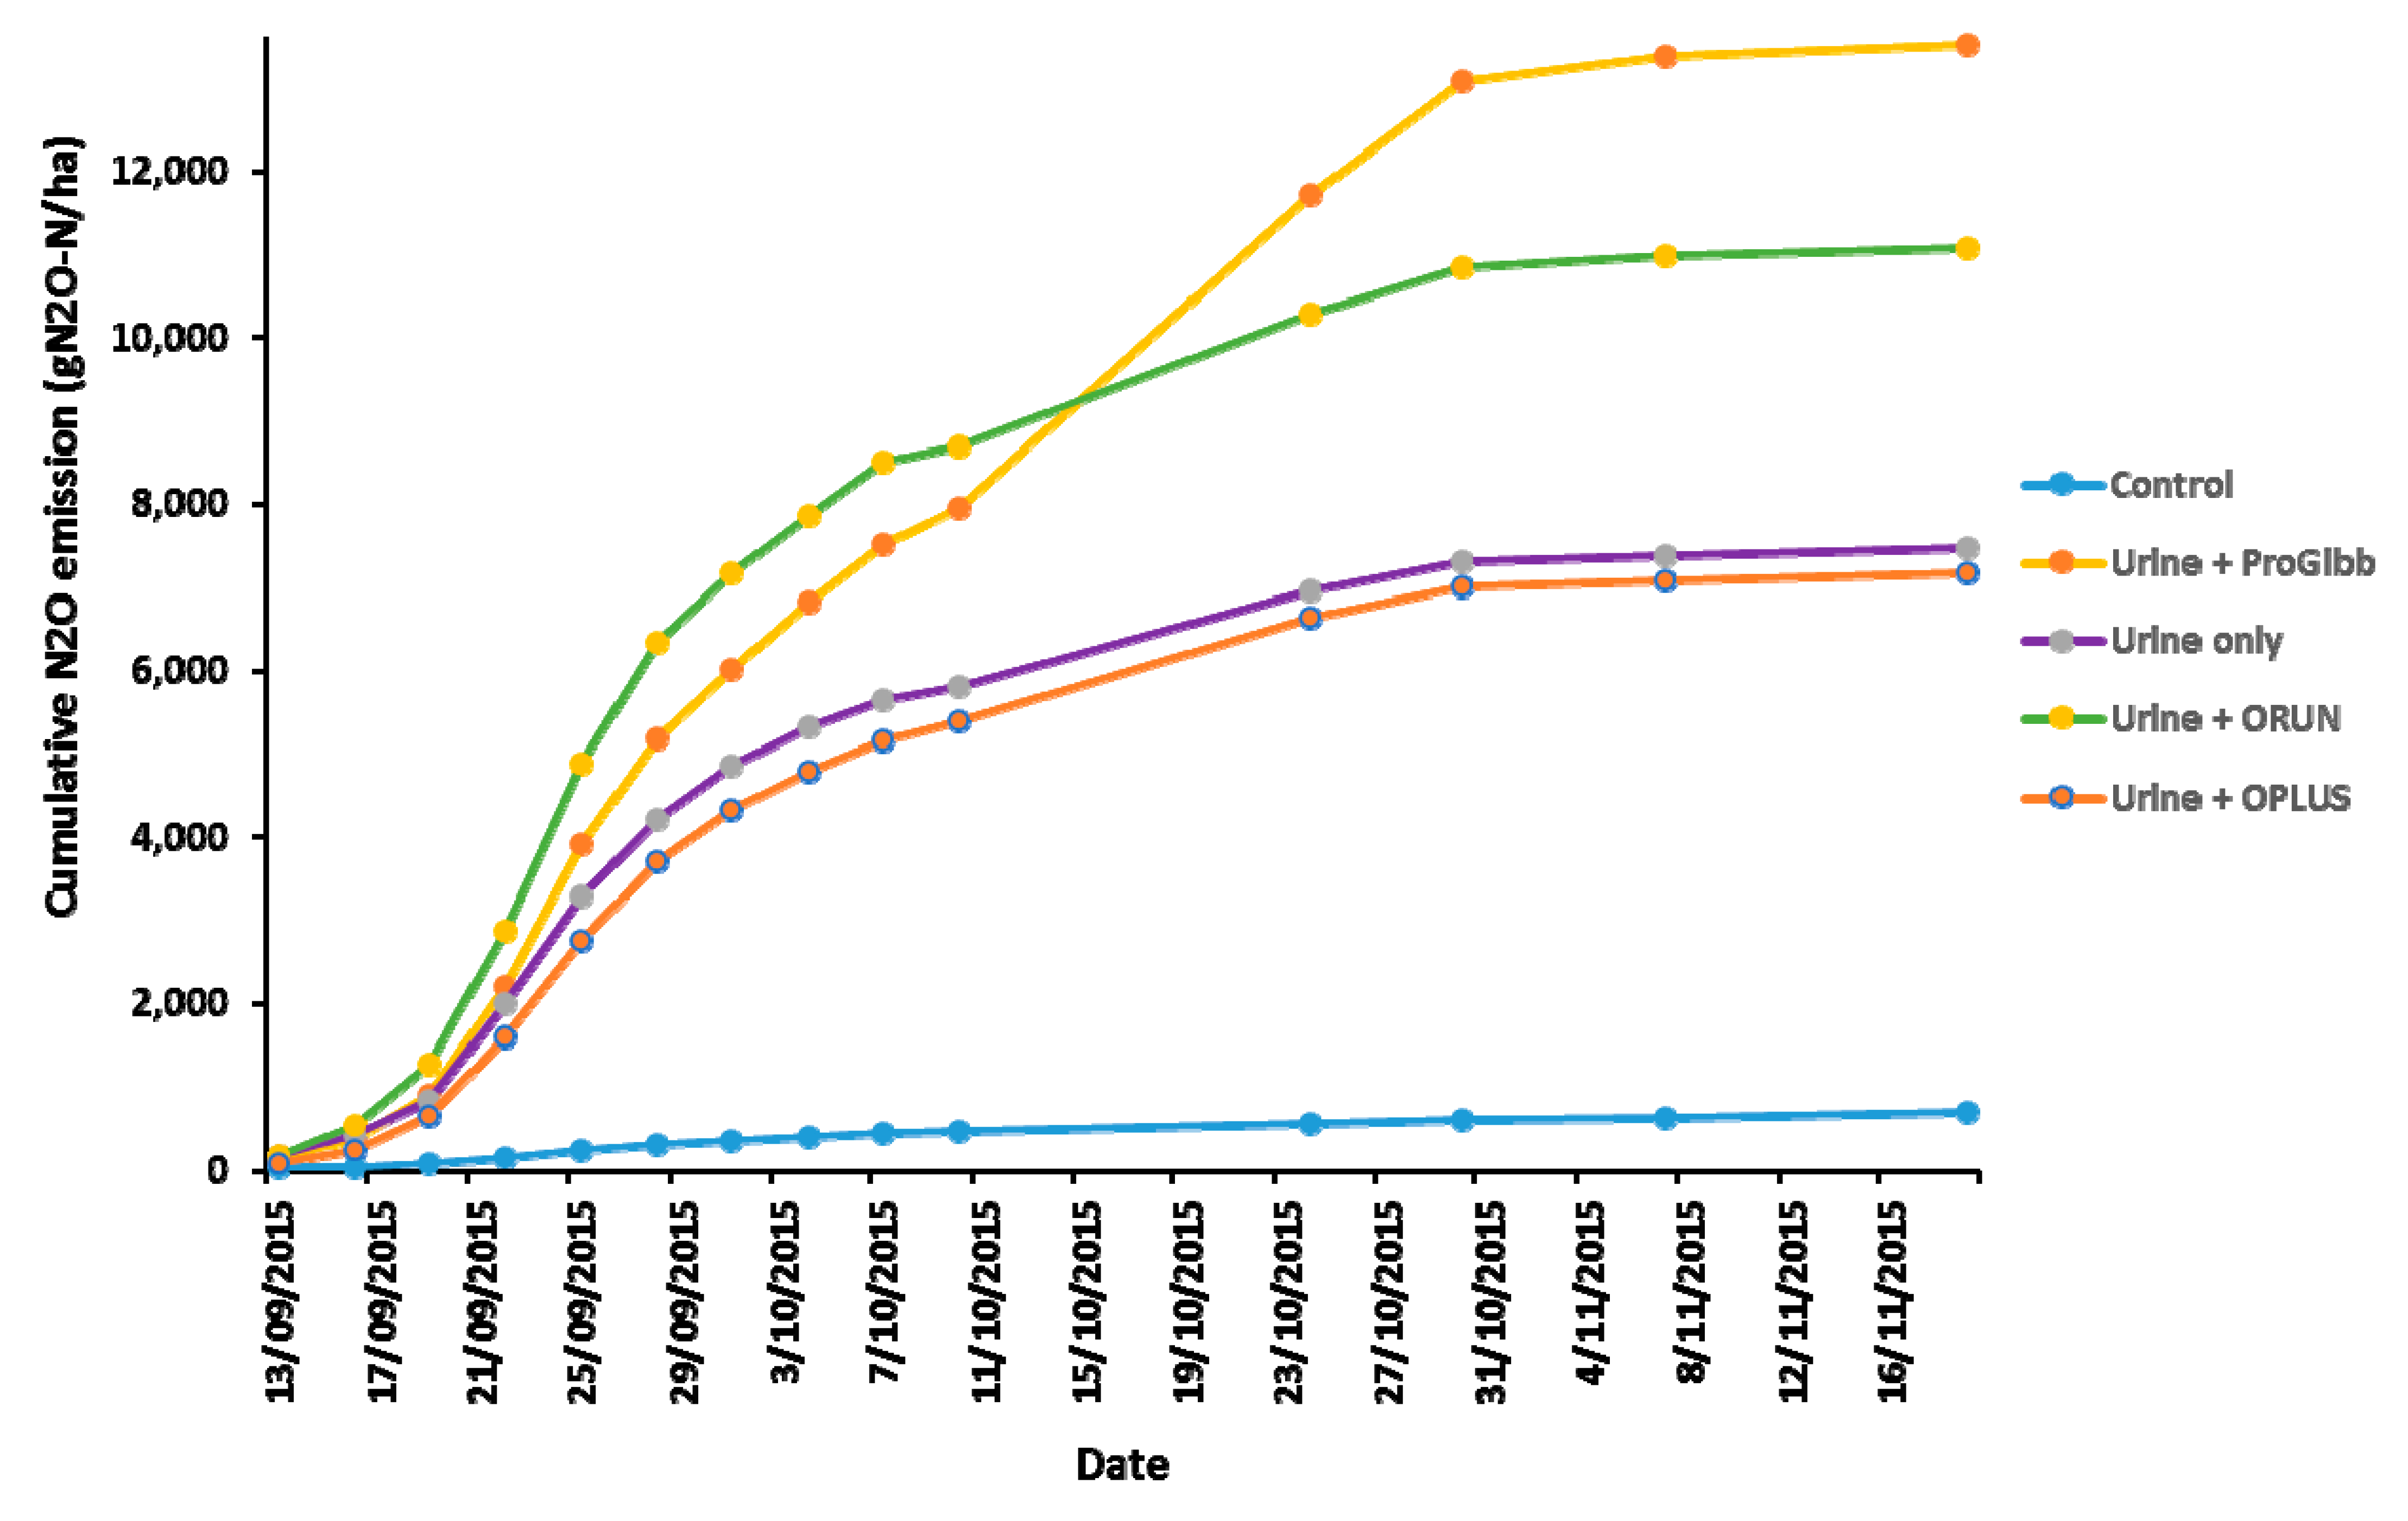
3.4.2. Cumulative N2O Flux

Figure 4 shows the cumulative N2O emissions over the period of the trial, notably the lowest cumulative emissions from urine-treated soils were from urine only and urine + ORUN® PLUS; all other treatments had higher emissions, with urine+ ProGibb® being the highest. None of the inhibitor treatment sprays were able to decrease the emissions of N2O, and the treatments of ProGibb® and ORUN® had increased emissions. The NBPT in ORUN® did not have a significant effect on the reduction of N2O emissions from the urine patches during springtime. Similar results were reported in a previous study [63] when the application of NBPT to urine patches during autumn, spring, or summer showed no significant effect on N2O emissions. In our study, higher emissions of N2O by urine + ProGibb® and urine + ORUN® treatments were associated with peaks of denitrification (Figure 3), when high soil NH4+ N concentrations (at 0–5 cm depth) on 13 September 2015 (Table 1) were first oxidized to NO3N during the period 13 September 2015–26 September 2015 (Table 2), but then rainfall on the 18, 21, and 22 September 2015 decreased the soil water deficit to zero (field capacity) (Figure 1), creating microaerophilic conditions and denitrification.

4. General Discussion

Fate of Urine-Applied N

After urine application of 540 kg N/ha, it is expected that approximately 14% (~75 kg N/ha) will be volatilized as NH3, as reported in similar studies [56,66] and the review by Selbie et al. [22]. Pasture growth after 76 days took up only an apparent 25–40 kgN/ha of urine-derived N (urine-treated minus control). Only approximately 6 kgN/ha of apparent urine-derived N remained in the soil profile at 76 DAT. The measured N2O N emissions were 6–12 kgN/ha (Figure 4); however, the combined emission of N2O and N2 would be significantly higher. We can speculate on the size of N2 emissions by referring to the recent studies of Ding et al. [74]. Following synthetic urine-15N application at either 400 or 800 kg N ha−1, Ding et al. [74] found that cumulative N2O emissions from soil after 95 days represented 0.16 ± 0.08% and 0.43 ± 0.08% of deposited N, respectively, while emitted N2 accounted for 32.1 ± 4.1% and 14.4 ± 1.7%, respectively. Therefore, with a urine-N application rate of 540 kg N ha−1 and similar soil moisture conditions, we might expect N2 emissions to be in the region of 162 kg N ha−1 (30% of 540 kg N ha−1). These estimates of NH3 loss, measured pasture N uptake, residual soil N, and N2O and N2 emissions accumulate to (75 + 40 + 6 + 12 + 162) 295 KgN/ha, which only accounts for 55% of the urine-N applied. As we expect the N leaching lost over this period to be low because of the low estimated drainage volume (64 mm, Figure 1), then it is likely that dentrification losses of N2 would be larger than estimated from the observations of Ding et al. [74]. Progib and Orun treatments had higher NO3N concentrations during a period of low soil water deficits, which led to higher N2O emissions and higher N2-N emissions. None of the inhibitor treatments increased the half life of urine N in soil for N to be used more productively for plant growth. Future research needs to focus on how to increase the contact between inhibitor sprays and the soil containing urine N if the management of inhibitor application is to reduce NH3 and N2O emissions from urine patches.

5. Conclusions

The results from this study revealed that the combined application of NBPT and gibberellic acid (patented as ORUN®) to urine patches during springtime over 76 days did not effectively reduce N2O emissions, increase soil mineral N concentrations, or increase plant N uptake. The fine spray application of NBPT did not delay the hydrolysis of urinary urea. This was likely due to poor contact between the NBPT in ORUN® and the urine-affected soil, resulting from spatial separation within the soil profile. In addition, the pasture plant growth rates in this trial were not stimulated by the application of gibberellic acid. Thus, the soil and plant processes required for the initial hypothesis to be proven did not occur under the climate and soil conditions of this trial. Whereas future research could be focused on how to increase the contact between urease and denitrification inhibitor sprays and the soil containing the urine N, a more effective solution to the high N2O and N leaching loss from dairy cow urine patches is likely to be feeding systems that reduce the surplus N intake by dairy cows grazing ryegrass/clover pastures.

Author Contributions

Conceptualization, M.J.H. and P.B.; methodology, M.J.H. and P.B.; formal analysis, I.J.J.O. and P.B.; data curation, I.J.J.O. and P.B.; writing—original draft preparation, I.J.J.O.; writing—review and editing I.J.J.O. and M.J.H.; supervision, M.J.H. and P.B.; project administration, M.J.H. All authors have read and agreed to the published version of the manuscript.

Funding

This research was funded by New Zealand Agricultural Greenhouse Gas Research Centre (NZAGRC).

Institutional Review Board Statement

Not applicable.

Informed Consent Statement

Not applicable.

Data Availability Statement

The data presented in this study are available on request from the corresponding author.

Acknowledgments

The authors are grateful to New Zealand Agency for International Development (NZAID) and NZAGRC for a postgraduate scholarship to I. J. J. Otene.

Conflicts of Interest

The authors declare no conflicts of interest.

References

  1. Araújo, R.G.; Chavez-Santoscoy, R.A.; Parra-Saldívar, R.; Melchor-Martínez, E.M.; Iqbal, H.M. Agro-food systems and environment: Sustaining the unsustainable. Curr. Opin. Environ. Sci. Health 2023, 31, 100413. [Google Scholar] [CrossRef]
  2. Habib, A.; Sarwar, S.; Ahson, U.; Idrees, A.S. Measuring green growth in agriculture: A comparative analysis of world economies. Qual. Quant. 2023, 57, 5491–5511. [Google Scholar] [CrossRef]
  3. Vannier, C.; Cochrane, T.A.; Zawar-Reza, P.; Bellamy, L. Development of a Systems Model for Assessing Pathways to Resilient, Sustainable, and Profitable Agriculture in New Zealand. Land 2022, 11, 2334. [Google Scholar] [CrossRef]
  4. Intergovernmental Panel on Climate Change (IPCC). Working Group 3. Climate Change 2007: Mitigation: Contribution of Working Group III to the Fourth Assessment Report of the Intergovernmental Panel on Climate Change: Summary for Policymakers and Technical Summary; Metz, B., Davidson, O., Bosch, P., Dave, R., Meyer, L., Eds.; Cambridge University Press: Cambridge, UK, 2007. [Google Scholar]
  5. Li, D.; Watson, C.J.; Yan, M.J.; Lalor, S.; Rafique, R.; Hyde, B.; Humphreys, J. A review of nitrous oxide mitigation by farm nitrogen management in temperate grassland-based agriculture. J. Environ. Manag. 2013, 128, 893–903. [Google Scholar] [CrossRef]
  6. Gaugler, T.; Stoeckl, S.; Rathgeber, A.W. Global climate impacts of agriculture: A meta-regression analysis of food production. J. Clean. Prod. 2020, 276, 122575. [Google Scholar] [CrossRef]
  7. Solomon, S.; Qin, D.; Manning, M.; Chen, Z.; Marquis, M.; Averyt, K.B.; Miller, H.L. Contribution of Working Group I to the Fourth Assessment Report of the Intergovernmental Panel on Climate Change. 2007. Available online: https://unfccc.int/process-and-meetings/transparency-and-reporting/greenhouse-gas-data/frequently-asked-questions/global-warming-potentials-ipcc-fourth-assessment-report (accessed on 19 February 2024).
  8. Ravishankara, A.R.; Daniel, J.S.; Portmann, R.W. Nitrous oxide (N2O): The dominant ozone-depleting substance emitted in the 21st century. Science 2009, 326, 123–125. [Google Scholar] [CrossRef] [PubMed]
  9. Reay, D.S.; Davidson, E.A.; Smith, K.A.; Smith, P.; Melillo, J.M.; Dentener, F.; Crutzen, P.J. Global agriculture and nitrous oxide emissions. Nat. Clim. Chang. 2012, 2, 410–416. [Google Scholar] [CrossRef]
  10. Tian, H.; Xu, R.; Canadell, J.G.; Thompson, R.L.; Winiwarter, W.; Suntharalingam, P.; Yao, Y.A. comprehensive quantification of global nitrous oxide sources and sinks. Nature 2020, 586, 248–256. [Google Scholar] [CrossRef] [PubMed]
  11. Wrage, N.; Velthof, G.L.; Van Beusichem, M.L.; Oenema, O. Role of nitrifier denitrification in the production of nitrous oxide. Soil Bio. Biochem. 2001, 33, 1723–1732. [Google Scholar] [CrossRef]
  12. Baral, K.R.; Thomsen, A.G.; Olesen, J.E.; Petersen, S.O. Controls of nitrous oxide emission after simulated cattle urine deposition. Agric. Ecosyst. Environ. 2014, 188, 103–110. [Google Scholar] [CrossRef]
  13. De Klein, C.A.M.; Eckard, R.J. Targeted technologies for nitrous oxide abatement from animal agriculture. Anim. Prod. Sci. 2008, 48, 14–20. [Google Scholar] [CrossRef]
  14. Caradus, J.R.; Goldson, S.L.; Moot, D.J.; Rowarth, J.S.; Stewart, A.V. Pastoral agriculture, a significant driver of New Zealand’s economy, based on an introduced grassland ecology and technological advances. J. R. Soc. N. Z. 2023, 53, 259–303. [Google Scholar] [CrossRef]
  15. Ministry of Primary Industries. Situation and Outlook for Primary Industries. 2021. p. 64. Available online: https://www.mpi.govt.nz/dmsdocument/45451-Situation-and-Outlook-for-Primary-Industries-SOPI-June-2021 (accessed on 14 July 2023).
  16. Ministry for the Environment (MFE). New Zealand’s Emissions Reduction Targets: Doing Our Fair Share. Available online: https://www.climatechange.govt.nz/ (accessed on 24 August 2016).
  17. New Zealand Agricultural Greenhouse Gas Research Centre (NZAGRC). Highlights 2014. 2015. p. 19. Available online: www.nzagrc.org.nz (accessed on 24 August 2016).
  18. Ministry for the Environment. New Zealand’s Greenhouse Gas Inventory 1990–2013: Fulfilling reporting requirements under the United Nations Framework Convention on Climate Change and the Kyoto Protocol. Available online: http://www.mfe.govt.nz (accessed on 13 August 2015).
  19. de Klein, C.A.; Luo, J.; Woodward, K.B.; Styles, T.; Wise, B.; Lindsey, S.; Cox, N. The effect of nitrogen concentration in synthetic cattle urine on nitrous oxide emissions. Agric. Ecosyst. Environ. 2014, 188, 85–92. [Google Scholar] [CrossRef]
  20. Saggar, S.; Jha, N.; Deslippe, J.; Bolan, N.S.; Luo, J.; Giltrap, D.L.; Tillman, R.W. Denitrification and N2O: N2 production in temperate grasslands: Processes, measurements, modelling and mitigating negative impacts. Sci. Total Environ. 2013, 465, 173–195. [Google Scholar] [CrossRef] [PubMed]
  21. Saggar, S.; Giltrap, D.L.; Hedley, C.B.; Lambie, S.M.; Tate, K.R.; Li, C.; Amstel, A.V. Nitrous oxide emissions from grazed perennial pastures in New Zealand. In Proceedings of the 4th International Symposium on non-CO2 Greenhouse Gases (NCGG-4), Science, Control, Policy and Implementation, Utrecht, The Netherlands, 4–6 July 2005; Millpress Science Publishers: Rotterdam, The Netherlands, 2005; pp. 113–122. [Google Scholar]
  22. Selbie, D.R.; Buckthought, L.E.; Shepherd, M.A. The Challenge of the Urine Patch for Managing Nitrogen in Grazed Pasture Systems. Adv. Agron. 2015, 129, 229–292. [Google Scholar]
  23. Saggar, S.; Andrew, R.M.; Tate, K.R.; Hedley, C.B.; Rodda, N.J.; Townsend, J.A. Modelling nitrous oxide emissions from dairy-grazed pastures. Nutr. Cycl. Agroecosystems 2004, 68, 243–255. [Google Scholar] [CrossRef]
  24. van der Weerden, T.J.; Manderson, A.; Kelliher, F.M.; de Klein, C.A. Spatial and temporal nitrous oxide emissions from dairy cattle urine deposited onto grazed pastures across New Zealand based on soil water balance modelling. Agric. Ecosyst. Environ. 2014, 189, 92–100. [Google Scholar] [CrossRef]
  25. Whitehead, D.; Edwards, G.R. Assessment of the application of gibberellins to increase productivity and reduce nitrous oxide emissions in grazed grassland. Agric. Ecosyst. Environ. 2015, 207, 40–50. [Google Scholar] [CrossRef]
  26. Cheng, L.; Judson, H.G.; Bryant, R.H.; Mowat, H.; Guinot, L.; Hague, H.; Edwards, G.R. The effects of feeding cut plantain and perennial ryegrass-white clover pasture on dairy heifer feed and water intake, apparent nutrient digestibility and nitrogen excretion in urine. Ani. Feed Sci. Technol. 2017, 229, 43–46. [Google Scholar] [CrossRef]
  27. de Klein, C.A.; van der Weerden, T.J.; Luo, J.; Cameron, K.C.; Di, H.J. A review of plant options for mitigating nitrous oxide emissions from pasture-based systems. N. Z. J. Agric. Res. 2020, 63, 29–43. [Google Scholar] [CrossRef]
  28. Earl-Goulet, S.; Talbot, W.D.; Cameron, K.C.; Di, H.J. Effects of plantain in pasture on nitrous oxide emissions from cattle urine patches, as affected by urine deposition timing and soil type. N. Z. J. Agric. Res. 2023, 66, 44–60. [Google Scholar] [CrossRef]
  29. Gardiner, C.A.; Clough, T.J.; Cameron, K.C.; Di, H.J.; Edwards, G.R.; de Klein, C.A. Potential inhibition of urine patch nitrous oxide emissions by Plantago lanceolata and its metabolite aucubin. N. Z. J. Agric. Res. 2018, 61, 495–503. [Google Scholar] [CrossRef]
  30. Gardiner, C.A.; Clough, T.J.; Cameron, K.C.; Di, H.J.; Edwards, G.R. Efficacy of aucubin as a nitrification inhibitor assessed in two Canterbury field trials. N. Z. J. Agric. Res. 2020, 63, 73–86. [Google Scholar] [CrossRef]
  31. Luo, J.; Balvert, S.F.; Wise, B.; Welten, B.; Ledgard, S.F.; de Klein, C.A.M.; Judge, A. Using alternative forage species to reduce emissions of the greenhouse gas nitrous oxide from cattle urine deposited onto soil. Sci. Total Environ. 2018, 610, 1271–1280. [Google Scholar] [CrossRef]
  32. Rodriguez, M.J.; Navarrete, S.; Horne, D.J.; Hanly, J.A.; Bishop, P.; Kemp, P.D. Can secondary metabolites of plantain reduce N losses from urine patches? N. Z. J. Agric. Res. 2023, 66, 83–100. [Google Scholar] [CrossRef]
  33. Simon, P.L.; de Klein, C.A.; Worth, W.; Rutherford, A.J.; Dieckow, J. The efficacy of Plantago lanceolata for mitigating nitrous oxide emissions from cattle urine patches. Sci. Total Environ. 2019, 691, 430–441. [Google Scholar] [CrossRef]
  34. Adler, A.A.; Doole, G.J.; Romera, A.J.; Beukes, P.C. Managing greenhouse gas emissions in two major dairy regions of New Zealand: A system-level evaluation. Agric. Syst. 2015, 135, 1–9. [Google Scholar] [CrossRef]
  35. Fleming, D.; Kerr, S.; Lou, E. Cows, cash and climate: Low stocking rates, high-performing cows, emissions and profitability across New Zealand farms. High-Perform. Cows Emiss. Profitab. N. Z. Farms 2019, 1124-2019-2294. [Google Scholar]
  36. Leahy, S.C.; Kearney, L.; Reisinger, A.; Clark, H. Mitigating greenhouse gas emissions from New Zealand pasture-based livestock farm systems. J. New Zealand Grassl. 2019, 81, 101–110. [Google Scholar] [CrossRef]
  37. Reisinger, A.; Clark, H.; Journeaux, P.; Clark, D.; Lambert, G. On-Farm Options to Reduce Agricultural GHG Emissions in New Zealand; New Zealand Agricultural Greenhouse Gas Research Centre: Palmerston North, New Zealand, 2017. [Google Scholar]
  38. Van der Weerden, T.; Beukes, P.; De Klein, C.; Hutchinson, K.; Farrell, L.; Stormink, T.; Dynes, R. The effects of system changes in grazed dairy farmlet trials on greenhouse gas emissions. Animals 2018, 8, 234. [Google Scholar] [CrossRef]
  39. Christensen, C.L.; Hedley, M.J.; Hanly, J.A.; Horne, D.J. Duration-controlled grazing of dairy cows. 2: Nitrogen losses in sub-surface drainage water and surface runoff. N. Z. J. Agric. Res. 2019, 62, 48–68. [Google Scholar] [CrossRef]
  40. Romera, A.J.; Cichota, R.; Beukes, P.C.; Gregorini, P.; Snow, V.O.; Vogeler, I. Combining restricted grazing and nitrification inhibitors to reduce nitrogen leaching on New Zealand dairy farms. J. Environ. Qual. 2017, 46, 72–79. [Google Scholar] [CrossRef]
  41. Van der Weerden, T.J.; Laurenson, S.; Vogeler, I.; Beukes, P.C.; Thomas, S.M.; Rees, R.M.; De Klein, C.A.M. Mitigating nitrous oxide and manure-derived methane emissions by removing cows in response to wet soil conditions. Agric. Syst. 2017, 156, 126–138. [Google Scholar] [CrossRef]
  42. de Klein, C.A.; Shepherd, M.A.; van der Weerden, T.J. Nitrous oxide emissions from grazed grasslands: Interactions between the N cycle and climate change—A New Zealand case study. Curr. Opin. Environ. Sust. 2014, 9, 131–139. [Google Scholar] [CrossRef]
  43. Edwards, G.R.; De Ruiter, J.M.; Dalley, D.E.; Pinxterhuis, J.B.; Cameron, K.C.; Bryant, R.H.; Chapman, D.F. Urinary nitrogen concentration of cows grazing fodder beet, kale and kale-oat forage systems in winter. In Proceedings of the 5th Australasian Dairy Science Symposium, Hamilton, New Zealand, 19–21 November 2014; pp. 144–147. [Google Scholar]
  44. Luo, J.; Sun, X.Z.; Pacheco, D.; Ledgard, S.F.; Lindsey, S.B.; Hoogendoorn, C.J.; Watkins, N.L. Nitrous oxide emission factors for urine and dung from sheep fed either fresh forage rape (Brassica napus L.) or fresh perennial ryegrass (Lolium perenne L.). Animals 2015, 9, 534–543. [Google Scholar] [CrossRef]
  45. Malcolm, B.J.; Cameron, K.C.; Edwards, G.R.; Di, H.J. Nitrogen leaching losses from lysimeters containing winter kale: The effects of urinary N rate and DCD application. N. Z. J. Agric. Res. 2015, 58, 13–25. [Google Scholar] [CrossRef]
  46. Gardiner, C.A.; Clough, T.J.; Cameron, K.C.; Di, H.J.; Edwards, G.R.; de Klein, C.A.M. Potential for forage diet manipulation in New Zealand pasture ecosystems to mitigate ruminant urine derived N2O emissions: A review. N. Z. J. Agric. Res. 2016, 59, 301–317. [Google Scholar] [CrossRef]
  47. Adhikari, K.P.; Chibuike, G.; Saggar, S.; Simon, P.L.; Luo, J.; de Klein, C.A. Management and implications of using nitrification inhibitors to reduce nitrous oxide emissions from urine patches on grazed pasture soils–A review. Sci. Total Environ. 2021, 791, 148099. [Google Scholar] [CrossRef]
  48. Chibuike, G.; Saggar, S.; Palmada, T.; Luo, J. The persistence and efficacy of nitrification inhibitors to mitigate nitrous oxide emissions from New Zealand pasture soils amended with urine. Geoderma Reg. 2022, 30, e00541. [Google Scholar] [CrossRef]
  49. Grace, P.; De Rosa, D.; Shcherbak, I.; Strazzabosco, A.; Rowlings, D.; Scheer, C.; Bell, M. Revised emission factors for estimating direct nitrous oxide emissions from nitrogen inputs in Australia’s agricultural production systems: A meta-analysis. Soil Res. 2023, 62, SR23070. [Google Scholar] [CrossRef]
  50. Soares, J.R.; Souza, B.R.; Mazzetto, A.M.; Galdos, M.V.; Chadwick, D.R.; Campbell, E.E.; Jaiswal, D.; Oliveira, J.C.; Monteiro, L.A.; Vianna, M.S.; et al. Mitigation of nitrous oxide emissions in grazing systems through nitrification inhibitors: A meta-analysis. Nutr. Cycl. Agroecosystems 2023, 125, 359–377. [Google Scholar] [CrossRef]
  51. Di, H.J.; Cameron, K.C. Nitrous oxide emissions from two dairy pasture soils as affected by different rates of a fine particle suspension nitrification inhibitor, dicyandiamide. Biol. Fertil. Soils 2006, 42, 472–480. [Google Scholar] [CrossRef]
  52. Di, H.J.; Cameron, K.C.; Sherlock, R.R. Comparison of the effectiveness of a nitrification inhibitor, dicyandiamide, in reducing nitrous oxide emissions in four different soils under different climatic and management conditions. Soil Use Man. 2007, 23, 1–9. [Google Scholar] [CrossRef]
  53. Hoogendoorn, C.J.; de Klein, C.A.; Rutherford, A.J.; Letica, S.; Devantier, B.P. The effect of increasing rates of nitrogen fertiliser and a nitrification inhibitor on nitrous oxide emissions from urine patches on sheep grazed hill country pasture. Aust. Prod. Sci. 2008, 48, 147–151. [Google Scholar] [CrossRef]
  54. Ravensdown. N-Protect®. Available online: https://www.ravensdown.co.nz/products/fertiliser/n-protect (accessed on 19 February 2024).
  55. O’Neill, M.; Richards, K.A.; Bates, G.; Smith, D.; Forrestal, P.J. Performance of “Spikey” in locating and detecting freshly deposited urine aptches in livestock grazed pasture soils of Ireland. In Nutrient Management in Farmed Landscapes; Christensen, C.L., Horne, D.J., Singh, R., Eds.; Occasional Report No. 33; Farmed Landscapes Research Centre, Massey University: Palmerston North, New Zealand, 2020; 11p, Available online: http://flrc.massey.ac.nz/publications.html (accessed on 19 February 2024).
  56. Rodriguez, M.J.; Saggar, S.; Berben, P.; Palmada, T.; Lopez-Villalobos, N.; Pal, P. Use of a urease inhibitor to mitigate ammonia emissions from urine patches. Environ. Technol. 2021, 42, 20–31. [Google Scholar] [CrossRef]
  57. Ray, A.; Nkwonta, C.; Forrestal, P.; Hogan, S.; Cummins, E. Current knowledge on urease and nitrification inhibitors technology and their safety. Rev. Environ. Health 2021, 36, 477–491. [Google Scholar] [CrossRef]
  58. Bishop, P.A.; Quin, B.F. Modelling of the Effect of Combined DCD and Urease Inhibitors on the Post-Doposition Size of Urine Patches–Implications for Decreased N losses and Increased Pasture Production Using the ‘Taurine’ Tail-Attached Dispenser. In Proceedings of the Workshop “Farming’s Future: Minimising Footprints and Maximising Margins, Palmerston North, New Zealand, 10–11 February 2010; pp. 268–273. [Google Scholar]
  59. Cowie, J.D.; Rijkse, W.C. Soils of Manawatu County, North Island, New Zealand. N. Z. Soil Surv. Rep. 1977, 30, 34–41. [Google Scholar]
  60. Soil Survey Staff. Keys to Soil Taxonomy, 12th ed.; USDA, Natural Resources Conservation Service: Washington, DC, USA, 2014. [Google Scholar]
  61. Kamphake, L.J.; Hannah, S.A.; Cohen, J.M. Automated analysis for nitrate by hydrazine reduction. Water Res. 1967, 1, 205–216. [Google Scholar] [CrossRef]
  62. Blakemore, L.C.; Searle, P.L.; Daly, B.K. Methods for chemical analysis of soils. N. Z. Soil Bur. Scient. Rep. 1987, 80, 21–23. [Google Scholar]
  63. Zaman, M.; Saggar, S.; Blennerhassett, J.D.; Singh, J. Effect of urease and nitrification inhibitors on N transformation, gaseous emissions of ammonia and nitrous oxide, pasture yield and N uptake in grazed pasture system. Soil Biol. Biochem. 2009, 41, 1270–1280. [Google Scholar] [CrossRef]
  64. Rolston, D.E. Gases flux. In Methods of Soil Analysis Part 1 Physical and Mineralogical Methods; Klute, A., Ed.; Soil Science Society of America: Madison, WI, USA, 1986; pp. 1103–1119. [Google Scholar]
  65. Hensen, A.; Skiba, U.; Famulari, D. Low cost and state of the art methods to measure nitrous oxide emissions. Environ. Res. Lett. 2013, 8, 025022. [Google Scholar] [CrossRef]
  66. Adhikari, K.P.; Saggar, S.; Hanly, J.A.; Guinto, D.F. Urease inhibitors reduced ammonia emissions from cattle urine applied to pasture soil. Nutr. Cycl. Agroecosystems 2020, 117, 317–335. [Google Scholar] [CrossRef]
  67. Hill Laboratories Limited, R.J. Crop Guide-Mixed Pasture. KB Item: 3472v3. Available online: http://www.hill-laboratories.com/file/fileid/38620 (accessed on 24 August 2016).
  68. Bell, M.J.; Rees, R.M.; Cloy, J.M.; Topp, C.F.E.; Bagnall, A.; Chadwick, D.R. Nitrous oxide emissions from cattle excreta applied to a Scottish grassland: Effects of soil and climatic conditions and a nitrification inhibitor. Sci. Total Environ. 2015, 508, 343–353. [Google Scholar] [CrossRef] [PubMed]
  69. Wu, X.; Brüggemann, N.; Gasche, R.; Shen, Z.; Wolf, B.; Butterbach-Bahl, K. Environmental controls over soil-atmosphere exchange of N2O, NO, and CO2 in a temperate Norway spruce forest. Glob. Biogeochem. Cycles 2010, 2, 24. [Google Scholar] [CrossRef]
  70. Luo, G.J.; Brüggemann, N.; Wolf, B.; Gasche, R.; Grote, R.; Butterbach-Bahl, K. Decadal variability of soil CO2, NO, N2O, and CH4 fluxes at the Höglwald Forest, Germany. Biogeoscience 2012, 9, 1741–1763. [Google Scholar] [CrossRef]
  71. Alves, B.J.; Smith, K.A.; Flores, R.A.; Cardoso, A.S.; Oliveira, W.R.; Jantalia, C.P.; Boddey, R.M. Selection of the most suitable sampling time for static chambers for the estimation of daily mean N2O flux from soils. Soil Biol. Biochem. 2012, 46, 129–135. [Google Scholar] [CrossRef]
  72. Hargreaves, P.R.; Rees, R.M.; Horgan, G.W.; Ball, B.C. Size and Persistence of Nitrous Oxide Hot-Spots in Grazed and Ungrazed Grassland. Environ. Nat. Res. Res. 2015, 5, 1. [Google Scholar] [CrossRef]
  73. Müller, C.; Sherlock, R.R. Nitrous oxide emissions from temperate grassland ecosystems in the Northern and Southern Hemispheres. Glob. Biogeochem. Cycles 2004, 1, 18. [Google Scholar] [CrossRef]
  74. Ding, K.; Luo, J.; Clough, T.J.; Lindsey, S.; Di, H.J. In situ nitrous oxide and dinitrogen fluxes from a grazed pasture soil following cow urine application at two nitrogen rates. Sci. Total Environ. 2022, 838, 156473. [Google Scholar] [CrossRef]
Figure 1. Climatic data at trial site.
Sustainability 16 02843 g001
Figure 2. Daily rainfall, drainage, soil moisture deficit, and extractable total mineral N (kg/ha) in 0–5 cm soil profiles for spring urine patches treated with and without ProGibb, ORUN®, and ORUN® PLUS from Manawatu mottled fine sandy loam. Note: Cnil U—control nil urine, U + PrGb—urine + ProGibb®, U0—urine only, U + O—urine + ORUN®, U + OPLUS—urine + ORUN® PLUS.
Sustainability 16 02843 g002
Figure 3. Nitrous oxide emissions from combined effects of climatic data of trial site and the application of ProGibb, ORUN®, and ORUN® PLUS to spring urine patches from Manawatu mottled fine sandy loam.
Sustainability 16 02843 g003
Figure 4. Cumulative N2O emissions from combined effects of climatic data of trial site and the application of ProGibb, ORUN®, and ORUN® PLUS to spring urine patches from Manawatu mottled fine sandy loam.
Sustainability 16 02843 g004
Table 1. Extractable kg NH4+ N/ha in 0–5 cm soil profiles for spring urine patches treated with and without ProGibb®, ORUN®, and ORUN® PLUS from Manawatu mottled fine sandy loam.
Treatment10 September 201513 September 201526 September 201528 September 20151 October 20154 October 201510 October 201516 October 201524 November 2015
Days after Application of Treatment (DAT)1417192225313776
Cnil U28.9 b20.84 b10.65 c6.5521.1114.7213.176.2213.11
CnilU + PrGb15.9 b12.82 b13.15 c10.2419.8814.3613.78ndnd
U0377.8 a384.29 a195.52 ab54.573114.1211.916.0511.76
U + PrGb481.9 a501.05 a130.90 ab86.153.1827.7816.638.628.13
U + O457.2 a509.93 a231.85 a66.5222.0229.4711.278.498.8
U + OPLUS320.7 a502.63 a98.11 bc31.2451.414.9518.458.419.65
LSD184.89164.98114.5767.3248.94518.5796.8043.8624.804
SEM78.161.842.126.720.376.982.61.5321.906
p value0.0005<0.00010.01520.2891 NS0.7046 NS0.4861 NS0.4383 NS0.593 NS0.362 NS
Note: means with the same letter (s) within a column are not significantly different; LSD—least significant difference, SEM—standard error of means, NS—not significant; Cnil U—control nil urine, CnilU + PrGb—control nil urine + ProGibb®, U + PrGb—urine + ProGibb®, U0—urine only, U + O—urine + ORUN®, U + OPLUS—urine + ORUN® PLUS, nd—not determined.
Table 2. Extractable kg NO3 N/ha in 0–5 cm soil profiles for spring urine patches treated with and without ProGibb, ORUN®, and ORUN® PLUS from Manawatu mottled fine sandy loam.
Treatment10 September 201513 September 201526 September 201528 September 20151 October 20154 October 201510 October 201516 October 201524 November 2015
Days after Application of Treatment (DAT)1417192225313776
Cnil U10.066.113.67 b6.30 c10.14 b4.95 c6.16 cd44.84
CnilU + PrGb2.22.21.47 b2.92 c33.20 b2.78 c4.24 dndnd
U02.263.5865.72 a90.21 ab126.77 a42.08 b48.15 bcd674.04
U + PrGb2.392.0655.56 a101.36 a165.82 a121.92 a121.40 a722.23
U + O1.83.2773.34 a109.62 a161.75 a110.86 a74.86 ab894.84
U + OPLUS2.173.0748.47 a57.34 b91.82 ab61.98 b54.56 bc362.59
LSD5.9423.18540.13942.66483.30537.64749.63858.84.087
SEM2.3971.28513.6315.2734.914.3220.0223.31.622
p value0.1686 NS0.3900 NS0.01880.00060.0174<0.00010.00410.142 NS0.683 NS
Note: means with the same letter (s) within a column are not significantly different; LSD—least significant difference, SEM—standard error of means, NS—not significant; Cnil U—control nil urine, CnilU + PrGb—control nil urine + ProGibb®, U + PrGb—urine + ProGibb®, U0—urine only, U + O—urine + ORUN®, U + OPLUS—urine + ORUN PLUS®, nd—not determined.
Table 3. Extractable mineral N from soil profiles of 0–60 cm for spring urine patches treated with and without ProGibb, ORUN®, and ORUN® PLUS from Manawatu mottled fine sandy loam.
Treatment16 October 201524 November 2015
Days after Application of Treatment (DAT)3776
NH4+ NNO3 NTotal Mineral N
(kg/ha)
NH4+ NNO3 NTotal Mineral N
(kg/ha)
Cnil U20.413.3 b33.7 b61.76.468.1
U040.6285.6 a326.2 a60.613.574.1
U + PrGb40.6204.8 a245.4 a54.418.372.7
U + O44.4248.8 a293.2 a61.710.572.2
U + OPLUS64.8240.4 a305.2 a62.51274.5
LSD51.33134.3180.87.599.36.77
SEM20.3653.371.73.013.692.69
p value0.671 NS0.0260.0760.357 NS0.292 NS0.499 NS
Note: means with the same letter (s) within a column are not significantly different; LSD—least significant difference, SEM—standard error of means, NS—not significant; Cnil U—control nil urine, U + PrGb—urine + ProGibb®, U0—urine only, U + O—urine + ORUN®, U + OPLUS—urine + ORUN® PLUS.
Table 4. Herbage analysis from spring urine patches treated with and without ProGibb, ORUN®, and ORUN® PLUS from Manawatu mottled fine sandy loam.
TreatmentDry Matter (kg/ha)Herbage N (kgN/ha)Herbage P (kgP/ha)
First HarvestSecond HarvestCumulative HarvestFirst HarvestSecond HarvestCumulative NFirst HarvestSecond HarvestCumulative P
Cnil U1820 c2262.6 b3881 c55.82 c50.72 b106.54 c8.0468.80 ab16.85 ab
CnilU + PrGb2186 ab1448 c3634 c59.09 c35.29 c90.43 d8.655.83 c14.48 c
U02052 bc2801 a4854 a80.61 ab67.11 a147.72 a8.699.60 a18.29 a
U + PrGb2183 ab2263 b4446 b73.15 b58.14 ab131.29 b8.217.45 bcd15.65 bc
U + O2312 ab2126 b4438 b80.51 ab55.25 b135.76 ab9.27.60 bc16.79 ab
U + OPLUS2386 a2086 b4471 b85.18 a53.29 b138.47 ab97.01 cd16.00 bc
LSD284.7351.63277.7911.6113.391.181.712.027
SEM114.8161.6152.93.584.685.40.4350.690.818
p value0.042<0.001<0.001<0.0010.007<0.00010.5324 NS0.0220.079
Note: means with the same letter (s) within a column are not significantly different; LSD—least significant difference, SEM—standard error of means, NS—not significant; Cnil U—control nil urine, CnilU + PrGb—control nil urine+ ProGibb®, U + PrGb—urine + ProGibb®, U0—urine only, U + O—urine + ORUN®, U + OPLUS—urine + ORUN® PLUS; date of first harvest is 15 October 2015 (36 days after application of treatment—DAT), date of second harvest is 19 November 2015 (71 DAT).
Disclaimer/Publisher’s Note: The statements, opinions and data contained in all publications are solely those of the individual author(s) and contributor(s) and not of MDPI and/or the editor(s). MDPI and/or the editor(s) disclaim responsibility for any injury to people or property resulting from any ideas, methods, instructions or products referred to in the content.

