Article

A Review and Analysis of Rangeland and Wildland Soil Health

by
Stephen E. Williams
Department of Ecosystem Science & Management, College of Agriculture, Life Sciences & Natural Resources, University of Wyoming, Laramie, WY 82071, USA
Sustainability 2024, 16(7), 2867; https://doi.org/10.3390/su16072867
Submission received: 5 February 2024 / Revised: 10 March 2024 / Accepted: 18 March 2024 / Published: 29 March 2024
(This article belongs to the Section Sustainability, Biodiversity and Conservation)

Abstract

:
Soil health is focused on intensively managed (IM) soils (often farmed soils), by-passing extensively managed (EM) soils (range lands, deserts, shrub lands, tundra). High economic value products are generated by IM systems. Many EM lands are of cultural, recreational, scenic, or scientific value. However, and despite the fact that they provide forage for domestic and wild animals, they are not always of high economic value. IM and EM soils are evaluated on the same health scales. The contention herein is all soils formed under soil state conditions under the absence of human interventions are inherently healthy. But a given soil has dynamic properties that determine its management as IM or EM. An EM sagebrush steppe soil may be deemed unhealthy as a result of low organic matter and short growing season. An IM grassland steppe soil is healthy as a result of high organic matter and a long growing season. The sagebrush soil, however, provides habitat for culturally important sage grouse. The grassland soil may provide, when plowed, habitat for economically important soybeans. Soil taxonomies can be used to establish inherent health of undisturbed soils. Determining a soil’s dynamic nature is a different construct. Here, four different sets of EM soils were evaluated to showcase their diversity, evaluate levels of health and display their often-unconventional dynamic characteristics. An argument is made that a soil’s health, an inherent condition, is not the same as its dynamic condition (potential to produce goods and services). Soil health changes are usually slowly driven by soil state factors but can be dramatically changed by humans. Otherwise, soil health can be viewed as a near constant ecosystem attribute. The dynamic nature of soils change according to needs placed by humans. EM soils may be healthy but lack attention since their dynamic nature is not traditional and often of low economic value. Evaluation of soil health and dynamic value on EM lands is often exacerbated by information absence. Strategies to circumvent this include sampling design, reference sites and standardized ways of EM soil health determination. A case is made that baselines of soil health can be taken from soil surveys, taxonomic names, and soil data from map units, where such information exists. Certified supplementary information is ambiguously available, but may be crucial. Outdoor living laboratories that feature inherent soil health and dynamic soil alternatives may help circumvent information voids.

1. Introduction

Rangelands and Wildlands, (extensively managed lands) include range lands, deserts, shrub lands and tundra. These lands are not plowed or treated with agricultural chemicals (except infrequently if at all). They are managed with a minimum input of energy and resources and described as extensively managed (EM) lands (contrast: intensively managed (IM) lands).
Products from rangeland and wildlands include more than meat, hides, wood, and water [1]. These lands make up important recreational zones, and many are at headwaters, and maintaining underlying soils is key to providing habitat for aquatic organisms, and water for downstream users. Crucial too are supporting services (nutrient cycling and soil formation), regulating services (e.g., flood and disease control, climate stabilization [2]) and some hard to identify and quantify features such as spiritual and cultural values [3].
Land management varies from minimal on extensively managed wild lands to maximal on those intensively managed. In management, if ecosystem specific levels of energy and labor are exceeded, the products may not compensate economically for inputs (e.g., Nitrogen fertilization of arid lands seldom produces enough product to compensate for the fertilizer cost [4]).
Lands may be managed extensively too as a result of regulation. In the U. S. there are zones maintained officially as wilderness [5].
Many lands are managed intensively to maximize production from inputs of energy and labor including plowing, removal of unwanted plants, fertilization, pesticide use and planting selectively bred plants having disease resistance, rapid growth, and tolerance to unfavorable soils [6].
Between these two extremes are lands managed at varying energy and labor inputs. Failure to recognize lands suited to extensive management (EM) but where intensive management (IM) methods (e.g., plowing) were applied, has resulted in degradation of many lands west of the 100th meridian in North America [7] and similar lands world-wide [8].
Where abiotic factors dominate an environment and management is to minimize input of energy and labor, these are defined here as extensively managed (EM) lands. Those dominated by biological factors such that management is to maximize input of energy and labor, are intensively managed (IM) lands.
One action, when performed, signifies that efforts have moved from extensive to intensive: plowing. Using plowing as the demarcation between EM and IM lands is, admittedly, simplistic. Fertilization, irrigation, one-time deep plowing, pesticide use etc., when implemented could mark the boundary.
North American lands at the time of European settlement were mostly wild lands. Many are now stocked with domestic grazing animals but many support wildlife populations. Most of the tall grass prairies, were converted to farmed lands that are plowed and fertilized regularly (managed intensively). Such conversions have also occurred at large scales elsewhere [9].
Extensively managed (EM) soils have an array of chemical, physical and biological properties attenuated by geological substrates [10,11,12]. This is true also of intensively managed (IM) soils, although often these have a more robust biological component that transforms features of geological substrates. Soils across the full spectrum of IM to EM lands function within their environment achieving a steady state (Steady state: where inputs to the soil roughly equals outputs. Steady state may balance in some soils annually but others over decades or longer).
Terminology developed to describe the general condition of any soil as well as its capacity to function is still a point of discussion. The terms health and quality have both been commonly applied to soils. The NRCS [13], and Bünemann et al. [14] consider the words equivalent. However, there is disagreement. Pankhurst et al., (1997, cited in Bünemann et al. [14]) argue “soil quality focuses more on the soil’s capacity to meet defined human needs……soil health focuses more on the soil’s continued capacity to sustain plant growth and maintain its functions.” Others [15] say soil quality is linked more to soil’s intrinsic capacity to contribute to ecosystem services. Bünemann et al. [14] states this “emphasis on inherent, more static soil properties was closely connected to Soil Taxonomy [16]”. Pellant et al. [17,18] as a step towards interpreting indicators of rangeland health, used soil surveys as a baseline for further evaluation.
Friedel’s [19] introduction of state and transition theory resulted in revisions of how the above ground component of range are viewed and analyzed. Her work suggested that succession in a plant community is not constrained to one pathway, but rather that there are several pathways that may lead to different communities having various levels of stability. It formed the basis for several reports that addressed rangeland health [20] and a basis for “Interpreting Indicators of Rangeland Health [17,18]”. There has not been an equivalent effort to examine state and transition models in below ground ecosystems.
A definition of soil health for rangeland and wildland (EM) soils can be drawn from discussion of rangeland health initiated with NRC’s Rangeland Health [20]. Pellant et al. [17,18], summarized various definitions: soil health is “the degree to which the integrity of the soil, vegetation, water and air, as well as ecological processes of the rangeland ecosystem are balanced and sustained”. Integrity is “maintenance of the functional attributes characteristic of a locale, including normal variability”. Health of EM soils suggested and used here is the degree to which the soil is in a stable state, is marked by expected biota and has functional attributes characteristic of an undisturbed locale, including normal variability. “Undisturbed locale” implicates comparison to a standard: a standard soil at optimum stability, with vegetation having no disturbance by humans as well as inputs undisturbed by humans. In the USA, NRCS [13] considers this standard to be characterized by a locale equivalent to one prior to European immigration and settlement.
Information, both qualitative and quantitative, imbedded in specific Soil Taxonomy names and descriptions, can be used to define at a general level the expected health of soils. The same factors that define an ecosystem are those that define a soil and its taxonomy [21]. Use of Soil Taxonomy also satisfies several of Doran and Parkin’s [22] principles for soil health determination: “Indicators should……be components of existing soil data bases”. Further, given that soil taxonomy is based on the Soil State Equation (an ecosystem description formula) it “correlates well with ecosystem processes”.
Comprehensively addressing soil health is mandated through United Nations Sustainable Development Goals (SDGs). These encompass ecosystem services and soil functions [23]). Attaining the SDGs points to multi-use of land and restoration of degraded land. Inherently healthy soils of dynamic quality are a basic condition for the successful implementation of the SDGs [24]. SDGs apply to all lands: hyper arid to hyper humid, and to all parts of the terrestrial environment. Bonfante et al. [25] address this further in defining soil health and quality with world-wide rather than regional application. Soil health (inherently) is a composite of “relatively stable soil properties as expressed in soil types that reflect the long-term effect of the soil forming factors… This can be in the USA the soil series as defined in USDA Soil Taxonomy, Soil Survey Staff, 2014” [26].
A focus on soil health is how soil science can embrace an ecosystem approach and convey the message of soils’ critical importance to the public [27]. Viewing soils holistically to include soil geography, geomorphology, and geology, is essential to conveying the roles of soils in aspects of sustainability and survival on planet earth [28]. Kibblewhite et al. [29] emphasizes evaluation of soil functionality requires attention to interactions between biotic and abiotic components. They conclude the need to quantify “flow of energy and carbon between functions is an essential but non-trivial task for the assessment and management of soil health”.

Objectives

  • Analysis of soil health and quality indicators and supporting data: Examples.
  • Basic soil health and quality indicators for EM soils: healthy, at risk and unhealthy.
  • Areas needing further investigation.
  • Examination of the dynamic capacity of the four sets of soil examples in the context of inherent health.

2. Methods

Soil health indicators for EM lands were taken from published source and screened using Doran and Parkin [22] principles below. These were used to evaluate soil health of four dissimilar sets of soils.
There is no single measure that will determine soil health. Multiple measures are recommended [22]. Of published measures (physical, chemical, and biological), most address IM soils and not EM soils.
Compared to IM soils, EM soils are generally heathy since they have not been plowed [4,10,30,31,32]. Doran [33] stated the health of “The quality of many soils in the Americas and elsewhere has declined significantly since grasslands and forests were converted to arable agriculture and cultivation was initiated. In particular, mechanical cultivation and the continuous production of row crops has resulted in physical soil loss and displacement through erosion, large decreases in soil organic matter content …”
IM soil plant cover is often row crops, which are normally harvested annually and soils plowed annually. Rangelands and related unplowed lands (EM) retain their health in part since the protective plant cover is maintained [34]. Severely overgrazed lands, especially if root systems have been impacted, are subject to wind and water erosion that compromise rangeland and wildland health.
Some authors focus on plant health but suggest indicators that pertain to soil functionality, be it inherent or dynamic, as well. Of lists published (see Table 1 in [35]; and [18]), more than half of the indicators pertain to soil and site stability but mostly to surface features observable in the field. An early objective of the soil health movement was that health features should be easily observed in the field. Doran and Parkin [22] indicated practitioners, extension workers, soil conservationists, scientists, and policy makers, should be able to use the set of basic soil health indicators across a diversity of ecological, sociological, and economic situations. Indicators should: (1) Correlate well with ecosystem processes. (2) Integrate soil physical, chemical and biological properties and processes and serve as basic inputs needed for estimation of soil properties or functions which are more difficult to measure directly. (3) be relatively easy to use under field conditions and be assessable by both specialists and producers. (4) Be sensitive to variations in management and climate……(especially) long-term changes……but not so sensitive as to be influenced by short-term weather patterns. (5) Be components of existing soil databases where possible.
In compiling soil health/quality indicators for rangeland and wildlands (Table 1), these guidelines were considered. The problem in meeting these was some are mutually exclusive: that is, how to keep the process of determining soil health relatively easy while meeting needs like correlation with ecosystem processes and integration of soil chemical, physical and biological information?
Data from four sets of soils were derived either from previous published works or from unpublished data produced by the author. Soil Taxonomy [16,26] established the general chemical, physical and biological characteristics of each soil. These defined general parameters of soil health (inherent). The health of these sites can be classed healthy (undegraded), unhealthy (degraded) or at risk when compared to ecological sites having “vegetation and surface soil properties of reference conditions that represent either (1) pre-European vegetation and historical range of variation (in the United States) or (2) proper functioning condition or having potential natural vegetation [43]”. Outside of the USA, especially where EM lands have been managed by humans since antiquity, “proper functioning condition or potential natural vegetation” will need to be established.
The first data set was drawn from the soil survey of Sherman County, Texas [44]; Figure 1. Focus was made on the Sherm Series since in some locales it is managed intensively for crop agriculture, and in others managed extensively for grazing of domestic animals. Here it represents the nexus between EM (rangeland) soils and IM (farmed) soils. A detailed data set is also available in Unger and Pringle [45].
The second data set was drawn mostly from work on arid rangelands reported by Fisser and Trueblood [46]. The work is from range exclosures in the Salt Well Planning Unit of SW Wyoming. The data from one Pedon came from Cochise Co., Arizona (Pedon 58, [41]). These soils show the diversity of soils that often occur in arid range environments where soil forming factors vary and frequently so over short distances (Figure 2).
The third data set is from work carried out by the author in the Gobi Desert of Mongolia: a hyper-arid environment. Although descriptions and maps of Mongolian soils have been published [55], soils data is general and taxonomy used is the older Russian system and not the current system [56]. Putative names were determined using Soil Taxonomy [16,26].
The fourth data set represents characterization of cold soils: mostly those with permafrost. Descriptions presented here were condensed from Bockheim [57], The Soils of Antarctica.
During the examination of the four soil sets, information deficiencies were noted. Most of these rangeland and wildland soils could be considered of a distinct (inherent) health but a different but of distinct dynamic characteristics.

3. Results

3.1. Analysis of Soil Health Indicators and Supporting Data: Examples

A compilation shows heath indicators (Table 1) for rangeland and wildland (EM) soils. Not all indicators apply equally or at all to every soil examined. Parent material and climate are often accurate for a region.

3.1.1. Soils of the Central Great Plains: Grassland Soils

Grassland soils in the Great Plains are largely Mollisols with more Aridisol associations in the west and some Entisols and Inceptisols throughout. These soils are intensively managed in general, but particularly in the more arid western reaches extensively managed. The Sherm Series is of these dual management philosophies. Unger and Pringle in 1986 reported in the panhandle areas of Texas and Oklahoma were 516,200 ha of the Sherm, 10% managed as rangeland. The Sherm is a member of the Torrertic Paleustolls (In the NRCS Soil Survey of Sherman County [44], the Sherm series was placed in the Aridic Paleustolls subgroup. Unger and Pringle [45] placed it in the Torrertic Paleustolls. Such discrepancies do not compromise utility of soil surveys and Soil Taxonomy in evaluating soil health, but underscore the evolutionary nature of soil taxonomy and the need to use best available information) ([41] page 308; and Figure 1).
To quantitatively evaluate soil health, it is an advantage to know how any given soil health parameter varies. If a soil has a mean soil organic matter (SOM) of 1.75% (in the A horizon), and this level defines that soil as a healthy soil, then what change in SOM would result in posting that soil as at risk or even unhealthy?
From a sampling of five Torrertic Paleustolls (Sherm Series, Table 2) it is known that to 16.8 cm these soils have an average SOM of 1.75% that vary from 1.45 to 1.94% with standard deviation of ±0.14%. If SOM is determined to be 1.75% in a parcel classified as above, then as long as this evaluation remains between 1.61 and 1.89% (the average ± the standard deviation), there should is no change in soil health. If SOM drops below 1.61% there may be cause for establishing this as a soil at risk. If the SOM drops below 1.47% (two standard deviations from the mean) then this may constitute evidence to post this soil as unhealthy. At 1.33% (three standard deviations from the mean), this soil would be clearly unhealthy with regard to SOM. It could also be a signal that the dynamic nature of this soil is diminished.
Care needs to be exercised in making this kind of health or quality determination. If an examination of a Sherm series soil has an SOM of 1.45% (similar to the site 1 soil in Table 2), observing it drop a little below 1.45% is likely not cause for changing its evaluation if other characteristics suggest otherwise.
Soil health determinations should be based on multiple characteristics [20,22,33,34,35]. Flis et al. [58] maintains that health determinations are not determined by “a single set of properties but rather……taken at consistent field and weather conditions each time, ……the same laboratory used over time, and progress tracked over time”.
The pHs of the example soils vary from 6.8 to 7.9 in the A horizon increasing with depth. If pHs exceed 8.4, this is evidence that the soil has sodium as a dominant component of the bases [9]. This does not mean the health or dynamic characteristics are compromised, especially if this pH has been established as the ambient pH. However, if pH has rapidly (over the course of a few years) risen from 7.5 to 8.5, this is cause for concern and likely cause to evaluate other soil parameters.
Other ecosystem factors also imping on ecosystem health. The presence of an argillic horizon [21], depth to calcic or petrocalcic horizons [38], climatic parameters as the basis for forage production [59], are related to soil health. Soil characteristics that modify or show change inputs [60] include EC, pH, CO3−2 and clay content. Topography can be subtle to dramatic. Slopes in this example (Table 2) only vary a little, but a northern aspect will be a little cooler and moist [61]. The grasses listed for the Sherm soil are largely perennial, but mostly decompose annually creating high SOM [62]. Depth and amount of organic matter are key health characteristics of this Paleustoll and Mollisols in general. Many soils have not enough organic matter, depth, or base saturation to meet the definition of Mollisols but have mollic materials constituting key soil health or dynamic measures [20,38,63]. In Bünemann et al. [14] of 65 soil quality published assessments, 90% used total SOM or TOC as an indicator.
Evaluation of the health of EM lands is key to understanding not only grazing potential but also potential for other uses. As a consequence, the suggested list of possible indicators for EM lands is not short (52 items in Table 1). However, only eight should be examined in most soils. There is no general principle or formula for which of the others should be evaluated. The experience, mental processing and gut rumination of the examiner(s) should be the guides.
Soil sampling of EM lands may be more labor demanding than IM soils. IM environments are often where fields are level, crops monoculture and soils of consistent character. Evaluation of just a few samples may suffice for health determination. On many EM sites heterogeneity is so high that evaluation of a few samples does not capture variability of the health. Paleustolls (Table 2) are fairly homogeneous in many settings. The health of any given 100 hectares of Paleustolls can likely be carried out with relatively few samples. However, many rangelands are highly heterogeneous even when modestly sized (Figure 2). This may require many multiples of soil samples to determine an average, and variability for soil health of a given parcel.
A minimum set of soil parameters for EM lands is: A horizon depth (and depth of the mollic (Mollic material would be the material that meets the color criteria of a mollic epipedon, but not necessarily the depth or base saturation criteria) material), total organic carbon (or Soil Organic Matter), plant species list, cover by plant species, bare soil, recent disturbance (fire, erosion over grazing etc.), electrical conductivity and pH of surface and subsurface soils. Results of these analyses may determine other parameters needed.
For the Sherm Soil, detailed information is available [45]. Some information was derived from soils once managed intensively now reverted to rangeland. Given that each of the soil profiles (Table 2) has an Ap horizon suggests SOM of the Ap is less than in the unplowed, native equivalent and the depth of Mollic epipedon is less. A bench mark (a standard undisturbed by humans) for the Sherm soil would be a parcel that has never been plowed but always extensively managed via modest grazing by domestic livestock in recent times and wildlife prior. As such, there is no known standard. A best standard can be conjectured from Table 2 data as summarized. If the summary is accepted as the health standard, then the Sherm Soils are healthy. The uses of the Sherm (dynamic properties) are conventional agriculture and on the EM Sherm Soils this would be grazing by livestock.

3.1.2. Soils of the Basin and Foothill Region: Arid Range Soils

Arid EM lands are often steppe-like, many in mountainous or rough terrain or in deep basins. Soil diversity is high: hot to cold deserts, tall grass but mostly short grass prairie, shrub steppe to saltbush scablands, short stature (e.g., pinyon-juniper in the USA) woodlands to chaparral and chaparral-like shrub lands.
The health determination of these soils is constrained since statistics (e.g., averages and standard deviations) of parameters e.g., organic matter, pH, phosphorus, etc. are seldom known. The four arid range soils (Table 3), were selected since they had quantitative data although for only one Pedon per soil. USA Soil Surveys do have some quantitative information often given as an interval of physical and chemical attributes and not as averages with variability. Biological information includes percent organic matter and vascular plants. Plants and sometimes production on native sites are usually named by mapping unit and soil name. For lands suitable for grazing, total annual production is usually given for favorable, average, and unfavorable weather years.
Comprehensive evaluation of soil health of many arid range soils (e.g., Table 3) is often impractical due to time and fiscal constraints. Derner et al. [36] suggest establishing cross-regional, living laboratory networks where producers, interested publics and scientists would interact to not so much improve soil health but rather to maintain current soil health and protect soil ecosystems from poor management practices. The suggestions by Derner et al. [36] look to maintain and improve resilience of range soils to threats imposed by catastrophic disturbance (anthropomorphic or otherwise) or those more subtle (e.g., climate change). A participatory structure between producers, state agriculture experiment stations and the USDA-ARS, is logical. Other agencies as well as representatives from users (extractive industry, grower, and recreation) also should also partner in such efforts [14].
The first three soil and vegetation descriptions (Table 3) were carried out cooperatively with the BLM and are from exclosures established throughout the State of Wyoming by Professor H. Fisser and his students largely in the 1970s and 1980s. These exclosures could provide a component of the living laboratory network proposed by Derner et al. [36]
It is not known if these sites (Table 3) meet the NRCS requirement for being undisturbed since before the time of European settlement of North America. There is no indication that these soils have ever been plowed (no Ap). Of the Fisser exclosures (the first three profiles, Table 3), all had been protected from domestic animal grazing and large wildlife grazers for 16 to 17 years before soils were described. Vegetation cover and production were determined during these years as well [46]. This constitutes the best available information for these three sites and probably approaches closely the NRCS guideline.
For the three Wyoming soils (Table 3), a minimum set of characteristics for evaluation of soil health would be A horizon depth, pH, EC, SOM (or OC), depth of the Mollic material, plant species list, and indication of recent disturbance. The covariance (CV) of annual production across these sites was high. At Cumberland Exclosure #3 (Table 3) annual productivity across eight years (1971–1978) was 811 Kg/Ha with CV of 39%. The average annual precipitation during this period at the site was 274 mm. The variation in precipitation is not given, but at nearby Kemmerer the annual average precipitation was 239 mm with a CV of 24% (from 1963 through 1978). The presence of various categories of plants (e.g., legumes [39]) and some non-legumes, e.g., genera Ceanothus, Cercocarpus, Purshia and Cowania [4] implies potential active biological nitrogen fixation. Presence of these plants and others in the Poaceae, Rosaceae, Asteraceae, Scrophulariaceae, Ericaceae, Primulaceae as well as most Bryophytes, Pteridophytes, Gymnosperms and Angiosperms are hosts to mycorrhizal fungi [39]; reviewed by Bellgard and Williams [64]. Presence of these plants in a healthy state implies a healthy mycorrhizal community below ground. Conversely presence of members of the Brassicaceae and Chenopodiaceae, even though healthy, do not normally interact with mycorrhizal fungi [65]. Presence of certain plants, e.g., Bromus tectorum, suggests a degraded mycorrhizal community as well as depressed bacterial and overall fungal levels [66].
For the fourth soil described (Table 3), the Natrargid, there is an argument the same basic criteria should be used to establish a baseline soil health: A horizon depth, pH, EC, SOM (or OC), depth of the Mollic material, plant species list, and indication of recent disturbance. The main characteristic determining the taxonomy and health of this soil, however, is the soluble sodium content. Shown (Table 3) are the soluble cations Ca, Mg, Na and K. The sodium adsorption ratio (SAR) shows that sodium dominates the chemistry of this site.
This soil may have had high sodium since before the settlement of North America by Europeans [42], but it is also possible that mismanagement even in antiquity has resulted in elevated sodium in this soil. Although the grazing potential of this soil by domestic animals is likely low, there may be native species that survive here. Determining the management history of this soil would establish if this is a healthy soil or has been degraded by human action. The Hohokam culture occupied areas along the Salt River in Arizona from about 450 CE to 1450 CE. High salt marks of their civilization are still present in the soil they farmed [67]. There are numerous other examples of farming by Native Americans before European immigration [68]. However, the Natrargid, probably developed under conditions not influenced by humans and thus would be a healthy soil.
The health of all four of these soils cannot be ascertained in the manner used for the Sherm Soils. There is not enough information to determine variability and thus if any given soil (from Table 3) lies outside this variability. Most likely visual observations of each would now, some 50 or more years removed from publication of the information, provide information about erosion, invasive plants, over grazing, etc. that might qualitatively establish health for these soils. The dynamic potential of these soils would be manifest likely as grazing lands by domestic biota, but also would provide habitat for wildlife.

3.1.3. Soils of the Gobi: Hyper-Arid Desert Soils

The Gobi lies in a hyper-arid zone along the border between the Republic of Mongolia and Chinese Inner Mongolia. It is characterized by a stone surface caused by deflation of fines or in the case of the Cryaquent (Table 4) has a surface where the materials have been removed by wind between resource islands (Figure 3). The area where soils were examined (Table 4) receives an average annual precipitation of between 50 and 100 mm, with the majority coming during warm months and only from 5 to 10 mm during cold months [55]. The variations from year to year of weather parameters are extreme, with CVs being over 100% for many including annual precipitation.
Natural resource management efforts have resulted in much land-use planning in Mongolia [79]. Development by Design philosophy has been central to these efforts. Much of eastern Mongolia is dominated by grassland soils and are characterized as Mollisols [80]. Soils of the Gobi are generally described as “steppe-like desert brown” or steppe-like shallow desert brown”, have a stony surface, a weakly developed A horizon, organic matter content of 0.1 to 0.2% and alkaline soil pHs. Subsurface soil development is slight, with decreased organic matter and pH increases [55]. Much of the Gobi examined was of soils similar to the Inceptisol (Table 4, Figure 4 and Figure 5) minus the coal dust surface. Also, periodic zones of sand were docked around shrubs (Psamments, Table 4, and Figure 3).
The Cryaquent (Table 4) had characteristics of a resource island that has formed around the docking agent, a succulent shrub (Nitraria siberica). The surface soil in the islands was almost half (by volume) organic debris (>2 mm). The soil between the islands was higher clay content, higher pH, no organic matter and void of vegetation.
What would be the soil health standard for these soils (Table 4: Figure 3, Figure 4 and Figure 5)? The last two soils represented (Table 4: Arents) are materials stored for use in revegetation. These soils had no plant cover and low OC, total N and P. Based on these measures alone, these soils would be characterized as unhealthy. Consequently, they provide an extreme standard for unhealthy soils.
Although intensive agriculture has not long been practiced in Mongolia, grazing based was prevalent long before the rise of the Mongolian Empire in the 13th century [81]. Also, there is so little specific information on soils from Mongolia that setting standards for soil health is not possible yet. More realistically is applying that proposed by Derner et al. [36] to Mongolia: that examples of conjectured healthy soils and plant systems be located in the Gobi and used as reference. The dynamic potential of these soils is actualized via grazing. Grazing of domestic animals has long been practiced here. Wild grazers include camels (Camelus bactrianus) and gazelle (Mongolian, Procapra gutturosa).
The data set here (Table 4) as well as the landscape and soil profile figures (Figure 3, Figure 4 and Figure 5) are offered due to scarcity of published data and photographs from the Gobi.

3.1.4. Soils of Extreme Latitude or Altitude: Soils with Permafrost

Cold soils (Gelisols), have permafrost or horizons within 2 m of the surface that are permanently at or below 0 °C [21].
Gelisol diversity is large, the only common diagnostic feature is pervasive coldness (Table 5). The Gelisol suborders may be histic, subject to cryoturbation or inorganic having little cryoturbation. Great groups are variable with taxa being anhydric, aquic, argic, fibric, folic, glacic, haplic, hemic, mollic, psammic, sapric, and umbric [16,21,82]. Of soils and properties shown (Table 5), all are from the southern ice-cap region, are either Gelisols or intergrades to Gelisols, although shown also is a Histosol that is cold (Cryosaprist). Most of the soils (Table 5) have high organic matter: some due to vegetative inputs (mostly lichens) and others from bird feces (ornithogenic soils).
The health of these soils is influenced by warming climate. As temperatures warm, some of the soils shown may revert to a different taxonomy, likely the taxonomy of their intergrade (e.g., the Gelorthent or Cryorthent). The salient point is that soil temperatures of the diagnostic horizon will exceed 0 °C perhaps for increasingly longer periods.
Methane is sequestered in frozen zones of many arctic marine zones, but also in the permafrost of the Arctic circumpolar lands [88] and likely too the Antarctic. Soil climate has been implicated as a major factor impacting the release of methane in the Arctic [89]. Methane release dynamics from cold soils is obscure, but clear is that monitoring the health and thus the temperatures of Gelisols is important. These soils are also important habitat for many birds (notable in the Antarctic, [83] as well as arctic mammals [90]).
Health parameters for Gelisols would center on temperature of the gelic material and organic carbon in especially surface horizons and O horizon atop the soil. Establishing and monitoring reference sites [36] on Gelisols would be a likely strategy given the absence of specific information on these soils. Dynamic features of these soils is that they sequester methane and provide critical wildlife habitat.

3.2. Soil Health and Quality Indicators for EM Soils

Soil Taxonomy can be used as a guide to approximate health characteristics of soils in a given taxon. Supporting information can further define soil health limits. Identification of a soil as healthy, at risk or unhealthy can be estimated if the variability of parameters selected for soil health are known. Data for such analysis is in soil surveys and supporting data for many counties in the United States [91], although at various levels of detail [21]. Some soil surveys on arid rangelands provide a span of values for parameters such as pH and soil organic matter for particular soil taxa. These characteristics can be used if confident of the taxonomic identity of the soil they represent. Map units on most soil surveys from arid rangelands are third through fifth order, and may be dominated by soils of a single taxon, similar soils or of two or more dissimilar taxa [21].
Supporting data e.g., [45] may include profile analysis (chemical, physical and biological) and descriptions. Extrapolation of data from associated IM soils of the same taxonomy can be used but carried out with knowledge that certain actions (e.g., plowing) will predictably change some characteristics (e.g., organic matter).
There is enough information available about the Sherm soil that general health can be determined by examining soil characteristics taken from Soil Taxonomy [16,41,42]. Soil surveys can be used to locate a soil, and further define expected health characteristics. Averages of some Sherm soil parameters and their variability can be derived from Unger and Pringle ([45] in Table 2). Soil having parameters lying outside the variability of the Sherm soils, and/or outside one standard derivation from the mean, are candidates for further consideration and likely “at risk” in terms of health. From the information on the Sherm soil (Table 2), both pH and soil organic matter can be examined in this way. However, soil health should not be based on these alone. Important also are organic carbon (drawn from SOM conversion (In most recent works, OC is reported whereas older published materials usually reports SOM. The accepted conversion is SOM = 1.724 OC. The factor of 1.9 may be more appropriate for surface soils [21]. Key is to use the same method for determining SOM or OC consistently across sites to be compared and across times of comparison. If a reference site is used for comparison, it is imperative the same method used there be used in tested sites)), depth of the mollic materials, plant cover, native biota, EC, erosion estimate, history of soil manipulation, grazing history and recent disturbances. On site observations may result in need to evaluate other indicators (Table 1).
Arid Range soils (like those represented in Table 3) require a different approach to determining soil health. These soils are highly diverse (compared to Table 2) and parameter averages and variability are available from soil surveys and other sources [40]. Information on these and similar soils has not reached a level where averages and variability of health parameters are available. Use of the Derner et al. [36] proposal of setting a series of outdoor demonstrations of one or more typical soils seems a logical approach. Each soil or soil set could be supported with certified Ecological Site Descriptions (see below).
The Hyper-arid soils (Table 4) example represent soils where establishing a baseline for health is not possible using either the method for the Great Plains set (Table 2) or the Arid Range set (Table 3). Indigenous knowledge (gathered by the author, but through an interpreter) was essential for plant identification and grazing and disturbance history. This approach was crucial in describing these systems and likely has utility for many soil health evaluations. Securing such information may require qualitative research methods where oral histories, traditions and cultural landscapes are considered [92].
Cold Soils (Table 5) and their health characteristics are not well studied. Monitoring soil temperature is tantamount to monitoring climate influences. The Antarctic soils have been so little influenced by humans, it is arguable they are in good health. It behooves soil and climate scientists to more completely determine soil properties but also map soils of cold areas.
Among soil health parameters for Gelisols that should be monitored are conditions that maintain cold temperatures; therefore, monitoring cold horizons is the first line of health evaluation. Surface organic matter or the depth of organic matter, an insulating material, is equally important. Plant cover too is important in that it provides an albedo favorable to retaining subsurface cold temperatures. Working out a complete set of soil health parameters is important especially in light of their capacity to retain greenhouse gases, like methane.

3.3. Areas Needing Further Investigation

3.3.1. Ecological Sites (ES)

The concept of Ecological Sites (ES) has grown out of the work by Westoby et al. [93] and Friedel [19]. It was considered initially as a standard to replace rangeland condition. However, now the Ecological Site concept includes site characteristics (physiographic, climate, soils, and water features), plant communities (species, vegetation states and ecological dynamics), site interpretations (management alternatives), and supporting information (relevant literature, information, and data sources). Ecological Site Descriptions (ESDs) have been embraced by the NRCS ([42] see http://www.nrcs.usda.gov/wps/portal/nrcs/detail/soils/survey/geo/?cid=nrcs142p2_053587) for rangelands, and forest lands. Briefly, The ESDs “provide a consistent framework for classifying and describing rangeland and forest land soils and vegetation; thereby delineating land units that share similar capabilities to respond to management activities or disturbance”. The ESD inventory provides a listing by State of all provisional, approved, and correlated ESDs.
The “reference community” forms the basis for the description of any given ES [13]. The supporting narrative for this definition acknowledges that there may be much vegetative variation within any given reference community, but it indirectly acknowledges the connection of the reference community to the underlying soils. Despite this conundrum, ESDs contain considerable soils information. If ESDs describe site characteristics at the time of “European immigration and settlement”, then comparison of sites to the reference community, and by implication the reference soil, could be used as a measure of the soil health as well as evaluation of soil quality.
There is more information that can be added to ESDs and the NRCS [42], continuously adds to information databases and narratives. ESD inventories could be applied internationally especially to EM soils. This would result in adding to the definition of the reference plant community (and by association the reference soil). Pellant et al. [18] has already hinted at a new definition: “In western North America, a 500-year or shorter period immediately preceding European settlement is a reasonable time period for describing the reference state”, and the reference soil. Similar constructs could be generated for EM soils worldwide. Starting points for such could be the soil surveys for various countries. Finding reference soils for regions having experienced human manipulation for thousands of years may not be always possible. An argument is an EM soil, even where humans have hosted grazing animals even prehistorically, is the reference soil!
This work has leaned heavily on the US Soil Taxonomy [16,41]. The international soil community needs to work more seriously at a global taxonomy. The World Reference Base for Soil Resources is an effort at a global unified soil taxonomy [94].

3.3.2. Physical and Chemical Levels of Soils at Risk

A characteristic of many soils is a capacity to buffer chemical and physical changes. Soils of neutral or high pH or of high ion exchange capacity may buffer input that change, e.g., pH or EC. Smith and Doran [95] suggest that pHs between 6.0 and 7.5 and ECs of 0 to 1.5 dS/m are acceptable for general plant growth and microbial activity. However, across the diversity of EM soils there are plant communities well adapted to pHs and ECs outside of these general limits. The Natrargid (Pedon 58 in Table 3) has pHs well above 9.0 and ECs above 4.0 dS/m. Soils in geyser basins in Yellowstone Park, hydrothermal acid sulfate soils--Troporthents, have pHs between 2.1 and 5.3 [96]. Both of these in this treatment would be considered healthy soils (e.g., inherent health). From a production agricultural perspective these would not be considered healthy soils. However, the dynamic aspect of soil is directly related to products, often biological, that are supported by the soil and the value (often monetary) that humans attach to those products. The acid soil of Yellowstone Park may not produce much forage, but it may support biota that have educational, scenic, or medicinal values. The high pH and EC Natrargid may be habitat for plant species important to wildlife even though the grazing potential for domestic animals is low.
The arid range soils (Table 3) have limited potential for large grazing animals including domesticated animals. Forage production of these soils is low compared to areas of higher precipitation like the Sherm soil series (Table 2) where productivity is approximately three to four times that of these arid range soils. Annual production of overstory plus understory vegetation across five of the exclosures studied by Fisser and Trueblood [46] (The five exclosures include the Mollisol (Cumberland #3) in Table 3. The others (not shown in Table 3), Cumberland #1, #2, and #4 were Torriorthents and the Farson Haplargid) averaged 657 kg/ha with lows of 465 and highs of 814 kg/ha. Of this the understory (mostly Pascopyron smithii) averaged 295 kg/ha with 139 and 441 kg/ha being the minimum and maximum. The balance was sagebrush (Artemesia tridentata) at 352, 326 and 373 kg/ha for annual production average, minimum and maximum, respectively. For sagebrush, a woody perennial, above ground productivity does not change much from average to maximum and minimum years. It remains relatively static in terms of annual production and provides little forage for livestock. However it does provides snow catchment [97], habitat for understory plants as well as animals (e.g., pygmy rabbits, Brachylagus idahoensis, Purcell, [98]; and greater sage grouse, Centrocercus urophasianus; Schroeder et al. [99]—habitat that is not provided by the Sherm soils (Table 2). From the perspective of providing habitat for sage grouse, the arid range soils from Wyoming produce a high value dynamic output, whereas the Sherm soils of the Texas Panhandle do not. However, by every measure, these arid range soils are inherently healthy soils. All meet the taxonomic criteria for their taxonomic placement and thus are healthy soils, yet if they are judged by standards of soil health related to economic gain, they are low.
The terms of soil health and soil quality are used differently and defined differently in NRCS publications and by others who have used these terms. Here soil health is inherent health and dynamic health can be recast as soil quality. NRCS, refer to these as inherent quality and dynamic quality (NRCS (https://www.nrcs.usda.gov/sites/default/files/2022-10/indicator_sheet_guide_sheet.pdf) Accessed on 15 January 2024). There is potential for considerable confusion where these terms are used.
Land managers may be mandated by regulations, political pressure or economic need to maintain soils at a particular level of soil health that corresponds to a particular level of soil quality [100]. Managers may find after a sever episode of over-grazing or during reclamation of a site after mining that it is not possible to return the soil to its original level of soil health. Amendments such as water and fertilizer may result in the soil being of higher quality than the original. While such treatments may result in higher soil quality, they may not restore the soil to its original health. When such treatments are removed (e.g., irrigation water), plant and below-ground biota activity may be compromised [101] as the soil returns to a new stable state.
Once a reference community and presumably an equivalent reference soil is established, information from those can be used to determine the health, and with time, the trajectory of soil health for a particular site. A given soil parameter may or may not vary as a function of time. There is a temptation to establish a standard metric of change for any soil parameter used to determine soil health. Perhaps a standard metric would be, if a parameter changes by one half from the healthy ambient to established unhealthy then there is cause for concern and likely cause for action. However, a call to action should be made by agents having certified and/or usually long term experience.

3.3.3. Progressive and Regressive Pedogenesis

As Soil State factors interact, soils can change and may be reflected as a change in taxonomy. Intergrades of great groups suggest how if soils change, they can take on characteristics of other taxa. Progressive pedogenesis is essentially slow change starting with non-soil and becoming a taxonomic unit at steady state [11].
A soil at steady state has passed through stages of development identifiable as different taxa. Maximum expression of A horizon materials takes a decade to thousands of years as the parent material weather from non-soil to Entisol to Inceptisol to Mollisol. Subsurface horizon maximum development takes a few hundred years to tens of thousands, with oxic horizons taking millions. On reaching steady state, several processes (e.g., cryoturbation, increased clay, carbonate accumulation, vegetation disruption and others; [11]) can lead to retrogressive pedogenesis as soils transition to a different steady state (different taxonomy).
Whether progressive or regressive pedogenesis, multifaceted processes are slow (hundreds to millions of years). Human actions (e.g., plowing; topsoil removal, storage and respreading) can suspend either progressive or regressive pedogenesis, or conversely promote either. Soil health will remain constant for long periods if not adversely influenced by humans. Soil health and perhaps soil quality will be depressed under many human induced activities, but both can be revived with treatments (e.g., fertilizer, rest).
A soil of high-quality (dynamic potential) is generally one having high potential for production of biologically related products (e.g., forage for domestic animals). Other observers may view soil quality (dynamic potential) characteristics differently (e.g., habitat for a threatened species, like the western prairie fringed orchid, Platanthera praeclara, [102]). A soil that has retrogressed might provide that habitat whereas one that has progressed does not. Both, however, would likely be healthy soils.
Establishing a definition of rangeland health has been on-going since and before the phrase was emphasized in the NRC report [20]. Pellant et al. [17], brought together various modifications: “The degree to which the integrity of the soil, vegetation, water and air, as well as ecological processes of the rangeland ecosystem are balanced and sustained”. Integrity in their report is “maintenance of the functional attributes characteristic of a locale including normal variability”. This definition of integrity echoes the minimum standard of rangeland management “to prevent human induced loss of rangeland health [20]”.
This (these) definition(s) articulate theory. To functionalize this from the soil side proposed here is if a soil parameter changes from a known healthy level by say one-half towards a known unhealthy level, this may be cause to establish this soil as unhealthy but certainly cause for concern. Admittedly, the “one-half level,” is conjecture. If there is enough information for a particular parameter for a given soil that the variation of that parameter as well as its standard deviation are known, then another manner of assessing health can be used. If the parameter falls outside the standard deviation, then there is reason to establish the soil as at risk. If the parameter is outside the known variation of that parameter, then the soils soil should be established as unhealthy.
An ultimate goal of all endeavors is to predict correctly the future. Herrick et al. [103] show examples where long term studies show that short term monitoring of plant communities incorrectly predicted the failure of treatments that were ultimately successful as well as predicted success of treatments that ultimately failed. Their strong recommendation that such plant community composition monitoring be combined with fundamental ecosystem attributes: Soil and site stability, hydrologic function and biotic integrity.
Planet Earth is rife with over exploitation of intensively and extensively managed lands [8]. There remain marks in the soil of cultures that have treated lands poorly [104,105,106] and others that have treated lands with care and even reverence [68,107]. The author contends that judging EM lands using the same soil health criteria as used for IM lands, provides rational for further exploitation of EM lands. This is so especially when health is considered to be correlated with how much economic return can be derived from a given piece of land. A way to avoid this pit-fall is to separate soil health, an inherent property, from soil quality, a dynamic property.

3.3.4. Environmental Drivers of Soil Health

Natural drivers such as fire and flood can rapidly attenuate soil health. Others may be more subtle: invasion of an aggressive annual grass (e.g., Bromus techtorum) into a largely perennial plant community or long term changed precipitation. Of ultimate concern are human linked drivers. Regular plowing can depress soil organic matter content as well as disrupt below ground connectivity between plants and symbiotic microorganisms [108]. Nitrogen fertilization can change soil pH and promote proliferation of some plants [109,110]. Climate disruption attenuates soil moisture, temperature regimes and acid forming materials [40]. Resulting changes in pH can impact symbiotic microorganisms and their functionality, changes in plants, nutrient uptake by plants and thus nutrients availability to grazers [111,112,113].
The Earth’s human population has increased from two billion at the end of WWII to 8 billion. Food need has resulted in policies to intensively farm some lands not well suited to plow agriculture [32]. Efforts to this end have resulted, for example, in movement of farmers onto grassland steppes to intensively manage soils that previously were managed as grazing lands (Figure 6). Even presumably subtle activities are noted as having impacts. “……Many precious medicinal plants……grow in desert regions;……laxity in law enforcement has led to continued illegal harvesting and consequent erosion and desertification [114]”.

3.4. Examination of Soil Quality in the Context of Soil Health

A case has been made that Soil Taxonomy (and probably other soil taxonomies) can be used to determine if a soil is generally healthy. Argued also is that evaluation of soil characteristics can determine if a soil is at risk or unhealthy.
Although the NRCS [13] uses soil health and soil quality synonymously, asserted here is they should not be synonymous, especially for EM soils. Soil Quality is the capacity of a soil to provide goods and services and can vary depending on human demands. Demands include output of forage for domestic animals, but also habitat for rare and endangered organisms. Under the pressure to produce more food, those that manage IM soils are expected to increase soil quality usually by improving organic matter, available nutrients, soil structure and decreasing erosion. High-quality soil becomes a sought-after standard especially if inputs to a universal soil quality index are associated only with agricultural output [14].
Doran and Zeiss [115] made a distinction between soil quality and soil health. They made clear that “soil quality will generally be associated with a soils’ fitness for a specific use and soil health used in a broader sense to indicate capacity of a soil to function as a vital living system…”
The difference between Soil Health and Soil Quality becomes much more apparent in EM soil scenarios. The uses of these soils are multidimensional and often not tied to maximizing or even optimizing biological output (e.g., forage for livestock). Forage production may be important on lands allotted to grazing, but for many public lands and some private lands, domestic livestock grazing is of no or little importance. Wildlife habitat, watershed protection, maintenance of wilderness characteristics, protection of view-sheds, etc. take precedence. Increasing soil quality to produce more domestic animal grazing is often not desirable or possible. Manipulations may be carried out to increase, for example, shrub density for browsing wildlife or off-road vehicle restrictions to protect a rare plant. Some EM lands are left to regress or progress at rates unfettered by human activities. Most are managed in some manner. Surface mining, development of drilling pads, road building, expansion of towns and cities—all can reduce healthy soil and high-quality soils to unhealthy and low-quality soils. Separation of soil quality and soil health becomes apparent in land management decisions. What is a land manager doing when they decide to rest a piece of land from grazing, decide to fertilize a native grassland or reclaim abandoned mine tailings? The first is an effort to sustain or regain soil health, the second to improved soil quality, the third to restore soil health and perhaps quality.

4. Discussion

The question of if our soils are healthy and/or high-quality or otherwise is a construct that has at its roots soil conservation and the use of soils by humanity for a variety of functions, but particularly for agricultural pursuits. Most of the work on soil health has been carried out on IM lands. These are environments where there is a high level of capital put into soil management that is manifest as energy input including agrichemical usage and tillage. EM lands are those where conversely there is usually minimal capital investment, labor input, chemical usage, and no tillage. There has been some effort, but much less than on IM lands, to set health and quality indicators for EM lands [18].
EM soils are soils that are not plowed (or plowed in antiquity or only very occasionally) and are generally called rangelands but include alpine and tundra soils, desert soils and some grassland soils. They encompass wildlands too.
Indicators for evaluating health of rangelands have value for overall health of EM soils. These (Table 1) are drawn from various works that address soil health (an inherent condition) and quality (dynamic potential). Though not complete, it provides a tabulation of indicators that users can draw from to construct soil health and quality patterns. There are no absolute rules that dictate which indicators to use for any given soil, only guidelines in part provided through Soil Taxonomy but also conceived by experienced agents, often in the field.
There have been attempts, especially for IM soils to develop one or two methods that determine the soil health. The Soil Health Nutrient Tool (Haney test) and Solvita CO2 test [116] focus both on soil biota activity in the top 15 cm (from a composite of 12 to 15 cores). Soil taken from adjacent fence row(s) is used as a reference. These tests highlight issues related to determination of soil health applicable to all soils, EM or IM: sampling design (here 12 to 15 samples from throughout the field), reference site (here the fence row) and what constitutes a healthy soil, one at risk and one unhealthy.
Evaluation of soil health of the four examples (Great Plains, arid range, hyper-arid and cold, Table 2, Table 3, Table 4 and Table 5, respectively) shows how each is different according to sampling design, reference site and health or quality categories.
For the Great Plains (Sherm series) soils, the number of samples taken to provide high confidence (0.95) and low error (0.10) can be determined in statistically sound ways. The number varies according to the coefficient of variation (CV) of a given parameter. Parameters of color, pH, A-Horizon depth, silt content, and bulk density have low CVs (<15%) and thus a low number of needed samples (less than10 over the sampled area). Sand content, clay content, CEC, soil organic C have moderate CVs (15 to 35%) and require between 10 and 45 samples. Solum thickness, exchangeable Ca, Mg, and K, nitrate, P and K have high CVs (35 to 75%) and thus require a high number of samples (45 to 200). Others (e.g., nitrous oxide flux and EC) have very high CVs (between 75 and 100%) and require over 200 to nearly 1000 samples [117,118]. Although statistically defensible, some of these sample numbers are not fiscally defensible.
For determining reference sites for the Sherm soils, there are soil surveys available through NRCS, and complimented by other, certified, information [45]. A reference site could be located that approximates the average Sherm soil, but equally useful might be a virtual site (A disadvantage of the Sherm soils information is that although some are used as rangelands, the pedons described by Unger and Pringel [45] all have Ap horizons. Thus, analysis of the Sherm series (Table 2) probably under-estimates SOM and Mollic epipedon thickness for rangelands. If unplowed reference sites could be found, this would make possible an evaluation (using at least soil organic matter) of the health of the soils shown in Table 2). (e.g., an expanded Table 2 with a virtual reference site based on the summary).
Defining health, at risk and unhealthy soils for Sherm soils is possible. Since the variation of some parameters are known as well as measures of variation (SD, Table 2), health can be derived for any given Sherm soil. If say either pH or SOM fall outside either the variation or one standard deviation of the mean there is reason to establish the given soil as at risk. Field inspection and determination of other characteristics of the soil and environment should provide the observer with enough information to make quantitative and qualitative statements about the health of the soil. This analysis can be used also to ascertain soil quality (the dynamic possibilities).
The Arid range soils from Western Wyoming (Table 3), do not lend themselves well to soil health evaluation the way the Sherm soils do. The soil information in this area [46] does provide good, certified information, but not enough to determine averages or variability of parameters (It may be challenging to find similar “best-available-information” for soil health assessment that will stand the test of time. However, the fact that information is available does not always mean it is reliable. Information must have a level of certification consistent with that required by professional societies charged with maintaining discipline integrity [92]).
In most situations it seems impractical to assess health of rangelands, like the arid range example here (Table 3) in the manners used for the Sherm soils (Table 2). Even using a modest subset of range health indicators (derived from Table 1) is compromised by not knowing the number of samples needed to achieve high confidence with low error for any needed parameter. The exclosure idea (outdoor living laboratories) promulgated by Derner et al. [36] would establish exclosures having a diversity of range soils across regions where research and monitoring would provide information for health evaluation of similar test soils.
The hyper-arid Gobi soil examples (Table 4) emphasize health and quality of remotely located soils. These soils support a grazing system used for many hundreds if not more than a thousand years. Determining number of samples to take, parameters to evaluate, comparison to reference sites as well as demarcation of levels of soil health will be possible when more soils research and monitoring is carried out. However, a negative baseline is possible. The soils description (Table 4) shows properties of several undisturbed soils plus two severely disturbed and stockpiled for use later. These disturbed soils have no plant cover and little organic carbon. Based on these parameters alone, these soils are unhealthy. None-the-less there are other parameters that logically should be evaluated for soil health (e.g., salts (EC and SAR), total N, P, etc.). Here again, the outdoor living laboratories concept [36] could be implemented in some form.
The cold soils (Table 5) are examples where soil health should be monitored especially for ecosystem services provided. Cold soils (Gelisols or intergrades) are key indicators of climate change and ecosystem perturbation. As permafrost fades, this signals conditions sequestering methane in these soils are at risk [89].
Although these are Antarctic region examples, many soils of global concern are Artic circumpolar in North America, Asia and Europe. High elevations lands throughout the world are also potentially at risk. Health and quality of these soils also impacts important wildlife habitat.
More precisely defining EM soil parameters rendering them healthy, at risk or unhealthy, needs attention as well as quality alternatives. For soils where the variability of any given soil parameter is known, it is reasonable to recognize measurements falling outside the known variability of that parameter. Such should be a warning of reduced health. Alternatively, if a parameter falls outside one standard deviation, this too should be taken as a warning sign. These considerations should not by any means be promulgated as absolute rules, but more as guidelines.
If (from Table 1) plant species composition is changed, percent cover of any group of plants is changed (e.g., loss of leguminous forbs and/or biological crusts) this may not be a change in soil health and likely a change in quality (dynamic potential): there may be other factors. Drought conditions could explain the loss of biological characteristics. Alternatively, invasion by other biota (e.g., downy brome, Bromus techtorum) could signal a marked change.
Other soil characteristics are more resistant to change, and their degradation would be taken as a serious warning of impending health and quality change. Soil organic matter is the one characteristic across all soils that if diminished would be a serious warning. The change would need to be obviously outside the normal variability of organic matter in such soils (e.g., the Sherm Series, Table 2) and/or outside the standard deviation of soil organic matter. Change in depth of the Mollic material would be another sign that soil health and quality are attenuating.
However, for most EM soils there is not enough information to know the variability of soil characteristics (e.g., arid range soils, Table 3). Soil Surveys usually do provide an estimate of some soil chemical and physical soil parameters for taxonomic entities. These can be used to establish approximate baselines of soil health and soil quality alternatives for arid range Soils. Such approximations would employ “judgement sampling” to be carried out by highly experienced professionals judiciously selecting sampling points (free survey approach [117].
Derner et al. [36], asserts that many range environments have innately healthy soils. This is arguable and some have made arguments to the contrary. Donahue [119] addresses deteriorating rangelands largely in Western North America, making the point that livestock numbers should be reduced to conserve native biodiversity. NRC [20] however makes the case that if soil stability and watershed function, integrity of nutrient cycles and energy flow, and presence of recovery mechanisms are all preserved, then the soil is healthy or has the capacity to be so. The point is that as long as perturbations such as grazing are within limits, soil health will be preserved, and soil quality may rebound. There is, however, excessive perturbation of many EM lands (73% of the rangelands in arid areas, reviewed by Kwon et al. [120]).
Use of soil quality as a synonym for soil health is common. Proposed here is that Soil quality and soil health should have separate definitions. Soil health is the natural condition of the soil that usually changes very slowly under non-anthropomorphic factors. Soil quality is the use to which humans put the soil. That use can change depending on management objectives, mandated regulations or societal changes.
Doran and Parkin [22,121] define soil quality as “the capacity of a soil to function, within ecosystem and land-use boundaries, to sustain biological productivity, maintain environmental quality and promote plant and animal health”. If soil quality is synonymous with soil health, then many of the rangelands and related USA lands (EM lands) will be classified as unhealthy since they are of poor quality as measured by low organic matter, high salts, are droughty and other factors that would be deemed as detrimental to maintaining plant and animal production, environmental quality and biological production. Many EM soils with these characteristics have other equally important functions such as critical wildlife habitat, watershed protection and some hard to define but still having importance connected to some cultures and practices. They retain these properties since they are healthy despite being of low economic quality.

5. Conclusions

Extensively managed (EM) ecosystems cover the majority of the terrestrial surface of Earth. Evaluation of the health of these and thus the health of the underlying soils does not always lend itself well to those principles used to evaluate intensively managed (IM) soils.
The evaluation of health and quality indicators (Table 1) across four sets of extensively managed soils (Table 2, Table 3, Table 4 and Table 5) implies use of different principles for each set. Evaluation methods are functions of the information available for a given set of soils. Here an argument is presented that basic health of a soil can be determined using the taxonomic placement of that soil. Health can be established (to healthy, at risk and unhealthy) if there is sufficient information available such that for soil characteristics, means and indications of variability can be determined. There are soils where so little information (e.g., those represented by Table 3, Table 4 and Table 5) that health as well as quality indicators are not well established, and variability is postulated in some but unknown in others. Where information is available (e.g., Sherm Soil, Table 2), soil health and quality criteria may be apparent, and how they vary (Figure 1) from healthy to unhealthy levels may be established. Otherwise, other principles need to be used to authenticate soil health.
Despite the absence of health information on EM soils, it is critical that health and quality be addressed. Several principles have emerged from this work.
  • There is no substitute for using best available, certified information to make soil health and quality determinations. Such information is available but at different levels of intensity and detail from various sources. Certification often comes from reviewed and published materials but can come from longevity of observation.
  • Often it will be uneconomical to evaluate soil health on EM lands in the same way it is carried out on IM lands. Derner et al. [36] argues that living laboratories should be established on EM lands. These should be of dimensions to encompass local variation in soil properties. A system of such laboratories, highly secured exclosures across especially arid EM lands, could be established. Fully correlated Ecological Site Descriptions should be developed for these outdoor laboratories (These “exclosures” would not necessarily be fenced including those located on public lands already closed to domestic animal grazing. Others could be located on public lands routinely grazed by livestock under permit (e.g., BLM and USDA FS lands) and maybe fenced or not. Exclosures would not be restricted to public lands. They could and should be established on private lands too. In regions where public land is largely absent (e.g., the example of the Sherm Series in the Texas Panhandle, Table 2) it might not be possible to locate exclosures on public lands. Location of such exclosures on land controlled by land trusts (e.g., The Nature Conservancy Lands) would make sense).
  • Evaluation and monitoring of EM soil health and quality has international dimensions. Monitoring hyper-arid soils and soils with permafrost, have global implications especially concerning climate disruption.
  • Establishing reference sites for soil health and quality poses problems not always adequately addressed by using a fence row comparison site or speculating what the vegetation and soils were on a potential reference site prior to European occupation [13]. Where much information is available (e.g., the Sherm Soil, Table 2), an ideal reference may be found that shows average parameters. However, the ideal site with data may exist only in the virtual world and if developed by experienced practitioners, may have much utility.
  • Where there is an absence of information, other means need to be employed to establish reference sites. Ecological site descriptions are useful, but many lack connection to specific sites and the variability of soil characteristics given may be so broad as to be of limited use to establish soil health levels. Changing this situation could provide users of ESDs a practical way to determine soil health. A solid connection between the somewhat theoretical ESDs with living laboratories in the field [36] would be a way towards resolution. Karl and Jason [122] underscore the importance of ESDs in rangeland monitoring and assessment.
  • Proposed is that the definition of soil health be separated from that of soil quality for all soils but especially for EM soils. The push to accommodate the nutritional needs of growing world population means improving soil quality to increase output of goods and services. It may seem that soil health and soil quality are the same. Herein is the argument that soil health is an inherent property of a soil. Soil quality, conversely, is a dynamic property defined by the utility of that soil by humans. Semantically “health” and “quality” are different and the definition of neither uses the other. Further, neither is a synonym for the other [123]. Hence, using these synonymously is a source of confusion. Potential confusion continues. Work in Nebraska examines how soil health is impacted under rain fed and irrigated corn by cover crops [124]. In Idaho irrigated barley-pulse intercropping improves soil health [125]. The author contends that both of these address soil quality and not soil health. Hopkins et al. [126] state that “soil health……is an immature science”. This author agrees and contends that fundamental terminology be clarified so that this immature science can grow and be understood.
  • Many EM soils are not suited to management techniques to increase economic output since these (e.g., plowing, agri-chemicals) do not result in net economic return. Domestic animal grazing of EM lands is a common use, many support ecosystems of recreational value and others support wildlife species of economic or cultural value. The value of extensively managed lands often lies not in the fact they are of high-quality providing high economic output in terms of harvestable goods but rather in their maintenance as soils of good health providing basic ecosystem services, recreational lands as well as habitat for grazing animals, and lands sometimes having hard to define and hard to quantify values some describe as spiritual.

Funding

The National Grazing Lands Coalition funded a portion of this work through a Master Professional Service’s Agreement of 4 February 2016. The Nature Conservancy funded the work on the Gobi Soils through contract number DBD-Williams-0115, executed on 14 May 2015, as well as supporting translations from Mongolian. Terre Microbes LLC, owner S. E. Williams, provided funding for final manuscript synthesis, professional editing and securing permission for information especially in Table 2, Table 3 and Table 5.

Institutional Review Board Statement

Not Applicable.

Informed Consent Statement

Not Applicable.

Data Availability Statement

Data are contained within the article. Data from the Gobi Soils are available through the author, with some restrictions imposed by the funding agency.

Acknowledgments

(1) National Grazing Lands Coalition; 8992 White Creek Road; College Station, TX 77845 funded an earlier manuscript version; (2) Texas A & M AgriLife Research & Extension Center, 6500 Amarillo Blvd. W., Amarillo, TX 79106 for use of Unger and Pringle, [45]; (3) University of Wyoming Agric. Expt. Sta., 1000 E. Univ. Ave, Laramie, WY 82071, for use of Fisser and Trueblood [46]; (4) The Nature Conservancy, Global Lands, Development by Design Global Priority; 4245 North Fairfax Drive, Suite 100, Arlington VA 22203, for funding sampling & analysis of Gobi Soils, and TNC Mongolia office for site information; (5) Springer Nature CSC for permission to use descriptions from five chapters in The Soils of Antarctica, J. R. Bockheim (ed.), Springer. 322 pages, and (6) Terre Microbes, LLC; 514 Grand Ave., Box 375; Laramie, WY 82070; USA, for manuscript development and editing. Thanks to reviewers, most through MDPI, who provided perspective and corrections. All photographs are by the author unless noted otherwise.

Conflicts of Interest

The author declares no conflicts of interest.

Abbreviations

CV Covariance; EM Extensively Managed; IM Intensively Managed; SOM soil organic matter; OC organic carbon; MAAT Mean Annual Air Temperature.

References

  1. Holechek, J.L.; Pieper, R.D.; Herbel, C.H. Range Management: Principles and Practices, 6th ed.; Prentice Hall: Hoboken, NJ, USA, 2011; 444p. [Google Scholar]
  2. PNW: Pacific Northwest Research Station. Categorizing ecosystems services. In What People Value: An Ecosystem Services Approach to Managing Public Lands; Mazza, R., Ed.; Science Findings 188; USDA-Forest Service: Portland, OR, USA, 2016; pp. 2–3. [Google Scholar]
  3. Driver, B.L.; Dustin, D.; Baltic, T.; Elsner, G.; Peterson, G. (Eds.) Nature and the Human Spirit: Toward an Expanded Land Management Ethic; Venture Publishing, Inc.: State College, PA, USA, 1996; 467p. [Google Scholar]
  4. Peterson, G.A.; Williams, S.E.; Moser, L. Inorganic fertilizer use and its effect on semiarid and arid regions. In Semiarid Lands and Deserts: Soil Resource and Reclamation; Skujins, J., Ed.; Marcel Dekker, Inc.: New York City, NY, USA, 1991; Chapter 18; pp. 543–580. [Google Scholar]
  5. Wilderness Act. Public Law 88=557 (16 U.S.C. 1131–1136). 88th Congress, Second Session. 3 September 1964. Available online: https://www.fs.usda.gov/Internet/FSE_DOCUMENTS/fseprd645666.pdf (accessed on 15 January 2024).
  6. Uphoff, N.; Ball, A.S.; Fernandes, E.; Herren, H.; Husson, O.; Laing, M.; Palm, C.; Pretty, J.; Sanchez, P.; Saninga, N.; et al. (Eds.) Biological Approaches to Sustainable Soil Systems; CRC—Taylor & Francis: Boca Raton, FL, USA, 2006; 764p. [Google Scholar]
  7. Udall, S.L. The Quiet Crisis; Holt, Rinehart and Winston: New York, NY, USA; Chicago, IL, USA; San Francisco, CA, USA, 1963; 209p. [Google Scholar]
  8. Loudermilk, W.C. Conquest of the Land through 7000 Years. 24 pages. Agriculture Information Bulletin No. 99. 1953. Slightly Revised and Republished in 1975, 1997 and 1999. Available online: https://nrcspad.sc.egov.usda.gov/DistributionCenter/pdf.aspx?productID=109 (accessed on 7 June 2021).
  9. Troeh, F.R.; Thompson, L.M. Soils and Soil Fertility; Oxford University Press: Oxford, UK, 1993; 462p. [Google Scholar]
  10. Jenny, H. Factors of Soil Formation: A System of Quantitative Pedology; McGraw-Hill: New York, NY, USA, 1941. [Google Scholar]
  11. Birkeland, P.W. Soils and Geomorphology, 3rd ed.; Oxford University Press: Oxford, UK, 1999; 430p. [Google Scholar]
  12. Torsvik, V.; Ovreas, L. Chapter 2. Microbial phylogeny and diversity in soil. In Modern Soil Microbiology, 2nd ed.; Van Elsas, J.D., Jansson, J.K., Trevors, J.T., Eds.; CRC Press, Taylor & Francis Group: Boca Raton, FL, USA, 2007; pp. 23–54. [Google Scholar]
  13. Natural Resources Conservation Service. Soil Health. 2001. Available online: https://www.nrcs.usda.gov/wps/portal/nrcs/main/soils/health/ (accessed on 3 July 2019).
  14. Bünemann, E.K.; Bongiorno, G.; Bai, Z.; Creamer, R.E.; De Deyn, G.; de Goede, R.; Fleskens, L.; Geissen, V.; Kuyper, T.W.; PMäder MPulleman Sukkel, W.; et al. Soil quality—A critical review. Soil Biol. Biochem. 2018, 120, 105–125. [Google Scholar] [CrossRef]
  15. Bouma, J.; van Ittersum, M.K.; Stoorvogel, J.J.; Batjes, N.H.; Droogers, P.; Pulleman, M.M. Soil Capability: Exploring the Functional Potentials of Soils. In Global Soil Security; Field, D.J., Morgan, C.L.S., McBratney, A.B., Eds.; Progress in Soil Science; Springer: Berlin/Heidelberg, Germany, 2017; pp. 27–44. [Google Scholar]
  16. Soil Survey Staff, USDA. Soil Taxonomy: A Basic System of Soil Classification for Making and Interpreting Soil Surveys, 2nd ed.; Agriculture Handbook No. 436; Natural Resource Conservation Service, U.S. Government Printing Office: Washington, DC, USA, 1999; 871p + 14 maps.
  17. Pellant, M.; Shaver, P.; Pyke, D.A.; Herrick, J.E. Interpreting Indicators of Rangeland Health, version 4; Technical Reference 1734-6; U.S. Department of the Interior, Bureau of Land Management, National Science and Technology Center: Denver, CO, USA, 2005; 122p, BLM/WO/ST-00/001+1734/REV05. [Google Scholar]
  18. Pellant, M.; Shaver, P.L.; Pyke, D.A.; Herrick, J.E.; Lepak, N.; Riegel, G.; Kachergis, E.; Newingham, B.A.; Toledo, D.; Busby, F.E. Interpreting Indicators of Rangeland Health, version 5; Tech Ref 1734-6; U.S. Department of the Interior, Bureau of Land Management, National Operations Center: Denver, CO, USA, 2020; 186p, BLM/WO/ST-00/001+1734+REV20. [Google Scholar]
  19. Friedel, M.H. Range condition assessment and concept of thresholds: A viewpoint. J. Range Manag. 1991, 44, 422–426. [Google Scholar] [CrossRef]
  20. National Research Council. Rangeland Health; Board on Agriculture; National Academy Press: Washington, DC, USA, 1994; 180p.
  21. Buol, S.W.; Southard, R.J.; Graham, R.C.; McDaniel, P.A. Soil Genesis and Classification, 5th ed.; Iowa State Press: Ames, IA, USA, 2003; 494p. [Google Scholar]
  22. Doran, J.W.; Parkin, T.B. Quantitative indicators of soil quality: A minimum data set. In Methods for Assessing Soil Quality; Doran, J.W., Jones, A.J., Eds.; SSSA Special Publication Number 49; Soil Science Society of America: Madison, WI, USA, 1996; pp. 25–38. [Google Scholar]
  23. Keesstra, S.D.; Bouma, J.; Qallinga, J.W.; Tittonell, P.; Smith, P.; Cerdà, A.; Montanarella, L.; Quinton, J.N.; Pachepsky, Y.; van der Putten, W.H.; et al. The significance of soils and soil science towards realization of the United Nations Sustainable Development Goals. Soil 2016, 2, 111–128. [Google Scholar] [CrossRef]
  24. Visser, S.; Keesstra, S.; Maas, G.; de Cleen, M.; Molenaar, C. Soil as a basis to create enabling conditions for transitions towards sustainable land management as a key to achieve the SDGs by 2030. Sustainability 2019, 11, 6792. [Google Scholar] [CrossRef]
  25. Bonfante, A.; Terrible, F.; Bouma, J. Refining physical aspects of soil quality and soil health when exploring the effects of soil degradation and climate change on biomass production: And Italian case study. Soil 2019, 5, 1–14. [Google Scholar] [CrossRef]
  26. Soil Survey Staff. Keys to Soil Taxonomy. USDA, Natural Resource Conservation Service. 14. Keys to Soil Taxonomy, Twelfth Edition. 2014. Available online: https://nrcspad.sc.egov.usda.gov/DistributionCenter/product.aspx?ProductID=1059 (accessed on 15 January 2024).
  27. Robinson, D.A.; Hockley, N.; Dominati, E.; Lebron, I.; Scow, K.M.; Reynolds, B.; Emmett, B.A.; Keith, A.M.; de Jonge, L.W.; Schjønning, P.; et al. Natural Capital, Ecosystem Services, and Soil Change: Why Soil Science Must Embrace an Ecosystems Approach. Vadose Zone J. 2012, 11, 6. [Google Scholar] [CrossRef]
  28. Rodrigo-Comino, J.; Senciales, J.M.; Cerdà, R.; Brevik, E.C. The multidisciplinary origin of soil geography: A review. Earth-Sci. Rev. 2018, 177, 114–123. [Google Scholar] [CrossRef]
  29. Kibblewhite, M.G.; Ritz, K.; Swift, M.J. Soil health in agricultural systems. Philos. Trans. R. Soc. B 2008, 363, 685–701. [Google Scholar] [CrossRef]
  30. Low, A.J. The effect of cultivation on the structure and other physical characteristics of grassland and arable soils (1945–1970). J. Soil Sci. 1972, 23, 363–380. [Google Scholar] [CrossRef]
  31. Anderson, D.W.; Coleman, D.C. The dynamics of organic matter in grassland soils. J. Soil Water Conserv. 1985, 40, 211–216. [Google Scholar]
  32. Aguilar, R.; Kelly, E.F.; Heil, R.D. Effects of cultivation on soils in northern Great Plains rangeland. Soil Sci. Soc. Am. J. 1988, 52, 1081–1085. [Google Scholar] [CrossRef]
  33. Doran, J.W. Soil health and global sustainability: Translating science into practice. Agric. Ecosyst. Environ. 2002, 88, 119–127. [Google Scholar] [CrossRef]
  34. Printz, J.; Toledo, L.D.; Boltz, S.C. Rangeland health assessment: The key to understanding and assessing rangeland soil health in the Northern Great Plains. J. Soil Water Conserv. 2014, 69, 73A–77A. [Google Scholar] [CrossRef]
  35. Pyke, D.A.; Herrick, J.E.; Shaver, P.; Pellant, M. Rangeland health attributes and indicators for qualitative assessment. J. Range Manag. 2002, 55, 584–589. [Google Scholar] [CrossRef]
  36. Derner, J.D.; Smart, A.J.; Toombs, T.P.; Larsen, D.; McCulley, R.L.; Goodwin, J.; Sims, S.; Roche, L.M. Soil health as a transformational change agent for US grazing lands management. Rangel. Ecol. Manag. 2018, 71, 403–408. [Google Scholar] [CrossRef]
  37. Belnap, J.; Lange, O.L. Structure and functioning of biological soil crusts: A synthesis. In Biological Soil Crusts: Structure, Function and Management; Belnap, J., Lange, O.L., Eds.; Ecological Studies; Springer: Berlin/Heidelberg, Germany, 2001; Volume 150, Chapter 33; 503p. [Google Scholar]
  38. Munn, L.C.; Nielsen, G.A.; Mueggler, W.F. Relationships of soils to mountain and foothill range habitat types and production in Western Montana. Soil Sci. Soc. Am. J. 1978, 42, 135–139. [Google Scholar] [CrossRef]
  39. Jeffries, P.; Gianinazzi, S.; Perotto, S.; Turnau, K.; Barea, J.-M. The contribution of arbuscular mycorrhizal fungi in sustainable maintenance of plant health and soil fertility. Biol. Fertil. Soils 2003, 37, 1–16. [Google Scholar] [CrossRef]
  40. Baron, J.S.; Ojima, D.S.; Holland, E.A.; Parton, W.J. Analysis of nitrogen saturation potential in Rocky Mountain tundra and forest: Implications for aquatic systems. Biogeochemistry 1994, 27, 61–82. [Google Scholar] [CrossRef]
  41. Soil Survey Staff, USDA. Soil Taxonomy. A Basic System of Soil Classification for Making and Interpreting Soil Surveys; Agriculture Handbook No. 436; Soil Conservation Service, U. S. Government Printing Office: Washington DC, USA, 1975; 754p. [Google Scholar]
  42. Natural Resources Conservation Service. No Date. Official Soil Series Descriptions. On-Line and Updated Periodically. Available online: http://www.nrcs.usda.gov/wps/portal/nrcs/detail/soils/survey/geo/?cid=nrcs142p2_053587 (accessed on 8 January 2024).
  43. Agriculture Research Service. No Date. Most of the Information on Ecological Site Description Has Been Developed by the Range Unit at Las Cruces, New Mexico. Available online: https://www.ars.usda.gov/plains-area/las-cruces-nm/range-management-research/docs/ecological-site-descriptions-introduction/ (accessed on 17 March 2024).
  44. Stringer, B.R. Soil Survey of Sherman County, Texas; USDA-Soil Conservation Service in cooperation with the Texas Agriculture Experiment Station; U.S. Government Printing Office: Washington, DC, USA, 1975; 50p + maps. [Google Scholar]
  45. Unger, P.W.; Pringle, F.B. Sherm Soils: Distribution, Importance, Variability and Management; Texas Agriculture Experiment Station College Station, Texas, in Cooperation with USDA Agriculture Research Service and Soil Conservation Service: 1986; 32p, Publication B-1523. Available online: https://oaktrust.library.tamu.edu/handle/1969.1/129132 (accessed on 17 March 2023).
  46. Fisser, H.G.; Trueblood, D.C. Soil-Vegetation Relationships on Rangeland Exclosures in the Salt Wells Planning Unit of South Western Wyoming; Wyoming Agriculture Experiment Station Report No. 1041; University of Wyoming: Laramie, WY, USA, 1980; 68p. [Google Scholar]
  47. Salinity Laboratory Staff. Quality of irrigation water. In Diagnosis and Improvement of Saline and Alkali Soils; Richards, L.A., Ed.; Agriculture Handbook No. 60; USDA U. S. Government Printing Office: Washington, DC, USA, 1954; 160p, SAR: pp. 72–75. [Google Scholar]
  48. Black, C.A. (Ed.) Methods of Soil Analysis. Part 1. Physical and Mineral Properties, Including Statistics of Measurement and Sampling; Agronomy 9; American Society of Agronomy: Madison, WI, USA, 1965; 770p. [Google Scholar]
  49. Salinity Laboratory Staff. Methods for soil characterization. In Diagnosis and Improvement of Saline and Alkali Soils; Richards, L.A., Ed.; Agriculture Handbook No. 60; USDA U. S. Government Printing Office: Washington, DC, USA, 1954; 160p, Carbonates: Effervescence; p. 105. [Google Scholar]
  50. Soil Conservation Service. Soil Survey Laboratory Methods and Procedures for Collecting Soil Samples; Soil Survey Investigation Report No. 1; USDA: Washington, DC, USA, 1972; Bulk Density; pp. 14–16. Available online: https://books.google.com/books?id=WAOyyAEACAAJ&pg=PA14&source=gbs_toc_r&cad=2#v=onepage&q&f=false (accessed on 15 January 2024).
  51. Bouyoucos, C.J. Texture: Sand, silt & clay fractions determined on <2 mm fraction. Texture finalized using the triangle. Directions for making mechanical analysis of soils by the hydrometer method. Soil Sci. 1936, 42, 225–228. [Google Scholar]
  52. Monsen, S.B.; Stevens, R.; Shaw, N.L. Grasses. In Restoring Wester Ranges and Wildlands; Monsen, S.B., Stevens, R., Shaw, N.L., Eds.; General Technical Report RMRS-GTR-136-vol-2; U.S. Department of Agriculture, Forest Service, Rocky Mountain Research Station: Fort Collins, CO, USA, 2004; pp. 295–698 plus index; Chapter 18; pp. 295–414. [Google Scholar]
  53. McArther, D.; Monsen, S.B. Chapter 20. Chenopod Shrubs. In Restoring Wester Ranges and Wildlands; Monsen, S.B., Stevens, R., Shaw, N.L., Eds.; General Technical Report RMRS-GTR-136-vol-2; U.S. Department of Agriculture, Forest Service, Rocky Mountain Research Station: Fort Collins, CO, USA, 2004; pp. 295–698 plus index; pp. 467–491. [Google Scholar]
  54. McArther, D.; Stevens, R. Chapter 21. Composite Shrubs. In Restoring Wester Ranges and Wildlands; Monsen, S.B., Stevens, R., Shaw, N.L., Eds.; General Technical Report RMRS-GTR-136-vol-2; U.S. Department of Agriculture, Forest Service, Rocky Mountain Research Station: Fort Collins, CO, USA, 2004; pp. 295–698 plus index; pp. 493–537. [Google Scholar]
  55. Mongolian Academy of Sciences. Soils. In The Mongolian People’s Republic’s National Atlas, Translated and published by the Mongolian Academy of Sciences (Ulaanbaatar, 1990) and from the Academy of Science of the Union of Soviet Socialist Republics Russian version (Minsk, 1988); Mongolian Academy of Science: Ulaanbaatar, Mongolia, 1990; pp. 65–70. 144p, 45 × 60 cm. (In Mongolian) [Google Scholar]
  56. Goryachkin, S.V.; Tonkonogov, V.D.; Gerasimova, M.I.; Lebedeva, I.I.; Slhisshov, L.L.; Targulian, V.O. Changing concepts of Soil and Soil Classification in Russia. In Soil Classification, A Global Desk Reference; Eswaran, H., Rice, T., Ahrens, R., Stewart, B.A., Eds.; CRC Press: Boca Raton, FL, USA, 2003; Chapter 15; pp. 187–200. 263p. [Google Scholar]
  57. Bockheim, J.G. (Ed.) The Soils of Antarctica; World Soils Book Series; Springer: Berlin/Heidelberg, Germany, 2015; 322p. [Google Scholar]
  58. Flis, S.; Peterson, T.; Vollmer-Sanders, C. Managing at a system level—Considering 4R nutrient stewardship and soil health together. ASA—Crops Soils Mag. 2020, 53, 40–43. [Google Scholar] [CrossRef]
  59. Ahrens, C.D. Meteorology Today: An Introduction to Weather, Climate, and the Environment, 4th ed.; West Publishing Co.: Eagan, MN, USA, 1991; 576p. [Google Scholar]
  60. Solomon, S.; Qin, D.; Manning, M.; Marquis, M.; Averyt, K.; Tignor, M.M.B.; Miller, H.L., Jr.; Chen, Z. (Eds.) Climate Change 2007: The Physical Science Basis; IPCC: Geneva, Switzerland, 2007. [Google Scholar]
  61. Aandahl, A.R. Soils of the Great Plains; University of Nebraska Press: Lincoln, NE, USA, 1982; 282p. [Google Scholar]
  62. Robertson, G.P.; Grandy, A.S. Chapter 3. Soil System Management in Temperate Regions. In Biological Approaches to Sustainable Soil Systems; Uphoff, N., Ball, A.S., Fernandes, E., Herren, H., Husson, O., Laing, M., Palm, C., Pretty, J., Sanchez, P., Snanginga, N., et al., Eds.; CRC Press: Boca Raton, FL, USA, 2006; pp. 27–40. [Google Scholar]
  63. Sikora, L.J.; Stott, D.E. Soil Organic Carbon and Nitrogen. In Method for Assessing Soil Quality; Doran, J.W., Jones, A.J., Eds.; SSSA Special Publication Number 49; Soil Science Society of America: Madison WI, USA, 1996; Chapter 9; pp. 157–168. [Google Scholar]
  64. Bellgard, S.E.; Williams, S.E. Response of mycorrhizal diversity to current climatic changes. Diversity 2011, 3, 8–90. [Google Scholar] [CrossRef]
  65. Allen, E.B.; Allen, M.F. Facilitation of succession by the nonmycotrophic colonizer Salsola kali (Chenopdiaceae) on a harsh site: Effects of mycorrhizal fungi. Am. J. Bot. 1988, 75, 257–266. [Google Scholar] [CrossRef]
  66. Gasch, C.; Enloe, S.F.; Stahl, P.D.; Williams, S.E. An aboveground-belowground assessment of ecosystem properties associated with exotic annual brome invasion. Biol. Fertil. Soils 2013, 49, 919–928. [Google Scholar] [CrossRef]
  67. McCauley, D.J. Saline soil and the agricultural failure of a prehistoric population. CSA News 2020, 65, 6–9. [Google Scholar] [CrossRef]
  68. Sandor, J.A.; Norton, J.B.; Homburg, J.A.; Muenchrath, D.A.; White, C.S.; Williams, S.E.; Havener, C.I.; Stahl, P.D. Biogeochemical studies of a Native American runoff agroecosystem. In Advances in Archaeological Approaches to Soil Chemistry; Wells, E.C., Terry, R.E., Eds.; Advances in Archeological Science Series; Society for Archeological Sciences; Alta Mira Press: Walnut Creek, CA, USA, 2007; Volume 22, pp. 359–386. [Google Scholar]
  69. Environmental Protection Agency. Field and Laboratory Methods Applicable to Overburdens and Minesoils; Sobek, A.A., Schuller, W.A., Freeman, J.R., Smith, R.M., Eds.; EPA-600/2-78-054; Environmental Protection Technology Series; U.S. Environmental Protection Agency: Washington, DC, USA, 1978; pH: Paste with deionized water, glass electrode; pp. 45–47. [Google Scholar]
  70. Environmental Protection Agency. Field and Laboratory Methods Applicable to Overburdens and Minesoils; Sobek, A.A., Schuller, W.A., Freeman, J.R., Smith, R.M., Eds.; EPA-600/2-78-054; Environmental Protection Technology Series; U.S. Environmental Protection Agency: Washington, DC, USA, 1978; EC: Saturation Extract; pp. 91–95. [Google Scholar]
  71. Environmental Protection Agency. Field and Laboratory Methods Applicable to Overburdens and Minesoils; Sobek, A.A., Schuller, W.A., Freeman, J.R., Smith, R.M., Eds.; EPA-600/2-78-054; Environmental Protection Technology Series; U.S. Environmental Protection Agency: Washington, DC, USA, 1978; SOM: Walkley-Black; pp. 76–80. [Google Scholar]
  72. Goh, T.B.; Mermut, A.R. Chapter 20. Carbonates. In Soil Sampling and Method of Analysis, 2nd ed.; Carter, M.R., Gregorich, E.G., Eds.; Canadian Society of Soil Science; CRC Press: Boca Raton, FL, USA, 2008; pp. 215–223. [Google Scholar]
  73. Skjemstad, J.O.; Baldock, J.A. Chapter 21. Total and Organic Carbon. In Soil Sampling and Method of Analysis, 2nd ed.; Carter, M.R., Gregorich, E.G., Eds.; Canadian Society of Soil Science; CRC Press: Boca Raton, FL, USA, 2008; 1224p, Total carbon: pp. 26–27. Total Organic Carbon: Difference between total carbon and carbonate. [Google Scholar]
  74. Keeney, D.R.; Nelson, D.W. Nitrogen—Inorganic Forms. In Methods of Soil Analysis. Part 2, 2nd ed.; Page, A.L., Miller, R.H., Keeney, D.R., Eds.; Agronomy No. 9; American Society of Agronomy: Madison, WI, USA, 1982; 1050p, pp. 643–698, Nitrate Nitrogen. [Google Scholar]
  75. Bremner, J.M.; Mulvaney, C.S. Nitrogen—Total. In Methods of Soil Analysis. Part 2, 2nd ed.; Page, A.L., Miller, R.H., Keeney, D.R., Eds.; Agronomy No. 9; American Society of Agronomy: Madison, WI, USA, 1982; 1050p, pp. 595–624, Total Kjeldahl Nitrogen: Column shows sum of TKN plus Nitrate N. [Google Scholar]
  76. Knudsen, D.; Peterson, G.A.; Pratt, P.F. Lithium, Sodium and Potassium. In Methods of Soil Analysis. Part 2, 2nd ed.; Page, A.L., Miller, R.H., Keeney, D.R., Eds.; Agronomy No. 9; American Society of Agronomy: Madison, WI, USA, 1982; pp. 225–246, Potassium: pp. 228–237. [Google Scholar]
  77. Olsen, S.R.; Sommers, L.E. Phosphorus. In Methods of Soil Analysis. Part 2, 2nd ed.; Page, A.L., Miller, R.H., Keeney, D.R., Eds.; Agronomy No. 9; American Society of Agronomy: Madison, WI, USA, 1982; 1050p, pp. 403–430, Phosphate: Plant available. pp. 414–416. [Google Scholar]
  78. Knudsen, D.; Peterson, G.A.; Pratt, P.F. Lithium, Sodium and Potassium. In Methods of Soil Analysis. Part 2, 2nd ed.; Page, A.L., Miller, R.H., Keeney, D.R., Eds.; Agronomy No. 9; American Society of Agronomy: Madison, WI, USA, 1982; Metals: Cu, Fe, Pb, Mn, Zn. 5 mM DTPA, 2 hour shake extraction. Final analysis by ICP. [Google Scholar]
  79. Heiner, M.; Bayarjargal, Y.; Kiesecker, J.; Galbadrakh, D.; Batsaikhan, N.; Munkhzul, G.; Odonchimeg, I.; Enkhtuya, O.; Enkhbat, D.; von Wehrden, H.; et al. Identifying Conservation Priorities in the Face of Future Development: Applying Development by Design in the Mongolian Gobi; The Nature Conservancy: Arlington County, VA, USA, 2013; 121p. [Google Scholar]
  80. Williams, S.E.; Dodd, J.L.; Lockwood, J.A.; Li, Q. A comparison of the soils of the Northern Mixed Prairie (North America) and grassland of the Mongolian Plateau (Asia). In Proceedings of the International Symposium on Grassland Resources, Hohhot, China, 15–20 August 1993; Li, B., Ed.; P.R.C. China Agriculture Scientech Press: Beijing, China, 1994; pp. 335–344. [Google Scholar]
  81. Baabar, B. History of Mongolia; White Horse Press: Cambridge, UK, 1999; 448p. [Google Scholar]
  82. Tarnocai, C. Arctic Permafrost Soils. In Permafrost Soils; Margesin, R., Ed.; Soil Biology; Springer: Berlin/Heidelberg, Germany, 2009; Volume 16. [Google Scholar]
  83. Bockheim, J.G.; McLeod, M. Soils of Central Victoria Land, the McMurdo Dry Valleys. In The Soils of Antarctica; Bockheim, J.G., Ed.; World Soils Book Series; Springer: Berlin/Heidelberg, Germany, 2015; 322p, pp. 117–148. [Google Scholar]
  84. Blume, H.-P.; Bölter, M. Soils of Wilkes Land (The Windmill Islands). In The Soils of Antarctica; Bockheim, J.G., Ed.; World Soils Book Series; Springer: Berlin/Heidelberg, Germany, 2015; 322p, pp. 87–106. [Google Scholar]
  85. Lupachev, A.V.; Abakumov, E.V.; Abramov, A.A.; Goryachkin, S.V.; Gilichinsky, D.A. Soils of Marie Byrd Land. In The Soils of Antarctica; Bockheim, J.R., Ed.; World Soils Book Series; Springer: Berlin/Heidelberg, Germany, 2015; Chapter 11; 322p, pp. 187–204. [Google Scholar]
  86. Simas, F.N.B.; Schaefer, C.E.G.R.; Michel, R.F.M.; Francelino, M.R.; Bockheim, J.G. Soils of the South Orkney and South Shetland Islands, Antarctica. In The Soils of Antarctica; Bockheim, J.G., Ed.; World Soils Book Series; Springer: Berlin/Heidelberg, Germany, 2015; 322p, pp. 227–273. [Google Scholar]
  87. Haus, N.; Schaefer, C.E.G.R.; Bockheim, J.R.; Pereira, T.T.C. Soils of Graham and Palmer Lands, Antarctic Peninsula. In The Soils of Antarctica; Bockheim, J.R., Ed.; World Soils Book Series; Springer: Berlin/Heidelberg, Germany, 2015; Chapter 12; 322p, pp. 205–226. [Google Scholar]
  88. Whiteman, G.; Hope, C.; Wadhams, P. Vast costs of Arctic change. Nature 2013, 499, 401–403. [Google Scholar] [CrossRef] [PubMed]
  89. Zona, D.; Gioli, B.; Commane, R.; Lindaas, J.; Wofsy, S.C.; Miller, C.E.; Dinardo, S.J.; Dengel, S.; Sweeney, C.; Karion, A.; et al. Cold season emissions dominate the Arctic tundra methane budget. Proc. Natl. Acad. Sci. USA 2011, 113, 40–45. [Google Scholar] [CrossRef] [PubMed]
  90. U.S. Fish and Wildlife Service. 2019. Available online: https://www.nps.gov/subjects/arctic/wildlife.htm (accessed on 27 January 2024).
  91. Natural Resources Conservation Service—Soils. Soil Surveys by State. Available online: http://www.nrcs.usda.gov/wps/portal/nrcs/soilsurvey/soils/survey/state/ (accessed on 10 April 2016).
  92. Williams, S.E.; Bellgard, S.E. Skill set needs of Natural Resource Managers: Derivation from case studies, field based education argument and a proposed decision making system. NACTA J. 2019, 63, 60–71. [Google Scholar]
  93. Westoby, M.; Walker, B.; Noy-meir, I. Opportunistic management for rangelands not at equilibrium. J. Range Manag. 1989, 42, 266–274. [Google Scholar] [CrossRef]
  94. IUSS Working Group WRB. World Reference Base for Soil Resources, International Soil Classification System for Naming Soils and Creating Legends for Soil Maps, 4th ed.; International Union of Soil Sciences (IUSS): Vienna, Austria, 2022; Available online: https://www.isric.org/sites/default/files/WRB_fourth_edition_2022-12-18.pdf (accessed on 12 April 2016).
  95. Smith, J.L.; Doran, J.W. Measurement and use of pH and electrical conductivity for soil quality analysis. In Methods for Assessing Soil Quality; Doran, J.W., Jones, A.J., Eds.; Special Publication # 49; Soil Science Society America: Madison, WI, USA, 1996; pp. 169–185. [Google Scholar]
  96. Rodman, A.; Shovic, H.; Thoma, D. Soil of Yellowstone National Park; Yellowstone Center for Resources: Yellowstone National Park, WY, USA, 1996; YCR-NRSR-96-2, 324p + 27 maps. [Google Scholar]
  97. Swallow, A.N. Ecohydrologic Impact of Vegetation Treatments in Bates Creek Watersheds, Wyoming. Master’s. Thesis, Department of Renewable Resources, University of Wyoming, Laramie, WY, USA, 2011; 120p. [Google Scholar]
  98. Purcell, M.J. Pygmy Rabbit (Brachylagus idahoensis) Distribution and Habitat Requirements in Wyoming. Master’s. Thesis, Department of Zoology and Physiology, University of Wyoming, Laramie, WY, USA, 2006. [Google Scholar]
  99. Schroeder, M.A.; Aldridge, C.L.; Apa, A.D.; Bohne, J.R.; Braun, C.E.; Bunnell, S.D.; Connnelly, J.W.; Deibert, P.A.; Gardner, S.C.; Hilliard, M.A.; et al. Distribution of sage-grouse in North America. Condor 2004, 106, 363–376. [Google Scholar] [CrossRef]
  100. Surface Mining Control and Reclamation Act. Public Law 95-87. Includes All Revisions up through 2012. Available online: http://www.osmre.gov/lrg/docs/SMCRA.pdf (accessed on 12 April 2016).
  101. White, J.A.; DePuit, E.J.; Smith, J.L.; Williams, S.E. Establishment of vesicular-arbuscular mycorrhizal fungi on irrigated reclamation in southwestern Wyoming. Soil Sci. Soc. Am. J. 1992, 56, 1464–1469. [Google Scholar] [CrossRef]
  102. Wolken, P.M.; Hull-Sieg, C.; Williams, S.E. Quantifying suitable habitat of the threatened western prairie fringed orchid. J. Range Manag. 2001, 54, 611–616. [Google Scholar] [CrossRef]
  103. Herrick, J.E.; Schuman, G.E.; Rango, A. Monitoring ecological processes for restoration projects. J. Nat. Conserv. 2016, 14, 161–171. [Google Scholar] [CrossRef]
  104. Sandor, J.A.; Gersper, P.L.; Hawley, J.W. Soils of prehistoric agricultural terracing sites in New Mexico. I. Site placement, soil morphology, and classification. Soil Sci. Soc. Am. J. 1986, 50, 166–173. [Google Scholar] [CrossRef]
  105. Sandor, J.A.; Gersper, P.L.; Hawley, J.W. Soils at prehistoric agricultural terracing sites in New Mexico: II. Organic matter and bulk density changes. Soil Sci. Soc. Am. J. 1986, 50, 173–177. [Google Scholar] [CrossRef]
  106. Sandor, J.A.; Gersper, P.L.; Hawley, J.W. Soils of prehistoric agricultural terracing sites in New Mexico. III. Phosphorus, selected micronutrients, and pH. Soil Sci. Soc. Am. J. 1986, 50, 177–180. [Google Scholar] [CrossRef]
  107. Sandor, J.A.; Eash, N.S. Ancient agricultural soils in the Andes of southern Peru. Soil Sci. Soc. Am. J. 1995, 59, 170–179. [Google Scholar] [CrossRef]
  108. Sylvia, D.M.; Williams, S.E. VA Mycorrhizae and Environmental Stress. In Mycorrhizae in Sustainable Agriculture; Bethlenfalvay, G.J., Linderman, R.G., Eds.; ASA Special Publication No. 54; American Society of Agronomy, Inc.: Madison, WI, USA, 1992; Chapter 5; pp. 101–124. [Google Scholar]
  109. Rauzi, F. High rates of nitrogen change composition of shortgrass rangeland in Southeastern Wyoming. J. Range Manag. 1978, 30, 366–370. [Google Scholar] [CrossRef]
  110. Rauzi, F. Residual effects of phosphorus and high rates of nitrogen on shortgrass rangeland. J. Range Manag. 1979, 32, 470–474. [Google Scholar] [CrossRef]
  111. Fenn, M.E.; Baron, J.S.; Allen, E.B.; Rueth, H.M.; Nydick, K.R.; Giser, L.; Bowman, W.B.; Sickman, J.O.; Meixner, T.; Johnson, D.W.; et al. Ecological effects of nitrogen deposition in the Western United States. BioScience 2003, 53, 404–420. [Google Scholar] [CrossRef]
  112. Fenn, M.E.; Haeuber, R.; Tonnesen, G.S.; Baron, J.S.; Grossman-Clarke, S.; Hope, D.; Jaffe, D.A.; Copeland, S.; Geiser, L.; Rueth, H.M.; et al. Nitrogen emissions, deposition and monitoring in the Western United States. BioScience 2003, 53, 391–403. [Google Scholar] [CrossRef]
  113. Palmer, K.M.; Stanton, N.L.; Ben-David, M.; Mionczynski, J.; Williams, S.E. Are pika exposed to and affected by selenium deficiency? J. Wildl. Dis. 2007, 43, 475–484. [Google Scholar] [CrossRef]
  114. Li, Z.-B.; Li, P.; Huang, P.P.; Liu, X.-J. Comprehensive Chinese government policies to combat desertification. In Restoration and Development of the Degraded Loess Plateau, China; Tsunekawa, A., Liu, F., Yamanaka, N., Du, S., Eds.; Springer: Berlin/Heidelberg, Germany, 2013; pp. 123–135. [Google Scholar]
  115. Doran, D.L.; Zeiss, M.R. Soil health and sustainability: Managing the biotic component of soil quality. Appl. Soil Ecol. 2000, 15, 3–11. [Google Scholar] [CrossRef]
  116. Dorsey, N. Understanding soil health testing. Crops Soils Mag. 2019, 52, 22–24. [Google Scholar] [CrossRef]
  117. Pennock, D.; Yates, T.; Braidek, J. Soil Sampling Designs. In Soil Sampling and Methods of Analysis; Carter, M.R., Gregorich, E.G., Eds.; Canadian Soil Science Society; CRC Press, Taylor and Francis Group: Boca Raton, FL, USA, 2008; Chapter 1; 1224p, pp. 1–14. [Google Scholar]
  118. Wilding, L.P. Spacial Variability: Its documentation, accommodation and implication to soil surveys. In Soil Spatial Variability, Proceedings of the Workshop of the ISSS and the SSA, Las Vegas, NV, USA, 30 November–1 December 1984; Nielsen, D.R., Bouma, J., Eds.; Center for Agricultural Publications and Documentation (Pudoc): Wageningen, The Netherlands, 1985. [Google Scholar]
  119. Donahue, D.L. The Western Range Revisited: Removing Livestock from Public Lands to Conserve Native Biodiversity; University of Oklahoma Press: Norman, OK, USA, 1999; 388p. [Google Scholar]
  120. Kwon, H.; Nkonya, E.; Johnson, T.; Graw, V.; Kato, E.; Kihiu, E. Global Estimates of the Impacts of Grassland Degradation on Livestock Productivity from 2001 to 2011. In Economics of Land Degradation and Improvement—A Global Assessment for Sustainable Development; Nkonya, E., Mirzabaev, A., Von Braun, J., Eds.; Springer: Berlin/Heidelberg, Germany, 2016; Chapter 8; 608p, pp. 197–214. Available online: https://link-springer-com.libproxy.uwyo.edu/content/pdf/10.1007%2F978-3-319-19168-3_8.pdf (accessed on 12 April 2016).
  121. Doran, J.W.; Parkin, T.B. Defining and assessing soil quality. In Defining Soil Quality for a Sustainable Environment; Doran, J.W., Coleman, D.C., Bezdicek, D.F., Stewart, B.A., Eds.; SSSA Special Publication Number 35; Soil Science Society of America: Madison, WI, USA, 1994; pp. 3–21. [Google Scholar]
  122. Karl, J.W.; Herrick, J.E. Monitoring and assessment based on ecological sites. Rangeland 2010, 32, 60–64. [Google Scholar] [CrossRef]
  123. Laird, C. Roget’s A-Z Thesaurus, 4th ed.; Wiley Publishing, Inc.: Hoboken, NJ, USA, 1999; 894p. [Google Scholar]
  124. Blanco-Canqui, H.; Ruis, S.J.; Klehler-Cole, K.; Elmore, R.W.; Francis, C.A.; Shapiro, C.A.; Proctor, C.A.; Ferguson, R.B. Cover crops and soil health in rainfed and irrigated corn: What did we learn after 8 years? Soil Sci. Soc. Am. J. 2023, 87, 1174–1190. [Google Scholar] [CrossRef]
  125. Liang, X.; Kayler, Z.; Stephenson, T.; von Rein, I.; Shaber, J. Barley-Pulse Intercroppping Improves Resource Us Efficiency and Soil Health. Crops Soils 2023, 56, 10–13. [Google Scholar] [CrossRef]
  126. Hopkins, B.G.; Rogers, C.W.; Yost, M. Soil Health: What We Know—And Don’t Know. Crops Soils 2023, 56, 43–49. [Google Scholar] [CrossRef]
Figure 1. Schematic of the various subgroups of the Paleustolls and how they vary from the Typic Paleustolls [16]. The data set (Table 2) underlying this construct is derived from the Torrertic subgroup given data for the Typic subgroup are rare.
Sustainability 16 02867 g001
Figure 2. A heterogeneous landscape (at about 41.33° N and 107.67° W, Wyoming USA) with likely 5 different soil taxa and thus 5 or more sets of soil health indicators. A single pit and description in this landscape would not capture variability and soil health (see Table 3). Topographic variability shapes this landscape as it controls microclimate and thus available soil moisture. Snow accumulation in the nivation hollow (right) allows enough soil moisture to support aspen (Populus tremuloides) whereas the wind swept plateau (left, mid screen) is usually swept clean of snow and thus remains droughty.
Sustainability 16 02867 g002
Figure 3. Dune plus docking agent Nitraria siberica. Common in the Gobi, these form resources islands and contain much coarse (>2 mm) organic debris. Landscape shown is that typical of Area VI (Table 4).
Sustainability 16 02867 g003
Figure 4. Gobi landscape and Vegetation (Table 4, similar to Area III but without coal dust in surface material). Gobi vegetation: S = Salsola sp. A = Allium sp.
Sustainability 16 02867 g004
Figure 5. Typical Gobi landscape from Area III, Table 4, Putative Cryochrept. Coal dust in surface material is From the nearby (Tavan Tolgoi) coal mines, and has an organic carbon Content of 1.2% whereas the A (0 to 20 cm), A/C (20 to 36 cm) and C (36 to 60 cm) are less than 0.1%. Picture by Naranzul, B. in 2014, project officer with Mongolian TNC.
Sustainability 16 02867 g005
Figure 6. Over farmed, wind eroded landscape in eastern Inner Mongolia (China).at approximately 44° N and 116° E. Examination of remnant profiles suggest the area was originally a grassland and soils had mollic epipedons. This represents failure in land management and provides an example to be avoided.
Sustainability 16 02867 g006
Table 1. Soil health indicators stratified, in part, by Soil State Factors [10]. Although this list is not comprehensive, each has been used as cited. Those in bold are those herein identified as principle health indicators for extensively managed soils. Those in italics are fundamental ecosystem properties often of regional importance. There is no single indicator that can be used to determine soil health, rather a suite of indicators that should be considered for all soils (bolded items). Evaluation of these bolded indicators may suggest others that should be examined. There is no set of rules or dictates that can be followed to absolutely determine soil health. Inspections of soils in the field by experienced and often certified observers may mandate determination of other indicators.
IndicatorCitation
Organismic (from Soil State equation, Jenny, 1941 [10])
A horizon depthPyke et al., 2002 [35]
 Annual plant productivity, above groundPyke et al., 2002 [35], Derner et al., 2018 [36]
Carbon, total organicNRCS, 2001 [13]
Cover, bare soilPyke et al., 2002 [35], Derner et al., 2018 [36]
 Cover, biological soil crustsBelnap and Lange, 2001 [37]
 Cover, by legumes as a groupPeterson et al., 1991 [4]
 Cover, other N2 fixers (lichens, actinorhizal plants)Peterson et al., 1991 [4]
Cover, by plant speciesPyke et al., 2002 [35]
 Cover, non-soil: e.g., rocks, asphalt, etc. Pyke et al., 2002 [35]
 Cover, total plantPyke et al., 2002 [35]
 Invasive plants and organisms, species listPyke et al., 2002 [35]
Mollic epipedon or Mollic material, depthMunn et al., 1978 [38]
 Mycorrhizal associationsJeffries et al., 2003 [39]
 Plant morbidity/decadencePyke et al., 2002 [35]
Plant species, listPyke et al., 2002 [35], Derner et al., 2018 [36]
Climate (from Soil State equation, Jenny, 1941)
Growing season: length, average & variabilityJenny, 1941 [10]
 Precipitation: chemistryBaron et al., 1994. [40]
 Precipitation: annual & variabilityJenny, 1941 [10]
 Soil Moisture regimeSoil Survey Staff, 1975 [41]; NRCS, no date. [42]
 Temperature: average, high, low & variabilityJenny, 1941 [10]
 Water: Available to rooting depthSoil Survey Staff, 1975 [41]; NRCS, no date. [42]
Parent Material (from Soil State equation, Jenny, 1941)
Geological materials below the solum
 Subsurface materials
 Surface materials
Time (from Soil State equation, Jenny, 1941)
 Geologic Time: Duration since soil formation initiated.Jenny, 1941 [10]
Recent disturbance: fire, erosion, overgrazing, etc.Derner et al., 2018 [36]
 Time since plowing.SEW, this paper.
 Time since agri-chemical use (fertilizers, pesticides, etc.)SEW, this paper
Topography (from Soil State equation, Jenny, 1941)
 AspectSoil Survey Staff, 1975 [41]; NRCS, no date. [42]
 Elevation (above sea level).Soil Survey Staff, 1975 [41]; NRCS, no date. [42]
 Location, latitude and longitude. Soil Survey Staff, 1975 [41]; NRCS, no date. [42]
 Slope (variation in slope, description). Soil Survey Staff, 1975 [41]; NRCS, no date. [42]
Chemical Properties
 Cations (extractable and/or water soluble)NRCS, 2001 [13]
Electrical conductivity of saturation extractNRCS, 2001 [13]
 Nitrogen (total, nitrate, ammonium)NRCS, 2001 [13]
pH, soil solution or soil pasteNRCS, 2001 [13]
 Phosphorus (total and/or plant available)NRCS, 2001 [13]
Physical Properties
 Erosion: Pedestals & terracettesPyke et al., 2002 [35]
 Erosion: rills-linear erosional rivuletsPyke et al., 2002 [35]
 Erosion: Surface resistance to erosionPyke et al., 2002 [35]
 Erosion: water flow patternsPyke et al., 2002 [35]
 Erosion: wind scoured Pyke et al., 2002 [35]
 Erosion: GulliesPyke et al., 2002 [35]
 Litter: amountPyke et al., 2002 [35]
 Litter: MovementPyke et al., 2002 [35]
 Soil crusts, abioticNRCS, 2001 [13]
 Soil surface, compactedPyke et al., 2002 [35]
Water parameters
 Sodium absorption ratio of soil solutionNRCS, 2001 [13]
 Sodium absorption ratio of sub-irrigation waterSEW, this paper
 Infiltration ratesPyke et al., 2002 [35] NRCS, 2001 [13]
Taxonomic placement of soilSoil Survey Staff, 1975 [41]; NRCS, no date. [42]
 Great group identificationMunn et al., 1978 [38]
 Subgroup: determine breadth of expected propertiesMunn et al., 1978 [38]
Table 2. Some characteristics of Great Plains grassland soils managed as range for livestock production.
All soils described in this table are classified as the Sherm Series and are present on the high plains of the Texas Panhandle and somewhat into the Oklahoma Panhandle (35.97 to 36.05° N and 100.91 to 101.07° W).
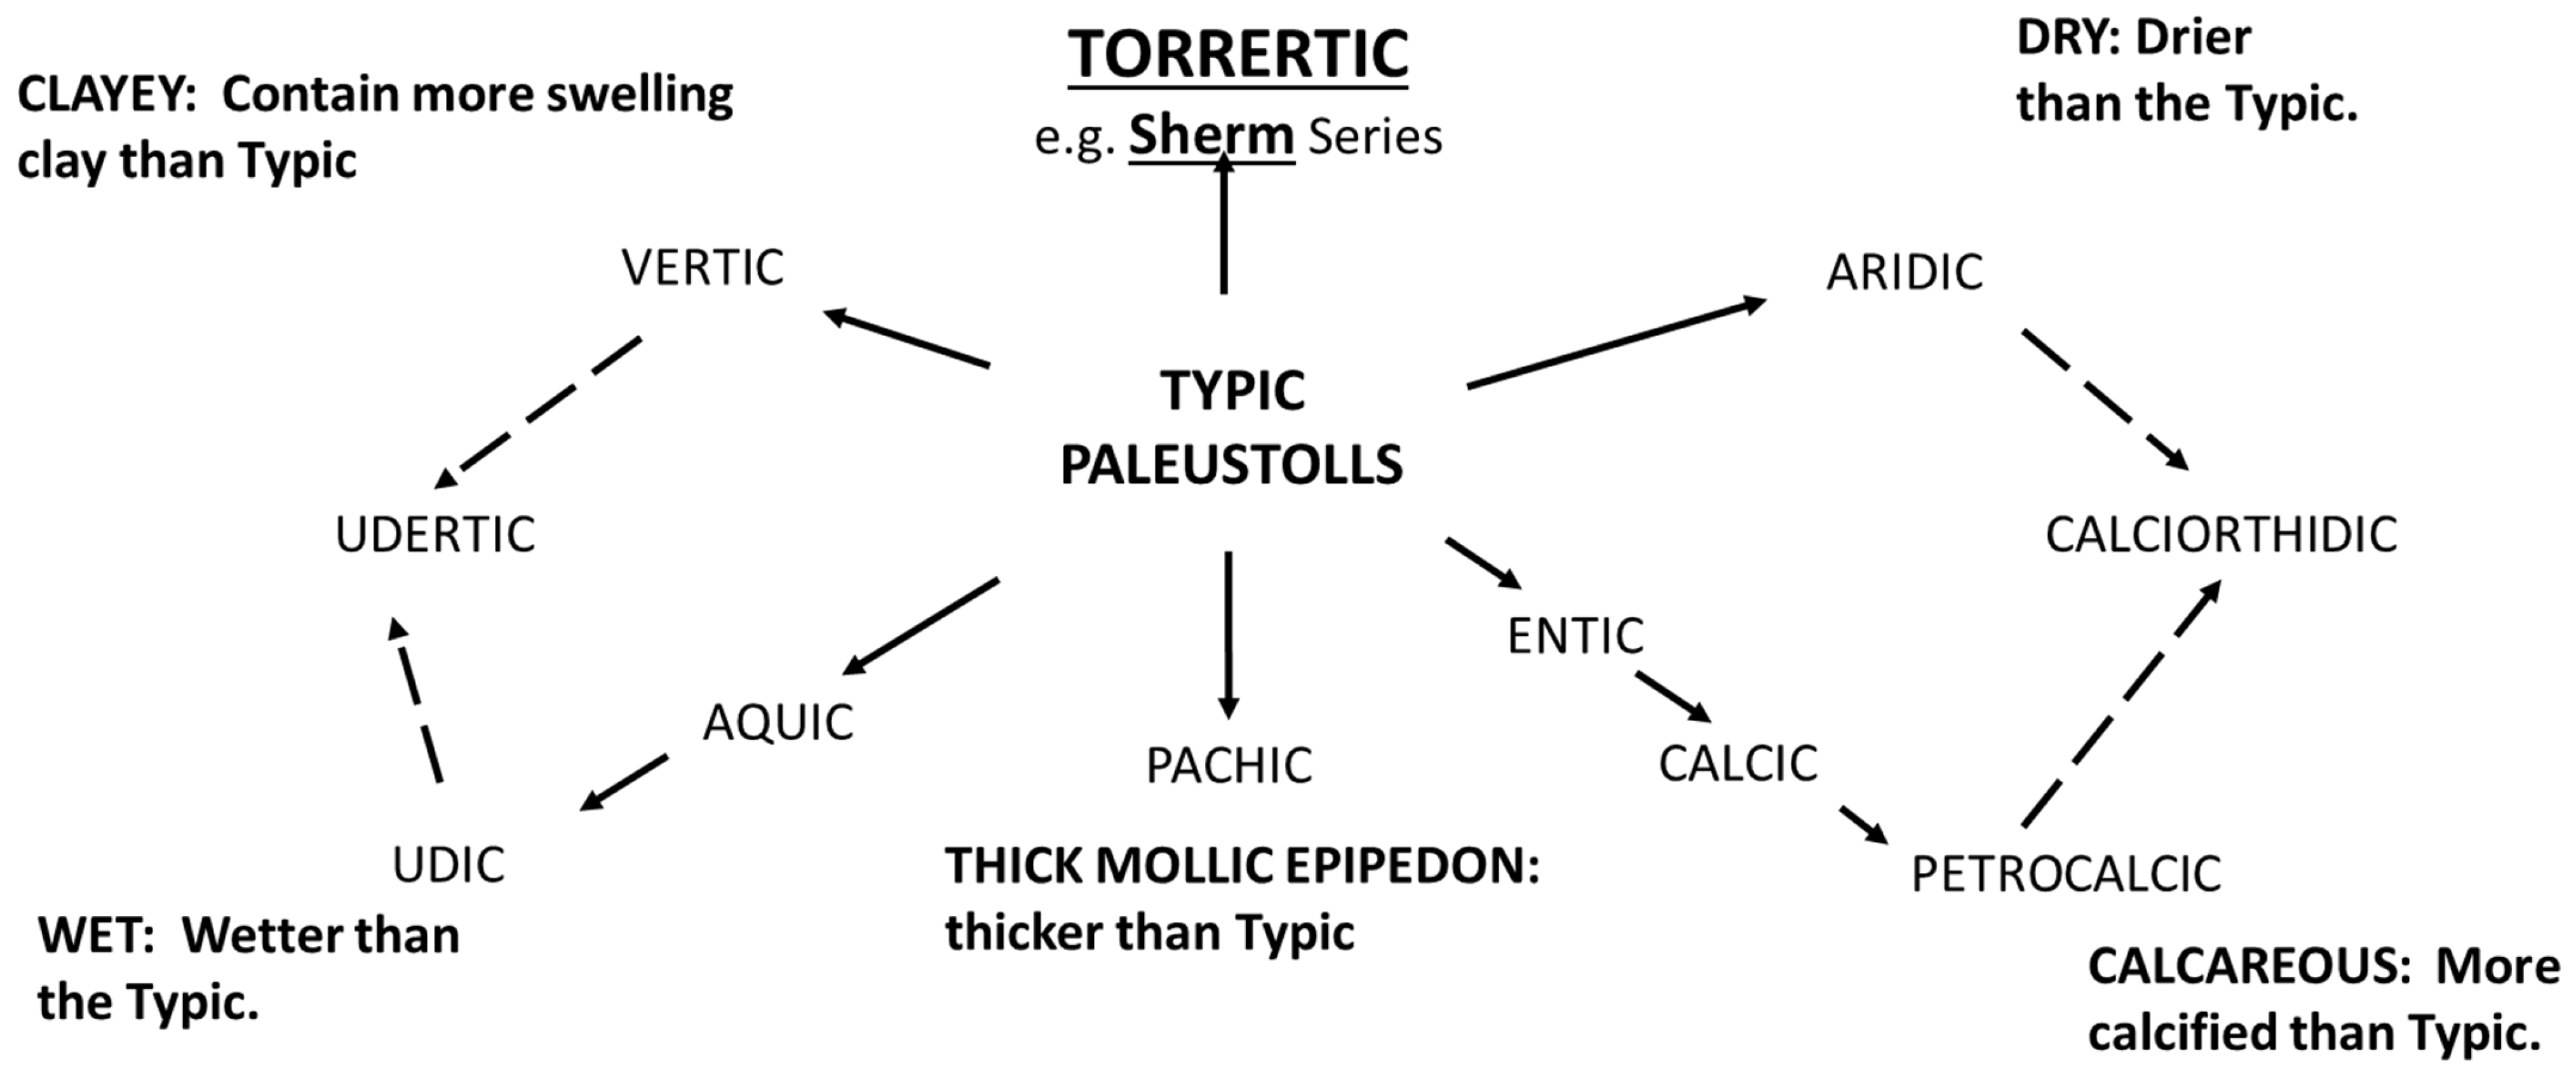
MOLLISOLS: All of these soils are Torrertic Paleustolls. Parent materials are medium to fine-textured sediments largely or entirely of Aeolian origin. Slopes of all vary from 0 to 3%.
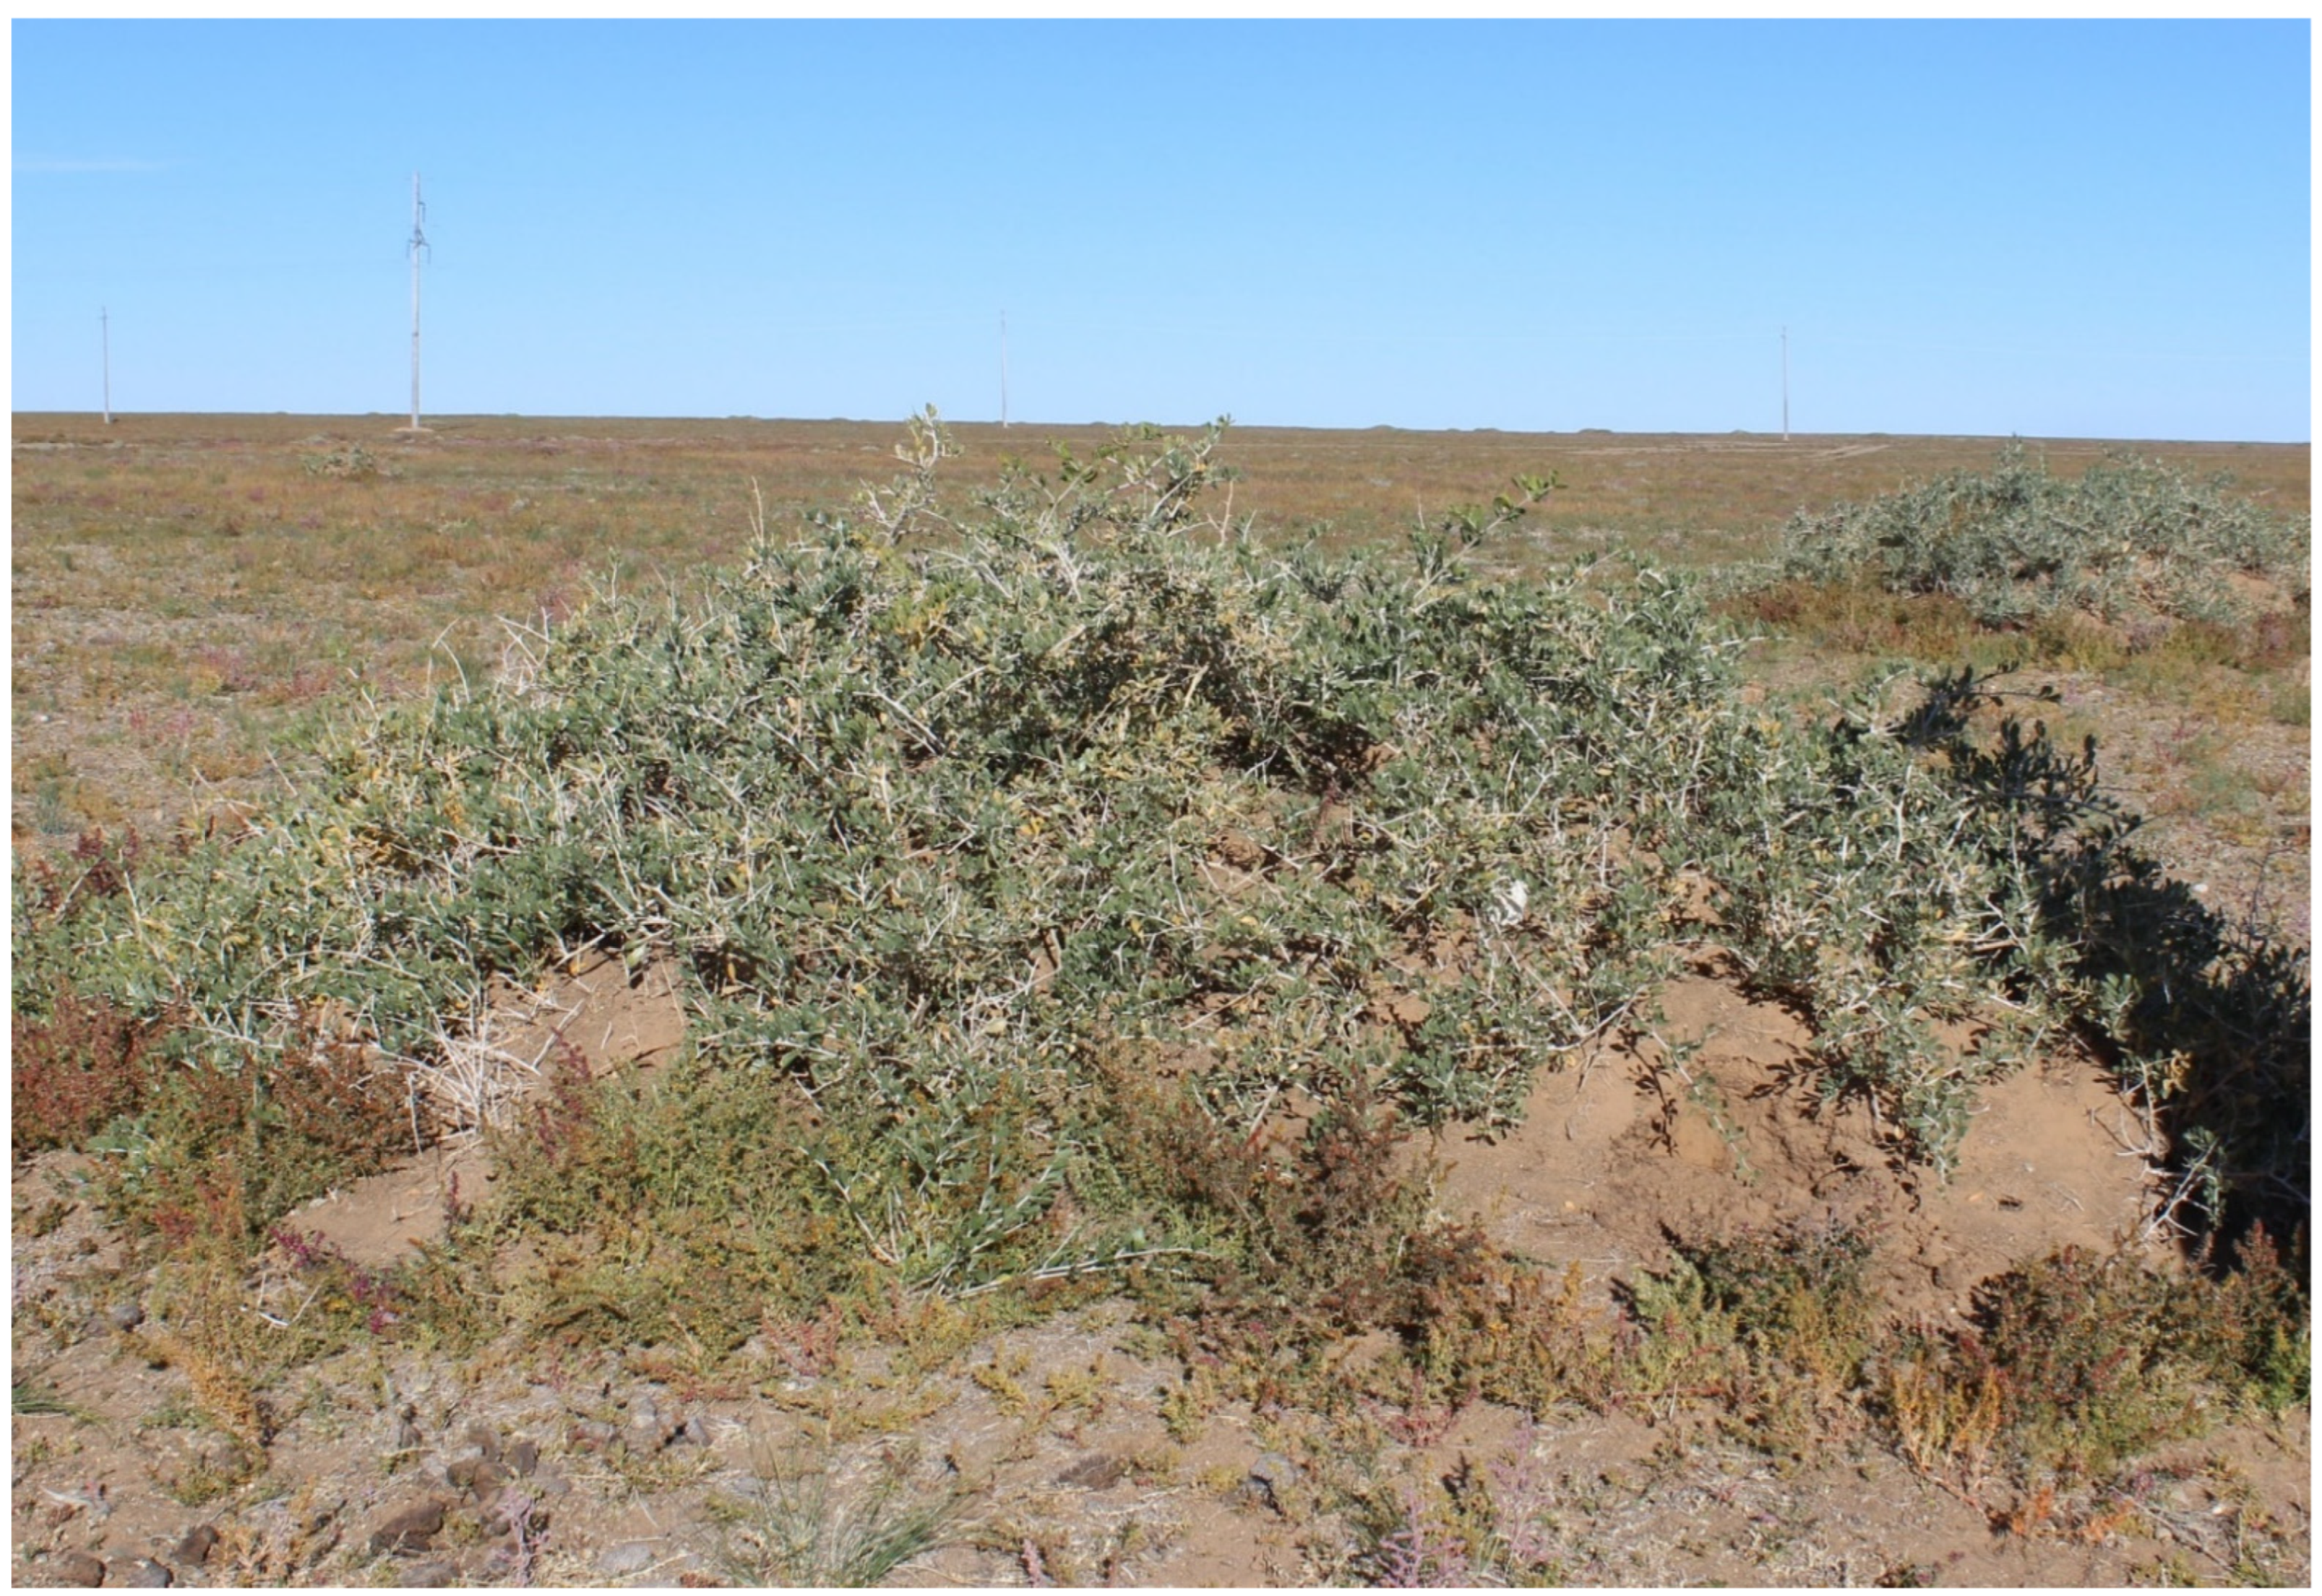
Typical vegetation on the Sherm Series is (by percentage of dry matter production): Blue grama (Bouteloua gracilis) 40%, Buffalo grass (Buteloua dactyloides) 25%, Sideoats grama (Bouteloua curtipendula) 5%, Western wheatgrass (Pascopyrum smithii) 5%, vine-mesquite (Panicum obtusum) 5%, Silver bluestem (Bothriochloa laguroides subsp. torreyana) 5%, Tobosa (Hilaria mutica) 5%, Other perennial grasses 5%, and Perennial Forbs, 5%.
The potential total annual productivity in favorable, average and unfavorable years is 2250 kg/ha, 1700 kg/ha and 1125 or less, respectively.
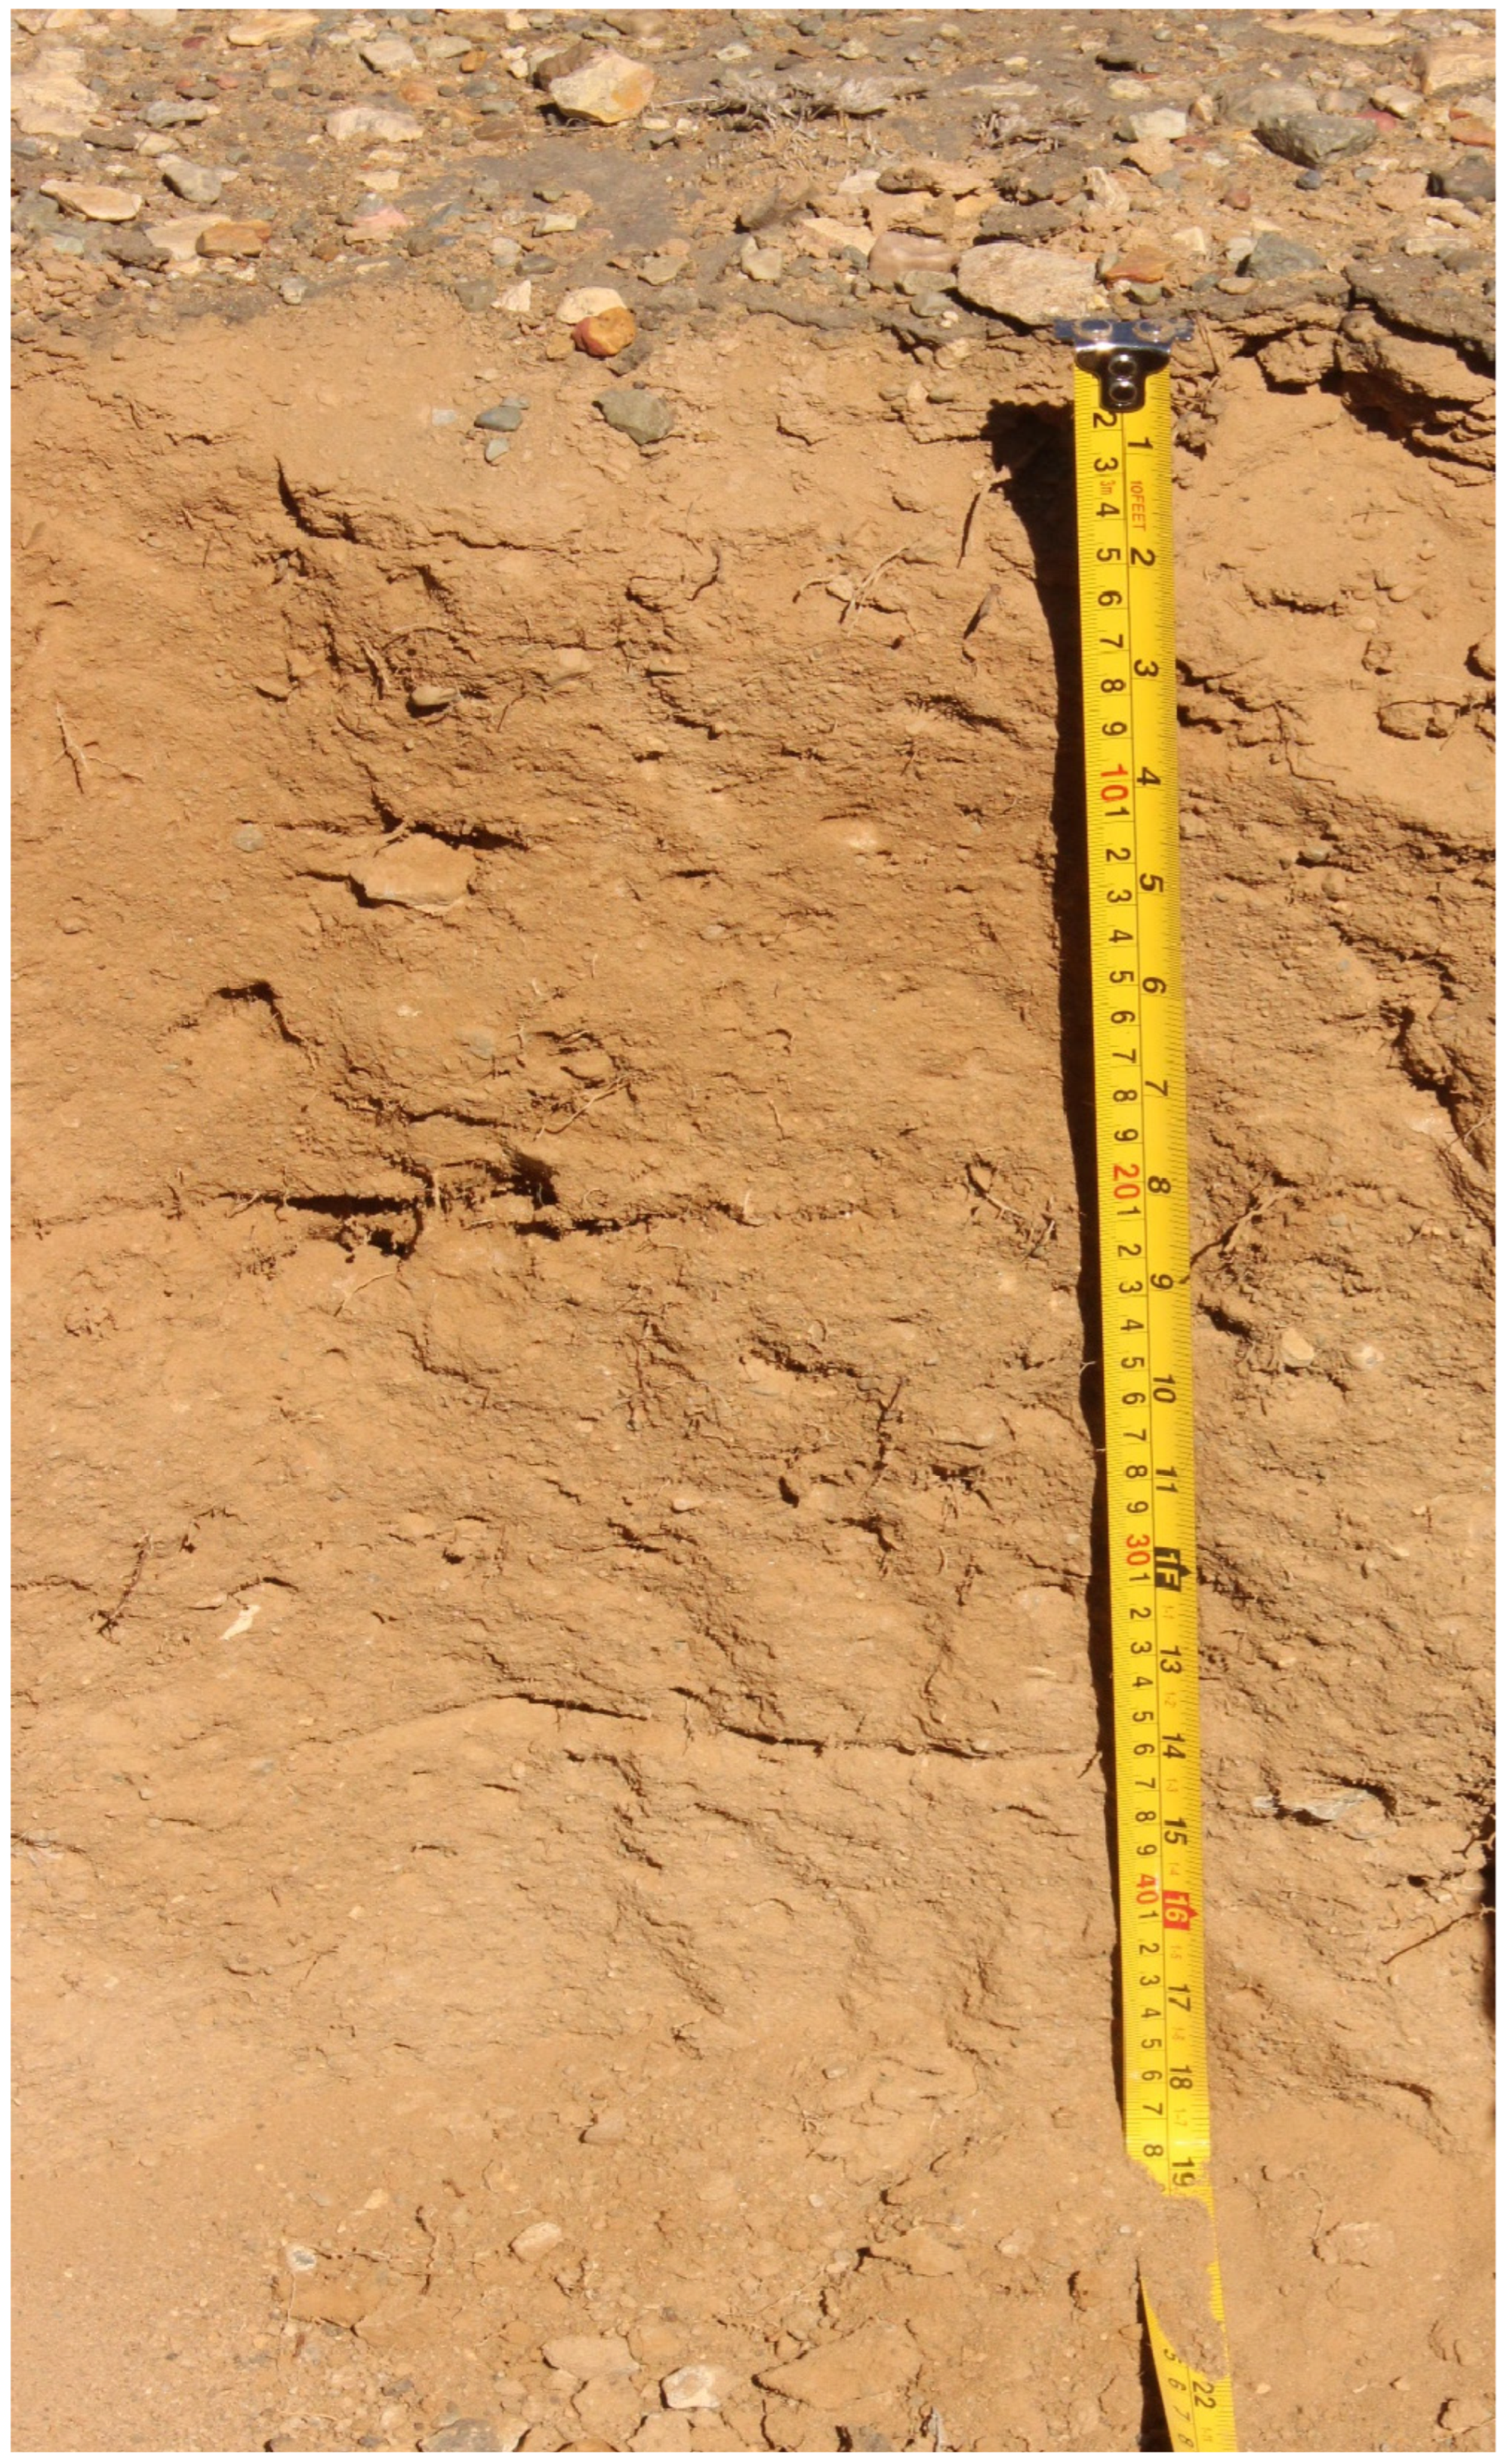
All examples below are shown with Ap horizons. The unplowed equivalent would have probably a somewhat deeper A horizon.
Although often managed more under intensive agriculture, these soils are also managed as range for livestock grazing. That even these have Ap horizons suggests they were under plow agriculture at one time but now have reverted to an extensive management scenario.
Further, some of these descriptions were indeed carried out on intensively managed sites. This is the continuation of a theme that extensively managed lands and the soils under them, have not received the attention that intensively managed lands have. Still, all of the examples below are managed as grazing lands in some sectors [45].
Soil MoistureMunsell Colors
HorizonsDepthpHOrganicCaCO3Bulk0.32 atm14.80 atmAvailableDryMoistClayTextural
(cm)1:1Matter(%)DensityWaterWaterWater Class **
(%) (g/cc)(%)(%)% <0.002
mm
Hartley, Texas: Sherm Series (site 1)
Annual Precipitation: 413 mm; Mean Annual Air Temperature Maximum: 21.5 °C Minimum 5.0 °C.
Frost-free season is about 178 days annually. Elevation 1216 m.
Plant Available Water to 152 cm: 17.7 cm
Ap0–157.751.45 1.2629.519.210.37.5YR 4/27.5YR 3/231.6CL
Bt115–457.650.93 1.5337.922.815.17.5YR 4/27.5YR 3/243.6C
Bt245–717.600.63 1.6334.420.613.87.5YR 5/27.5 YR 4/239.7CL
Bt371–917.600.39 1.5130.119.910.27.5YR 5/47.5YR 4/435.4CL
Bt491–1527.500.23 1.4627.117.49.75YR 5/65YR 5/633.7CL
Btk152–1837.900.2545.25 5YR 8/45YR 7/429.2CL
Dallam, Texas: Sherm Series (site 2)
Annual Precipitation: 413 mm; Mean Annual Air Temperature Maximum: 21.5 °C, Minimum 5.0 °C.
Frost-free season is about 178 days annually. Elevation 1216 m.
Plant Available Water to 152 cm: 14.5 cm
Ap0–187.701.75 1.2631.120.210.97.5YR 4/27.5YR 3/231.6CL
Bt118–437.600.84 1.5833.818.615.27.5YR 4/27.5YR 3/237.9CL
Bt243–667.600.39 1.5526.016.99.17.5YR 5/47.5YR 4/430.7CL
Bt366–967.500.36 1.4922.217.64.67.5YR 5/47.5YR 4/426.4CL
Ab96–1227.700.45 1.5127.219.37.97.5YR 5/27.5YR 4/232.4CL
Btb1122–1527.700.34 1.6429.619.010.65YR 5/45YR 4/434.9CL
Btb2152–1887.900.23 1.69 5YR 5/65YR 4/634.8CL
Sherman, Texas: Sherm Series (Site 5)
Annual Precipitation: 420 mm; Mean Annual Air Temperature Maximum: 21.6 °C, Minimum 4.5 °C.
Frost-free seasons is about 182 days annually, Elevation 1128 m.
Plant Available Water to 102 cm (the top of the Btk): 16.5 cm
Ap0–157.601.70 1.2632.021.011.07.5YR 4/27.5YR 3/233.2CL
Bt115–437.800.86 1.4831.820.910.97.5YR 4/27.5YR 3/236.4CL
Bt243–697.900.46 1.5633.124.38.87.5YR 5/47.5YR 4/439.8CL
Bt369–917.900.32 1.5727.919.68.37.5YR 5/47.5YR 4/433.6CL
Bt491–1127.900.32 1.4728.516.012.55YR 5/45YR 4/435.5CL
Btk112–1838.000.1621.631.57 7.5YR 8/47.5YR 7/440.0C
Moore, Texas: Sherm Series (site 6).
Annual Precipitation: 481 mm; Mean Annual Air Temperature Maximum: 22.0 °C, Minimum 5.5 °C
Frost-Free season is about 185 days annually, Elevation 1067 m.
Plant Available Water to 147 cm (the top of the Btk): 18.4 cm
Ap0–187.901.94 1.2640.728.212.55YR 4/25YR 3/236.8SiCL
Bt118–488.001.06 1.5433.124.38.85YR 3/25YR 2/243.5SiC
Bt248–898.000.67 1.6240.524.615.95YR 4/45YR 3/447.9C
Bt389–1478.000.35 1.3834.522.212.37.5YR 5/47.5YR 4/444.7SiC
Btk147–1887.900.3354.171.75 7.5YR 8/47.5YR 7/435.7SiCL
Dallam, Texas: Sherm Series (Site 11)
Annual Precipitation: 413 mm; Mean Annual Air Temperature Maximum: 21.5 °C, Minimum 5.0 °C.
Frost-free season is about 178 days annually. Elevation 1216 m.
Plant Available Water to 119 cm (the top of the Btk): 11.6 cm
Ap0–186.801.61 1.2629.819.710.15YR 4/35YR 3/330.8CL
Bt118–517.400.70 1.4932.222.210.05YR 4/35YR 3/337.8CL
Bt251–817.600.31 1.4530.720.410.35YR 5/35YR 4/338.8CL
Bt381–1197.800.19 1.6028.323.05.35YR 5/65YR 4/634.6SCL
Btk119–2038.100.4049.521.62 5YR 7/45YR 6/434.4SCL
SUMMARY:
MeanSDCV, % MeanSDCV, %
Annual Precipitation (mm):42829.7837 Depth of A Horizon16.8 cm1.649.8
Aver/Annual Max Temp (°C):21.620.216810.2 Plant Avail. Water15.74 cm2.7517.5
Frost Free Season, days:180.23.19371.8
Soil Moisture
pHOrganicCaCO3Bulk0.32 atm14.80 atmAvailableSandSiltClayTextural
1:1Matter(%)DensityWaterWaterWater Class **
(%) (g/cc)(%)(%)%2–0.05 mm0.05–0.002 mm<0.002 mm
ApMean7.51.75 1.2633.422.311.129.637.433.1CL
SD0.4830.139 04.94.01.012.810.22.7
Bt1Mean7.70.865 1.5232.721.511.225.535.738.9C
SD0.2580.148 0.050.92.42.811.59.33.1
BtkMean80.29741.7731.65 31.631.736.7CL
SD0.1000.12317.5990.09 17.616.52.9
The five units reported above were selected from the 11 reported by Unger and Pringle [45] and taken from counties where a high percentage of the Sherm Soils were managed as rangelands. These were all from Texas counties in the western most regions occupied by Sherm Soils. Precipitation was low, compared to those further east. ** Si: Silt, S: Sand, C: Clay, L: Loam.
Table 3. Some characteristics of arid range soils on various parent materials [41] and [46] for Pedon 58, the Natargid).
HorizonsDepthpHpHE. C.OrganicCaCO3BulkMunsellMunsellTextureCoarse
(cm)Paste1 to 5dS/MMatter %(%)Density g/ccColorColorClassFrags. %
METHODS, Wyoming Soils
InSal. LabBlackSal. LabSoil Cons.DryMoistBouyoucos>2 mm
waterStaff [47][48]Staff [49]Serv.
[50]
[51][50]
ARIDISOL: Typic Calciorthid; Coarse-loamy, mixed frigid. Sweetwater Co, Wyoming (1). Black Mountain Exclosure. Location: 41°15.035′ N, 109° 37.257′ W.
Annual Precipitation: 188 mm (17 years of records); Mean Annual Air Temperature 6 °C; Mean Summer Air Temperature 19 °C;
Frost-free season is about 100 days annually. Elevation 1881 m.
Parent Material: Residuum. Topography: Gently sloping (1%), aspect-south.
Vegetation: Shadscale (Atriplex confertifolia), Spiny hopsage (Grayia spinosa), Indian ricegrass (Achnatherum hymenoides),
Bluebunch wheatgrass (Pseudoroegneria spicatum) 1. Rooting depth 91 cm
A110–108.18.90.64.94.51.1210YR 6/310YR 4/3SL1
A1210 to 158.39.10.51.441.4310YR 7/210YR 4/3SL3
B215–308.29.30.71.25.51.4110YR 5/410YR 4/4SL2
B3ca30–6489.95.41.27.51.382.5YR 5/42.5YR 4/4SL5
C1ca64–918.710101.2111.2410YR 6/410YR 5/6SL13
ENTISOL: Typic Torrifluvent; fine-silty, mixed, calcareous, frigid. Sweetwater Co, Wyoming. Boars Tusk Exclosure (swale position). Location: 41° 57.106′ N, 109° 14.789′ W.
Annual Precipitation: 195 mm (13 years of records); Mean Annual air Temperature 7°C; Mean Summer air Temperature 18.
Frost-free season is about 100 days annually. Elevation 2053 m.
Parent Material: Alluvium. Topography: Gently sloping (1 to 2%), aspect east.
Vegetation: Big Sagebrush (Atrimesia tridentata), Bluebunch Wheatgrass (Pseudoroegneria spicatum), Bottlebrush Squirreltail (Elymus elymoides) 1. Rooting depth 152 cm.
A110–87.78.50.76.117.51.0910YR 7/22.5YR 5/4SiL12
A128 to 2388.80.54.716.51.210YR 6/310yr 4/3L0
C123–617.98.70.52.423.11.2610YR 6/310YR 4/3SiCL1
C261–71890.91.517.51.3510YR 6/310yr 4/3L0
C371–1528.38.80.61.816.51.2810YR 6/310YR 4/3SiCL0
MOLLISOL: Aridic Calciboroll; fine-loamy, mixed. Lincoln Co, Wyoming. Cumberland Exclosure #3.
Location: 41°45.3′ N, 110°85.5′ W.
Annual Precipitation: 274 mm (15 years of records); Mean Annual Soil Temperature is 7 °C.
Frost free season is about 100 days annually. Elevation 2042 m.
Parent Material: Strongly calcareous, medium textured alluvium. Topography: 6 to 10% slope.
Vegetation: Big Sagebrush (Artemisia tridentata), Bluegrass (Poa sp.), western wheatgrass (Pascopyrum smithii), bluebunch wheatgrass (Pseudoroegneria spicatum) 1. Rooting depth 20 cm.
A110–87.48.10.59.971.210YR 4/210YR 3/2L21
A128 to 207.68.20.56.712.51.2710YR 5/210YR 3/2L20
C1ca20–337.98.30.55.117.51.410YR 5/310YR 3/3L28
C2ca33–977.98.80.51.951.51.1510YR 8/310YR 5/4L19
C3ca97–114 10YR 8/310YR 5/4L
Analytical characterization categories of the Aridisol below is as the soils above except for the relabeled columns.
pHpH Extract from saturation pasteSAR
1 to 11:10 CaMgNaK
meq/liter
ARIDISOL: Typic Natrargid. Cochise Co., Arizona. Pedon 58
Annual Precipitation: 250 mm. Mean annual air temperature is about 21 °C
Parent Material: Mixed alluvium from rhyolite, thyolite tuff, and andesite.
Vegetation: Alkali sacaton (Sporobolus airoides) with minor amounts of tobosa grass (Hilaria (now Plersaphis) mutica), mesquite shrubs (Prosobis sp.) and annual grasses 1.
A210–58.79.21.60.431.572.70.611.50.49
A225 to 139.29.71.250.29tr1.680.50.311.20.218
B2t13–2899.94.350.3861.561.10.341.30.149
Cca28–619.910.213.20.13151.7210.31590.3197
IIB2tcab61–1051010.216.70.07251.930.50.31980.5312
IIC1cab105–1309.910.2100.0321.740.50.51100.2155
IIC2casib130–2059.7105.160.0111.60.30.250.50.198
For methods of analysis for this Natrargid see [41].
Coarse Fragements in this soil: trace amounts in the top 3 horizons, and 1, 5, 12 and 7% respectively in the Cca through IIC2casib.
Dominant Musell Colors are by horizon from top, dry and Moist respectively: 10YR 6/2, 10Yr 4/2; 10YR 6/2, 10YR 4/2; 10YR 5/2, 10YR 4/2;
10YR 6/3, 10YR 7/2; 7.5YR 7/4, 7.5YR 6/6; 2.5YR 7/2, 2.5YR 5/2; and 2.5YR 5/6, moist not given. Textures from the top: SL, SL, CL, L, L, CL, LS/SL.
1 [52,53,54] (all 2004) used to confirm plant Latin names associated with soil descriptions above.
Table 4. Soils of the Gobi Desert. The Gobi in general has annual precipitation levels less than 100 mm per year. The area may go multiple years without measureable precipitation. The soils shown here were all collected in Omnogovi Imag (Tsogttsetsii Soum) north and east of Dalanzadgad.
AvailableDTPA Extractable
HorizonDepthpHECSOMCO3−2TOCSARTextureN03−2 (N)Total NKPCuFePbMnZn
cm dS/m%%% ppm%ppmppmppmppmppmppmppm
Methods of Soil analysis, See Footnote
[69,70,71] [72] [73] [49]Hand Tex. By author [74][75][76][77][78]
ENTISOL (putative Cryaquent). Area V. Elevation 1518 m. N 43.58984° E 105.45042°. This soil is in a zone where subsurface water is available and soil is wet most of the time. The surface soil was from a clay dune that accumulated around the docking agent Nitraria siberica, a succulent shrub. In addition to trapping aeolian clay and silt (42% and 32%, respectively), wind driven plant parts and animal feces also accumulate. About half of sample (vol) was organic debris that did not pass 2 mm. This results in the high organic matter of this soil. Vegetation: Nitraria siberica, Carex species, Agnatherium species, Chenopodium album, Allium polyrrhizum, and Allium mongolicum.
A10–77.53.337.96.23.74.08C1330.39855922.0213.01.7920.70.94
A27 to 418.21.043.46.90.56.07C0.30.17529252.2314.31.6413.8<0.05
On dilution 1 to 2.5, pHs were 7.8 and 8.6 from surface to depth.
No coarse fragments
INCEPTISOL (Putative Typic Cryochrept). Area III. Elevation 1418 m. N 43.91064° E 105.31042°. This is a typical soil for this part of the Gobi. Very young soil with a stony surface which strongly suggests soil fines are being or have been removed through wind deflation. Coarse fragments remain. Plants: Anabisis brevifolia, Stipa Krylovii, Allium polyrrhizum, Allium mongolicum, Salsola collina, Eurotia ceratoides, Peganum sp.
Coal Dust1 to 0 3.93.11.2 2.50.08
A0–208.00.720.54.1<0.11.30SC5.80.0527460.595.230.332.76<0.05
A/C20–368.00.51<0.14.8<0.12.73SL2.00.028440.492.420.272.25<0.05
C36–608.40.490.15.1<0.11.01SL0.50.025650.412.350.302.13<0.05
On dilution 1 to 2.5, pHs were 8.5, 8.6 & 8.8 from surface to depth
Coarse fragments 14, 12 & 3% from surface to depth
ENTISOL (Putative Typic Psamment). Area VI. Elevation 1520 m. N 43.71902° E 105.45882°. This is a common Gobi feature: sand docked around a shrub, here Nitraria siberica. Other plants adjacent to the dune include Stipa Krylovii, Allium polyrrhizum, Allium mongolicum &, Salsola collina. Dune and A contained 8% & 11%, respectively, coarse organic debris (wt).
Sand Dune30–08.01.820.91.31.83.89LS26.40.07333270.3212.40.296.14<0.05
A0–208.10.440.63.40.10.69SL2.40.04224100.444.290.382.86<0.05
On dilution 1 to 2.5, pHs were 8.0 & 8.4 from surface to depth.
Coarse fragments 0.3% in dune & none below.
ENTISOL (putative Arent). Area II. Elevation 1548 m. N 43.65244° E 105.46086°. This, a stockpiled Topsoil, had been in place about one year. There were no plants on this material.
A?0–207.82.851.85.60.37.31SCL14.40.05261100.794.540.367.73<0.05
A?20–607.92.901.55.80.29.96SCL3.10.0422080.884.130.456.59<0.05
A?60–1007.73.541.36.30.210.3SCL1.90.0421270.844.160.435.16<0.05
On dilution 1 to 2.5, pHs were 8.5, 8.5 & 8.6 from surface to depth
Coarse fragment were 22, 24 & 16% from surface to depth
ENTISOL (putative Arent). Area I. Elevation 1547 m. N 43.64709° E 105.47358°. This is a stockpiled topsoil and had been in place about three years. There were no plants on this material.
I-3 yr
A?0–207.82.040.33.80.13.16SL19.00.049370.433.050.322.89<0.05
A?20–608.10.48<0.13.4<0.11.40SL1.00.016870.292.280.241.52<0.05
A?60–1007.70.97<0.14.2<0.12.14SL2.00.015150.353.000.241.92<0.05
On dilution 1 to 2.5, pHs were 8.3, 8.6, 8.5 from surface to depth
Coarse fragments were 20, 27 & 22% from surface to depth
1. EPA, [69,70,71]. 2. Goh & Mermut, [72]. 3. Skjemstad and Baldock, [73]. 4. Salinity Laboratory Staff, [49]. 5. Hand textured by author. 6. Keeney and Nelsen, [74]. 7. Bremner & Mulvaney, [75]. 8. Knudsen et al., [76]. 9. Olsen and Sommers, [77] 10. Metals: DTPA extractable metals [78] were conducted mainly due to concerns about contamination of soils with various metals especially Hg. Illegal mining for especially Au in Mongolia (sometimes called artisan or ninja mining) may result in Hg contamination associated with processing in this uncontrolled activity. Total Hg, not shown, was below detection limits in all samples.
Table 5. Cold soils from Antarctica and adjacent Islands. Most of these soils have gelic materials within 200 cm of the surface.
HorizonDepthCoarseTexture as component %pHECBDTOCC:NTotal P
cmFragmentsor Descriptions(water)dS/mg/cc% %
(>2 mm)SandSiltClayexcept
%%%%where
other.
GELISOL: Typic Anhyorthel (75-06). This soil is an example from the McMurdo Dry Valleys which lie between 76° and 79° S and 158° to 170° E. MAAT varies from −20 °C to −35 °C and mean annual water equivalent is less than 10 to 100 mm. Derived from Bockheim and McLeod [83]. Used with permission from Springer Nature.
https://link.springer.com/book/10.1007/978-3-319-05497-1 (accessed 15 January 2024).
Bw10 to 1255Sand 6.64.7ndndndnd
Bw212 to 184596.92.30.86.61.6ndndndnd
Bw318–548594.43.32.35.31.2ndndndnd
Cn254–1152596.32.31.46.40.3ndndndnd
GELISOL: Lithic Folistel (137). Formed on gneiss with lichens and dry moss cushion. Soil is from near Casey Station (66°17′ S, 110°50′ E) on the Bailey Peninsula. Permafrost is continuous with an active layer of between 30 and 80 cm. Cryoturbation is prominent. MAAT of 0.3 °C for the warmest months and −14.9 °C for the coldest at the Casey Station. Mean annual water equivalent is 230 mm. MAAT between 1957 and 1983 was −9.3 °C and between 1989 and 2010 −5.8 °C. Derived from Blume and Bölter [84]. Used with permission from Springer Nature. https://link.springer.com/book/10.1007/978-3-319-05497-1 (accessed 15 January 2024).
CaCl2
LH0–30ndndnd4.73.50.32919nd
H13 to 86ndndnd3.92.80.4209.1nd
H28 to 169ndndnd3.80.80.6199.1nd
HC16 to 2821ndndnd3.80.4nd1612nd
NOTE: The letter designations for horizons here uses the pre-1970 terminology: L = litter, H = humis.
GELISOL: Lithic Anhyturbel (LA55-Rs-0I). Parent materials of the region where this soil was sampled is biotite and hornblend derived gneiss. The site is on an ice-free nunatak of volcanic origin. The underlying permafrost is likely ice cemented. Average air temperature is −12.4 °C with absolute minimum of −46.4 and absolute maximum of +7.4 °C. Annual precipitation is near 2000 mm. Climate data is from the “Russkaya” station nearby which is located on the Berks Cape of the Hobbs Coast (74°46′ S, 136°48′ W) and at an elevation of 148 m. The region experiences high winds throughout much of the year. Biota is mostly the lichen Usnea antarctica, although there are 26 other lichen species and four bryophytes known in the region. Table derived from Lupachev et al. [85]. Used with permission from Springer Nature. https://link.springer.com/book/10.1007/978-3-319-05497-1 (accessed 15 January 2024).
OC0 to 2ndndndndndndndndndnd
C12 to 7ndndndnd5.4ndnd0.91ndnd
C27 to 31ndndndnd5.3ndnd0.56ndnd
R31+ndndndnd5.4ndnd0.37ndnd
GELISOL: “Ornithogenic” Lithic Haploturbel. Elevation 40 m, on a moraine. This soil is on Llano point on King George Island parallel to the Antarctic Peninsula (approximately 62°S, 58°W). Parent materials are of volcanic origin. Mean annual air temperature is −2.2 °C and summer temperatures may exceed 0 °C for up to 4 months per year. Precipitation varies from 350 to 2000 on King George. Total phosphorus was calculated from data reported in mg/dm3. To convert to percent total P, a bulk density of 1.68 was used (average of six soil horizons described by Blume and Bolter, [84] to convert to a weight basis. Other ornithogenic soils on Llano point have total P contents from near 0.04% up to 0.25%. Table derived from Simas et al. [86]. Other Haploturbels (n = 2) that are not of ornithogenic influence have much lower organic carbon (average of 1% to 25 cm) and total phosphorus (0.007% to 25 cm) than the soil shown here. These other Haploturbels are located at the Casey Station (see soils 202 and 246 in Blume and Bolter, [84]. Used with permission from Springer Nature. https://link.springer.com/book/10.1007/978-3-319-05497-1 (accessed 15 January 2024).
in water
A0 to 10nd84884.5ndnd11.5nd0.015
BA10 to 20nd801374.8ndnd2.2nd0.03
B20 to 30nd761374.5ndnd1.9nd0.048
C30 to 40nd771784.3ndnd2.7nd0.071
Cr40 to 50nd7415104.5ndnd4.1nd0.058
HISTOSOL: Lithic Cryosaprist (CP09) Formed in muck in a bedrock depression. 89 m elevation. 0 slope. This soil is located on Cieva point on the Danco Coast of the Antarctic Peninsula (64°10′ S, 60°57′ W). Winter air temperatures average −5.2 °C, summer −1.2 °C. Average mean annual temperature across ten reporting stations on the peninsula is −4.3 °C. Precipitation averages 500 mm per year and varies from 300 to 1000 mm. Parent materials are till, scree and peat with underlying rocks of granites, granodiorites, granophyres and gabbro. Almost all soils on Cieva Point are highly impacted by sea birds and penguins (e.g., ornithogenic). This Histosol data and the Inceptisol and Entisol data following derived from Haus et al. [87]. Used with permission from Springer Nature. https://link.springer.com/book/10.1007/978-3-319-05497-1 (accessed 15 January 2024).
Oa10 to 18ndMuck5.30.014nd12.24140.49
Oa218 to 32ndMuck5.80.019 13.13120.55
Oa332 to 45ndVery gravelly muck5.80.014 11.93150.36
Oa445 to 80ndVery gravelly muckndnd ndndnd
2R80+ndrockndnd ndndnd
INCEPTISOL: Typic Humigelept (CP16) formed in peat from the Bryophyte (a turf forming moss) Polytrichum alpestre and colluvium. 45 m elevation and 40% slope. Location, climate and parent materials are the same as the Histosol above (CP09).
Oi10 to 11ndPeatndndnd31.81440.3
Oi211 to 19ndVery stony peatndndnd31.5260.59
A19 to 39ndExtremely gravelly coarse sand3.40.052nd4.88140.45
Bw39 to 62ndVery cobbly sandy loam3.60.045nd0.87110.43
BC62 to 75ndExtremely gravelly coarse sand3.60.06nd0.4590.3
ENTISOL: Typic Gelorthent (CP 12) formed in till on a solifluction lobe. Elevation 68 with 21% slope Location, climate and parent materials are the same as the Histosol above (CP09).
A10 to 4ndGravel6.30.628nd15.8944.72
A24 to 9ndGravel3.80.89nd13.3151.25
A39 to 25ndVery gravelly fine sandy loam3.50.176nd2.7361.09
E25 to 42ndVery gravelly loamy sand3.50.104nd0.3940.44
Bw142 to 53ndVery gravelly loamy sand3.40.073nd0.3460.32
Bw253 to 85ndVery gravelly loamy sand3.50.081nd0.4460.39
BC85+ndndndndndndndndndnd
Note: Soils on the South Orkney and South Shetland Islands, just off the coast of the Antarctic Peninsula have the full suite of cold soils including the several Gelisol suborders as well as Histosols, Entisols and Inceptisols [86].
Disclaimer/Publisher’s Note: The statements, opinions and data contained in all publications are solely those of the individual author(s) and contributor(s) and not of MDPI and/or the editor(s). MDPI and/or the editor(s) disclaim responsibility for any injury to people or property resulting from any ideas, methods, instructions or products referred to in the content.

