Article

Contribution of Photosynthetic, Root and Phenotypic Traits to Soybean Plant Height

College of Grassland, Resources and Environment, Inner Mongolia Agricultural University, Hohhot 010011, China
*
Author to whom correspondence should be addressed.
Sustainability 2024, 16(7), 2886; https://doi.org/10.3390/su16072886
Submission received: 17 February 2024 / Revised: 22 March 2024 / Accepted: 27 March 2024 / Published: 29 March 2024

Abstract

:
Breeding new high-yield and high-quality forage soybean cultivars is an effective approach to addressing the shortage of feed protein and sustainable agricultural development. Plant height is a key indicator of forage soybean genotypes and is closely related to forage yield. However, the determinants affecting soybean plant height remain highly uncertain. In order to analyze the factors contributing to plant height differences among soybean cultivars, two tall-stemmed soybean cultivars (“Neinong S001” and “Neinong S002”) and two short-stemmed soybean cultivars (“Neinong 0004” and “Neinong 0005”) were used in this study as test materials for examining aboveground phenotypic characteristics, root traits, and photosynthetic characteristics. The test materials were planted in 2018 at Chakintai Ranch (122°15′ E, 43°38′ N) using the potting method, and the indicators were measured in June. The results showed that the leaf area, root volume, and root surface area of high-stemmed soybean cultivars were significantly (p < 0.05) lower than those of short-stemmed soybean cultivars. Additionally, the dry weight of a single plant and transpiration rate were significantly (p < 0.05) higher in high-stemmed soybean cultivars compared to short-stemmed soybean cultivars. It was found that soybean plant height was significantly (p < 0.05) correlated with leaf area, leaf shape index, intercellular CO2 concentration, transpiration rate, SPAD, root weight, root length, root surface area, and root volume. Further path analyses revealed that intercellular CO2 concentration and root surface area had a direct impact on plant height, with direct effect coefficients of 0.22 and −0.91, respectively. These results provide new insights into the sustainability development and genetic enhancement of plant height characteristics in forage soybean.

1. Introduction

Soybean (Glycine max L.) is an annual legume that originated in China and was domesticated as one of the most important crops in agricultural production. Soybeans have high value not only as a food source but also as a raw material for various industrial products, bioenergy, and animal feed. In recent years, there has been a resurgence of interest in developing high-quality forage soybean cultivars [1,2,3]. This is due to the soybean being rich in proteins and other essential nutrients required by humans and livestock animals [4,5]. Additionally, they are adaptable and have a wide range of harvest periods [6,7]. To supplement high-protein feeds, numerous soybean cultivars have been developed for animal feed and are extensively cultivated in temperate, subtropical, and tropical regions [8,9,10]. In general, soybean cultivars with tall stems and late maturity are the best choices for becoming forage soybean cultivars because these traits tend to result in higher dry matter yields [9,11]. In soybean, the dominant stem structure is considered an important component of many high-yield cultivars [12]. Currently, the ideal height of commercially available soybean cultivars is typically 70–90 cm. Deviations from this height range, either shorter or taller, tend to lead to reduced grain yields [13,14]. Most forage soybean cultivars can reach a plant height of over 100 cm, while forage soybean cultivars in maturity groups V, VI, and VII can grow to over 150 cm [9,15,16]. The ideal plant structure often depends on the proper plant height. However, the key factors affecting soybean plant height remain uncertain.
Stem growth is a crucial factor in determining plant height. The growth habit of soybean stems is classified into three types: indeterminate, semi-determinate, and determinate. Cultivars with a determinate stem growth habit usually cease stem growth immediately after flowering and produce very short stems, often with long inflorescences at the terminal nodes, resulting in clusters of pods at the top [17,18]. In cultivars with an indeterminate stem growth habit, the stems persist for several weeks after flowering and produce tall, tapered stems with elongated top nodes [17,18]. Semi-determinate cultivars are a middle ground between indeterminate and determinate cultivars [17,18].
The plant height of the soybean is not only determined by genetic factors, but external conditions such as light, temperature, water, and fertilizer are also important factors [19,20,21,22]. Light is essential for photosynthesis, serving as the foundation for the accumulation of dry matter and the formation of yield. More than 95% of plant dry matter is derived from photosynthesis [23]. Moisture and fertilizer influence nutrient uptake by the root system, and the productivity of any plant in optimal or sub-optimal environments is typically determined by the distribution and structure of the root system [24]. The structure of the root system not only influences the uptake and accumulation of nutrients but also enhances photosynthesis by facilitating nitrogen uptake. On the other hand, increased photosynthesis may promote root growth [25]. The formation of forage yield and seed yield in soybean cultivars begins with the development of organs from germination (VE) to flowering (R1). The combined effect of these organs provides the necessary mechanisms for the production of assimilated biomass through photosynthesis and nutrient uptake.
Tall stems, as one of the dominant traits in forage soybean, can be utilized in marker-assisted breeding. However, compared to grain soybean and alfalfa, soybean has received less attention as a forage crop, resulting in limited research on forage traits. Moreover, the challenge of obtaining root traits has led to a predominant focus on the aboveground portion of soybean plants in studies investigating the factors influencing plant height formation [26,27]. Therefore, this study analyzed the differences in phenotypic characteristics, root traits, and photosynthetic characteristics between two tall-stemmed soybean cultivars and short-stemmed soybean cultivars. The aim was to discuss the relationship between aboveground and belowground traits and plant height in soybean and to analyze the important factors contributing to differences in plant height in soybean. The results of this study offer new insights for genetic improvement of plant height traits in forage soybean.

2. Materials and Methods

2.1. Plant Material

The test materials used in this study were soybean cultivars developed by the Grassland and Resource Environment College of Inner Mongolia Agricultural University (Table 1). In 2018, two tall-stemmed materials, “Neinong S001” (S001) and “Neinong S002” (S002), and two short-stemmed materials, “Neinong 0004” (0004) and “Neinong 0005” (0005), were selected under the same planting conditions (Table 1).

2.2. Experimental Site and Growth Conditions

All experiments were conducted in 2018 at Chajintai Ranch (122°15′ E, 43°38′ N), Kerqin Left-Wing Hou Banner, Tongliao City, Inner Mongolia, China. The ranch is situated in northeastern China, experiencing a temperate continental monsoon climate. The average annual rainfall in the region is about 400 mm, with June through August receiving 90% of the year’s precipitation. The average temperature in June is 23.5 °C. The experiment was conducted using the pot plant method to minimize root loss during sampling. Buried pots with dimensions of 35 cm in diameter and 35 cm in height were placed into the field and filled with topsoil from the same field. The soil was calcareous chestnut soil with 110 kg/hm2 of nitrogen, phosphorus, and potassium organic fertilizer (N:P:K = 3.0:4.6:1.3) applied. These pots were randomly buried in the field to replicate natural field growing conditions. Then, five seeds were sown in each pot, and two well-grown plants were retained at the seedling stage. This process was repeated 12 times. The plants were watered once a week after being planted to ensure the soil remained moist and were not fertilized during the growing season. All indicators were measured in June 2018 when the soybeans were in full bloom.

2.3. Measurement Indexes

2.3.1. Phenotypic Trait Indicators

Neatly flowered, uniformly sized plants were randomly selected from each pot for phenotypic trait measurements, and 10 replicates of each soybean genotype were chosen to determine plant height, stem diameter, number of internodes and dry weight per plant. The height from the base of the soybean to the tip of the leaf or top of the inflorescence was measured with a tape measure to determine plant height (PH). The stem diameter (SD) was determined by measuring the thickness of the first node of the stem base using a vernier caliper (150 mm, CHILON, Chengdu, China) with an accuracy of 0.02 mm. The internodes of the plants were counted to determine the number of internodes (NI). A DHG-9030A electrothermal oven thermostat blast was used from the Shanghai Yiheng Science and Technology Co., Ltd. (Shanghai, China). The plants were dried at 105 °C for 30 min, baked at 70 °C until a constant weight was achieved, and then weighed to determine the dry weight per plant. Three mature leaves of the plant were selected and placed on a LI 3100 portable leaf area meter (LICOR Inc., Lincoln, NE, USA) to measure leaf area (LA), leaf length and leaf width, and then the leaf shape index (LI) was calculated from the measurements [28].
Leaf shape index (LI):
Leaf shape index (LI) = leaf length/leaf width

2.3.2. Root Trait Indicators

When the root samples were taken, the pots were slowly rinsed under running water, with several washes to ensure that the soil on the roots was washed away, and then brought back to the lab. To prevent the loss of dislodged roots, the retrieved root samples were placed on a 100-mesh sieve, rinsed slowly under running water, and then thoroughly soaked in distilled water. Subsequently, soybean root traits were measured using an Expression 1680 desktop scanner (EPSON EXPRESSION 1680, Regent Instruments Inc., Quebec, QC, Canada). The scanned images were analyzed using an image analysis software package WinRHIZO Pro2007 (Regent Instruments Inc., Quebec, QC, Canada) to measure the root length, root surface area, and root volume. The roots were dried at 105 °C for 30 min, baked at 70 °C until a constant weight was achieved, and then weighed to determine the dry weight of the roots (DHG-9030A, Yiheng Science and Technology Co., Ltd., Shanghai, China).

2.3.3. Determination of Photosynthetic Indicators

The mature leaves of healthy, disease-free plants were chosen for the measurement of photosynthetic parameters using a Li-6400 portable photosynthesizer (LICOR Inc., Lincoln, NE, USA) from 9:00 a.m. to 11:00 a.m. on a sunny and windless day. Three plants were selected for each soybean cultivar, and three leaves were chosen from each plant. After the system had stabilized, photosynthetic indexes such as leaf net photosynthetic rate (NPR), transpiration rate (TR), stomatal conductance (SC), and intercellular CO2 concentration (IC) were measured simultaneously. The chlorophyll content was then measured using a self-calibrating chlorophyll meter (SPAD 502, Spectrum Technologies, Plainfield, IL, USA).

2.4. Statistical Analysis

Statistical analyses mainly included the following four procedures. First, the dry weight per plant, aboveground phenotypic characteristics (stem diameter, leaf area, leaf shape index, and number of internodes), root traits (root weight, root length, root volume, and root surface area), and photosynthetic characteristics (net photosynthetic rate, intercellular CO2 concentration, stomatal conductance, and transpiration rate) of different soybean cultivars were determined using one-way analysis of variance (ANOVA) and a least significant difference test (LSD). All data were presented as the mean ± standard deviation.
Second, Pearson correlation analysis was used to identify indicators of phenotypic trait characteristics, photosynthetic characteristics, and root traits that are linked to plant height. Thirdly, the explanatory power of the selected correlation indexes for plant height was determined using principal component analysis. All of the statistical analyses mentioned above were conducted using R statistical software version 4.1.2 (https://www.r-project.org/). The significance level was determined at p < 0.05.
Finally, we utilized path analysis to examine the direct and indirect effects of the selected indicators on plant height. We conducted the path analysis using SPSS software version 26.0 (SPSS Inc., Chicago, IL, USA).

3. Results

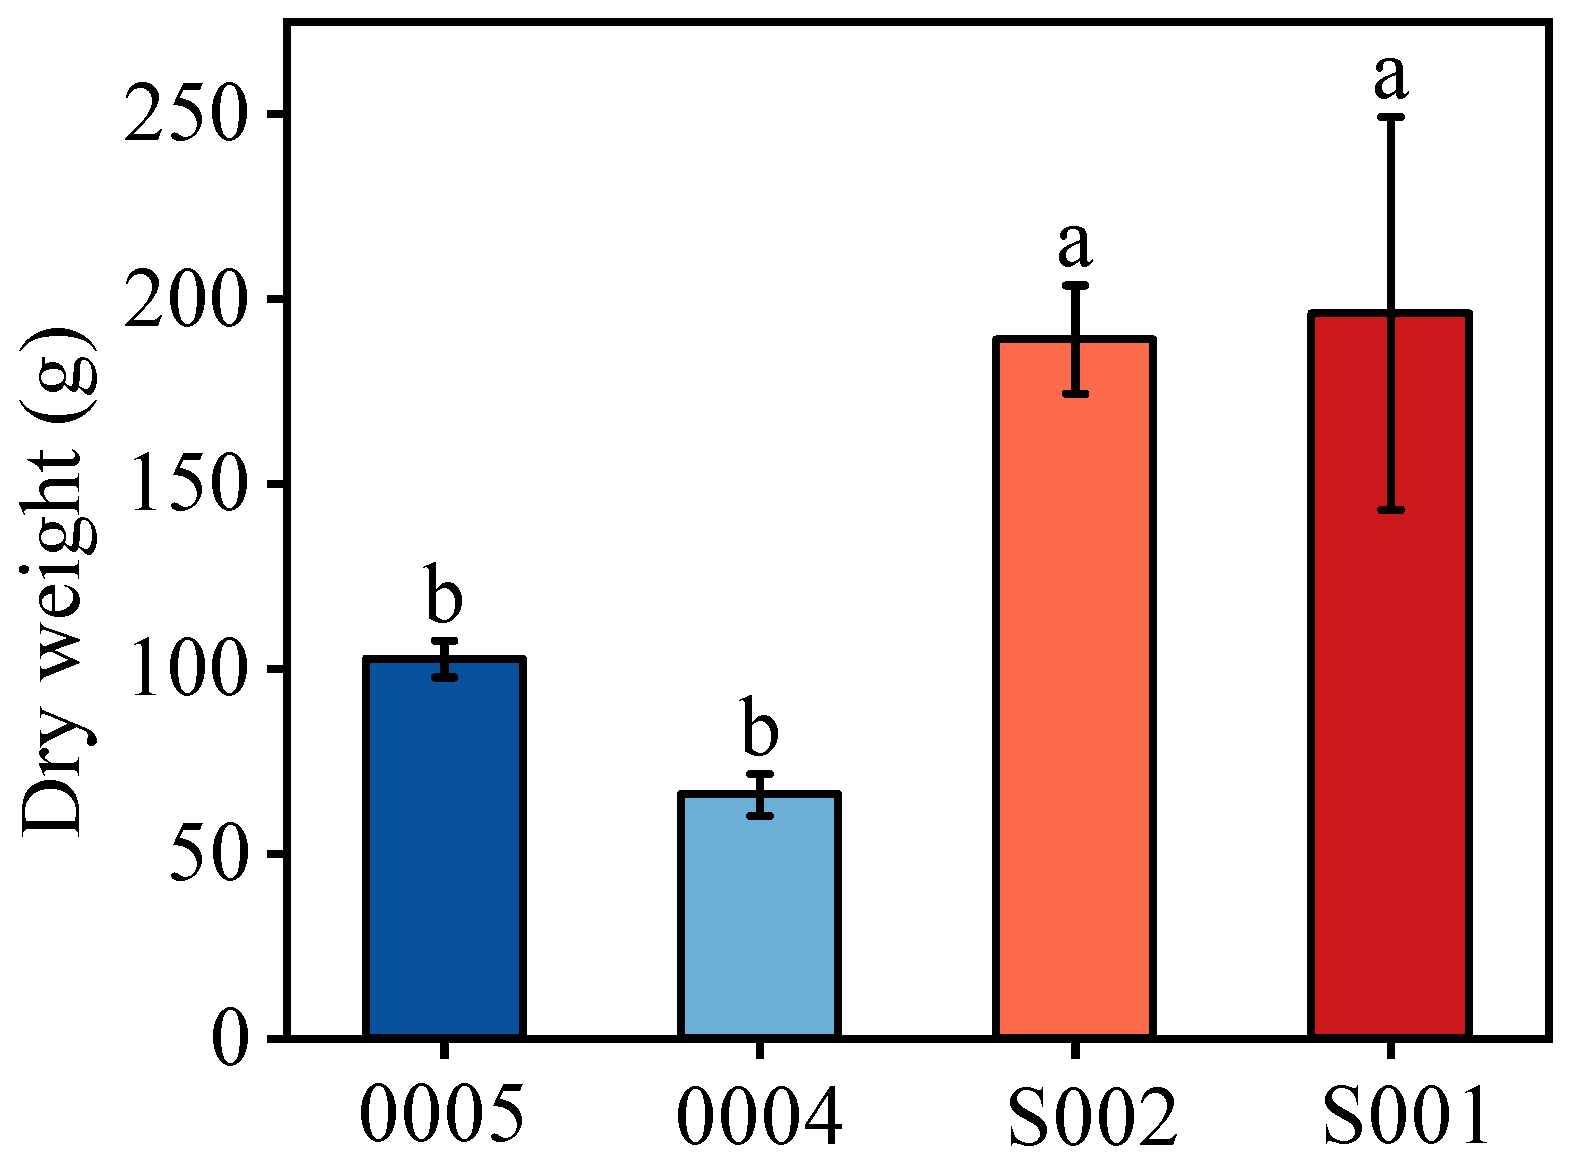
3.1. Dry Weight per Plant Differences between Tall and Short Soybean Cultivars

The dry weight per plant of the two tall-stemmed soybean cultivars was significantly greater (p < 0.05) than that of the short-stemmed soybean cultivars (Figure 1). The average dry weights per plant of the tall-stemmed soybean cultivars S002 and S001 were 196.1 g and 189.0 g, respectively, while the dry weight of the short-stemmed soybean cultivars 0005 and 0004 were 65.9 g and 102.7 g, respectively. The average dry weight per plant was 56.2% lower in short-stemmed soybean cultivars than in tall-stemmed soybean cultivars.

3.2. Aboveground Phenotypic Differences between Tall and Short Soybean Cultivars

There was a notable contrast in aboveground characteristics between tall- and short-stem cultivars of soybean (Figure 2). Compared to other soybean cultivars, the high-stemmed soybean S002 exhibited a significantly smaller stem diameter (Figure 2a) and a significantly higher leaf shape index (Figure 2b). The stem diameter of S002 was 25.2% smaller than the average stem diameter of the short-stemmed soybean cultivars The leaf shape index of S002 was 32% higher than the average leaf shape index of the short-stemmed soybean cultivars. The leaf area was significantly lower in the high-stemmed soybean cultivars compared to the short-stemmed soybean cultivars (Figure 2c). Furthermore, the number of internodes was significantly higher in the tall-stemmed soybean cultivar S001 compared to the other soybean cultivars (Figure 2d). The average leaf area of the tall-stemmed soybean cultivars was 60.13 cm3, while that of the short-stemmed soybean cultivars was 128.41 cm3, which was 53.17% lower than that of the short-stemmed soybean. The number of internodes in the high-stemmed soybean cultivar S001 was 33.76% higher than the average number of internodes in the short-stemmed soybean cultivar.

3.3. Root Traits of Different Soybean Cultivars

Measurements of soybean root traits showed significant differences between different soybean cultivars (Figure 3). The root weight and length of the high-stem soybean S002 were significantly lower than those of the other soybean cultivars. However, there were no differences between the other three soybean cultivars (Figure 3a,b). In addition, the root volume and root surface area were significantly lower in the high-stemmed soybean cultivars compared to the short-stemmed soybean cultivars (Figure 3c,d), with mean values reduced by 57.10% and 46.58%, respectively. In particular, the root surface area of the high-stemmed soybean S002 was significantly lower than that of S001 (Figure 3d).

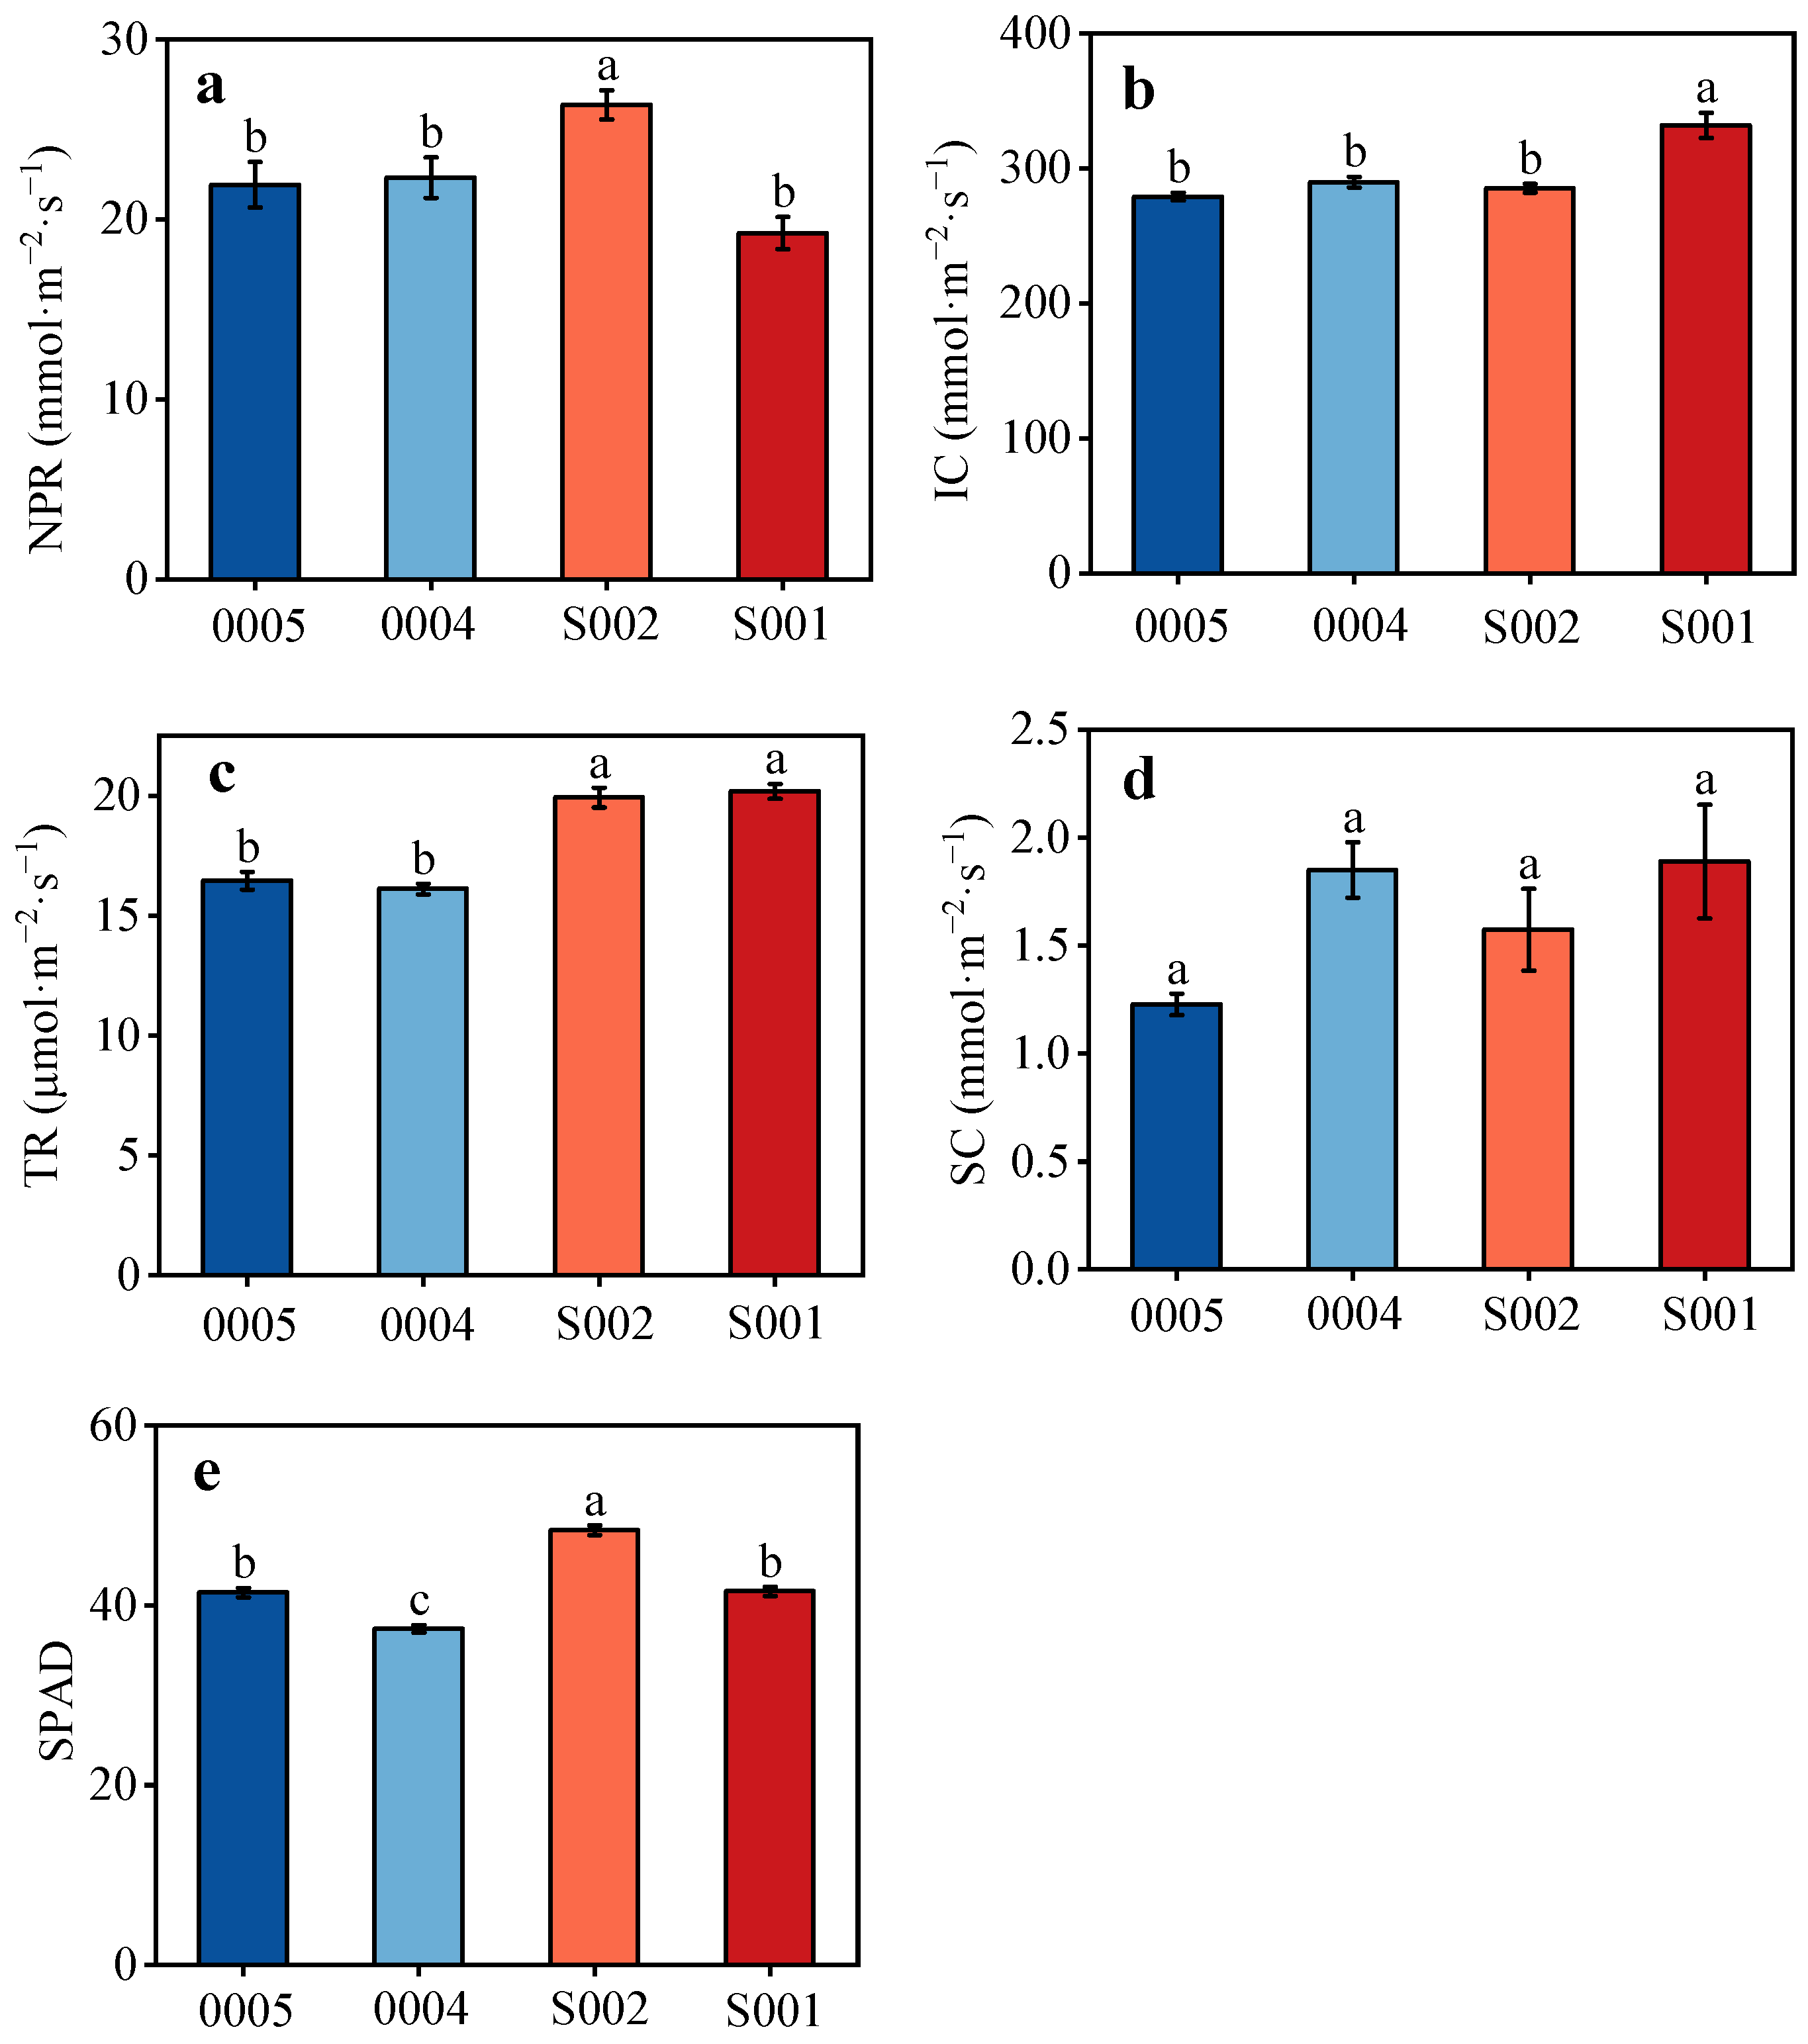
3.4. Photosynthesis Characteristics of Different Soybean Cultivars

Significant differences were observed in four photosynthetic traits between tall-stem and short-stem soybean cultivars (Figure 4). Among them, the net photosynthetic rate of the tall-stemmed soybean S002 was significantly higher than that of the other soybean cultivars (Figure 4a). In addition, the intercellular CO2 concentration of the tall-stemmed soybean S001 was significantly higher than that of the other soybean cultivars (Figure 4b). The transpiration rate of both tall-stemmed soybean cultivars was significantly higher than that of short-stemmed soybean cultivars, showing a 23.10% increase in the mean transpiration rate (Figure 4c). However, there was no significant difference in stomatal conductance between all soybean cultivars (Figure 4d). The chlorophyll content (SPAD values) of S002 was significantly higher than that of the other cultivars, while the values of 0004 were significantly lower. There was no significant difference between the chlorophyll content (SPAD) values of S001 and 0005 (Figure 4e).

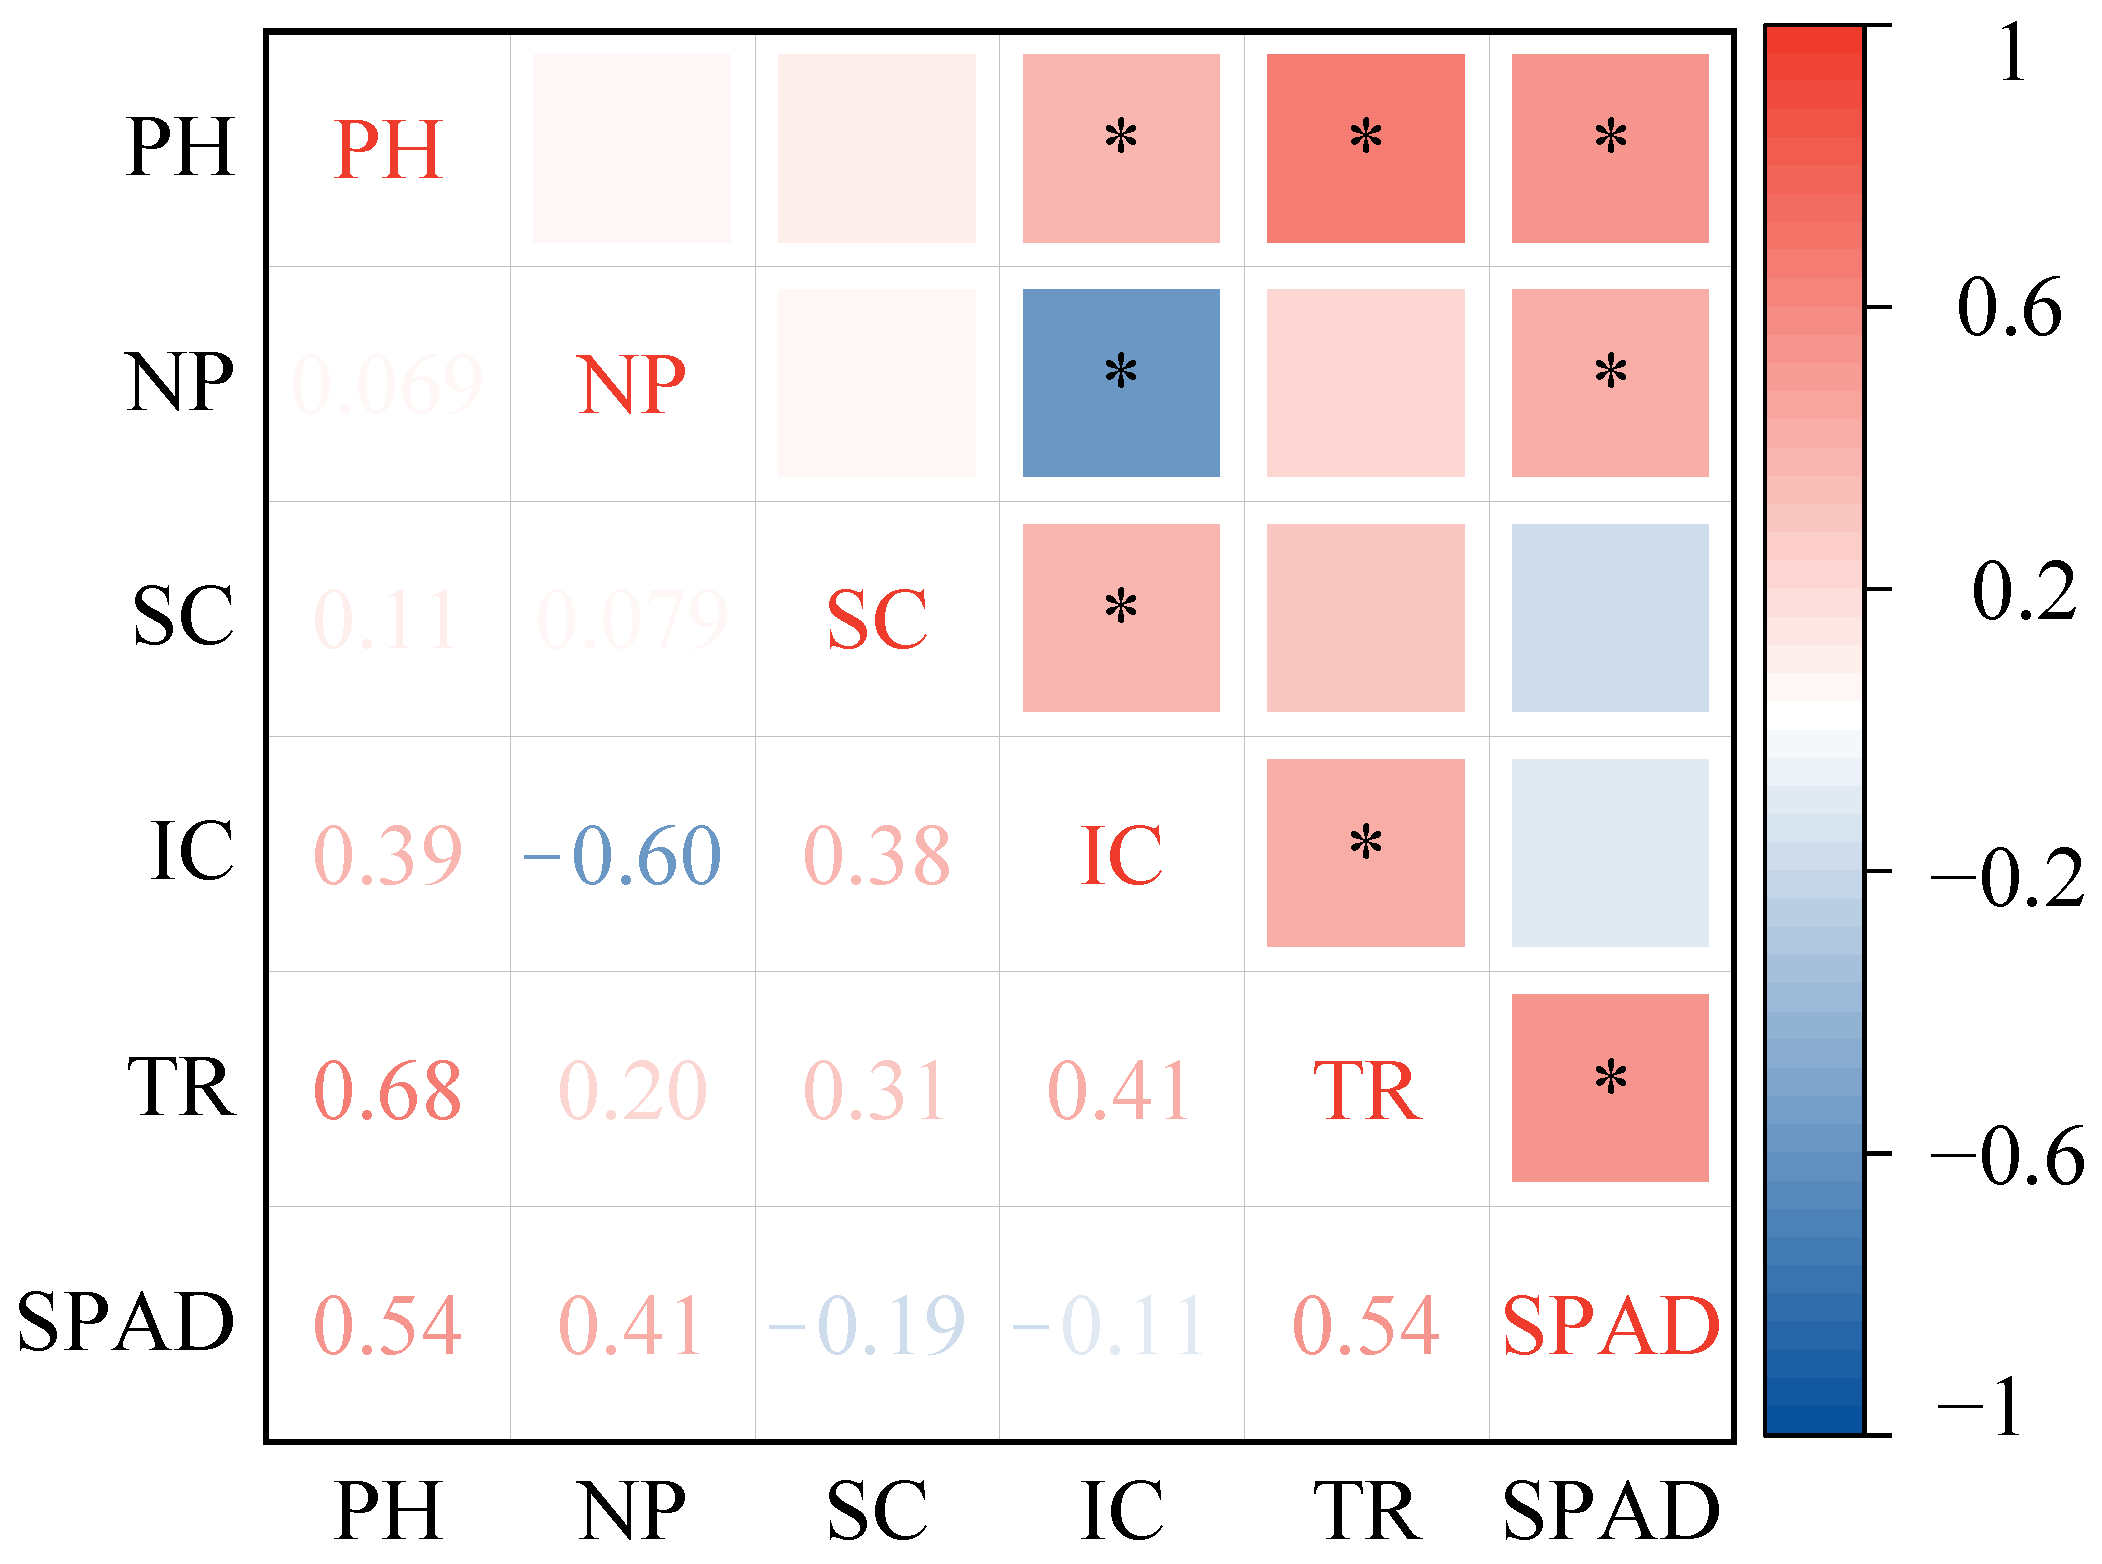
3.5. Correlation of Soybean Plant Height with Phenotypic and Photosynthetic Indicators

3.5.1. Correlation of Soybean Plant Height with Phenotypic Characteristics

Correlation analysis of all soybean cultivars with aboveground phenotypic traits revealed significant negative and positive correlations between soybean plant height and leaf area, and leaf shape index, respectively (Figure 5). The correlation coefficients were −0.87 and 0.75, respectively. In addition, the leaf area and leaf shape index were significantly negatively correlated, with a correlation coefficient of −0.73 (Figure 5).

3.5.2. Correlation of Soybean Plant Height with Root Traits

The results of the correlation analysis indicated that the plant height exhibited a significant negative correlation with four root traits. The order of correlation from largest to smallest is: root surface area > root volume > root length > root weight (Figure 6). In addition, there were significant positive correlations among four root traits that had a notable impact on plant height (Figure 6). The most significant correlation was observed between root surface area and root length, as well as root volume, with correlation coefficients of 0.93 for both. The lowest correlation was found between root volume and root weight, as well as between root volume and root length, with correlation coefficients of 0.76 for both pairs.

3.5.3. Correlation of Soybean Plant Height with Photosynthetic Characteristics

The results of the correlation analysis indicate that the intercellular CO2 concentration, transpiration rate and chlorophyll content (SPAD value) significantly affected the height of soybean plants (Figure 7). These three indicators were positively correlated with plant height, with correlation coefficients of 0.39, 0.68, and 0.54, respectively. Additionally, the intercellular CO2 concentration was significantly and positively correlated with the stomatal conductance and transpiration rate. This suggests that the stomatal conductance and transpiration rate have a positive impact on intercellular CO2 concentration. However, a significant negative correlation was found between the intracellular CO2 concentration and net photosynthetic rate. The chlorophyll content (SPAD values) was positively correlated with the net photosynthetic rate as well as the transpiration rate, indicating a positive effect of the chlorophyll content on these two indicators.

3.6. Principal Component Analysis of Soybean Plant Height, Phenotypic Traits, and Photosynthetic Characteristics

The results of correlation analysis were used to screen the traits significantly associated with soybean plant height, including two aboveground phenotypic traits, four root traits and three photosynthetic indicators (Figure 8). Therefore, a principal component analysis was performed to characterize the degree of interpretation of the degree of explanation for the soybean plant height based on nine indicators, including the leaf area, leaf shape index, root surface area, root volume, root length, root weight, intercellular CO2 concentration, transpiration rate, and chlorophyll content (SPAD value). The results showed that the first and second principal components together explained 91.5% of the variation in soybean plant height. In addition, significant and widely distributed differences between tall-stemmed and short-stemmed soybean cultivars indicated that there were significant differences in traits affecting soybean plant height. Among them, the intercellular CO2 concentration, leaf shape index, and chlorophyll content (SPAD value) had a greater effect on tall-stemmed soybean S001 and S002, respectively. Short-stemmed soybean cultivars 0004 and 0005 are strongly correlated with the root surface area, root volume, and leaf area (Figure 8).

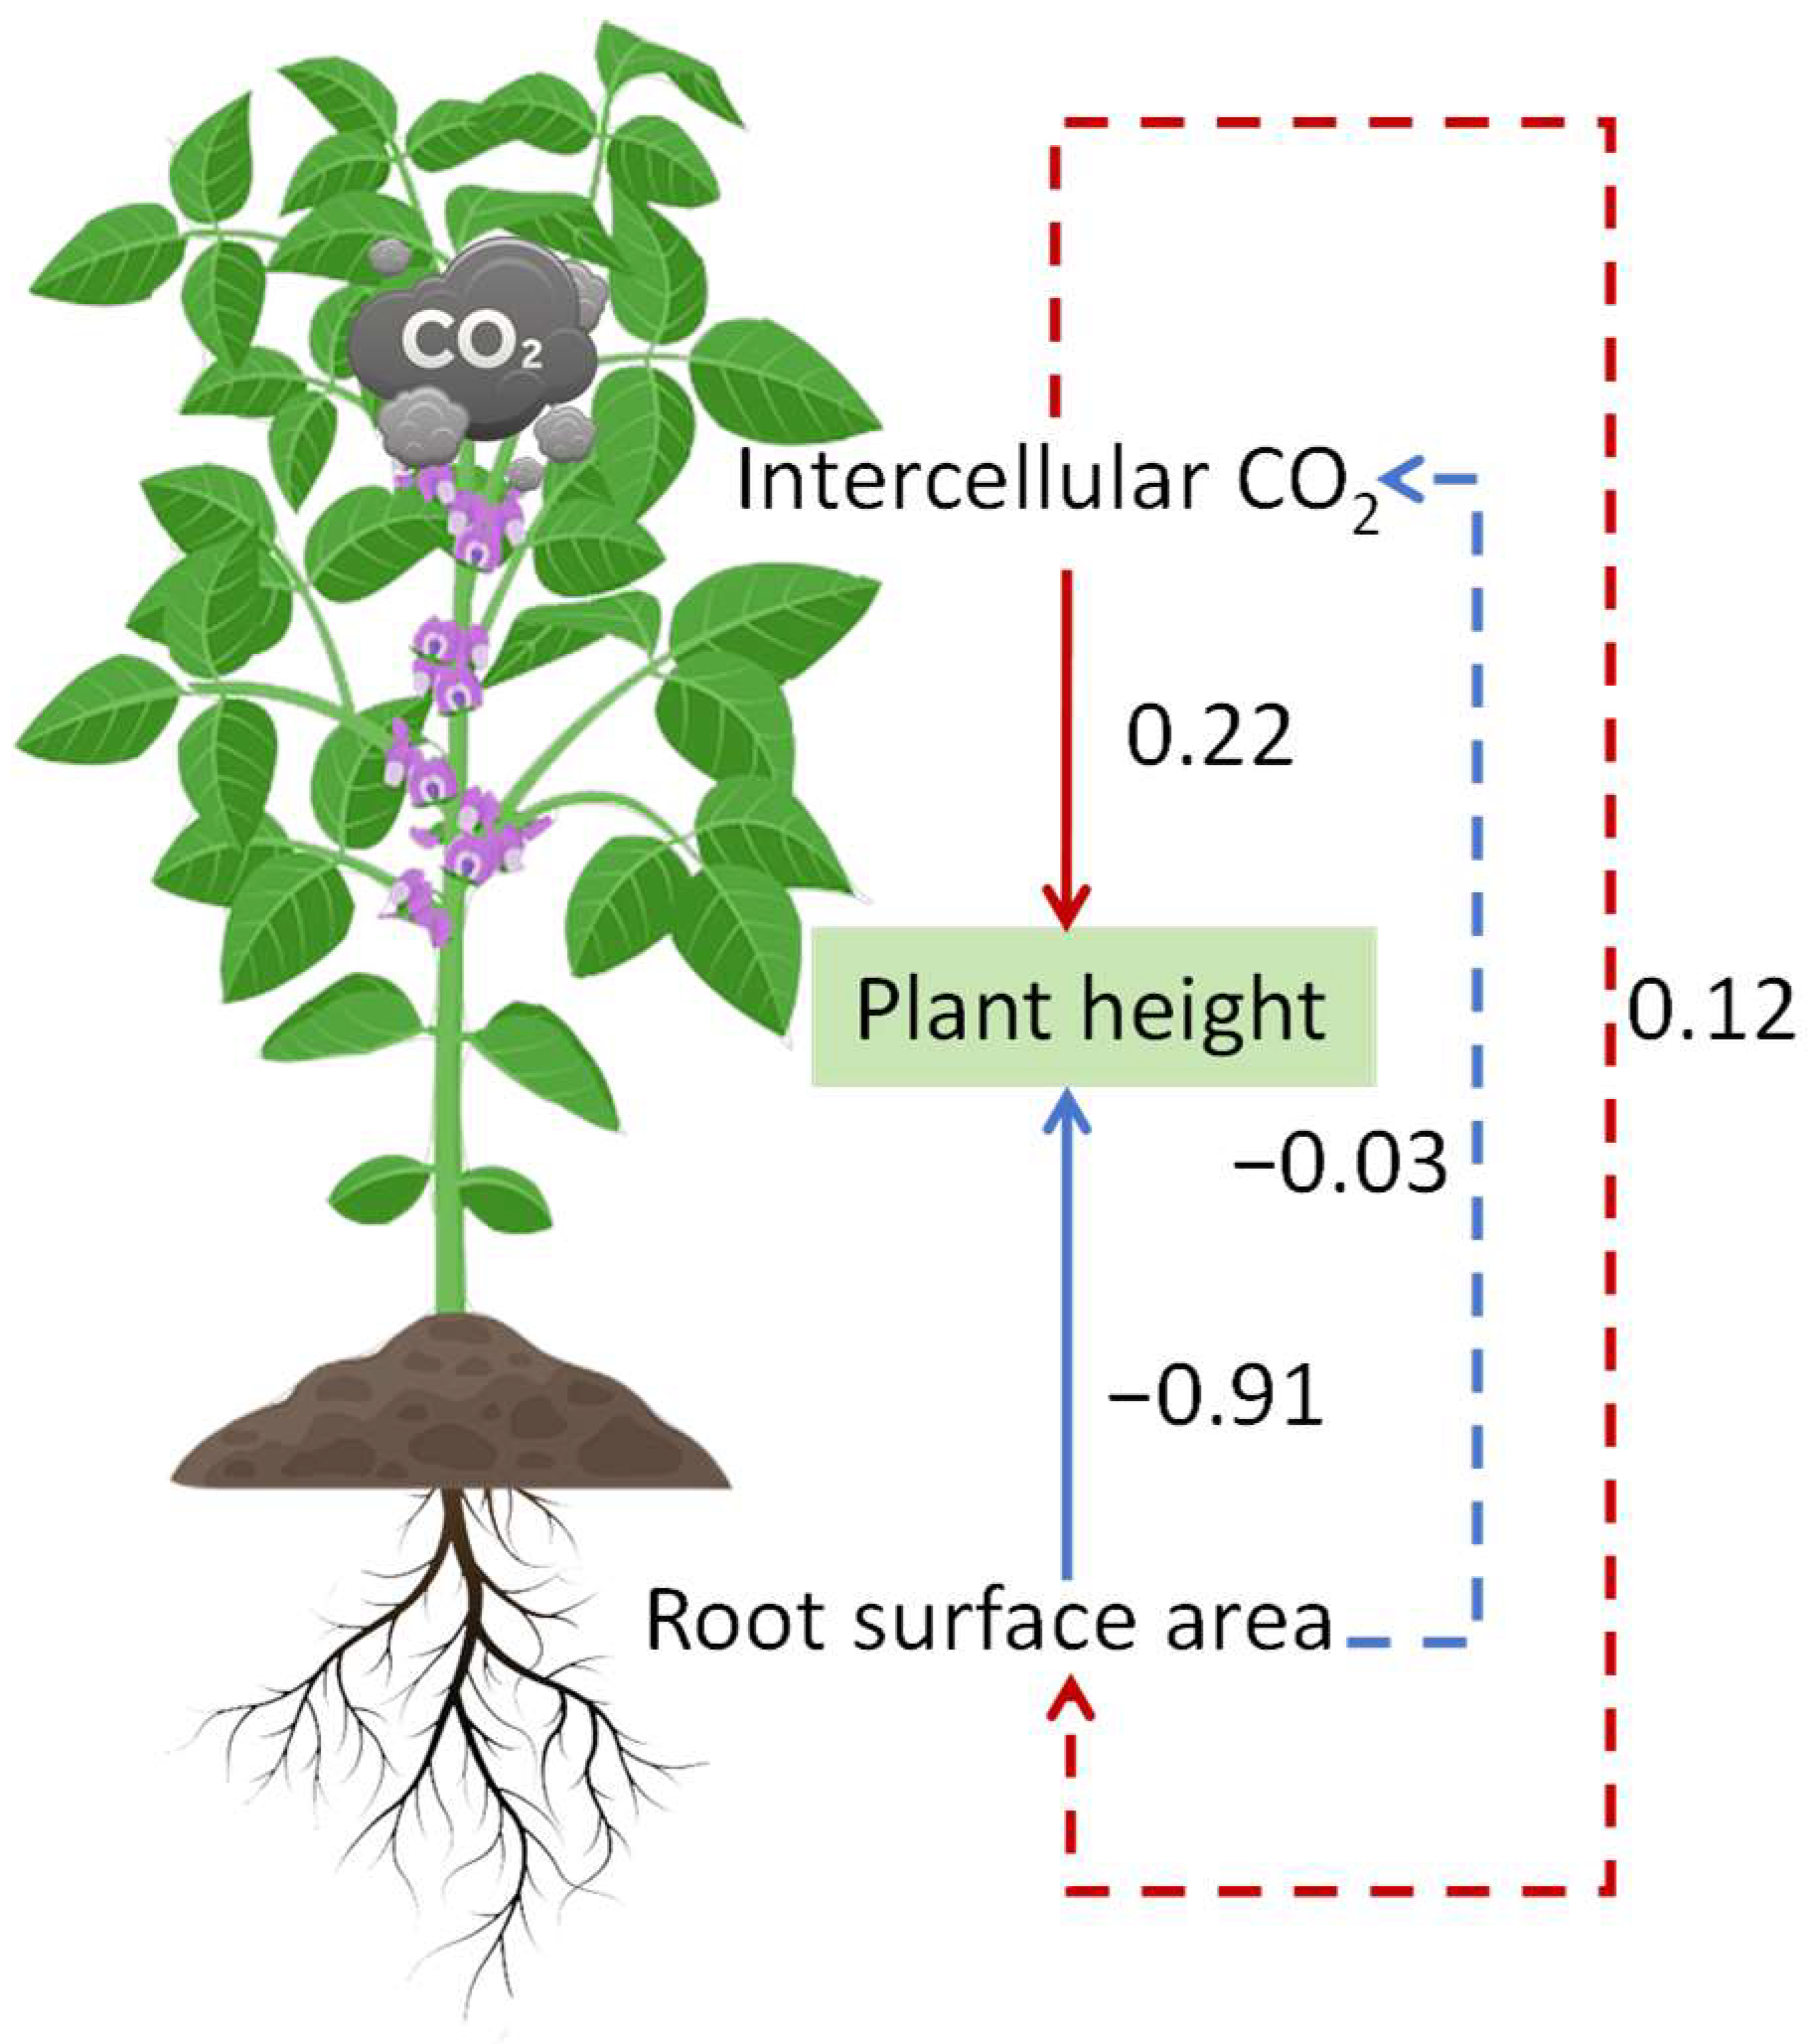
3.7. Role of Phenotypic Traits and Photosynthetic Characteristics in the Height of Soybean

The results of the path analysis of the phenotypic traits and photosynthetic indicators that significantly affected soybean plant height showed that seven indicators were excluded, and the other two indicators that affected plant height were the root surface area and intercellular CO2 concentration (Figure 9). The intercellular CO2 concentration had a positive effect on soybean plant height and the root surface area had a negative effect on soybean plant height, with direct path coefficients of 0.22 and −0.91, respectively. The negative effects of the root surface area on plant height are greater than the positive effects of intercellular CO2 concentration. Intercellular CO2 concentration had an indirect positive effect on plant height through its effect on the root surface area, with an indirect path coefficient of 0.12. The root surface area had an indirect negative effect on plant height by influencing the intercellular CO2 concentration with an indirect path coefficient of −0.03.

4. Discussion

4.1. The Phenotypic Traits Affecting Forage Soybean Plant Height

Understanding the correlations between various traits in plant breeding is important because strong selection for one trait can impact other traits in desired or undesired directions [29]. The genetic advancement of traits with low genetic variability can be accomplished through indirect selection when the strength and direction of the association between traits are known [29]. Cultivars with tall stems are the best choice for growing feed soybeans because they result in a higher dry matter yield [11]. The results of the present study support the notion that the dry weight per plant was significantly higher in tall-stemmed soybean cultivars compared to short-stemmed soybean cultivars.
The leaf is an important indicator of genetic traits in forage production, influencing nutrient harvesting and affecting forage crop yield, quality, and population canopy structure [30]. Increasing the number of leaves or the leaf area of forage soybean cultivars can effectively enhance the photosynthetic leaf area, leading to improved photosynthetic utilization, enhanced dry matter accumulation, and ultimately higher feed yield [31]. The results of this study showed that the leaf area of tall-stemmed soybean cultivars was significantly lower than that of short-stemmed soybean cultivars. There was a negative correlation between plant height and leaf area, and a strong positive correlation with leaf shape index in soybean. Research has demonstrated that soybean cultivars with various leaflet shapes (ovate, lanceolate, and linear) display significant variability in plant height [32]. The reason for this situation may be that cultivars with lanceolate leaves and a small leaf area have better canopy light distribution than the cultivars with large ovoid leaves, allowing for higher photosynthetic rates [32,33]. In addition, the leaf shape has a significant impact on tolerance to deciduousness, with narrower leaflets being more resistant [34]. The results of the path analysis in this study indicated that the aboveground phenotypic traits of soybean did not have a direct effect on plant height. Therefore, the leaf area and leaf shape index may indirectly affect plant height through photosynthesis.

4.2. The Root Traits Affecting Forage Soybean Plant Height

The root system serves as the gateway for plant nutrient and water uptake and provides the foundation for synthesizing organic matter. Therefore, studying root characterization helps to scientifically evaluate yields and guide the precise implementation of agronomic measures. Several studies have established the connection between root traits and crop productivity [35,36]. Significant differences in root traits were observed between tall- and short-stem cultivars in this study. The root volume and root surface area of soybean were significantly lower in tall-stem cultivars compared to short-stem cultivars. Correlation analysis revealed a significant negative correlation between plant height and root weight, root length, root volume, and root surface area. A similar result was obtained in the study by Harrison Gregory Fried [25]. The pathway analysis results revealed that the root surface area directly negatively affected plant height and also indirectly influenced plant height through its impact on the intercellular CO2 concentration. This is because access to resources above and below ground is often considered to be mutually constraining. Studies on resource acquisition and plant growth under dual resource constraints have focused on biomass allocation [37,38]. Growth maximization is considered to result from optimal biomass allocation to different organs [37,38]. It is clearly impossible for a plant to allocate more biomass to both its leaf and root systems, so plant height and root traits were negatively correlated in this study. There were significant positive correlations among the four root traits: root volume, root length, and root weight. Although these traits do not directly affect plant height, they could still have an indirect effect on plant height through the root surface area.

4.3. The Photosynthetic Indicators Affecting Forage Soybean Plant Height

Plant growth, development, and yield depend on the photosynthetic capacity of individual plants and populations. Net photosynthetic rate, stomatal conductance, intercellular CO2 concentration, transpiration rate, and chlorophyll content are important indicators that affect the physiological activities of plant photosynthesis. They play key roles in the formation of plant yield and quality [39]. A higher net photosynthetic rate indicates a plant’s greater ability to photosynthesize. It has also been shown that a shorter plant height diminishes the permeability of plant populations, reduces the rate of light energy absorption by leaves, affects the transport of photosynthetically active products, and decreases biomass [40]. The results of the present study show that the monocot biomass was significantly higher in the high-stemmed varieties than in the low-stemmed varieties, but the net photosynthetic rate did not follow the same trend. The chlorophyll content had a significant positive effect on both the net photosynthetic rate and plant height. However, there was no significant correlation between the net photosynthetic rate and plant height, possibly attributable to the varying biomass allocation mechanisms between different soybean cultivars.
The transpiration rate not only represents the plant’s ability to regulate the water balance but also reflects, to some extent, the ability of photosynthesis. An increased transpiration rate and stomatal conductance have a positive effect on the exchange of water vapor from the external environment to the plant, promoting the uptake of carbon dioxide for photosynthesis [41]. This observation was also evident in the present study, where the intercellular CO2 concentration showed a significant and positive correlation with the stomatal conductance and transpiration rate. This indicates that the stomatal conductance and transpiration rate positively influenced the intercellular CO2 concentration. The photosynthetic capacity of a leaf depends on both the supply of CO2 to the chloroplasts from the atmosphere and the fixation of CO2 in the chloroplasts. Studies on the photosynthetic capacity of soybean cultivars have shown that the CO2 fixation capacity is the primary factor contributing to the high photosynthetic capacity of soybean cultivars, rather than the supply of CO2 [42]. Similar results were obtained in this study, where the intercellular CO2 concentration of soybean leaves had a direct positive effect on the plant height and an indirect positive effect on the root surface area in the path analysis results. However, the accumulation of starch in chloroplasts may inhibit photosynthesis by impeding the diffusion of CO2 at elevated CO2 concentrations [43]. The high intercellular CO2 concentration in S001, which was the highest in this study, may be the reason for its lowest net photosynthesis rate.

5. Conclusions

In the present study, it was found that the leaf area, root volume, and root surface area were significantly larger, while the dry weight per plant and transpiration rate were significantly lower in soybean cultivars with shorter stems compared to soybean cultivars with taller stems. Correlation analysis revealed a significant positive correlation between the soybean plant height and leaf shape index, intercellular CO2 concentration, transpiration rate, and SPAD. Conversely, there was a negative correlation between the plant height and leaf area, root surface area, root volume, root length, and root weight. According to the results of path analysis, only the intercellular CO2 concentration in soybean leaves had a direct positive effect on plant height, while only the root surface area had a direct negative effect on soybean plant height. In summary, this study analyzed the differences in soybean plant height in relation to aboveground phenotypic traits, root traits, and photosynthesis. It provides a phenotypic and physiological basis for the genetic improvement and sustainability of forage soybean cultivars.

Author Contributions

Conceptualization, R.S. and M.W.; methodology, T.Z.; software, R.S. and T.Z.; investigation, R.S.; data curation, R.S. and M.W.; writing—original draft preparation, R.S.; writing—review and editing, M.W.; supervision, M.W.; funding acquisition, M.W. All authors have read and agreed to the published version of the manuscript.

Funding

This research was funded by 2023 Important Innovation Platform Construction Project of National Center of Pratacultural Technology Innovation (under way), (CCPTZX2023B10).

Institutional Review Board Statement

Not applicable.

Informed Consent Statement

Not applicable.

Data Availability Statement

The data presented in this study are available upon request from the corresponding author.

Acknowledgments

We are grateful to Tang Fang from Inner Mongolia Agricultural University for provided support. We are grateful to Na Wang, Liansheng Wang, Jiawei Liu, Yuqian Du, and Kefan Cao of Inner Mongolia Agricultural University for all their help during the experiment.

Conflicts of Interest

The authors declare no conflicts of interest.

References

  1. Rizzo, G.; Luciana, B. Soy, Soy Foods and Their Role in Vegetarian Diets. Nutrients 2018, 1, 43. [Google Scholar] [CrossRef]
  2. Islam, I.; Adam, Z.; Shahidul, I. Soybean (Glycine max): Alternative Sources of Human Nutrition and Bioenergy for the 21st Century. J. Food Sci. Technol. 2019, 7, 1–6. [Google Scholar] [CrossRef]
  3. Pretto, C.D.; Giordano, R.d.L.C.; Tardioli, P.W.; Caliane, B.B.C. Possibilities for Producing Energy, Fuels, and Chemicals from Soybean: A Biorefinery Concept. Waste Biomass Valorization 2018, 9, 1703–1730. [Google Scholar] [CrossRef]
  4. Azam, M.; Zhang, S.; Qi, J.; Abdelghany, A.M.; Shaibu, A.S.; Ghosh, S.; Feng, Y.; Huai, Y.; Gebregziabher, B.S.; Li, J.; et al. Profiling and associations of seed nutritional characteristics in Chinese and USA soybean cultivars. J. Food Compos. Anal. 2021, 98, 103803. [Google Scholar] [CrossRef]
  5. Nielsen, D.C. Forage Soybean Yield and Quality Response to Water Use. Field Crop Res. 2011, 3, 400–407. [Google Scholar] [CrossRef]
  6. Rogers, J.; Florez-Palacios, L.; Chen, P.Y.; Orazaly, M.; Jaureguy, L.M.; Zeng, A.L.; Wu, C.J. Evaluation of Diverse Soybean Germplasm for Forage Yield and Quality Attributes. Crop Sci. 2017, 2, 1020–1026. [Google Scholar] [CrossRef]
  7. Lee, E.J.; Choi, H.J.; Shin, D.H.; Kwon, C.H.; Shannon, J.G.; Lee, J.D. Evaluation of Forage Yield and Quality in Wild Soybeans (Glycine Soja Sieb. and Zucc.). Plant Breed. Biotechnol. 2014, 2, 71–79. [Google Scholar] [CrossRef]
  8. Kökten, K.; Seyithan, S.; Mahmut, K.; Erkan, B. Forage Nutritive Value of Soybean Varieties. Legume Res. 2011, 37, 201–206. [Google Scholar] [CrossRef]
  9. Darmosarkoro, W.; Harbur, M.M.; Buxton, D.R.; Moore, K.J.; Devine, T.E.; Anderson, I.C. Growth, Development, and Yield of Soybean Lines Developed for Forage. Agron. J. 2001, 5, 1028–1034. [Google Scholar] [CrossRef]
  10. Koivisto, J.; Devine, T.; Lane, G.; Sawyer, C.; Brown, H. Forage Soybeans (Glycine max (L.) Merr.) in the United Kingdom: Test of New Cultivars. Agronomie 2003, 4, 287–291. [Google Scholar] [CrossRef]
  11. Asekova, S.; Shannon, J.G.; Lee, J.D. The current status of forage soybean. Plant Breed. Biotechnol. 2014, 2, 334–341. [Google Scholar] [CrossRef]
  12. Liu, S.L.; Zhang, M.; Feng, F.; Tian, Z.X. Toward a Green Revolution for Soybean. Mol. Plant. 2020, 5, 688–697. [Google Scholar] [CrossRef]
  13. Huang, Z.W.; Wang, W.; Xu, X.J.; Wen, Z.X.; Li, H.C.; Li, J.Y.; Lu, W.G. Relationship of Dynamic Plant Height and Its Relative Growth Rate with Yield Using Recombinant Inbred Lines of Soybean. Acta Agron. Sin. 2011, 3, 559–562. [Google Scholar] [CrossRef]
  14. Josie, J.; Alcivar, A.; Rainho, J.; Kassem, A. Genomic Regions Containing QTL for Plant Height, Internodes Length, and Flower Color in Soybean [Glycine max (L.) Merr]. Bios. 2007, 4, 119–126. [Google Scholar] [CrossRef]
  15. Acikgoz, E.; Sincik, M.; Oz, M.; Albayrak, S.; Wietgrefe, G.; Turan, Z.M.; Goksoy, A.T.; Bilgili, U.; Karasu, A.; Tongel, O. Forage Soybean Performance in Mediterranean Environments. Field Crop Res. 2007, 3, 239–247. [Google Scholar] [CrossRef]
  16. Sheaffer, C.C.; Orf, J.H.; Devine, T.E.; Jewett, J.G. Yield and Quality of Forage Soybean. Agron. J. 2001, 1, 99–106. [Google Scholar] [CrossRef]
  17. Xiong, S.S.; Guo, D.D.; Wan, Z.; Quan, L.; Lu, W.T.; Xue, Y.; Liu, B.; Zhai, H. Regulation of soybean stem growth habit: A ten-year progress report. Crop J. 2023, 11, 1642–1648. [Google Scholar] [CrossRef]
  18. Kim, J.H.; Scaboo, A.; Pantalone, V.; Li, Z.; Bilyeu, K. Utilization of Plant Architecture Genes in Soybean to Positively Impact Adaptation to High Yield Environments. Front. Plant Sci. 2022, 13, 891587. [Google Scholar] [CrossRef]
  19. Zhang, L.; Allen, L.H., Jr.; Vaughan, M.M.; Hauser, B.A.; Boote, K. Solar Ultraviolet Radiation Exclusion Increases Soybean Internode Lengths and Plant Height. Agric. Meteorol. 2014, 184, 170–178. [Google Scholar] [CrossRef]
  20. Yang, Q.; Lin, G.; Lv, H.Y.; Wang, C.H.; Yang, Y.Q.; Liao, H. Environmental and Genetic Regulation of Plant Height in Soybean. BMC Plant Biol. 2021, 21, 63. [Google Scholar] [CrossRef]
  21. Mustapha, Y.; Biwe, E.R.; Salem, A. Effects of Moisture Stress on the Growth Parameters of Soybean Genotypes. Discourse J. Agr. Food Sci. 2014, 2, 142–148. [Google Scholar]
  22. Servani, M.; Mobasser, H.; Sobhkhizi, A.; Adibian, M.; Noori, M. Effect of Phosphorus Fertilizer on Plant Height, Seed Weight and Number of Nodes in Soybean. Int. J. Plant Anim. Environ. Sci. 2014, 2, 696–700. [Google Scholar]
  23. He, H.F.; Yan, C.H.; Wu, N.; Liu, J.L.; Jia, Y.H. Effects of Different Nitrogen Levels on Photosynthetic Characteristics and Drought Resistance of Switchgrass (Panicum virgatum). Acta Prataculturae Sin. 2021, 30, 107. [Google Scholar] [CrossRef]
  24. Bengough, A.G.; McKenzie, B.M.; Hallett, P.D.; Valentine, T.A. Root Elongation, Water Stress, and Mechanical Impedance: A Review of Limiting Stresses and Beneficial Root Tip Traits. J. Exp. Bot. 2011, 1, 59–68. [Google Scholar] [CrossRef] [PubMed]
  25. Fried, H.G.; Narayanan, S.; Fallen, B. Characterization of a Soybean (Glycine max L. Merr.) Germplasm Collection for Root Traits. PLoS ONE 2018, 7, e0200463. [Google Scholar] [CrossRef] [PubMed]
  26. Xue, A.; Zhao, M.H.; Qian, Z.; Jie, L.; Zhang, H.J.; Wang, H.Y.; Yu, C.M.; Li, C.H.; Yao, X.D.; Xie, F.T. Study on Plant Morphological Traits and Production Characteristics of Super High-Yielding Soybean. J. Integr. Agric. 2013, 7, 1173–1182. [Google Scholar] [CrossRef]
  27. Lu, Y.P.; Zhang, J.M.; Guo, X.Y.; Chen, J.J.; Chang, R.Z.; Guan, R.X.; Qiu, L.J. Identification of Genomic Regions Associated with Vine Growth and Plant Height of Soybean. Int. J. Mol. Sci. 2022, 10, 5823. [Google Scholar] [CrossRef] [PubMed]
  28. Tsukaya, H. The Leaf Index: Heteroblasty, Natural Variation, and the Genetic Control of Polar Processes of Leaf Expansion. Plant Cell Physiol. 2002, 43, 372–378. [Google Scholar] [CrossRef] [PubMed]
  29. Hallauer, A.R. History, Contribution, and Future of Quantitative Genetics in Plant Breeding: Lessons from Maize. Crop Sci. 2007, 27, S4–S19. [Google Scholar] [CrossRef]
  30. Wang, J.; Liu, X.J.; Cheng, T.T.; Tong, C.C.; Xue, W. Study on Leaf Characteristics and Yield Effect of Alfalfa with Different Nitrogen Efficiency. Acta Agrestia Sin. 2021, 9, 1941. [Google Scholar] [CrossRef]
  31. Sun, Z.Q.; Xu, F.; Zhang, Y.Q.; Hai, G.; Yang, C.Y.; Wu, Z.; Wang, B.; Yu, Z. Comparison and Correlation of Agronomic Characteristics and Fermentation Quality of Different Types of Hybrid Corn. Acta Agrestia Sin. 2019, 1, 250. [Google Scholar] [CrossRef]
  32. Sujata, B.; Basavaraja, G.T.; Salimath, P.M. Evaluation of Narrow Leaflet Genotypes and Genetic Variability in Segregating Generation of Soybean (Glycine max (L) Merrill). Electron. J. Plant Breed. 2011, 2, 124–131. [Google Scholar]
  33. Virdi, K.S.; Sreekanta, S.; Dobbels, A.; Haaning, A.; Jarquin, D.; Stupar, R.M.; Lorenz, A.J.; Muehlbauer, G. Branch Angle and Leaflet Shape Are Associated with Canopy Coverage in Soybean. Plant Genome 2023, 16, e20304. [Google Scholar] [CrossRef] [PubMed]
  34. Haile, F.J.; Higley, L.G.; Specht, J.E.; Spomer, S.M. Soybean Leaf Morphology and Defoliation Tolerance. Agron. J. 1998, 3, 353–362. [Google Scholar] [CrossRef]
  35. Salim, M.; Chen, Y.L.; Ye, H.; Nguyen, H.T.; Solaiman, Z.M.; Siddique, K.H.M. Screening of Soybean Genotypes Based on Root Morphology and Shoot Traits Using the Semi-Hydroponic Phenotyping Platform and Rhizobox Technique. Agronomy 2021, 1, 56. [Google Scholar] [CrossRef]
  36. Narayanan, S.; Mohan, A.; Gill, K.S.; Prasad, P.V.V. Variability of Root Traits in Spring Wheat Germplasm. PLoS ONE 2014, 6, e100317. [Google Scholar] [CrossRef]
  37. Shen, Y.; Gilbert, G.S.; Li, W.; Fang, M.; Lu, H.P.; Yu, S.X. Linking Aboveground Traits to Root Traits and Local Environment: Implications of the Plant Economics Spectrum. Front. Plant Sci. 2019, 10, 1412. [Google Scholar] [CrossRef] [PubMed]
  38. Ryser, P.; Eek, L. Consequences of Phenotypic Plasticity vs. Interspecific Differences in Leaf and Root Traits for Acquisition of Aboveground and Belowground Resources. Am. J. Bot. 2000, 3, 402–411. [Google Scholar] [CrossRef]
  39. Schulze, E.D.; Caldwell, M.M. Overview: Perspectives in Ecophysiological Research of Photosynthesis. In Ecophysiology of Photosynthesis; Springer: Berlin/Heidelberg, Germany, 1995; pp. 553–564. [Google Scholar] [CrossRef]
  40. Lan, J.H.; Chu, D. Study on the Genetic Basis of Plant Height and Ear Height in Maize (Zea mays L.) by QTL Dissection. Hereditas 2005, 6, 925–934. [Google Scholar] [CrossRef]
  41. Wang, F.; Chen, Y.Z.; Wang, X.P.; You, Z.M.; Chen, C.S. Comparison of Leaf Functional and Photosynthetic Characteristics in Different Tea Cultivars. J. Tea Sci. Res. 2016, 3, 285–292. [Google Scholar] [CrossRef]
  42. Sakoda, K.; Tanaka, Y.; Long, S.P.; Shiraiwa, T. Genetic and Physiological Diversity in the Leaf Photosynthetic Capacity of Soybean. Crop Sci. 2016, 5, 2731–2741. [Google Scholar] [CrossRef]
  43. Sawada, S.; Kuninaka, M.; Watanabe, K.; Sato, A.; Kawamura, H.; Komine, K.; Sakamoto, T.; Kasai, M. The Mechanism to Suppress Photosynthesis through End-Product Inhibition in Single-Rooted Soybean Leaves During Acclimation to CO2 Enrichment. Plant Cell Physiol. 2001, 10, 1093–1102. [Google Scholar] [CrossRef] [PubMed]
Figure 1. Dry weight per plant of different soybean cultivars. Different lower-case letters represent significant differences between cultivars at the p < 0.05 level.
Sustainability 16 02886 g001
Figure 2. Aboveground phenotypic characteristics of different soybean cultivars. (a) Stem diameter, (b) leaf area, (c) leaf shape index and (d) number of internodes. Different lower-case letters represent significant differences between cultivars at the p < 0.05 level.
Sustainability 16 02886 g002
Figure 3. Root traits of different soybean cultivars. (a) Root weight, (b) root length, (c) root volume, and (d) root surface area. Different lower-case letters represent significant differences between cultivars at the p < 0.05 level.
Sustainability 16 02886 g003
Figure 4. Photosynthetic characteristics of different soybean cultivars. (a) Net photosynthetic rate (NPR), (b) intercellular CO2 concentration (IC), (c) transpiration rate (TR), (d) stomatal conductance (SC) and (e) chlorophyll content (SPAD). Different lower-case letters represent significant differences between cultivars at the p < 0.05 level.
Sustainability 16 02886 g004
Figure 5. Correlation between soybean height and phenotypic characteristics. Red and blue colors represent positive and negative correlations, respectively. * represents correlation at p < 0.05 level. Darker color represents stronger correlation. PH: plant height; SD: stem diameter; NI: number of internodes; LA: leaf area; LS: leaf shape index.
Sustainability 16 02886 g005
Figure 6. Correlations between soybean height and root traits. Red and blue colors represent positive and negative correlations, respectively. * represents correlation at p < 0.05 level. Darker color represents stronger correlation. PH: plant height; RW: root weight; RL: root length; RS: root surface area; RV: root volume.
Sustainability 16 02886 g006
Figure 7. Correlation between soybean height and photosynthetic characteristics. Red and blue colors represent positive and negative correlations, respectively. * represents correlation at p < 0.05 level. Darker color represents stronger correlation. PH: plant height; NP: net photosynthetic rate; SC: stomatal conductance; IC: intercellular CO2 concentration; TR: transpiration rate; SPAD: chlorophyll content.
Sustainability 16 02886 g007
Figure 8. Principal component analysis between height and phenotypic, photosynthetic and root traits in soybean. PH: Plant height; LA: Leaf area; LS: Leaf shape index; IC: intercellular CO2 concentration; TR: transpiration rate; RW: Root weight; RL: Root length; RS: Root surface area; RV: Root volume; SPAD: chlorophyll content.
Sustainability 16 02886 g008
Figure 9. Path analysis of plant height, phenotypic traits, and photosynthetic indicators. Red arrows represent positive impacts, blue arrows represent negative impacts, solid lines represent direct impacts, and dashed lines represent indirect impacts.
Sustainability 16 02886 g009
Table 1. Origin and plant height data for test materials.
Test MaterialOriginHeight Class2016 Height (cm)2017 Height (cm)2018 Height (cm)
Neinong S001Inner Mongolia, ChinaTall189172.4175.9
Neinong S002Inner Mongolia, ChinaTall186180.2176.5
Neinong 0004Inner Mongolia, ChinaShort79.272.382.3
Neinong 0005Inner Mongolia, ChinaShort78.679.978.7
Disclaimer/Publisher’s Note: The statements, opinions and data contained in all publications are solely those of the individual author(s) and contributor(s) and not of MDPI and/or the editor(s). MDPI and/or the editor(s) disclaim responsibility for any injury to people or property resulting from any ideas, methods, instructions or products referred to in the content.

