Article

Assessment of Crop Water Footprint and Actual Agricultural Water Consumption in Arid Inland Regions: A Case Study of Aksu Region

1
State Key Laboratory of Simulation and Regulation of Water Cycle in River Basin, China Institute of Water Resources and Hydropower Research, Beijing 100044, China
2
Department of Management and Economics, Tianjin University, Tianjin 300072, China
3
College of Water Conservancy & Architectural Engineering, Shihezi University, Shihezi 832000, China
4
State Key Laboratory of Hydraulic Engineering Simulation and Safety, School of Civil Engineering, Tianjin University, Tianjin 300072, China
*
Author to whom correspondence should be addressed.
Sustainability 2024, 16(7), 2911; https://doi.org/10.3390/su16072911
Submission received: 20 February 2024 / Revised: 28 March 2024 / Accepted: 28 March 2024 / Published: 30 March 2024
(This article belongs to the Section Sustainable Water Management)

Abstract

:
Water scarcity is a major issue in arid regions, and it is crucial to have an accurate understanding of water resource utilization for informed decision-making regarding water-related issues. However, due to various reasons such as inadequate measuring facilities, the actual agricultural water usage is often underestimated. The concept and methodology of the water footprint, based on a life-cycle perspective, provide a powerful tool for studying the actual water usage in agriculture. By utilizing the theories and models of water footprints, a method for reviewing the actual agricultural water usage in arid regions is proposed. Taking the Aksu region as an example, the evolution patterns and water consumption of 15 major crops over a 31-year period from 1990 to 2020 were calculated and analyzed. The research shows that the total water footprint of crops in the Aksu region has increased by nearly 3.13 times over the 31-year period, with significant accelerations in 2003 and 2016. The green water footprint accounts for an average of about 8% of the major crops, while the average water footprint of cotton accounts for over 57.2% of the total water footprint of major crops in the study area. Based on the calculation of the blue water footprint, the actual water usage in the Aksu region in 2020 was estimated to be 11.128 billion cubic meters, which is 1.30 times higher than the reported water usage, with groundwater extraction being 2.46 times higher than reported. This method of water footprint analysis for reviewing actual water usage and its application examples provide a methodological foundation and technical support for regional water resource management and policymaking.

1. Introduction

Agricultural water use is the main disturbance behavior in the development and utilization of water resources and has a significant impact on ecosystems [1,2]. Scientifically quantifying agricultural water use is essential for the development, utilization, and rational allocation of water resources [3]. However, the lack of comprehensive and scientific measurement methods for water use has led to statistical errors in the traditional reporting-based water use statistics, particularly in the water-stressed arid regions of northwest China, where distortions are more apparent and accuracy needs improvement [4].
A crop water footprint provides a comprehensive assessment of water resource utilization efficiency in agricultural systems by considering the total water required during the crop growth cycle [5,6]. Compared to the traditional methods of analyzing agricultural water use, a crop water footprint can more accurately quantify the water demand of crops and provide data-based recommendations for agricultural water resource management [7,8,9]. In 2002, Hoekstra introduced the concept of the water footprint [10] and calculated the water footprint for each nation of the world for the period 1997–2001 [11]. (1) On the global scale, Liu et al. calculated the water consumption of global crop production, highlighting the importance of green water and virtual water [12]. Chapagain et al. calculated the water footprint of global cotton and assessed the impact of global cotton consumption on water resources in cotton-producing countries [13]. (2) On the regional scale, Duan et al. analyzed the spatial variation characteristics of water footprints in northeast China based on agricultural input analysis [14]. Long et al. analyzed water resource footprint and consumption patterns in Gansu Province [15]. (3) On the time scale, Lin et al. analyzed the characteristics of a crop production water footprint (WF) under different crop production and planting structure adjustments in five regions of the Tarim River Basin from 1990 to 2020 [16]. Ercin et al. developed water footprint scenarios for 2050 based on a number of drivers of change [17]. Currently, water footprint research remains a hot topic in academia, primarily focusing on the calculation of water footprints. There are a limited number of studies evaluating the sustainability of agricultural water resources by analyzing the relationship between water footprints and agricultural water use, especially in arid inland regions.
As for actual water consumption, Yuan et al. estimated agricultural water consumption from meteorological and yield data [18]. Hoekstra assessed the water footprints of Morocco and the Netherlands and concluded that global water consumption is the result of the domestic consumption of agricultural products [19]. A crop water footprint generally includes a green water (soil water) footprint and a blue water (irrigation water) footprint [20]. The blue water footprint can be understood as the net consumption of irrigation water. The actual irrigation water consumption in arid regions can be estimated by combining the blue water footprint with water consumption rates [21,22], providing a new approach and method for accurately measuring agricultural water use. Through innovative methods and in-depth analysis, a more accurate method of estimation of agricultural water consumption is provided, which is of great significance for understanding the true consumption of water resources. It also provides practical guidance for water resource management and provides a scientific basis for promoting the sustainable use of water resources.
This study uses the water footprint theory as its foundation. It aims to overcome the limitation of traditional statistical water consumption, which does not fully capture the actual use of water in agriculture. This study analyzes and calculates the production water footprints of 15 major crops in the Aksu region from 1990 to 2020, a period of 31 years. It investigates the trends of water footprint growth and variation. By reviewing and analyzing actual water consumption, this study supports the development, optimization, and collaborative management of regional water resources.

2. Overview and Methods of the Study

2.1. Overview of the Study Area

The Aksu region is located in the middle section south of the Tianshan Mountains and the northern edge of the Tarim Basin, between 39°30′ and 42°41′ N and 78°03′ and 84°07′ E. As shown in Figure 1, it governs two cities and seven counties, with a total administrative area of 132,500 square kilometers, accounting for 8% of the total land area of Xinjiang. Due to its location in the heartland of Eurasia, the region has a dry and arid climate with little rainfall. The average annual temperature ranges from 9.2 to 11.5 degrees Celsius, and the average annual precipitation is 138.93 mm. The average annual evaporation capacity is 1890 mm, indicating a typical continental climate. The Aksu region is one of the most water-rich areas in Xinjiang, with a glacier area of about 4098 square kilometers and a water storage capacity of approximately 215.4 billion cubic meters. Most of the rivers are supplied by mountain precipitation and snowmelt, with snowmelt accounting for 58% of the annual runoff. After frequent transformation between surface water and groundwater in the piedmont plain, it converges into the Tarim Basin.
In 2020, the Aksu region reported a grain sowing area of 3.644 million mu and a cotton sowing area of 7.484 million mu. The annual outputs were 1.574 million tons for grain and 1.013 million tons for cotton. The forestry and fruit industry spanned a total area of 4.500 million mu, with 4.222 million mu bearing fruit, and yielded a total fruit production of 2.456 million tons.

2.2. Data Sources

The meteorological data required for this study, including precipitation, sunlight, temperature, air temperature, wind speed, etc., come from the National Meteorological Center (http://www.nmic.cn/, accessed on 1 October 2022), with a time series scale from 1990 to 2020. The socioeconomic data related to agricultural production come from statistical yearbooks (including the Aksu Regional Yearbook and the Xinjiang Local Statistical Yearbook), with a time series scale from 1991 to 2021. For some missing years, the data are supplemented and perfected using time series data interpolation methods, after which calculations and analyses are conducted. The data sources for analysis and accounting include the “Aksu Region Water Resources Bulletin (2016–2019)”, “Xinjiang Uygur Autonomous Region Water Resources Bulletin 2020”, “Third National Water Resources Survey and Assessment”, and several related planning and special research reports [23,24,25].

2.3. Research Methods

2.3.1. Calculation of Crop Water Footprint

This study utilizes the Cropwat model developed by the Food and Agriculture Organization of the United Nations to calculate the blue and green water footprints of crops separately [26,27]. Given that the calculation methods and criteria for the gray water footprint of crops have not yet been universally established [28,29] and that this research primarily focuses on the consumption of blue water, the computation of the gray water footprint is not considered for the time being. The formula for calculating the green water footprint of crops is as follows:
W F P g r e e n   = C W U g r e e n / Y
C W U g r e e n   = 10 × d = 1 l g p E T g r e e n
E T g r e e n = min ( E T c ,   P e f f )
In the formula, W F P g r e e n represents the green water footprint of crops (m3·t−1); C W U g r e e n refers to the green water usage of crops (m3·hm−2); Y (yield) is the per-unit-area yield of crops (t·hm−2); E T g r e e n   is the green water demand of crops (mm); 10 is a constant factor, which is the conversion coefficient from the depth of water (mm) to the volume of water per unit land area (m3·hm−2); the sum Σ calculates the cumulative amount from the planting date (first day) to the harvest date (lgp stands for length growth process, indicating the length of the growth period, measured in days); E T c is the crop evapotranspiration (mm), calculated using the FAO recommended Cropwat 8.0 software; and P e f f   is the effective precipitation (mm).
The formula for calculating the blue water footprint of crops is as follows:
W F P b l u e   = C W U b l u e / Y
C W U b l u e   = 10 × d = 1 l g p E T b l u e
E T b l u e = min ( E T c ,   P e f f )
In the formula, W F P b l u e represents the blue water footprint of crops (m3·t−1); C W U b l u e is the blue water consumption of crops (m3·hm−2); E T b l u e is the blue water demand of crops (mm); and other quantities are the same as in the previous formula.
After calculating the blue and green water footprints of crop production in the Aksu region’s production units, the sum of the blue and green water footprints constitutes the total water footprint of the crops.
CWF = i = 1 n ( W F P i , b l u e + W F P i , g r e e n ) · Y i
In the formula, CWF (crop water footprint) represents the total water footprint of crops and i denotes the type of crop.

2.3.2. Mann–Kendall Trend Test

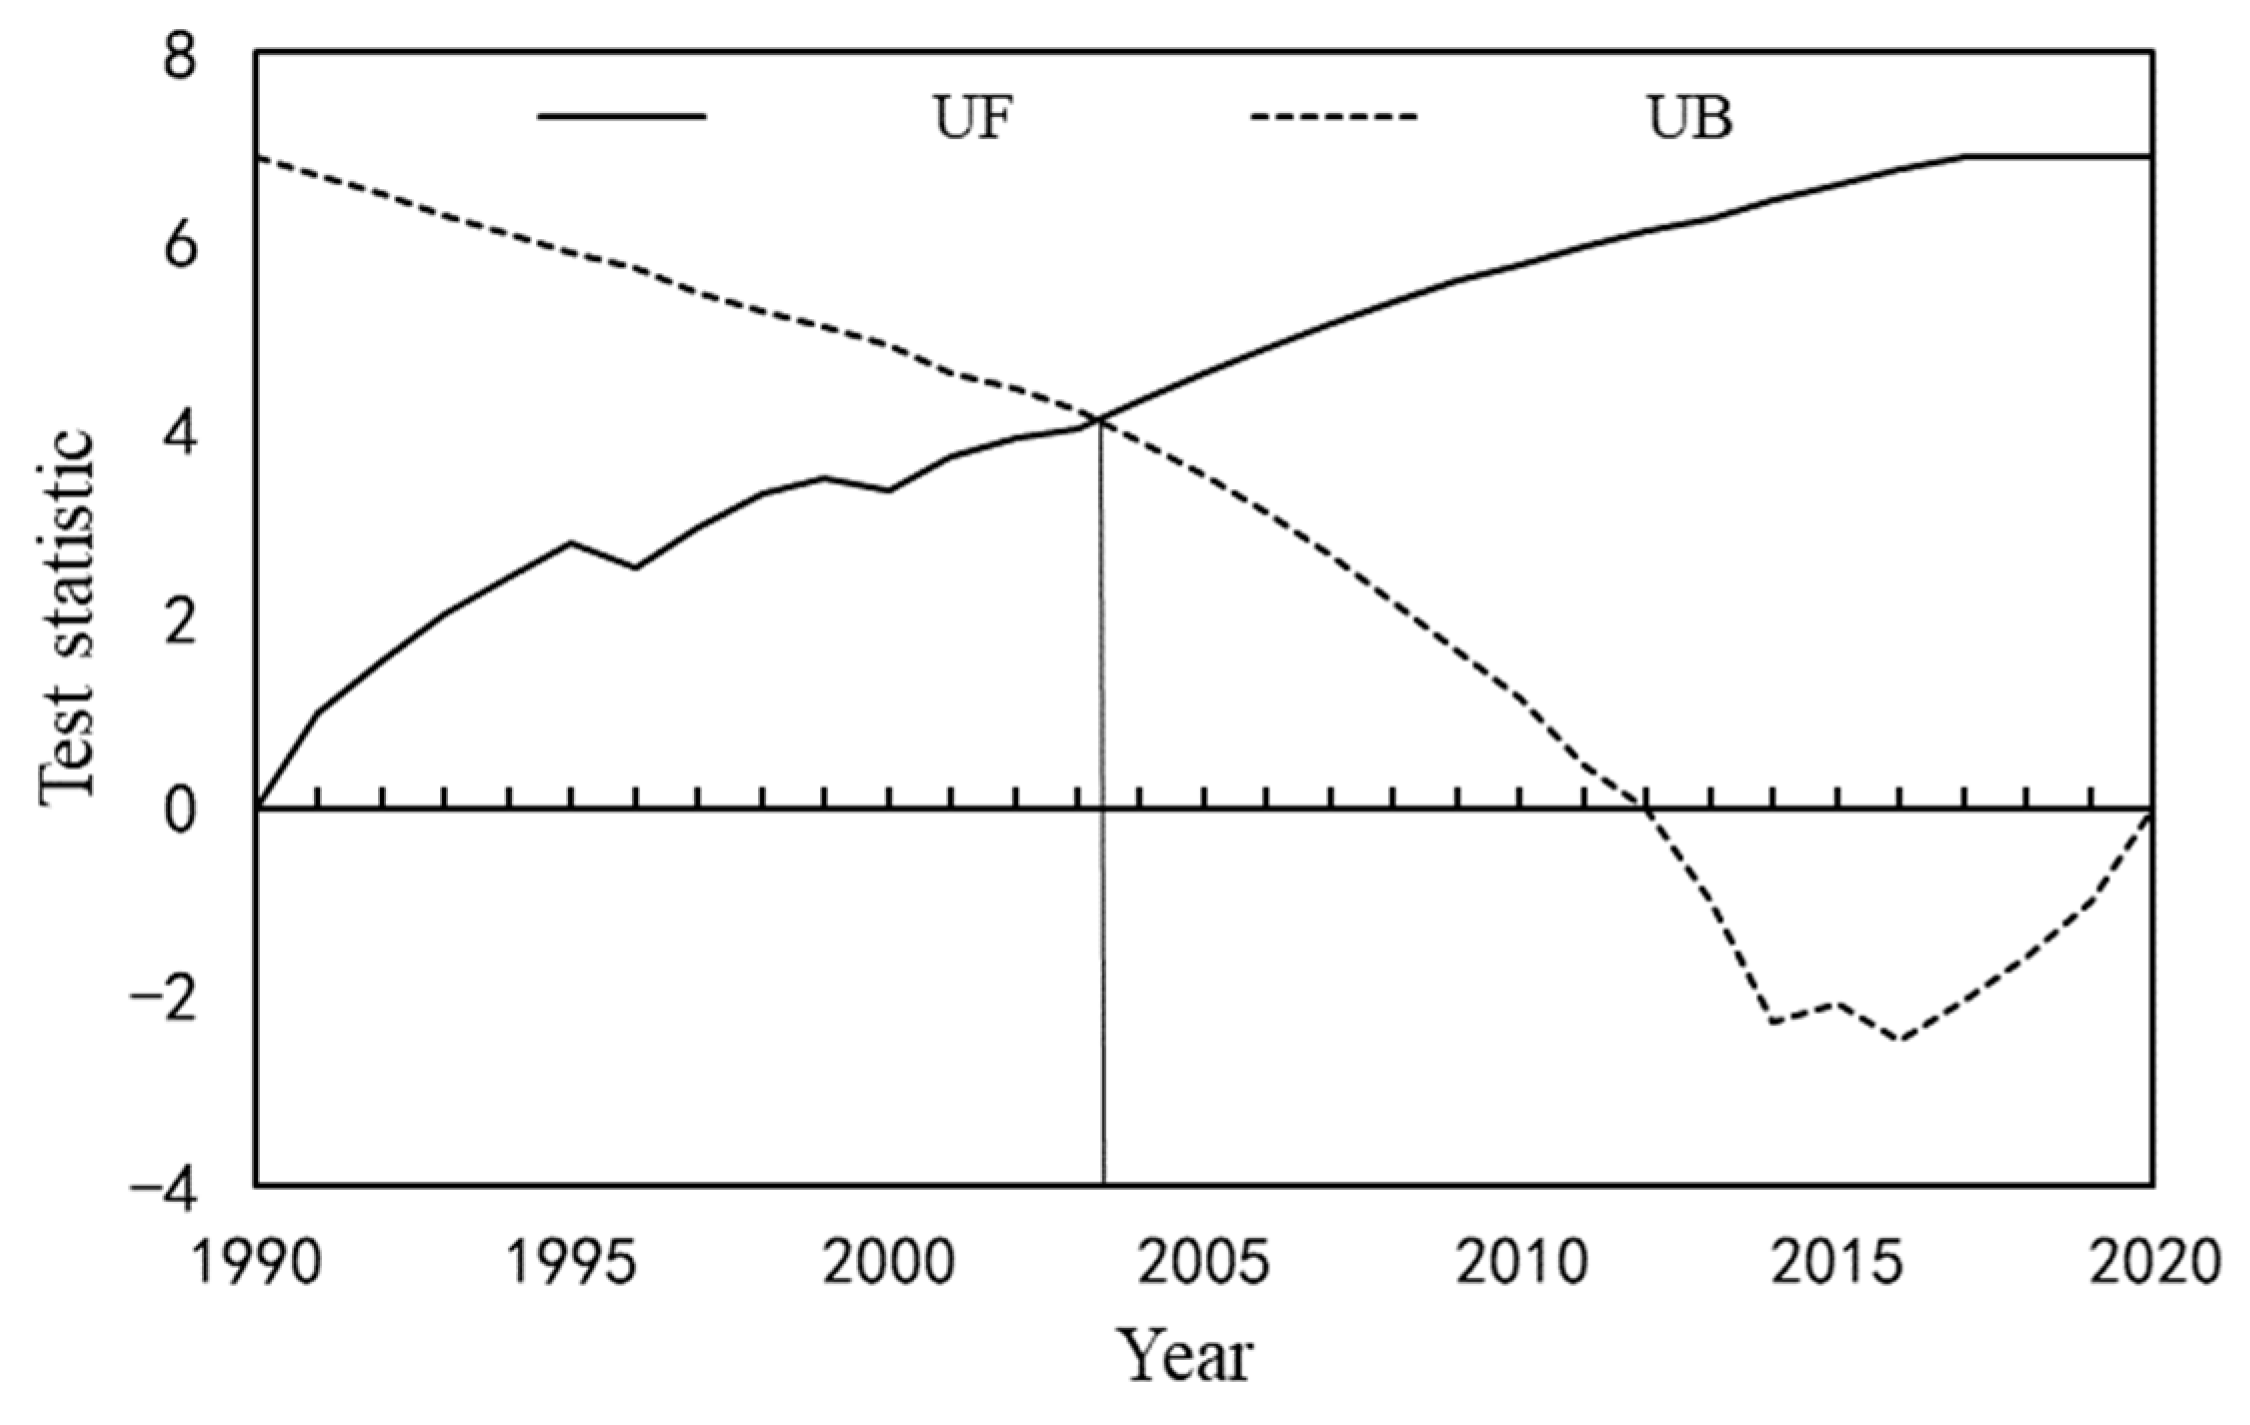
The M-K test method is an effective tool recommended by the World Meteorological Organization for identifying trends in data series [30]. This method is not influenced by individual outliers and can objectively reflect the trend of time series. The M-K method can clearly identify the periods and areas of abrupt changes based on two output sequences (UF and UB) [31,32].
For time series X with n observations, a rank series is constructed.
s k = i = 1 k r i ,    r i = 1 ,     x i > x j       j = 1 , 2 , , i 0 ,     else
It is apparent that the rank sequence s k represents the cumulative count of instances when the value at moment i is greater than that at moment j, and it is known that, when k = 1, s1 = 0.
Under the assumption that the time series are randomly independent, a statistical measure is defined:
U F k = s k E ( s k ) V a r ( s k ) , k = 1,2 , , n
In the equation, UF1 = 0, E ( s k ) and V a r ( s k ) represent the mean and variance of the cumulative count sk. When x1, x2, …, xn are mutually independent and have the same continuous distribution, they can be calculated using the following formula:
E ( s k ) = n ( n 1 ) 4 , V a r ( s k ) = n ( n 1 ) ( 2 n + 5 ) 72
UF is a standard normal distribution, which is a statistical series calculated in the order of time series x, namely, x1, x2, …, xn. Inverting the time series x to xn, xn−1, …, x1 and repeating the above process constructs the inverted series UB.
If the UF value is greater than 0, it indicates an upward trend in the series; if it is less than 0, it indicates a downward trend. When it exceeds the critical confidence level line (at a testing confidence level of α = 0.05, the confidence level line is ±1.96), it signifies that the upward or downward trend is significant. The range beyond the critical line is determined as the time region where a mutation occurs. If the UF and UB curves intersect, and the intersection point is between the critical lines, then the moment corresponding to the intersection is the start time of the mutation [33].

2.3.3. Calculation of True Water Consumption

The Aksu region is rich in surface water resources, and all water diversion projects, big or small, are equipped with comprehensive metering facilities. Therefore, it can be considered that the volume of surface water diverted is essentially close to the actual amount of surface water developed and utilized. Due to the lack of effective monitoring methods for groundwater, its extraction volume is mainly estimated based on rural electricity consumption, which introduces certain errors. The approach to verifying actual water usage involves estimating the water consumption of field crops through the blue water footprint [34]. By using the volume of surface water diverted to estimate the actual surface water consumption in the fields, the difference between the two is the actual groundwater consumption in the fields. Then, by applying the groundwater utilization coefficient, the actual groundwater extraction volume is calculated. This enables the verification of actual agricultural water usage from different water sources.
The utilization of water by crops generally comprises two parts: green water and blue water. As mentioned earlier, the water footprint is a concept of water consumption; hence, the blue water footprint represents the consumption of blue water. In the case of irrigated agriculture, it refers to the portion of irrigation water that is consumed and utilized by plants. By employing the blue water footprint and the water consumption rate, the actual water usage in the fields can be determined. The water consumption rate refers to the ratio of water consumed to the gross water used, or the ratio of the water consumption quota to the gross water quota.
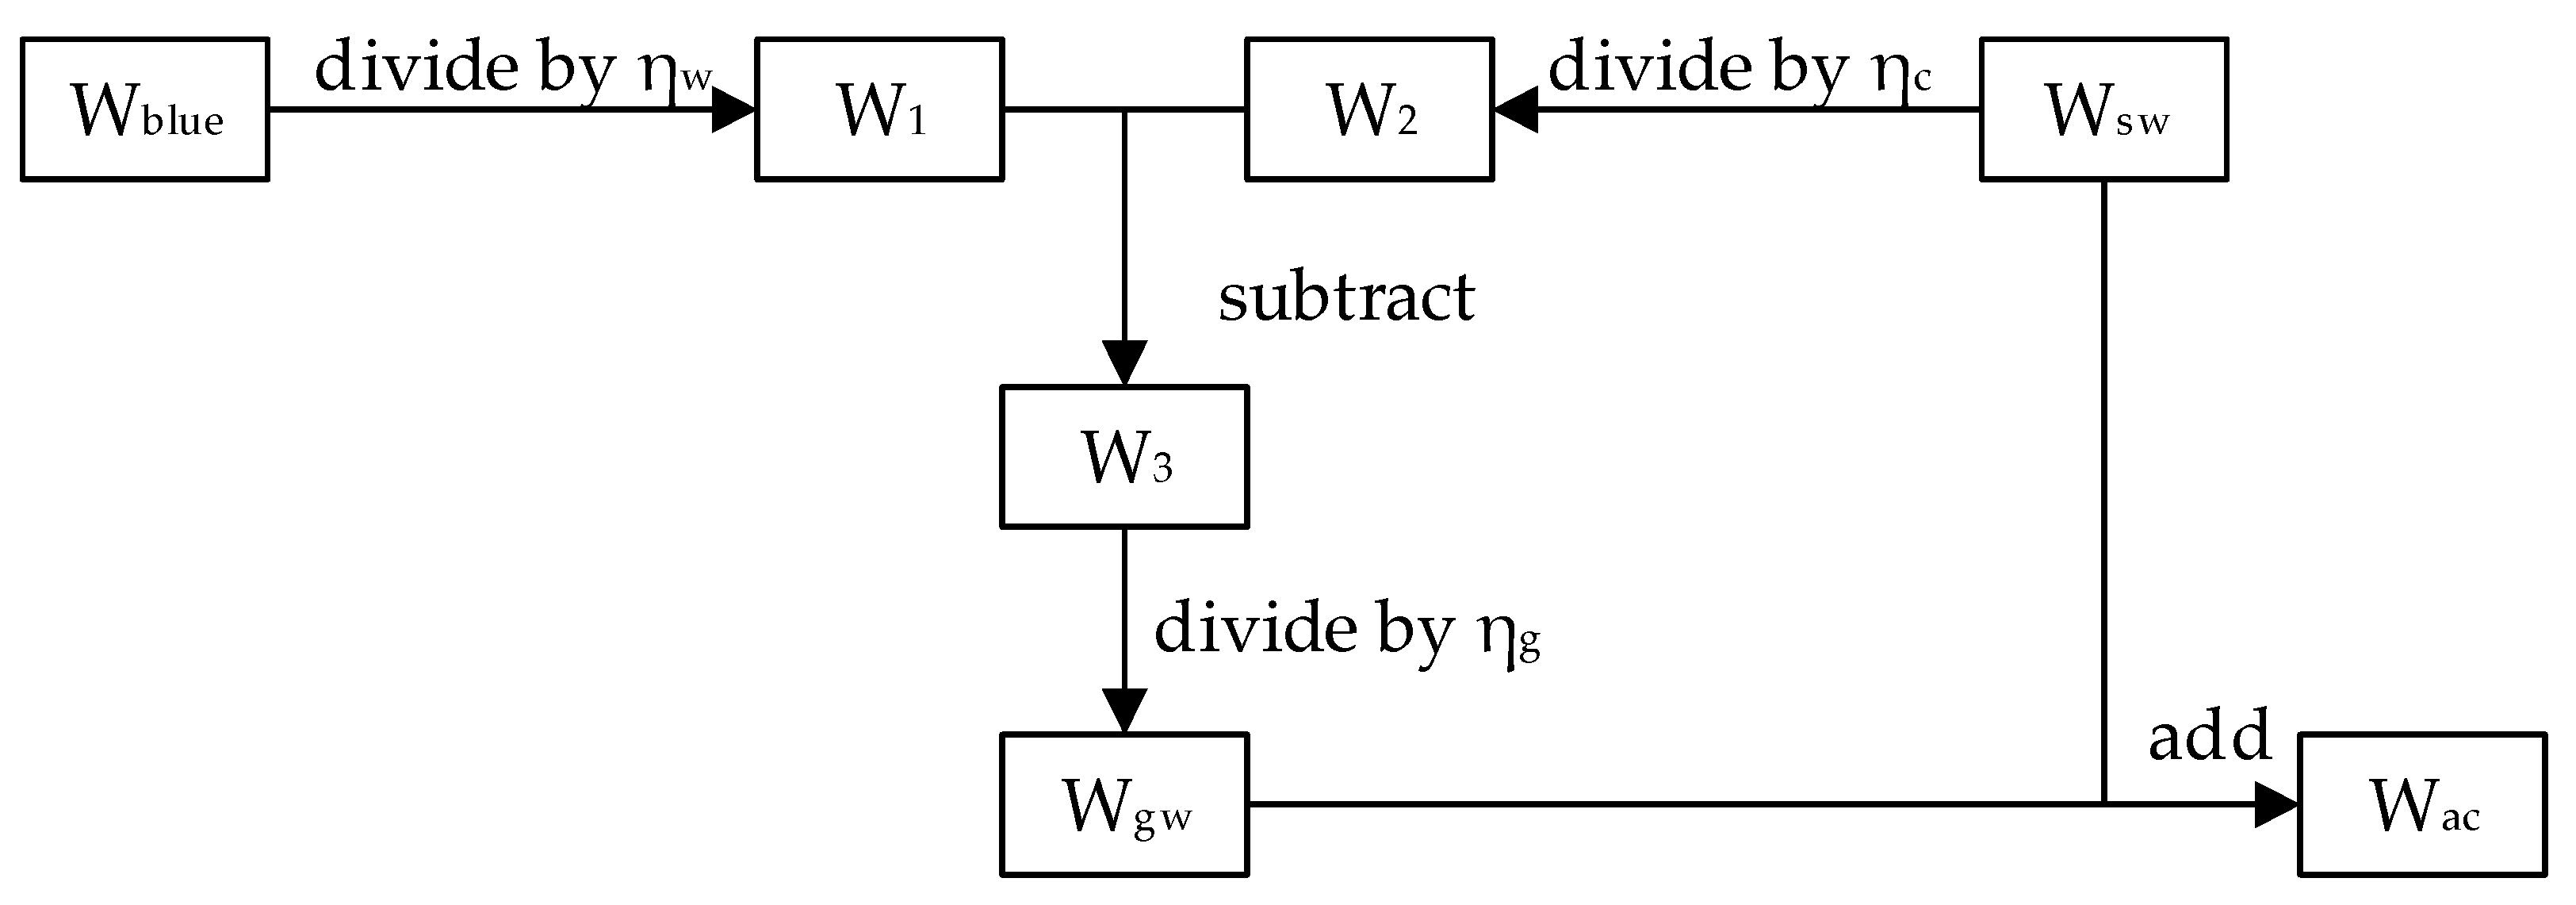
W 1 = W b l u e / η w
In the formula, W1 represents the actual water usage in the fields, measured in cubic meters; W b l u e is the blue water footprint, in cubic meters; and η w is the water consumption rate.
By consulting relevant water diversion documents, data on the volume of surface water diverted at the canal head by various counties and cities can be obtained. However, during transportation to the fields, a portion of the water is lost due to evaporation, transpiration, and other forms. Therefore, to calculate the actual amount of surface water that reaches the fields, it is necessary to divide the known volume of surface water by the surface water diversion coefficient.
W 2 = W s w / η c
In the formula, W 2 represents the volume of surface water used in the fields, measured in cubic meters; W s w denotes the volume of surface water diverted, in cubic meters; and η c is the canal utilization coefficient.
The actual groundwater usage can be progressively calculated based on the field water usage. Initially, the difference between the actual field water usage and the actual surface water usage in the fields represents the portion contributed by groundwater, denoted as the groundwater usage in the fields W 3 . The actual groundwater withdrawal W g w can be obtained by dividing the groundwater usage in the fields W 3 by the groundwater utilization coefficient η g . The actual water usage W a c is the sum of the surface water diverted W s w and the groundwater withdrawal W g w .
The water volume utilized in the fields comes from the actual surface water and the actual groundwater reaching the fields. Therefore,
W 3 = W 1 W 2
W g w = W 3 / η g
W a c = W s w + W g w
The process of groundwater abstraction also involves some consumption. However, since the water loss is minimal, the groundwater abstraction coefficient can be approximated as 1. The sum of the surface water abstraction volume and the groundwater abstraction volume yields the actual water usage. Refer to Figure 2 for the specific calculation process.
As can be seen in Figure 2, based on the calculated blue water footprint and the data on the volume of surface water diverted at the canal head by various counties and cities, the coefficients can be calculated step by step to extrapolate the real agricultural water consumption.

2.3.4. Water Balance Method

This study uses the water balance method to verify the accuracy of the calculated actual water consumption [35]. The fundamental principle of water balance is that the inflow volume R i n plus the self-produced water resources (including surface water R s u r and groundwater R g r o ) equals the sum of the outflow volume R o u t , socioeconomic water consumption W a r t , and natural ecological water consumption   W n a , with the balance difference ΔS as an additional factor. When the balance difference ΔS is less than 5% of the total water resources, the water balance verification result is considered reasonable. The water balance equation is as follows:
R i n + R s u r + R g r o = R o u t + W a r t + W n a + S

3. Results and Analysis

3.1. Spatial and Temporal Variation in Crop Water Footprints

From 1990 to 2020, the calculation results of the water footprint of 15 major crops in the Aksu region (Figure 3) show that the total water footprint of crops in the region increased from 1.732 billion m3 in 1990 to 7.156 billion m3 in 2020, with an annual increase of 181 million m3, amounting to an overall increase of nearly 3.13 times. The linear trend fitting formula for the series is y = 0.0579x2 − 229.88x + 228193, with an R2 value of 0.92. As shown in Figure 2, the series of the total crop water footprint in the study area experienced abrupt changes in 2003 and 2016.
The use of the Mann–Kendall abrupt change test curve method for the aforementioned crop water footprints (where the UF statistic curve intersects with the UB statistic curve in 2003, Figure 4) indicates an abrupt increase in the total water footprint series in the Aksu region in 2003. Specifically, between 1990 and 2003, the growth trend of crop water footprints in the Aksu region was gradual, with an average annual increase of 80 million m3 and an average annual growth rate of 4.15%. In the second phase from 2003 to 2016, the annual average growth rate of the water footprint was 9.07%, which is 2.19 times that of the previous phase. From 2016 to 2020, the water footprint showed a slow declining trend, with an average annual decrease rate of 3.43%.
Preliminary analysis suggests that the abrupt changes may be related to the rapid popularization of efficient water-saving measures across Xinjiang and the commencement of benefits from certain comprehensive management projects of the Tarim River area completed in 2003 [22]. This also implies that a unified management pattern had not yet matured, leading to a significant increase in agricultural irrigation water use due to the massive and disorganized expansion of irrigation areas [36].
The water footprint of crops is related to climate, agricultural inputs, and cropping patterns. Based on the calculation methods for crop water footprints and the formulas for calculating crop E T c , it is clear that the direct influencing factors of crop water footprints are the planting area and yield of crops. As shown in Figure 5, the trend in crop water footprints is the same as the trend in crop yields and planting area. After 2016, the implementation of the strictest water resource management system and the Tarim River Basin’s overall water resource carrying capacity nearing its limit, together with the widespread promotion of efficient water-saving agriculture in Xinjiang, have led to a significant decline in both the crop planting area and the total production in the study area. This resulted in a downward trend in its crop water footprint. During the period from 2016 to 2020, the crop water footprint in the study area showed a gradual declining trend, with an average annual reduction of 216 million cubic meters.
Over the past 30 years, the crop water footprint in each county and city of the study area has increased to varying degrees. As shown in Table 1, among them, Kuqa City has a relatively higher long-term average crop water footprint (763 million m3). The water footprint of Kuqa City was 355 million m3 in 1990 and reached 1.306 billion m3 by 2020. The total volume increased by 268%, with an annual average increase of 31 million m3. The county with the lowest long-term average crop water footprint is Keping County (65 million m3), which increased from 12 million m3 in 1990 to 113 million m3 in 2020. The total volume increased by 842%, with an annual average increase of 3 million m3. This is closely related to Keping County’s small water resource volume, backward agricultural technology level, and limited arable land.

3.2. The Composition of and Changes in Blue and Green Water Footprints in Crops

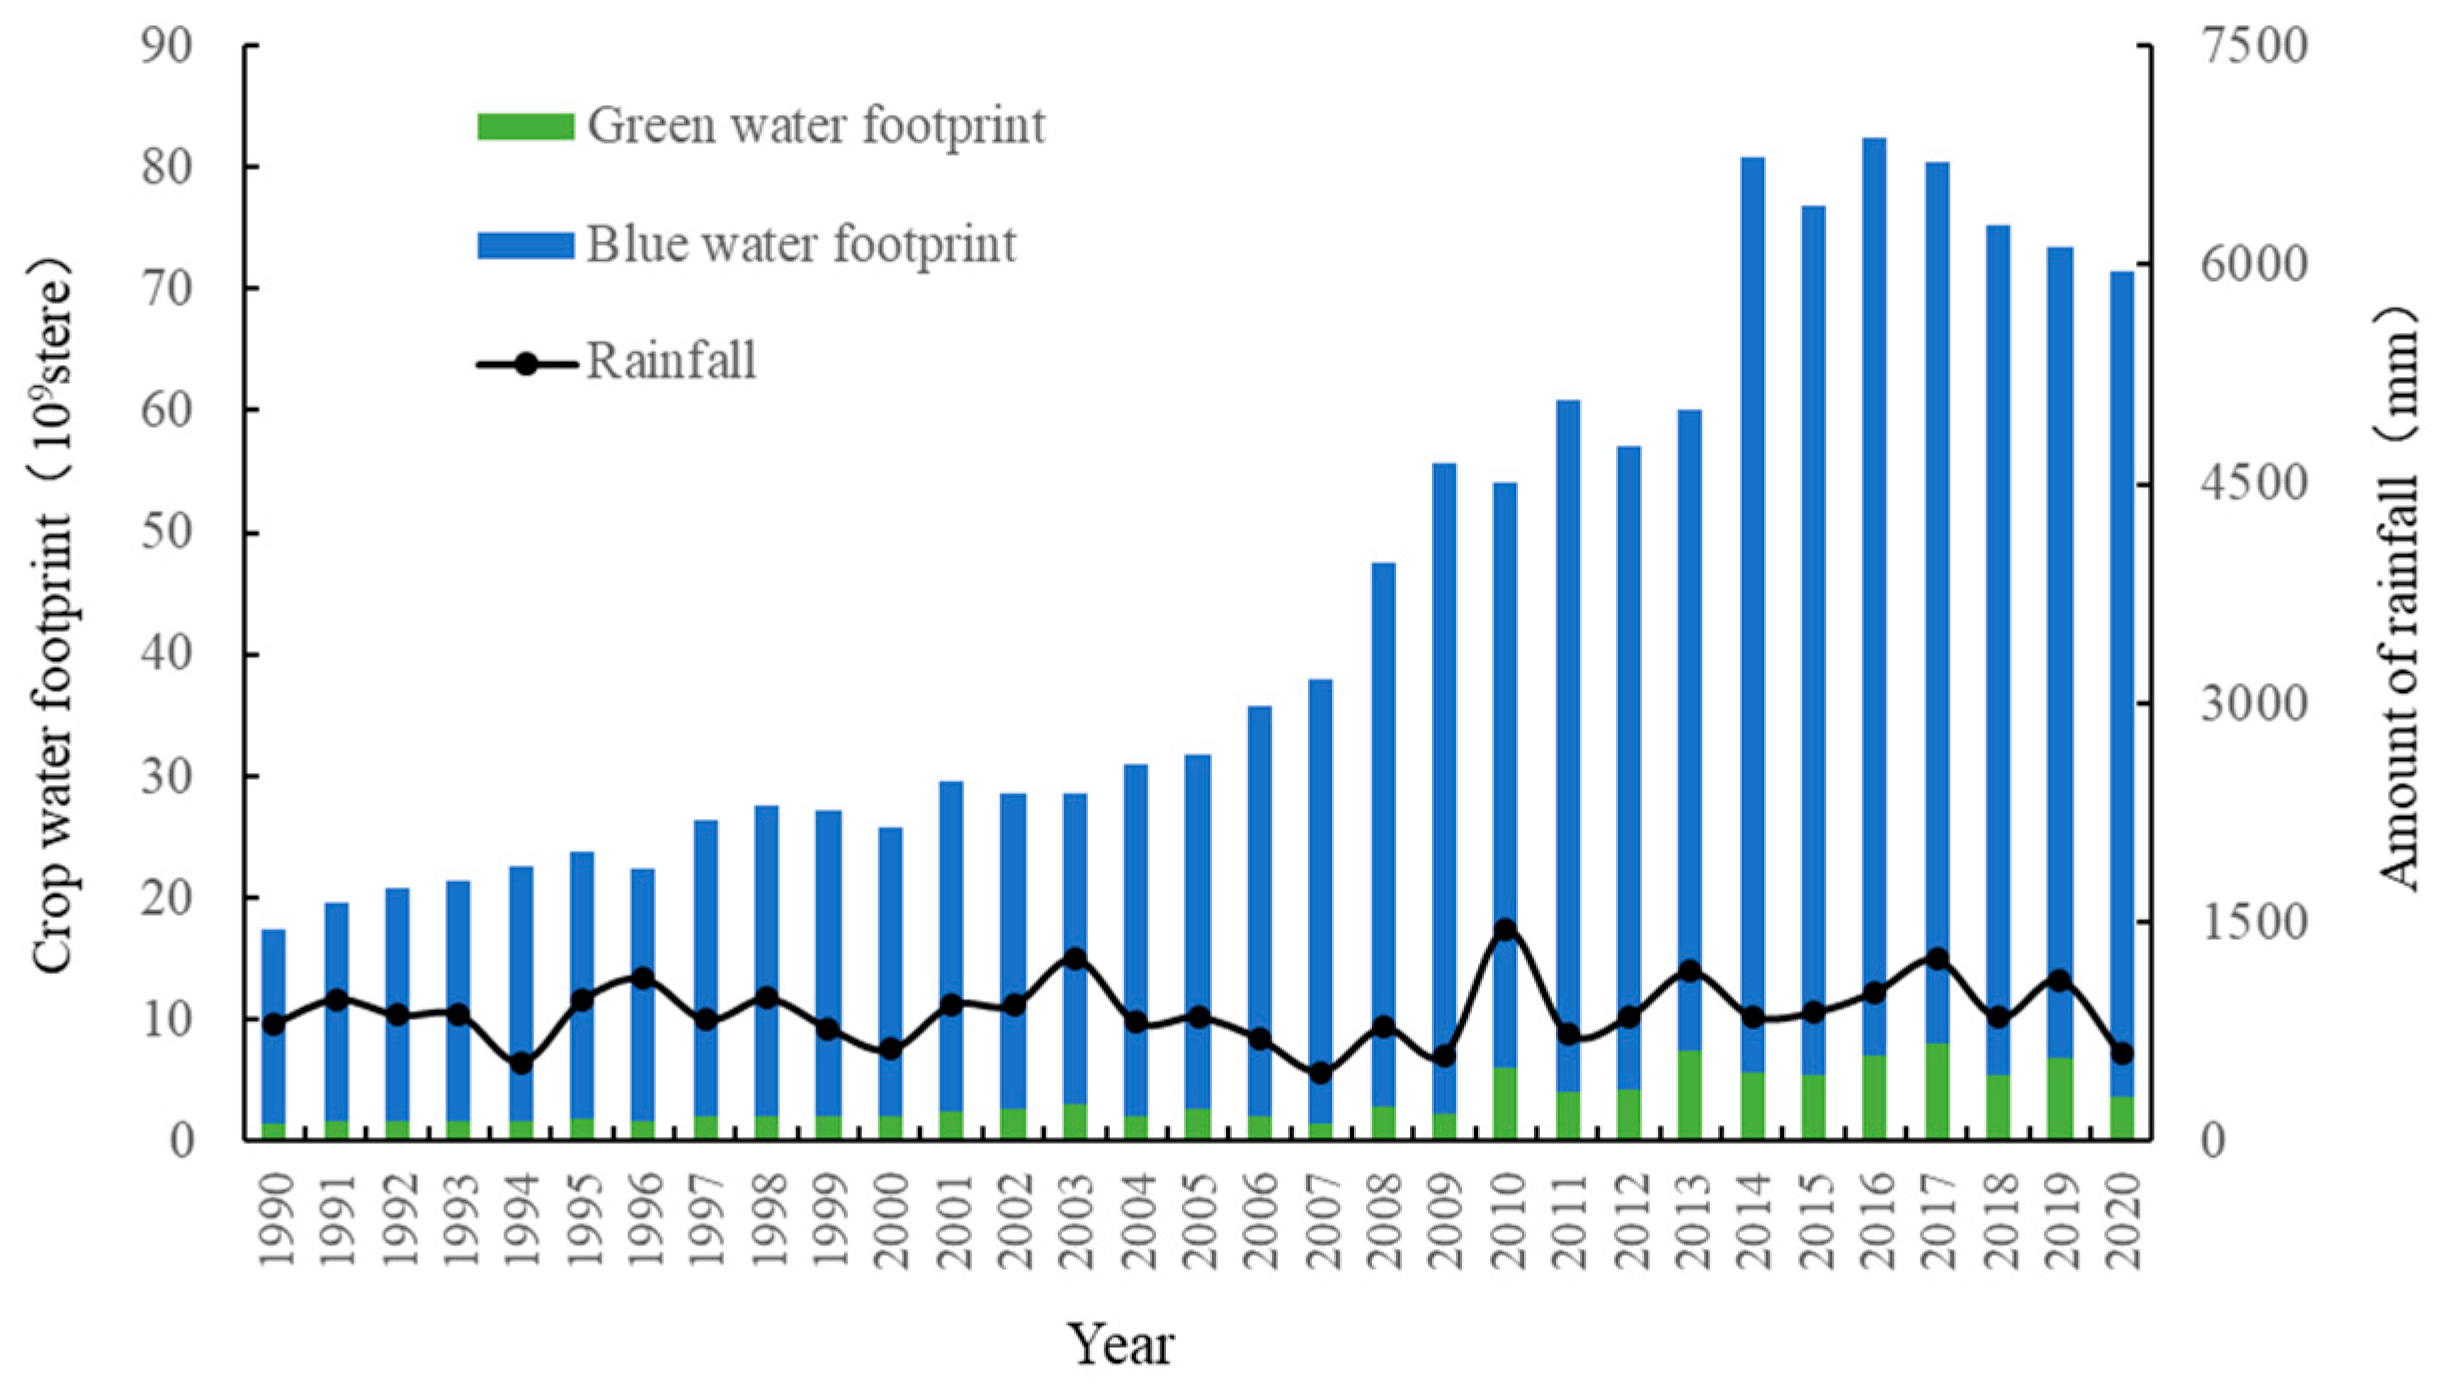
Looking at the composition of blue and green water footprints (Figure 6), the total green water footprint of crops in the Aksu region increased from 142 million m3 in 1990 to 369 million m3 in 2020, increasing by almost 1.6 times. This accounted for an average of 8% of the total crop water footprint, with blue water footprints making up 92%, indicating that irrigation water is the main source of water consumption for typical crop production in the Aksu region. In 2017, the green water footprint in the Aksu region reached its highest at 944 million m3, while, in 2007, it was the lowest, at only 170 million m3. Due to differences in crop planting structures, levels of economic development, and meteorological conditions of the locations, there are significant differences in the composition of blue and green water footprints of crops in the study area. Kuqa City has a relatively higher long-term average green water footprint for crops, with its green water footprint increasing from 28 million m3 in 1990 to 78 million m3 in 2020. Kuqa City also has a relatively higher long-term average blue water footprint for crops, increasing from 327 million m3 in 1990 to 1.228 billion m3 in 2020.
A comparison of the green water footprint and precipitation in the study area reveals that their variations are essentially consistent. In years with higher precipitation, the green water footprint is larger; conversely, it is smaller in years with less precipitation. Observing the green water footprint of crops over the past 30 years, an increase in precipitation has also led to an increase in the effective utilization of rainfall. From a spatial distribution perspective, counties with higher average annual precipitation also have a larger green water footprint proportion. Wushi County has the highest rainfall in the study area, with an average precipitation of 150.45 mm from 1990 to 2020. Therefore, the long-term average proportion of the green water footprint is the largest compared to other counties, at 13.01%. Meanwhile, Shaya County, with an average precipitation of only 61.85 mm from 1990 to 2020, has a long-term average green water footprint proportion of just 5.87%.
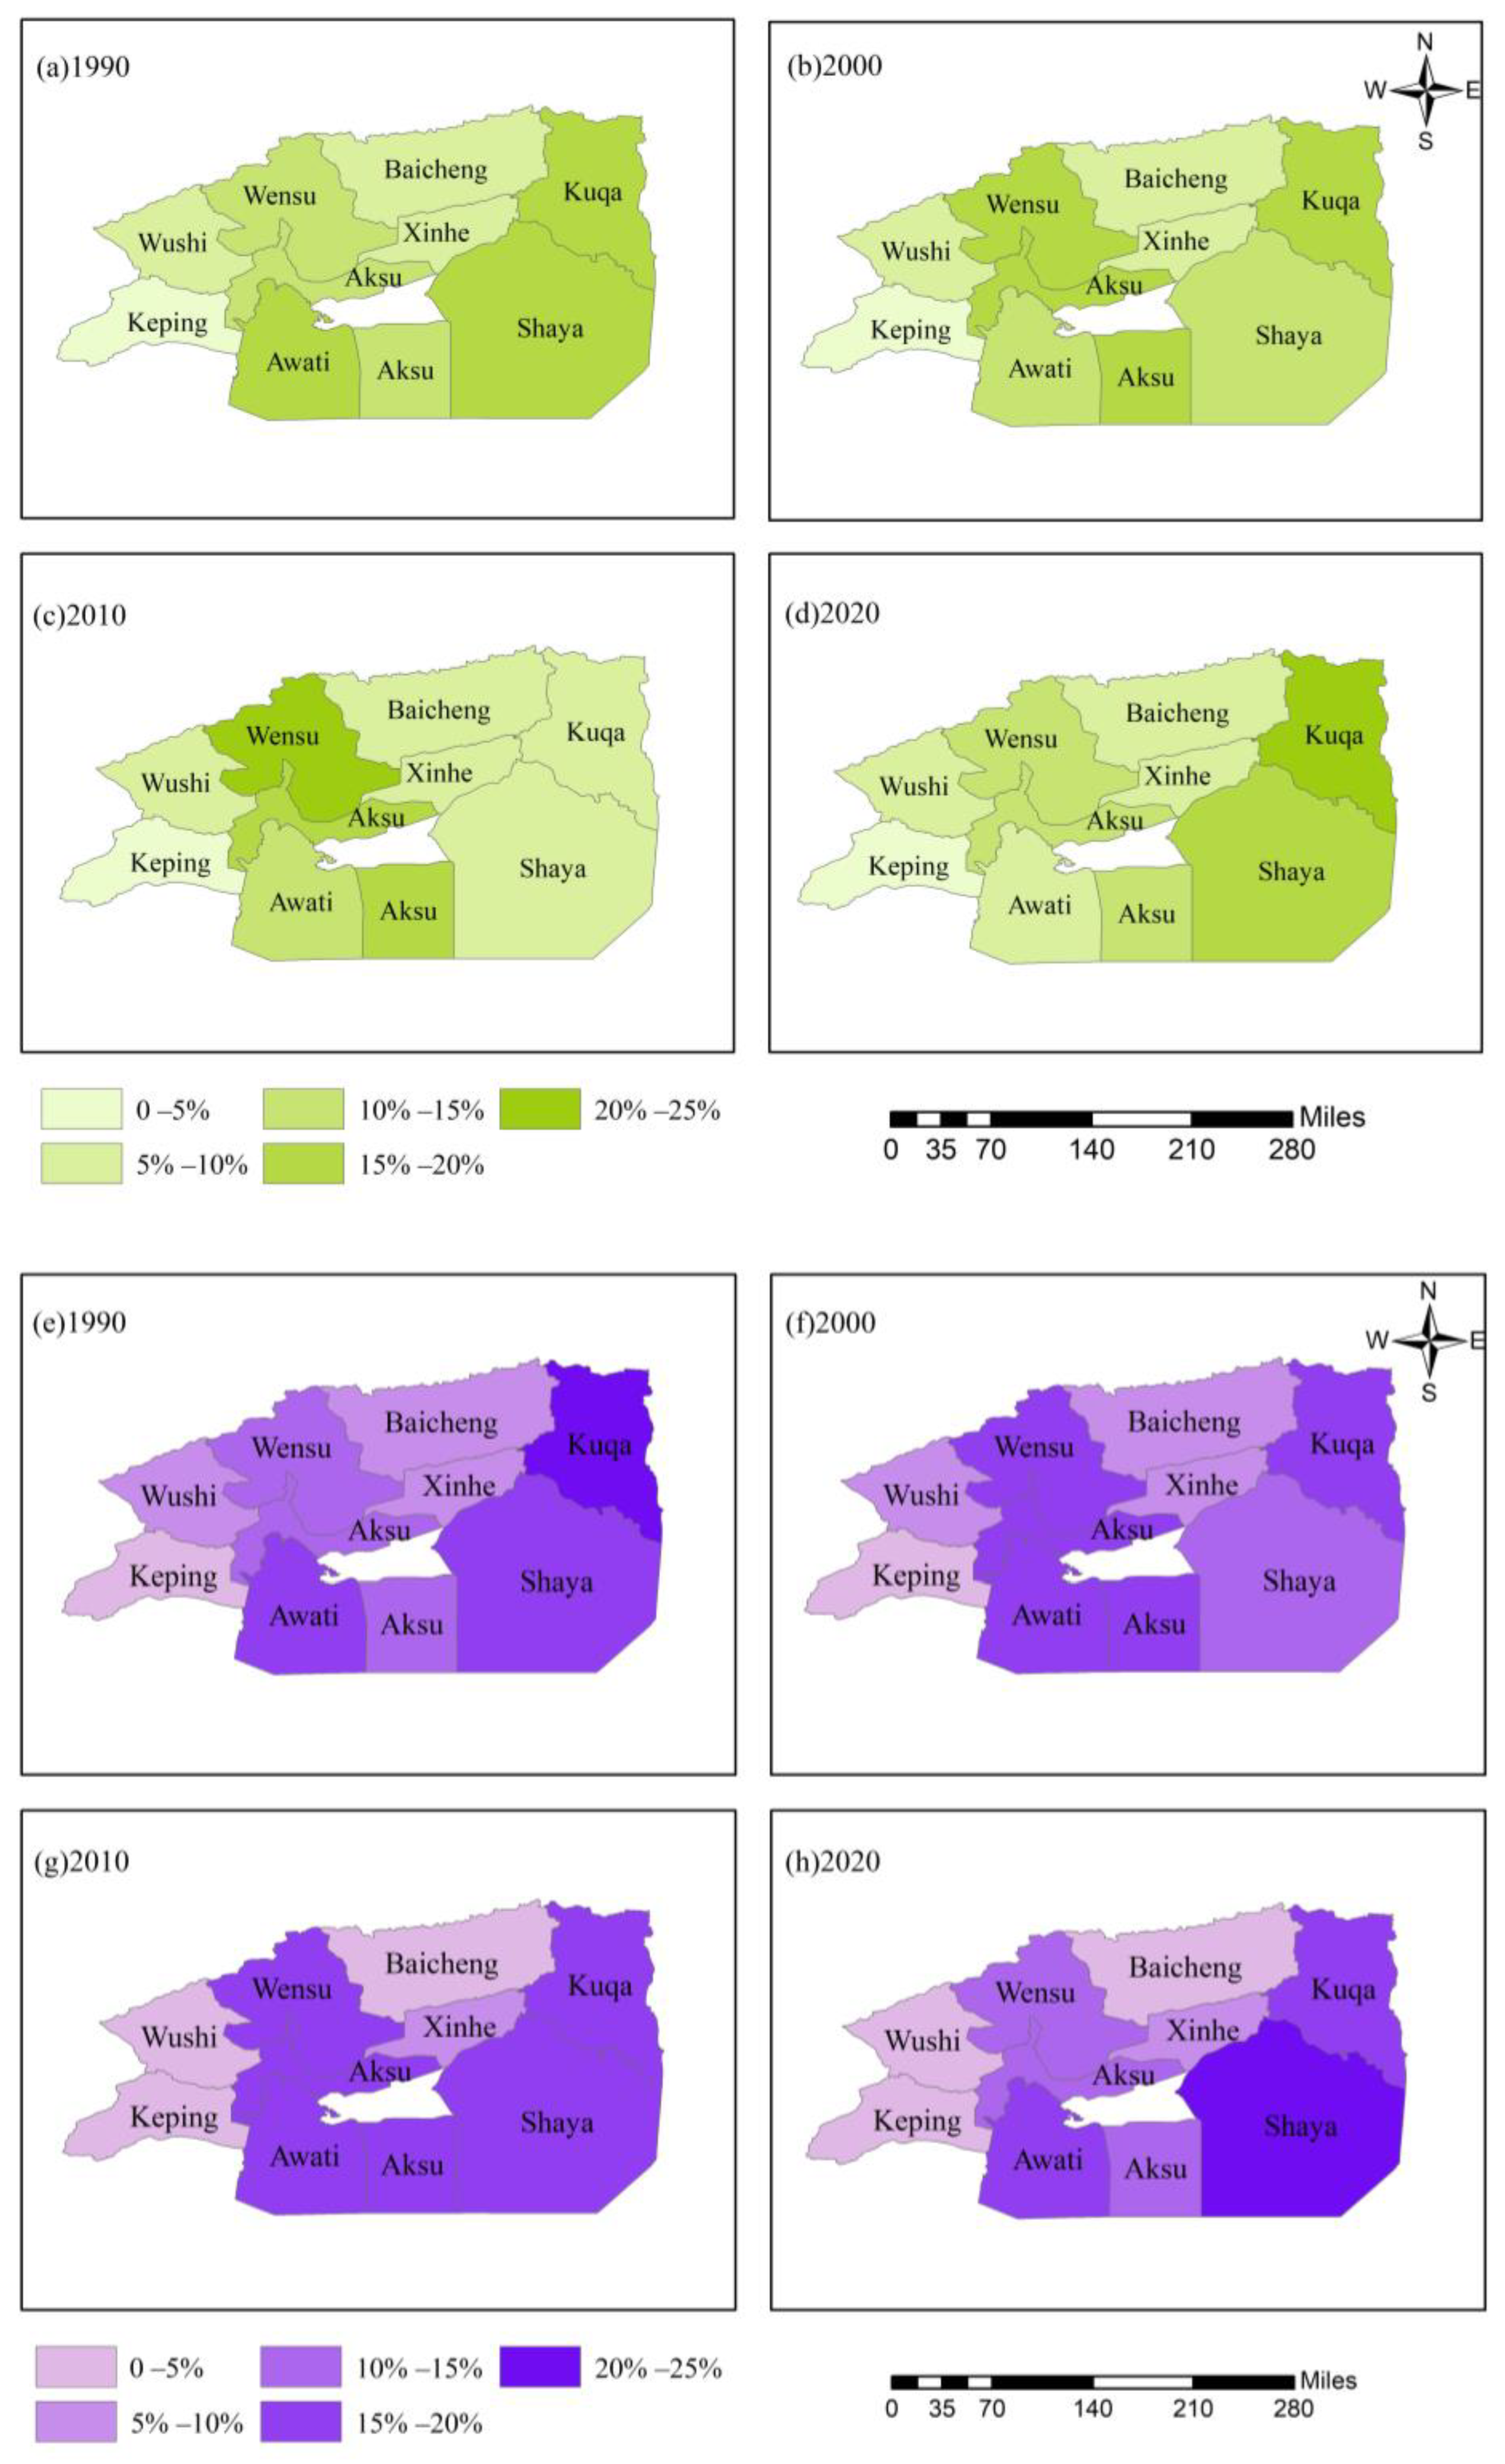
From Figure 7, it can be observed that there were significant changes in the green water footprint distribution in the Aksu region from 1990 to 2020. In 1990, Awati County, Kuqa City, and Shaya County had relatively larger proportions. By 2000, the proportions shifted to Wensu County, Kuche City, and Aksu City. In 2010, the proportion of Kuqa City decreased but, by 2020, the green water footprint of Kuqa City had the largest proportion in the Aksu region. From the blue water footprint distribution map, it is evident that Wensu County, Awati County, Kuqa City, Aksu City, and Shaya County consistently have larger blue water footprints compared to the other four counties.

3.3. Analysis of the Water Footprint Structure of Crops

3.3.1. Food Crops

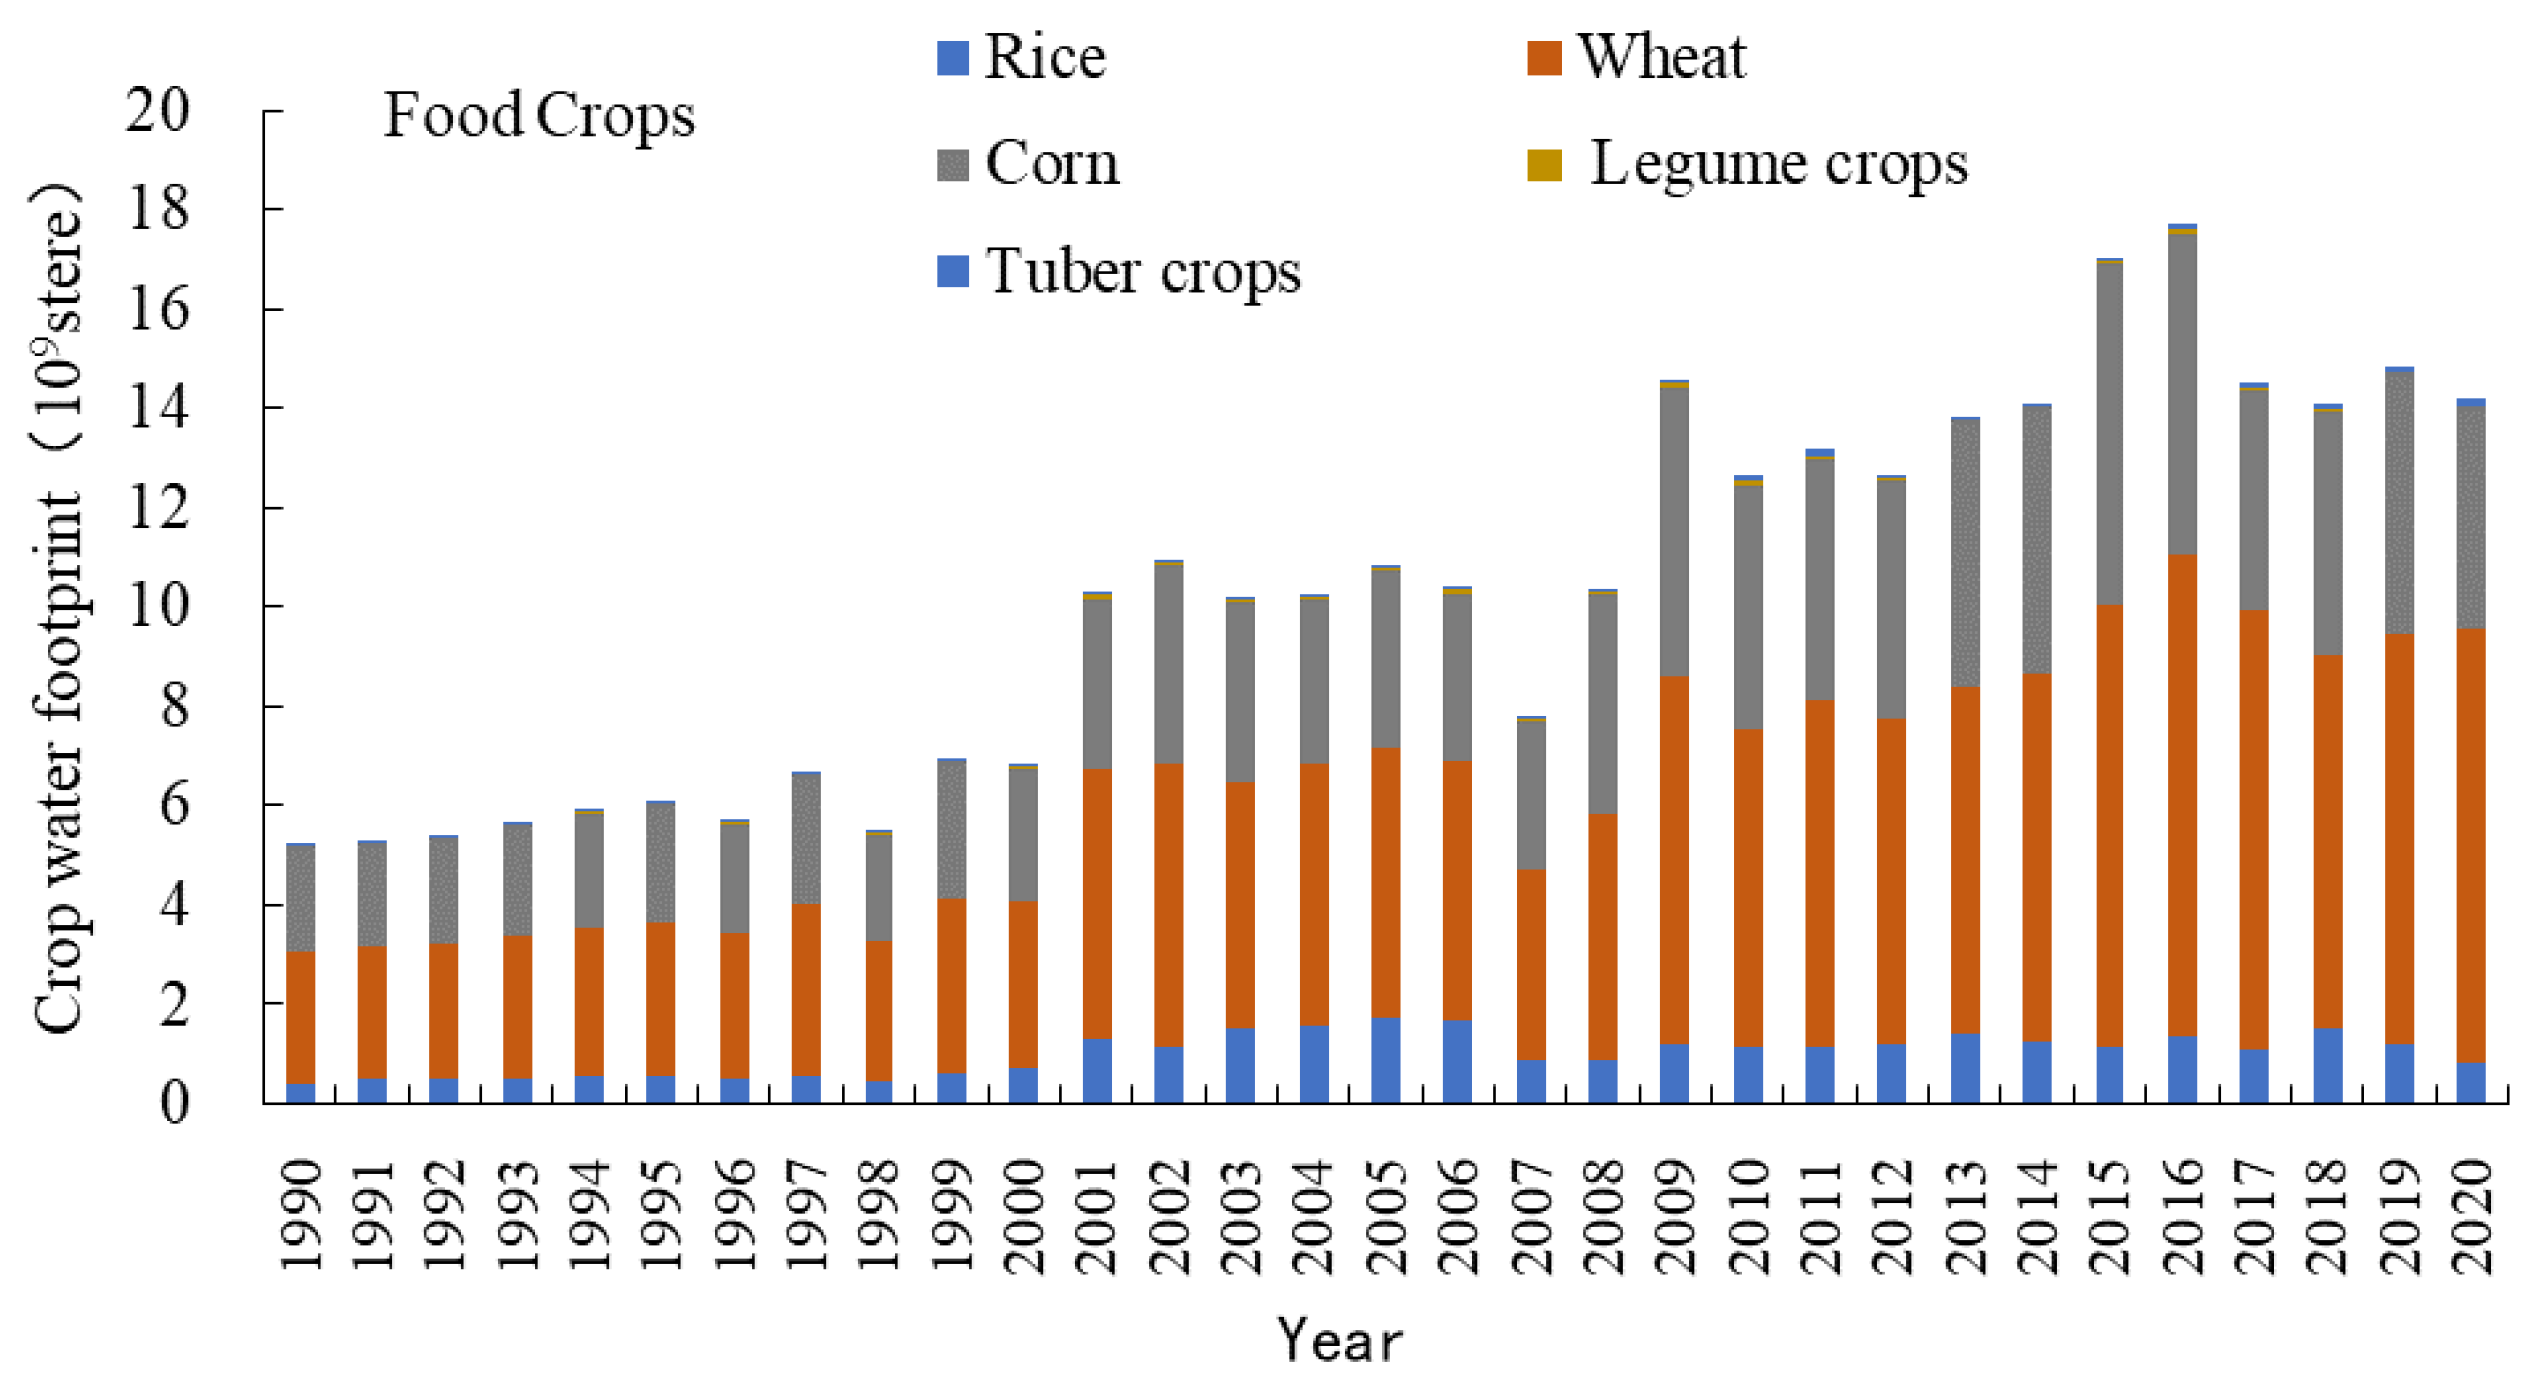
The results from the study of typical food crop water footprints in the research area between 1990 and 2020 (Figure 8) indicate an overall fluctuating growth trend in the water footprints of food crops. Among them, the wheat water footprint experienced the largest growth, increasing by nearly 609 million m3 over 31 years. The changes in the water footprints of tuber and legume crops were relatively stable compared to other crops, essentially remaining at around 10 million m3. The water footprints of rice and corn showed a fluctuating increase, with the rice water footprint increasing by 39 million m3 and the corn water footprint by 237 million m3 over 31 years. The average water footprint of various food crops over many years is as follows: wheat (541 million m3) > corn (379 million m3) > rice (100 million m3) > tuber crops (6 million m3) > legume crops (5 million m3).

3.3.2. Economic Crops

As shown in Figure 9, there was a clear trend of increase in the water footprint of typical economic crops in the Aksu region from 1990 to 2020. Among these, the water footprint of cotton, being the primary component of economic crop water footprint changes, increased by 3.786 billion m3 over 31 years. Following this were the water footprints of jujubes, vegetables, and apples, which increased by approximately 398 million m3, 112 million m3, and 110 million m3, respectively. The changes in the water footprints of other economic crops, compared to the four mentioned above, showed a trend of stable but increasing growth, essentially remaining around 4 million m3 to 55 million m3. The average water footprint of various economic crops over many years is as follows: cotton (2499 million m3) > jujubes (379 million m3) > apples (99 million m3) > vegetables (81 million m3) > alfalfa (68 million m3) > pears (60 million m3) > melons (57 million m3) > grapes (47 million m3) > sugar beets (36 million m3) > oil crops (11 million m3).

3.3.3. Comparison of the Water Footprint Structures of Different Crops

Table 2 shows the change in the distribution structure of crop water footprints between 1990 and 2020 in the study area. The proportion of cotton’s water footprint increased from 54% in 1990 to 66% in 2020. The multi-year average water footprint accounts for more than 57.2% of the typical crop water footprint. The proportion of cotton’s water footprint is significantly higher than that of other crops. Xinjiang’s unique photothermal resource conditions are conducive to large-scale cotton cultivation. Currently, Xinjiang is the largest cotton producing base in the country. The supply and demand situation of the cotton market is relatively stable throughout the year. Additionally, crops with a higher proportion in the water footprint include wheat and corn. Their multi-year average water footprints reach 12.38% and 8.68%, respectively. The water usage of typical grain crops, primarily wheat and corn, is also substantial in Xinjiang’s agricultural production, influenced by a combination of geographical conditions, national policies, and food security factors. The combined water footprint share of these three typical crops (cotton, wheat, and corn) grew from 81% in 1990 to 84% in 2020. The combined water footprint shares of other crops make up less than 20%. It is evident that there are differences in planting areas and proportions among various typical crops in the Aksu region, leading to variations in agricultural water usage.

3.4. Accounting for the Actual Water Usage in the Aksu Region

3.4.1. Analysis of Statistical Water Consumption

In accordance with the strictest water resource management system implemented in the counties (cities) of the Aksu region, adhering to the “three red lines” control indicators, the water usage red line indicator for the Aksu region in 2020 was set at 6.910 billion m3, which included 6.257 billion m3 of surface water, 0.613 billion m3 of groundwater, and 0.040 billion m3 from other sources. According to the Xinjiang Water Resources Bulletin, the total water usage in the counties of Aksu in 2020 amounted to 8.575 billion m3, exceeding the water usage control red line by 1.665 billion m3. Given the region’s relatively abundant water resources and numerous irrigation areas, the agricultural irrigation methods remain extensive, so there are still challenges. Monitoring of agricultural irrigation water intake in large- and medium-sized irrigation areas is mainly focused on the canal head, with other canal systems having a relatively low availability of associated water metering equipment. Small irrigation areas face relatively poor metering conditions, with a variety of crops and complex structures, making water management challenging. Therefore, there is a discrepancy between the statistical water usage data and the actual situation, indicating that the reported figures are lower than the actual water usage.

3.4.2. Analysis of Actual Water Usage Based on Water Footprint

This study estimates the actual field water usage by combining the blue water footprint of crops in the Aksu region calculated above with the agricultural irrigation water consumption rate obtained from field surveys and research. The specific actual water usage for each county and city can be found in Table 3.
According to the statistics, the total surface water diversion in the Aksu region’s counties and cities in 2020 was 8.657 billion cubic meters. The actual agricultural water usage in the Aksu region for 2020 was ultimately determined to be 10.922 billion cubic meters. Together with the industrial and domestic water usage of 206 million cubic meters, this results in a total actual water usage of 11.128 billion cubic meters for 2020. Taking into account the newly assessed groundwater extraction capacities of the Weihe River Basin and Aksu River Basin as reported in the “Xinjiang Water Security Strategic Guarantee Planning”, the future groundwater extraction in the Aksu region should be kept below 1.699 billion cubic meters. However, in 2020, the groundwater extraction in the Aksu region reached 2.265 billion cubic meters, exceeding the extractable groundwater volume of 1.699 billion cubic meters by 566 million cubic meters. This was 2.46 times the statistical exploitation. Kuqa City had the highest actual groundwater extraction in the region, amounting to 371 million cubic meters. The actual groundwater extractions in Kuqa City, Shaya County, and Wensu County accounted for about half of the total in the region. Shaya County had the largest discrepancy between actual and reported groundwater extraction, with the actual value being 6.53 times the reported amount. In recent years, the overall groundwater level in the Aksu region has shown a yearly decline. Over-extraction of groundwater has occurred in certain areas, and this imbalance between extraction and replenishment has led to the formation of sinkholes.
Similarly, the analysis and calculation of the actual water usage between 2001 and 2020 show that, according to the comparison with the statistical water usage, the actual water usage in each year was equal to or greater than the reported water usage, as shown in Figure 10. Water usage increased dramatically in 2003, and after 2012, the discrepancy between the statistical and actual data became more pronounced. This could be attributed to the Number One Central Document of 2011, which explicitly proposed the implementation of the strictest water resource management system, establishing a “three-system” framework of total water use control, water use efficiency control, and pollution limitations within water functional zones. Accordingly, “three red lines” were delineated for each region’s total water usage, water usage efficiency, and pollution restrictions within water functional zones. The establishment of the “three red lines” resulted in a significant reservation in the reported water usage data compared to the actual water usage, increasing the disparity between the two.

3.4.3. Review of Actual Water Usage Based on Water Footprint

(1)
Based on relevant survey data
Integrating the “Recent Comprehensive Management Plan for the Tarim River Basin” and the results of the third land survey in Xinjiang, the irrigation area of the “Nine Sources and One Mainstream” region in the Tarim River Basin yields 57.19 million mu. This is 15.8 million mu more than the reported irrigation area of 41.39 million mu (according to self-inspection report statistics). According to the water usage analysis from the self-inspection report statistics, the average agricultural water usage within the river cities is 506 m3 per mu, while the average agricultural water usage in the basins of the Aksu River, the main Tarim River, and the Dina River is below 450 m3 per mu. To accurately analyze the current state of water resource development and utilization in the basin, this study calculated the current supply of water from different sources. The surface water supply data were re-examined and analyzed through the water diversion information from basin management organizations and water management units. The groundwater supply data were reviewed through a comprehensive analysis combining the irrigation area, electricity consumption of mechanical wells, and changes in groundwater levels. The supply from other water sources is relatively small and is based on self-inspection report statistics submitted by various prefectures (corps divisions). The development of water resources in the basin was calculated and analyzed from both the supply and demand sides. According to the “Recent Comprehensive Management Plan for the Tarim River Basin,” the total water supply for the “Nine Sources and One Mainstream” area in 2020 was 35.51 billion m3, of which the surface water consumption was 6.843 billion m3, and the groundwater consumption was 2.567 billion m3. The difference in surface water volume before and after review is not significant, with the post-review surface water consumption differing by 10.62% from the statistical bulletin. However, the difference in groundwater volume before and after review is substantial, with the post-review groundwater consumption being approximately 2.79 times the reported extraction amount. This is mainly because groundwater is managed locally, and in the context of rapidly increasing irrigation areas, increasing groundwater extraction is the most convenient way to ensure supply.
(2)
Based on regional water balance
Based on relevant plans and special research reports, the total water resources in the Aksu region (including self-produced and imported) amount to 15.794 billion m3. The outflow of water from the region is 5.981 billion m3 (the amount of water leaving the region is equal to the amount of water discharged from Aral and the water used by the Corps). The ecological water demand of the Aksu region is 2.688 billion m3 (the data on the amount of ecological water demand are from the report on “Study on the Water Resource Carrying Capacity of the Aksu Region under the Changing Condition and its Comprehensive Regulation”). The socioeconomic water consumption is 6.993 billion m3 (including blue water footprint, industrial, and domestic water consumption). Thus, based on the water balance equation, the balance difference is calculated to be 132 million m3. This accounts for 0.84% of the total water resources, validating the water balance equation. This indicates that the calculated actual socioeconomic water usage in this study is reliable.

3.5. Analysis of Water Use Efficiency in Aksu

Comparing the actual water usage derived from this analysis with statistical bulletin data and water efficiency across Xinjiang and the entire country, as shown in Table 4, it was found that the actual per capita water usage in 2020 was 4099.6 m3, exceeding the 4066.9 m3 reported in the statistical bulletin. This figure is 1.9 times the level across Xinjiang. The actual water usage per CNY 10,000 of GDP was 846.2 m3, slightly above the 823.2 m3 reported in the statistical bulletin, making it 2.1 times the level across Xinjiang. The actual average water usage for irrigation per mu of farmland was 614.3 m3, 0.9 times that reported in the statistical bulletin and 1.1 times the level across Xinjiang. Over the past 30 years, influenced by national policies, distance from mainland markets, and a relative scarcity of talent, the economic development of the study area has primarily relied on expanding the area of irrigation. The adjustment of the industrial structure has been relatively slow, water usage has shown a rapid growth trend, and the proportion of agricultural water usage has not decreased but has slightly increased. Both water use efficiency and benefits are not high; economic benefits are especially low. This has become the most prominent issue and hidden danger in the development and utilization of water resources and water security in the study area.
Moreover, the over-extraction of groundwater should be highly emphasized. Although the study area is located in the upstream area of the Tarim River, with relatively abundant water resources and relatively more groundwater recharge along the main stream of the Tarim River, the current groundwater resource management system implements a hierarchical and departmental administrative regional management, and surface water and groundwater have always been managed separately. On 28 June 2023, the Ministry of Water Resources and the Ministry of Natural Resources studied, formulated, and issued the Measures for Groundwater Protection and Utilization Management, which requires the establishment of a sound system of groundwater management regulations. The formulation of groundwater management regulations in the Aksu region is required under the Measures in conjunction with the Basin Agency as soon as possible, so as to clarify groundwater management rights and strengthen law enforcement and management.

4. Discussion

The results show that the water footprint of crops in the Aksu region increased from 1.732 billion m3 in 1990 to 7.156 billion m3 in 2020 (Table 1), an increase of nearly 3.13 times. There were significant increases in 2003 and 2016 (Figure 4). In the composition of the water footprint, the green water footprint accounts for an average of 8% of the total crop water footprint, while the blue water footprint accounts for 92%. In the water footprint proportions of different crops, the share of cotton’s water footprint increased from 54% in 1990 to 66% in 2020. Over many years, the average water footprint accounted for more than 57.2% of the typical crop water footprint (Table 2), with cotton’s share being significantly higher than that of other crops.
The calculation of actual water usage based on the blue water footprint indicates that, in 2020, the Aksu region’s real water consumption amounted to 11.128 billion cubic meters. Of this, the total actual groundwater extraction was 2.265 billion cubic meters (Table 3).

5. Conclusions

In this study, we calculated and analyzed the water consumption of 15 types of crops in the Aksu region, a typical arid inland river area, over the past 30 year, i.e., the water footprint of crops. Based on the relationship and consumption process between the water footprint and irrigation water use in arid regions, we estimated the actual water usage in the Aksu region from 1990 to 2020. The results show that the water footprint of crops in the Aksu region increased from 1.732 billion m3 in 1990 to 7.156 billion m3 in 2020 (Table 1). There were significant increases in 2003 and 2016 (Figure 4). The variation trend was the same as that of the crop water footprint in the arid area of Northwest China [37]. Over many years, the average water footprint accounted for more than 57.2% of the typical crop water footprint, with cotton’s share being significantly higher than that of other crops. From 1960 to 2010, oasis farmland in Xinjiang continued to expand, and the planting structure of main crops changed significantly. The cash crops, represented by cotton, replaced the food crops, represented by wheat and corn, and became the dominant crop planting type in the oasis area of Xinjiang [38]. However, cotton is a crop with high water consumption, and the effect of planting density on the canopy photosynthetic rate can be studied to improve the cotton yield in Xinjiang [39]. In addition, land-use conflicts can be identified and suggestions made to optimize the spatial layout of cotton planting [40]. However, in the arid region of northwest China, maize is the main contributor to the blue and green water footprints (accounting for 21.15% and 20.31% of the total blue and green water footprints, respectively), which is closely related to the agricultural planting structure in the arid region of northwest China [37].
The total actual groundwater extraction was 2.265 billion cubic meters; this was 2.46 times the statistical exploitation. Over-extraction of groundwater has become a new threat to water and ecological security in the study area. The variation in the groundwater level in Xinjiang is significantly affected by agricultural irrigation [41]. Therefore, while accelerating the development of agricultural water-saving under the “water-saving priority” policy in the future, it is essential to focus on and control the issue of groundwater over-extraction to prevent new ecological degradation, moving towards the sustainable management of water resources. Relevant policies and measures should be introduced through the implementation of agricultural water-saving subsidy measures. A scientific groundwater monitoring and data analysis system should be established to monitor the groundwater level in real time. A unified water resources management agency or department should be established, responsible for the unified division of water resources and other methods to solve the problem of agricultural irrigation and groundwater overextraction [42].

Author Contributions

Conceptualization, X.L.; software, J.M. and C.R.; validation, C.R.; formal analysis, J.Z.; investigation, J.L. and Y.Z.; resources, A.L. and P.Z.; data curation, J.M.; writing—original draft preparation, J.M.; writing—review and editing, A.L. and P.Z.; visualization, J.Z.; supervision, X.D. and P.Z.; project administration, A.L.; funding acquisition, A.L., P.Z. and X.D. All authors have read and agreed to the published version of the manuscript.

Funding

This work was supported by the “Ten Thousand People Plan” of China for Science and Technology Innovation Leaders and the National Natural Science Foundation of China (Grant Nos. 52309041, 52179028).

Institutional Review Board Statement

Not applicable.

Informed Consent Statement

Not applicable.

Data Availability Statement

The data presented in this study are available on request from the corresponding author.

Conflicts of Interest

The authors declare no conflicts of interest.

References

  1. Wallace, J.S.; Gregory, P.J. Water resources and their use in food production systems. Aquat. Sci. 2002, 64, 363–375. [Google Scholar] [CrossRef]
  2. Fan, J.; Abudumanan, A.; Wang, L.; Zhou, D.; Wang, Z.; Liu, H. Dynamic Assessment and Sustainability Strategies of Ecological Security in the Irtysh River Basin of Xinjiang, China. Chin. Geogr. Sci. 2023, 33, 393–409. [Google Scholar] [CrossRef] [PubMed]
  3. Chen, H.; Xu, F.; Wang, X. Analysis of game theory in water resource management institutions—A case study of Qiantang River and Heihe River. J. Glaciol. Geocryol. 2018, 39, 1089–1097. [Google Scholar]
  4. Howell, T.A. Enhancing water use efficiency in irrigated agriculture. Agron. J. 2001, 93, 281–289. [Google Scholar] [CrossRef]
  5. Zhang, H.X. Water Sustainability and Renewable Energy: A Synopsis. In Water Sustainability; Springer: Berlin/Heidelberg, Germany, 2023; pp. 381–391. [Google Scholar]
  6. Bai, Y. Systems Modeling for Sustainable Water Resources Management and Agricultural Development. Ph.D. Thesis, New Mexico State University, Las Cruces, NM, USA, 2021. [Google Scholar]
  7. Jahangir, M.H.; Arast, M. Remote sensing products for predicting actual evapotranspiration and water stress footprints under different land cover. J. Clean. Prod. 2020, 266, 121818. [Google Scholar] [CrossRef]
  8. Abdullah, M. Assessment of wheat’s water footprint and virtual water trade: A case study for Turkey. Ecol. Process. 2020, 9, 13. [Google Scholar]
  9. Shtull-Trauring, E.; Bernstein, N. Virtual water flows and water-footprint of agricultural crop production, import and export: A case study for Israel. Sci. Total Environ. 2018, 622, 1438–1447. [Google Scholar] [CrossRef] [PubMed]
  10. Hoekstra, A.Y. Virtual water trade. In Proceedings of the International Expert Meeting on Virtual Water Trade, Delft, The Netherlands, 12–13 December 2002; Value of Water Research Report Series No. 12. UNESCO-IHE: Delft, The Netherlands, 2003. [Google Scholar]
  11. Hoekstra, A.Y.; Chapagain, A.K. Water footprints of nations: Water use by people as a function of their consumption pattern. In Integrated Assessment of Water Resources and Global Change: A North-South Analysis; Springer: Berlin/Heidelberg, Germany, 2007; pp. 35–48. [Google Scholar]
  12. Liu, J.; Zehnder, A.J.; Yang, H. Global consumptive water use for crop production: The importance of green water and virtual water. Water Resour. Res. 2009, 45, W05428. [Google Scholar] [CrossRef]
  13. Chapagain, A.K.; Hoekstra, A.Y. The blue, green and grey water footprint of rice from production and consumption perspectives. Ecol. Econ. 2011, 70, 749–758. [Google Scholar] [CrossRef]
  14. Li, D.P.; Jie, Q.L.; Wang, Y.; Shi, H.H. Spatiotemporal correlations between water footprint and agricultural inputs: A case study of maize production in Northeast China. Water 2015, 7, 4026–4040. [Google Scholar] [CrossRef]
  15. Long, A.; Xu, C.; Zhang, C. Virtual water theory and empirical study of virtual water in four provinces of Northwest China. Adv. Earth Sci. 2004, 19, 577. [Google Scholar]
  16. Lin, X.; Xu, F.; Ma, X.; Chen, Y.; Dang, X.; Ma, F.; Liu, Y. Analysis and evaluation of different crop production and planting structure based on water footprint in Tarim River Basin: A case study of five prefectures from 1990 to 2020. J. China Agric. Resour. Reg. Plan. 2023, 1–11. [Google Scholar]
  17. Ercin, A.E.; Hoekstra, A.Y. Water footprint scenarios for 2050: A global analysis. Environ. Int. 2014, 64, 71–82. [Google Scholar] [CrossRef]
  18. Yuan, Z.; Shen, Y. Estimation of agricultural water consumption from meteorological and yield data: A case study of Hebei, North China. PLoS ONE 2013, 8, e58685. [Google Scholar] [CrossRef]
  19. Hoekstra, A.Y.; Chapagain, A.K. The water footprints of Morocco and the Netherlands: Global water use as a result of domestic consumption of agricultural commodities. Ecol. Econ. 2007, 64, 143–151. [Google Scholar] [CrossRef]
  20. Mekonnen, M.M.; Hoekstra, A.Y. The green, blue and grey water footprint of crops and derived crop products. Hydrol. Earth Syst. Sci. 2011, 15, 1577–1600. [Google Scholar] [CrossRef]
  21. Rushforth, R.R.; Ruddell, B.L. A spatially detailed blue water footprint of the United States economy. Hydrol. Earth Syst. Sci. 2018, 22, 3007–3032. [Google Scholar] [CrossRef]
  22. Zhang, P.; Long, A.; Hai, Y.; Deng, X.; Wang, H.; Liu, J.; Li, Y. Research on the spatiotemporal changes and policy drivers of agricultural water use in Xinjiang from 1988 to 2015. J. Glaciol. Geocryol. 2021, 43, 242–253. [Google Scholar]
  23. Long, A. (China Institute of Water Resources and Hydropower Research, Beijing, China). Research on the Water Resources Carrying Capacity and Integrated Regulation in Aksu Region under Changing Conditions. Unpublished work. 2023. [Google Scholar]
  24. Xinjiang Water Use Control Plan; Phase: Government Plan; Xinjiang Uygur Autonomous Region People’s Government: Xinjiang, China, 2017.
  25. Water Resources Department, China; Xinjiang Uygur Autonomous Region Government, China. Comprehensive Management Planning Report for the Tarim River Basin in the Near Future. Unpublished work. 2001; (Phase: Government Report). [Google Scholar]
  26. Hoekstra, A.Y. The Water Footprint Assessment Manual: Setting the Global Standard; Routledge: London, UK, 2011. [Google Scholar]
  27. Wu, P.; Sun, S.; Wang, Y.; Li, X.; Zhao, X.N. Research on quantification method and evaluation of crop production water footprint. J. Hydraul. Eng. 2017, 48, 651–660. [Google Scholar]
  28. Liu, W.; Antonelli, M.; Liu, X.; Yang, H. Towards improvement of grey water footprint assessment: With an illustration for global maize cultivation. J. Clean. Prod. 2017, 147, 1–9. [Google Scholar] [CrossRef]
  29. Lovarelli, D.; Bacenetti, J.; Fiala, M. Water Footprint of crop productions: A review. Sci. Total Environ. 2016, 548, 236–251. [Google Scholar] [CrossRef]
  30. Ai, P.; Wu, J.; Wang, X.; Ding, Q. Water temperature time series test based on Mann-Kendall method. Water Resour. Hydropower Eng. 2014, 45, 10–12. [Google Scholar]
  31. Cao, J.; Chi, D.; Wu, L.; Liu, L.; Li, S.; Yu, M. Application of Mann-Kendall test in precipitation trend analysis. Agric. Sci. Technol. Equip. 2008, 5, 35–37. [Google Scholar]
  32. Chen, C.; Xu, Q. Mann-Kendall test for analyzing the characteristics of time-varying precipitation. Bull. Sci. Technol. 2016, 32, 47–50. [Google Scholar]
  33. Hu, Q.; Ma, X.; Hu, L.; Wang, Y.; Xu, L.; Pan, X. Application of Matlab in teaching meteorology majors—MK test mutation analysis of meteorological elements. Res. Explor. Lab. 2019, 38, 48. [Google Scholar]
  34. Veettil, A.V.; Mishra, A.K. Water security assessment using blue and green water footprint concepts. J. Hydrol. 2016, 542, 589–602. [Google Scholar] [CrossRef]
  35. Li, W.; Zhang, W.; Ge, J.; Peng, H. Methods and applications of water balance analysis. Water Resour. Prot. 2011, 27, 83–87. [Google Scholar]
  36. Guo, Y. An empirical study on the change of regional industrial ecological footprint—Taking Xinjiang as an example. Hubei Agric. Sci. 2013, 52, 1966–1970. [Google Scholar]
  37. Zhang, J.; Huang, H.; Han, Y.; Deng, M.; Yang, T. Coordinated adjustment of planting structure in northwest arid region from the perspective of water footprint. South North Water Transf. Water Sci. Technol. 2023, 21, 751–760. [Google Scholar]
  38. Lv, N.; Bai, J.; Chang, C.; Li, J.; Luo, G.; Wu, S.; Ding, J. Temporal and spatial changes of evapotranspiration in oasis farmland in Xinjiang based on crop planting structure in recent 50 years. Geogr. Res. 2017, 36, 1443–1454. [Google Scholar]
  39. Zhang, W.-F.; Wang, Z.-L.; Yu, S.-L.; Li, S.-K.; Fang, J.; Tong, W.-S. Effects of planting density on canopy photosynthesis, canopy structure and yield formation of high-yield cotton in Xinjiang, China. Chin. J. Plant Ecol. 2004, 28, 164. [Google Scholar]
  40. Zhu, Y.; Sun, L.; Luo, Q.; Chen, H.; Yang, Y. Spatial optimization of cotton cultivation in Xinjiang: A climate change perspective. Int. J. Appl. Earth Obs. Geoinf. 2023, 124, 103523. [Google Scholar] [CrossRef]
  41. Cao, W.; An, K.; Zi, W.; Lv, S. Determination of groundwater level control index in typical groundwater overdraft area of Xinjiang—A case study of Wusu City groundwater overdraft area. Ground Water 2024, 46, 77–80. [Google Scholar]
  42. Fang, J. Some suggestions on solving the problem of agricultural irrigation and groundwater overdrawing. Hebei Agric. Mach. 2023, 15, 79–81. [Google Scholar]
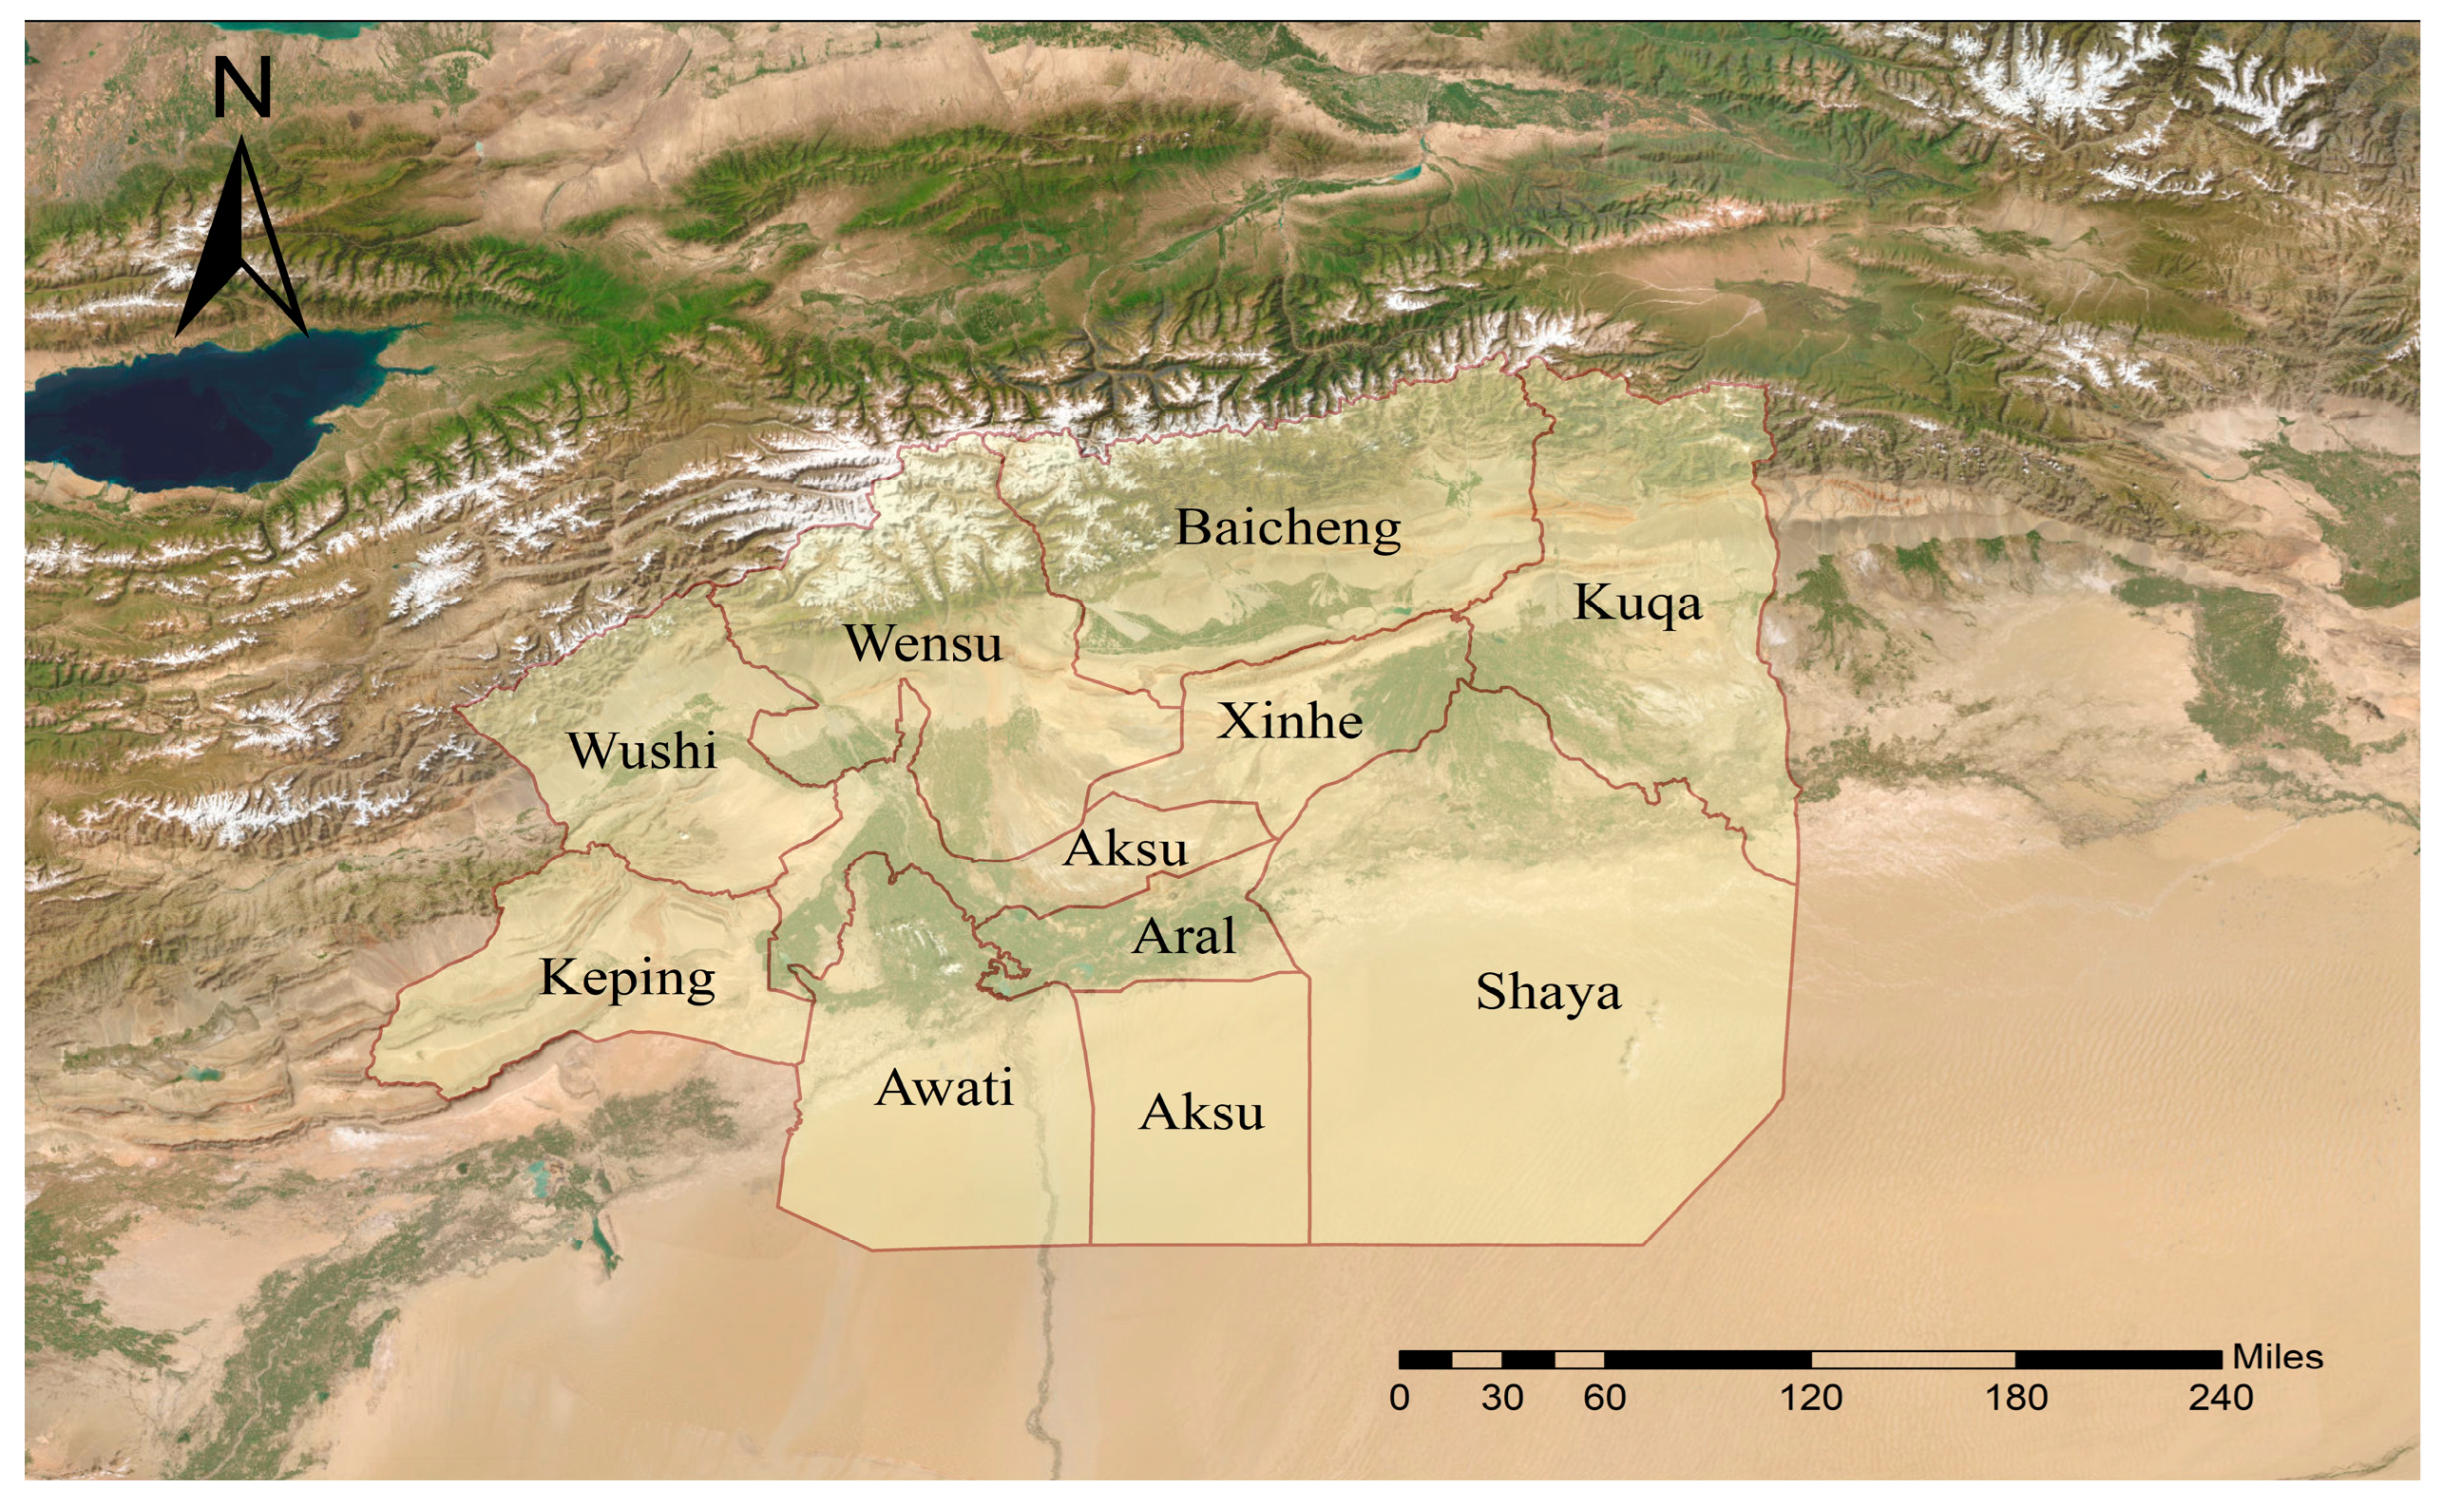
Figure 1. Schematic diagram of the study area.
Sustainability 16 02911 g001
Figure 2. Calculation of true water consumption.
Sustainability 16 02911 g002
Figure 3. Phased fitting curves of water footprint changes in the Aksu region from 1990 to 2020.
Sustainability 16 02911 g003
Figure 4. Mann–Kendall abrupt change test based on the phased linear fitting results of the Aksu water footprint.
Sustainability 16 02911 g004
Figure 5. The relationship curve between crop water footprint, total sown area, and total yield.
Sustainability 16 02911 g005
Figure 6. Interannual variations in the green water footprint in the Aksu region from 1990 to 2020.
Sustainability 16 02911 g006
Figure 7. Spatial distribution characteristics of green and blue water footprints in crop production in the Aksu region.
Sustainability 16 02911 g007
Figure 8. The process of change in the water footprint of grain crops in the Aksu region from 1990 to 2020.
Sustainability 16 02911 g008
Figure 9. The process of change in the water footprint of economic crops in the Aksu region from 1990 to 2020.
Sustainability 16 02911 g009
Figure 10. Changes in actual water usage versus reported water usage from 2001 to 2020.
Sustainability 16 02911 g010
Table 1. The changes in water footprint in the Aksu region from 1990 to 2020.
City1990200020102020
Aksu2594149801043
Wensu177400865778
Awati2923968361165
Wushi94145206214
Keping122595113
Kuqa3554158201306
Shaya2793758641478
Xinhe167234505699
Baicheng98174236359
Amount1732257954077156
Note: Data in the table are in million cubic meters.
Table 2. The change in the distribution structure of crop water footprints in the Aksu region from 1990 to 2020.
Crop Names1990200020102020
rice2.38%2.75%2.16%1.12%
wheat15.33%13.07%11.81%12.22%
corn12.24%10.34%9.06%6.27%
legume crops0.10%0.15%0.14%0.02%
tuber crops0.18%0.15%0.21%0.23%
cotton53.79%53.49%52.22%65.93%
oil crops0.38%0.32%0.19%0.14%
sugar beets0.86%0.86%1.00%0.46%
vegetables2.08%2.09%1.81%2.06%
melons1.29%1.46%1.36%1.08%
alfalfa2.30%1.88%1.78%0.73%
jujubes1.85%7.82%13.56%6.01%
apples2.79%2.53%2.43%2.22%
grapes1.66%1.33%0.99%0.66%
pears2.77%1.74%1.26%0.85%
Table 3. Aksu region groundwater extraction volume statistics for 2020 by county and city.
CityReal Water ConsumptionStatistical Water ConsumptionStatistical ExploitationActual Surface Water ReferencesActual Groundwater Extraction
Aksu1.4861.0270.1651.1380.348
Wensu1.5411.2250.2891.1750.366
Awati1.4511.0210.091.1320.319
Wushi0.6120.7090.0530.4630.149
Keping0.1570.1120.010.1190.038
Kuqa1.9341.4940.0961.5630.371
Shaya1.6391.1680.0561.2730.366
Xinhe0.9660.770.1470.7280.238
Baicheng1.1361.0490.0141.0660.07
Amount10.9228.5750.9198.6572.265
Note: Data in the table are in billion cubic meters.
Table 4. The 2020 water use efficiency summary for the Aksu region.
AreaPer Capita Water Consumption ①Per Capita Water Consumption ②Water Consumption per 10,000 Yuan of GDP ①Water Consumption per 10,000 Yuan of GDP ②Average Water Consumption per mu for Actual Irrigation in Farmland ①Average Water Consumption per mu for Actual Irrigation in Farmland ②
Aksu region4066.94099.6823.2846.2693.4614.3
Xinjiang region2127.22127.2398.6398.6553.1553.1
Aksu/Xinjiang1.91.92.12.11.31.1
Notes: (1) Data in the table are in cubic meters. (2) The data are sourced from the China Water Resources Bulletin and the Xinjiang Water Resources Bulletin, using the prices of the respective year. ① The data are derived from the 2020 Water Resources Statistical Bulletin of the Xinjiang Uygur Autonomous Region. ② The water efficiency of the Aksu region is calculated based on the actual water usage.
Disclaimer/Publisher’s Note: The statements, opinions and data contained in all publications are solely those of the individual author(s) and contributor(s) and not of MDPI and/or the editor(s). MDPI and/or the editor(s) disclaim responsibility for any injury to people or property resulting from any ideas, methods, instructions or products referred to in the content.