Article

A Hybrid Modeling Approach for Estimating the Exposure to Organophosphate Pesticide Drift in Sangamon County, Illinois

College of Agriculture, Environment and Nutrition Sciences, Tuskegee University, Tuskegee, AL 36088, USA
*
Author to whom correspondence should be addressed.
Sustainability 2024, 16(7), 2908; https://doi.org/10.3390/su16072908
Submission received: 22 January 2024 / Revised: 20 March 2024 / Accepted: 27 March 2024 / Published: 30 March 2024
(This article belongs to the Special Issue Agriculture, Land and Farm Management)

Abstract

:
According to estimates from the World Health Organization (WHO), organophosphate pesticides are responsible for approximately 300,000 deaths worldwide. In the United States, documented cases of organophosphate pesticide exposure number around 8000, with a small number of fatalities occurring annually. The health risks associated with these pesticides affect those living in agricultural areas, as well as farmers and pesticide applicators. Despite the intervention of government agencies in Illinois to regulate pesticide application, studies have shown that these pesticides remain present in the soil, crops, water, and air. Urban-agricultural interface communities around Sangamon County exhibit significant levels of air pollution due to pesticide spray drift, although the lack of reliable pesticide data poses a challenge in estimating the extent of the problem. Therefore, developing novel strategies to reduce the impact of pesticides on environmental health is a critical and effective research area. Currently, new, dependable models and methods are being developed to calculate spray drift and mitigate its effects. The primary objective of this study was to investigate whether and to what extent organophosphate pesticide spray drifts into urban-agricultural interface communities in Sangamon County, Illinois. To achieve this, the current study employed an integrated approach that combined the capabilities of the HYSPLIT and AgDRIFT models to evaluate organophosphate pesticide spray drifting at both the field- and county-level scales. In the absence of precise pesticide quantity data, this novel approach allowed for field simulations within identified exposure drift zones. The preliminary findings indicate that all residential areas close to agricultural areas are at risk of pesticide drift, as buffer zones do not exceed 25 m. Furthermore, of the 34 water bodies (rivers, lakes, streams, and drains) in the 30,200-acre study region, 12 are within the high-drift zone for pesticide spray drift from corn and soybean fields. Finally, the potential for organophosphate pesticide drift was present in approximately 106 buildings, covering an area of 10,300 km2.

1. Introduction

Pesticides are chemicals and biologically active compounds used as plant protection products (PPP) to safeguard crops from pests and diseases that can harm agricultural products and food production [1,2]. The excessive use of pesticides has resulted in widespread pollution, which can be found in the atmosphere, soils, water bodies, and crops [3,4]. The increased demand for crop production has led to a rise in pesticide usage, especially in agriculture. However, the growing use of pesticides has become a serious public health concern [5]. While pesticides have been highly effective in preserving crops from insects, pests, and disease outbreaks, they have also caused air, water, and soil pollution, raising public concern [4,5,6]. They are harmful pollutants that have a significant impact on ecosystems and public health [6]. Due to the compounds’ toxicity and their prolonged exposure to humans, whether voluntarily or not, there is a direct correlation between these substances and an increased incidence of cancer that disrupts the endocrine system [7,8].
Pesticides are believed to cause a variety of additional disorders, including learning disabilities and significant decreases in intelligence and behavior. Children are more susceptible to pesticide exposure than adults, as their bodies are still developing [7,8,9].
Agricultural pesticides are widely used worldwide to manage weeds, pests, and insect species, with the United States being the second-largest consumer of pesticides [10]. The usage of pesticides in agricultural activity represents approximately 90% of pesticide applications in the United States, making applicators, farm laborers, and their families particularly vulnerable to the impacts of these poisonous substances [10,11,12,13,14,15]. Studies suggest that pesticide exposure leads to severe illnesses among agricultural workers, with an estimated 10,000–20,000 workers in agriculture in the USA suffering from such illnesses each year [16,17]. The estimate could reach 300,000 acute illnesses annually, especially symptoms associated with respiratory diseases, when taking into account workers who choose not to seek care from a medical facility [18,19].
A significant prospective investigation of pesticide users in the United States revealed that sixteen percent of those surveyed suffered less than one poisoning caused by pesticides or extremely severe pesticide exposure event during their lives [20,21,22]. Pesticide vapors from farmers’ applications cause health issues in urban–rural interface communities, including heart, lung, kidney, weight loss, and reproductive effects due to a lack of pesticide exposure data [23,24,25,26,27,28].
Organophosphate pesticides, which are widely used in the US for agriculture and residential purposes, are neurotoxic and can cause neurodevelopmental issues like autism and attention deficit hyperactivity disorder (ADHD). High exposure levels could lead to numerous pesticide poisonings worldwide [28,29,30,31,32]. Pesticide drift, which refers to the unintentional displacement of pesticide droplets, has grown into an ever more contentious issue in urban-agricultural interface communities and has an impact on social and environmental justice, particularly concerning quality of life [33,34].
Investigating the estimation of pesticide drift from treatment fields has become a significant research project due to its impact on the health of residents living near the treated fields. However, contemporary approaches in this complex study face several challenges [35].
Atmospheric models are capable of analyzing a wide range of spray drift situations arising from agricultural applications and off-site deposition of pesticide chemical compositions [36,37,38]. These mathematical models, such as AGricultural DISPersal (AgDISP), AgDRIFT, CALPUFF, and Atmospheric Dispersion Modelling System (ADMS), can estimate spray drift deposition downwind from various application techniques [39,40,41,42,43,44]. Organophosphate substances are a varied category of chemicals utilized in the agricultural and industrial sectors. In Illinois, eight organophosphate pesticides are used, with an amount of approximately 75,754 Ib. annually [45].
Between 2017 and 2019, the Illinois Department of Agriculture received over 1476 complaints related to pesticide misuse, with around 60% of these complaints being related to pesticide drift. To curb this issue, the department is actively working on promoting the proper use of pesticides and improving the agricultural industry in Sangamon County [46].
Pesticides are a global concern due to their potential to spread and transport through various factors. Accurately measuring these factors is crucial in understanding the widespread problem of pesticide exposure drift. This study examines the possibility of estimating exposure to chemical pesticide drift in Sangamon County, Illinois.
Previous studies on pesticide exposure have been limited by their data sources and methods, such as patient surveys and questionnaires. These methods can lead to misclassifications due to recall biases, limited knowledge about crop patterns, and a lack of specific pesticide ingredients [47]. The large number of pesticide classes and types available on the market, each with unique interactions with organisms, makes it difficult to study the effects of pesticides due to a shortage of pesticide use data [48].
Several methodologies are available for characterizing pesticide exposure drift, such as personally administered inquiries, surveys, bio-monitoring data, geographic information systems (GIS), and atmospheric models. However, there are limitations to each of these methods, including inaccuracies caused by individuals’ lack of knowledge concerning pesticide usage, actual distance from dwellings, recall bias, and short exposure times [49,50,51,52,53,54,55,56,57,58].
Large-scale studies focusing on the environment and health require precise measurements of pesticide exposure near crops. In previous studies, the Spraying Drifting Task Force (SDTF) regular standards were used to determine the potential risks of being exposed to pesticide drift [59,60,61]. However, the lack of an agricultural pesticide database has made it necessary to rely on comparing pesticide usage distribution with maps. To explore the impact of pesticide drift on the environment and community well-being, especially in counties that lack pesticide usage records, previous studies have used GIS and satellite imagery. Their approach and findings will be more relevant and useful at a county-wide level, such as in Sangamon County [57,58,59,60,61,62,63].
Dappen [64] used supervised classification in a GIS environment to create a map of land usage and cover. This map was then scaled up to cover the whole state of Nebraska during the 2005 season of growth. Shelton [65] found that pregnant women exposed to two common agricultural pesticides—organophosphates and pyrethroids—in their homes may have a higher incidence of autism spectrum disorder (ASD). Additionally, Wang [66] developed a model to evaluate the risk of Parkinson’s disease caused by pesticide exposure in the environment. This study concluded that spray drift could be calculated and simulated based on the method of application and proximity to unintended targets’ buffer zones. Wan’s study [47] utilized county-level USGS pesticide usage data, census data, and LULC data to estimate the potential pesticide drift. It found that 12% of the population in Nebraska was at risk of pesticide drift. Gibbis [67] showed that pesticide concentrations were higher in homes near agricultural areas compared to control houses. Both pesticide indoor concentrations and outdoor surface deposition were higher in houses within 255 m of orchard fields than in non-proximal households. However, interior air measurements showed no changes between the two groups of homes. Zivan [68] measured airborne pesticides in a persimmon orchard during three separate applications of organophosphate pesticides. The results were compared to meteorological data to better understand dispersion patterns, allowing for a more comprehensive evaluation of air concentrations in nearby communities. Mayer’s study [69] integrated LULC data and satellite images to estimate residential exposure drift to atrazine and glyphosate in Madison County. The majority of people lived in rural, sparsely populated communities, with 3.3% considered highly exposed. Mayer’s study also discussed the spatial pattern of exposure and a literature review on drift, disease, and regulations.
A study conducted by El Afandi [33] found that in areas with inaccurate pesticide data, GIS and remote sensing techniques can be used to predict crop exposure to pesticide drift. The study revealed that 6.6% of Macon County residents, predominantly those living in rural regions, may be at high risk of exposure. The researchers concluded that the AgDRIFT model is more effective in estimating pesticide spread at a field level. Another study [44] used a unique approach that combined the AgDRIFT atmospheric model and the OpenAir R package with satellite image data to accurately calculate the spray drift of organophosphate pesticides in two case studies in Macon County, Alabama. Despite the lack of previous data on pesticide quantities, this study allowed for field simulations within specific exposure zones.
This study aims to estimate the drift of organophosphate pesticides from their targets by relying on dynamic models such as the HYSPLIT model. Unlike previous studies that relied on atmospheric static models, which assume that weather data remain constant, these models take into account changes in variables over time, such as wind speed and direction, air temperature, and relative humidity. Therefore, the current study developed a hybrid matrix for dynamic atmospheric model parameters, which includes dispersion direction, computed center-of-mass trajectory, emission rate, release quantity, species lifetime, application height, horizontal Gaussian puff, and vertical top hat puff, among others. In addition, it utilized a new approach to better understand the organophosphate pesticide dispersion patterns and identify the potential receptors of pesticide exposure drift and deposited particles. In addition, it estimated the quantity of organophosphate pesticide drift in Sangamon County, Illinois, by simulating several pesticide data sources using the appropriate dynamic models. Thus, the HYSPLIT dispersion model is used to provide an estimation of pesticide concentration drift at the county-level scale and the AgDRIFT model to provide an estimation of downwind deposition of spray drift at the field-level scale.
This hybrid methodology effectively utilized computing power to simulate a variety of model results, making it possible to study the exposure of populations and water bodies to organophosphate pesticide drift not only at the county level but also at the field level, which contributes to increased confidence in the outcomes of simulations. To the best of our knowledge, this is the first study utilizing a hybrid modeling approach to estimate the drift of organophosphate pesticides in Sangamon County, Illinois. The study’s findings could have important implications for policymakers and researchers to better understand and mitigate the impact of pesticide exposure on human health and the environment.
The current study aims to address two specific questions:
  • How many residential areas and water bodies in Sangamon County are at risk of being exposed to organophosphate pesticides?
  • Where the areas with the highest percentage of pesticide are drift exposure incidents in Sangamon County?

2. Materials and Methods

2.1. Study Area

Sangamon County is a Central-Illinois-based county with an area of 877 square miles [70]. According to the 2020 Census, it has a population of 196,343 people. The county has mostly flat terrain and rich agricultural soils, which contribute to its high agricultural output. Twenty-seven incorporated towns are present in Sangamon County. Springfield, which is the state capital seat, is part of the main urbanized area. While some of the more rural areas are located further away, the City of Springfield is adjacent to some of the more compactly incorporated communities. Agriculture is the primary industry in the unorganized outer districts. Figure 1 shows the location and main LULC units of the study area.
Sangamon County has a diverse climate, with average highs of 112 °F in 1954 and record lows of −24 °C in 1905. The average temperature ranges from −8 °C in January to 87 °F in July. January has an average precipitation of 1.62 inches, while May sees 4.06 inches of rainfall [70]. Menard County is to the north, Logan County to the northeast, Macon County to the east, Christian County to the southeast, Montgomery County to the south, Macoupin County to the south, Morgan County to the west, and Cass County to the northwest.
Pesticide exposure drift events have increased significantly in Sangamon County over the past few years. Depending upon the quantity, application period, and type of pesticide applications resulting from chemical control of crops, the Sangamon County Multi-Jurisdictional Mitigation Plan Task Force (JMPTF) may conduct local air quality monitoring to mitigate hazards during the event. Buffer zones may even be required to protect people near agricultural fields from harm.

2.2. Datasets

2.2.1. HYSPLIT Meteorological Input Data

For this research, the High-Resolution Rapid Refresh (HRRR) data were utilized to produce high-resolution meteorological input data using the HYSPLIT model. Accurately forecasting pesticide drift and dispersion at the county-level scale requires the proper utilization of meteorological data. Since 2019, the HYSPLIT atmospheric model has provided routine HRRR datasets for the entire North American region with a 3 km spatial accuracy. The data are functioning and can be downloaded within minutes through the following URL: https://rapidrefresh.noaa.gov/hrrr/, accessed on 1 January 2024.
To assess the validity of these HRRR data for specific locations, local weather station data from three locations in Sangamon County—Logan, Christian, and Springfield—were retrieved. CSV spreadsheets containing hourly wind direction, wind speed, and air temperature data were generated for each field site for the spring and summer of 2019.
For the week of 1–7 July 2019, three-day backward trajectories arriving in Springfield city (39.7817 N, 89.6501 W) were computed at 0, 6, 12, and 18 UTC for every day. These daily moments were chosen to maximize the total number of trajectories. This time frame was considered appropriate for both aerial pesticide application and monitoring the drifting of organophosphate pesticides beyond their original targets.
The trajectory sets from one week were run through three separate clustering algorithms at three different arrival altitudes (25, 75, and 150 m AGL) to assess their clustering patterns.

2.2.2. Crop Data

Crop data for Sangamon County were obtained using the Crop-Scape-Crops Dataset Layer (CDL) database, which was created in collaboration with USDA’s National Agricultural Statistical Services (Figure 2). This database includes high-resolution 30 m satellite imagery that covers a period of over twenty-five years (1997–2022) and provides extensive information on agricultural land use and aerial applications (https://nassgeodata.gmu.edu/CropScape/, accessed on 4 January 2024). The data from this database were used to calculate the quantity of organophosphate pesticides used, which was obtained by multiplying the crop cultivation area by the average pesticide rate of 2.40 kg per acre [71,72].

2.2.3. Pesticide Usage Data

This study relied on yearly agricultural pesticide reporting data provided by the United States Environmental Protection Agency (USEPA) and the Department of Agriculture (USDA), which are obtained annually by the National Agricultural Statistics Service (NASS) at the state level [45,73], to determine the quantity of organophosphate pesticide consumption data. Table 1 and Table 2 contain these reporting data on pesticide use. It was assumed that the quantity of pesticides sprayed for corn and soybean crops was equal, and the potential of pesticides drifting beyond their intended targets could be estimated by the type of application employed, whether ground or aerial. To calculate the field’s total deposit, residential and aquatic areas were combined.

2.2.4. Land Use/Land Cover Dataset

The European Space Agency (ESA) has created a global Land Use and Land Cover (LULC) map using Sentinel-2 imagery with a spatial resolution of 10 m, which identifies the most significant LULC units, such as cropland, water bodies, residential areas, and forests (Table 3). The map has been generated using a deep learning algorithm developed from over five trillion hand-labeled Sentinel-2 images from more than 20,000 locations across the world [74]. This Sentinel-2 global LULC dataset provides accurate land cover information that can be used for various applications such as urban planning, agriculture, and environmental monitoring.

2.2.5. Meteorological Data

The main source of meteorological data used in this study was the National Weather Service (NWS) Director’s office, which is an NOAA Associate Director for Meteorological Resources database. The NWS collects weather-related data, including wind direction and speed, air temperature, relative humidity, and precipitation, on an hourly basis. All relevant climate variables can be accessed at https://www.weather.gov/wrh/Climate?wfo=bmx. Weather data for Sangamon County were collected for the entire research period (spring and summer of 2019), with the data last accessed on 4 January 2024. Hourly wind speed and direction data for the AgDRIFT model were obtained using this information.

2.3. Methodology

The current study has developed a hybrid modeling approach by using the HYSPLIT and AgDRIFT models. This approach is used to estimate the exposure to organophosphate pesticide drift in Sangamon County, Illinois. This method predicts the exposure of residential areas and water bodies to organophosphate pesticide drifting from intended targets in the county. The method uses meteorological data, the Cropland dataset, and information on populations’ distribution and pesticide use to predict the population’s exposure to pesticides, including organophosphates, at both the field and county levels.
This approach involves clustering analysis, modeling backward trajectories, and investigating potential sources and routes of transmission of pesticide substances in the atmosphere. Moreover, it uses AgDRIFT to assess possible drift exposure on a field-level basis. It is worth noting that in this study, the exposure to organophosphate pesticide drift was estimated at both the field and county levels. The decision was taken primarily because tracking the movement of air masses contaminated by pesticides provides an estimation of these chemicals’ drift from their intended targets at the county level. Furthermore, understanding the application type and local meteorological conditions has significant impacts on assessments of pesticide drift risk at the field level.

2.3.1. HYSPLIT Clustering Analysis

Clustering is a process of unsupervised learning that divides data objects based on their similarity or heterogeneity. This allows for the classification of objects into either the same cluster or different clusters. Unlike classification, clustering does not require model training [75,76].
In this study, the air mass of the pollution induced by pesticide spray and the release of particles, vapor, and puffs were connected using the HYSPLIT model to calculate pollutant concentrations. Each cell on the grid was utilized to estimate air concentrations and compute particle advection and diffusion from the initial position.
The raw data formed the foundation for the air pollution trajectories clustering approach used in this study. The study classified the air-polluted trajectories induced by organophosphate pesticides into five distinct groups based on a K-means clustering analysis. K-means clustering is a particularly well-known partitioning method for clustering and the most often utilized among all clustering algorithms due to its simplicity and effectiveness.
Equation (1) explains that every location has the potential to be chosen as the central location. In this equation, ‘s’ refers to the central number, ‘xr’ represents one of the remaining points, ‘D(xr)’ is the measurement of the distance between ‘xr’ and the nearest existing cluster, and ‘E’ is the expectation that ‘xr’ will be selected as the central point [77,78].
p r = D 2 x r i = 1 n s D 2 x r
In this study, trajectory clustering was conducted to identify the primary potential source directions of pesticides in Sangamon County based on the similarity of trajectories. The HYSPLIT model is widely used in the atmospheric sciences community for air transport and dispersion, particularly for backward trajectory analysis. This method helps determine the origin of air masses and identify source-receptor interconnections. In our study, we relied on the capabilities of the HYSPLIT model to identify the source of pesticides affecting the city of Springfield. By doing so, we hope to contribute to identifying various sources of pesticides that drift beyond their intended targets.

2.3.2. Potential Source Contribution Function (PSCF)

The PSCF technique is commonly used to identify the most probable areas where emissions that impact pollutant loadings at the receptor originate from. This is done by combining estimates of backward air movement in time with pollution concentrations measured at the receptor site [79]. The PSCF is essentially a conditional probability function that can be calculated as the proportion of trajectory endpoints that exceed a specific threshold value to the total number of endpoints in the entire grid cell. The PSCF value for a given square cell (i, j) is determined as follows:
PSCF = m i j n i j ,
In air pollutant modeling, nij represents the total number of endpoints for a given trajectory within the (ij) grid cell. Meanwhile, nij represents the number of endpoints in each (ij) grid cell for every trajectory with pollutant concentrations exceeding a certain standard range. When there are only a few trajectory endpoints in a given grid, their values can be quite unpredictable. To eliminate ambiguity, a weighting variable called Wij is defined as follows [32]:
w i j   0.99                                         n i j > 3 . A v g   0.72             A v g   < n i j 3 . A v g   0.44                         0.5 . A v g   < n i j   A v g .   0.17           0       < n i j 0.5 .         A v g
The term Avg refers to the average number of endpoint locations for each cell on a grid. The weighting function is used to decrease the high PSCF value whenever the value of nij is less than three times the mean endpoint locations of all grids within the investigation zone. The PSCF technique is simply used to show the percentage of trajectory groups with pollutant concentrations higher than the standard threshold of a grid relative to the total number of trajectories [80,81,82,83,84,85].

2.3.3. Backward Dispersion Analysis

Over four weeks from May to August 2019, the release of organophosphate pesticides from four farmers’ fields surrounding Springfield City was monitored. The goal was to determine how the HRRR initialization was used during the summer season and gain a better understanding of the impact of pesticide drift on agricultural urban interface communities beyond their intended targets.
To assess the accuracy of the HRRR dataset, meteorological data were obtained from four locations in Sangamon County: Williamsville (North), Mechanicsburg (East), Virden (South), and Spring Creek (West). In July 2019, we generated hourly temperature, wind direction, and wind speed data in CSV format for each location. These data were downloaded using the POWER Data Access Viewer (https://power.larc.nasa.gov/data-access-viewer, accessed on 20 December 2023).
Although the adverse effects of pesticide drift on human health and the environment may be more pronounced in the warm season (summer), particularly when applying pesticides to corn and soybeans (summer crops), it was decided to determine the backward trajectory of air masses carrying pesticide pollutants from May to August 2019. This decision was made mainly because Sangamon County is located in a humid subtropical zone with notable intra-annual variability and significant seasonal variations.

2.3.4. AgDRIFT Model

The AgDRIFT model was created by combining aerial and ground-boom pesticide applications. Its purpose is to determine the amount of drifting spray that will end up downwind at the field level, as well as the quantity of spray drift that has already been deposited. The EPA’s Office of Research and Development and the Spray Drift Task Force (SDTF) are working together to build a comprehensive database of pesticide usage to support pesticide registration requirements. This database is being developed for the collection of organophosphate pesticide registrations. The model was originally made available as part of a cooperative research and development agreement (CRADA) by Teske et al. For the model to work, meteorological and environmental factors such as relative humidity, air temperature, and surface roughness must be considered. Wind data for Sangamon County were obtained from the Midwestern Regional Climate Center (MRCC) on 2 January 2024. During a designated spraying period in Sangamon County, wind and pesticide drift trends were produced using pollution (pesticide) and wind roses.
Four experiments were conducted between 12:00 and 14:00 UTC, each lasting for two hours. Both ground and aerial applications were used at four locations that represent cropland fields in Sangamon County where pesticides are applied more frequently and at higher rates. The most commonly used pesticides in the county are organophosphates, which include bensulid, chloreth, chlorpyr, dimethoa, malathion, phosmet, terbufos, and tribufos. This study focuses on malathion as it is the most efficient pesticide for all types of applications (ground, orchard, and aerial) among the eight chemicals used in Sangamon County. Malathion is highly soluble in water and has a high capacity for adsorption in soils, making it an effective insecticide with a wide range of actions [47,67]. However, it is also a significant risk to aquatic ecosystems as it has been found in surface water, air, and soil over the years [86,87]. Table 4 provides more information on the use and characteristics of organophosphate pesticides.
The AgDRIFT model has undergone extensive validation through 360 separate ground-boom and aerial treatments. Furthermore, more than 3000 wind tunnel atomization tests have been conducted, using a wide variety of nozzles at different wind speeds and nozzle angles relative to the wind field. These tests were carried out with many different types of chemical and physical characteristics for materials sprayed during SDTF field trials. This rigorous testing ensures the reliability and accuracy of the AgDRIFT model [87]. The AgDRIFT model was used to calculate the rate of spray drift from various pesticide treatments, taking into account factors such as spray nozzle droplet dispersion, high sprayer boom, and wind speed (which varied between 4 and 10 miles per hour). According to ASAE Standard S572, downwind drift decreases as droplet size increases [40]. When choosing their application-specific equipment, pesticide applicators in the United States often consider the volume median diameter (Dv0.5) and the spray volume in droplets that are less than 100 m (V < 100 m) and 200 m (V < 200 m). The V < 200 m represents the spray that is most susceptible to drift, while V < 100 m represents the percentage of spray that is likely to travel more than 1 km. Table 5 shows the droplet spectra of a reference nozzle that is categorized as medium, which has a Dv0.5 of 294 m, V < 100 m of 5%, and V < 200 m of 25%. In contrast, a fine droplet spectrum has a Dv0.5 of 180 m, V < 100 m of 20%, and V < 200 m of 60% [40,85,86,87]. In Illinois, the use of fine droplet spectra is considered inappropriate for pesticide applications due to the potential for drift. Therefore, this study assesses the potential hazards of medium and coarse spray drift to unintended targets within a 1 km radius of the application position.
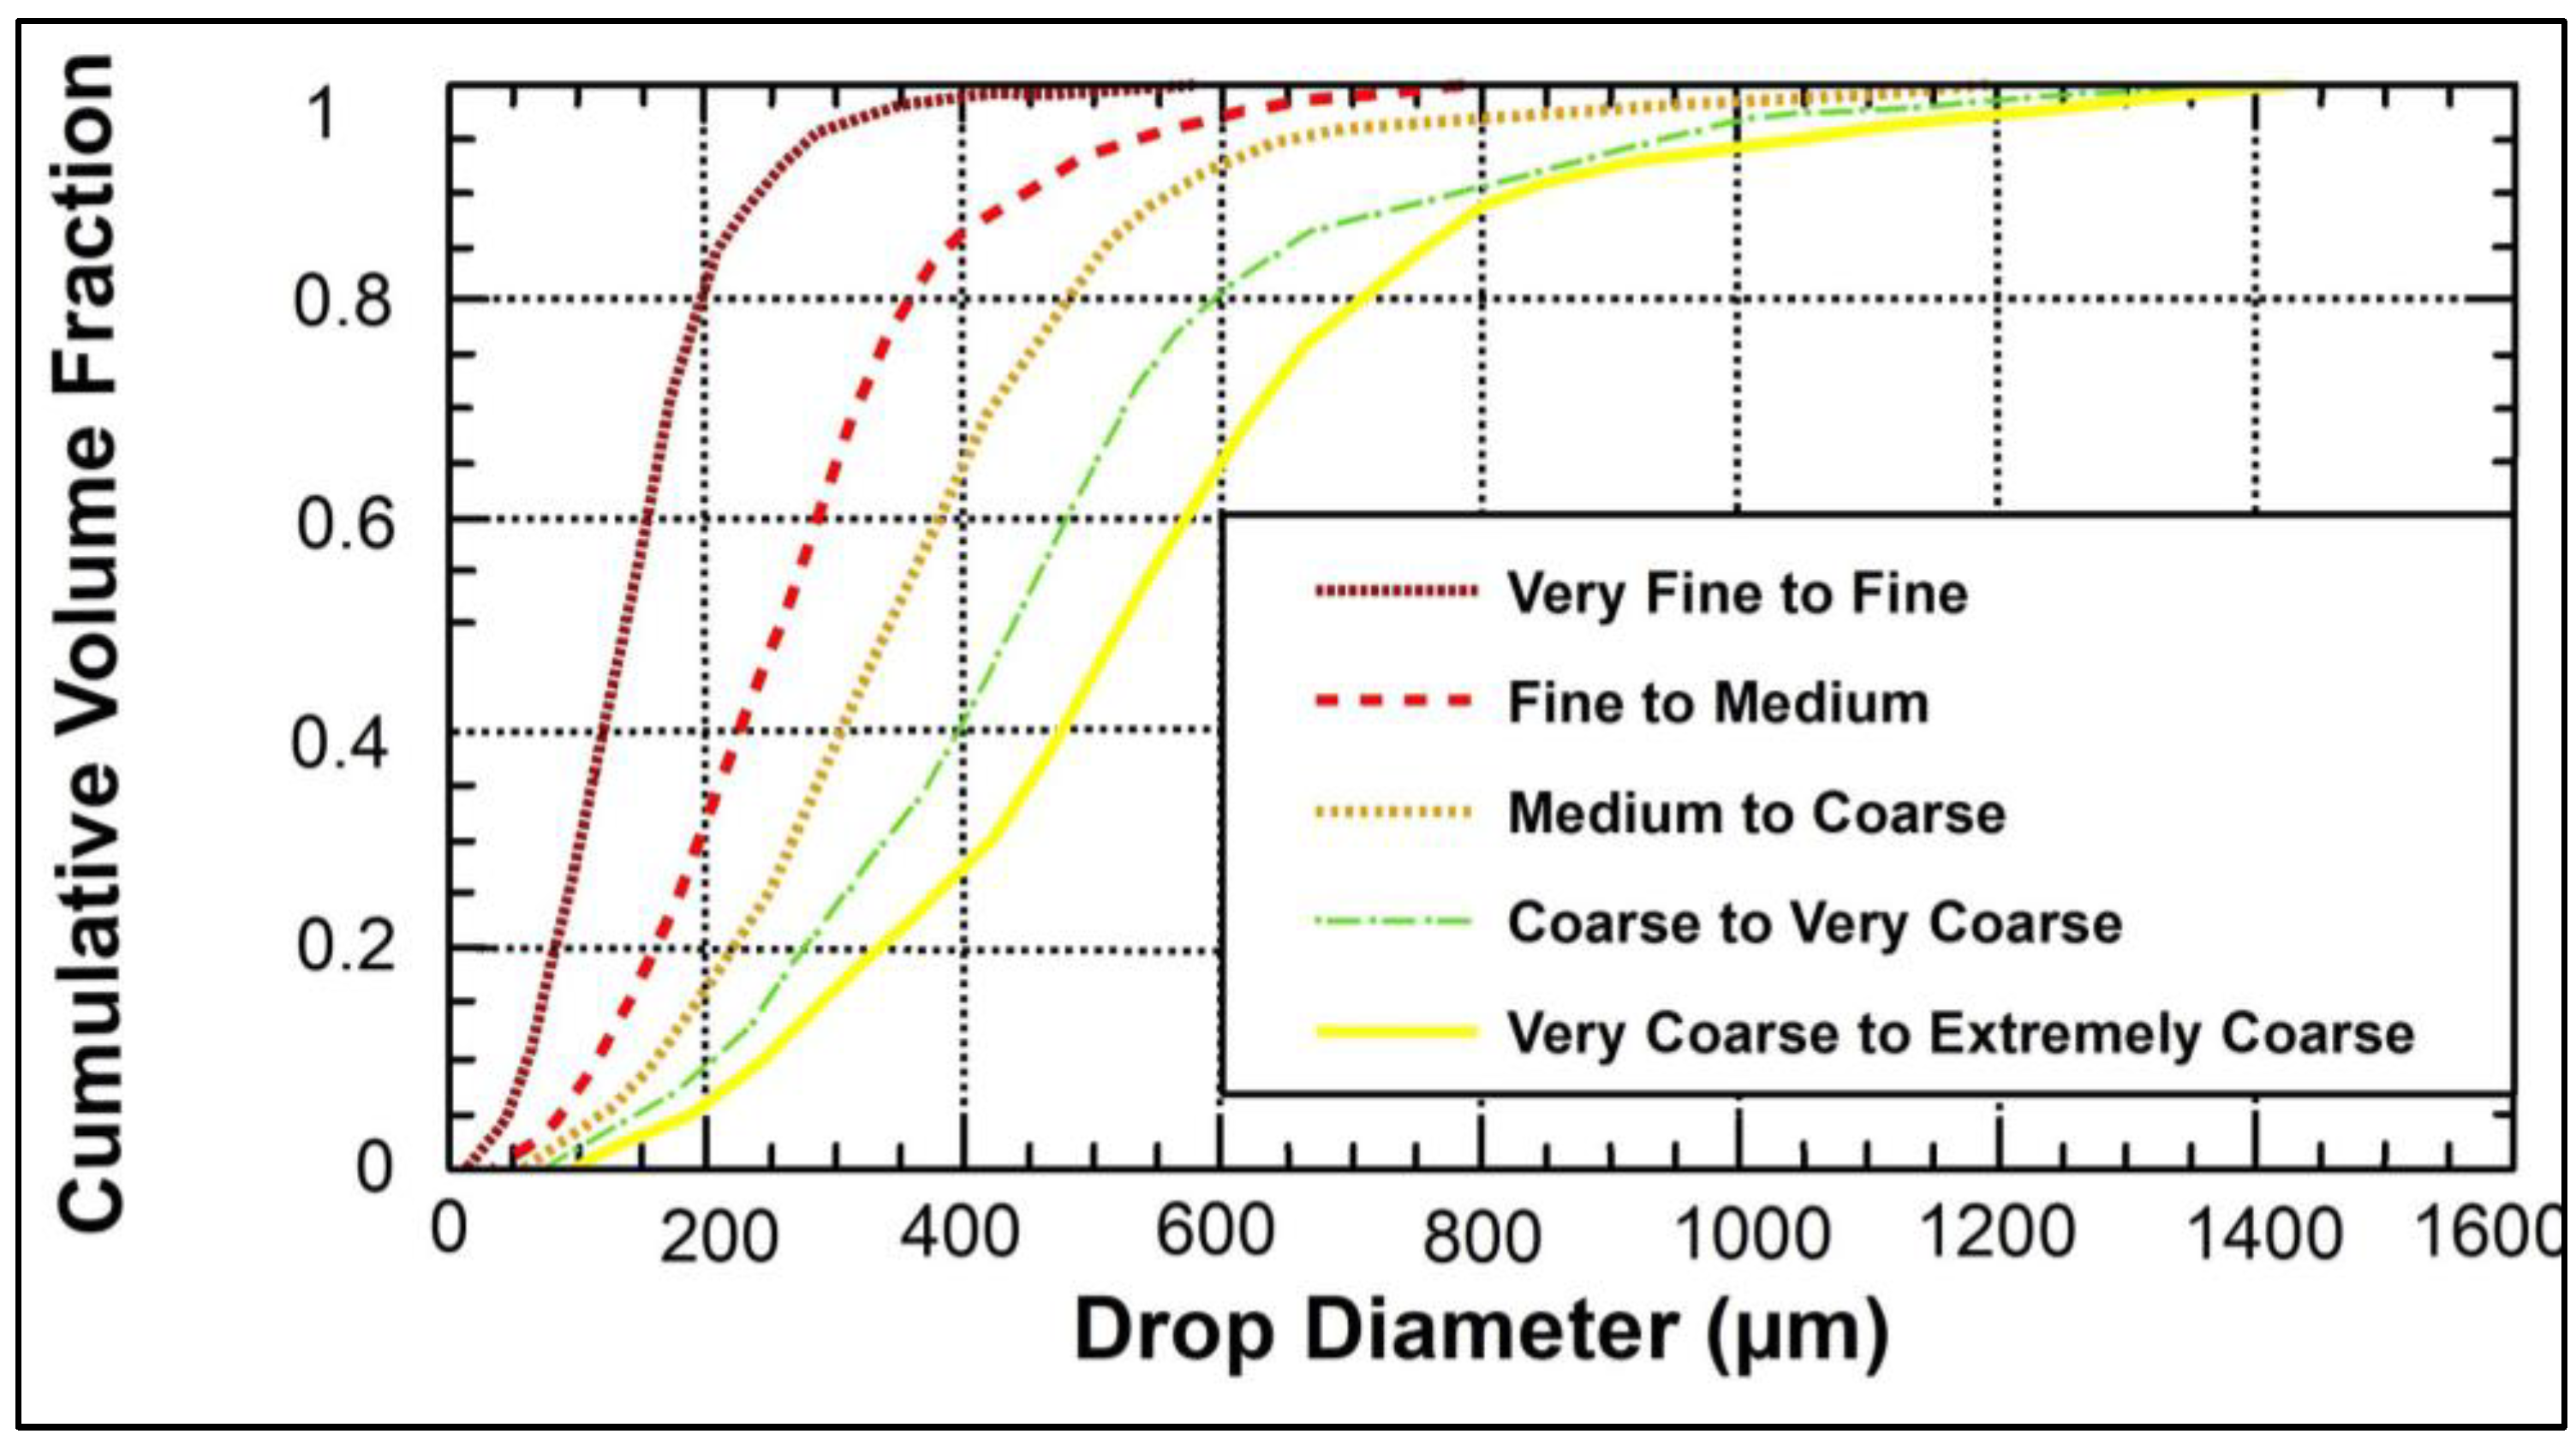
AgDRIFT categorizes drop sizes into six modes, namely Very Fine, Fine, Medium, Coarse, Very Coarse, and Extremely Coarse. Figure 3 illustrates the ASAE reference threshold curves for drop diameters measured in micrometers (μm) against cumulative volume fraction. These curves establish the thresholds that distinguish between reference atomization regimes.
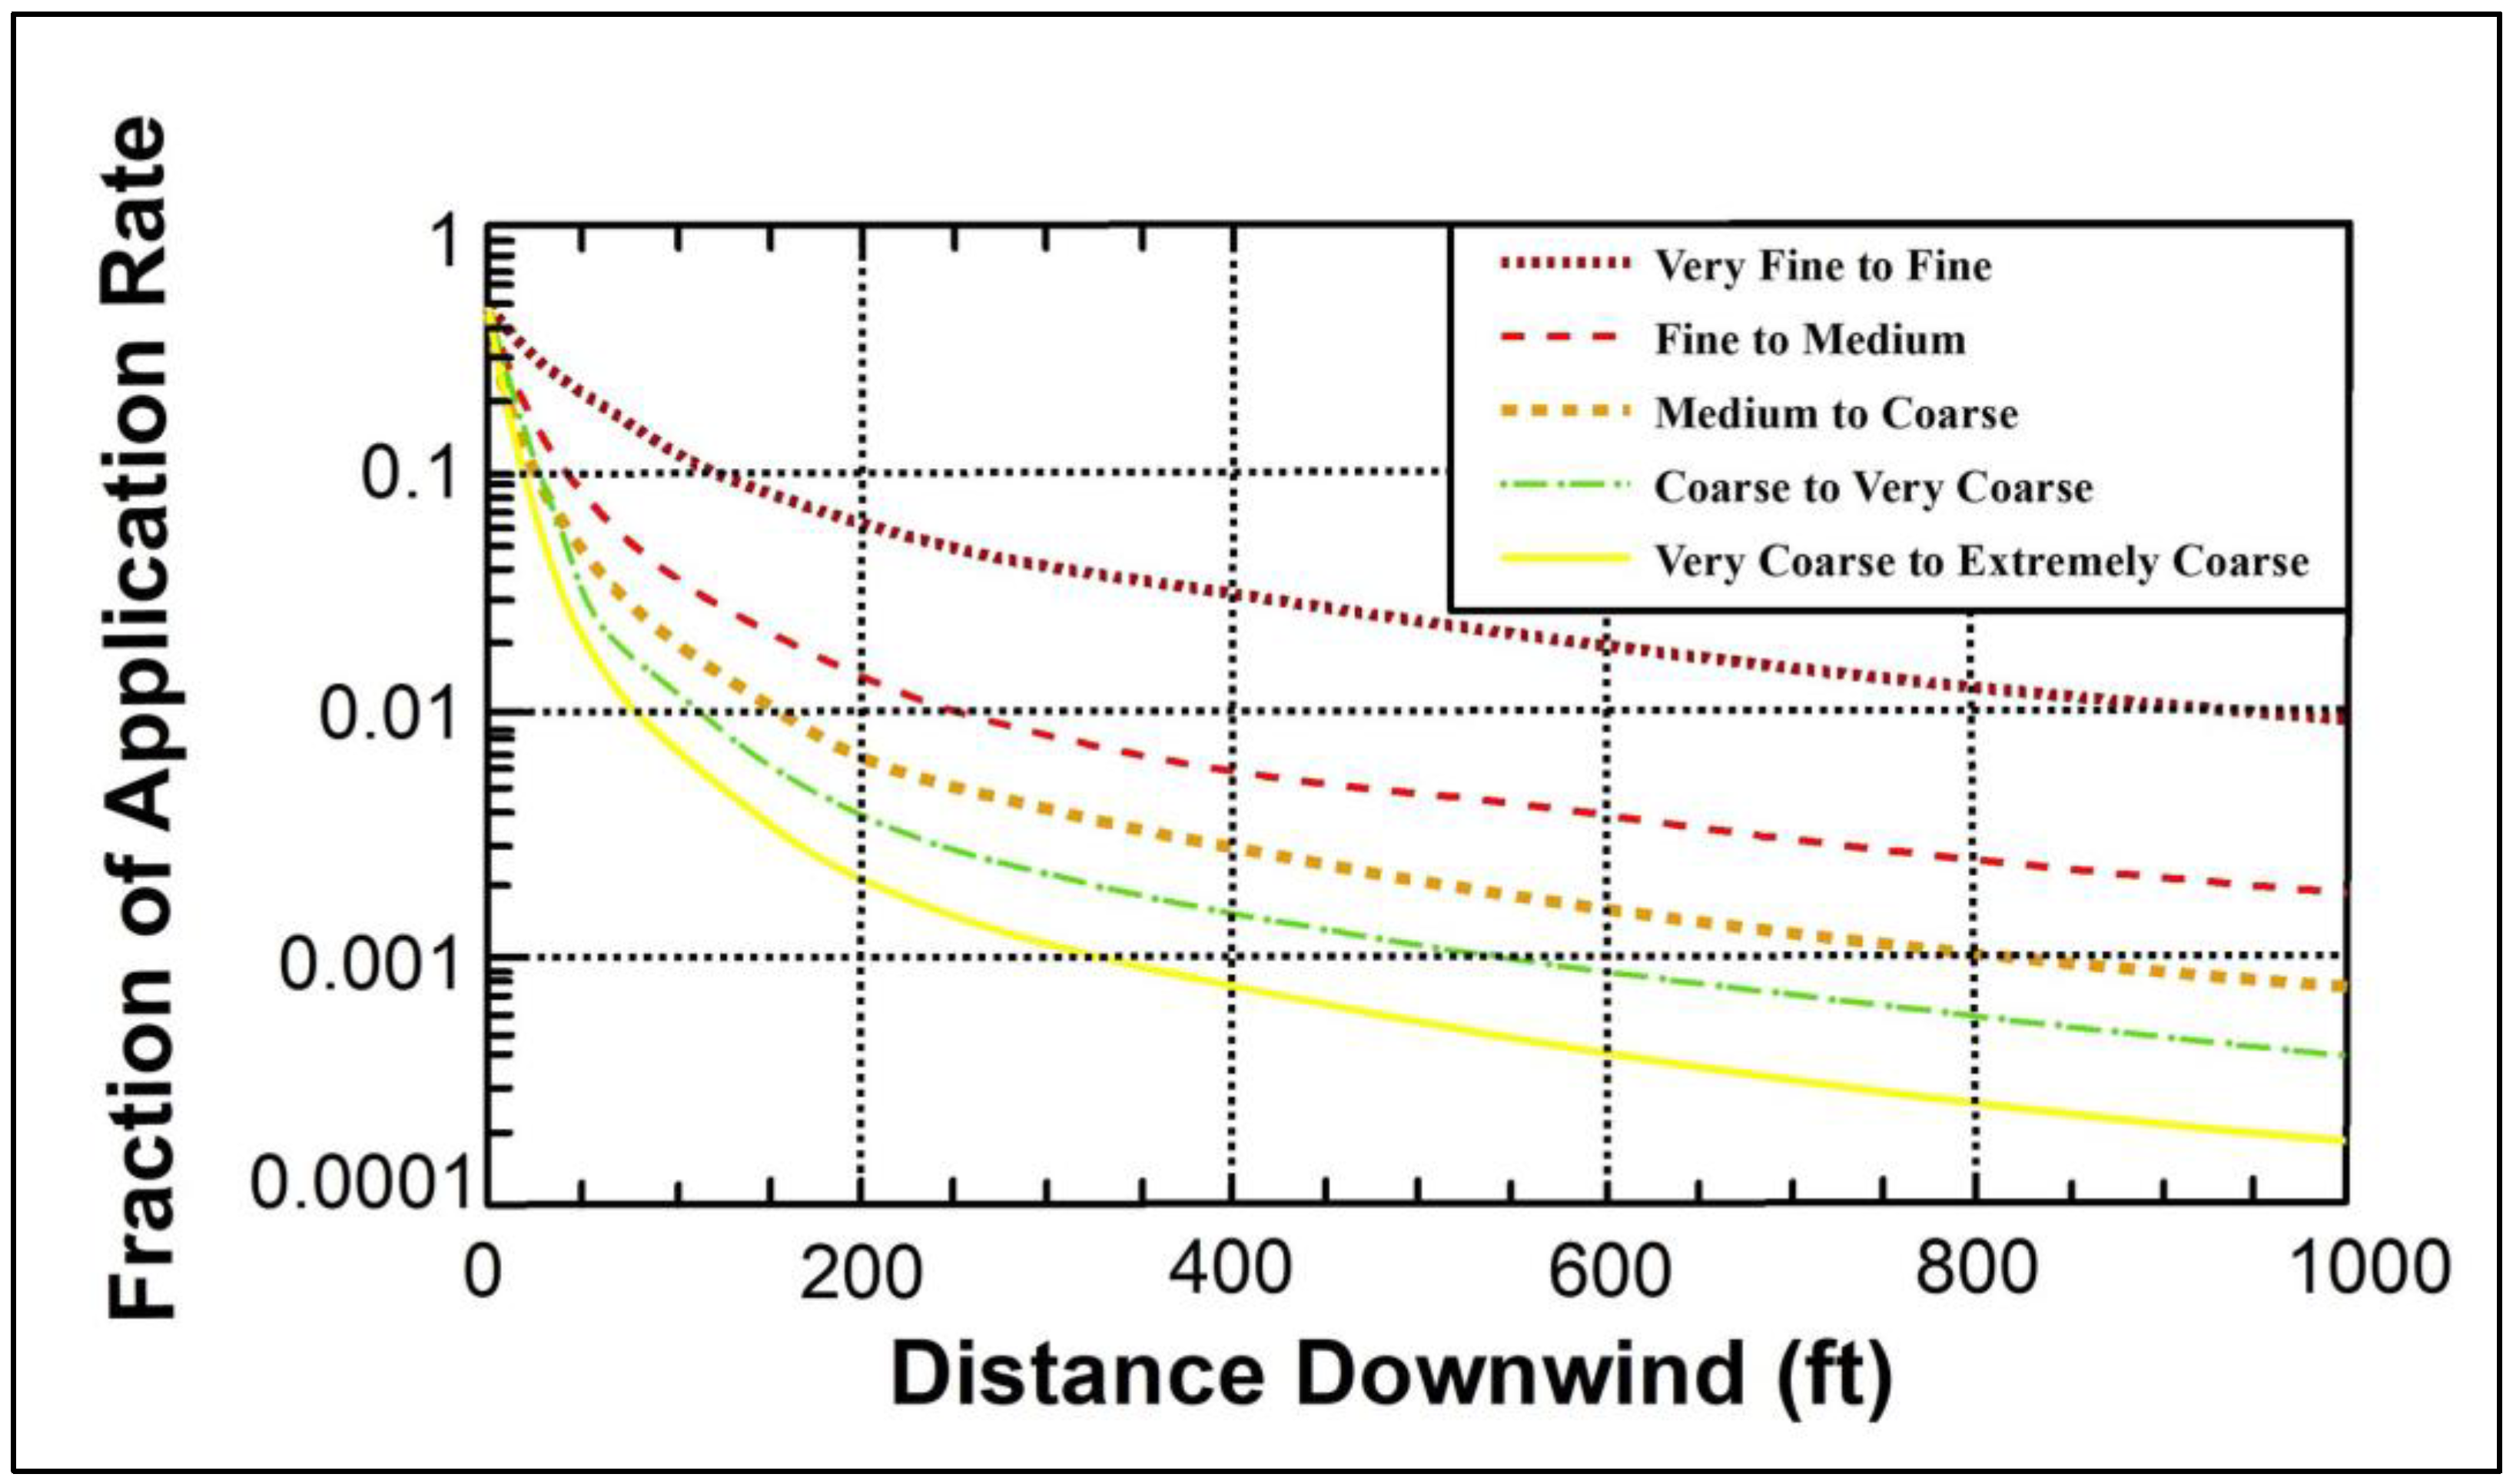
It is estimated that pesticides sprayed from an airplane can drift and deposit up to 250–800 m away before rates of 1% or less are reported. Similarly, ground-based spraying can result in drift up to a range of 50–350 m, depending on various factors like wind speed, direction, relative humidity, atmospheric stability, spray equipment, droplet size, height of application, and number of swaths. Apart from these factors, the aircraft’s type and speed during aerial spraying can also impact the drift [87]. The AgDRIFT experiments’ settings for ground-based and aerial-based applications in four Sangamon County cases are listed in Table 6. The deposition according to distance was graphed for each of the five ASAE S-572 threshold categories in Figure 4.
In the Williamsville, Mechanicsburg, Virden, and Spring Creek fields, different amounts of organophosphate pesticides were used in four simulations. The quantities were about 25, 25, 27, and 32 kg/ha, respectively. To control pollution caused by these pesticides, specific schemes were implemented.
The wind speed, direction, and frequency were determined for seven consecutive days in three selected fields. The research mainly focused on soybean and corn crops and considered the implementation of pesticide application using aerial and ground methods.
The pollution rose was divided into four primary directions and four sub-directions that correspond to 0, 45, 90, 135, 180, 225, 270, and 315 degrees (N, NE, E, ES, S, SW, W, and NW) and examined thoroughly.
The AgDRIFT atmospheric model was utilized to determine the possible drift deposit values. Table 4 and Table 5 illustrate the simulation parameters for ground-boom and aerial pesticide applications in four fields located in Sangamon County. The simulations were carried out with air temperatures ranging from 26 to 36 degrees Celsius at a height of 2 m, relative humidity ranging from 75 to 88%, and average wind speeds varying between 4 and 10 mph. We estimated the potential drift of organophosphate pesticides for all spatially distributed fields over a large area through the AgDRIFT atmospheric model based on CropScope (CDL) and LULC data.

2.3.5. Study’s Hypotheses and Limitations

The study’s approach is based on the assumption that the primary cause of air pollution affecting urban–rural interface residents is the drift of pesticides from their intended targets, rather than industrial activities that emit pollutants into the air. This assumption is supported by evidence showing that over 60% of the nearly 600 complaints received by the Illinois Department of Agriculture in 2019 were related to pesticide drift (https://agr.illinois.gov/pesticides/pesticides-uses-misuses.html, accessed on 24 December 2023) and that the amount and potential for drift of organophosphate pesticides are comparable.
Since there is no database for pesticide consumption reports in Illinois, the study assumes that soybean and corn crops in Sangamon County receive equivalent treatment with organophosphate pesticides. As the crops surround residential areas from all directions, the study hypothesizes that winds will always blow towards residential areas and streams and rivers, away from the intended position, according to county-level simulations. The simulations were run at the same time as the application of pesticides in ground and aerial applications.
Furthermore, pesticide drift from its intended targets is influenced by several environmental and meteorological factors, depending on the scale of the study. The movement of air masses from outside the county has a significant impact on the rate of drift exposure at the county level. In contrast, the exposure to organophosphate pesticide drift at the field level is first determined by the local environmental and meteorological conditions at the time of application.
The study assumes that Springfield is surrounded by agricultural fields in all directions, making it predominantly influenced by the migration of air masses carrying pesticide particles and gases that drift beyond their intended targets. Two assumptions are used to calculate pesticide application quantity: firstly, that cultivated corn and soybean areas are distributed equally across each county, and secondly, that the pesticide application rates remain constant across the selected fields each crop season.

3. Result and Discussion

3.1. HYSPLIT Clustering Analysis and Trajectory Calculation

Air pollution caused by pesticide spray drift is a complex issue, with potential causes and origins linked to specific characteristics of air circulation transmission trajectory. To address these challenges, the backward trajectory model, clustering analysis, and the PSCF technique are increasingly being used [84,85,86]. This study focuses on the areas encompassed by the HRRR 3 km spatial resolution domains to study the organophosphate pesticide drift at the county-level scale in Sangamon County.
The study used the HYSPLIT model to compute the backward trajectory at arrival altitudes of 10, 75, and 150 m (AGL) for every hour of the day in Springfield City for a week in July 2019. The trajectory clustering starts at (39.7817 N, 89.6501 W). The study found that pesticide drift causes significant air pollution in urban-agricultural communities around Springfield City.
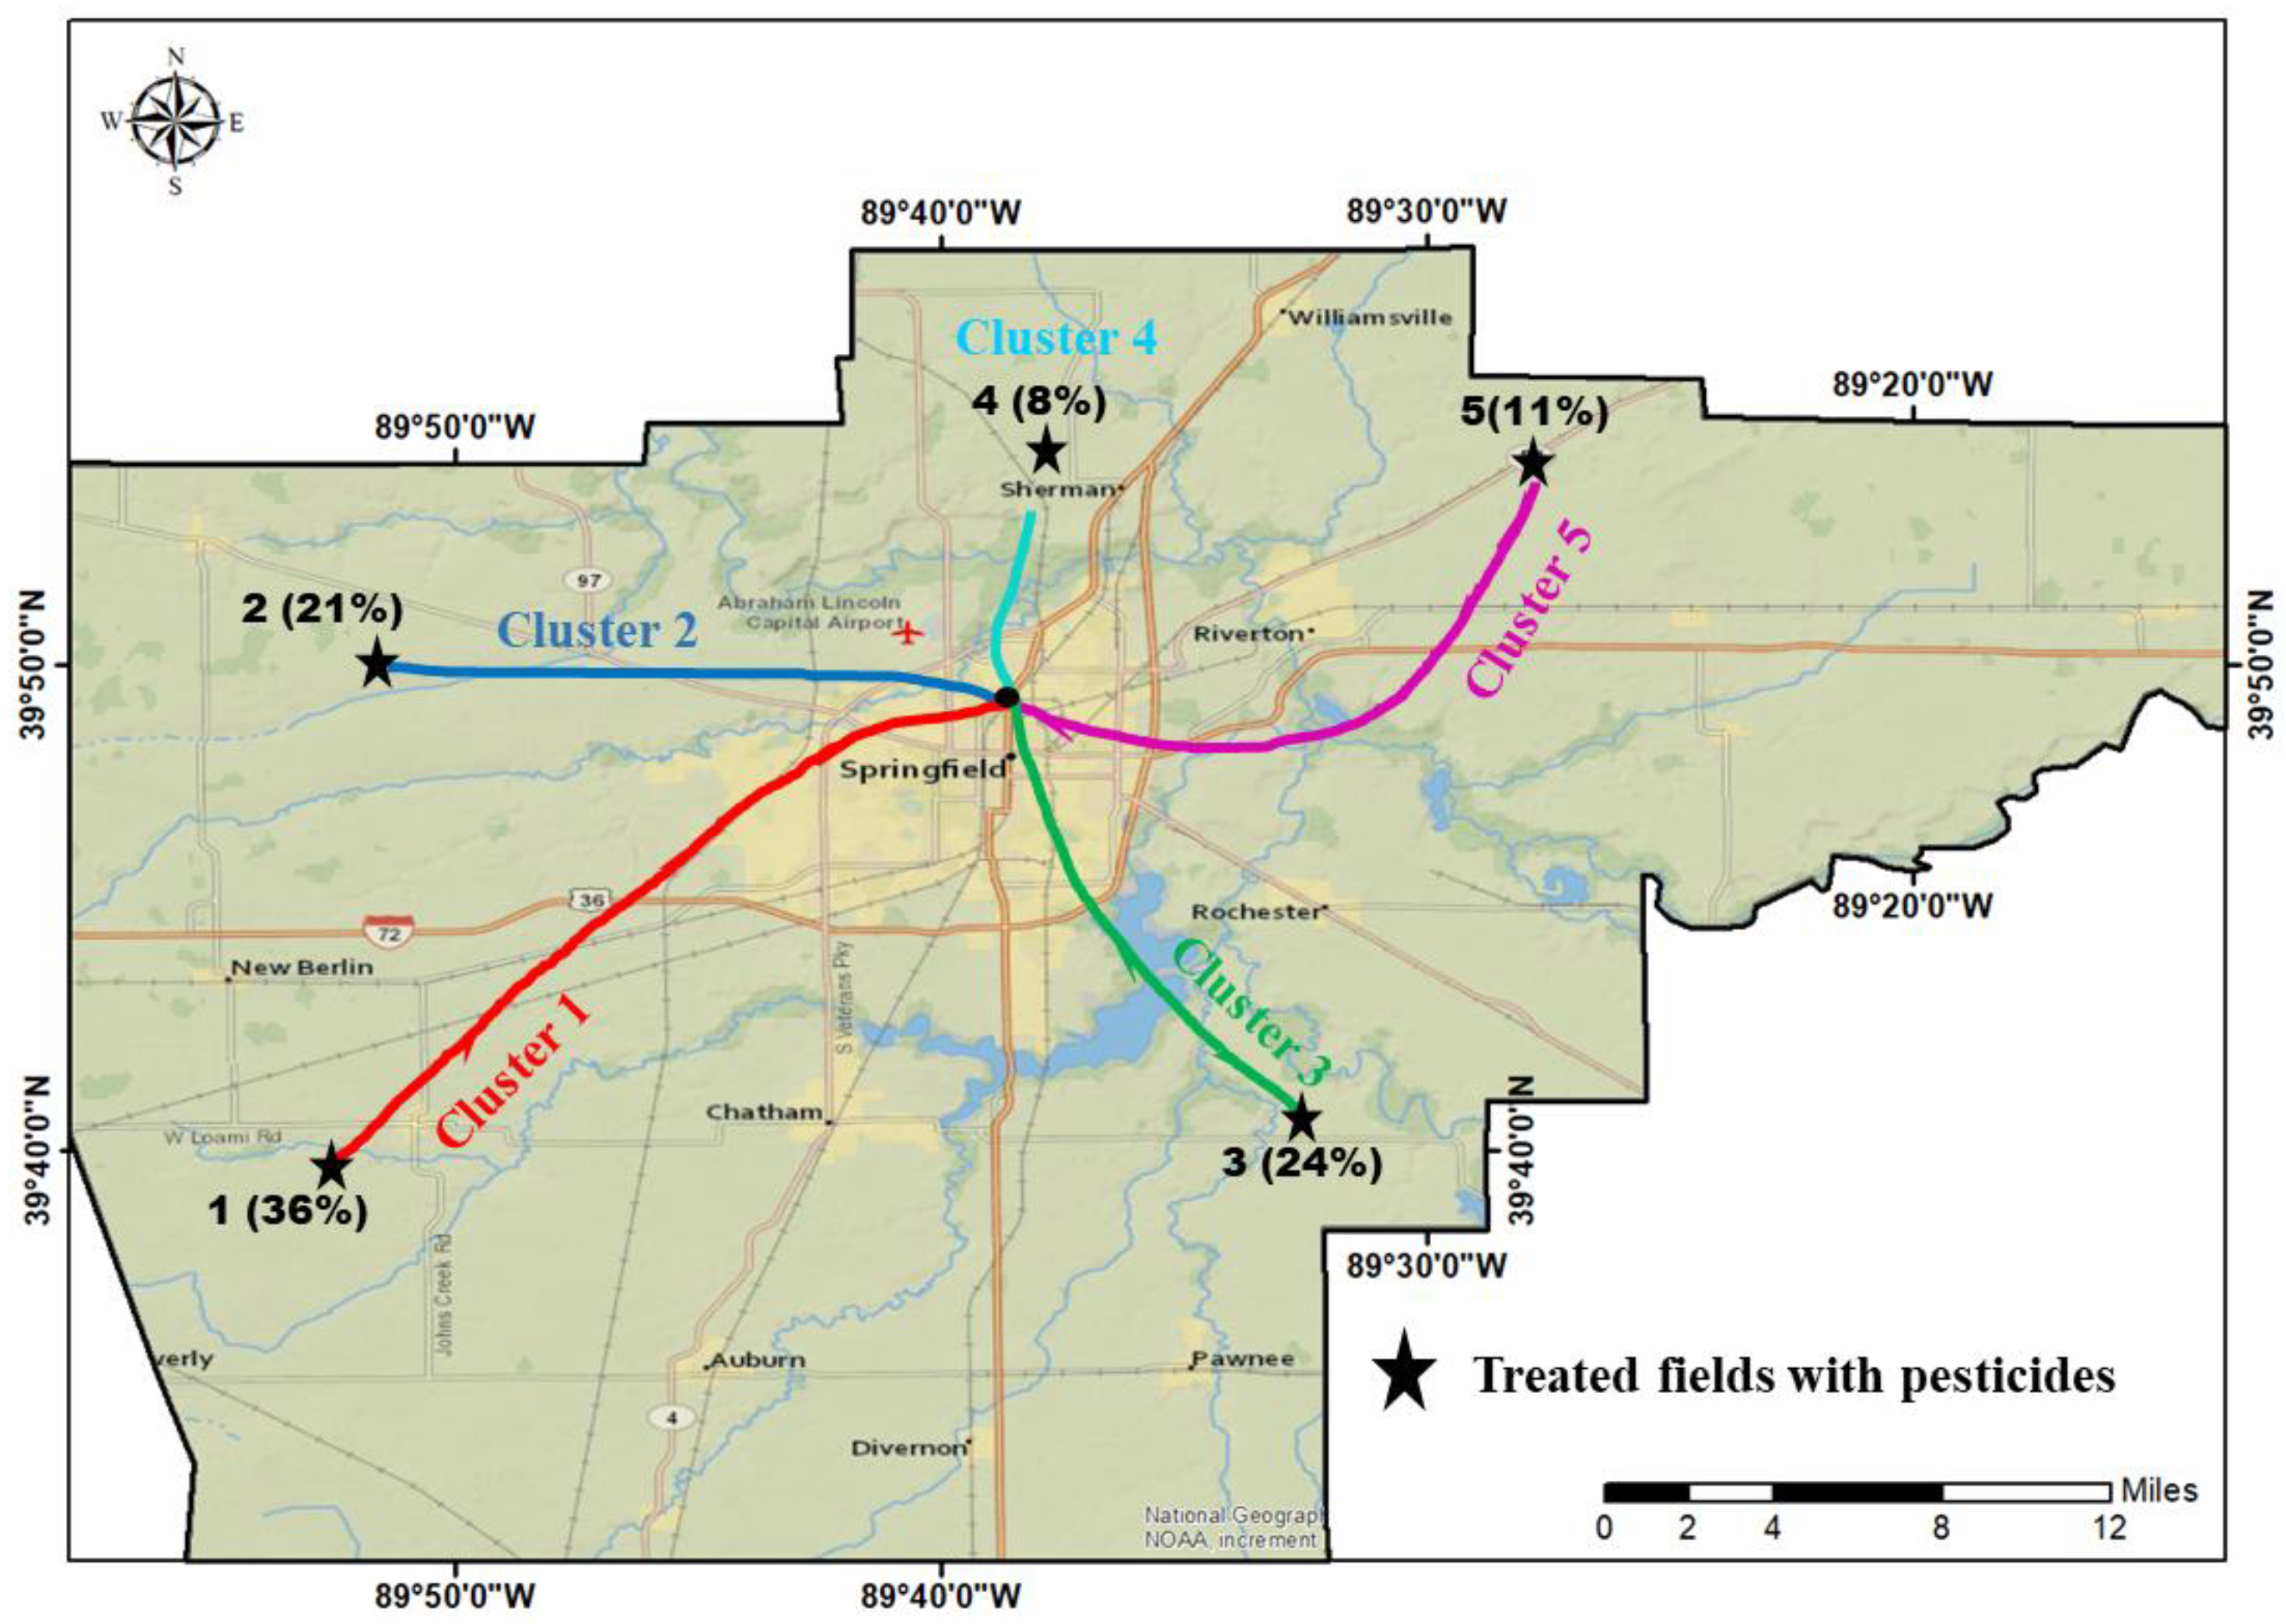
The trajectory clustering classified the trajectories into five groups depending on their length and origin. The five clusters of trajectory groups are shown in Figure 5, with the paths of the air masses dispersed in the following directions: north, northeast, southeast, southwest, and northwest. The trajectories in clusters 1, 2, and 3 were short and flowed considerably more slowly than trajectory patterns in other remaining clusters. However, compared to other directions, the trajectories in the northeast (cluster 5) and southwest (cluster 1) are longer and travel more quickly.
In July 2019, the study determined four air mass clusters coming from five different directions. Cluster 1 (36%) originated in the Headwaters Apple Creek region and traveled via New Berlin. Cluster 2 (21%), which originated in Prairie Creek, passed through Curran village before arriving at Springfield City. Cluster 3 (24%) flowed mostly from Pawnee, traveled through Rochester Village, and finally arrived at Springfield City. Cluster 4 (8%) traveled from Cantrall to Williamsville villages, then to Springfield City. Cluster 5 (8%) was from Hunter Slough, and passed through Clear Creek to Buffalo Village before arriving in Springfield City.
Clusters 1, 2, and 3 are the most significant transport pathways contributing to increased pesticide drift to the urban-agricultural interface communities in Springfield. Cluster 4 is the transmission path of greatest cleanliness, as organophosphate pesticide concentrations were extremely low and transported in this direction by mesoscale air masses. The transport route of cluster 5 is likely responsible for the organophosphate drifting into Lake Fork and the western portions of the Sangamon River.

3.2. The Potential Source Contribution Function (PSCF)

The PSCF method is used to identify potential source regions that may lead to excessive amounts of air pollution by counting the entire number of backward trajectories across a specific region with the average number of trajectories for significant concentrations of air pollution at the receptor [78]. It is frequently used to estimate the source regions of air pollution. In this study, the geographical area was divided into grids with a spatial resolution of (0.3°0.3°) based on the entire area occupied by the backward trajectories. The PSCF map of Springfield City for July 2019 is shown in Figure 4.
The study assessed the potential source contribution function of organophosphate pesticide drift in Sangamon County. The study considered the quantity of soybeans and corn within a 450 m buffer zone from the urban-rural community’s center point and analyzed airflow paths to determine the possible origin of the pesticide drift. This buffer zone value has been relied upon in previous studies [40,43,46,63,68]. The PSCF results for the potential organophosphate pesticide drift in Springfield, Illinois, in July 2019 are shown in Figure 6. The participation rates for potential origin positions are indicated by colors. The light green and yellow colors are associated with low concentrations, while red and brown represent high pesticide concentrations.
Higher PSCF values mostly occurred in residential communities and bodies of water such as rivers, lakes, and streams close to agricultural areas, especially where the buffer zone is less than 450 m. All urban-agricultural interface communities around Springfield City are likely threatened by high concentrations of pesticides drifting beyond their intended targets and therefore likely to become a major potential source of air pollution throughout Sangamon County.
According to Figure 6, the city of Springfield and its suburbs are unlikely to be threatened by the risk of pesticide drift, and so pesticide-related air pollutant concentrations are expected to decrease to the lowest level. Higher PSCF levels become more likely and are mostly observed close to agricultural areas. Furthermore, comparisons indicate a significant association between the distributions of high PSCF ratios and the main trajectory zones depicted in Figure 6. This result suggests that the possible origin contributing results in this study, which were acquired using the PSCF method, are quite dependable. High PSCF rates are mainly observed in Auburn, Pawnee, and Divernon in south Sangamon County, and towns such as Loami, Berlin, and New Berlin in the west. In comparison to those in the east, the prospective sources have migrated eastward and are concentrated in the towns of Illiopolis and Mechanicsburg.

3.3. Backward Dispersion Analysis

The findings of this study were based on the capabilities of the HYSPLIT model. This model is designed to simulate the transport and dispersion of chemical compounds through the atmosphere. It is particularly useful in analyzing the backward and forward trajectory of pollutants, identifying areas that receive polluting air masses, and characterizing the movement, dispersion, and deposition of pollutants and toxic substances. Since organophosphate pesticides are commonly utilized in agricultural operations in Sangamon County, the HYSPLIT backward trajectory technique was used to determine the dispersion paths of these pesticides, including the areas that receive pesticide-carrying air masses. A real-time procedure was developed to provide operational release forecasts for aerial pesticide application. This procedure updates the transport and dispersion data using HRRR meteorological data with a spatial resolution of 3 km.
Between April and August 2019, five simulations were conducted on large croplands and farms surrounding Sangamon County. These simulations released 165 kg of pesticides, particularly on soybean and corn crops. Eight organophosphate pesticides were extensively utilized and identified as having the potential for spray drift, considering the sprayed field’s closeness to sensitive resources and wind direction.
The simulations were distributed geographically throughout Sangamon County, with fields located in the south, east, north, southeast, and west, specifically in the Spring Creek, Richland Creek, Pawnee, Sugar Creek, and Cantrall fields, respectively. The simulations included the release of standard, calibrated amounts of pesticides during the period of treating corn and soybean crops with pesticides using aerial application.
The simulations were conducted during the spring and summer seasons, which are the peak months of organophosphate pesticide spraying. This was done to determine the extent to which pesticides drift from their intended targets during multiple climatic conditions, as well as determine the extent to which the city of Springfield and its agricultural urban interfaces are exposed to drifting.
A backward dispersion analysis of organophosphate pesticide spray drift over Sangamon County was conducted for five selected application fields. The experiments employed malathion, a frequently used organophosphate pesticide in Sangamon County, as the active ingredient. The modeling procedures were performed using various emissions, chemical substances’ lifetime, depositing rates, application height, and meteorological variables, providing a backward-dispersion-based analysis of the specified fields.
According to Figure 7, the exposure effect of organophosphate pesticide drifting from five pesticide-treated fields to the city of Springfield is not significant.
It is interesting to note that despite differences in wind direction and speed, as well as geographical location, the city of Springfield remained unaffected by phosphate insecticide drift during the spring and summer months. However, communities situated at the urban-agricultural interface were significantly impacted by the drift of organophosphate pesticides, with average pesticide concentrations reaching approximately 2000 ng/m3 in the area near the application fields.
Following application, the maximum concentration of organophosphate pesticides increased by 13,000 ng/m3 adjacent to the application position, with vapors spreading while concentrations immediately descended. The impact of spray drift from the five fields on surrounding settlements during the simulation period (April to August 2019) was highly dependent on prevailing wind direction and speed. The spatial pattern of pesticide vapor plumes was affected by several factors, including application start time, duration time, amount of pesticides applied, amount of active ingredient applied, and application height.
The experiments did not detect any evidence of pesticide drifting beyond 1–2 km from their intended targets. However, residential areas and water bodies within this buffer zone were at risk of drift for two hours before peak pesticide concentrations ended. The greatest decrease in pesticide concentrations was found two hours after the release of standard amounts of pesticides from 13 mg/m3 to 7 mg/m3 (as evidenced by the second frame of the simulation in each field under observation).
The exception to this trend was the Richland Creek field, which showed a slight decrease in pesticide concentrations during the third and fourth hours of the estimated pesticide release, according to the cropped area per acre.

3.4. AgDRIFT Model for Field-Level Simulations

Table 7 shows the average spray drift potential from dominant wind directions, as well as the average drift for residential areas and water bodies near corn and soybean fields in the regions under investigation for all eight directions.
The calculated potential deposition ratio was obtained after applying a medium-sized nozzle droplet with a height boom of 1 m. The buffer zones 25, 50, 75, and 100 m downwind had deposition ratios of 4.4%, 3.2%, 1.1%, and 0.6% for the ground-boom application average, respectively. These calculations were based on the variable’s downwind length for both ground-boom and aerial applications, as shown in Table 8. As the droplet dispersion moved from medium to fine, off-site spray deposition rates increased significantly. However, this increase was associated with increasing boom heights. Based on the local weather conditions and topography, outside drift at 50 m downwind can be up to 3.2% of the ground application rate. The deposition rates computed at 50, 100, 150, and 300 m downwind, respectively, for a medium droplet dispersion during aerial application, were 7.9%, 6.0%, 4.3%, and 2.6%. Depending on the topography and local weather conditions, off-site deposition is expected to be higher than 2% of the aerial pesticide spray rate at 500 m downwind.
The current study found that estimating the amount of organophosphate pesticide that drifts beyond the intended fields, such as residential and aquatic areas, is dependent on knowledge of the crop area and buffer zones, as well as the weather during pesticide application. As a result, if an off-target area measuring thirty acres is present after an aerial application, the expected drifting zone will be 0.96 km2 or 40.5%. The AgDRIFT model estimates a drift range of over 500 m with moderate spray droplet dispersion. For example, the drifting distance of the off target is approximately 0.70 km2 or 26.5% of the total target area.
Table 9 and Figure 8 show the results of the study on the use of pesticides in a nearby field. The field was 45 hectares in size, and the area where the pesticide was deposited ranged from 2.82 to 5.60 hectares. The drift deposition fraction, which is the amount of pesticide that drifts away from the target area, varied from 0.222 to 0.350.
For ground applications using a boom, the swath width (the width of the area covered by the pesticide application) ranged from one to four meters. For aerial applications, the swath width ranged from one to six meters. The average amount of pesticide that drifted away from the target area ranged from 3.97 to 5.50%.
When using medium-sized droplets, the drift rates 50, 100, 200, and 400 m downwind were 40.5%, 36.2%, 26.5%, and 20.4%, respectively. In this study, the amount of pesticide vapor drift was found to reach 0.8 kg/ha.
This study discovered that medium droplets being dispersed over a distance of 500 m or more is the worst-case scenario for pesticides spreading beyond their intended targets. This can lead to more than 14% of the treated agricultural land area being at risk of organophosphate pesticides drifting towards residential areas and water bodies. The study also estimated that there is a 2.4% risk, or 4450 hectares of the entire cropping area cultivated near corn and soybean fields being affected by off-site spray drift from organophosphate pesticide treatments. The simulations were conducted in the worst-case scenario, based on all parameters listed in Table 8 and Table 9. The pesticide rose was divided into eight quadrants: North, Northeast, East, South, Southwest, West, and Northwest, corresponding to 0, 45, 90, 135, 180, 225, 270, and 315 degrees, respectively. The AgDRIFT atmospheric model was used to acquire possible drift deposition values.
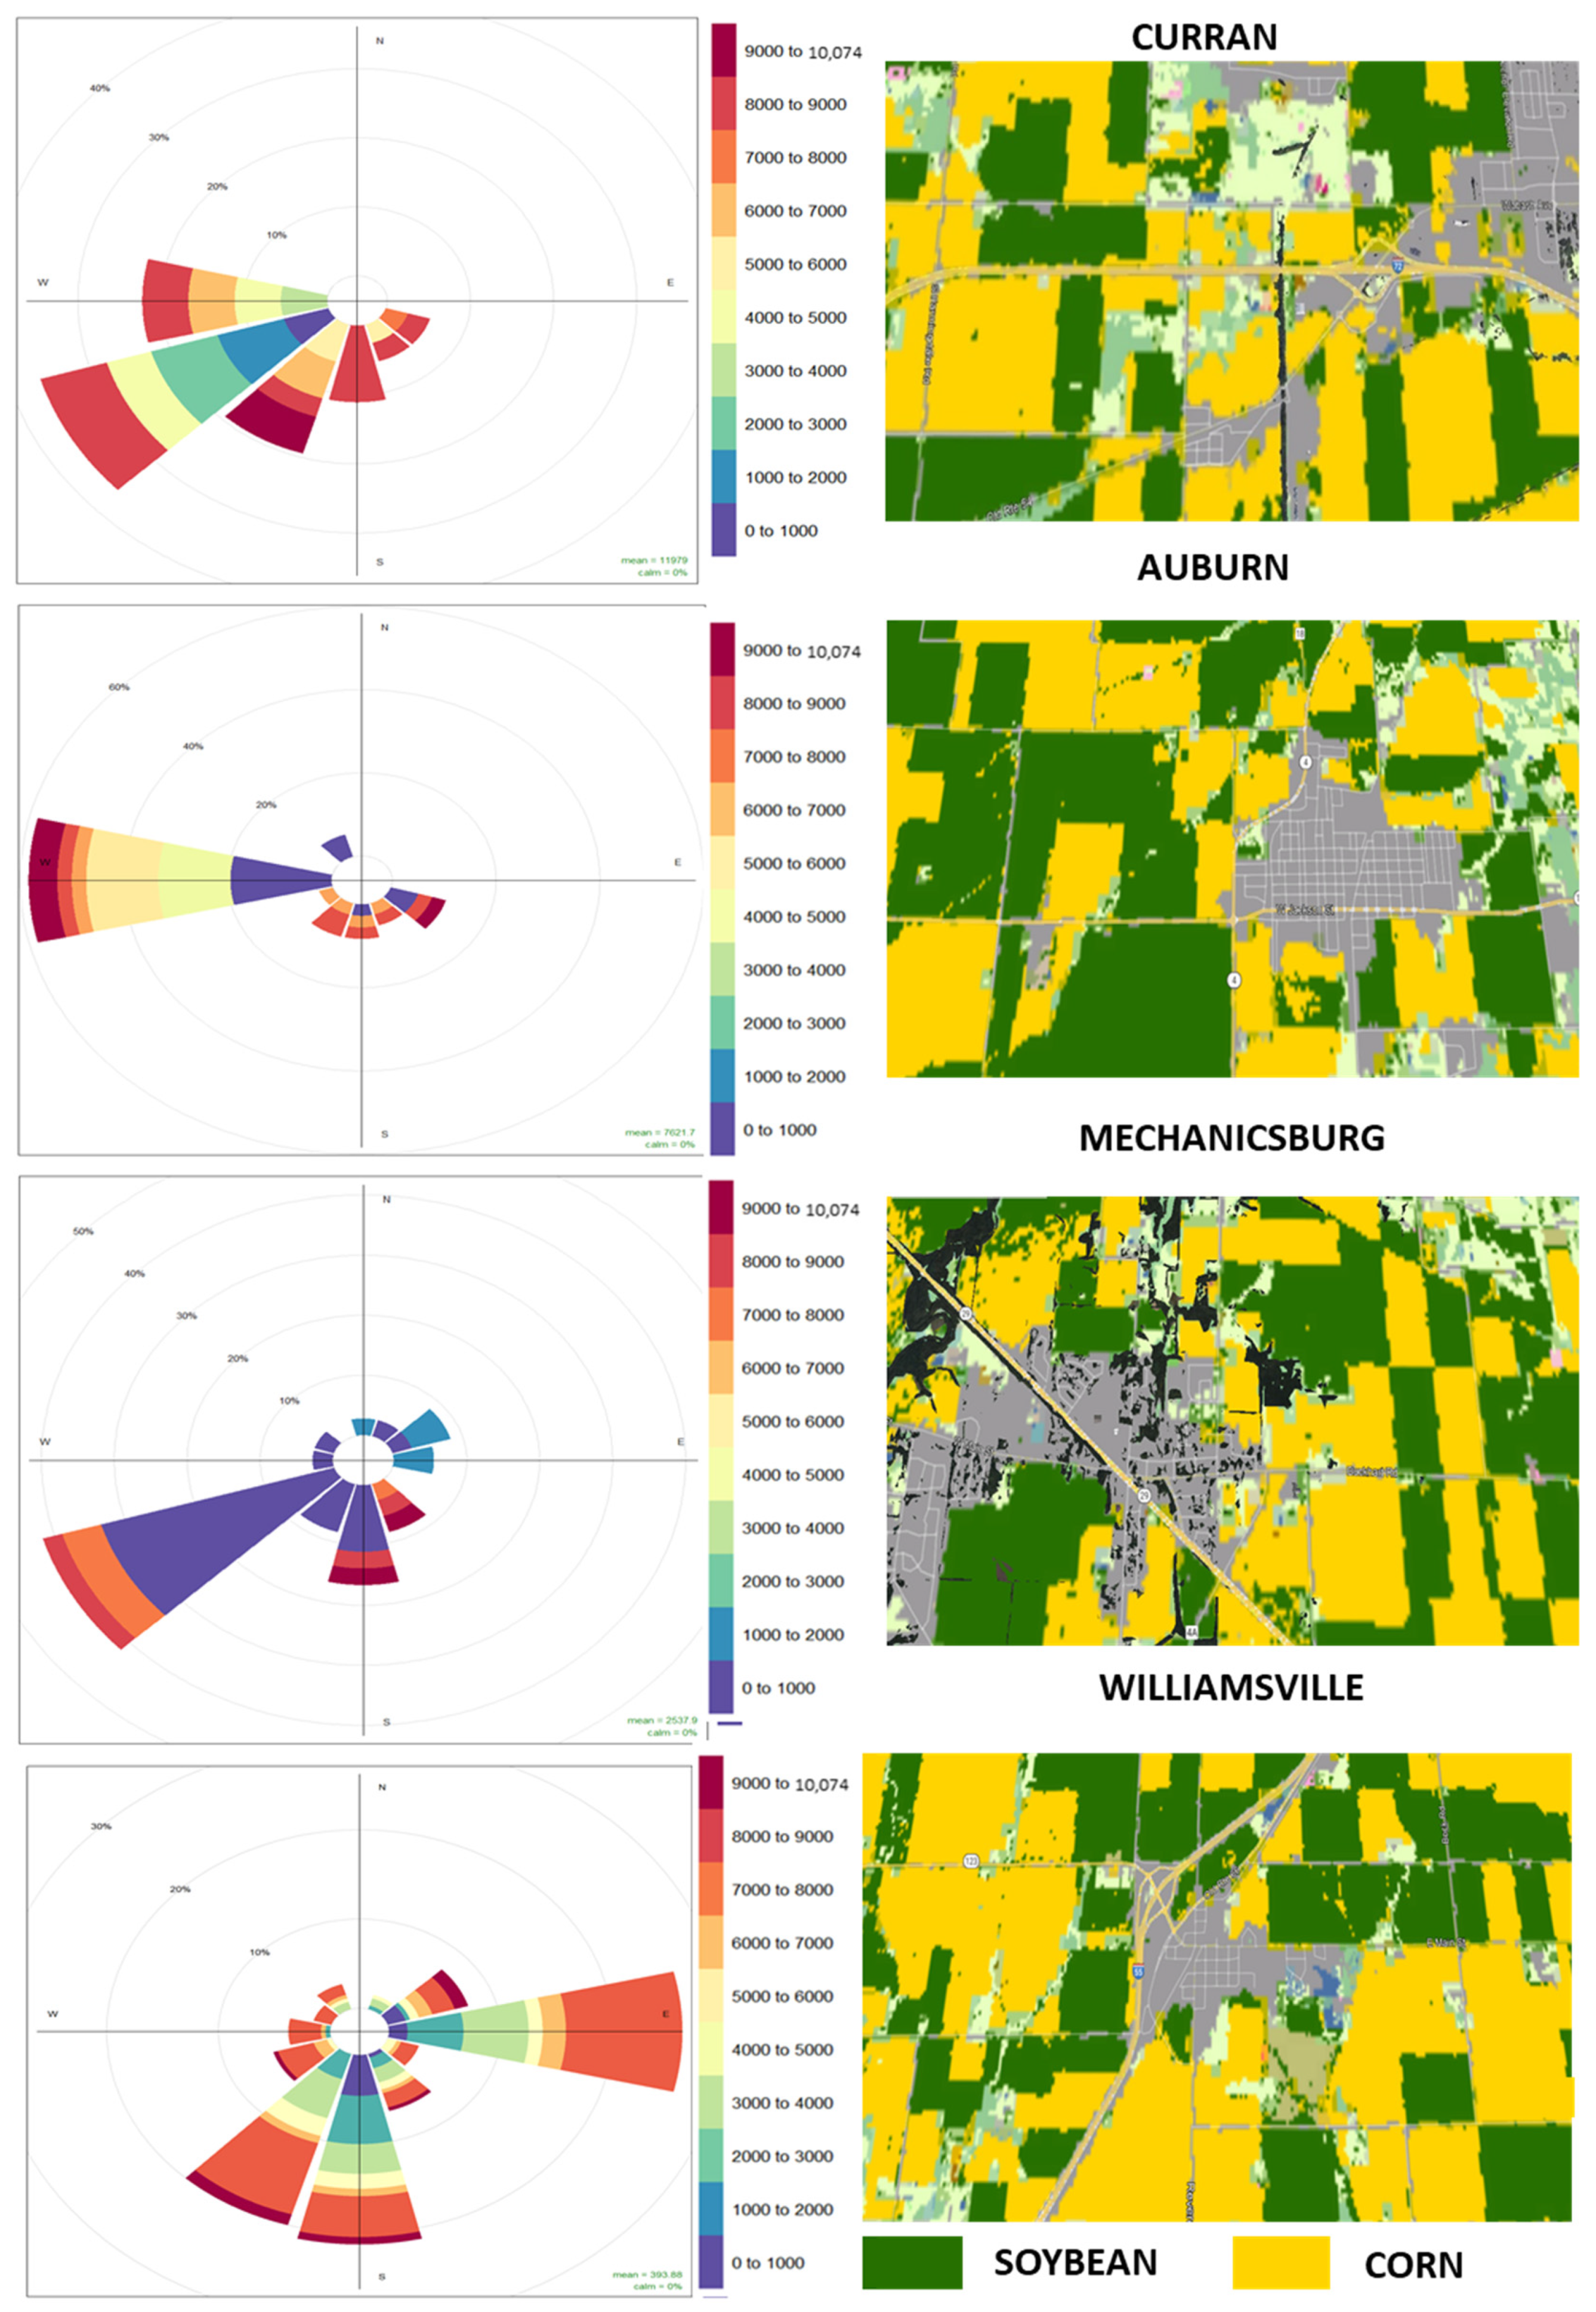
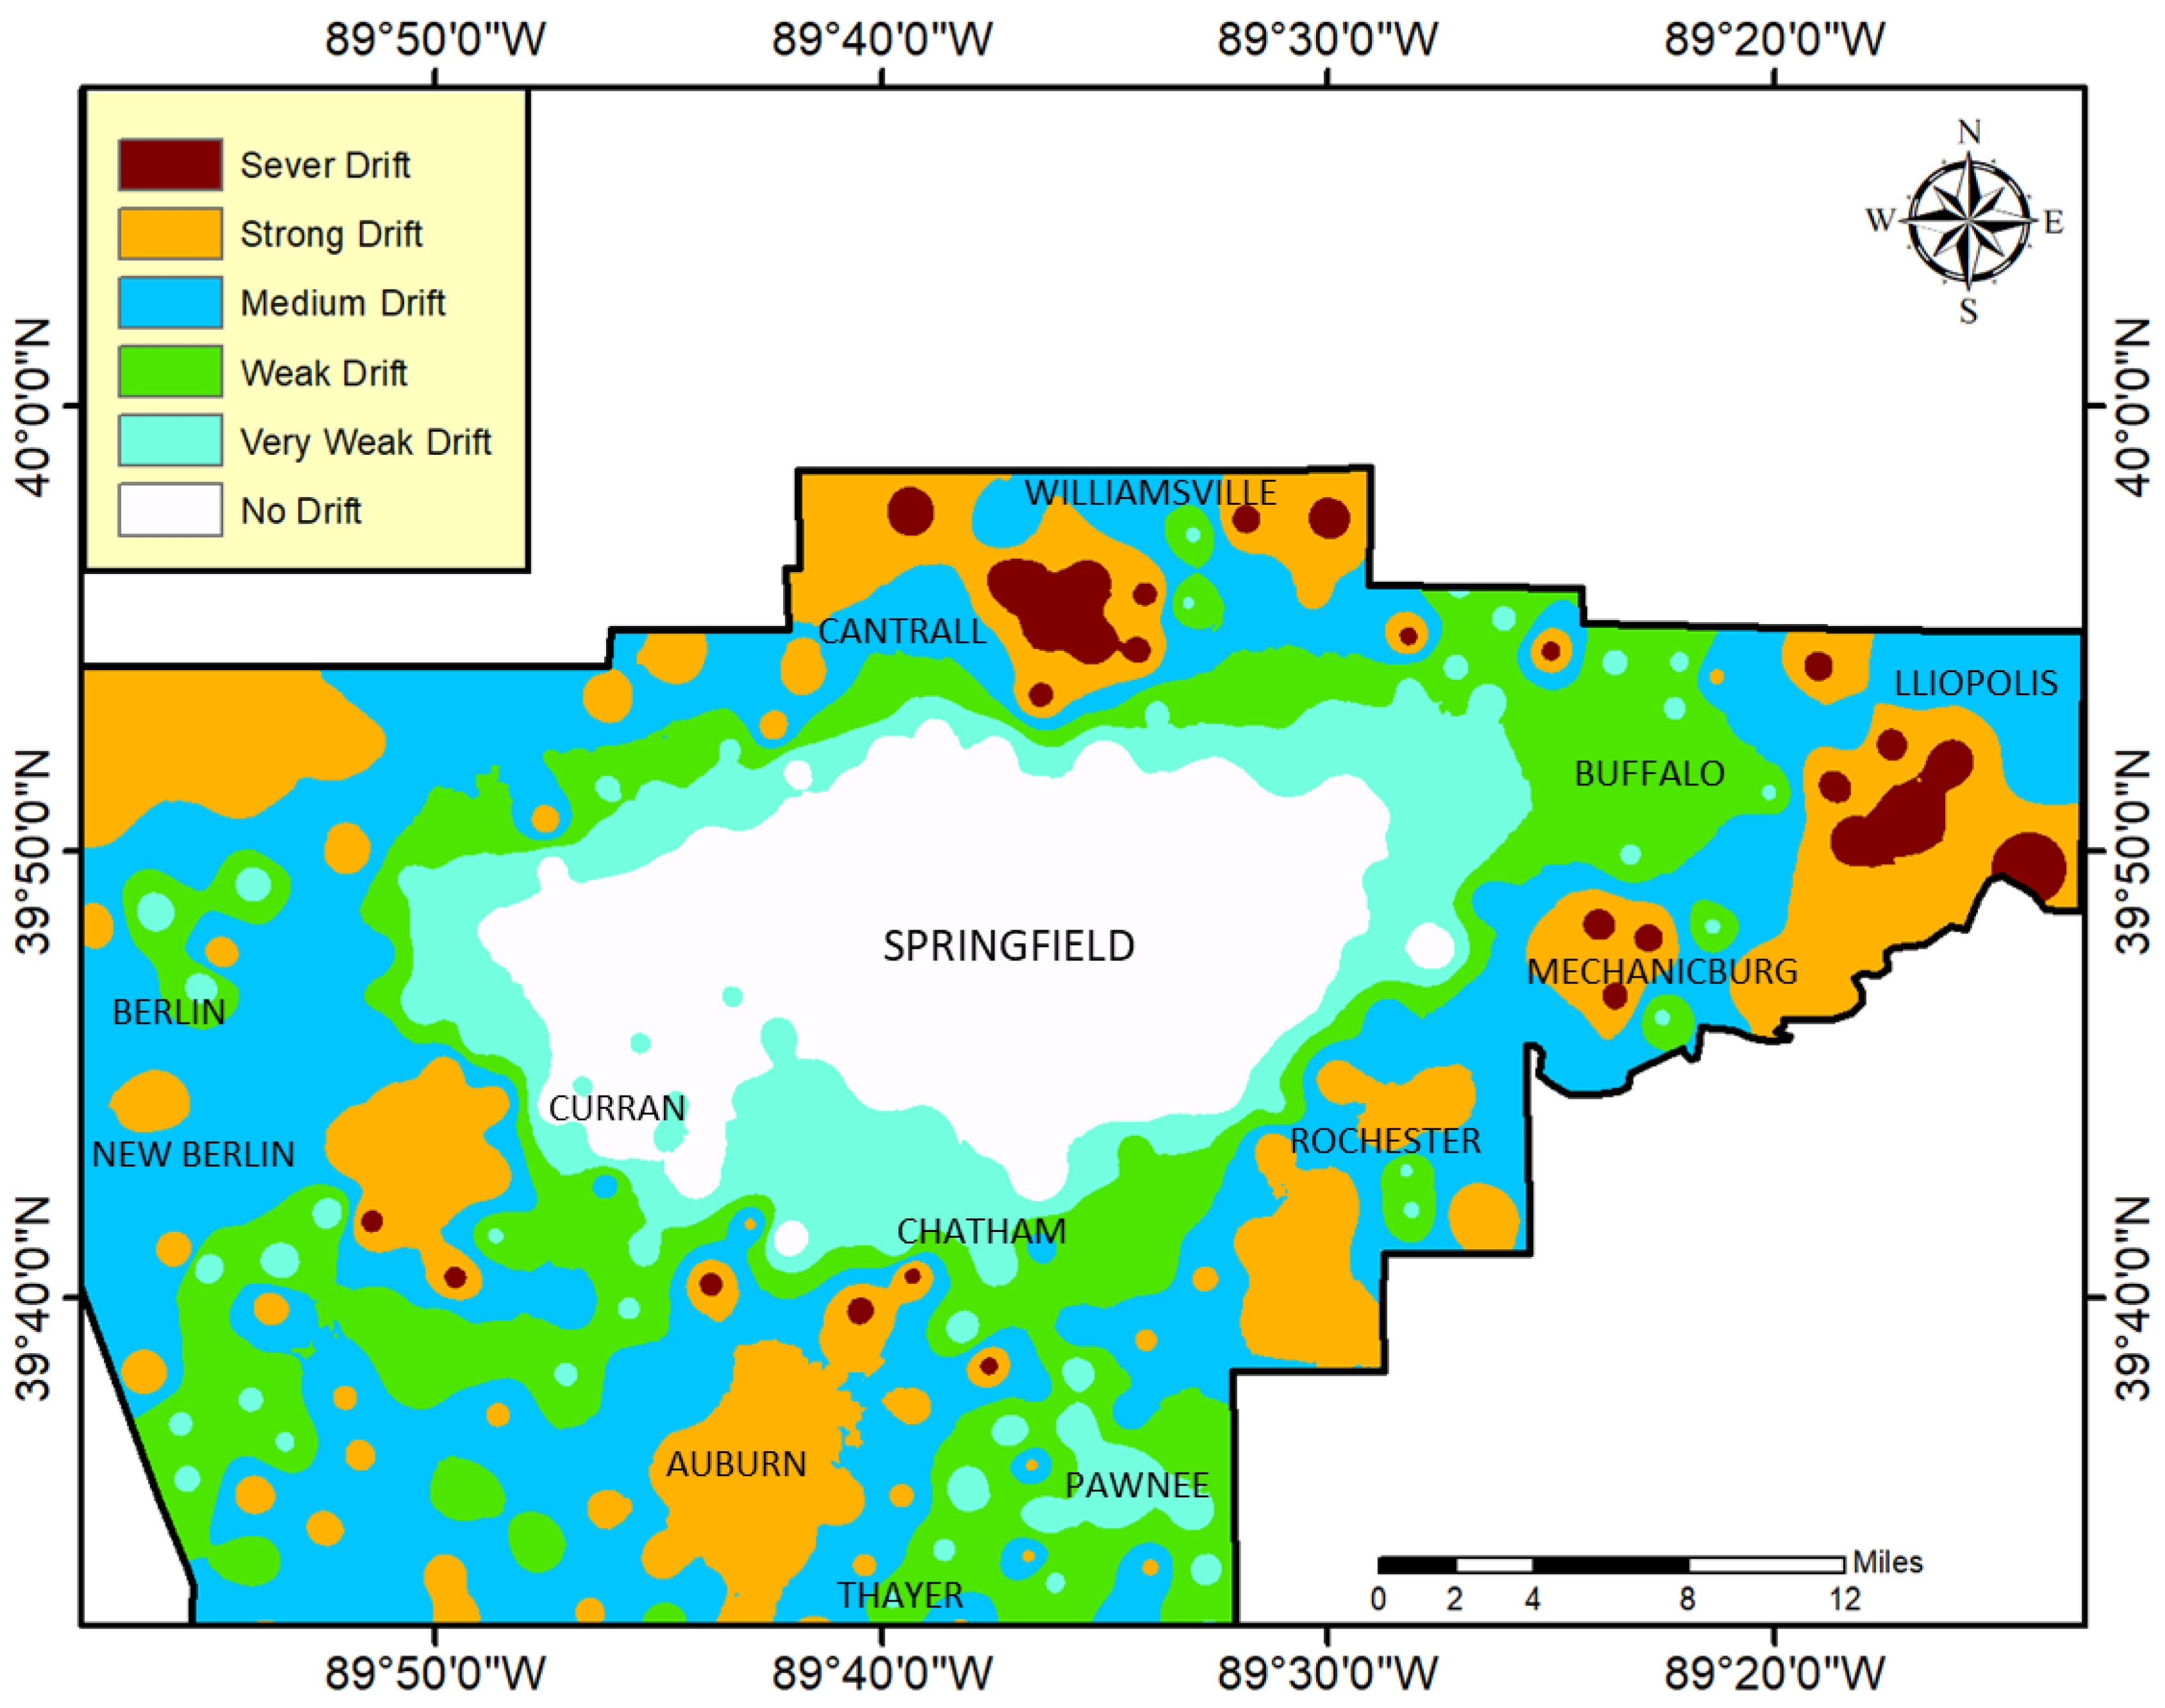
Figure 9 shows that pesticide applications at rates of around 25 kg/ha were received by Mechanicsburg, Auburn, and Curran fields, while Williamsville’s farms had rates of around 32 kg/ha. The pollution (pesticide) rose charts shown in Figure 9 were constructed by considering wind speed, frequency, and direction during the four application days that each of the four fields experienced. This study conducted simulations including both aerial and ground applications of pesticide flowers mostly for soybeans and corn. The west and south-westerly winds significantly influenced the average deposition and drift of organophosphate pesticides in the Curran, Auburn, and Mechanicsburg fields, as shown in Figure 9. Half of the overall concentration is explained due to two wind sectors in the west and southwest. The average deposition and spread of organophosphate pesticides in the Williamsville field, on the other hand, are mostly determined by the south wind, as depicted in Figure 9. Two of the south section’s wind sectors account for more than half of the concentration overall.
Figure 10 illustrates the average categories of Sangamon County’s agriculture pesticide (organophosphate) exposure drift based on the AgDRIFT model. From Figure 9, it is clear that the city of Springfield and its urban suburbs, such as Curran, are not affected by pesticide drift due to the wide buffer zone and the geographical distance between them and the fields treated with pesticides. Conversely, it is clear from Figure 8 that urban-agricultural communities, such as Williamsburg, Lliopolis, Mechanicsburg, and Auburn, are severely impacted by pesticide drift due to surrounding corn and peanut fields in these villages treated with pesticides from all directions. Meanwhile, the villages of Pawnee, Buffalo, and Berlin have very weak pesticide drift. It is worth noting that the application of buffer zones to protect the residents of agricultural communities in Sangamon County is very vital to protect them from pesticide drift. However, the prevailing wind pattern during pesticide application controls the degree of pesticide drift.
The study found that 7.24% of water bodies, equivalent to 9652 acres, were at risk of organophosphate pesticide exposure due to drift outside the original treatment area. Additionally, 36% of buildings near the affected sites were also at risk of pesticide spray drifting off-site. The study area covered 30,200 acres with approximately 34 water bodies, 12 of which were within the high range of pesticide spray drift from soybean and corn fields. Moreover, about 106 buildings covering an area of 10,300 km2 were exposed to the risk of organophosphate pesticide exposure drift. The study concluded that the estimated average drift of pesticides for ground application was more than 80 m from the intended targets, while the predicted average drift for aerial application was more than 400 m from their intended targets.
Assessing the harmful effects of organophosphate pesticide drift exposure on health and developing intervention strategies for reducing exposure drift in urban-agricultural interface communities is critical. However, estimating pesticide drift is difficult as there are no measures of ambient pesticide levels on a county or field level. To overcome this challenge, we used a hybrid modeling dispersion technique to investigate the potential quantities of ground-boom and aerial exposure.
This study involved the use of HYSPLIT and AgDRIFT models to simulate possible pesticide spray drift on both a county- and field-level scale and assess its potential influence on exposure in urban-agricultural interface communities in Sangamon County. The HYSPLIT model was utilized to simulate pesticide dispersion during mobility and dispersed through the atmosphere over Sangamon County, and the AgDRIFT model to estimate the agriculture pesticides drift out of the intended target. This hybrid approach allowed us to estimate the exposure to organophosphate pesticide exposure drift throughout the county level and the field level and contributed to enhanced confidence in the simulation findings.
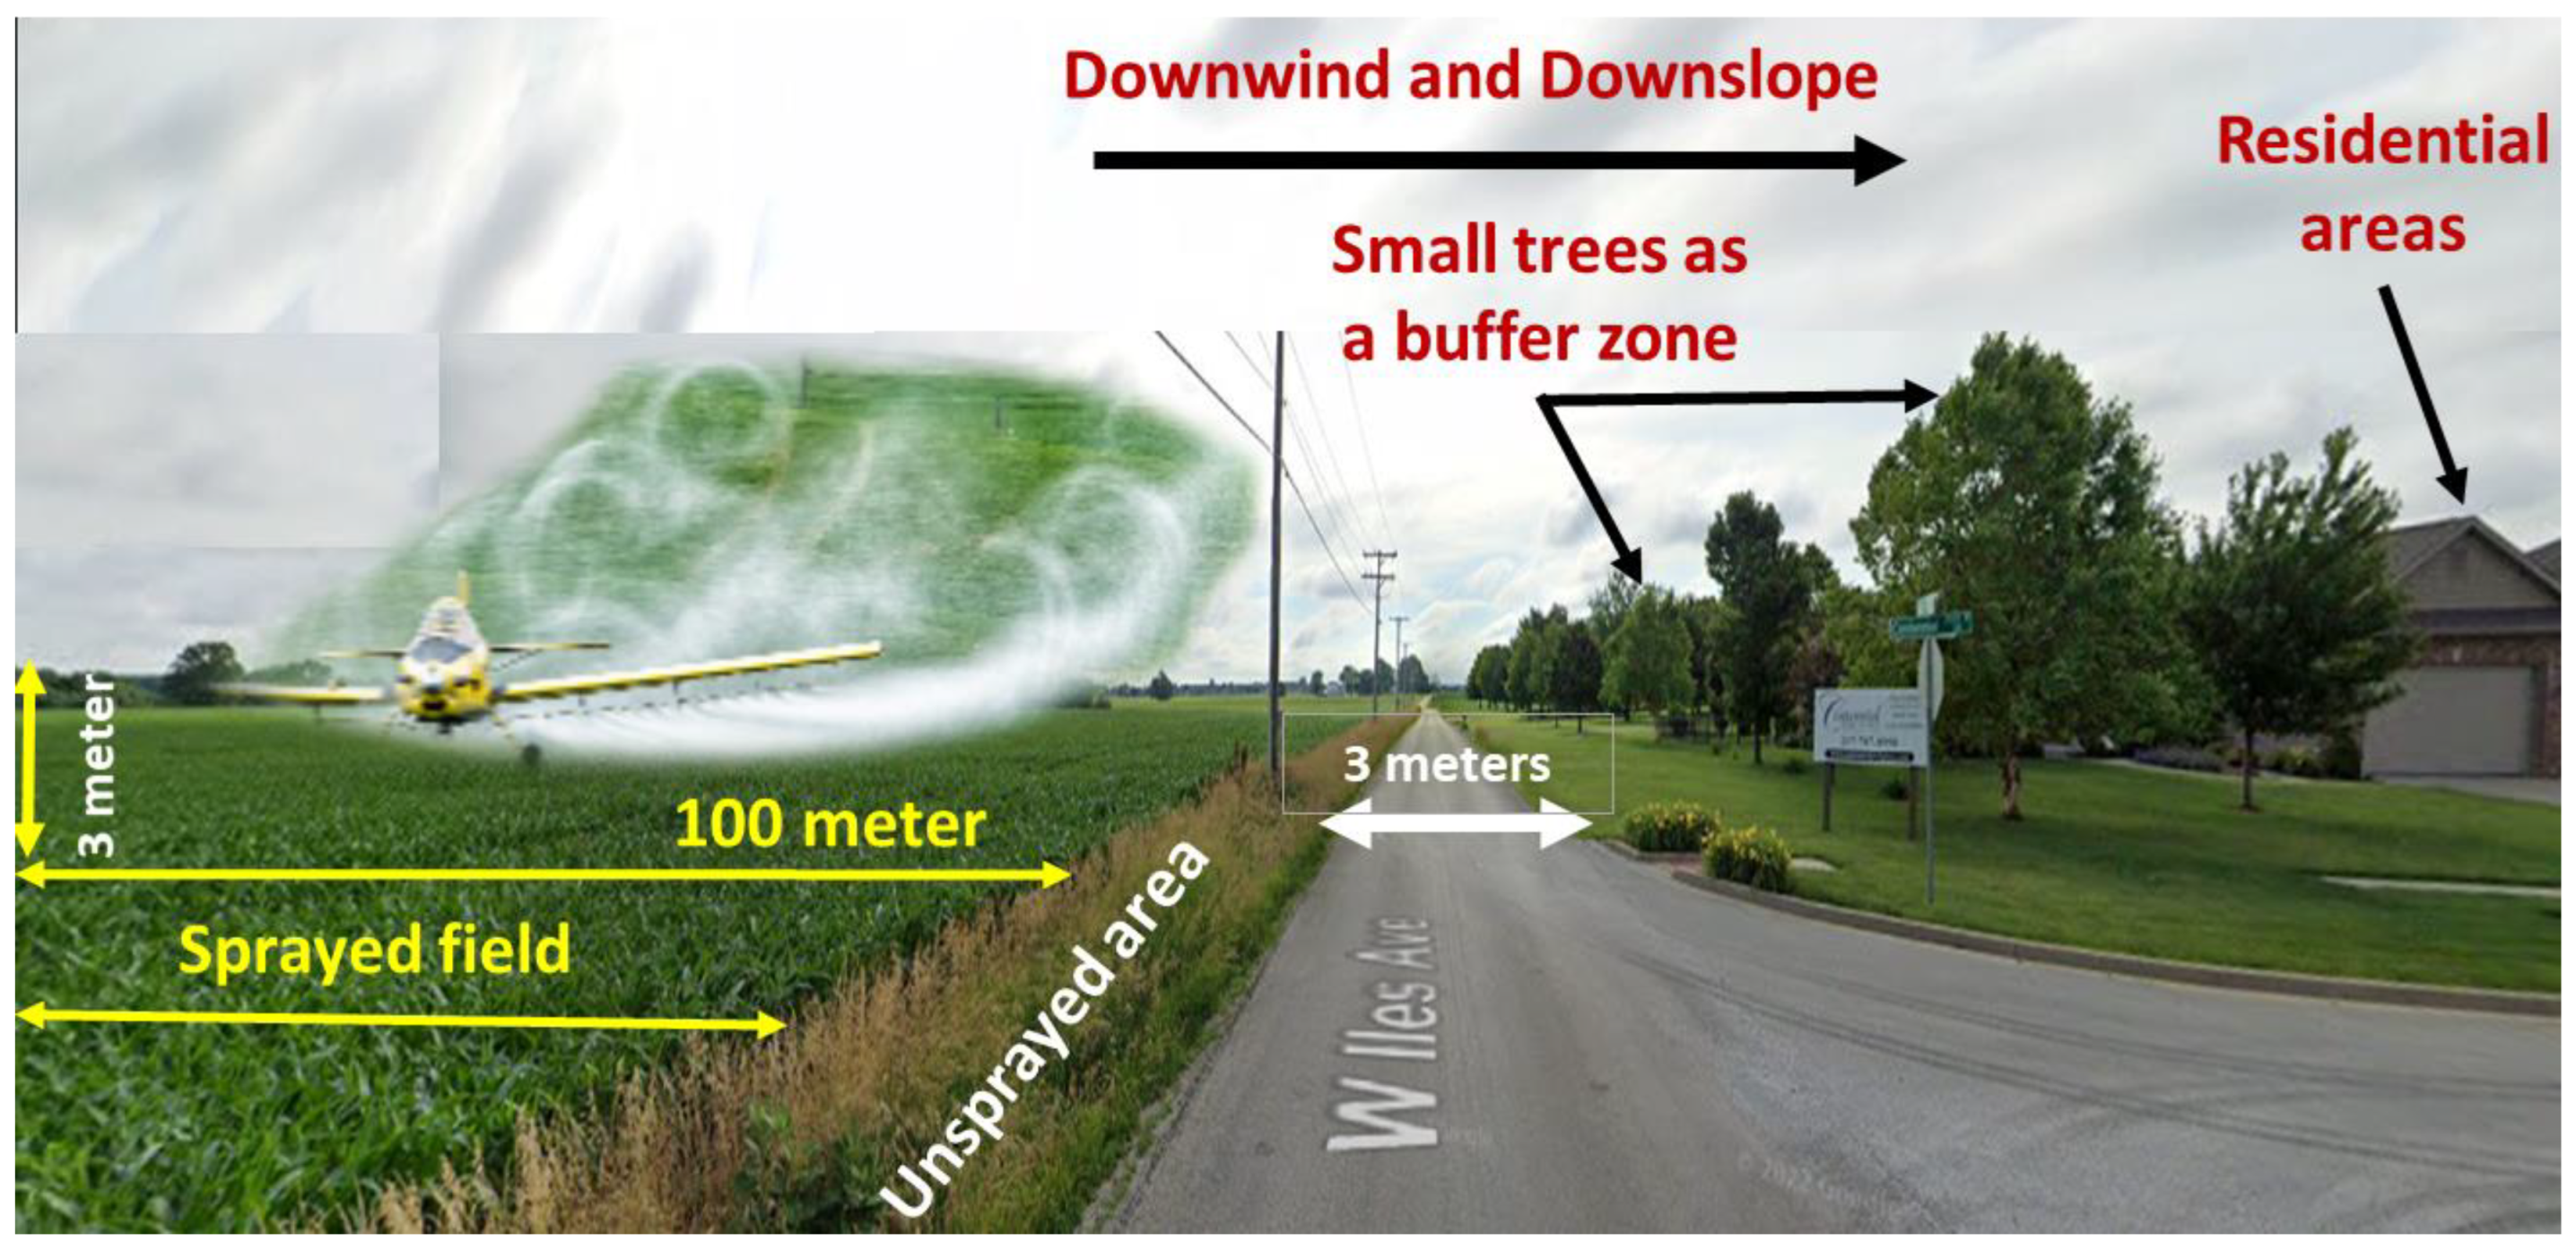
The results showed that the impact of organophosphate pesticide spray drift from the treated fields on the main urban areas of Springfield City is limited due to the urban mass being concentrated far from agricultural areas treated with pesticides. However, urban agricultural communities adjacent to agricultural fields treated with pesticides are at risk of pesticide spray drifting to varying degrees, depending on the prevailing wind pattern and their proximity to the treated fields. The study also revealed that Sangamon County relies on aerial application to spray pesticides instead of ground application due to the vast agricultural area, in addition to being more efficient in terms of time and workforce. As a result, the opportunity for pesticides to drift beyond their intended targets has increased dramatically, making all residential areas and nearby water bodies vulnerable to organophosphate pesticide drifting, as shown in Figure 11.
This recent finding challenges one of the main pieces of evidence in a few previous simulation studies [43,68] that suggest a population could be exposed to toxic pesticide drift when the surrounding crop fields reach a certain threshold, without taking wind patterns into account. However, this result is fully consistent with the predictions of other studies [41,50,67] that imply the dispersion of organophosphate pesticide vapors emitted at the time of spraying is primarily dependent on the prevailing weather conditions, particularly wind patterns (speed and direction).
According to the findings, the increased drift of pesticides into Springfield’s urban-agricultural interface communities was caused by the presence of four main air mass groups, originating from five directions. The first group (36%) originated in Headwaters Apple Creek and traveled through New Berlin. The second group (21%) originated in Prairie Creek and passed through Curran Village. The third group (24%) mostly flowed from Pawnee and Rochester. The fourth group was found to be the cleanest transfer path. Interestingly, the factors leading to this result were the same as those that caused the previous one. However, it is important to note that this finding is limited by the local weather conditions that could have affected the pesticide applications in each field separately and cannot be extrapolated to all areas.
It has been discovered that residential and agricultural areas have high PSCF values, which could lead to air pollution in the communities situated around Springfield City’s urban-agricultural interface. Nonetheless, Springfield and its suburbs are not under any threat from pesticide spread, due to negligible exposure drift. It is possible that the lack of adequate air monitoring stations in Sangamon County influenced this outcome. However, this result may also support the hypothesis that equal amounts of pesticides are released in proportion to the total area of the treated fields.
During the simulations in selected fields, it was surprising to find that the amount of pesticide drifting and depositing outside of their targets was relatively low, despite releasing large amounts of pesticides. This could be attributed to the fact that only 0.136% of the total quantity of organophosphate pesticide used was transformed into small particles (aerosols), and about 10% of the overall quantity of the organophosphate pesticide evaporated. These findings were based on droplet size distributions obtained through multiple AgDRIFT examinations and are consistent with the results of other studies [41,67].
Various studies have been conducted to determine the concentration and effect of pesticides on the environment. These studies utilized statistical models that took into account weather conditions, pesticide toxicity, and risks [23,32,37,40,42,52,65,67]. The results of these studies consistently showed that organophosphate pesticides applied in fields can drift, depending on several factors such as the type of application used, wind patterns, and prevailing weather conditions. Some previous studies have also investigated the relationship between the proximity of inhabitants to treated farms and the levels of pesticide residues.
This study found that the drifting of organophosphate pesticides from five pesticide-treated fields to Springfield was not significant, despite variations in wind speed and field location. However, the drift had a significant impact on urban-agricultural interface populations, with an average pesticide concentration of around 2000 ng/m3 in the surrounding area. Maximum concentrations increased by 13,000 ng/m3 around the application site shortly after application, with vapors spreading but concentrations dropping quickly. For pesticides with high volatilization rates, secondary drift may also be significant, consistent with Zivan et al. [67].
These findings indicate that simulations in various fields showed that residents and lakes within a buffer zone of 450 m were at risk from pesticide drift for two hours before peak concentrations ended. The greatest decrease in pesticide concentrations was observed after standard amounts of pesticides were released, from 13 mg/m3 to 7 mg/m3. No signs of pesticide drift were found outside the 1–2 km range. The simulation in the Richland Creek field showed a minor drop in pesticide concentrations in the third and fourth hours of the expected release.
These results are consistent with previous observational studies [32,41,42,52,65]. They have shown that after pesticide application, the highest concentrations of pesticides can be found near the application site, with concentrations exceeding 1000 ng/m3. However, these concentrations quickly decrease as the vapors spread. The study also found that the use of organophosphate pesticides in Springfield City’s urban-agricultural interface communities could pose a risk to approximately 7% of all water bodies and over 35% of buildings. On average, pesticides applied on the ground can drift more than 80 m away from their intended target, while organophosphate pesticides applied by air can drift over 400 m.
These findings are consistent with recent studies that have shown that urban sprawl towards agricultural fields can result in an increased risk of pesticides drifting into residential areas [9,32,40,49,54,61,62,63,64,65,66,67,68]. While the study has its limitations and hypotheses, it provides an accurate evaluation of organophosphate pesticide drift, which can serve as a basis for further in-depth research on drift tendencies.
By using a hybrid modeling method, it is possible to obtain reasonable estimates of the frequent drift of organophosphate pesticides in Sangamon County at both the county-level and field-level scales. This approach could help generate high-resolution pesticide data that can fill gaps in the majority of US states’ pesticide use statistics.

4. Conclusions

This study was conducted to estimate the exposure to organophosphate pesticide drift in Sangamon County, Illinois, on both a county- and field-level scale. A hybrid modeling approach was used, employing the HYSPLIT atmospheric model to estimate the drifting of organophosphate pesticides at the Sangamon County level, and the AgDRIFT model to estimate organophosphate pesticide exposure drift at the field level. The study used HRRR meteorological data at 3 km and 72 h backward trajectories computed at 0, 6, 12, and 18 UTC, as well as clustering analysis using the HYSPLIT model in Sangamon County. This methodology relied on employing the CDL database, the annual organophosphate pesticide database, LULC data, and ground meteorological data using the AgDRIFT model in three selected fields. The study aimed to provide a new spatial estimate that quantitatively defines the areas potentially impacted by drifting pesticides.
The findings showed that the potential for prolonged exposure drifting occurred mainly in rural areas of Sangamon County, with exposure drifting consistently rising in urban-agricultural interface communities, increasing in more rural areas, and declining in Springfield City, which has a higher population density. The development pattern of urban sprawl in Sangamon County contributed strongly to increasing residents’ exposure to the risk of pesticide drift. The horizontal expansion of Springfield City in all directions led to the reduction of buffer zones between fields treated with pesticides and residential areas. This study confirms previous findings indicating that pesticide drift is more severe in rural communities.
Several variables affect organophosphate pesticide drift, including meteorological conditions, buffer zones, chemical composition, nozzle size, and application technique. From an environmental and health standpoint, the results of this study can help local urban planners improve their understanding of the association between pesticide drift behavior and planning agricultural communities in a way that ensures a sufficient buffer zone to limit the drift of pesticides and improve air quality.
The study concluded that using the HYSPLIT model for evaluating organophosphate pesticide drift at the county level from their intended targets was effective, considering the model’s capability to determine trajectories of air masses carrying air pollutants affecting populated areas within Sangamon County. The present study also concluded that using the AgDRIFT atmospheric model was useful for estimating pesticide drift exposure in urban agricultural communities at the field level. The applied method employs a rigorous approach that considers both temporally and spatially varied data, in addition to the appropriate model parameters utilized in pesticide drift estimation, and thus, it might be expanded to other counties in the United States and internationally. Finally, the study recommends that further research be undertaken to encourage the use of spray technologies scientifically verified by the EPA’s Drift Reduction Technology (DRT) Program to significantly reduce pesticide drift. These technologies include anti-drift nozzles, spray shields, and drift-reducing adjuvant chemicals.

Author Contributions

Conceptualization, G.E.A.; Methodology, H.I.; Software, H.I.; Validation, G.E.A. and H.I.; Formal analysis, G.E.A. and H.I.; Investigation, H.I.; Resources, S.F.; Data curation, S.F.; Writing—original draft, H.I.; Supervision, G.E.A.; Project administration, G.E.A.; Funding acquisition, G.E.A. All authors have read and agreed to the published version of the manuscript.

Funding

This work is funded by the 1890 Capacity Building Grants Program (CBG) [Grant No. 2020-38821-31084/project accession No. 1021820] from the USDA National Institute of Food and Agriculture.

Data Availability Statement

The datasets generated during and/or analyzed during this study are available from the corresponding author upon reasonable request.

Conflicts of Interest

The authors declare no conflict of interest. The funders had no role in the design of the study; in the collection, analyses, or interpretation of data; in the writing of the manuscript; or in the decision to publish the results.

References

  1. Sharma, A.; Kumar, V.; Shahzad, B.; Tanveer, M.; Sidhu, G.P.S.; Handa, N.; Kohli, S.K.; Yadav, P.; Bali, A.S.; Parihar, R.D.; et al. Worldwide pesticide usage and its impacts on ecosystem. SN Appl. Sci. 2019, 1, 1446. [Google Scholar] [CrossRef]
  2. Bhatt, P.; Zhou, X.; Huang, Y.; Zhang, W.; Chen, S. Characterization of the role of esterases in the biodegradation of organophosphate, carbamate, and pyrethroid pesticides. J. Hazard. Mater. 2021, 411, 125026. [Google Scholar] [CrossRef] [PubMed]
  3. Bhatt, P.; Bhatt, K.; Sharma, A.; Zhang, W.; Mishra, S.; Chen, S. Biotechnological basis of microbial consortia for the removal of pesticides from the environment. Crit. Rev. Biotechnol. 2021, 41, 317–338. [Google Scholar] [CrossRef] [PubMed]
  4. Pathak, V.M.; Verma, V.K.; Rawat, B.S.; Kaur, B.; Babu, N.; Sharma, A.; Dewali, S.; Yadav, M.; Kumari, R.; Singh, S.; et al. Current status of pesticide effects on environment, human health and it’s eco-friendly management as bioremediation: A comprehensive review. Front. Microbiol. 2022, 13, 962619. [Google Scholar] [CrossRef] [PubMed]
  5. Burchfield, S.L.; Bailey, D.C.; Todt, C.E.; Denney, R.D.; Negga, R.; Fitsanakis, V.A. Acute exposure to a glyphosate-containing herbicide formulation inhibits Complex II and increases hydrogen peroxide in the model organism Caenorhabditis elegans. Environ. Toxicol. Pharmacol. 2018, 66, 36–42. [Google Scholar] [CrossRef]
  6. Centner, T.J.; Russell, L.; Mays, M. Viewing evidence of harm accompanying uses of glyphosate-based herbicides under US legal requirements. Sci. Total Environ. 2018, 648, 609–617. [Google Scholar] [CrossRef]
  7. Chen, M.; Chang, C.-H.; Tao, L.; Lu, C. Residential Exposure to Pesticide During Childhood and Childhood Cancers: A Meta-Analysis. Pediatrics 2015, 136, 719–729. [Google Scholar] [CrossRef] [PubMed]
  8. Boffetta, P.; Adami, H.-O.; Berry, S.C.; Mandel, J.S. Atrazine and Cancer: A Review of the Epidemiologic Evidence. Eur. J. Cancer Prev. 2013, 22, 169–180. [Google Scholar] [CrossRef]
  9. VoPham, T.; Brooks, M.M.; Yuan, J.-M.; Talbott, E.O.; Ruddell, D.; Hart, J.E.; Chang, C.-C.H.; Weissfeld, J.L. Pesticide exposure and hepatocellular carcinoma risk: A case-control study using a geographic information system (GIS) to link SEER-Medicare and California pesticide data. Environ. Res. 2015, 143, 68–82. [Google Scholar] [CrossRef]
  10. Worldatlas. 2022. Available online: https://www.worldatlas.com/articles/toppesticide-consuming-countries-of-the-world.html (accessed on 14 December 2023).
  11. The WHO Recommended Classification of Pesticides by Hazard and Guidelines to Classification: 2009; World Health Organization: Geneva, Switzerland, 2010.
  12. Thundiyil, J.G.; Stober, J.; Besbelli, N.; Pronczuk, J. Acute pesticide poisoning: A proposed classification tool. Bull. World Health Organ. 2008, 86, 205–209. [Google Scholar] [CrossRef]
  13. Worldometer Pesticide Use by Country. Available online: https://www.worldometers.info/food-agriculture/pesticides-by-country/ (accessed on 7 July 2022).
  14. International Union of Pure and Applied Chemistry (IUPAC). Global Availability of Information on Agrochemicals. Available online: http://sitem.herts.ac.uk/aeru/iupac/atoz.htm (accessed on 1 August 2023).
  15. U.S. EPA. Regulatory Impact Analysis of Worker Protection Standard for Agricultural Pesticides; Report Number EPA/735/R/92/002; Biological and Economic Analysis Division Office of Pesticide Programs: Washington, DC, USA, 1992; Volume 20460. Available online: https://nepis.epa.gov/Exe/ZyPDF.cgi?Dockey=P100LYPD.PDF (accessed on 20 September 2023).
  16. Donley, N.; Bullard, R.D.; Economos, J.; Figueroa, I.; Lee, J.; Liebman, A.K.; Martinez, D.N.; Shafiei, F. Pesticides and environmental injustice in the USA: Root causes, current regulatory reinforcement and a path forward. BMC Public Health 2022, 22, 708. [Google Scholar] [CrossRef] [PubMed]
  17. Karunarathne, A.; Gunnell, D.; Konradsen, F.; Eddleston, M. How many premature deaths from pesticide suicide have occurred since the agricultural Green Revolution? Clin. Toxicol. 2020, 58, 227–232. [Google Scholar] [CrossRef] [PubMed]
  18. Faluomi, M.; Cialini, M.; Naviganti, M.; Mastromauro, A.; Marinangeli, F.; Angeletti, C. Organophosphates pesticide poisoning: A peculiar case report. J. Emerg. Crit. Care Med. 2022, 6, 30. [Google Scholar] [CrossRef]
  19. Alavanja, M.C.R. Introduction: Pesticides Use and Exposure, Extensive Worldwide. Rev. Environ. Health 2009, 24, 303–310. [Google Scholar] [CrossRef]
  20. Alavanja, M.C.R.; Sprince, N.L.; Oliver, E.; Whitten, P.; Lynch, C.F.; Gillette, P.P.; Logsden-Sacket, N.; Zwerling, C. Nested case-control analysis of high pesticide exposure events from the Agricultural Health Study. Am. J. Ind. Med. 2001, 39, 557–563. [Google Scholar] [CrossRef] [PubMed]
  21. Brouwer, M.; Kromhout, H.; Vermeulen, R.; Duyzer, J.; Kramer, H.; Hazeu, G.; De Snoo, G.; Huss, A. Assessment of residential environmental exposure to pesticides from agricultural fields in the Netherlands. J. Expo. Sci. Environ. Epidemiol. 2017, 28, 173–181. [Google Scholar] [CrossRef] [PubMed]
  22. Parrón, T.; Requena, M.; Hernández, A.F.; Alarcón, R. Environmental exposure to pesticides and cancer risk in multiple human organ systems. Toxicol. Lett. 2014, 230, 157–165. [Google Scholar] [CrossRef] [PubMed]
  23. Yan, D.; Zhang, Y.; Liu, L.; Yan, H. Pesticide exposure and risk of Alzheimer’s disease: A systematic review and meta-analysis. Sci. Rep. 2016, 6, 32222. [Google Scholar] [CrossRef]
  24. Zhang, C.; Hu, R.; Huang, J.; Huang, X.; Shi, G.; Li, Y.; Yin, Y.; Chen, Z. Health effect of agricultural pesticide use in China: Implications for the development of GM crops. Sci. Rep. 2016, 6, 34918. [Google Scholar] [CrossRef]
  25. King, A.M.; Aaron, C.K. Organophosphate and Carbamate Poisoning. Emerg. Med. Clin. N. Am. 2015, 33, 133–151. [Google Scholar] [CrossRef]
  26. Sinha, S.N.; Kumar, K.R.; Ungarala, R.; Kumar, D.; Deshpande, A.; Vasudev, K.; Boiroju, N.K.; Singh, A.; Naik, R.P.; Pokharakar, S. Toxicokinetic analysis of commonly used pesticides using data on acute poisoning cases from Hyderabad, South India. Chemosphere 2020, 268, 129488. [Google Scholar] [CrossRef] [PubMed]
  27. Alkon, A.; Gunier, R.B.; Hazard, K.; Castorina, R.; Hoffman, P.D.; Scott, R.P.; Anderson, K.A.; Bradman, A. Preschool-Age Children’s Pesticide Exposures in Childcare Centers and at Home in Northern California. J. Pediatr. Health Care 2022, 36, 34–45. [Google Scholar] [CrossRef] [PubMed]
  28. Lu, C.; Fenske, R.A.; Simcox, N.J.; Kalman, D. Pesticide Exposure of Children in an Agricultural Community: Evidence of Household Proximity to Farmland and Take Home Exposure Pathways. Environ. Res. 2000, 84, 290–302. [Google Scholar] [CrossRef] [PubMed]
  29. Yusà, V.; Coscollà, C.; Mellouki, W.; Pastor, A.; de la Guardia, M. Sampling and analysis of pesticides in ambient air. J. Chromatogr. A 2009, 1216, 2972–2983. [Google Scholar] [CrossRef] [PubMed]
  30. Manley, C.K.; Villanger, G.D.; Thomsen, C.; Cequier, E.; Sakhi, A.K.; Reichborn-Kjennerud, T.; Herring, A.H.; Øvergaard, K.R.; Zeiner, P.; Roell, K.R.; et al. Prenatal Exposure to Organophosphorus Pesticides and Preschool ADHD in the Norwegian Mother, Father and Child Cohort Study. Int. J. Environ. Res. Public Health 2022, 19, 8148. [Google Scholar] [CrossRef] [PubMed]
  31. Tessari, L.; Angriman, M.; Díaz-Román, A.; Zhang, J.; Conca, A.; Cortese, S. Association Between Exposure to Pesticides and ADHD or Autism Spectrum Disorder: A Systematic Review of the Literature. J. Atten. Disord. 2020, 26, 48–71. [Google Scholar] [CrossRef] [PubMed]
  32. El Afandi, G.; Ismael, H.; Fall, S.; Ankumah, R. Effectiveness of Utilizing Remote Sensing and GIS Techniques to Estimate the Exposure to Agricultural Pesticides Drift over Macon, Alabama. Agronomy 2023, 13, 1759. [Google Scholar] [CrossRef]
  33. Boonupara, T.; Udomkun, P.; Khan, E.; Kajitvichyanukul, P. Airborne Pesticides from Agricultural Practices: A Critical Review of Pathways, Influencing Factors, and Human Health Implications. Toxics 2023, 11, 858. [Google Scholar] [CrossRef]
  34. Tudi, M.; Ruan, H.D.; Wang, L.; Lyu, J.; Sadler, R.; Connell, D.; Chu, C.; Phung, D.T. Agriculture Development, Pesticide Application and Its Impact on the Environment. Int. J. Environ. Res. Public Health 2021, 18, 1112. [Google Scholar] [CrossRef]
  35. Menezes, A.; Neves, F.; Afonso, P.; Pereira, D.P. Development, validation, and application of a method based on DI-SPME and GC–MS for determination of pesticides of different chemical groups in surface and groundwater samples. Microchem. J. 2010, 96, 139–145. [Google Scholar]
  36. Carles, C.; Bouvier, G.; Lebailly, P.; Baldi, I. Use of job-exposure matrices to estimate occupational exposure to pesticides: A review. J. Expo. Sci. Environ. Epidemiol. 2016, 27, 125–140. [Google Scholar] [CrossRef] [PubMed]
  37. Schulz, R.; Bub, S.; Petschick, L.L.; Stehle, S.; Wolfram, J. Applied pesticide toxicity shifts toward plants and invertebrates, even in GM crops. Science 2021, 372, 81–84. [Google Scholar] [CrossRef] [PubMed]
  38. Wang, Z.; He, X.; Li, T.; Huang, M.; Zhang, Y.; Xu, L.; Deng, X. Evaluation method of pesticide droplet drift based on laser imaging. Trans. Chin. Soc. Agric. Eng. 2019, 35, 73–79. [Google Scholar]
  39. Gil, E.; Llorens, J.; Llop, J.; Fàbregas, X.; Gallart, M. Use of a Terrestrial LIDAR Sensor for Drift Detection in Vineyard Spraying. Sensors 2013, 13, 516–534. [Google Scholar] [CrossRef] [PubMed]
  40. Teske, M.E.; Bird, S.L.; Esterly, D.M.; Curbishley, T.B.; Ray, S.L.; Perry, S.G. AgDrift®: A model for estimating near-field spray drift from aerial applications. Environ. Toxicol. Chem. 2002, 21, 659–671. [Google Scholar] [PubMed]
  41. Yuan, S.; Arellano, A.F.; Knickrehm, L.; Chang, H.I.; Castro, C.L.; Furlong, M. Towards quanti-fying atmospheric dispersion of pesticide spray drift in Yuma County Arizona. Atmos. Environ. 2024, 319, 120262. [Google Scholar] [CrossRef] [PubMed]
  42. Pivato, A.; Barausse, A.; Zecchinato, F.; Palmeri, L.; Raga, R.; Lavagnolo, M.C.; Cossu, R. An integrated model-based approach to the risk assessment of pesticide drift from vineyards. Atmos. Environ. 2015, 111, 136–150. [Google Scholar] [CrossRef]
  43. El Afandi, G.; Ismael, H.; Fall, S. Application of OpenAir and AgDRIFT Models to Estimate Organophosphate Pesticide Spray Drift: A Case Study in Macon County, Alabama. Agriculture 2023, 13, 1763. [Google Scholar] [CrossRef]
  44. Wieben, C.M. Estimated Annual Agricultural Pesticide Use by Major Crop or Crop Group for States of the Conterminous United States, 1992–2019 (Including Preliminary Estimates for 2018–2019); U.S. Geological Survey Data Release; U.S. Geological Survey: Reston, VA, USA, 2021.
  45. Illinois Department Agriculture. 2023. Available online: https://agr.illinois.gov/pesticides/pesticides-uses-misuses.html#:~:text=If%20you%20believe%20your%20property,the%20damage%20was%20first%20noticed (accessed on 21 December 2023).
  46. Wan, N. Pesticides exposure modeling based on GIS and remote sensing land use data. Appl. Geogr. 2015, 56, 99–106. [Google Scholar] [CrossRef]
  47. Lerro, C.C.; Koutros, S.; Andreotti, G.; Friesen, M.C.; Alavanja, M.C.; Blair, A.; A Hoppin, J.; Sandler, D.P.; Lubin, J.H.; Ma, X.; et al. Organophosphate insecticide use and cancer incidence among spouses of pesticide applicators in the Agricultural Health Study. Occup. Environ. Med. 2015, 72, 736–744. [Google Scholar] [CrossRef]
  48. Wang, M.; Rautmann, D. A simple probabilistic estimation of spray drift—Factors determining spray drift and development of a model. Environ. Toxicol. Chem. 2008, 27, 2617–2626. [Google Scholar] [CrossRef] [PubMed]
  49. Larsen, K.; Black, P.; Rydz, E.; Nicol, A.-M.; Peters, C.E. Using geographic information systems to estimate potential pesticide exposure at the population level in Canada. Environ. Res. 2020, 191, 110100. [Google Scholar] [CrossRef] [PubMed]
  50. Ward, H.; Nuckols, R.; Weigel, J.; Maxwell, S.; Cantor, P.; Miller, S. Identifying populations potentially exposed to agricultural pesticides using remote sensing and a geographic information system. Environ. Health Perspect. 2000, 108, 5–12. [Google Scholar] [PubMed]
  51. Brody, J.; Vorhees, D.; Melly, J.; Swedis, R.; Drivas, P.; Rudel, R. Using GIS and historical records to reconstruct residential exposure to large-scale pesticide application. J. Expo. Anal. Environ. Epidemiol. 2002, 12, 64–80. [Google Scholar] [CrossRef] [PubMed]
  52. Brody, J.; Aschengrau, A.; McKelvey, W.; Rudel, R.; Swartz, C.; Kennedy, T. Breast cancer risk and historical exposure to pes-ticide from wide-area applications assessed with GIS. Environ. Health Perspect. 2004, 112, 889–897. [Google Scholar] [CrossRef] [PubMed]
  53. Maxwell, S.; Jaymie, R.; Pierre, G. Use of Land Surface Remotely Sensed Satellite and Airborne Data for Environmental Ex-posure Assessment in Cancer Research. J. Expo. Sci. Environ. Epidemiol. 2010, 20, 176. [Google Scholar] [CrossRef] [PubMed]
  54. Marusek, J.C.; Cockburn, M.G.; Mills, P.K.; Ritz, B.R. Control Selection and Pesticide Exposure Assessment Via GIS in Prostate Cancer Studies. Am. J. Prev. Med. 2006, 30, S109–S116. [Google Scholar] [CrossRef] [PubMed]
  55. Nuckols, J.R.; Gunier, R.B.; Riggs, P.; Miller, R.; Reynolds, P.; Ward, M.H. Linkage of the California Pesticide Use Reporting Database with Spatial Land Use Data for Exposure Assessment. Environ. Health Perspect. 2007, 115, 684–689. [Google Scholar] [CrossRef] [PubMed]
  56. Ward, M.H.; Lubin, J.; Giglierano, J.; Colt, J.S.; Wolter, C.; Bekiroglu, N.; Camann, D.; Hartge, P.; Nuckols, J.R. Proximity to Crops and Residential Exposure to Agricultural Herbicides in Iowa. Environ. Health Perspect. 2006, 114, 893–897. [Google Scholar] [CrossRef]
  57. Teysseire, R.; Manangama, G.; Baldi, I.; Carles, C.; Brochard, P.; Bedos, C.; Delva, F. Assessment of residential exposures to agricultural pesticides: A scoping review. PLoS ONE 2020, 15, e0232258. [Google Scholar] [CrossRef]
  58. Johnson, D.R. Spray Drift Task Force (SDTF)—Development of Data and Models for Determining Off-Target Drift of Agricultural Pesticides. In Data Generation for Regulatory Agencies: A Collaborative Approach; American Chemical Society: Washington, DC, USA, 2021; Volume 20036, pp. 17–26. [Google Scholar] [CrossRef]
  59. Nuyttens, D.; Taylor, W.A.; De Schampheleire, M.; Verboven, P.; Dekeyser, D. Influence of nozzle type and size on drift po-tential by means of different wind tunnel evaluation methods. Biosyst. Eng. 2009, 103, 271–280. [Google Scholar] [CrossRef]
  60. Ferguson, J.; Chechetto, G.; O’Donnell, C.; Door, G.; Moore, H.; Baker, G. Determining the drift potential of Venturi nozzles compared with standard nozzles across three insecticide spray solutions in a wind tunnel. Pest Manag. Sci. 2016, 72, 1460–1466. [Google Scholar] [CrossRef] [PubMed]
  61. Butts, T.R.; Fritz, B.K.; Kouame, K.B.-J.; Norsworthy, J.K.; Barber, L.T.; Ross, W.J.; Lorenz, G.M.; Thrash, B.C.; Bateman, N.R.; Adamczyk, J.J. Herbicide spray drift from ground and aerial applications: Implications for potential pollinator foraging sources. Sci. Rep. 2022, 12, 18017. [Google Scholar] [CrossRef] [PubMed]
  62. Kasner, E.J.; Prado, J.B.; Yost, M.G.; Fenske, R.A. Examining the role of wind in human illness due to pesticide drift in Washington state, 2000–2015. Environ. Health 2021, 20, 18017. [Google Scholar] [CrossRef] [PubMed]
  63. Dappen, P.; Merchant, J.; Ratcliffe, I.; Robbins, C. Delineation of 2005 Land Use Patterns for the State of Nebraska; Center for Advanced Land Management Information Technologies, School of Natural Resources, University of Nebraska-Lincoln: Lincoln, NE, USA, 2007; Available online: http://nlcs1.nlc.state.ne.us/epubs/n1500/b009-2007.pdf (accessed on 30 May 2023).
  64. Shelton, J.F.; Geraghty, E.M.; Tancredi, D.J.; Delwiche, L.D.; Schmidt, R.; Ritz, B.; Hansen, R.L.; Hertz-Picciotto, I. Neurodevelopmental Disorders and Prenatal Residential Proximity to Agricultural Pesticides: The CHARGE Study. Environ. Health Perspect. 2014, 122, 1103–1109. [Google Scholar] [CrossRef] [PubMed]
  65. Wang, A.; Costello, S.; Cockburn, M.; Zhang, X.; Bronstein, J.; Ritz, B. Parkinson’s disease risk from ambient exposure to pesticides. Eur. J. Epidemiol. 2011, 26, 547–555. [Google Scholar] [CrossRef] [PubMed]
  66. Gibbs, J.L.; Yost, M.G.; Negrete, M.; Fenske, R.A. Passive Sampling for Indoor and Outdoor Exposures to Chlorpyrifos, Azinphos-Methyl, and Oxygen Analogs in a Rural Agricultural Community. Environ. Health Perspect. 2017, 125, 333–341. [Google Scholar] [CrossRef]
  67. Zivan, O.; Segal-Rosenheimer, M.; Dubowski, Y. Airborne organophosphate pesticides drift in Mediterranean climate: The importance of secondary drift. Atmos. Environ. 2016, 127, 155–162. [Google Scholar] [CrossRef]
  68. Ann, M. Modeling Exposure to Pesticide Drift in Madison County, Illinois. Ph.D. Thesis, Southern Illinois University at Edwardsville, Ed-Wardsville, IL, USA, 2019; p. 76. [Google Scholar]
  69. Springfield-Sangamon County Regional Planning Commission, Sangamon County Multi-jurisdictional Natural Hazards Mit-igation Plan, July 2023. Available online: https://co.sangamon.il.us/departments/m-r/regional-planning-commission/natural-hazards-mitigation-plan (accessed on 21 January 2024).
  70. Copenhaver, K.; Hamada, Y.; Mueller, S.; Dunn, J.B. Examining the Characteristics of the Cropland Data Layer in the Context of Estimating Land Cover Change. ISPRS Int. J. Geo-Inf. 2021, 10, 281. [Google Scholar] [CrossRef]
  71. CropScape-Cropland Data Layer Project. National Agricultural Statistics Service (NASS)/USDA. Available online: https://nassgeodata.gmu.edu/CropScape/ (accessed on 1 February 2024).
  72. USGS. Pesticide National Synthesis Project (PNSP). Estimated Annual Agricultural Pesticide Use. 2019. Available online: https://water.usgs.gov/nawqa/pnsp/usage/maps/county-level/ (accessed on 18 May 2023).
  73. Karra, K.; Kontgis, C.; Statman-Weil, Z.; Mazzariello, J.C.; Mathis, M.; Brumby, S.P. Global land use/land cover with Sentinel-2 and deep learning. In Proceedings of the 2021 IEEE International Geoscience and Remote Sensing Symposium IGARSS, Brussels, Belgium, 11–16 July 2021. [Google Scholar]
  74. Stein, A.F.; Ngan, F.; Draxler, R.R.; Chai, T. Potential Use of Transport and Dispersion Model Ensembles for Forecasting Ap-plications. Weather Forecast 2015, 30, 639–655. [Google Scholar] [CrossRef]
  75. Stein, A.F.; Draxler, R.R.; Rolph, G.D.; Stunder, B.J.B.; Cohen, M.D.; Ngan, F. NOAA’s HYSPLIT Atmospheric Transport and Dispersion Modeling System. Bull. Am. Meteorol. Soc. 2015, 96, 2059–2077. [Google Scholar] [CrossRef]
  76. Pirouzmand, A.; Kowsar, Z.; Dehghani, P. Atmospheric dispersion assessment of radioactive materials during severe accident conditions for Bushehr nuclear power plant using HYSPLIT code. Prog. Nucl. Energy 2018, 108, 169–178. [Google Scholar] [CrossRef]
  77. Rolph, G.; Stein, A.; Stunder, B. Real-time Environmental Applications and Display System: READY. Environ. Model. Softw. 2017, 95, 210–228. [Google Scholar] [CrossRef]
  78. Kim, I.S.; Kim, Y.P.; Wee, D. Potential Source Density Function: A New Tool for Identifying Air Pollution Sources. Aerosol Air Qual. Res. 2022, 22, 210236. [Google Scholar] [CrossRef]
  79. Karion, A.; Lauvaux, T.; Coto, I.L.; Sweeney, C.; Mueller, K.; Gourdji, S.; Angevine, W.; Barkley, Z.; Deng, A.; Andrews, A.; et al. Intercomparison of atmospheric trace gas dispersion models: Barnett Shale case study. Atmos. Chem. Phys. 2019, 19, 2561–2576. [Google Scholar] [CrossRef] [PubMed]
  80. Cui, L.; Song, X.; Zhong, G. Comparative Analysis of Three Methods for HYSPLIT Atmospheric Trajectories Clustering. Atmosphere 2021, 12, 698. [Google Scholar] [CrossRef]
  81. Liu, N.; Yu, Y.; He, J.; Zhao, S. Integrated modeling of urban-scale pollutant transport: Application in a semi–arid urban valley, Northwestern China. Atmos. Pollut. Res. 2013, 4, 306–314. [Google Scholar] [CrossRef]
  82. Wang, Q.; Zhao, T.; Wang, R.; Zhang, L. Backward Trajectory and Multifractal Analysis of Air Pollution in Zhengzhou Region of China. Math. Probl. Eng. 2022, 2022, 2226565. [Google Scholar] [CrossRef]
  83. Schade, G.W.; Gregg, M.L. Testing HYSPLIT Plume Dispersion Model Performance Using Regional Hydrocarbon Monitoring Data during a Gas Well Blowout. Atmosphere 2022, 13, 486. [Google Scholar] [CrossRef]
  84. Ghosh, S.; Biswas, J.; Guttikunda, S.; Roychowdhury, S.; Nayak, M. An investigation of potential regional and local source regions affecting fine particulate matter concentrations in Delhi, India. J. Air Waste Manag. Assoc. 2015, 65, 218–231. [Google Scholar] [CrossRef]
  85. Teske, M.E.; Bird, S.L.; Esterly, D.M.; Ray, S.L.; Perry, S.G. A User’s Guide for AgDRIFT 1.0: A Tiered Approach for the Assessment of Spray Drift of Pesticides; Technical Note Number 95-10; Continuum Dynamics, Inc.: Princeton, NJ, USA, 1997. [Google Scholar]
  86. Bird, S.L.; Perry, S.G.; Ray, S.L.; Teske, M.E. Evaluation of the AgDISP aerial spray algorithms in the AgDRIFT model. Environ. Toxicol. Chem. 2002, 21, 672–681. [Google Scholar] [CrossRef] [PubMed]
  87. Sumon, K.A.; Rashid, H.; Peeters, E.T.; Bosma, R.H.; Brink, P.J.V.D. Environmental monitoring and risk assessment of organophosphate pesticides in aquatic ecosystems of north-west Bangladesh. Chemosphere 2018, 206, 92–100. [Google Scholar] [CrossRef] [PubMed]
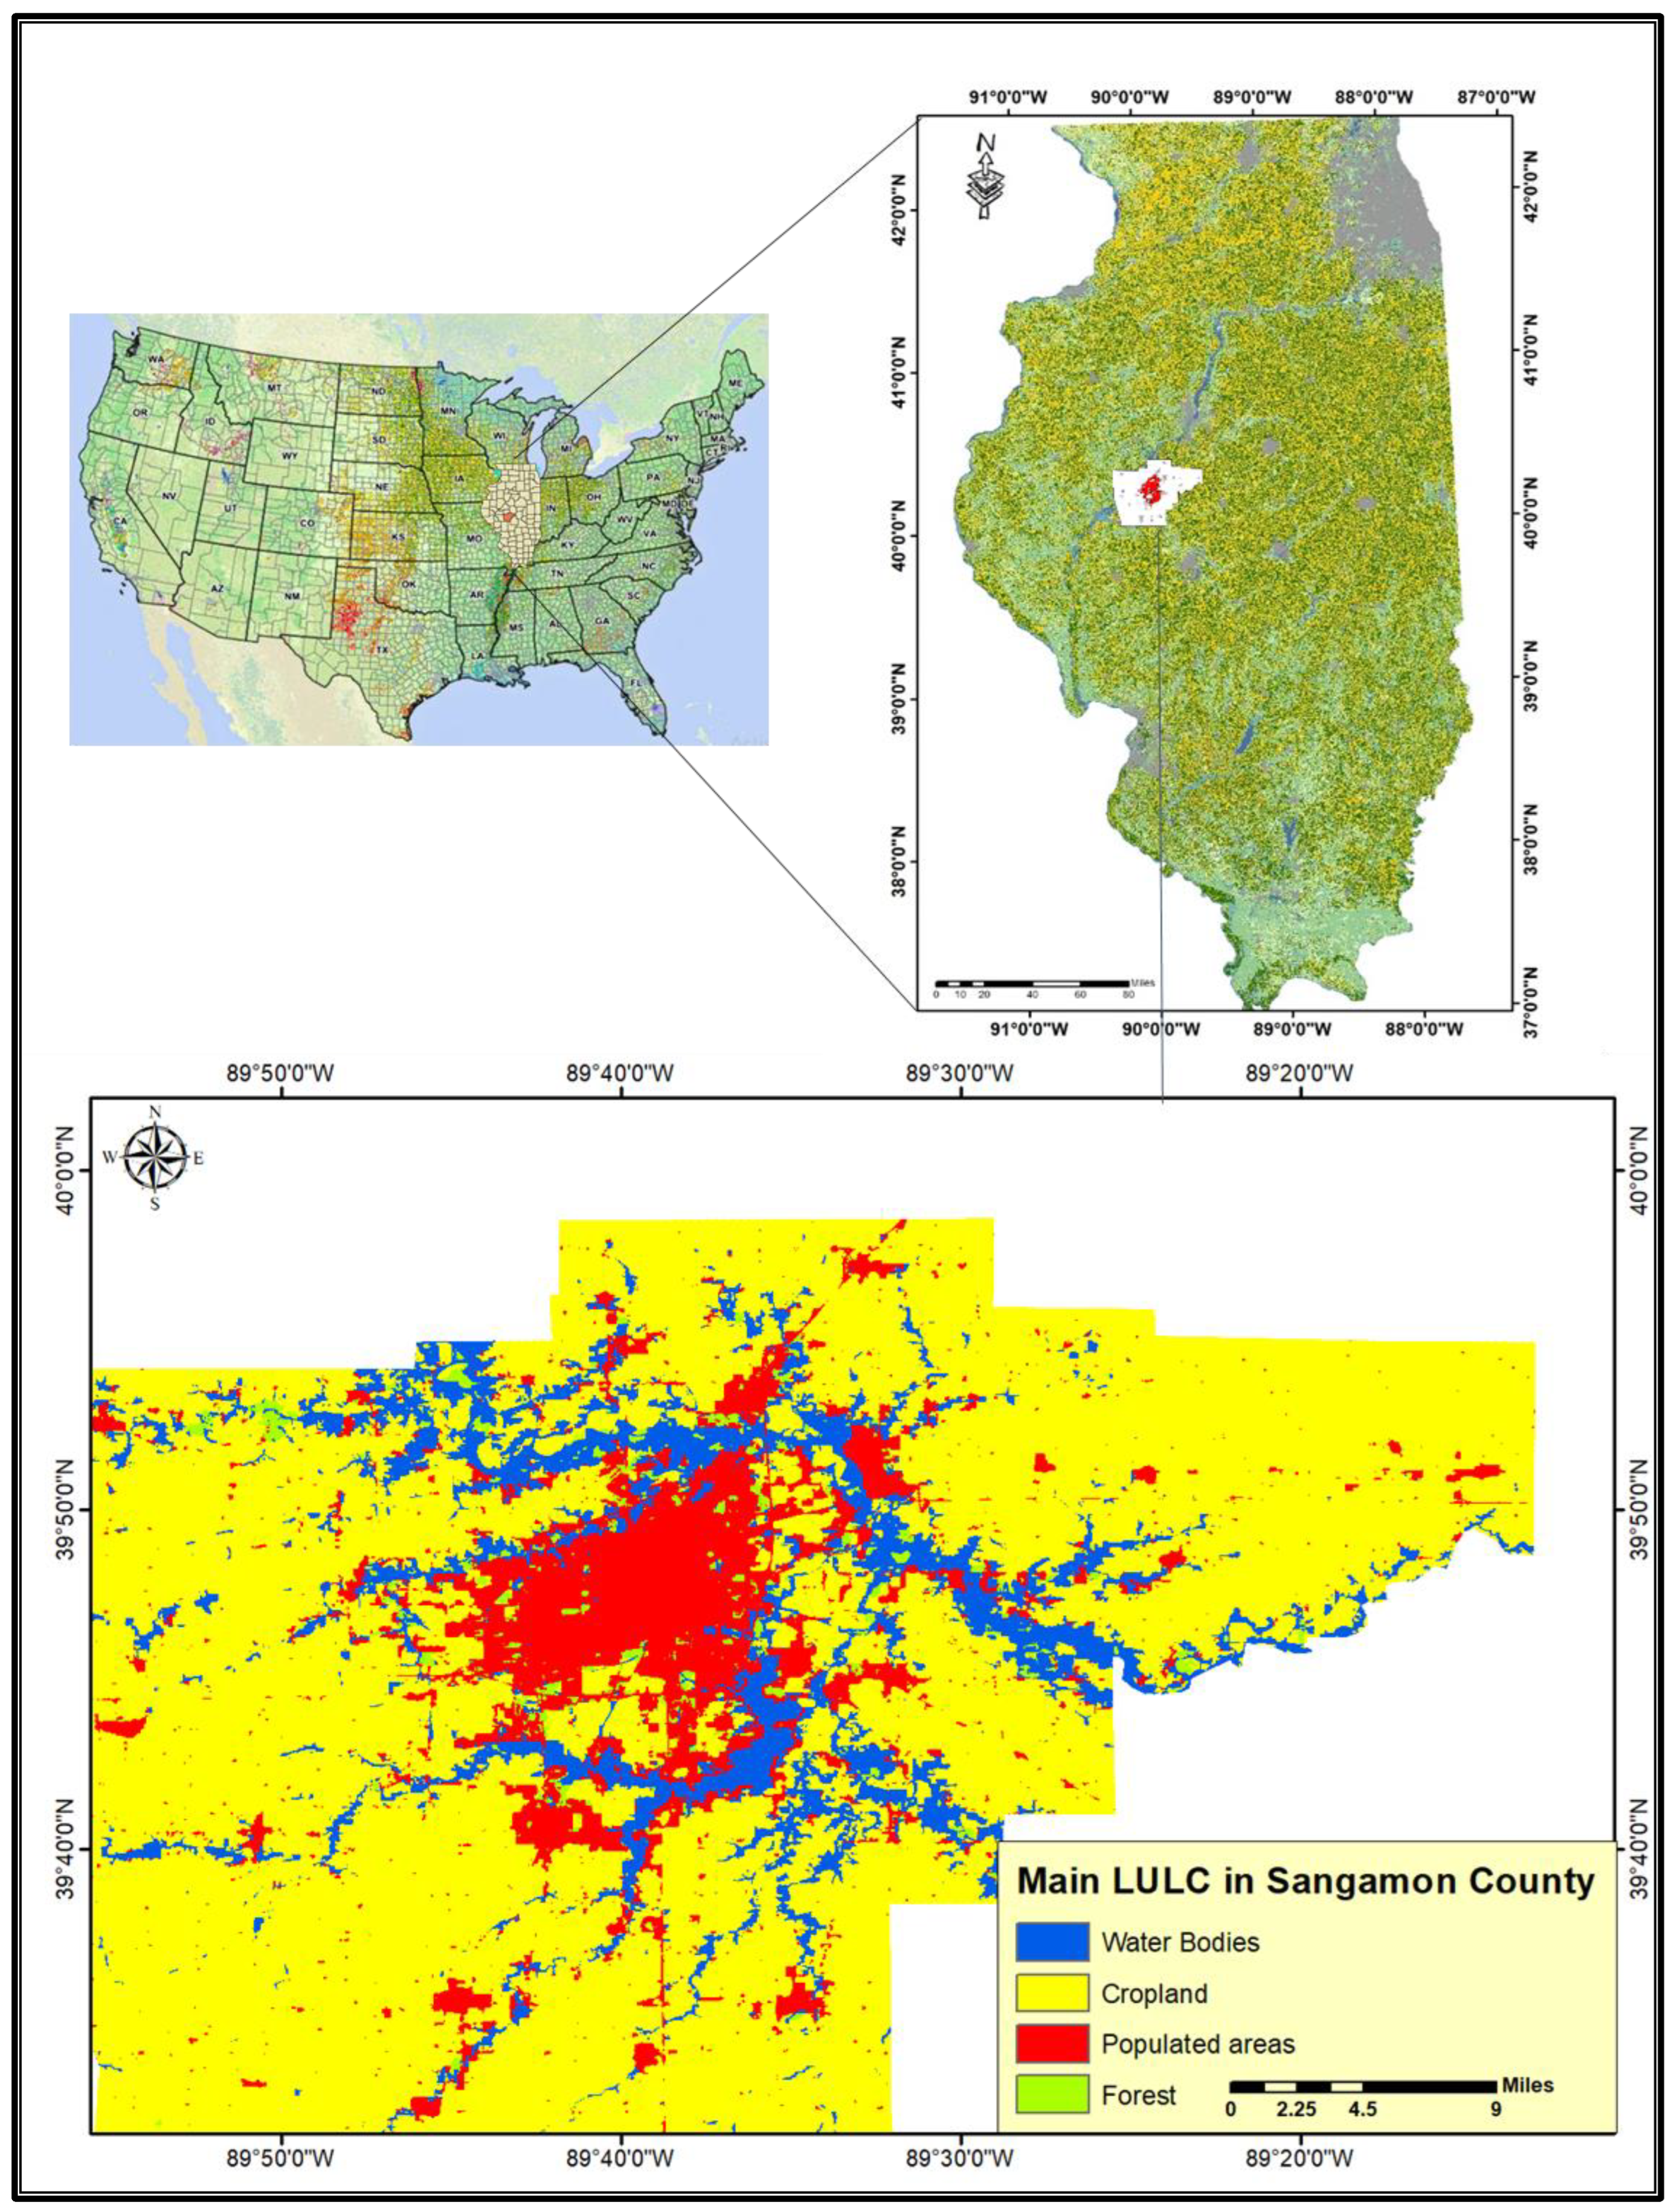
Figure 1. The location and main LULC units of Sangamon County, Illinois.
Sustainability 16 02908 g001
Figure 2. The crop data for Sangamon County, Illinois.
Sustainability 16 02908 g002
Figure 3. ASAE reference threshold curves for drop diameters in micrometers (μm) are based on the nozzle categorization scheme developed in ASAE S-572.
Sustainability 16 02908 g003
Figure 4. Deposition graphed for each of the five ASAE S-572 threshold categories according to distance.
Sustainability 16 02908 g004
Figure 5. Air mass cluster trajectory as it arrives at Springfield in July 2019.
Sustainability 16 02908 g005
Figure 6. PSCF maps of Springfield in July 2019.
Sustainability 16 02908 g006
Figure 7. Backward dispersion analysis of Sangamon County from April to August 2019.
Sustainability 16 02908 g007
Figure 8. Approximate drift zone for a 100-acre square field, considering a drift range of 350 m (B) for an aerial application and 250 m (A) for a ground-boom application.
Sustainability 16 02908 g008
Figure 9. Simulation of drift related to the application of organophosphate pesticides on four particular crop fields in Sangamon County, Illinois.
Sustainability 16 02908 g009
Figure 10. Average of the organophosphate pesticides drift categories in Sangamon County, based on AgDRIFT model results.
Sustainability 16 02908 g010
Figure 11. Expansion of residential areas and schools in Sangamon County near treated crops increases the potential for pesticides to drift beyond their intended targets.
Sustainability 16 02908 g011
Table 1. Organophosphate pesticide usage in Sangamon County compared with the state of Illinois, 2020.
Components and DescriptionIllinoisSangamon%
Administration region’s area calculated in acres (ATLAS_ACRE)35,529.820555,7131.66
Harvested cropland in acres (ACRES_HC)22,701.380451,8361.90
Harvested crops in square miles (SQ_MI_HC)3504.72075.2892.15
Aggregate weight in kilograms (kg) of the EPest-high estimations for each of the eight organophosphates (AGG_HI_KG)2220.99350.5312.4
Total weight in pounds (lbs) of all eight organophosphate pesticides based on EPest-high estimations (HI_LB_AGG)491.61612.1932.5
EPest-high estimations of organophosphate pesticide usage throughout harvested crops (HI_LOG_RAT)757.537120.9401.5
EPest-high estimations of organophosphate concentration in pounds per square mile1085.90016.1951.47
Source: USGS, 2021 [45,73].
Table 2. Organophosphate pesticide usage in Sangamon County, 2020.
Organophosphate PesticideUse in Kilograms
Bensulid27.80
Chloreth91.50
Chlorpyr335.6
Dimethoa62.00
Malathion197.70
Phosmet21.80
Terbufos1790.80
Tribufos27.50
Total2553
Source: USGS, 2021 [45,73].
Table 3. The main LULC units in Sangamon County, 2021.
Main LULC UnitArea km2%
Cropland17.39676.72
Populated areas2.58211.38
Water bodies2.34010.32
Forest3581.58
Total22,677100
Source: [74].
Table 4. Factors affecting organophosphate pesticide releasing at field level in Sangamon County.
Pesticide CharacteristicsStandard Quantities
Initiate time of the simulation12:00–14:00
Average time spent120 min
Average area of application148,320 m2
The average amount of pesticides released6 kg
Average quantity of the chemical ingredient employed0.4 kg
Average application heights10–20 feet
Active substanceMalathion
Particle’s mean diameter50 μm
Half-life in ground17 days
Half-life (utilizing O3 and OH)14 h to 9 days
Hourly simulation-based mean emission rate (EMAH)0.029/h and 23.9 h
Diffusivity (malathion)0.0569 cm2/s
Solubility (malathion)145 mg/L at 20 °C
Pressure of vapor (malathion)1.77 × 4–10 mm/Hg at 26 °C
Constant of Henry’s law (malathion)2.0 (±1.2) × 10–7
Table 5. ASAE reference threshold curves for drop diameters in micrometers (μm) considering four scenarios.
ParameterVery Fine to FineFine to MediumMedium to CoarseCoarse to Very Coarse
Swath Displacement/Swath0.65060.37220.28510.2191
D v0.162 μm114 μm157 μm209 μm
VMD (Dv0.5)137 μm255 μm341 μm439 μm
D v0.9237 μm444 μm560 μm786 μm
Fraction < 141 μm0.520.160.080.05
Source: [86,87].
Table 6. Drift length estimation for both aerial and ground boom applications considering four scenarios.
The CropsHigh Sprayer Boom/Fine Droplet 137 μmLow Sprayer Boom/Fine Droplet 255 μmHigh Sprayer Boom/Coarse Droplet 341 μmLow Sprayer Boom/Coarse Droplet
439 μm
Drift range estimation for ground boom application
Soybean35020010050
Corn35020010075
Drift range estimation for aerial application
Soybean750600500250
Corn800600500250
Source: [32,43,87].
Table 7. Average of the potential drifting in eight directions in the specific case studies.
Highly Valuable ResourcesAcresThe Average of the Potential Spray Drift for All Possible Directions in the Curran FieldAverage Drift
ENENSESSWWNW
Residences114.50.000.000.000.002.205.303.500.001.38
Rivers, lakes, and streams1.3000.000.000.000.002.205.302.850.001.40
Auburn field
Residences266.600.000.000.002.402.700.005.350.001.25
Rivers, lakes, and streams1.8000.000.000.002.202.700.004.900.001.32
Mechanicsburg field
Residences123.000.000.000.001.903.004.400.000.001.30
Rivers, lakes, and streams960.000.000.000.001.903.003.900.000.001.28
Williamsville field
Residences1500.000.000.004.404.904.700.000.001.75
Rivers, lakes, and streams20500.000.000.004.104.804.700.000.001.78
Table 8. The downwind drift range parameters for both aerial and ground-boom applications.
Ground-Boom ApplicationDownwind Drift Range Parameters (m)Drift Rate Scenario
255075100
Swath-width m/number12/312/512/712/9Drifting of medium droplets
Downwind drift4.43.21.10.6
Drift rate (%)19107.64.2
Drift area (km2)0.180.080.040.014
Aerial ApplicationDownwind Drift Range Parameters (m)Drift Rate Scenario
50100150300
Swath-width m/number12/412/812/1212/16Drifting of medium droplets
Downwind drift7.46.04.31.6
Drift rate (%)40.536.226.520.4
Drift area (km2)0.480.450.350.25
Source: [40,50,58].
Table 9. Potential pesticide drift instances connected with ground-boom and aerial application in four fields across Sangamon County.
Curran Field
The CropsApplication TechniqueTreated Field
(ha)
Dominant Wind DirectionPesticide
Rate
(kg/ha)
Drift Fraction
Fd
Deposition Ratio (ha)Swath Range (m)Drift
Weight (kg)
Average Differing (%)
SoybeanGround-boom42.0NE2.300.2223.501–81.24.50
Aerial47.0W/NW2.600.3505.201–202.68.30
CornGround30.0NW2.300.2223.821–80.84.20
Aerial42.0E/NW2.600.3505.401–202.67.60
Auburn field
SoybeanGround36.50SE2.300.2223.611–80.95.50
Aerial46.60S/SW2.600.3504.801–202.58.20
CornGround36.50SE2.300.2222.821–80.94.50
Aerial46.60S/SW2.600.3505.601–202.57.90
Mechanicsburg field
SoybeanGround26.8NE2.300.2223.611–80.75.90
Aerial34.2N2.600.3504.801–202.29.50
CornGround26.8NE2.300.2222.821–80.76.90
Aerial36.5N2.600.3505.601–202.29.50
Williamsville field
SoybeanGround24.6SE2.300.2223.611–80.94.50
Aerial38.6SW2.600.3504.801–202.48.50
CornGround24.6SE2.300.2222.821–80.94.50
Aerial38.6SW2.600.3505.601–202.48.50
Source: [32,40,43,50,58].
Disclaimer/Publisher’s Note: The statements, opinions and data contained in all publications are solely those of the individual author(s) and contributor(s) and not of MDPI and/or the editor(s). MDPI and/or the editor(s) disclaim responsibility for any injury to people or property resulting from any ideas, methods, instructions or products referred to in the content.