Abstract
The United Nations Sustainable Development Goals (UN SDGs) were introduced in 2015 to advance the 2030 Agenda of sustainable development in all supporting countries. The SDGs are applicable to countries, non-governmental organizations, industries, and companies. In this article, we focus on the contribution of listed companies headquartered in the European Union (EU) to the SDGs. The EU intends to be the front-runner in the race for sustainable development and has adopted comprehensive strategies that mirror the UN SDGs. For this reason, we collected relevant data points from the Refinitiv Eikon database for 1156 companies headquartered in EU countries for the financial year 2022. The data collected refer to contributions to each SDG and the adoption of corporate sustainability policies. Data were statistically analyzed per country and sector to generate a comprehensive image of industry contributions to the SDGs in the EU. By applying a comparative analysis of country-level achievements and policies, the results point to four EU countries that are significant contributors to the SDGs through their economic activities. At the same time, other EU countries are still facing significant challenges in this domain. The socioeconomic considerations for these cases are laid out in the Discussion section. The present article offers a snapshot of corporate contributions to the SDGs as climate and geopolitical challenges become more prominent.
1. Introduction
The 2030 Agenda for Sustainable Development was adopted by the United Nations (UN) in late September 2015 and became effective in January 2016 [1]. However, the Sustainable Development Goals (SDGs) had been proposed in 2012. The adoption year represents a milestone as 13% of policies issued by 71 countries as of 2016 were linked to the SDGs. By 2021, the percentage increased to 52% in 84 countries [2]. The commitment to the 2030 Agenda was undertaken by 193 UN member countries dedicated to transforming and addressing global challenges for a more sustainable and equitable future [2,3]. The 2030 Agenda encompasses 17 SDGs and 169 specific targets providing guidance across environmental, social, and governance (ESG) dimensions for nations seeking a more sustainable development.
The SDGs represent a universal call to action, recognizing five concepts referred to as the 5Ps: people, planet, prosperity, peace, and partnerships [4]. This call requires collective efforts to eradicate poverty and hunger, promote prosperity for all, ensure good health and well-being, provide quality education, achieve gender equality, and protect the planet through climate action. The SDGs were created as a result of negotiations between stakeholders and governmental entities [5], and there may be overlaps or potential contradictions between some of the targets associated with the SDGs. However, mappings between the SDGs and economic, social and environmental (ESG) factors demonstrate the relevance and urgency of the SDGs [6]. Organizations are important actors in the implementation of sustainable business practices to create value for investors, but also stakeholders, with the aim of limiting the effects of climate change and facilitating the transition to a greener economy [7].
The European Union (EU) has sought the position of the frontrunner in the sustainability race. The European Commission and the European Parliament adopted a series of strategies in several domains of sustainable development. Some of these strategies include the European Green Deal [8,9], aiming to make the EU climate-neutral by 2050 through policies across industries that support the Farm to Fork strategy [10]; the Circular Economy Action Plan [11,12] that focuses on promoting sustainable practices in waste management; and the Biodiversity Strategy for 2030 [13], outlining actions to protect nature and restore biodiversity. These strategies are closely coordinated with the corresponding SDGs and are significant for various industries.
The most recent literature (2021–2023) comprises various topics such as sustainability during the COVID-19 pandemic and how this affected the pursuit of the SDGs [14,15]; the analysis of a limited number of SDGs in and outside the European Union [16,17]; and the sustainability-related impacts of specific industries [18]. Our article responds to the call [19] for research to clarify the responsibilities of large multinationals in the domain of energy transition, decarbonization, and environmental protection, as well as in the social realm, in areas such as gender equality and education. We have identified a research gap in the specificity of SDG adoption in each industrial sector in relation to country-specific conditions. This research gap represents a challenge, prompting us to explore the dynamics and corporate behaviors associated with SDG adoption.
While there is a growing recognition of the importance of achieving the SDGs [20,21], a more granular analysis is required to discern the specific factors that influence the successful implementation of sustainable practices. Sector-specific research facilitates the understanding of different development strategies and policies linked to the characteristics of each industry, taking into consideration factors such as available resources and the complexity of the industry in connection to the regulatory frameworks at the national level.
The present research analyzes the applicability of the SDGs and sustainability policies among companies headquartered in each EU member country. The article uses a dual framework that encompasses both country- and industry-based perspectives. The investigation aims to determine to what extent the SDGs align with the various socioeconomic contexts within the EU states. The paper provides insights into national and sectoral dynamics, observing the challenges and opportunities associated with the integration of SDGs and sustainability policies. This granularity allows for the analysis of the different roles of industries in supporting sustainable development. By identifying the countries that significantly contribute to the SDGs, we envisage a wider dissemination of knowledge and an adaptation of effective business models, leading to progress among all nations. The present article enriches academic understanding of SDG implementation by providing an analysis of the national and industry contexts within the European Union.
The structure of the present article is as follows. The literature review is divided between studies approaching SDG implementation at the country level and those focusing on implementation at the industry level, also identifying general research questions. The Materials and Methods section presents the process of collecting data from the Refinitiv Eikon database representative of the 2022 financial year for 1156 companies. The binary data collected represent the status of adherence of EU companies to each of the 17 SDGs, as well as 24 sustainability policies. The analytical questions are discussed in the Results section of the article. Furthermore, in the Discussion section, we adopt a comparative perspective and highlight the best practices of the top countries contributing to the SDGs, versus the situation of the least-contributing countries. The final section identifies the limitations of the research and proposes avenues for future investigation.
2. Literature Review and Research Questions
2.1. SDGs at the Country Level
The UN’s 2030 Agenda serves as a common language for all the participating nations and presents a roadmap for companies and non-governmental organizations [22]. To monitor the progress on sustainability aspects, the UN Department of Economic and Social Affairs (UNDESA) proposed sustainable development (SD) indicators based on the 17 SDGs [23]: no poverty; zero hunger; good health and well-being; quality education; gender equality; clean water and sanitation; affordable and clean energy; decent work and economic growth; industry, innovation, and infrastructure; reduced inequalities; sustainable cities and communities; responsible consumption and production; climate action; life underwater and life on land; peace, justice, and strong institutions; and partnership for the goals.
Most countries have already begun the implementation of the SDGs and are monitored through an SDG progress index grouped by regional dimension [24]. In this regard, social inclusion represents a global challenge. Based on this premise, social inclusion extends beyond interpersonal relations, having implications at the macro level in the form of decreased poverty and positive ecological impacts. As observed by Mosse [25], adversities in the field of sustainable development are not isolated events but rather outcomes of strategic decisions. Within the framework of the SDGs, addressing these challenges is critical for sustainable and inclusive development. Poverty, insufficient education, and ecological concerns underscore the pressing need to adjust corporate strategies to achieve the SDGs.
Initial reviews showed slow progress at the national level in setting targets and evaluating policies as there was limited experience of national governments in this domain [26]. The positive impact lies in the integration of the SDGs into national policies that align with one of the 169 specified targets [27]. The previous literature [28] revealed that of the 169 targets, 49 targets (29%) were well-developed, 91 targets (54%) could benefit from increased specificity, and 29 targets (17%) required substantial improvement. The main weaknesses included the inadequate alignment of targets and goals with existing international agreements and political processes, ineffective implementation, and potential conflicts between goals and targets.
In Europe, North America, and Asia, the SDG scores trended toward high and extremely high levels [6]. Before the implementation of the 2030 Agenda, in 2017, the European Commission created a reference framework to monitor the applicability of the SDGs in the European context. The SDG indicator set was created in alignment with the UN’s list of global sustainability indicators [23]. Based on the SDG index [24], Finland, Sweden, Denmark, Germany, Austria, France, Norway, Czechia, Poland, and Estonia are the ten most developed countries. Due to the danger posed by climate change [29], Finland set ambitious climate targets, with significant progress [30]. Sweden has a rich history of sustainable development, such as being the frontrunner of Agenda 21 [31], and acted as a role model for the Arctic countries, including Norway, in order to reach the UN goals by 2030 together [32]. Czechia also has a vast knowledge of sustainable development, being a model for other Central and Eastern European countries in achieving the SDGs [33].
Previous results point to the fact that the level of SDG implementation varies widely: higher sustainability is observed in the Nordic and Baltic states, the Netherlands, and Austria, and lower goal achievement is present in southern and eastern countries, especially Romania, Bulgaria, and Greece [34,35]. Researchers have completed country-level sustainability assessments for Romania [36], the Czech Republic, Hungary, Poland, Slovakia, and other countries within the European Union [37,38]. The Czech Republic, Hungary, Poland, and Slovakia, referred to as the V4 (Visegrád Group) countries, have implemented sustainable development strategies and are significantly improving their domestic environmental policies—for example, the Strategy for Responsible Development was implemented by Poland as a response to the 2030 Agenda [39]. For Central and Eastern Europe, an aggregate sustainability index was created as a comparison tool, using multiple methods and various indexes that measure sustainability performance in several areas [40].
2.2. SDGs at the Company Level
Sustainability reporting involves the public disclosure of companies’ economic, environmental, and social impacts, along with their adherence to the SDGs and related policies [41]. The Non-financial Reporting Directive (2014/95/EU) [42] required the preparation of non-financial statements in conjunction with the annual reports of EU companies. The non-financial statements must present companies’ policies on environmental and social impacts, alongside information on the respect for human rights, diversity on the company’s board, anti-corruption, and bribery prevention. The updated Corporate Sustainability Reporting Directive (2022/2464) [43] extended the scope of existing legislation and made reference to the UN SDGs. The newer directive introduces stronger disclosure requirements, with quantitative indicators on progress towards sustainability targets and clear policies on environmental, social, and governance (ESG) aspects. On the other hand, companies are aware that the reporting of sustainability policies, programs, and projects can generate negative feedback from the community due to increased transparency and comparability [44]. For this reason, sustainability reporting is often accused of greenwashing [45] or pinkwashing [46].
Companies that contribute to the SDGs consider that this process is supported by good governance practices such as the presence of independent directors and experts in non-financial reporting [47]. Organizations align with SDG targets that are directly related to their activities in the value chain and tend to focus on those that minimize negative impacts [48,49]. For greater coverage of the SDGs, it is important that researchers observe them beyond the industry-specific objectives [50]. The potential of sustainable supply chain management (SSCM) to contribute to the adoption of the SDGs is realized through optimized processes, the reduction of environmental impacts, the lowering of operational costs, and the promotion of responsible consumption and production.
Previous research on factors that influence non-financial disclosure refers to voluntary disclosure theory, legitimacy theory, and stakeholder theory to elucidate the voluntary non-financial reporting behavior of companies [51]. SDG indicators were identified to monitor existing policies and forecast trends until 2030 based on a data set available for the period 2007–2018 [52]. For the period 2015–2018, the SDG disclosure increased to 58% in Europe for a population of 1732 companies. A sample of 652 enterprises provided information on the SDGs, with a great proportion represented by France and the United Kingdom (UK) [53]. The UK was excluded in the present research as it has not been part of the European Union since 2020. The goals most often prioritized were SDGs 3, 8, 9, 12, and 13 [53]. At the European level, there is no country on track to achieve all the targets and SDGs related to well-being and health, but achieving half of the proposed targets within the 2030 Agenda is feasible if the current level of engagement is maintained [52].
2.3. SDGs at the Industry Level
In 2018, it was difficult for companies to identify the SDGs to which they contributed directly and indirectly. Most companies in the utilities (58%), automotive (58%), retail (57%), and technology (56%) sectors were more likely to report on the SDGs, with the healthcare industry (47%) in the top five contributing industries. In contrast, the financial services (37%), industrials (30%), and oil and gas (28%) industries were less likely to report on the SDGs [54]. The significance of SDG reporting in environmentally sensitive industries (e.g., oil and gas, heavy metals, paper, chemicals, and utilities) has become more pronounced as these industries face increased stakeholder and social pressure and might use SDG reporting as a strategy to repair their reputation [55].
Regarding the metals and mining industry, the most pursued goals are SDGs 3, 8, and 12, which are directly linked to the activities of the companies [56]. As an energy-intensive sector, it is important to understand how companies in this industry reduce costs and increase energy efficiency. In addition to the 2030 Agenda, companies in this sector should consider that the global steel demand will increase by 2050, together with greenhouse gas (GHG) emissions [57]. The researchers found that only 26% of companies in the steel industry based in China made the connection between the company’s activity and SDG compliance [56].
Another important actor is the automotive industry, which can easily reach certain goals but at the same time is responsible for severe environmental issues such as air pollution and greenhouse gas emissions, mainly downstream in the value chain [58]. Automotive manufacturers face increasing challenges as the European Parliament approved a strategy to phase out combustion engines in new passenger vehicles starting in 2035 [59]. This approach demands technological advancement in battery production for electric vehicles to make them competitive in the market.
The construction industry is of great importance for the achievement of the SDGs in the EU [60] because it generates large amounts of greenhouse gas emissions from the processing of raw materials [61]. Regarding the construction industry, specific policies have been developed to promote sustainable business models in this sector, namely the European Commission’s Construction Products Regulation (CPR) [62]. As indicated in the literature, the construction sector can contribute to SDGs 6, 8, 9, 11, and 12 [60]. The procurement process for non-renewable resources during construction projects has an impact on the achievement of the SDGs, especially SDG 12 [63,64].
SDGs 1, 2, 5, 8, 13, and 15 are extremely relevant to the food industry, especially “eradicating poverty” and “zero hunger” [65,66]. Researchers have observed that, for the social dimension, there is high employment for women in the agricultural industry, especially in regions with low food security. On the contrary, in regions that have sufficient food security, women can work outside the agriculture industry and increase their income. On the other hand, in terms of sustainability, food security does not pose a threat to biodiversity [65]. Together with the food industry, the agriculture sector aims to satisfy the demand for food in a sustainable way, to enhance resource allocation and promote equal access [67]. Sustainable agriculture constructs the base for SDGs 3 and 13 [68] but also for the most relevant SDGs identified by the Food and Agriculture Organization of the UN (FAO): SDGs 2, 6, 8, 12, 14, and 15 [67].
The financial sector has focused on SDG 3 through partnerships with companies in the healthcare industry; SDG 7 through investments related to environmental challenges; SDG 8 through creating space for career and skill development; SDG 9 through the digitalization of internal processes and the development of sustainable services; and SDG 13 by supporting climate research and clients willing to change their business models towards sustainable and eco-friendly activities [69].
As the previous literature has not focused sufficiently on the overall adoption of the SDGs in specific industries, we propose the following research questions, which will be operationalized in more detail:
Q1. How many companies headquartered in the EU apply each SDG and related sustainability policies?
Q2. How many companies in each EU country follow the SDGs and implement sustainability policies?
Q3. Which SDGs and corporate sustainability policies are applied in each industry and EU country?
Q4. What is the relationship between the SDGs and the corresponding policies as applied by the sample companies?
3. Materials and Methods
The research sample for the study comprises publicly traded companies in the 27 European member states. The member states are characterized by the geographic scope and diversity inherent in the European Union, which ensures a comprehensive representation of various economic, cultural, and regulatory environments [70]. The data set was compiled from the Refinitiv Eikon database, which is part of the London Stock Exchange Group (LSEG). Refinitiv is known for its detailed ESG data set, which contains over 450 metrics with a high level of granularity on various dimensions of sustainability [71]. This includes coverage of dimensions such as environmental strategies, resource use efficiency, pollution abatement, waste reduction, environmental innovation, human rights, and product responsibility, among others. Data availability over more than a decade facilitates longitudinal studies and has become an important tool for researchers [71,72,73]. Refinitiv applies a transparent methodology to collect and verify ESG metrics, with frequent updates that ensure access to the latest and most relevant information. Furthermore, the data set is suitable for conducting cross-country and cross-industry comparative analyses.
The collected data set is cross-sectional for the 2022 financial year, which is the most recent period for analysis at the time of download (end of November 2023). This creates a very recent background for our research. The database comprises 7015 companies, as observed in Table 1, allowing a better understanding of trends and patterns within the European Union business landscape. The results presented in Table 1 are an overview of the availability of data on listed companies in European countries. The sample data complement the series of research papers investigating the role of European companies in advancing SDG adherence within the EU [74,75]. Our study analyzes companies operating within the EU, which, as members of the UN, play an important role in global sustainability efforts. Through our analysis, we provide an enhanced perspective on the contributions made by EU-based companies towards the 2030 Agenda. The focus of data collection was to identify and analyze Boolean data (TRUE or FALSE) representing the adherence or nonadherence of each company to the 17 Sustainable Development Goals (SDGs), as well as information on 24 distinct policies conceptually related to the SDGs.

Table 1.
The number and proportion of sample companies with data available in the Refinitiv database, as of November 2023.
During data collection, we implemented a screening process to safeguard the integrity of data and the validity of our research. Two types of data that were considered not valid for further analysis were: (a) 761 companies lacking industry classification, as this information was absent from the Refinitiv Eikon database, resulting in a sample of 6254 valid records; and (b) “missing” information, i.e., data that were not collected by Refinitiv analysts at the end of November 2023—the timestamp for exporting data for our research.
Consequently, a final sample of 1156 listed companies with valid data was further analyzed. Valid data incorporate companies for which the Boolean data were collected from Refinitiv, fulfilling our objective of comprehensive data collection, including industry classification, total assets of the companies, and data collected for all 17 SDGs and 24 policies relevant to the SDGs. This approach was essential to enhance the reliability and precision of our findings by eliminating potential sources of bias and ensuring that the analyzed data set was representative of companies with available financial and sustainability information.
Additional data collected for analysis incorporate fundamental information such as the names of the companies and their TRBC (Thomson Reuters Business Classification) industry classifications, which were subsequently correlated with NACE [76] industry codes (rev. 2.0) to streamline and enhance the categorization process. This approach aims to create a more compact and coherent framework for analysis. Additionally, the data set includes the total assets reported by the companies, providing the financial context. This set of variables facilitates a detailed exploration of their commitment to sustainability through the lens of both specific SDGs and policies [77,78].
To address research questions Q1–Q4, data transformations and statistical procedures were applied in SPSS. Specifically, we transformed the data downloaded as “TRUE” or “FALSE” into 1 and 0 values to perform different calculations. We created another variable that computes the number of SDGs applied per company and a check variable to mark which company applies at least one SDG. This is also a Boolean value where 1 means the company applies at least one SDG and 0 means the company does not apply any SDG. Subsequently, we created a correspondence table between the SDGs and sustainability policies. To answer the research objectives, we used frequencies and correlations. Frequencies were calculated to observe policy and SDG adherence. Furthermore, descriptive statistics were generated in relation to minimum and maximum values, as well as mean and median values, to provide insights into the applied SDGs and policies. The calculations were carried out considering industry- and country-specific contexts, facilitating the comparative analysis to better understand corporate policies and sustainability goals.
Relevant corporate policies, along with their descriptions, were extracted from the Refinitiv Eikon database. The mapping between the 24 distinct policies and the 17 SDGs is presented in Table A1 (Appendix A). The identification of policies from the Refinitiv database was carried out in response to the research question, based on the assumption that companies are pursuing a specific SDG or the corresponding policy. During the mapping process, key terms and formulations in the policy description were identified and used to create the “word search” column in Table A1. This column served as a tool to identify specific words and concepts within the context of specific targets pertaining to each SDG, thereby establishing an effective mapping process. As a result, the cross-check of policies with the SDGs is based on the identifiers of specific targets. For example, the policies linked to SDG 3 are summarized as p_SDG3 and can be any of the following: p_PER (product environmental responsible use), p_WEF (policy water efficiency), p_EHS (employee health safety policy), and p_SHS (supply chain health and safety).
The mapping approach was introduced to analyze the correlations between the adherence to the SDGs and the policy implementation of the sample companies. This multifaceted data set is a representative instrument of analysis of the intersection between sustainable practices and company self-regulation within the complex setting of the EU economic environment.
To enhance data visualization and pursue a comparative analysis, we created two types of figures. The first type represents the geographical map of the number of companies that apply at least one SDG and one sustainability policy, respectively. The geographical maps were created using the R software environment (version 4.3.2). Specifically, we used the ggplot2 library (version 3.5.0) in conjunction with the Natural Earth database [79]. For the second type of figure, we present heatmaps for the number of companies in each country that apply each SDG and each sustainability policy, respectively. In this regard, we constructed tables in Excel, as presented in the figures, and used the tool named “Conditional Formatting”, keeping the main settings for the “Green-Yellow-Red color scale”.
4. Results
4.1. Statistical Results on the Application of Each SDG and Sustainability Policy by EU Companies
The present section explores research question Q1 in multiple facets. We start by answering the following detailed questions on the application of SDGs:
- Q1a. How many companies in the EU apply each SDG?
- Q1b. What is the proportion of companies in the EU (in total) that apply each SDG?
In Table 2, we observe that the level of application of the SDGs varies between different goals, with SDGs 3, 7, 8, 12, and 13 having the highest application percentages ranging from 50.3% to 68.3%, with SDG 8 regarding decent work and economic growth at the top of the list. These are the dimensions that are incorporated into most of the companies’ operations. The percentages indicate a strong commitment of the companies in our sample to health and safety at work, clean energy, responsible consumption, and climate action. At the opposite pole, SDGs 1, 2, and 14 have the lowest number of companies pursuing these goals, meaning 13.7%, 11.0%, and 14.4%, respectively, of the 1156 companies. The results for SDGs 1 and 2 are similar as there are few companies that pursue these goals. This is because the specific targets allocated to SDG 2—meaning T2.1., T2.2., and T2.3 (related to access to food and nutritional needs for poor and vulnerable people, and the agricultural productivity of small-scale producers)—are interlinked with T1.1., T1.2. and T1.3 (related to reducing poverty, especially for vulnerable people, through social protection systems) [80].
Table 2.
The number and proportion of sample companies applying each SDG.
The data in Table 2 highlight the most pursued SDGs [81]. Our article builds on previous results to highlight the various ways EU companies engage with each of the SDGs. Unlike previous studies that evaluated national performance [82], our analysis represents a more granular approach, identifying specific areas of underperformance within countries and empowering policymakers to incentivize the adoption of relevant and effective policies. Furthermore, our study represents an overview of all 17 SDGs, rather than being restricted to industry-specific goals, as observed in earlier literature [16,17,83,84]. There is room for improvement in the pursuit of all goals for the 2030 Agenda, as even the goals with the highest adoption rate do not reach 70% of the application within this sample.
The following two related questions refer to the adoption of relevant sustainability policies by EU-based companies:
- Q1c. How many companies in the EU apply each type of sustainability policy?
- Q1d. What is the proportion of companies in the EU that apply each type of sustainability policy?
Building on the existing literature [85], we identify relevant sustainability policies and elucidate their relationship with the SDGs, thus improving our understanding of the policy landscape in the context of sustainable development. Furthermore, our study goes beyond identifying the presence of these policies by examining the level of commitment and adherence to the SDGs among companies and providing valuable insights on the extent to which policies translate into actions aligned with the SDGs. As shown in Table 3, several policies show high adoption rates, indicating a strong commitment from a significant proportion of companies. Such policies refer to resource reduction (p_ARR, 91.4%), mapped in our research to targets 11.4, 12.2, 14.7, and 15.5; human rights (p_AHR, 90.2%), mapped to targets 1.4, 8.7, and 16.2; energy efficiency (p_EEF, 84.9%). mapped to targets 7.3 and 13.2; and waste reduction initiatives (p_WRI, 83.1%), mapped to targets 6.A, 11.6, 12.4, and 14.1. The high percentages of policy adoption suggest that a substantial number of companies are actively incorporating policies related to energy efficiency, human rights, and resource reduction, linked to SDGs 1, 7, 8, 11, 12, 13, 14, 15, and 16.
Table 3.
The number and proportion of sample companies applying each policy.
Low application percentages are notable for the fossil fuel divestment policy (p_FFD, 2.5%), nuclear safety policy (p_PNS, 0.7%), and take-back and recycling initiatives (p_TRI, 13.1%) as companies may find these policies less relevant to their operations or there may be challenges in implementing and adhering to these specific types of policies. These policy areas may be relevant to companies that want to improve their commitment to certain goals. In summary, companies prioritize and apply policies differently depending on their industry, size, and strategies.
- Q1e. Is there a relationship between company size and the number of SDGs applied or if a company applies the SDGs?
In our study, we performed a correlation analysis to understand the relationship between adherence to SDGs and company size. This analytical approach can provide valuable insights for stakeholders and policymakers seeking to navigate the interaction between sustainability actions and the economic impact of sample companies. Furthermore, the correlation analysis builds upon previous research [86,87,88] by offering an examination within the specific context of our sample. The results in Table 4 suggest that there is a positive relationship between company size (total assets) and the number of SDGs applied or if the company applies the SDGs. The correlation coefficient between total assets and the number of SDGs applied is 0.259. This correlation suggests a weak positive relationship between the total assets of a company and the number of SDGs pursued by the sample companies.
Table 4.
Correlation between company size (total assets) and the number of applied SDGs or if the company applies any SDGs.
The correlation coefficient between total assets and the binary variable indicating whether the SDGs are applied is 0.132. This very weak positive correlation suggests a slight positive relationship between the total assets of a company and whether it pursues any SDGs. Larger companies are slightly more likely to apply some SDGs. Other factors not considered in the analysis can influence the observed relationships. The conclusion is that companies, regardless of size, can choose to apply the SDGs or not based on their sustainable development strategies and business models. While larger companies may be under more peer pressure and stakeholder scrutiny, their public visibility is not enough to convince the board of directors to pursue the relevant SDGs.
- Q1f. Is there a relationship between company size and the number of policies applied, or if the company applies any sustainability policy?
In parallel with our previous correlation analysis that examined the relationship between SDG adherence and company size, we extended our inquiry to explore the correlation between the economic contribution of a company and the application of sustainability policies. This approach allows us to investigate the impact of policy implementation on financial outcomes independently of SDG alignment. Our research builds on the existing literature [89,90,91,92] by uncovering patterns or associations between policy implementation and financial outcomes, thus enriching the understanding of the mechanism that drives sustainable development and economic success.
The correlation coefficient of 0.171 between total assets and the number of policies applied indicates a weak positive association (see Table 5). This implies that there is a tendency for companies with higher total assets to have a greater number of applied policies, but the relationship is weak. The coefficient of 0.171 signifies a positive but relatively low correlation (very small statistical effect). As the total assets increase, there is a slight motivation for company boards to adopt multiple policies to deal with higher operational complexity. However, the correlation coefficient of 0.024 suggests that there is no relationship between sustainability commitment and company size. In conclusion, larger companies tend to have more sustainability policies in place, but increased operational complexity is not a sufficient motivation for boards to implement sustainability policies.
Table 5.
Correlation between company size (total assets) and the number of applied policies or if the company applies any sustainability policy.
4.2. Statistical Results on the Application of SDGs and Corporate Sustainability Policies in each EU Country
In this section, we focus on countries of incorporation. We reformulate the analysis in terms of how many companies in each country pursue the SDGs and apply sustainability policies. This analysis addresses research question Q2. We start by investigating the countries in which companies apply at least one SDG. The following question is relevant in this regard:
- Q2a. How many companies in each EU country pursue at least one SDG?
The total number of companies with valid data in each country provides context for the overall size of the business landscape in these nations (see Table 6). Companies incorporated in several countries, such as Austria (93.11%), Czechia (100%), Denmark (90.16%), Ireland (91.67%), the Netherlands (91.67%), Portugal (90.91%), Slovenia (100%), and Spain (91.11%), have high application rates, indicating a significant commitment of most companies to apply at least one SDG. On the other hand, companies from several countries (Bulgaria, Romania, Luxembourg) have a less-pronounced interest in the SDGs. Variations may be influenced by cultural and regulatory differences, even within the European Union, due to distinct national policies and the level of awareness and engagement in sustainability initiatives, influencing companies’ propensity to address the SDGs.
Table 6.
The number and proportion of companies in each country that pursue at least one SDG and adopt at least one sustainability-related policy (N = 1156 companies).
A visual representation of the results is provided in Figure 1. The map allows us to understand the patterns of SDG contributions in different geographical regions [93] within the European Union. The observed pattern is defined by a color spectrum from red to green. Figure 1 confirms the results of previous studies on the limited adoption of sustainability initiatives in Eastern Europe [94,95], as evidenced by the prevalence of red or near-red hues on the map, which signal countries where SDG targets are applied by fewer companies. Using color mapping can offer significant decision-making support by fostering a comparative viewpoint across SDG indicators, pinpointing the geographies requiring attention for sustainable development efforts and enabling the prioritization and allocation of resources to specific EU regions in alignment with SDG objectives.
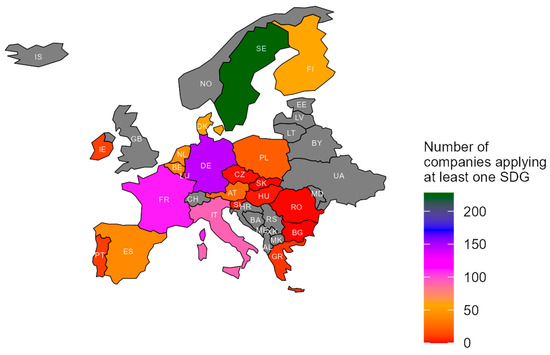
Figure 1.
Geographical map of the number of companies in the European Union pursuing at least one SDG. Source: Table 6.
The following question focuses on the application of sustainability-related policies by country:
- Q2b. How many companies in each EU country apply at least one sustainability policy?
Almost all companies in EU countries apply at least one sustainability policy. The uniformity in policy adoption throughout the business landscape observed in Table 6 shows the corporate commitment to responsible business practice. Sweden stands out with a slightly lower application percentage (97.98%) compared to the 100% application rates seen in several other countries. This indicates that a very small proportion of companies in Sweden have not adopted any policy. However, Sweden has the highest proportion of companies in the sample. The highest number of companies that do not apply any policy can be observed again in Sweden, meaning that 6 Swedish companies out of the 297 do not apply any policy.
A visual representation of these results is shown in Figure 2, facilitating an understanding of patterns in sustainability policies in diverse geographical regions within the EU. These policies are crucial to addressing the multifaceted challenges outlined in sustainability agendas. Figure 2 reinforces previous research findings that highlight the varying degrees of implementation of sustainability policies, particularly in certain regions (Eastern Europe), indicated by red or near-red hues, where policy uptake may be lacking [96,97,98]. Sustainability policies are the internal mechanism by which companies implement the SDGs and other requirements, such as the due diligence process mandated by the Corporate Sustainability Reporting Directive [43]. In this respect, the adoption of sustainability policies is more relevant to the sustainability strategy of EU companies than the self-declared contributions to the SDGs. Policies create a substantive obligation for company managers to prevent harm or facilitate environmental protection and social welfare, as a reflection of EU-level policies [99].

Figure 2.
Geographical map of the number of companies in the European Union applying at least one sustainability policy. Source: Table 6.
We continue the exploration of SDGs and policies by country by calculating the descriptive statistics of the extent to which SDGs are applied in each EU country. We will answer the following question:
- Q2c. What are the average and range of the number of SDGs applied per country?
The total number of companies (1156) considered in the analysis provides context for the overall sample size and the breadth of the study (see Table 7). The mean number of SDGs applied per country is calculated as the average number of SDGs adopted by companies within each country. The overall mean across all countries is 6.68, indicating that, on average, companies in EU countries apply approximately six or seven SDGs. There is considerable variation between countries in the mean number of SDGs applied. The means are found in the interval from 0 (e.g., Bulgaria, Luxembourg) to 11.50 (Czechia). In countries with many companies containing valid data (France, Germany, Italy, and Sweden), we can observe that the means lie between 5 and 9. Romania has a relatively low mean (2.60), suggesting that, on average, companies in Romania apply a smaller number of SDGs. This may be due to specific challenges or less emphasis on sustainability practices within the business landscape [100].
Table 7.
The mean, median, and range of SDGs applied per country.
All EU countries have companies that do not apply any SDGs, except Czechia (with two listed companies that apply at least ten SDGs) and Slovenia (with three listed companies applying a minimum of five SDGs). The maximum number of SDGs applied is 17, for most of the countries, while companies in Slovakia apply the least SDGs, with a maximum of 7. The median value of the sample (seven) is close to the mean, indicating a relatively symmetric distribution of the number of SDGs applied per country. Some countries, such as Sweden, have means that are close to their respective medians, suggesting a more balanced distribution of the SDG application. Other countries, such as Greece and Spain, have means that are slightly higher than their medians, indicating a positively skewed distribution, with prominent companies adopting a higher number of SDGs.
The weighted mean of each country is calculated by multiplying the mean number of SDGs pursued by the proportion of companies in the total sample. This indicator shows the contribution of the respective countries to the SDGs in the European Union. In our sample, Sweden has the largest weighted mean, followed by France and Germany. Not surprisingly, these countries also have many companies that pursue the SDGs and contribute to sustainable development.
- Q2d. What are the average and range of the number of sustainability policies applied by companies in each country?
The following analysis delves into the application of sustainability policies by companies in each EU country, mirroring the previous analysis concerning the SDGs in each country. The results are presented in Table 8. The overall mean across all countries is 13.45, indicating that, on average, companies in these countries apply approximately 13 to 14 policies out of the 24 analyzed. The mean values range from 7.00 (Bulgaria, Luxembourg) to 15.91 (Spain). This indicates a considerable variation in the average number of policies adopted by companies in different countries. In many cases, the mean values are close to the median values, suggesting a relatively symmetric distribution of policy adoption.
Table 8.
The mean, median, and range of the number of sustainability policies applied by sample companies, per country.
The minimum and maximum values represent the range of policy adoption within each country. For example, in Belgium, the minimum is 0, indicating that some companies have not adopted any policy, while the maximum is 19, indicating a high level of policy adoption by some Belgian companies. Some countries, such as Bulgaria and Luxembourg, have relatively lower mean values of 7.00, indicating a lower average level of policy adoption with minimum and maximum ranging between 3 and 11. There are companies in Belgium, Denmark, France, Germany, and Sweden that do not have any policy, according to Refinitiv. However, these countries have several companies that apply a very large number of policies, ranging from 19 to 21. Companies in Denmark, France, and Spain apply a maximum of 21 out of the 24 policies analyzed.
For countries where the mean is lower than the median (e.g., Belgium, Hungary, Romania, Slovakia, and Sweden), there is a potential skewness toward lower policy adoption. Policymakers may explore strategies to encourage wider policy adoption among companies in these countries.
The weighted mean of each country is calculated by multiplying the mean number of policies applied by the proportion of companies in the total sample. This indicator shows the commitment of companies in each country to the implementation of sustainability policies in the EU. In our sample, Sweden has the largest weighted mean, closely followed by Germany. France and Italy occupy the third and fourth positions, respectively. Not surprisingly, these countries also have numerous companies that implement sustainability policies and contribute to sustainable development.
4.3. Statistical Results on the Application of Each SDG and Sustainability Policy per Industry
The following analysis discusses the application of SDGs and sustainability policies per industry (classified using the NACE codes rev. 2.0). This is relevant to this investigation because industries have different impacts, risks, and opportunities related to sustainability [43]. The first point refers to the extent to which the SDGs are applied in each industry. The following question is relevant to this analysis:
- Q3a. What are the average and range of the number of SDGs applied per industry?
There is considerable variation in the mean number of SDGs applied in different industries, ranging from 4.38 in the administrative and support services industry (N) to 12 in the public administration and defense industry and the compulsory social security industry (O). This variation suggests that industries differ in their commitment to and alignment with the SDGs. Table 9 offers more details. Industries such as public administration and defense, compulsory social security (O), and financial and insurance activities (K) have relatively higher mean values of 12.00 and 7.91, respectively. This indicates that companies within these industries, on average, adopt a larger number of SDGs. This may be attributed to regulatory requirements, industry norms, and a strong emphasis on sustainability in these sectors [101]. Industries such as professional, scientific, and technical activities (M) and administrative and support services (N) have lower mean values of 4.50 and 4.38, respectively. In many cases, the mean values are close to the median values, indicating a relatively symmetric distribution of SDG applications within each industry.
Table 9.
The mean, median, and range of SDGs applied per industry.
The maximum number of SDGs applied is 17, which is common in most industries. Companies in the professional, scientific, and technical activities sector (M) apply a maximum of nine SDGs—the least number of SDGs in the present sample. The public administration and defense industry (O) applies a minimum of seven SDGs, compared to all other industries, where the minimum number of applied SDGs is zero.
- Q3b. What are the average and range of the number of sustainability policies applied per industry?
There is considerable variation in the mean number of policies applied across different industries (see Table 10), ranging from 8.50 (education—P) to 14.51 (manufacturing—C). Industries such as manufacturing (C), mining and quarrying (B) and construction (F) have relatively higher mean values of policies applied, indicating a stronger commitment to adopting a larger number of policies on average. Education (P), professional, scientific, and technical activities (M), and administrative and support service activities (N) have lower mean values, suggesting a comparatively weaker adoption of policies within these sectors. Industries such as manufacturing (C), information and communication (J), financial and insurance (K), professional, scientific, and technical activities (M), and arts, entertainment, and recreation (R) include some companies that do not apply any policy. There is no industry with at least 1 company that implemented all 24 policies.
Table 10.
The mean, median, and range of policies applied per industry.
In many cases, the mean values are close to the median values, indicating a relatively symmetric distribution of policy adoption within each industry. Across all industries, the overall mean number of policies applied is 12.74, suggesting that, on average, companies across various industries have aligned their practices with an average of 13 policies out of 24 analyzed, with a minimum of 3 policies applied and a maximum of 18 policies applied.
- Q3c. How many companies apply the SDGs in each industry and country (cross-tabulation)?
In Table A2 (Appendix A), the last column on the right provides the overall count of companies applying the SDGs, broken down by industry and EU country. Industries with higher counts indicate a greater prevalence of companies adopting the SDGs. For example, manufacturing (C) and wholesale and retail trade (G) have relatively high counts, suggesting widespread adoption in these sectors. Industries with lower counts have fewer companies actively applying SDGs. For example, mining and quarrying (B) and education (P) have lower counts. The frequencies for each country provide insights into the level of adoption of the SDGs. For instance, Germany (DEU) and Sweden (SWE) have relatively higher counts compared to other countries. Low values for the adoption of SDGs can be observed in Czechia, Hungary, Portugal, Romania, Slovakia, and Slovenia.
- Q3d. How many companies apply sustainability policies in each industry and country (cross-tabulation)?
In Table A3 (Appendix A), each column represents a country, and the numbers indicate the frequency with which companies in that country apply policies in each sector. Industries with higher counts indicate a greater prevalence of companies adopting sustainability policies. For instance, manufacturing (C) and wholesale and retail trade (G) have relatively high counts, suggesting widespread adoption in these sectors. Some industries such as agriculture (A) and mining and quarrying (B) have lower counts, indicating lower adoption and/or fewer companies in these sectors applying policies. The frequencies for each country provide insights into the level of adoption of sustainability policies. For instance, Sweden (SWE) and Germany (DEU) have a relatively higher count compared to other countries, considering that the most advanced industry in terms of sustainability policies is manufacturing (C). The lowest counts on corporate policies between countries are represented by Bulgaria, Czechia, Hungary, Italy, Romania, Slovakia, and Slovenia.
- Q3e. How many companies apply the SDGs in each industry?
In Table A4 (Appendix A), each row corresponds to a specific SDG, and the columns represent different industries. For example, in manufacturing (C), there are 228 companies applying SDG 3, which is related to good health and well-being. Industries such as manufacturing (C), wholesale and retail trade (G), and financial and insurance activities (K) have relatively high counts across multiple SDGs, indicating a comprehensive approach to sustainability. The most pursued SDGs (8, 12, 13, 5, 3, 7, and 9, in descending frequency of application) refer to job creation and economic development, inclusivity and social responsibility, resource efficiency and waste reduction, regulatory compliance and risk mitigation, environmental responsibility, and market demand and consumer preferences. A survey conducted by KPMG in 2022 on 12 countries, territories, and jurisdictions observed that the frequency of prioritized SDGs follows the same pattern; SDG 8 (72%), SDG 12 (58%), SDG 13 (63%), followed by SDG 5 (43%), SDG 3 (49%), SDG 7 (50%) and SDG 9 (50%) [102].
Some industries, like agriculture (A) and mining and quarrying (B), have lower counts for certain SDGs, possibly reflecting the need to focus more on specific sustainability goals within these sectors. Industry-specific challenges and characteristics are linked to resource-intensive practices, economic dependence on the exploitation of natural resources, or the fragmentation of the industry [103].
We analyzed the literature by searching Clarivate Web of Science and Scopus using keywords from the industry’s name and “SDGs” (e.g., “Agriculture SDG”, “Mining SDGs,” etc.). We performed textual analysis to identify the SDGs correlated with the results of the present study. Table A5 (Appendix A) includes the correspondence between the previous literature and the present results. We have identified common contributions to the SDGs for each industry, except water supply, sewerage waste management, and remediation activities (E), as the companies in this industry in our sample did not present adherence to any of the 17 SDGs. Higher SDG matching is observed in agriculture (A), electricity and gas (D), financial (K), education (P), and arts and recreation (R). We identified less SDG matching in wholesale and retail (G), transportation and storage (H), accommodation and food service activities (I), real estate activities (L), professional (M), administrative and support services (N), and human health and social work activities (Q). Table A5 also indicates future research opportunities in the investigation of the SDGs by industry to increase the matching between what companies consider relevant and what researchers consider relevant in terms of corporate contributions to the SDGs.
- Q3f. How many companies apply sustainability policies in each industry?
In Table A6 (Appendix A), each row corresponds to a specific policy, and the columns represent different industries. For example, in manufacturing (C), there are 402 companies applying the policy labeled p_ARR. Policies referring to resource reduction (p_ARR), human rights (p_AHR), diversity and equal opportunity (p_DOP), and employee health and safety (p_EHS) have relatively high frequencies across multiple industries. Similarly, with the pursuit of SDGs across industries, there is a high degree of adoption of policies in manufacturing (C), wholesale and retail trade (G), and financial services (K). In manufacturing (C) and wholesale and retail trade (G), there is a significant focus on the supply chain, leading to a greater adoption of sustainability policies in the process of sourcing raw materials, manufacturing, and distribution.
Integrating sustainable practices can be a competitive advantage in attracting environmentally conscious consumers. On the other hand, financial institutions (K), including banks and investment firms, recognize the financial risks associated with environmental, social, and governance (ESG) factors [71]. As sustainability issues can pose risks to long-term business viability, financial institutions are incorporating sustainability policies to assess and manage these risks in their investment portfolios and help their clients achieve the SDGs [104].
Some policies, like the fossil fuel divestment policy (p_FFD) and labeled wood (p_LBW), are applied by fewer companies, possibly reflecting industry-specific requirements. The lowest value observed is related to nuclear safety policy (p_PNS), which is applied in the electricity supply sector (D) and the construction sector (F) in relation to facility construction or materials for nuclear facilities.
4.4. Statistical Results on the Relationship between SDGs and the Corresponding Policies
The final section of the results proposes an exploration of the relationship between the SDGs and p_SDGs based on the SDG versus policies matrix (Table A1). The correlation is based on mapping the SDGs to corporate policies related to the SDGs. This correlation analysis answers Q4, which was formulated as:
- Q4. What is the relationship between the SDGs and the corresponding policies as applied by the sample companies?
In Table A7 (Appendix A), each cell in the table contains a correlation coefficient between each SDG and its corresponding p_SDG composed of mapped policies (in Table A1). For example, p_SDG1 is based on the occurrence of p_AHR (analytic human rights policy). Based on the mapping in Table A1, correlation coefficients were calculated between the SDG frequencies in columns and the aggregated p_SDG frequencies in rows. Specifically, the correlation coefficient between SDG 1 and its corresponding policy (p_SDG1) is 0.122 (significant at the 0.05 threshold). The positive value (0.122) suggests a very weak positive correlation between SDG 1 and p_SDG1.
The highest correlation can be observed between SDG 13 and the sustainability policies associated with this SDG (p_SDG13). Many of the coefficients are positive and statistically significant, indicating a general positive correlation between the implementation of SDGs and their corresponding policies aggregated by the p_SDGs. However, for most relationships, the statistical effect is either small or medium, but it is not strong. This indicates that the policies adopted by the respective companies are not entirely aligned with the SDGs pursued and reported by the same companies. This is an important result, which will be discussed in the next section.
5. Discussion
5.1. Comparative Perspective on SDG Adoption in the European Union Countries
The data collected from Refinitiv describe not only the parent company from the country of origin but also the application of policies and SDGs to the entire group of companies. Multinational corporations apply their SDGs and sustainability policies throughout the consolidation perimeter, leading to various business behaviors and progress toward the SDGs at various rates [105]. In other words, the sample companies—most of which are multinational enterprises—disseminate their policies in all countries of operation and pursue their underlying SDGs. The following discussion presents the notable contributions of the top performers in our sample, according to the results summarized in the previous tables.
Figure 3 provides a quantitative overview of the engagement of different companies in achieving specific SDGs using the number of companies applying each SDG. Red and orange hues indicate little contribution to the SDGs. Green hues indicate a substantial contribution to the SDGs. Sample companies from Bulgaria and Luxembourg had not reported contributions to any SDG. Companies in Croatia, Cyprus, Estonia, Latvia, Lithuania, and Malta did not have data collected by the Refinitiv analysts (as of November 2023), as observed in Table 1. In this sense, they appear in Figure 3 as lacking participation.
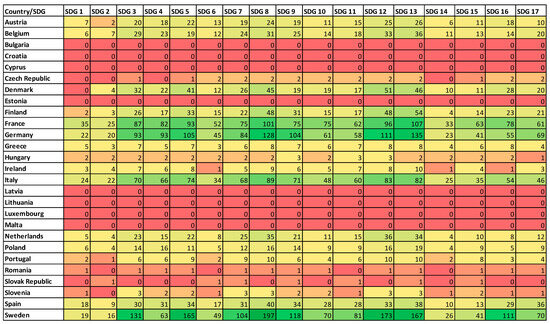
Figure 3.
Heatmap of the number of companies applying each SDG per country.
Swedish companies have outstanding participation in numerous SDGs; French and German companies demonstrate substantial engagement across most SDGs; and Italian companies engage significantly across multiple SDGs, approaching the level of sustainable development in France and Germany. On the other hand, there is minimal participation of companies in Romania and Bulgaria. More research is needed to understand the reasons behind the lack of participation in these countries.
On the same note, we observe in Figure 4 the heat map of the number of companies that apply each policy per country. Red and orange hues indicate lower adoption of sustainability policies. Green hues indicate a substantial adoption of corporate sustainability policies in the respective countries. Similar to the contributions towards the SDGs, French, German, Italian, and Swedish companies are the ones that engage more with sustainability policies. Policies most frequently applied by the companies are p_PER (product environmental responsible use), p_ARR (analytic resource reduction), p_WEF (water efficiency), p_EEF (energy efficiency), p_ESC (environmental supply chain), p_EHS (employee health), p_STR (skills training), p_CDV (career development), p_DOP (diversity and opportunity), p_FAS (freedom of association), p_CDL (prevention of child labor), p_AHR (human rights policy), and p_FLB (prevention of forced labor).
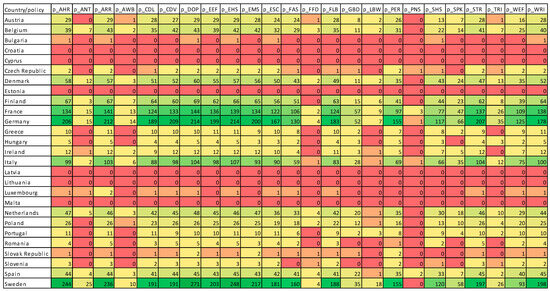
Figure 4.
Heatmap of the number of companies applying each policy per country.
Based on our research, SDG 1 (“end poverty”) is approached mainly in the manufacturing (C) and financial (K) industries. The contribution of the manufacturing sector to this SDG is characterized by high values due to the strong focus of companies on product development for a low-income population [81]. Observing the heatmap in Figure 3, companies in France, Germany, Italy, and even Spain and Sweden are the ones that approach this goal more. SDG 2 (“zero hunger”) has a similar scope in all sectors as it is closely linked to SDG 1, with high values in the manufacturing sector (C). The most significant contribution belongs to manufacturing companies that focus on their value chain. Other industries could adhere to this SDG by supporting organizations such as the World Food Programme.
SDG 3 (“good health and well-being”) continues the interlinkage with SDG 2 since hunger can cause diseases and affect the health of the population [81]. The manufacturing sector (C) and the wholesale and retail industry (G) have a high interest in SDG 3, implicitly seeking to attract and retain their personnel. Health should be a subject of interest for all companies by ensuring a safe work environment. Companies investing in education (SDG 4—“quality education”) could also target SDG 8 (“decent work”) by developing a skilled workforce through their investment in education before hiring and on the job. We observed that companies in sectors such as manufacturing (C), wholesale and retail (G), and financial services (K) apply SDG 4 to a larger extent, but companies in other industries could be more engaged and implement appropriate training programs for their workforce or participate in training partnerships [81].
SDG 5 (“gender equality”) creates benefits for the entire economy, as we observe an increase in the country’s GDP when the employment gap is reduced [106]. SDG 5 is highly applied by French, German, and Swedish companies, as shown in Figure 3. More companies in various industries should be aware of the gender equality policies.
SDG 6 (“access to water”) is mainly applied by the manufacturing (C) industry as water usage levels are higher in cooling and cleaning processes [107]. It is important for companies to track their water consumption and discharge in business activities and in providing sanitation to employees [81].
SDG 7 (“affordable and clean energy”) represents a new challenge for all companies as fossil fuels are phased out in the EU [108]. This sustainability goal is relevant not only to the manufacturing sector (C) but also to industries such as electricity and gas (D), construction (F), wholesale and retail (G), information and communication (J), financial services (K), and real estate (L). As in the case of SDG 6, companies should understand their energy usage patterns, especially in the manufacturing industry. In recent years, the hospitality industry (I) has demonstrated greater social and environmental responsibility as it seeks solutions to provide green accommodation practices that could be used as a marketing instrument toward the responsible consumer [109]. Organizations should seek to disseminate their clean energy practices throughout the supply chain when selecting and auditing suppliers.
SDG 8 (“decent work and economic growth”) reflects more dimensions, combining SDG 4, SDG 5, and access to finance [81], providing a specific link to SDGs 1 and 3. SDG 8 reflects the challenges related to unemployment and the risk of forced labor. During our research, we observed the applicability of SDG 8 in manufacturing (C) and wholesale and retail (G), as both industries are based on human labor. SDG 9 (“industry, innovation and infrastructure”) was approached by the same sectors mentioned above, in addition to information and communication (J), which deals mainly with the innovation side of this specific goal. SDG 10 (“reduced inequalities”) is relevant for manufacturing (C), wholesale and retail (G), and financial services (K), mainly as a consequence of their compliance efforts [42,81]. The three mentioned industries also seek continuous innovation, and the diversity of the workforce is a key factor in achieving SDG 10.
As the SDGs are interconnected [77], urban and rural life is supported by agriculture (A), manufacturing (C), and transportation (H). In our research, we observed a high interest in SDG 11 (“sustainable cities and communities”) in the manufacturing industry (C). Agriculture (A) and transportation (H) are not significant contributors, although they should diminish their negative effects by pursuing the targets associated with SDG 11. On the other hand, SDG 12 (“responsible consumption and production”) is approached by the same industries discussed above, with very high participation from the manufacturing industry (C) as it seeks to become carbon neutral [81]. SDG 13 (“climate action”), based on the Paris Agreement [110], puts pressure on revenue streams and relationships with suppliers and distributors, as the Corporate Sustainability Reporting Directive demands carbon accounting across the value chain [43].
SDG 14 (“life below water”) refers to the pollution of the seas directly or indirectly generated by companies in any industry, with a direct impact on the health of the population (SDG 4). High polluters should seek to identify plastic use and toxic substances in their production processes. Sustainable partnerships are needed to implement circular solutions in different value chains [111]. SDG 15 (“life on land”) is of great relevance to companies in the manufacturing industry (C) as they recognize “natural capital” as scarce [81]. SDG 15 is considered a challenge for companies as biodiversity is threatened in many parts of the world. SDG 16 (“peace and justice”) is linked to corporate transparency that helps policymakers and the public understand firm behavior. Multinational companies should disseminate their codes of conduct in the supply chain to ensure best practices and transparency with respect to their sustainable actions. Finally, SDG 17 (“partnerships for the goals”) has no homogenous applicability in the present sample, although it supports partnerships between the private and public sectors to solve complex problems and overcome challenges regarding funding, technology, or transition events.
Looking at the European Union as a whole in relation to the 17 SDGs, and understanding the role of the EU in setting the trend for all member states [52], researchers have concluded that the implementation of the SDGs can be carried through a collective approach, not limited to a particular industry. The following subsections analyze the “leaders” and “laggers” in the sustainability landscape of the European Union, based on the results discussed above. We seek to describe the socioeconomic context of the countries where companies have the highest contribution to the SDGs versus the countries where companies do not yet seem interested in applying the SDGs.
5.2. Contribution of Swedish Companies to the SDGs
In our study, we observed significant participation from Swedish companies; Sweden was the country with the highest share of valid data, as detailed in Table 1. In 2022, the services sector, including wholesale and retail trade (G), hotels and restaurants (I), transport (H), government (N, O), financial services (K), professional services (M), education (P), health care (Q), and real estate (L) contributed 63.5% to the total GDP. Industrial activity contributed 24% to GDP, with manufacturing taking 13% and construction 11%, while agriculture (A) contributed a share of 1.5%. According to the Sustainable Development Report 2023 [112], Sweden scored 85.98%, ranking in the second position.
Swedish companies focus their efforts on achieving SDGs 7, 12, 13, and 14 [113], which are primarily prevalent in the manufacturing (C), financial (K), and wholesale and trade (G) industries. Table A2 indicates that Swedish companies focus their efforts on the SDGs in these sectors. Sweden excels in domains such as the circular economy, eco-friendly agriculture, green infrastructure, an eco-friendly lifestyle, and sustainable living, aiming to become a fossil-fuel-free nation by 2050 through its commitment under the Roadmap 2050 initiative [114].
Currently, Sweden is recognized as an extensively documented innovator and contributor with a high adaptive capacity to address climate change [115]. The ranking comes as a result of environmental protection regulations and policies that are primarily applied in the manufacturing industry (C), which has the highest contribution to SDG 7. Sweden has already achieved the target for 2020 regarding 50% of energy from renewable sources (SDG 7) [116] by investing in hydropower and biomass [117]. Due to its northern geographical location, companies and the population are large consumers of energy. In this regard, Swedish companies have invested more in renewable energy sources than companies in other countries, making a greater step toward clean energy [116,118,119,120]. Regarding air pollution, the metropolitan population’s exposure to PM2.5 is below the WHO threshold [121] and is continuously decreasing (SDG 11). Climate change vulnerabilities, such as surface run-off and marine debris (SDG 14), consisting of industrial pellets, plastic, cigarettes, and paraffin pieces [122], are observed in the Baltic Sea [123] and linked to various industries, mainly manufacturing (C), retail and wholesale (G), and construction (F).
Companies headquartered in Sweden actively promote gender policies [124], benefiting from the most comprehensive legal framework for gender equality (SDG 5) [112]. Women hold 47% of parliamentary seats, as well as more than 40% of management positions, and SDG 5 is generally observed in every industry analyzed, with more focus on manufacturing (C) and financial services (K). Together with Sweden, European developed countries that are part of the G7, including France, Germany, and Italy, maintain a strong position regarding the applicability of SDGs [125].
5.3. Contribution of German Companies to the SDGs
Based on our research, in the list of countries with more than 100 companies with available data, Germany is the second country, as seen in Table 6. According to the Sustainable Development Report [112], Germany holds the fourth position in terms of sustainability performance, achieving an index of 83.36. In Germany, companies in the services sector account for 62.7% of GDP, which includes wholesale and retail trade (G), hotels and restaurants (I), transport (H), government services (N, O), financials (K), professional services (M), education (P), health care (Q), and real estate (L) [126]. In Germany, services also include the information and telecommunication sector (J) [127]. The second largest category is industry (26.9% of the GDP), which is divided between manufacturing (C), with a proportion of 18%, and construction (F), with 8.9%. Agriculture (A) contributes 0.9% to Germany’s GDP.
The German labor market has excelled in effectively utilizing the skills of its workforce. It is observed that SDG 8 is tackled in construction (F), wholesale and retail (G), information and telecommunication (J), and agriculture (A)—industries that have a high contribution to the GDP. In this regard, companies in these sectors provide substantial hourly wages, while the unemployment rate is less than half of the OECD average. Although there is room for enhancement, efforts have been made to improve educational results and significantly increase childcare enrollment (SDG 4). There is a high level of proficiency, above the OECD average, in functional skills such as numeracy, literacy, and digital skills (SDG 4) [128]. Engagement in lifelong learning surpasses the OECD average but has the potential for further improvement (SDG 4). The vocational education and training system facilitates the integration of young people into the labor market, with the majority of German youth either employed, pursuing education, or undergoing training (SDG 8) [129]. However, women are still underrepresented in decision-making positions, but there is a positive trend in this regard [128,130]. Women spend more time in unpaid care and domestic work than men, with a gap lower than the OECD average [128].
Germany has established ambitious sustainability goals for 2030 [129]. These goals include a minimum reduction of 65% in GHG emissions and the goal of reaching carbon neutrality by 2045 [129]. Although currently recognized by the OECD as a leader in waste management, Germany is above the average in retail food waste (SDG 2). Manufacturing (C), real estate (L), and agriculture (A) contribute to proficient waste management and support Germany’s leading position in recycling (SDGs 11 and 12). However, around 80% of freshwater, terrestrial, mountain, and marine areas, deemed crucial for biodiversity, lack protection (SDGs 14 and 15), although German companies implement policies regarding environmental and biodiversity protection.
5.4. Contribution of French Companies to the SDGs
In our study, France holds the third place as seen in Table 1. France holds the sixth position according to the Sustainable Development Report 2023 with an overall SDG adoption score of 82.05 [112]. It has a high standard of living and quality of life supported by social security systems and access to healthcare, as well as essential goods and services [124]. In France, companies in the services sector account for 70.7% of GDP [131]. This sector includes wholesale and retail trade (G), hotels and restaurants (I), transport (H), government (N, O), financials (K), professional services (M), education (P), health care (Q), and real estate (L). Industry accounts for 16.8% of the total GDP, specifically manufacturing (C) and construction (F). We identified in Table 6 that, from a total of 149 companies that contained valid data, 74.50% apply at least one SDG, especially in the two mentioned categories: services and industry, which represent 82.88% of the total number of companies that apply at least one SDG.
France is committed to implementing education policies within the curriculum (SDG 4). However, certain challenges persist. Based on the OECD, French students’ proficiency in reading and mathematics falls below the minimum target levels (SDG 4), registering an indicator of 26.9 [128]. Labor market challenges (SDG 8) faced by France come as a result of the situation in the construction, wholesale and retail, transport, education, and healthcare industries, due to the slow growth in labor productivity and high unemployment rate [124]. The professions in these types of industries are considered difficult by 61% of recruitment companies due to a lack of candidates, inadequate professional preparation of candidates, work conditions, lack of financial motivation, or difficult access to the workplace [132]. Despite this fact, France maintains an income poverty rate below the OECD average (SDG 1).
Gender inequality is also lower than the OECD average, supported by legal frameworks that promote gender equality (SDG 5). However, concerns arise regarding the time women spend on unpaid care and housework compared to men, although the gap is below the OECD average [133]. Additionally, one-third of management positions are occupied by women. SDG 5 is specifically addressed in government services (N, O), with an increase in the indicator related to seats held by women in the national parliament [124].
France’s environmental performance is sustained by self-owned nuclear electricity, leading to a decrease in GHG emissions (SDGs 9 and 13). In particular, in France, protected areas cover one-third of terrestrial regions and half of territorial waters, surpassing the 2020 Aichi biodiversity targets [134]. Moreover, beyond 80% of freshwater, terrestrial, and marine areas are considered protected areas (SDGs 14 and 15). However, companies in the manufacturing industry (C) are significant contributors to domestic material use (SDG 12). The manufacturing industry (C) contributes negatively to the SDGs by increasing marine pollution, exceeding the OECD average in terms of marine debris and nutrient pollution (SDG 14), as well as air pollution (SDGs 11 and 12).
5.5. Contribution of Italian Companies to the SDGs
As observed in Table 1, Italy is the fourth among the countries with over 100 companies that had available ESG data in Refinitiv Eikon. Italy ranks 24th in the Sustainable Development Report [112] with an index of 78.80. Since 3 February 2016, Italy has established the Italian Alliance for Sustainable Development (ASviS), comprising 270 member organizations [135]. This alliance plays a vital role in raising awareness and mobilizing stakeholders to achieve the SDGs. Italian companies show positive trends toward achieving SDGs 2, 5, 7, 9, 12, and 17, while SDGs 11, 13, 4, and 1 present worsening trends [136].
Companies in the services sector contribute to 64.3% of the Italian GDP. This sector includes wholesale and retail trade (G), hotels and restaurants (I), transport (H), government services (N, O), financial services (K), professional services (M), education (P), health care (Q), and real estate (L) [126]. Industry accounts for 23.8% of Italy’s GDP, of which manufacturing (C) represents 15% and construction (F) represents 8.8%. Agriculture represents 1.8% of GDP.
The growth of GDP and labor productivity (SDG 8) have been low or negative in the last 10 years [137], with a decrease in GDP for the year 2022 compared to 2021. Economic recovery is attributed to the construction industry (F) and the manufacturing industry (C), as well as certain services such as accommodation and food service activities (I) and transport and storage (H), which increased the value added per person employed [136]. The employment rate has increased, approaching the OECD average, but the unemployment rate remains high [112,136]. The proportion of young people (between 15 and 29 years of age) who are not engaged in any level of education or employment (SDG 8) is above the OECD average and exceeds the values reported by Spain and Germany [128].
Italy excels in waste management, witnessing a decline in the share of municipal waste sent to landfills in 2022 [112]. Italian companies lead in the OECD ranking on recycling (SDGs 11 and 12) [128], especially in the manufacturing sector (C), as shown in Table A4 (Appendix A). Italy falls below the OECD average on food waste from households and retailers (G), especially due to the COVID-19 pandemic period, making it comparable to major European countries, but it is close to the OECD average when it comes to restaurants (I) (SDG 12).
Approximately 25% of terrestrial, mountain, and marine areas, along with 15% of freshwater areas crucial to biodiversity, remain unprotected (SDGs 14 and 15), and the IUCN Red List of Threatened Species [138] confirms a decline in biodiversity (SDG 15). While air pollution is decreasing in general, emissions in large cities remain high (SDG 11) due to industries such as transport (H), wholesale and retail (G), manufacturing (C), construction (F), and agriculture (A) in the metropolitan area (Table A2). This poses a health threat to the population (SDG 3) [139] since Italy, similar to France and Germany, registers high values of PM 2.5 pollution (SDG 11) [121,140]. Italy experiences lower mortality from non-communicable diseases compared to the OECD average (SDG 3), reflecting an effective healthcare system [112].
Social challenges in Italy are related to adults not having minimum proficiency in numeracy and literacy (SDG 4), as well as low participation in learning, compared to the OECD average and countries such as Spain and Sweden [128]. Low labor productivity values and high unemployment rates are also linked to the deficiency in digital skills of Italian adults and young people (SDG 4). Gender equality (SDG 5) in Italy is below average [112], and women are underrepresented in the parliament and managerial positions. The gender gap in unpaid work also exceeds the OECD average [112]. In summary, Italy’s economic and social environment is characterized by contrasting aspects and uneven contributions to the SDGs.
5.6. The Case of Romanian Companies Regarding the SDGs
Romania and Bulgaria (in the next section) are EU countries with valid data but with very little contribution to the SDGs. They are ranked at the end of the scale of countries whose companies issue sustainability reports (analyzed by Refinitiv) but have little progress towards the SDGs and apply relatively few sustainability policies. According to the Sustainable Development Report 2023, Romania ranks 35th with a percentage of progress of 77.5 [112]. In 2022, the GDP of Romania was shared between services (57.6%) including hotels and restaurants (I), transport (H), government services (N, O), financials (K), professional services (M), education (P), health care (Q), and real estate (L), complemented by industry (28.9%) and agriculture (4.5%) [141].
Romania has the potential to make significant contributions to SDG 1, as agriculture (A) has well-developed supply chains [81]. This would also contribute to the fight against poverty (SDG 1) outside the European Union as the United Nations considers agriculture to be the best opportunity to reduce poverty. Improvements in food accessibility are necessary to reduce poverty [142]. Romania has a high rate of poverty (16.2%) [143], with only one more EU member—Bulgaria—registering a higher rate (16.5%). There is also a high proportion of malnutrition (SDG 2). Companies’ indifference to SDG 2 is compensated by the existence of the Romanian Food Bank [144], which helps food chain actors, specifically in the wholesale and retail industry (G), to improve the economic value of different types of products by minimizing their storage and disposal costs.
There is a significant link between agriculture (A) and SDG 2. Our sample includes 13 companies in agriculture (A), but none of them are in Romania. Agriculture (A) in Romania employs approximately 26.7% of the working population (SDG 8)—one of the highest rates in Europe [145]—as Romania focuses on the promotion of sustainable agriculture. Efforts towards SDG 3 are seen in high-polluter industries such as electricity and gas (D), agriculture (A), wholesale and retail trade (G), the food industry (I), transport (H), and construction (F) [146].
The education system ranks well below the EU average (SDG 4) due to school abandonment, poor infrastructure, and lack of investment in sustainable education [147]. Variations depend on the region and whether they are urban or rural [148]. In rural areas, the main reasons for school dropout are linked to the lack of construction or modernization of educational buildings, purchase of IT equipment, free transportation to and from school, and the existence of after-school programs.
Romania has a competitive position as energy-intensive companies benefit from a low dependence on imported energy resources. Romania’s geographical position and natural resources facilitate the use of wind and solar power, as well as hydropower [149]. Small and medium enterprises (SMEs) in Romania face challenges in finding partners that share sustainability values and actions.
Despite the existence of legal norms related to social protection expenditure, social services, and poverty prevention, Romania is often found at the bottom of the EU charts, revealing substantial gaps in these areas [150]. While there are favorable results for several key indicators, Romania still has a significant journey before reaching the level of achievement seen in the world’s most advanced nations [151]. In the corporate environment, SDG 4 is approached through training sessions for skills related to sustainable development [152].
5.7. The Case of Bulgarian Companies Regarding the SDGs
Bulgaria ranks 44th, with a percentage of progress of 74.6%, according to the Sustainable Development Report 2023 [112]. Bulgaria’s GDP in 2022 was divided between services (59.6%) including hotels and restaurants (I), transport (H), government services (N, O), financial services (K), professional services (M), education (P), health care (Q), and real estate (L) [153], followed by industry (25.5%) and agriculture (3.9%). In Bulgaria, the private sector has the resources to contribute significantly to the SDGs through improved access to quality education (SDG 4) [154].
A survey conducted by CSR AdviceBox observed that in a sample of 300 companies, two-thirds of companies are aware of the SDGs, and more than half are promoting the SDGs through corporate events. The most relevant SDGs for these companies were SDGs 4 and 13 [154]. Companies offering goods and services in a B2B transaction identified climate change as a greater risk, while companies offering products to end-users are more accountable with regard to SDGs 1, 2, and 3. As a general matter, Bulgarian companies focus on environmental actions linked to air quality (SDG 3 and 11), water management (SDG 6), marine protection (SDG 14), and the protection of nature and biodiversity (SDG 15). Bulgarian companies observe progress related to SDGs 4, 8, and 10 [155].
Bulgaria stands out in Europe with a prominent presence of women in the information and communication industry (J), reaching 27% [154]. Additionally, 53% of scientists and engineers in Bulgaria are women. Efforts are underway to reduce the gender pay gap (SDG 5), promote equality in decision-making processes, and combat gender-based violence. The challenges related to poverty and inequality, both within and between regions, hinder progress in the implementation of the SDGs [156]. Relatively poor performance in reading, mathematics, and science [157] underscores the need to increase efforts to provide quality education (SDG 4) to everyone [128].
Considering a different survey based on 30 Bulgarian companies, it is observed that most companies are aware of the SDGs but implementation is lacking due to challenges created by bureaucracy and insufficient financial resources in the company’s budget [158]. Lack of financial allocation and subsidies for sustainable development could be another reason for Bulgaria and Romania lagging behind the EU cohort [154].
5.8. Comparing the Rankings of European Union Countries on SDG and Policy Adoption
In Table 11 we present a comparison of the rankings of European Union countries regarding their SDGs and policy adoption. Weighted mean rankings are derived from the present research, specifically from Table 7 and Table 8. These are compared to the rankings derived from the Sustainable Development Report 2023 [112] for this subsample of EU countries only. In the cited report, the data on which the scoring methodology is based are drawn from international organizations (OECD, UNICEF, WHO, etc.) and civil society organizations and networks. The report data [112] are relevant at the country level and do not directly reflect the contribution of (multinational) companies to the achievement of the SDGs. However, it is relevant to compare these rankings to discover whether companies headquartered in a certain country follow the national trend in pursuing the SDGs.
Table 11.
Comparison of the rankings of EU countries regarding their SDGs and policy adoption.
The impact of EU leader countries on progress toward the SDGs is significant, with Sweden emerging as a consistent frontrunner, often ranking within the top three performers. Table 11 confirms the prominence of Swedish companies in their commitment to the SDGs, reflecting the nation’s proactive stance on sustainability initiatives. Furthermore, previous research [159] has highlighted several other leading countries within the EU, such as Denmark, Germany, Ireland, Luxembourg, the Netherlands, Slovenia, Belgium, Austria, and Finland, each demonstrating notable contributions to SDG adherence. Our study contributes new insights to the existing literature by delving deeper into the behavior of companies headquartered in the EU and validating the high rankings of Sweden, Germany, France, Italy, and Spain. However, it should be noted that Luxembourg, while recognized for its overall consistency in SDG adherence, does not rank as highly in our results, with the difference being attributed to the dynamics of Luxembourg’s corporate landscape. Despite the country’s efforts toward alignment with the SDGs, individual companies do not consistently report or prioritize sustainability initiatives. As such, our study sheds light on the relationship between national policy frameworks and corporate practices, offering various perspectives to policymakers, stakeholders, and researchers.
There is a strong correlation between the SDG adoption by companies and the SDG rank of the country of incorporation (Spearman’s rho = 0.644, p < 0.01, based on the data from Table 11). Similarly, there is a strong correlation between the companies’ policy adoption and the SDG rank of the country of incorporation (Spearman’s rho = 0.642, p < 0.01). The correlations between these ranks are not perfect, but they validate the results of the present article. It is apparent that companies with headquarters in a certain country largely follow government policies in terms of sustainable development and social welfare. However, the European Union is based on the principle of economic integration, so multinational companies disseminate their goals and policies in all countries in which they are active, without restrictions. Therefore, there are positive spillover effects from companies in high-ranking countries (such as Sweden) that disseminate their sustainability policies and practices in other EU countries where they have subsidiaries and perform economic activities. Multinational companies can contribute to the SDGs in any of the countries in which they operate.
6. Conclusions
This article makes several contributions to the scientific literature and EU policy. Our research describes the business landscape of the European Union in relation to the applicability of the SDGs. Relying on high-quality data from the Refinitiv Eikon database, we analyzed the differences between EU countries with respect to the contribution of listed companies to each SDG. The results are very relevant to national and supranational regulators (like the European Commission). As observed in the macroeconomic reports from Eurostat [23], the differences between EU member states are profound and far-reaching. While it is true that multinational companies apply their sustainability practices and pursue their goals in the value chain and multiple countries, it is also true that some countries have an economic landscape that is actively engaged with the SDGs, while other countries are lagging in the EU cohort. For example, Romania has 85 companies listed on the Bucharest Stock Exchange [160] but only 5 are analyzed by Refinitiv (as of November 2023) and only 1 is reported to pursue any SDG. At the other end of the spectrum, Sweden has the largest share of companies with valid ESG data in the Refinitiv database and makes the most significant contribution to the SDGs at the EU level.
The present research has implications for companies but also governments and sectoral organizations. By conducting a comparative analysis of policy commitments and alignment with the SDGs, our research sheds light on the efficacy of existing policies in driving sustainable development outcomes. Our paper creates an avenue for policy frameworks that help companies adhere to the SDGs. By identifying gaps in corporate policy implementation, policymakers, corporate stakeholders, and NGOs can improve regulatory interventions and promote sustainable development objectives. The pragmatic view of sustainability encapsulates the current representation of adherence to the SDGs among companies in the EU and creates an understanding of sustainable business models. Governments can put pressure on companies (specifically large corporations and multinational enterprises) to improve their corporate social responsibility (CSR) and environmental policies. The ESG scores of companies should align with the SDGs to provide a tool for managers and boards to measure their progress and facilitate the adoption of sustainable business models [161]. The pragmatic development of ESG scoring systems promotes a higher level of responsibility and encourages managers to better disclose information on how each company plans to achieve the relevant SDGs.
Multinational corporations must adhere to sustainable development goals and policies, as outlined in the OECD Guidelines, within the nations they operate [162]. These policies emphasize crucial aspects of sustainability: economic, social, and environmental contributions. It is important for companies to uphold human rights, fulfill obligations to those impacted by their operations, foster collaborations with communities by promoting local capacity building and development, advocate for education and skill enhancement through employment, raise awareness among employees, eliminate discriminatory practices, and apply corporate governance principles [163]. The SDGs are explicitly mentioned in the Corporate Sustainability Reporting Directive [43], which encourages large companies to report their contribution to each SDG. This article offers a different perspective of the EU landscape regarding sustainable development in the economic domain.
We observed the trend in the EU, illustrated in this paper in Figure 1 and Figure 2, indicating that companies in Eastern Europe exhibit lesser adherence to SDGs and sustainability policies compared to leading contributors like Sweden, Germany, France, or Italy. To achieve the common sustainability objectives among nations, the European Commission created various tools to “leave no one behind”. The EU “Whole-of-Government” [164] refers to legislative acts implemented by member states through their ministries, public administrations, or other agencies to achieve the application of policies through better regulation and engagement with stakeholders. Voluntary National Reviews (VNRs) of SDGs represent how EU countries assess their progress and share their experience and challenges faced in the implementation of SDGs [23]. The European Commission engages numerous stakeholders in the process. In this regard, the European Commission encourages stakeholders to actively participate and submit their opinions, in line with SDG 16, providing feedback to policymakers via an online portal. These reviews are used for VNRs, and for the discussion in the present paper. The other relevant tool to understand the contribution to each SDG is the statistics database published by Eurostat, which offers users access to comprehensible data to monitor the SDGs and compare the evolution throughout the European Union.
Several limitations must be highlighted. First, the analysis is limited to the sample of companies reviewed by Refinitiv. The present results are not representative of other EU companies that may contribute to the SDGs but have not been reviewed by Refinitiv. The analysis captures the contribution of certain very large companies headquartered in each EU country to achieving the SDGs. At the same time, the results do not capture the contribution of large but unlisted companies or SMEs. At the same time, it is known that companies may be supported by NGOs (foundations) and state institutions to contribute to the SDGs, but this is not captured in this analysis. Second, the sample is cross-sectional for 2022, so it does not capture an evolution of the phenomenon; it only presents a snapshot of the contribution of EU companies to the SDGs in 2022. Third, the quantitative analysis describes the status of a socioeconomic phenomenon but does not infer causalities. The causal links between various factors and the contributions to the SDGs require the application of other methods of investigation and longitudinal analysis over a longer period. Finally, the equivalence matrix between the SDGs and sustainability policies does not suggest a perfect conceptual equivalence between the SDGs and the respective policies. Also, it cannot be said that the implementation of these policies within the analyzed companies contributes to achieving the corresponding SDGs.
The present investigation opens several avenues for future studies. Researchers can turn directly to sustainability reports, using automated data collection methods, to extract and synthesize disclosures that relate to companies’ contributions to the SDGs. In this way, a much larger sample of listed and unlisted companies compliant with the Corporate Sustainability Reporting Directive can be covered. Using a different methodological approach, a qualitative analysis of the link between sustainability policies and SDGs can be carried out at the level of a sample of large companies. Researchers can investigate whether the contribution to the SDGs is made by explicitly applying sustainability policies so that the mapping of the SDGs to policies is explicit and relevant. The contribution of companies can be determined on each SDG or on certain SDGs grouped thematically by analyzing sustainability policies. This type of analysis should discuss the sectoral specificities and corporate factors of the adoption of certain SDGs.
Country-level or regional analyses can provide insight into socioeconomic and regulatory factors for adopting SDGs and corporate sustainability policies. In this sense, institutional theory [165] can provide a conceptual foundation on which to explain why certain sustainability concerns are more prevalent in some countries and sectors. Stakeholders can monitor progress toward the SDGs using external indexes that would evaluate business models, corporate strategies, and managerial behaviors under national circumstances and within each industry.
Author Contributions
Conceptualization, F.M.P. and V.D.D.; methodology, F.M.P. and V.D.D.; software, F.M.P. and V.D.D.; validation, V.D.D.; formal analysis, F.M.P.; investigation, F.M.P.; resources, F.M.P.; data curation, F.M.P.; writing—original draft preparation, F.M.P. and V.D.D.; writing—review and editing, V.D.D.; visualization, V.D.D.; supervision, V.D.D. All authors have read and agreed to the published version of the manuscript.
Funding
This research received no external funding.
Institutional Review Board Statement
Not applicable.
Informed Consent Statement
Not applicable.
Data Availability Statement
Data available from Refinitiv Eikon.
Acknowledgments
F.M.P. is grateful for the kind support of the Doctoral School of Accounting, Bucharest University of Economic Studies, Romania. The authors would like to thank the Editors and Reviewers for their kind consideration of this article and the numerous comments which significantly improved each version.
Conflicts of Interest
The authors declare no conflicts of interest.
Acronym List
| ASviS | Alleanza Italiana per lo Sviluppo Sostenibile |
| CPR | Construction Products Regulation |
| CSR | Corporate Social Responsibility |
| ESG | Environmental, Social and Governance |
| EU | European Union |
| FAO | Food and Agriculture Organization of the United Nations |
| GDP | Gross Domestic Product |
| GHG(s) | Greenhouse Gas(es) |
| IEA | International Energy Agency |
| IUCN | International Union for Conservation of Nature |
| LSEG | London Stock Exchange Group |
| MDG | Millennium Development Goals |
| NACE | Nomenclature statistique des Activités économiques dans la Communauté Européenne (the European Nomenclature of Economic Activities) |
| NGO | Non-Governmental Organization |
| OECD | Organisation for Economic Co-operation and Development |
| SD | Sustainable Development |
| SDG | Sustainable Development Goals |
| SMEs | Small and Medium-sized Enterprises |
| SSCM | Sustainable Supply Chain Management |
| TRBC | Thomson Reuters Business Classification |
| UK | United Kingdom |
| UN | United Nations |
| UNDESA | United Nations Department of Economic and Social Affairs |
| V4 | Visegrád Group countries |
| WHO | World Health Organization |
Appendix A
Table A1.
Matrix of sustainability policies linked to SDGs.
Table A1.
Matrix of sustainability policies linked to SDGs.
| Policy | Index (Refinitiv) | Word Search | SDG and Related Targets | ||||||||||||||||
|---|---|---|---|---|---|---|---|---|---|---|---|---|---|---|---|---|---|---|---|
| 1 | 2 | 3 | 4 | 5 | 6 | 7 | 8 | 9 | 10 | 11 | 12 | 13 | 14 | 15 | 16 | 17 | |||
| p_ANT | Animal Testing | “animal”, “test” | 2.5 | 12.3 | |||||||||||||||
| p_ARR | Analytic Resource Red Policy | “natural”, “resources” | 11.4 | 12.2 | 14.7 | 15.5 | |||||||||||||
| p_AWB | Animal Well-being | “animal” | 15.C | ||||||||||||||||
| p_EEF | Policy Energy Efficiency | “energy” | 7.3 | ||||||||||||||||
| p_EMS | Policy Emissions | “emission” | 9.4 | ||||||||||||||||
| p_ESC | Policy Env Supply Chain | “impact”, “supply”, “chain” | 7.B | 12.3 | 14.2 | ||||||||||||||
| p_FFD | Fossil Fuel Divestment Policy | “fossil”, “fuel” | 7.A | 12.C | |||||||||||||||
| p_GBD | Green Buildings | “green”, “office” “building” | 11.7 | ||||||||||||||||
| p_LBW | Labeled Wood | “forest”, “wood” | 6.6 | 15.1 | |||||||||||||||
| p_PER | Product Environmental Responsible Use | “product”, “responsible”, “cost”, “effective” “emissions”, “pollution” “noise” | 3.9 | 6.3 | 9.4 | 14.1 | |||||||||||||
| p_PNS | Policy Nuclear Safety | “nuclear”, “disaster” | 11.5 | ||||||||||||||||
| p_SPK | Policy Sustainable Packaging | “pack *”, “containers” “biodegradable” | |||||||||||||||||
| p_TRI | Takeback Recycling Initiatives | “take back”, “recyc *” | 12.5 | ||||||||||||||||
| p_WEF | Policy Water Efficiency | “water” | 3.9 | 6.4 | 12.4 | ||||||||||||||
| p_WRI | Waste Reduction Initiatives | “waste”, “recycle”, “reduce” “reuse”, “substitute”, “treat” | 6.A | 11.6 | 12.4 | 14.1 | |||||||||||||
| p_AHR | Analytic Human Rights Policy | “child”, “labor”, “forced” “vulnerable” | 1.4 | 8.7 | 16.2 | ||||||||||||||
| p_CDL | Policy Child Labor | “child”, “labor” | 8.7 | 16.2 | |||||||||||||||
| p_CDV | Policy Career Development | “skills”, “training”, “career” | 4.4 | 8.6 | |||||||||||||||
| p_DOP | Policy Diversity Opportunity | “diversity”, “equality”, “minorities”, “race” “ethnicity”, “religion” | 5.C | 10.2 | |||||||||||||||
| p_EHS | Employee Health Safety Policy | “health”, “safety”, “accidents” “employ *” | 3.8 | 8.8 | 12.4 | ||||||||||||||
| p_FAS | Policy Freedom of Association | “freedom”, “association” | 16.10 | ||||||||||||||||
| p_FLB | Policy Forced Labor | “forced”, “labour” | 8.7 | ||||||||||||||||
| p_SHS | Supply Chain HS Policy | “health”, “safety” | 3.8 | 8.8 | |||||||||||||||
| p_STR | Policy Skills Training | “skills”, “training” | 4.4 | 8.6 | |||||||||||||||
Note. Asterisks (*) are used to format the search phrase to take into account word suffixes.
Table A2.
Number of companies that apply the SDGs in each country and industry.
Table A2.
Number of companies that apply the SDGs in each country and industry.
| Industry | AUT | BEL | BGR | CZE | DNK | FIN | FRA | DEU | GRC | HUN | IRL | ITA | LUX | NLD | POL | PRT | ROU | SVK | SVN | ESP | SWE | Total |
|---|---|---|---|---|---|---|---|---|---|---|---|---|---|---|---|---|---|---|---|---|---|---|
| A | 0 | 0 | 0 | 0 | 2 | 0 | 1 | 3 | 0 | 0 | 1 | 0 | 0 | 1 | 1 | 0 | 0 | 0 | 0 | 0 | 3 | 12 |
| B | 1 | 0 | 0 | 0 | 1 | 1 | 2 | 2 | 1 | 0 | 0 | 0 | 0 | 2 | 1 | 0 | 0 | 0 | 0 | 1 | 3 | 15 |
| C | 10 | 15 | 0 | 0 | 21 | 29 | 36 | 58 | 2 | 2 | 4 | 36 | 0 | 17 | 3 | 3 | 1 | 0 | 1 | 6 | 89 | 333 |
| D | 1 | 1 | 0 | 1 | 2 | 1 | 4 | 6 | 2 | 0 | 0 | 7 | 0 | 1 | 1 | 3 | 0 | 0 | 0 | 4 | 2 | 36 |
| E | 0 | 0 | 0 | 0 | 0 | 0 | 0 | 0 | 0 | 0 | 0 | 0 | 0 | 0 | 0 | 0 | 0 | 0 | 0 | 0 | 0 | 0 |
| F | 2 | 2 | 0 | 0 | 4 | 3 | 7 | 2 | 0 | 0 | 1 | 3 | 0 | 1 | 0 | 1 | 0 | 0 | 0 | 2 | 12 | 40 |
| G | 0 | 3 | 0 | 0 | 4 | 6 | 14 | 24 | 0 | 0 | 0 | 11 | 0 | 1 | 5 | 1 | 0 | 0 | 0 | 3 | 32 | 104 |
| H | 1 | 2 | 0 | 0 | 7 | 1 | 3 | 6 | 1 | 0 | 0 | 4 | 0 | 3 | 1 | 1 | 0 | 0 | 0 | 1 | 2 | 33 |
| I | 1 | 1 | 0 | 0 | 1 | 1 | 6 | 2 | 0 | 0 | 1 | 1 | 0 | 0 | 0 | 0 | 0 | 0 | 0 | 3 | 7 | 24 |
| J | 2 | 2 | 0 | 0 | 4 | 7 | 5 | 11 | 0 | 1 | 0 | 7 | 0 | 1 | 2 | 1 | 0 | 0 | 1 | 3 | 13 | 60 |
| K | 6 | 12 | 0 | 1 | 6 | 4 | 15 | 15 | 2 | 0 | 4 | 15 | 0 | 11 | 7 | 0 | 0 | 1 | 1 | 9 | 18 | 127 |
| L | 2 | 0 | 0 | 0 | 0 | 2 | 2 | 7 | 0 | 0 | 0 | 0 | 0 | 1 | 0 | 0 | 0 | 0 | 0 | 3 | 23 | 40 |
| M | 0 | 0 | 0 | 0 | 3 | 1 | 8 | 3 | 0 | 0 | 0 | 3 | 0 | 1 | 0 | 0 | 0 | 0 | 0 | 4 | 13 | 36 |
| N | 0 | 0 | 0 | 0 | 0 | 0 | 0 | 0 | 0 | 0 | 0 | 1 | 0 | 2 | 0 | 0 | 0 | 0 | 0 | 0 | 1 | 4 |
| O | 1 | 0 | 0 | 0 | 0 | 0 | 3 | 2 | 0 | 0 | 0 | 1 | 0 | 0 | 0 | 0 | 0 | 0 | 0 | 0 | 3 | 10 |
| P | 0 | 0 | 0 | 0 | 0 | 0 | 0 | 0 | 0 | 0 | 0 | 0 | 0 | 0 | 0 | 0 | 0 | 0 | 0 | 0 | 2 | 2 |
| Q | 0 | 0 | 0 | 0 | 0 | 1 | 1 | 2 | 0 | 0 | 0 | 1 | 0 | 0 | 0 | 0 | 0 | 0 | 0 | 0 | 3 | 8 |
| R | 0 | 0 | 0 | 0 | 0 | 0 | 4 | 2 | 0 | 0 | 0 | 2 | 0 | 2 | 0 | 0 | 0 | 0 | 0 | 2 | 2 | 14 |
| S | 0 | 0 | 0 | 0 | 0 | 0 | 0 | 0 | 0 | 0 | 0 | 0 | 0 | 0 | 0 | 0 | 0 | 0 | 0 | 0 | 0 | 0 |
| T | 0 | 0 | 0 | 0 | 0 | 0 | 0 | 0 | 0 | 0 | 0 | 0 | 0 | 0 | 0 | 0 | 0 | 0 | 0 | 0 | 0 | 0 |
| U | 0 | 0 | 0 | 0 | 0 | 0 | 0 | 0 | 0 | 0 | 0 | 0 | 0 | 0 | 0 | 0 | 0 | 0 | 0 | 0 | 0 | 0 |
| Total | 27 | 38 | 0 | 2 | 55 | 57 | 111 | 145 | 8 | 3 | 11 | 92 | 0 | 44 | 21 | 10 | 1 | 1 | 3 | 41 | 228 | 898 |
Note. Industries are expressed as NACE codes rev.2.0. Country abbreviations follow the ISO country codes (three letters).
Table A3.
Number of companies that adopted sustainability policies in each country and industry.
Table A3.
Number of companies that adopted sustainability policies in each country and industry.
| Industry | AUT | BEL | BGR | CZE | DNK | FIN | FRA | DEU | GRC | HUN | IRL | ITA | LUX | NLD | POL | PRT | ROU | SVK | SVN | ESP | SWE | Total |
|---|---|---|---|---|---|---|---|---|---|---|---|---|---|---|---|---|---|---|---|---|---|---|
| A | 0 | 0 | 0 | 0 | 2 | 0 | 0 | 2 | 0 | 0 | 1 | 0 | 0 | 1 | 1 | 0 | 0 | 0 | 0 | 0 | 0 | 7 |
| B | 1 | 0 | 0 | 0 | 1 | 1 | 2 | 3 | 0 | 0 | 0 | 0 | 0 | 2 | 2 | 0 | 0 | 0 | 0 | 1 | 7 | 20 |
| C | 10 | 17 | 0 | 0 | 21 | 27 | 49 | 85 | 2 | 1 | 3 | 39 | 0 | 12 | 3 | 1 | 2 | 0 | 1 | 8 | 110 | 391 |
| D | 1 | 1 | 0 | 1 | 2 | 1 | 5 | 9 | 2 | 0 | 0 | 7 | 0 | 1 | 1 | 3 | 1 | 0 | 0 | 4 | 3 | 42 |
| E | 0 | 0 | 0 | 0 | 0 | 0 | 0 | 0 | 0 | 0 | 0 | 0 | 0 | 0 | 0 | 0 | 0 | 0 | 0 | 0 | 0 | 0 |
| F | 2 | 2 | 0 | 0 | 7 | 4 | 9 | 5 | 1 | 1 | 1 | 3 | 0 | 2 | 0 | 1 | 0 | 0 | 0 | 3 | 16 | 57 |
| G | 0 | 2 | 0 | 0 | 1 | 4 | 5 | 8 | 0 | 0 | 0 | 7 | 0 | 0 | 4 | 1 | 0 | 0 | 0 | 2 | 9 | 43 |
| H | 1 | 1 | 0 | 0 | 3 | 0 | 1 | 4 | 1 | 0 | 0 | 0 | 0 | 2 | 0 | 1 | 0 | 0 | 0 | 1 | 2 | 17 |
| I | 1 | 0 | 0 | 0 | 0 | 0 | 3 | 0 | 0 | 0 | 1 | 0 | 0 | 0 | 0 | 0 | 0 | 0 | 0 | 2 | 1 | 8 |
| J | 1 | 2 | 0 | 0 | 5 | 11 | 15 | 28 | 0 | 1 | 0 | 12 | 1 | 1 | 3 | 2 | 1 | 0 | 1 | 3 | 30 | 117 |
| K | 6 | 5 | 1 | 1 | 5 | 3 | 8 | 21 | 3 | 1 | 3 | 14 | 1 | 4 | 9 | 0 | 0 | 2 | 1 | 9 | 25 | 122 |
| L | 3 | 0 | 0 | 0 | 0 | 2 | 2 | 10 | 0 | 0 | 0 | 0 | 0 | 1 | 0 | 0 | 0 | 0 | 0 | 3 | 23 | 44 |
| M | 0 | 2 | 0 | 0 | 3 | 2 | 12 | 7 | 0 | 0 | 0 | 3 | 0 | 1 | 0 | 0 | 0 | 0 | 0 | 4 | 18 | 52 |
| N | 0 | 0 | 0 | 0 | 0 | 0 | 2 | 2 | 0 | 0 | 0 | 1 | 0 | 2 | 0 | 0 | 0 | 0 | 0 | 0 | 4 | 11 |
| O | 0 | 0 | 0 | 0 | 0 | 0 | 0 | 0 | 0 | 0 | 0 | 0 | 0 | 0 | 0 | 0 | 0 | 0 | 0 | 0 | 0 | 0 |
| P | 0 | 0 | 0 | 0 | 0 | 0 | 0 | 0 | 0 | 0 | 0 | 0 | 0 | 0 | 0 | 0 | 0 | 0 | 0 | 0 | 0 | 0 |
| Q | 0 | 0 | 0 | 0 | 0 | 1 | 1 | 4 | 0 | 0 | 0 | 1 | 0 | 0 | 0 | 0 | 0 | 0 | 0 | 0 | 3 | 10 |
| R | 0 | 0 | 0 | 0 | 1 | 0 | 4 | 3 | 1 | 0 | 0 | 0 | 0 | 2 | 0 | 0 | 0 | 0 | 0 | 1 | 6 | 18 |
| S | 0 | 0 | 0 | 0 | 0 | 0 | 0 | 2 | 0 | 0 | 0 | 0 | 0 | 0 | 0 | 0 | 0 | 0 | 0 | 0 | 2 | 4 |
| T | 0 | 0 | 0 | 0 | 0 | 0 | 0 | 0 | 0 | 0 | 0 | 0 | 0 | 0 | 0 | 0 | 0 | 0 | 0 | 0 | 0 | 0 |
| U | 0 | 0 | 0 | 0 | 0 | 0 | 0 | 0 | 0 | 0 | 0 | 0 | 0 | 0 | 0 | 0 | 0 | 0 | 0 | 0 | 0 | 0 |
| Total | 29 | 43 | 1 | 2 | 60 | 69 | 148 | 225 | 12 | 5 | 12 | 107 | 2 | 48 | 26 | 11 | 5 | 2 | 3 | 45 | 291 | 1146 |
Note. Industries are expressed as NACE codes rev.2.0. Country abbreviations follow the ISO country codes (three letters).
Table A4.
Number of companies that apply SDGs for each industry.
Table A4.
Number of companies that apply SDGs for each industry.
| SDG/ Industry | A | B | C | D | F | G | H | I | J | K | L | M | N | O | P | Q | R | Total |
|---|---|---|---|---|---|---|---|---|---|---|---|---|---|---|---|---|---|---|
| SDG 1 | 0 | 1 | 58 | 13 | 7 | 15 | 3 | 3 | 6 | 35 | 5 | 7 | 0 | 1 | 1 | 1 | 2 | 158 |
| SDG 2 | 5 | 0 | 58 | 9 | 6 | 16 | 2 | 5 | 4 | 13 | 2 | 4 | 0 | 1 | 1 | 1 | 0 | 127 |
| SDG3 | 6 | 10 | 228 | 18 | 19 | 76 | 20 | 12 | 34 | 79 | 29 | 27 | 2 | 2 | 1 | 8 | 11 | 582 |
| SDG 4 | 1 | 7 | 147 | 19 | 16 | 62 | 19 | 13 | 42 | 83 | 12 | 20 | 4 | 5 | 2 | 6 | 10 | 468 |
| SDG 5 | 5 | 12 | 226 | 26 | 26 | 76 | 21 | 18 | 51 | 97 | 29 | 33 | 4 | 8 | 2 | 4 | 11 | 649 |
| SDG 6 | 2 | 9 | 137 | 17 | 13 | 27 | 5 | 5 | 7 | 25 | 11 | 5 | 0 | 2 | 1 | 2 | 6 | 274 |
| SDG 7 | 5 | 10 | 183 | 36 | 30 | 48 | 19 | 9 | 29 | 85 | 33 | 13 | 1 | 3 | 1 | 3 | 11 | 519 |
| SDG 8 | 10 | 12 | 292 | 35 | 36 | 94 | 30 | 21 | 54 | 110 | 33 | 28 | 4 | 7 | 2 | 8 | 13 | 789 |
| SDG 9 | 5 | 11 | 209 | 32 | 31 | 55 | 21 | 12 | 50 | 70 | 20 | 20 | 1 | 8 | 1 | 5 | 8 | 559 |
| SDG 10 | 0 | 3 | 128 | 18 | 14 | 46 | 18 | 15 | 33 | 52 | 18 | 16 | 3 | 4 | 2 | 2 | 11 | 383 |
| SDG 11 | 1 | 4 | 125 | 27 | 32 | 28 | 11 | 10 | 35 | 75 | 38 | 12 | 1 | 1 | 2 | 1 | 4 | 407 |
| SDG 12 | 10 | 14 | 300 | 32 | 32 | 85 | 26 | 17 | 49 | 92 | 31 | 26 | 1 | 7 | 1 | 5 | 12 | 740 |
| SDG 13 | 9 | 15 | 297 | 36 | 32 | 86 | 30 | 21 | 50 | 116 | 36 | 24 | 2 | 8 | 2 | 6 | 11 | 781 |
| SDG 14 | 0 | 3 | 83 | 15 | 7 | 14 | 8 | 4 | 4 | 15 | 3 | 3 | 1 | 1 | 1 | 1 | 3 | 166 |
| SDG 15 | 6 | 5 | 117 | 25 | 17 | 29 | 5 | 6 | 10 | 39 | 16 | 4 | 0 | 1 | 1 | 1 | 4 | 286 |
| SDG 16 | 3 | 10 | 146 | 19 | 23 | 47 | 16 | 16 | 36 | 67 | 16 | 19 | 1 | 9 | 1 | 5 | 7 | 441 |
| SDG 17 | 3 | 5 | 138 | 22 | 14 | 40 | 22 | 11 | 30 | 56 | 16 | 19 | 2 | 2 | 2 | 2 | 6 | 390 |
| TOTAL | 71 | 131 | 2872 | 399 | 355 | 844 | 276 | 198 | 524 | 1109 | 348 | 280 | 27 | 70 | 24 | 61 | 130 | - |
Note. Industries are expressed as NACE codes rev.2.0.
Table A5.
SDGs observed in previous studies versus the current study.
Table A5.
SDGs observed in previous studies versus the current study.
| Industry | SDGs Identified in Previous Studies | Most Prominent SDGs Identified in the Current Study | Matching SDGs |
|---|---|---|---|
| A (Agriculture, Forestry and Fishing) | SDG 2 [18,166], 12 [166,167], 13 [167], 14 [166,168], 15 [166,167] | SDG 2, 8, 12, 13, 15 | SDG 2, 12, 13, 15 |
| B (Mining and Quarrying) | SDG 3 [169], 8 [169], 13 [169] | SDG 5, 8, 12, 13 | SDG 8, 13 |
| C (Manufacturing) | SDG 1 [170], 2 [170], 3 [171], 6 [172], 8 [171,172,173], 9 [171,172], 10 [172], 11 [172], 12 [171,172,173,174] | SDG 3, 5, 8, 12, 13 | SDG 3, 8, 12 |
| D (Electricity, Gas, Steam and Air Conditioning Supply) | SDG 1 [175], 3 [175], 4 [175], 6 [175], 7 [175,176,177,178], 9 [175,176,178], 11 [176], 12 [175,176,178], 13 [176,177] | SDG 7, 9, 12, 13 | SDG 7, 9, 12, 13 |
| E (Water Supply; Sewerage, Waste Management and Remediation Activities) | SDG 6 [179,180,181], 7 [182], 11 [182], 12 [182,183] | - | SDGs not identified in our study |
| F (Construction) | SDG 12 [184], 13 [184] | SDG 7, 8, 9, 11, 12, 13 | SDG 12, 13 |
| G (Wholesale and Retail Trade; Repair of Motor Vehicles and Motorcycles) | SDG 12 [84,185] | SDG 8, 12, 13 | SDG 12 |
| H (Transportation and Storage) | SDG 3 [186], 7 [186], 11 [186], 12 [186,187] | SDG 8, 12, 13, 17 | SDG 12 |
| I (Accommodation and Food Service Activities) | SDG 12 [188] | SDG 5, 8, 12, 13 | SDG 12 |
| J (Information and Communication) | SDG 1, 2, 3, 4, 5, 8, 9, 10, 11, 16, 17 [189] | SDG 5, 8, 9, 12, 13 | SDG 5, 8 |
| K (Financial and Insurance Activities) | SDG 1 [190], 3 [190,191], 4 [190,191], 5 [190], 8 [190,191], 9 [191], 10 [191], 13 [190], 16 [191] | SDG 5, 8, 12, 13 | SDG 5, 8, 13 |
| L (Real Estate Activities) | SDG 11 [192] | SDG 7, 8, 11, 12, 13 | SDG 11 |
| M (Professional, Scientific and Technical Activities) | SDG 4, 8, 9, 10 [193] | SDG 3, 5, 8, 12 | SDG 8 |
| N (Administrative and Support Service Activities) | SDG 5 [194], 6 [194], 10 [194], 11 [195], 13 [194], 16 [195], 17 [195] | SDG 4, 5, 8 | SDG 5 |
| O (Public Administration and Defense; Compulsory Social Security) | SDG 5 [194], 6 [194], 10 [194], 11 [196], 13 [194] | SDG 5, 9, 13, 16 | SDG 5, 13 |
| P (Education) | SDG 3, 4, 5, 8, 9, 10, 11, 12, 13, 16, 17 [197] | SDG 4, 5, 8, 10, 11, 13, 17 | SDG 4, 5, 8, 10, 11, 13, 17 |
| Q (Human Health and Social Work Activities) | SDG 3 [105,198], 10 [199], 16 [200] | SDG 3, 4, 8, 13 | SDG 3 |
| R (Arts, Entertainment and Recreation) | SDG 2 [201], 3 [201,202], 4 [201,202], 5 [201,202], 8 [201,202], 10 [201,202], 11 [201,203], 12 [202], 13 [201,202], 16 [201,203], 17 [202] | SDG 3, 5, 7, 8, 10, 12, 13 | SDG 3, 5, 8, 10, 12, 13 |
Table A6.
Number of companies that apply sustainability policies for each industry.
Table A6.
Number of companies that apply sustainability policies for each industry.
| Policy/ Industry | A | B | C | D | F | G | H | I | J | K | L | M | N | O | P | Q | R | Total |
|---|---|---|---|---|---|---|---|---|---|---|---|---|---|---|---|---|---|---|
| p_ANT | 0 | 0 | 49 | 0 | 0 | 11 | 0 | 0 | 0 | 7 | 0 | 20 | 0 | 0 | 0 | 3 | 0 | 90 |
| p_ARR | 13 | 20 | 402 | 40 | 42 | 128 | 37 | 30 | 70 | 142 | 42 | 42 | 5 | 14 | 2 | 10 | 18 | 1057 |
| p_AWB | 1 | 0 | 33 | 1 | 0 | 17 | 0 | 7 | 0 | 3 | 1 | 1 | 0 | 0 | 0 | 0 | 1 | 65 |
| p_EEF | 13 | 19 | 384 | 36 | 40 | 115 | 35 | 25 | 61 | 133 | 41 | 36 | 4 | 13 | 1 | 9 | 16 | 981 |
| p_EMS | 12 | 20 | 374 | 40 | 42 | 116 | 37 | 28 | 62 | 139 | 43 | 34 | 5 | 13 | 2 | 10 | 17 | 994 |
| p_ESC | 11 | 18 | 350 | 37 | 37 | 104 | 32 | 24 | 58 | 97 | 34 | 28 | 1 | 12 | 0 | 8 | 13 | 864 |
| p_FFD | 0 | 0 | 0 | 0 | 0 | 0 | 0 | 0 | 0 | 28 | 1 | 0 | 0 | 0 | 0 | 0 | 0 | 29 |
| p_GBD | 1 | 2 | 71 | 8 | 13 | 39 | 13 | 9 | 22 | 71 | 12 | 11 | 2 | 3 | 0 | 2 | 4 | 283 |
| p_LBW | 0 | 0 | 34 | 0 | 2 | 9 | 1 | 1 | 0 | 3 | 0 | 2 | 0 | 0 | 0 | 0 | 2 | 54 |
| p_PER | 7 | 14 | 294 | 40 | 36 | 85 | 11 | 10 | 48 | 107 | 32 | 17 | 0 | 11 | 0 | 3 | 12 | 727 |
| p_PNS | 0 | 0 | 0 | 6 | 2 | 0 | 0 | 0 | 0 | 0 | 0 | 0 | 0 | 0 | 0 | 0 | 0 | 8 |
| p_SPK | 4 | 4 | 181 | 2 | 2 | 67 | 9 | 9 | 19 | 7 | 0 | 2 | 0 | 1 | 0 | 3 | 10 | 320 |
| p_TRI | 2 | 1 | 77 | 2 | 1 | 26 | 1 | 3 | 26 | 4 | 0 | 3 | 0 | 1 | 1 | 1 | 2 | 151 |
| p_WEF | 11 | 19 | 286 | 35 | 21 | 58 | 22 | 14 | 30 | 71 | 29 | 19 | 1 | 10 | 0 | 5 | 11 | 642 |
| p_WRI | 10 | 18 | 372 | 39 | 40 | 114 | 33 | 27 | 64 | 125 | 39 | 39 | 2 | 14 | 1 | 9 | 15 | 961 |
| p_AHR | 13 | 20 | 399 | 40 | 41 | 133 | 38 | 27 | 69 | 139 | 41 | 36 | 5 | 15 | 2 | 9 | 16 | 1043 |
| p_CDL | 13 | 19 | 370 | 36 | 38 | 114 | 35 | 24 | 59 | 112 | 31 | 27 | 3 | 15 | 0 | 6 | 16 | 918 |
| p_CDV | 11 | 19 | 356 | 40 | 42 | 119 | 38 | 30 | 65 | 136 | 38 | 35 | 6 | 13 | 2 | 9 | 15 | 974 |
| p_DOP | 13 | 21 | 410 | 46 | 43 | 137 | 39 | 32 | 74 | 150 | 44 | 45 | 6 | 15 | 2 | 9 | 18 | 1104 |
| p_EHS | 13 | 21 | 400 | 43 | 44 | 133 | 40 | 31 | 69 | 140 | 41 | 47 | 5 | 15 | 2 | 10 | 17 | 1071 |
| p_FAS | 8 | 16 | 299 | 31 | 30 | 80 | 26 | 16 | 40 | 93 | 27 | 21 | 4 | 12 | 0 | 7 | 9 | 719 |
| p_FLB | 13 | 19 | 366 | 37 | 34 | 111 | 34 | 23 | 58 | 111 | 31 | 26 | 3 | 14 | 0 | 5 | 15 | 900 |
| p_SHS | 8 | 15 | 260 | 30 | 25 | 71 | 22 | 17 | 41 | 58 | 25 | 14 | 0 | 8 | 0 | 6 | 10 | 610 |
| p_STR | 10 | 19 | 357 | 42 | 42 | 128 | 36 | 31 | 63 | 135 | 41 | 36 | 6 | 12 | 2 | 10 | 17 | 987 |
| TOTAL | 187 | 304 | 6124 | 631 | 617 | 1915 | 539 | 418 | 998 | 2011 | 593 | 541 | 58 | 211 | 17 | 134 | 254 | - |
Note. Industries are expressed as NACE codes rev.2.0. Policy abbreviations are included in Table A1.
Table A7.
Pearson correlation matrix between the frequencies of SDGs (columns) and p_SDGs (corresponding sustainability policies on rows).
Table A7.
Pearson correlation matrix between the frequencies of SDGs (columns) and p_SDGs (corresponding sustainability policies on rows).
| Correl. | SDG 1 | SDG 2 | SDG 3 | SDG 4 | SDG 5 | SDG 6 | SDG 7 | SDG 8 | SDG 9 | SDG 10 | SDG 11 | SDG 12 | SDG 13 | SDG 14 | SDG 15 | SDG 16 | SDG 17 |
|---|---|---|---|---|---|---|---|---|---|---|---|---|---|---|---|---|---|
| p_SDG1 | 0.122 ** | 0.106 ** | 0.221 ** | 0.182 ** | 0.243 ** | 0.149 ** | 0.203 ** | 0.326 ** | 0.208 ** | 0.176 ** | 0.169 ** | 0.324 ** | 0.313 ** | 0.110 ** | 0.162 ** | 0.187 ** | 0.179 ** |
| p_SDG2 | 0.077 ** | 0.151 ** | 0.120 ** | −0.020 | 0.014 | 0.145 ** | −0.048 | −0.022 | −0.069 * | 0.005 | −0.110 ** | 0.039 | 0.011 | 0.135 ** | 0.092 ** | −0.023 | 0.034 |
| p_SDG3 | 0.071 * | 0.046 | 0.152 ** | 0.156 ** | 0.177 ** | 0.117 ** | 0.164 ** | 0.235 ** | 0.169 ** | 0.121 ** | 0.137 ** | 0.245 ** | 0.258 ** | 0.086 ** | 0.111 ** | 0.139 ** | 0.150 ** |
| p_SDG4 | 0.105 ** | 0.086 ** | 0.198 ** | 0.252 ** | 0.274 ** | 0.160 ** | 0.257 ** | 0.304 ** | 0.218 ** | 0.167 ** | 0.179 ** | 0.299 ** | 0.333 ** | 0.094 ** | 0.147 ** | 0.220 ** | 0.224 ** |
| p_SDG5 | 0.086 ** | 0.076 ** | 0.177 ** | 0.170 ** | 0.212 ** | 0.111 ** | 0.188 ** | 0.282 ** | 0.185 ** | 0.144 ** | 0.125 ** | 0.263 ** | 0.295 ** | 0.089 ** | 0.124 ** | 0.153 ** | 0.155 ** |
| p_SDG6 | 0.126 ** | 0.121 ** | 0.189 ** | 0.182 ** | 0.200 ** | 0.182 ** | 0.234 ** | 0.266 ** | 0.189 ** | 0.150 ** | 0.165 ** | 0.303 ** | 0.335 ** | 0.116 ** | 0.188 ** | 0.154 ** | 0.171 ** |
| p_SDG7 | 0.109 ** | 0.100 ** | 0.202 ** | 0.179 ** | 0.238 ** | 0.161 ** | 0.235 ** | 0.310 ** | 0.206 ** | 0.128 ** | 0.189 ** | 0.319 ** | 0.358 ** | 0.130 ** | 0.167 ** | 0.165 ** | 0.198 ** |
| p_SDG8 | 0.075 * | 0.067 * | 0.153 ** | 0.156 ** | 0.195 ** | 0.094 ** | 0.161 ** | 0.247 ** | 0.155 ** | 0.123 ** | 0.140 ** | 0.213 ** | 0.213 ** | 0.051 | 0.098 ** | 0.139 ** | 0.135 ** |
| p_SDG9 | 0.122 ** | 0.106 ** | 0.192 ** | 0.236 ** | 0.249 ** | 0.177 ** | 0.274 ** | 0.339 ** | 0.237 ** | 0.176 ** | 0.218 ** | 0.330 ** | 0.369 ** | 0.102 ** | 0.168 ** | 0.211 ** | 0.192 ** |
| p_SDG10 | 0.086 ** | 0.076 ** | 0.177 ** | 0.170 ** | 0.212 ** | 0.111 ** | 0.188 ** | 0.282 ** | 0.185 ** | 0.144 ** | 0.125 ** | 0.263 ** | 0.295 ** | 0.089 ** | 0.124 ** | 0.153 ** | 0.155 ** |
| p_SDG11 | 0.092 ** | 0.091 ** | 0.181 ** | 0.162 ** | 0.227 ** | 0.127 ** | 0.204 ** | 0.301 ** | 0.185 ** | 0.113 ** | 0.145 ** | 0.292 ** | 0.303 ** | 0.106 ** | 0.131 ** | 0.166 ** | 0.154 ** |
| p_SDG12 | 0.063 * | 0.067 * | 0.165 ** | 0.149 ** | 0.208 ** | 0.085 ** | 0.154 ** | 0.271 ** | 0.167 ** | 0.125 ** | 0.132 ** | 0.236 ** | 0.257 ** | 0.079 ** | 0.099 ** | 0.141 ** | 0.137 ** |
| p_SDG13 | 0.096 ** | 0.116 ** | 0.190 ** | 0.198 ** | 0.250 ** | 0.154 ** | 0.252 ** | 0.323 ** | 0.212 ** | 0.130 ** | 0.208 ** | 0.317 ** | 0.362 ** | 0.116 ** | 0.173 ** | 0.170 ** | 0.161 ** |
| p_SDG14 | 0.089 ** | 0.079 ** | 0.176 ** | 0.151 ** | 0.212 ** | 0.125 ** | 0.194 ** | 0.275 ** | 0.184 ** | 0.097 ** | 0.156 ** | 0.264 ** | 0.270 ** | 0.092 ** | 0.119 ** | 0.142 ** | 0.134 ** |
| p_SDG15 | 0.104 ** | 0.108 ** | 0.197 ** | 0.177 ** | 0.228 ** | 0.149 ** | 0.220 ** | 0.303 ** | 0.197 ** | 0.130 ** | 0.180 ** | 0.312 ** | 0.336 ** | 0.125 ** | 0.154 ** | 0.170 ** | 0.192 ** |
| p_SDG16 | 0.122 ** | 0.106 ** | 0.221 ** | 0.182 ** | 0.243 ** | 0.149 ** | 0.203 ** | 0.326 ** | 0.208 ** | 0.176 ** | 0.169 ** | 0.324 ** | 0.313 ** | 0.110 ** | 0.162 ** | 0.187 ** | 0.179 ** |
Notes. * p ≤ 0.05, ** p < 0.01. Correlation coefficients in bold are on the diagonal line of this matrix and represent the relationship between each SDG and the corresponding policy, as mapped in Table A1.
References
- Department of Economic and Social Affairs. Transforming Our World: The 2030 Agenda for Sustainable Development. Available online: https://sdgs.un.org/2030agenda (accessed on 12 February 2023).
- Chalmers, A.W.; Klingler-Vidra, R.; van de Wijs, P.P.; van der Lugt, C.; Bailey, T. Carrots & Sticks: Beyond Disclosure in ESG and Sustainability Policy. Annual Report. Available online: https://www.carrotsandsticks.net/ (accessed on 12 February 2023).
- Fukuda-Parr, S.; McNeill, D. Knowledge and Politics in Setting and Measuring the SDG s: Introduction to Special Issue. Glob. Policy 2019, 10, 5–15. [Google Scholar] [CrossRef]
- United Nations Economic and Social Commission for Western Asia. The 5Ps of the Sustainable Development Goals. Available online: https://www.unescwa.org/sites/default/files/inline-files/the_5ps_of_the_sustainable_development_goals.pdf (accessed on 12 February 2023).
- Tosun, J.; Leininger, J. Governing the Interlinkages between the Sustainable Development Goals: Approaches to Attain Policy Integration. Glob. Chall. 2017, 1, 1700036. [Google Scholar] [CrossRef]
- Bali Swain, R.; Yang-Wallentin, F. Achieving Sustainable Development Goals: Predicaments and Strategies. Int. J. Sustain. Dev. World Ecol. 2020, 27, 96–106. [Google Scholar] [CrossRef]
- Jimenez, D.; Franco, I.B.; Smith, T. A Review of Corporate Purpose: An Approach to Actioning the Sustainable Development Goals (SDGs). Sustainability 2021, 13, 3899. [Google Scholar] [CrossRef]
- European Commission. The European Green Deal. Available online: https://commission.europa.eu/strategy-and-policy/priorities-2019-2024/european-green-deal_en (accessed on 31 January 2024).
- European Council. European Green Deal. Available online: https://www.consilium.europa.eu/en/policies/green-deal/ (accessed on 31 January 2024).
- European Commission. Farm to Fork Strategy. Available online: https://food.ec.europa.eu/horizontal-topics/farm-fork-strategy_en (accessed on 31 January 2024).
- European Commission. Circular Economy Action Plan. Available online: https://environment.ec.europa.eu/strategy/circular-economy-action-plan_en (accessed on 31 January 2024).
- European Commission. A New Circular Economy Action Plan for a Cleaner and More Competitive Europe. Available online: https://eur-lex.europa.eu/resource.html?uri=cellar:9903b325-6388-11ea-b735-01aa75ed71a1.0017.02/DOC_1&format=PDF (accessed on 31 January 2024).
- European Commission. Biodiversity Strategy for 2030. Available online: https://environment.ec.europa.eu/strategy/biodiversity-strategy-2030_en (accessed on 3 January 2024).
- Zhang, D.; Wang, C.; Dong, Y. How Does Firm ESG Performance Impact Financial Constraints? An Experimental Exploration of the COVID-19 Pandemic. Eur. J. Dev. Res. 2023, 35, 219–239. [Google Scholar] [CrossRef]
- Ranjbari, M.; Shams Esfandabadi, Z.; Zanetti, M.C.; Scagnelli, S.D.; Siebers, P.-O.; Aghbashlo, M.; Peng, W.; Quatraro, F.; Tabatabaei, M. Three Pillars of Sustainability in the Wake of COVID-19: A Systematic Review and Future Research Agenda for Sustainable Development. J. Clean. Prod. 2021, 297, 126660. [Google Scholar] [CrossRef]
- Bereczk, A.; Hodine, B.H.; Sasvari, P. Prevalence of the Sustainable Cities and Communities Goal (SDG-11) in the Research Activity of V4 Countries. In Proceedings of the Central and Eastern European eDem and eGov Days 2023, Budapest, Hungary, 14–15 September 2023; ACM: New York, NY, USA; pp. 125–131. [Google Scholar]
- Grzebyk, M.; Stec, M.; Hejdukova, P. Implementation of Sustainable Development Goal 8 in European Union Countries–A Measurement Concept and a Multivariate Comparative Analysis. Sustain. Dev. 2023, 31, 2758–2769. [Google Scholar] [CrossRef]
- Craparo, G.; Cano Montero, E.I.; Santos Peñalver, J.F. Trends in the Circular Economy Applied to the Agricultural Sector in the Framework of the SDGs. Environ. Dev. Sustain. 2023. ahead of print. [Google Scholar] [CrossRef]
- Ali, S.M.; Appolloni, A.; Cavallaro, F.; D’Adamo, I.; Di Vaio, A.; Ferella, F.; Gastaldi, M.; Ikram, M.; Kumar, N.M.; Martin, M.A.; et al. Development Goals towards Sustainability. Sustainability 2023, 15, 9443. [Google Scholar] [CrossRef]
- Kleespies, M.W.; Dierkes, P.W. The Importance of the Sustainable Development Goals to Students of Environmental and Sustainability Studies—A Global Survey in 41 Countries. Humanit. Soc. Sci. Commun. 2022, 9, 218. [Google Scholar] [CrossRef]
- Cernev, T.; Fenner, R. The Importance of Achieving Foundational Sustainable Development Goals in Reducing Global Risk. Futures 2020, 115, 102492. [Google Scholar] [CrossRef]
- Delabre, I.; Alexander, A.; Rodrigues, C. Strategies for Tropical Forest Protection and Sustainable Supply Chains: Challenges and Opportunities for Alignment with the UN Sustainable Development Goals. Sustain. Sci. 2020, 15, 1637–1651. [Google Scholar] [CrossRef]
- Eurostat. Sustainable Development in the European Union: Monitoring Report on Progress towards the SDGs in an EU Context, 2023rd ed.; European Union: Luxembourg, 2023. [Google Scholar]
- Sachs, J.D.; Lafortune, G.; Fuller, G.; Drumm, E. Implementing the SDG Stimulus: Sustainable Development Report 2023; Dublin University Press: Dublin, Ireland, 2023. [Google Scholar]
- Mosse, D. A Relational Approach to Durable Poverty, Inequality and Power. J. Dev. Stud. 2010, 46, 1156–1178. [Google Scholar] [CrossRef]
- Allen, C.; Metternicht, G.; Wiedmann, T. Initial Progress in Implementing the Sustainable Development Goals (SDGs): A Review of Evidence from Countries. Sustain. Sci. 2018, 13, 1453–1467. [Google Scholar] [CrossRef]
- Breuer, A.; Janetschek, H.; Malerba, D. Translating Sustainable Development Goal (SDG) Interdependencies into Policy Advice. Sustainability 2019, 11, 2092. [Google Scholar] [CrossRef]
- Hák, T.; Janoušková, S.; Moldan, B. Sustainable Development Goals: A Need for Relevant Indicators. Ecol. Indic. 2016, 60, 565–573. [Google Scholar] [CrossRef]
- Wang, Y.; Adebayo, T.S.; Ai, F.; Quddus, A.; Umar, M.; Shamansurova, Z. Can Finland Serve as a Model for Other Developed Countries? Assessing the Significance of Energy Efficiency, Renewable Energy, and Country Risk. J. Clean. Prod. 2023, 428, 139306. [Google Scholar] [CrossRef]
- International Trade Administration. Finland—Country Commercial Guide. Available online: https://www.trade.gov/country-commercial-guides/finland-energy (accessed on 28 December 2023).
- Eckerberg, K.; Forsberg, B. Implementing Agenda 21 in Local Government: The Swedish Experience. Local Environ. 1998, 3, 333–347. [Google Scholar] [CrossRef]
- Bie, Q.; Wang, S.; Qiang, W.; Ma, X.; Gu, Z.; Tian, N. Progress toward Sustainable Development Goals and Interlinkages between Them in Arctic Countries. Heliyon 2023, 9, e13306. [Google Scholar] [CrossRef]
- Šebestová, J.; Sroka, W. Sustainable Development Goals and SMEs Decisions: Czech Republic vs. Poland. J. East. Eur. Cent. Asian Res. 2020, 7, 39–50. [Google Scholar] [CrossRef]
- Fura, B.; Wojnar, J.; Kasprzyk, B. Ranking and Classification of EU Countries Regarding Their Levels of Implementation of the Europe 2020 Strategy. J. Clean. Prod. 2017, 165, 968–979. [Google Scholar] [CrossRef]
- Lazăr, D.; Minea, A.; Purcel, A.-A. Pollution and Economic Growth: Evidence from Central and Eastern European Countries. Energy Econ. 2019, 81, 1121–1131. [Google Scholar] [CrossRef]
- Benedek, J.; Ivan, K.; Török, I.; Temerdek, A.; Holobâcă, I. Indicator-based Assessment of Local and Regional Progress toward the Sustainable Development Goals (SDGs): An Integrated Approach from Romania. Sustain. Dev. 2021, 29, 860–875. [Google Scholar] [CrossRef]
- Bompard, E.F.; Corgnati, S.P.; Grosso, D.; Huang, T.; Mietti, G.; Profumo, F. Multidimensional Assessment of the Energy Sustainability and Carbon Pricing Impacts along the Belt and Road Initiative. Renew. Sustain. Energy Rev. 2022, 154, 111741. [Google Scholar] [CrossRef]
- Saladini, F.; Betti, G.; Ferragina, E.; Bouraoui, F.; Cupertino, S.; Canitano, G.; Gigliotti, M.; Autino, A.; Pulselli, F.M.; Riccaboni, A.; et al. Linking the Water-Energy-Food Nexus and Sustainable Development Indicators for the Mediterranean Region. Ecol. Indic. 2018, 91, 689–697. [Google Scholar] [CrossRef]
- Sobczak, E.; Bartniczak, B.; Raszkowski, A. Implementation of the No Poverty Sustainable Development Goal (SDG) in Visegrad Group (V4). Sustainability 2021, 13, 1030. [Google Scholar] [CrossRef]
- Lamichhane, S.; Eğilmez, G.; Gedik, R.; Bhutta, M.K.S.; Erenay, B. Benchmarking OECD Countries’ Sustainable Development Performance: A Goal-Specific Principal Component Analysis Approach. J. Clean. Prod. 2021, 287, 125040. [Google Scholar] [CrossRef]
- Rosati, F.; Faria, L.G.D. Addressing the SDGs in Sustainability Reports: The Relationship with Institutional Factors. J. Clean. Prod. 2019, 215, 1312–1326. [Google Scholar] [CrossRef]
- European Parliament and the Council of the European Union. Directive 2014/95/EU of the European Parliament and of the Council of 22 October 2014 Amending Directive 2013/34/EU as Regards Disclosure of Non-Financial and Diversity Information by Certain Large Undertakings and Groups. Off. J. Eur. Union 2014, L330, 1–9. [Google Scholar]
- European Parliament and the Council of the European Union. Directive (EU) 2022/2464 of the European Parliament and of the Council of 14 December 2022 Amending Regulation (EU) No 537/2014, Directive 2004/109/EC, Directive 2006/43/EC and Directive 2013/34/EU, as Regards Corporate Sustainability Reporting (Text with EEA Relevance). Off. J. Eur. Union 2022, L322, 15. [Google Scholar]
- Fonseca, L.; Ferro, R. Influence of Firms’ Environmental Management and Community Involvement Programs in Their Employees and in the Community. FME Trans. 2015, 43, 370–376. [Google Scholar] [CrossRef]
- Inês, A.; Diniz, A.; Moreira, A.C. A Review of Greenwashing and Supply Chain Management: Challenges ahead. Clean. Environ. Syst. 2023, 11, 100136. [Google Scholar] [CrossRef]
- De Gennaro, D.; Piscopo, G. Pinkwashing and Mansplaining: Individual and Organizational Experiences of Gender Inequality at Work during the COVID-19 Pandemic. Cult. Organ. 2023, 29, 298–314. [Google Scholar] [CrossRef]
- Pizzi, S.; Del Baldo, M.; Caputo, F.; Venturelli, A. Voluntary Disclosure of Sustainable Development Goals in Mandatory Non-financial Reports: The Moderating Role of Cultural Dimension. J. Int. Financ. Manag. Account. 2022, 33, 83–106. [Google Scholar] [CrossRef]
- Van Zanten, J.A.; Van Tulder, R. Multinational Enterprises and the Sustainable Development Goals: An Institutional Approach to Corporate Engagement. J. Int. Bus. Policy 2018, 1, 208–233. [Google Scholar] [CrossRef]
- Nilsson, M.; Chisholm, E.; Griggs, D.; Howden-Chapman, P.; McCollum, D.; Messerli, P.; Neumann, B.; Stevance, A.-S.; Visbeck, M.; Stafford-Smith, M. Mapping Interactions between the Sustainable Development Goals: Lessons Learned and Ways forward. Sustain. Sci. 2018, 13, 1489–1503. [Google Scholar] [CrossRef] [PubMed]
- Leal Filho, W.; Viera Trevisan, L.; Paulino Pires Eustachio, J.H.; Dibbern, T.; Castillo Apraiz, J.; Rampasso, I.; Anholon, R.; Gornati, B.; Morello, M.; Lambrechts, W. Sustainable Supply Chain Management and the UN Sustainable Development Goals: Exploring Synergies towards Sustainable Development. TQM J. 2023. ahead of print. [Google Scholar] [CrossRef]
- Christensen, H.; Hail, L.; Leuz, C. Mandatory CSR and Sustainability Reporting: Economic Analysis and Literature Review; National Bureau of Economic Research: Cambridge, MA, USA, 2019; p. w26169. [Google Scholar]
- Ionescu, G.H.; Firoiu, D.; Tănasie, A.; Sorin, T.; Pîrvu, R.; Manta, A. Assessing the Achievement of the SDG Targets for Health and Well-Being at EU Level by 2030. Sustainability 2020, 12, 5829. [Google Scholar] [CrossRef]
- Hummel, K.; Szekely, M. Disclosure on the Sustainable Development Goals—Evidence from Europe. Account. Eur. 2022, 19, 152–189. [Google Scholar] [CrossRef]
- KPMG. How to Report on the SDGs. Available online: https://assets.kpmg.com/content/dam/kpmg/xx/pdf/2018/02/how-to-report-on-sdgs.pdf (accessed on 18 December 2023).
- Emma, G.-M.; Jennifer, M.-F. Is SDG Reporting Substantial or Symbolic? An Examination of Controversial and Environmentally Sensitive Industries. J. Clean. Prod. 2021, 298, 126781. [Google Scholar] [CrossRef]
- Hatayama, H. The Metals Industry and the Sustainable Development Goals: The Relationship Explored Based on SDG Reporting. Resour. Conserv. Recycl. 2022, 178, 106081. [Google Scholar] [CrossRef]
- IEA. Iron and Steel Technology Roadmap. Available online: https://www.iea.org/reports/iron-and-steel-technology-roadmap (accessed on 4 March 2024).
- Lisowski, S.; Berger, M.; Caspers, J.; Mayr-Rauch, K.; Bäuml, G.; Finkbeiner, M. Criteria-Based Approach to Select Relevant Environmental SDG Indicators for the Automobile Industry. Sustainability 2020, 12, 8811. [Google Scholar] [CrossRef]
- European Parliament Fit for 55: Zero CO2 Emissions for New Cars and Vans in 2035. Available online: https://www.europarl.europa.eu/news/en/press-room/20230210IPR74715/fit-for-55-zero-co2-emissions-for-new-cars-and-vans-in-2035 (accessed on 8 March 2024).
- Diaz Gonçalves, T.; Saporiti Machado, J. Origins of the Sustainability Concept and Its Application to the Construction Sector in the EU. Sustainability 2023, 15, 13775. [Google Scholar] [CrossRef]
- Alawneh, R.; Mohamed Ghazali, F.E.; Ali, H.; Asif, M. Assessing the Contribution of Water and Energy Efficiency in Green Buildings to Achieve United Nations Sustainable Development Goals in Jordan. Build. Environ. 2018, 146, 119–132. [Google Scholar] [CrossRef]
- European Commission. Construction Products Regulation (CPR). Available online: https://single-market-economy.ec.europa.eu/sectors/construction/construction-products-regulation-cpr_en (accessed on 1 March 2024).
- Opoku, A.; Deng, J.; Elmualim, A.; Ekung, S.; Hussien, A.A.; Buhashima Abdalla, S. Sustainable Procurement in Construction and the Realisation of the Sustainable Development Goal (SDG) 12. J. Clean. Prod. 2022, 376, 134294. [Google Scholar] [CrossRef]
- Yu, A.T.W.; Yevu, S.K.; Nani, G. Towards an Integration Framework for Promoting Electronic Procurement and Sustainable Procurement in the Construction Industry: A Systematic Literature Review. J. Clean. Prod. 2020, 250, 119493. [Google Scholar] [CrossRef]
- Ghufran, M.; Aldieri, L.; Pyka, A.; Ali, S.; Bimonte, G.; Senatore, L.; Vinci, C.P. Food Security Assessment in the Light of Sustainable Development Goals: A Post-Paris Agreement Era. Environ. Dev. Sustain. [CrossRef]
- Agovino, M.; Cerciello, M.; Gatto, A. Policy Efficiency in the Field of Food Sustainability. The Adjusted Food Agriculture and Nutrition Index. J. Environ. Manag. 2018, 218, 220–233. [Google Scholar] [CrossRef]
- Pânzaru, R.L.; Firoiu, D.; Ionescu, G.H.; Ciobanu, A.; Medelete, D.M.; Pîrvu, R. Organic Agriculture in the Context of 2030 Agenda Implementation in European Union Countries. Sustainability 2023, 15, 10582. [Google Scholar] [CrossRef]
- Bennetzen, E.H.; Smith, P.; Porter, J.R. Agricultural Production and Greenhouse Gas Emissions from World Regions—The Major Trends over 40 Years. Glob. Environ. Change 2016, 37, 43–55. [Google Scholar] [CrossRef]
- Li, Y.; Rockinger, M. Unfolding the Transitions in Sustainability Reporting. Sustainability 2024, 16, 809. [Google Scholar] [CrossRef]
- Robaina, M.; Villar, J.; Pereira, E.T. The Determinants for a Circular Economy in Europe. Environ. Sci. Pollut. Res. 2020, 27, 12566–12578. [Google Scholar] [CrossRef]
- Bătae, O.M.; Dragomir, V.D.; Feleagă, L. The Relationship between Environmental, Social, and Financial Performance in the Banking Sector: A European Study. J. Clean. Prod. 2021, 290, 125791. [Google Scholar] [CrossRef]
- Pozzoli, M.; Pagani, A.; Paolone, F. The Impact of Audit Committee Characteristics on ESG Performance in the European Union Member States: Empirical Evidence before and during the COVID-19 Pandemic. J. Clean. Prod. 2022, 371, 133411. [Google Scholar] [CrossRef]
- Disli, M.; Yilmaz, M.K.; Mohamed, F.F.M. Board Characteristics and Sustainability Performance: Empirical Evidence from Emerging Markets. Sustain. Account. Manag. Policy J. 2022, 13, 929–952. [Google Scholar] [CrossRef]
- Krasodomska, J.; Zieniuk, P.; Kostrzewska, J. Reporting on Sustainable Development Goals in the European Union: What Drives Companies’ Decisions? Compet. Rev. Int. Bus. J. 2023, 33, 120–146. [Google Scholar] [CrossRef]
- Rosati, F.; Rodrigues, V.P.; Cosenz, F.; Li-Ying, J. Business Model Innovation for the Sustainable Development Goals. Bus. Strategy Environ. 2023, 32, 3752–3765. [Google Scholar] [CrossRef]
- Eurostat. NACE Rev. 2—Statistical Classification of Economic Activities. Available online: https://ec.europa.eu/eurostat/web/products-manuals-and-guidelines/-/ks-ra-07-015 (accessed on 1 November 2023).
- Bennich, T.; Weitz, N.; Carlsen, H. Deciphering the Scientific Literature on SDG Interactions: A Review and Reading Guide. Sci. Total Environ. 2020, 728, 138405. [Google Scholar] [CrossRef]
- Ronzon, T.; Sanjuán, A.I. Friends or Foes? A Compatibility Assessment of Bioeconomy-Related Sustainable Development Goals for European Policy Coherence. J. Clean. Prod. 2020, 254, 119832. [Google Scholar] [CrossRef] [PubMed]
- Natural Earth Data Natural Earth. Free Vector and Raster Map Data at 1:10 m, 1:50 m, and 1:110 m Scales. Available online: https://www.naturalearthdata.com/downloads/ (accessed on 7 March 2024).
- Mainali, B.; Luukkanen, J.; Silveira, S.; Kaivo-oja, J. Evaluating Synergies and Trade-Offs among Sustainable Development Goals (SDGs): Explorative Analyses of Development Paths in South Asia and Sub-Saharan Africa. Sustainability 2018, 10, 815. [Google Scholar] [CrossRef]
- Deloitte. Sustainable Development Goals A Business Perspective. Available online: https://www2.deloitte.com/content/dam/Deloitte/nl/Documents/risk/deloitte-nl-risk-sdgs-from-a-business-perspective.pdf (accessed on 31 January 2024).
- Murphy, E.; Walsh, P.P.; Murphy, E. Nation-Based Peer Assessment of Europe’s Sustainable Development Goal Performance. PLoS ONE 2023, 18, e0287771. [Google Scholar] [CrossRef]
- Chen, J.; Huang, S.; Kamran, H.W. Empowering Sustainability Practices through Energy Transition for Sustainable Development Goal 7: The Role of Energy Patents and Natural Resources among European Union Economies through Advanced Panel. Energy Policy 2023, 176, 113499. [Google Scholar] [CrossRef]
- Amos, R.; Lydgate, E. Trade, Transboundary Impacts and the Implementation of SDG 12. Sustain. Sci. 2020, 15, 1699–1710. [Google Scholar] [CrossRef]
- Correa-Mejía, D.A.; Correa-García, J.A.; García-Benau, M.A. Analysis of Double Materiality in Early Adopters. Are Companies Walking the Talk? Sustain. Account. Manag. Policy J. 2024, 15, 299–329. [Google Scholar] [CrossRef]
- Al Lawati, H.; Hussainey, K. Does Sustainable Development Goals Disclosure Affect Corporate Financial Performance? Sustainability 2022, 14, 7815. [Google Scholar] [CrossRef]
- Martí-Ballester, C.-P. Analysing the Financial Performance of Sustainable Development Goals-Themed Mutual Funds in China. Sustain. Prod. Consum. 2021, 27, 858–872. [Google Scholar] [CrossRef]
- Khan, P.A.; Johl, S.K.; Akhtar, S. Firm Sustainable Development Goals and Firm Financial Performance through the Lens of Green Innovation Practices and Reporting: A Proactive Approach. J. Risk Financ. Manag. 2021, 14, 605. [Google Scholar] [CrossRef]
- Abughniem, M.S.; Aishat, M.A.H.A.A.A.; Hamdan, A.H. Corporate Sustainability as an Antecedent to the Financial Performance: An Empirical Study. Pol. J. Manag. Stud. 2019, 20, 35–44. [Google Scholar] [CrossRef]
- Siedschlag, I.; Yan, W. Do Green Investments Improve Firm Performance? Empirical Evidence from Ireland. Technol. Forecast. Soc. Chang. 2023, 186, 122181. [Google Scholar] [CrossRef]
- Qalati, S.A.; Barbosa, B.; Iqbal, S. The Effect of Firms’ Environmentally Sustainable Practices on Economic Performance. Econ. Res.-Ekon. Istraživanja 2023, 36, 2199822. [Google Scholar] [CrossRef]
- Pham, D.C.; Do, T.N.A.; Doan, T.N.; Nguyen, T.X.H.; Pham, T.K.Y. The Impact of Sustainability Practices on Financial Performance: Empirical Evidence from Sweden. Cogent Bus. Manag. 2021, 8, 1912526. [Google Scholar] [CrossRef]
- Song, L.; Zhan, X.; Zhang, H.; Xu, M.; Liu, J.; Zheng, C. How Much Is Global Business Sectors Contributing to Sustainable Development Goals? Sustain. Horiz. 2022, 1, 100012. [Google Scholar] [CrossRef]
- Fortea, C.; Zlati, M.L.; Lazarescu, I. Analysis of the Sustainable Development of the Eastern European Countries from the Perspective of the Transition to the Green Economy. Ovidius Univ. Ann. Econ. Sci. Ser. 2023, 23, 914–922. [Google Scholar]
- Huang, R. SDG-Oriented Sustainability Assessment for Central and Eastern European Countries. Environ. Sustain. Indic. 2023, 19, 100268. [Google Scholar] [CrossRef]
- Jakovljevic, M.; Cerda, A.A.; Liu, Y.; García, L.; Timofeyev, Y.; Krstic, K.; Fontanesi, J. Sustainability Challenge of Eastern Europe—Historical Legacy, Belt and Road Initiative, Population Aging and Migration. Sustainability 2021, 13, 11038. [Google Scholar] [CrossRef]
- Markowski, Ł.; Kotliński, K.; Ostrowska, A. Sustainable Consumption and Production in the European Union—An Attempt to Assess Changes and Convergence from the Perspective of Central and Eastern European Countries. Sustainability 2023, 15, 16485. [Google Scholar] [CrossRef]
- Bălăcescu, A.; Zaharia, M.; Gogonea, R.-M.; Căruntu, G.A. The Image of Sustainability in European Regions Considering the Social Sustainability Index. Sustainability 2022, 14, 13433. [Google Scholar] [CrossRef]
- Ahlström, H.; Sjåfjell, B. Why Policy Coherence in the European Union Matters for Global Sustainability. Environ. Policy Gov. 2023, 33, 272–287. [Google Scholar] [CrossRef]
- Rădoiu, A. Romania’s Challenges and Perspectives in Achieving Sustainable Development Goals. Int. Conf. Knowl.-Based Organ. 2020, 26, 251–256. [Google Scholar] [CrossRef]
- United Nations Global Compact; KPMG SDG Industry Matrix. Available online: https://assets.kpmg.com/content/dam/kpmg/xx/pdf/2017/05/sdg-financial-services.pdf (accessed on 31 January 2024).
- KPMG. Reporting on the UN Sustainable Development Goals. Available online: https://kpmg.com/xx/en/home/insights/2022/09/survey-of-sustainability-reporting-2022/sdg.html (accessed on 22 January 2024).
- United Nations. Development Programme Global Trends: Challenges and Opportunities in the Implementation of the SDGs. Available online: https://www.undp.org/publications/global-trends-challenges-and-opportunities-implementation-sdgs (accessed on 2 February 2024).
- Boffo, R.; Patalano, R. ESG Investing: Practices, Progress and Challenges. Available online: https://www.oecd.org/finance/ESG-Investing-Practices-Progress-Challenges.pdf (accessed on 31 January 2024).
- Yang, S.; Zhao, W.; Liu, Y.; Cherubini, F.; Fu, B.; Pereira, P. Prioritizing Sustainable Development Goals and Linking Them to Ecosystem Services: A Global Expert’s Knowledge Evaluation. Geogr. Sustain. 2020, 1, 321–330. [Google Scholar] [CrossRef]
- The Economist. Closing the Gap. Available online: https://www.economist.com/special-report/2011/11/26/closing-the-gap (accessed on 1 February 2024).
- Förster, J. Cooling for Electricity Production Dominates Water Use in Industry. Available online: https://ec.europa.eu/eurostat/statistics-explained/index.php?title=Archive:Water_use_in_industry (accessed on 1 February 2024).
- Covert, T.; Greenstone, M.; Knittel, C.R. Will We Ever Stop Using Fossil Fuels? J. Econ. Perspect. 2016, 30, 117–138. [Google Scholar] [CrossRef]
- Abdou, A.H.; Hassan, T.H.; El Dief, M.M. A Description of Green Hotel Practices and Their Role in Achieving Sustainable Development. Sustainability 2020, 12, 9624. [Google Scholar] [CrossRef]
- United Nations. Paris Agreement. Available online: https://unfccc.int/files/essential_background/convention/application/pdf/english_paris_agreement.pdf (accessed on 3 February 2024).
- Deloitte. Professionalising the Ocean Cleanup. Available online: https://www2.deloitte.com/nl/nl/pages/over-deloitte/articles/the-ocean-cleanup.html (accessed on 3 February 2024).
- Sustainable Development Solutions Network. Sustainable Development Report 2023. Available online: https://s3.amazonaws.com/sustainabledevelopment.report/2023/sustainable-development-report-2023.pdf (accessed on 19 January 2024).
- United Nations. Towards Sustainable Welfare—The 2030 Agenda. Available online: https://www.eea.europa.eu/themes/sustainability-transitions/sustainable-development-goals-and-the/country-profiles/sweden-country-profile-sdgs-and (accessed on 25 January 2024).
- Government of Sweden. The Global Goals and the 2030 Agenda for Sustainable Development. Available online: https://www.government.se/government-policy/the-global-goals-and-the-2030-Agenda-for-sustainable-development/ (accessed on 27 March 2024).
- Saeed, S.; Makhdum, M.S.A.; Anwar, S.; Yaseen, M.R. Climate Change Vulnerability, Adaptation, and Feedback Hypothesis: A Comparison of Lower-Middle, Upper-Middle, and High-Income Countries. Sustainability 2023, 15, 4145. [Google Scholar] [CrossRef]
- Sweden Sverige. Energy Use in Sweden. Available online: https://sweden.se/climate/sustainability/energy-use-in-sweden (accessed on 5 January 2024).
- Insightful Team. How Sweden Continues to Set the Benchmark as One of the World’s Most Sustainable Countries. Available online: https://www.insightvacations.com/blog/sweden-worlds-most-sustainable-countries/ (accessed on 5 January 2024).
- Hexagon. Hexagon’s R-Evolution Launches Its Renewable Energy Project Portfolio with a Focus on Digitalising Solar Production. Available online: https://hexagon.com/company/newsroom/press-releases/2021/hexagons-r-evolution-renewable-energy-project (accessed on 1 January 2024).
- Vattenfall. Sustainable Production. Available online: https://group.vattenfall.com/what-we-do/roadmap-to-fossil-freedom/sustainable-production (accessed on 31 January 2024).
- Scania. Renewable Fuels. Available online: https://www.scania.com/group/en/home/innovation/technology/renewable-fuels.html (accessed on 31 January 2024).
- World Health Organization. WHO Global Air Quality Guidelines: Particulate Matter (PM2.5 and PM10), Ozone, Nitrogen Dioxide, Sulfur Dioxide and Carbon Monoxide; WHO European Centre for Environment and Health: Bonn, Germany, 2021; ISBN 978-92-4-003422-8. [Google Scholar]
- Haseler, M.; Balciunas, A.; Hauk, R.; Sabaliauskaite, V.; Chubarenko, I.; Ershova, A.; Schernewski, G. Marine Litter Pollution in Baltic Sea Beaches—Application of the Sand Rake Method. Front. Environ. Sci. 2020, 8, 599978. [Google Scholar] [CrossRef]
- Neste. The Baltic Sea—Vulnerable and Unique. Available online: https://journeytozerostories.neste.com/sustainability/baltic-sea-vulnerable-and-unique#dc90d05a (accessed on 25 January 2024).
- OECD. The Short and Winding Road to 2030: Measuring Distance to the SDG Targets; OECD: Paris, France, 2022; ISBN 978-92-64-34190-6. [Google Scholar]
- Die Bundesregierung G7: The Group of the Seven. Available online: https://www.g7germany.de/g7-en/g7-summit/g7-members (accessed on 19 January 2024).
- The World Bank. Value Added (% of GDP)—Germany. Available online: https://data.worldbank.org/indicator/NV.SRV.TOTL.ZS?locations=DE (accessed on 22 January 2024).
- Statista. Germany: Share of Economic Sectors in Gross Domestic Product (GDP) in 2022. Available online: https://www.statista.com/statistics/295519/germany-share-of-economic-sectors-in-gross-domestic-product/ (accessed on 22 January 2024).
- Eurostat. Sustainable Development Indicators. Available online: https://ec.europa.eu/eurostat/databrowser/explore/all/tb_eu?lang=en&subtheme=sdg&display=list&sort=category (accessed on 19 January 2024).
- Sustainable Development Goals Knowledge Platform. Germany. Available online: https://sustainabledevelopment.un.org/memberstates/germany (accessed on 19 January 2024).
- European Institute for Gender Equality Gender Equality Index. Available online: https://eige.europa.eu/gender-equality-index/2023/country (accessed on 27 February 2024).
- The World Bank. Services, Value Added (% of GDP)—France. Available online: https://data.worldbank.org/indicator/NV.SRV.TOTL.ZS?end=2022&locations=FR&start=2022&view=chart (accessed on 19 January 2024).
- République Française. Pôle Emploi: BMO 2023. Available online: https://statistiques.pole-emploi.org/bmo (accessed on 19 January 2023).
- Organisation for Economic Co-Operation and Development Employment: Time Spent in Paid and Unpaid Work, by Sex. Available online: https://stats.oecd.org/index.aspx?queryid=54757 (accessed on 5 January 2024).
- Convention on Biological Diversity Aichi Biodiversity Targets. Available online: https://www.cbd.int/sp/targets/ (accessed on 13 January 2024).
- Alleanza Italiana per lo Sviluppo Sostenibile. ASviS—Who We Are. Available online: https://asvis.it/who-we-are/ (accessed on 25 January 2024).
- Istituto Nazionale di Statistica. 2022 SDGs Report. Available online: https://www.istat.it/it/files//2023/05/2022-SDGS-Report_Inglese.pdf (accessed on 25 January 2024).
- The World Bank. GDP—Italy. Available online: https://data.worldbank.org/indicator/NY.GDP.MKTP.CD?locations=IT (accessed on 25 January 2024).
- The IUCN Red List of Threatened Species. The Mediterranean Red List of Species. Available online: https://www.iucnredlist.org/ (accessed on 25 January 2024).
- European Commission. Air Quality: Commission Urges Italy to Take Action against Small Particulate Matter (PM10) to Safeguard Public Health. Available online: https://ec.europa.eu/commission/presscorner/detail/ET/IP_17_1046 (accessed on 25 January 2024).
- Jaume, T.; Ripoll, A.; Banyuls, L.; Ortiz, A.G.; Soares, J. Status Report of Air Quality in Europe for Year 2022, Using Validated and up-to-Date Data (ETC-HE Report 2023/2); European Environment Agency: Copenhagen, Denmark, 2023. [Google Scholar]
- HitHorizons. Industry Breakdown of Companies in Romania. Available online: https://www.hithorizons.com/eu/analyses/country-statistics/romania (accessed on 26 January 2024).
- Christiaensen, L.; Demery, L.; Kuhl, J. The (Evolving) Role of Agriculture in Poverty Reduction—An Empirical Perspective. J. Dev. Econ. 2011, 96, 239–254. [Google Scholar] [CrossRef]
- OECD. Poverty Rate; OECD: Paris, France, 2021. [Google Scholar]
- Federatia Bancilor pentru Alimente din Romania Banca Pentru Alimente Bucuresti. Available online: https://bucuresti.bancapentrualimente.ro/ (accessed on 27 January 2024).
- Eurostat. Annual National Accounts. Available online: https://ec.europa.eu/eurostat/databrowser/explore/all/economy?lang=en&subtheme=na10.nama10&display=list&sort=category (accessed on 26 January 2024).
- Climate Trade. The World’s Most Polluting Industries. Available online: https://climatetrade.com/the-worlds-most-polluting-industries/ (accessed on 29 January 2024).
- The Department of Sustainable Development, as Part of the Working Apparatus of the Romanian Government Romania’s Sustainable Development Strategy 2030. Available online: https://dezvoltaredurabila.gov.ro/files/public/10000001/Romania-Sustainable-Development-Strategy-2030-en.pdf (accessed on 5 January 2024).
- Stănescu, I.; Bilan, A. Voluntary Subnational Review 2023: Localising the UN 2030 Agenda Sustainable Development Goals in Romanian Municipalities and Communes. Available online: https://hlpf.un.org/sites/default/files/vnrs/2023/VNR%202023%20Romania%20Report%20Subnational%20Report.pdf (accessed on 27 January 2024).
- Sustainable Development. Goals Knowledge Platform Romania. Available online: https://sustainabledevelopment.un.org/memberstates/romania (accessed on 29 January 2024).
- Eurostat. Expenditure on Social Protection (2010–2021). Available online: https://ec.europa.eu/eurostat/databrowser/product/view/spr_exp_sum (accessed on 2 February 2024).
- Firoiu, D.; Ionescu, G.H.; Băndoi, A.; Florea, N.M.; Jianu, E. Achieving Sustainable Development Goals (SDG): Implementation of the 2030 Agenda in Romania. Sustainability 2019, 11, 2156. [Google Scholar] [CrossRef]
- Radu, O.-M.; Dragomir, V.D.; Ionescu-Feleagă, L. The Link between Corporate ESG Performance and the UN Sustainable Development Goals. Proc. Int. Conf. Bus. Excell. 2023, 17, 776–790. [Google Scholar] [CrossRef]
- World Bank. Bulgaria. Available online: https://data.worldbank.org/indicator/NV.SRV.TOTL.ZS?locations=BG (accessed on 29 January 2024).
- United Nations. Economic and Social Affairs Voluntary National Review: Sustainable Development Goals—Bulgaria. Available online: https://sustainabledevelopment.un.org/content/documents/26289VNR_2020_Bulgaria_Report.pdf (accessed on 29 January 2024).
- Batembergska, L.; Dimitrova, N.; Georgiev, Y. The Link between the Implementation of the UN Sustainable Development Goals in Bulgaria and the Migration; Bulgarian Platform for International Development: Sofia, Bulgaria, 2020; Available online: https://gcap.global/wp-content/uploads/2021/02/Monitoring-report-2020-BPID.pdf (accessed on 29 January 2024).
- Ionescu, G.H.; Jianu, E.; Patrichi, I.C.; Ghiocel, F.; Țenea, L.; Iancu, D. Assessment of Sustainable Development Goals (SDG) Implementation in Bulgaria and Future Developments. Sustainability 2021, 13, 12000. [Google Scholar] [CrossRef]
- OECD. PISA 2022 Results. Available online: https://www.oecd.org/publication/pisa-2022-results/ (accessed on 2 February 2024).
- Dimitrov, I. Challenges for the Bulgarian Companies in the Implementation of Sustainability Practices. Eur. J. Mark. Econ. 2023, 6, 1–14. [Google Scholar] [CrossRef]
- Kuc-Czarnecka, M.; Markowicz, I.; Sompolska-Rzechuła, A. SDGs Implementation, Their Synergies, and Trade-Offs in EU Countries—Sensitivity Analysis-Based Approach. Ecol. Indic. 2023, 146, 109888. [Google Scholar] [CrossRef]
- CEIC Data. Romania Number of Companies: Bucharest Stock Exchange (BVB): Listed. Available online: https://www.ceicdata.com/en/romania/bucharest-stock-exchange-number-of-companies/number-of-companies-bucharest-stock-exchange-bvb-listed (accessed on 4 February 2024).
- Markopoulos, E.; Barbara Ramonda, M. An ESG-SDGs Alignment and Execution Model Based on the Ocean Strategies Transition in Emerging Markets. In Proceedings of the 13th AHFE International Conference on Creativity, Innovation Entrepreneurship, New York, NY, USA, 24–28 July 2022. [Google Scholar]
- OECD. OECD Guidelines for Multinational Enterprises on Responsible Business Conduct; OECD: Paris, France, 2023; ISBN 978-92-64-60598-5. [Google Scholar]
- Global Reporting Initiative Synergies between the OECD Guidelines for Multinational Enterprises (MNEs) and the GRI 2002 Sustainability Reporting Guidelines. Available online: https://www.oecd.org/corporate/mne/35150230.pdf (accessed on 19 January 2024).
- European Commission. EU ‘Whole-of-Government’ Approach. Available online: https://commission.europa.eu/strategy-and-policy/sustainable-development-goals/eu-whole-government-approach_en (accessed on 16 March 2024).
- Avram, V.; Calu, D.A.; Dumitru, V.F.; Dumitru, M.; Glăvan, M.E.; Jinga, G. The Institutionalization of the Consistency and Comparability Principle in the European Companies. Energies 2018, 11, 3456. [Google Scholar] [CrossRef]
- Miglietta, P.P.; Coluccia, B.; Pacifico, A.M.; Malorgio, G. Tracking on Food and Agriculture-Related SDG Indicators in the Mediterranean Region. New Medit 2023, 4, 56–71. [Google Scholar] [CrossRef]
- Högbom, L.; Abbas, D.; Armolaitis, K.; Baders, E.; Futter, M.; Jansons, A.; Jõgiste, K.; Lazdins, A.; Lukminė, D.; Mustonen, M.; et al. Trilemma of Nordic–Baltic Forestry—How to Implement UN Sustainable Development Goals. Sustainability 2021, 13, 5643. [Google Scholar] [CrossRef]
- Johnson, A.F.; Lidström, S.; Kelling, I.; Williams, C.; Niederműller, S.; Poulsen, K.V.; Burgess, S.; Kent, R.; Davies, W. The European Union’s Fishing Activity Outside of European Waters and the Sustainable Development Goals. Fish Fish. 2021, 22, 532–545. [Google Scholar] [CrossRef]
- Ivic, A.; Saviolidis, N.M.; Johannsdottir, L. Drivers of Sustainability Practices and Contributions to Sustainable Development Evident in Sustainability Reports of European Mining Companies. Discov. Sustain. 2021, 2, 17. [Google Scholar] [CrossRef]
- Marchetti, S.; Secondi, L. The Economic Perspective of Food Poverty and (In)Security: An Analytical Approach to Measuring and Estimation in Italy. Soc. Indic. Res. 2022, 162, 995–1020. [Google Scholar] [CrossRef]
- Mancini, L.; Valente, A.; Barbero Vignola, G.; Sanyé Mengual, E.; Sala, S. Social Footprint of European Food Production and Consumption. Sustain. Prod. Consum. 2023, 35, 287–299. [Google Scholar] [CrossRef]
- Perello-Marin, M.R.; Rodríguez-Rodríguez, R.; Alfaro-Saiz, J.-J. Analysing GRI Reports for the Disclosure of SDG Contribution in European Car Manufacturers. Technol. Forecast. Soc. Change 2022, 181, 121744. [Google Scholar] [CrossRef]
- Malik, A.; Lafortune, G.; Carter, S.; Li, M.; Lenzen, M.; Kroll, C. International Spillover Effects in the EU’s Textile Supply Chains: A Global SDG Assessment. J. Environ. Manag. 2021, 295, 113037. [Google Scholar] [CrossRef]
- Caldeira, C.; De Laurentiis, V.; Corrado, S.; Van Holsteijn, F.; Sala, S. Quantification of Food Waste per Product Group along the Food Supply Chain in the European Union: A Mass Flow Analysis. Resour. Conserv. Recycl. 2019, 149, 479–488. [Google Scholar] [CrossRef]
- Vögele, S.; Govorukha, K.; Mayer, P.; Rhoden, I.; Rübbelke, D.; Kuckshinrichs, W. Effects of a Coal Phase-out in Europe on Reaching the UN Sustainable Development Goals. Environ. Dev. Sustain. 2023, 25, 879–916. [Google Scholar] [CrossRef]
- Momete, D.C. Salient Insights on the Performance of EU Member States on the Road towards an Energy-Efficient Future. Energies 2023, 16, 925. [Google Scholar] [CrossRef]
- Zhao, X.; Ramzan, M.; Sengupta, T.; Deep Sharma, G.; Shahzad, U.; Cui, L. Impacts of Bilateral Trade on Energy Affordability and Accessibility across Europe: Does Economic Globalization Reduce Energy Poverty? Energy Build. 2022, 262, 112023. [Google Scholar] [CrossRef]
- Aydin, M.; Erdem, A. Analyzing the Impact of Resource Productivity, Energy Productivity, and Renewable Energy Consumption on Environmental Quality in EU Countries: The Moderating Role of Productivity. Resour. Policy 2024, 89, 104613. [Google Scholar] [CrossRef]
- Cai, J.; Zhao, D.; Varis, O. Match Words with Deeds: Curbing Water Risk with the Sustainable Development Goal 6 Index. J. Clean. Prod. 2021, 318, 128509. [Google Scholar] [CrossRef]
- Dilekli, N.; Cazcarro, I. Testing the SDG Targets on Water and Sanitation Using the World Trade Model with a Waste, Wastewater, and Recycling Framework. Ecol. Econ. 2019, 165, 106376. [Google Scholar] [CrossRef]
- Ezbakhe, F.; Giné-Garriga, R.; Pérez-Foguet, A. Leaving No One behind: Evaluating Access to Water, Sanitation and Hygiene for Vulnerable and Marginalized Groups. Sci. Total Environ. 2019, 683, 537–546. [Google Scholar] [CrossRef]
- Caglar, A.E.; Gökçe, N.; Şahin, F. Sustaining Environment through Municipal Solid Waste: Evidence from European Union Economies. Environ. Sci. Pollut. Res. 2023, 31, 6040–6053. [Google Scholar] [CrossRef]
- Halkos, G.E.; Aslanidis, P.S.C. Promoting Sustainable Waste Management for Regional Economic Development in European Mediterranean Countries. Euro-Mediterr. J. Environ. Integr. 2023, 8, 767–775. [Google Scholar] [CrossRef]
- Poranek, N.; Łaźniewska-Piekarczyk, B.; Lombardi, L.; Czajkowski, A.; Bogacka, M.; Pikoń, K. Green Deal and Circular Economy of Bottom Ash Waste Management in Building Industry—Alkali (NaOH) Pre-Treatment. Materials 2022, 15, 3487. [Google Scholar] [CrossRef]
- Corrado, S.; Rydberg, T.; Oliveira, F.; Cerutti, A.; Sala, S. Out of Sight out of Mind? A Life Cycle-Based Environmental Assessment of Goods Traded by the European Union. J. Clean. Prod. 2020, 246, 118954. [Google Scholar] [CrossRef]
- Onat, N.C.; Abdella, G.M.; Kucukvar, M.; Kutty, A.A.; Al-Nuaimi, M.; Kumbaroğlu, G.; Bulu, M. How Eco-efficient Are Electric Vehicles across Europe? A Regionalized Life Cycle Assessment-based Eco-efficiency Analysis. Sustain. Dev. 2021, 29, 941–956. [Google Scholar] [CrossRef]
- Barona, J.; Ballini, F.; Canepa, M. Circular Developments of Maritime Industrial Ports in Europe: A Semi-Systematic Review of the Current Situation. J. Shipp. Trade 2023, 8, 25. [Google Scholar] [CrossRef]
- Beretta, C.; Hellweg, S. Potential Environmental Benefits from Food Waste Prevention in the Food Service Sector. Resour. Conserv. Recycl. 2019, 147, 169–178. [Google Scholar] [CrossRef]
- Lyulyov, O.; Pimonenko, T.; Saura, J.R.; Barbosa, B. How Do E-Governance and e-Business Drive Sustainable Development Goals? Technol. Forecast. Soc. Change 2024, 199, 123082. [Google Scholar] [CrossRef]
- Gutiérrez-Fernández, M.; Gallego-Sosa, C.; Fernández-Torres, Y. Commitment to Sustainability in Large European Banks and Its Relationship with Board Gender Diversity: A 2030 Agenda Perspective. J. Manag. Organ. 2023, ahead of print, 1–27. [Google Scholar] [CrossRef]
- Sardianou, E.; Stauropoulou, A.; Evangelinos, K.; Nikolaou, I. A Materiality Analysis Framework to Assess Sustainable Development Goals of Banking Sector through Sustainability Reports. Sustain. Prod. Consum. 2021, 27, 1775–1793. [Google Scholar] [CrossRef]
- Kovalivska, S.; Shcherbyna, A.; Nikolaiev, V. Intensification of Investment in the Renovation of Residential Real Estate in the Context of the Sustainable Development Goals. Balt. J. Econ. Stud. 2020, 6, 184–195. [Google Scholar] [CrossRef]
- Cucco, P.; Maselli, G.; Nesticò, A.; Ribera, F. An Evaluation Model for Adaptive Reuse of Cultural Heritage in Accordance with 2030 SDGs and European Quality Principles. J. Cult. Herit. 2023, 59, 202–216. [Google Scholar] [CrossRef]
- Bisogno, M.; Cuadrado-Ballesteros, B.; Rossi, F.M.; Peña-Miguel, N. Sustainable Development Goals in Public Administrations: Enabling Conditions in Local Governments. Int. Rev. Adm. Sci. 2023, 89, 1223–1242. [Google Scholar] [CrossRef]
- Meuleman, L. Public Administration and Governance for the SDGs: Navigating between Change and Stability. Sustainability 2021, 13, 5914. [Google Scholar] [CrossRef]
- Bielecka, E.; Calka, B. Towards Sustainable Development Exemplified by Monitoring Land Use Efficiency in Europe Using SDG 11.3.1. Misc. Geogr. 2022, 26, 208–214. [Google Scholar] [CrossRef]
- Malešević Perovic, L.; Mihaljević Kosor, M. The Efficiency of Universities in Achieving Sustainable Development Goals. Amfiteatru Econ. 2020, 22, 516–532. [Google Scholar] [CrossRef]
- Pereira, M.A.; Marques, R.C. The ‘Sustainable Public Health Index’: What If Public Health and Sustainable Development Are Compatible? World Dev. 2022, 149, 105708. [Google Scholar] [CrossRef]
- Peña-Sánchez, A.R.; Ruiz-Chico, J.; Jiménez-García, M. Dynamics of Public Spending on Health and Socio-Economic Development in the European Union: An Analysis from the Perspective of the Sustainable Development Goals. Healthcare 2021, 9, 353. [Google Scholar] [CrossRef]
- Bickler, G.; Morton, S.; Menne, B. Health and Sustainable Development: An Analysis of 20 European Voluntary National Reviews. Public Health 2020, 180, 180–184. [Google Scholar] [CrossRef]
- Dai, J.; Menhas, R. Sustainable Development Goals, Sports and Physical Activity: The Localization of Health-Related Sustainable Development Goals through Sports in China: A Narrative Review. Risk Manag. Healthc. Policy 2020, 13, 1419–1430. [Google Scholar] [CrossRef]
- Baena-Morales, S.; Jerez-Mayorga, D.; Delgado-Floody, P.; Martínez-Martínez, J. Sustainable Development Goals and Physical Education. A Proposal for Practice-Based Models. Int. J. Environ. Res. Public Health 2021, 18, 2129. [Google Scholar] [CrossRef]
- Quinn, B.; Colombo, A.; Lindström, K.; McGillivray, D.; Smith, A. Festivals, Public Space and Cultural Inclusion: Public Policy Insights. J. Sustain. Tour. 2021, 29, 1875–1893. [Google Scholar] [CrossRef]

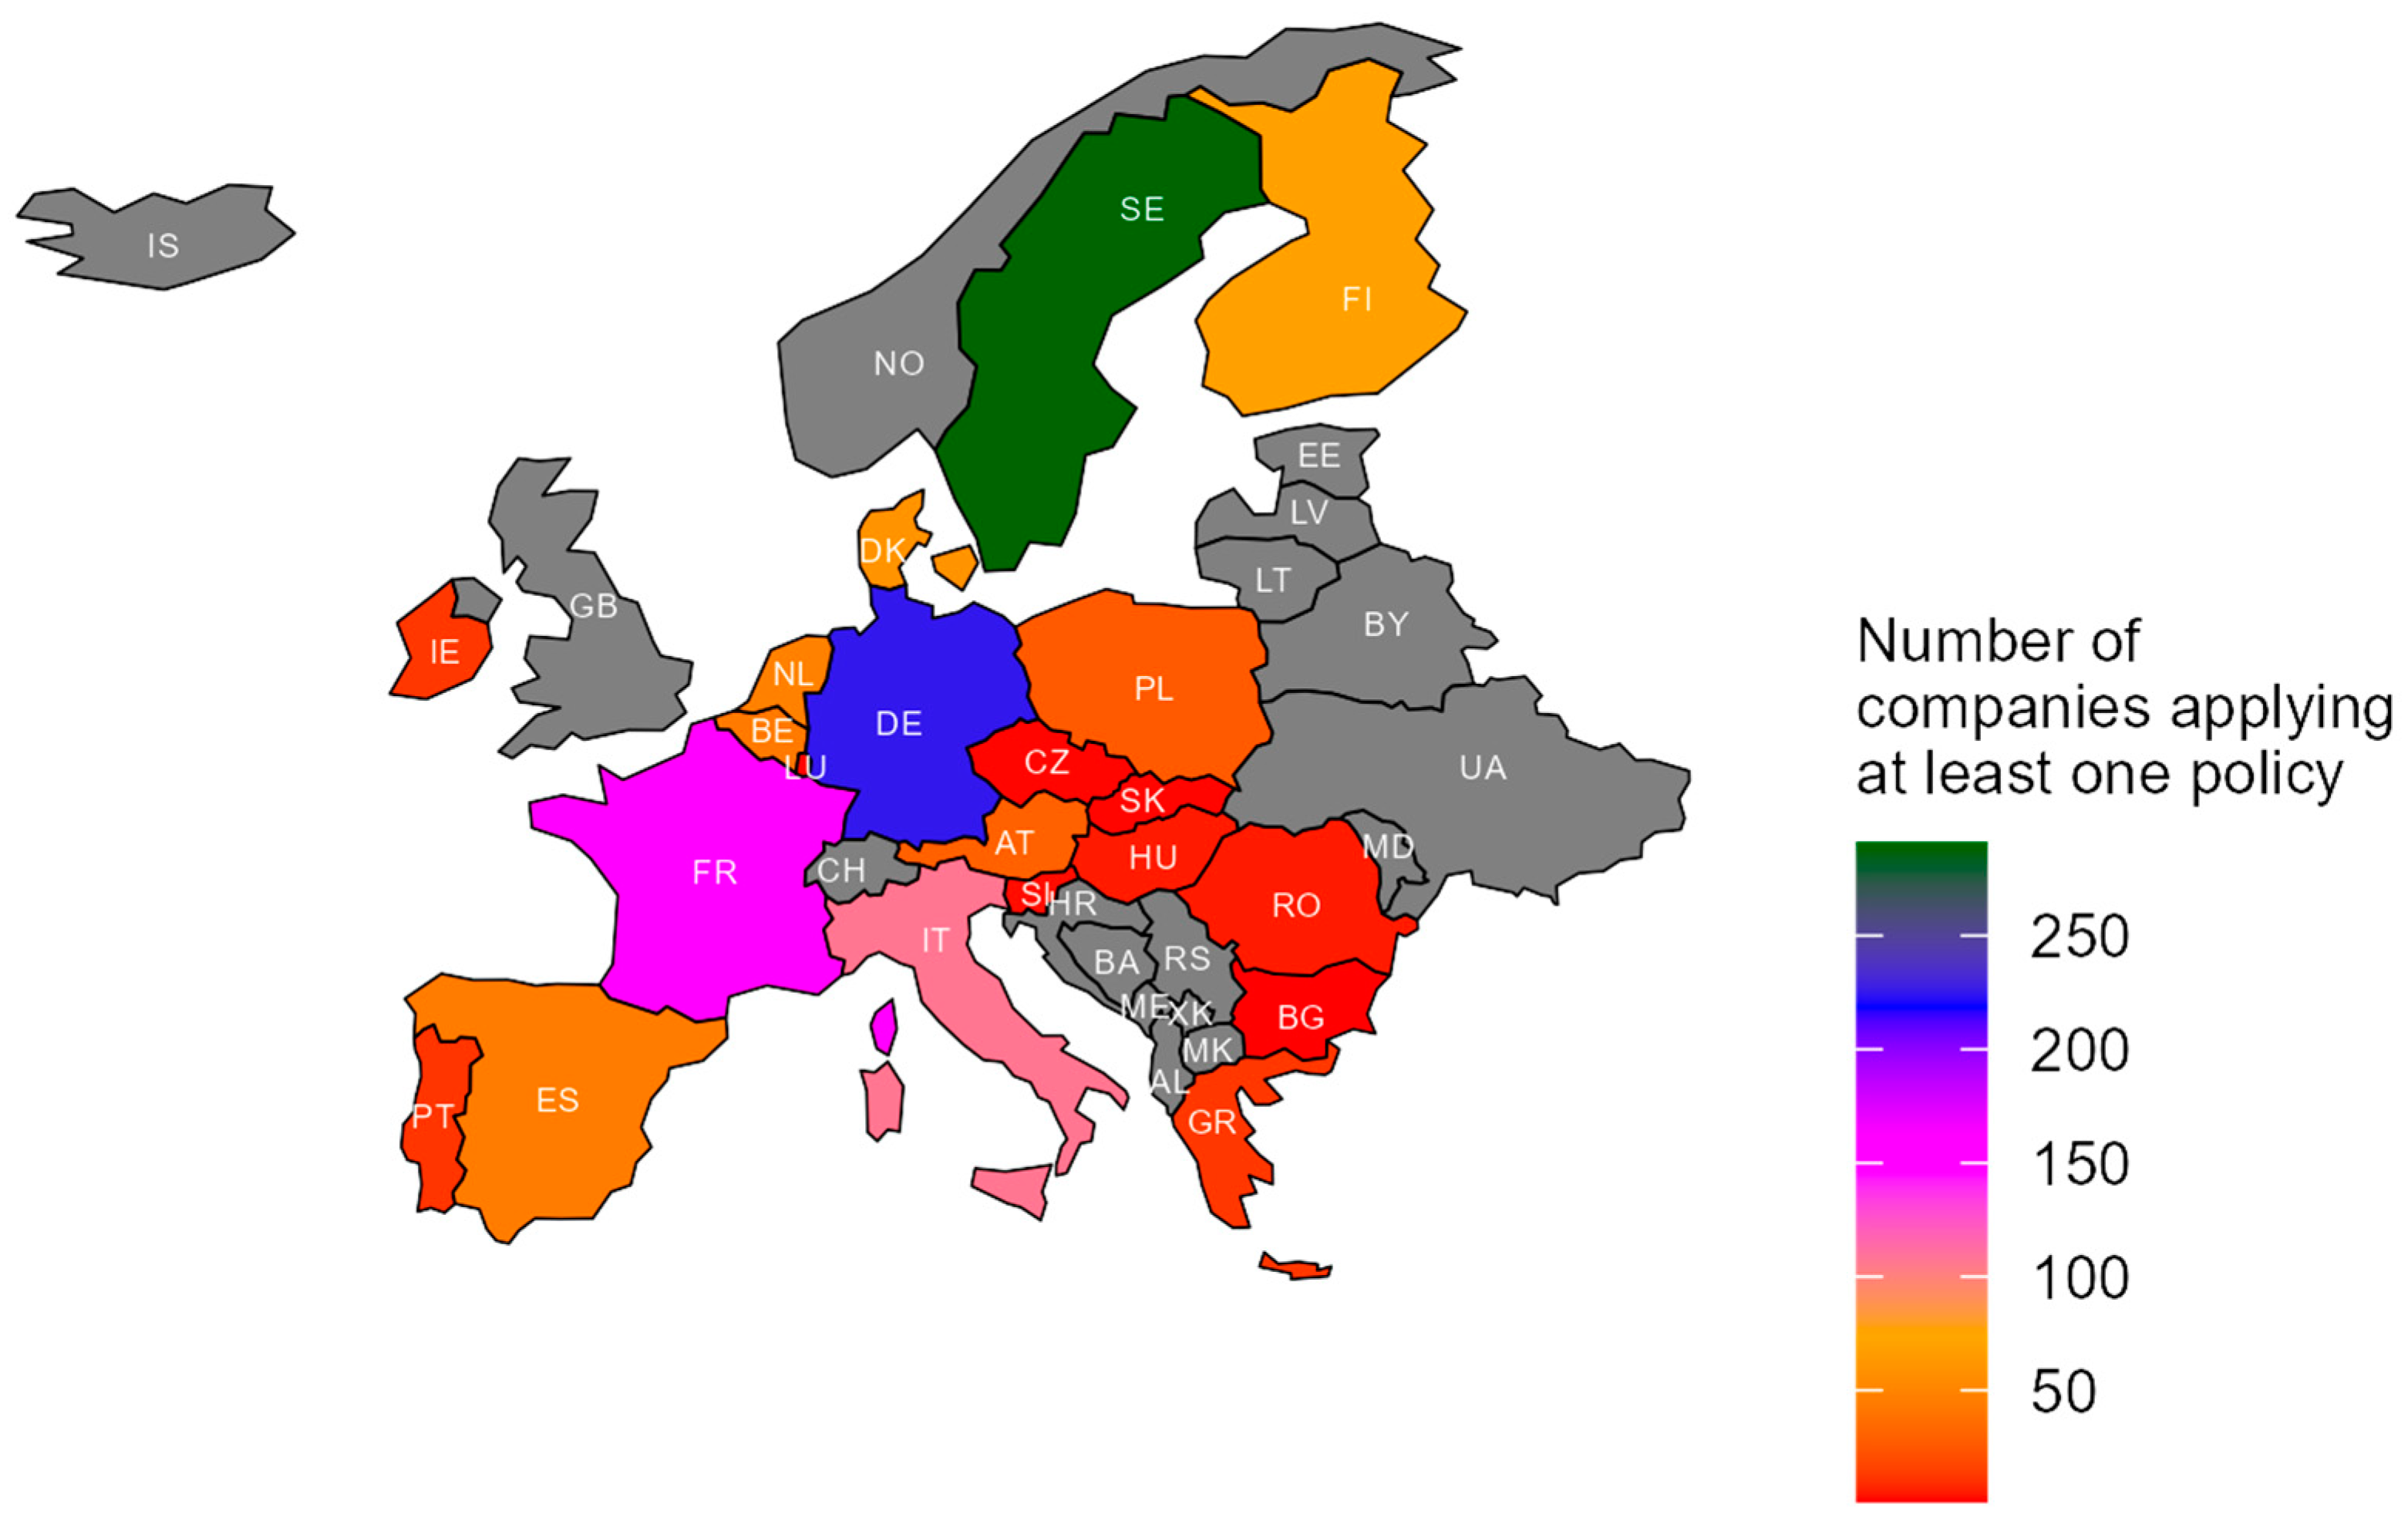
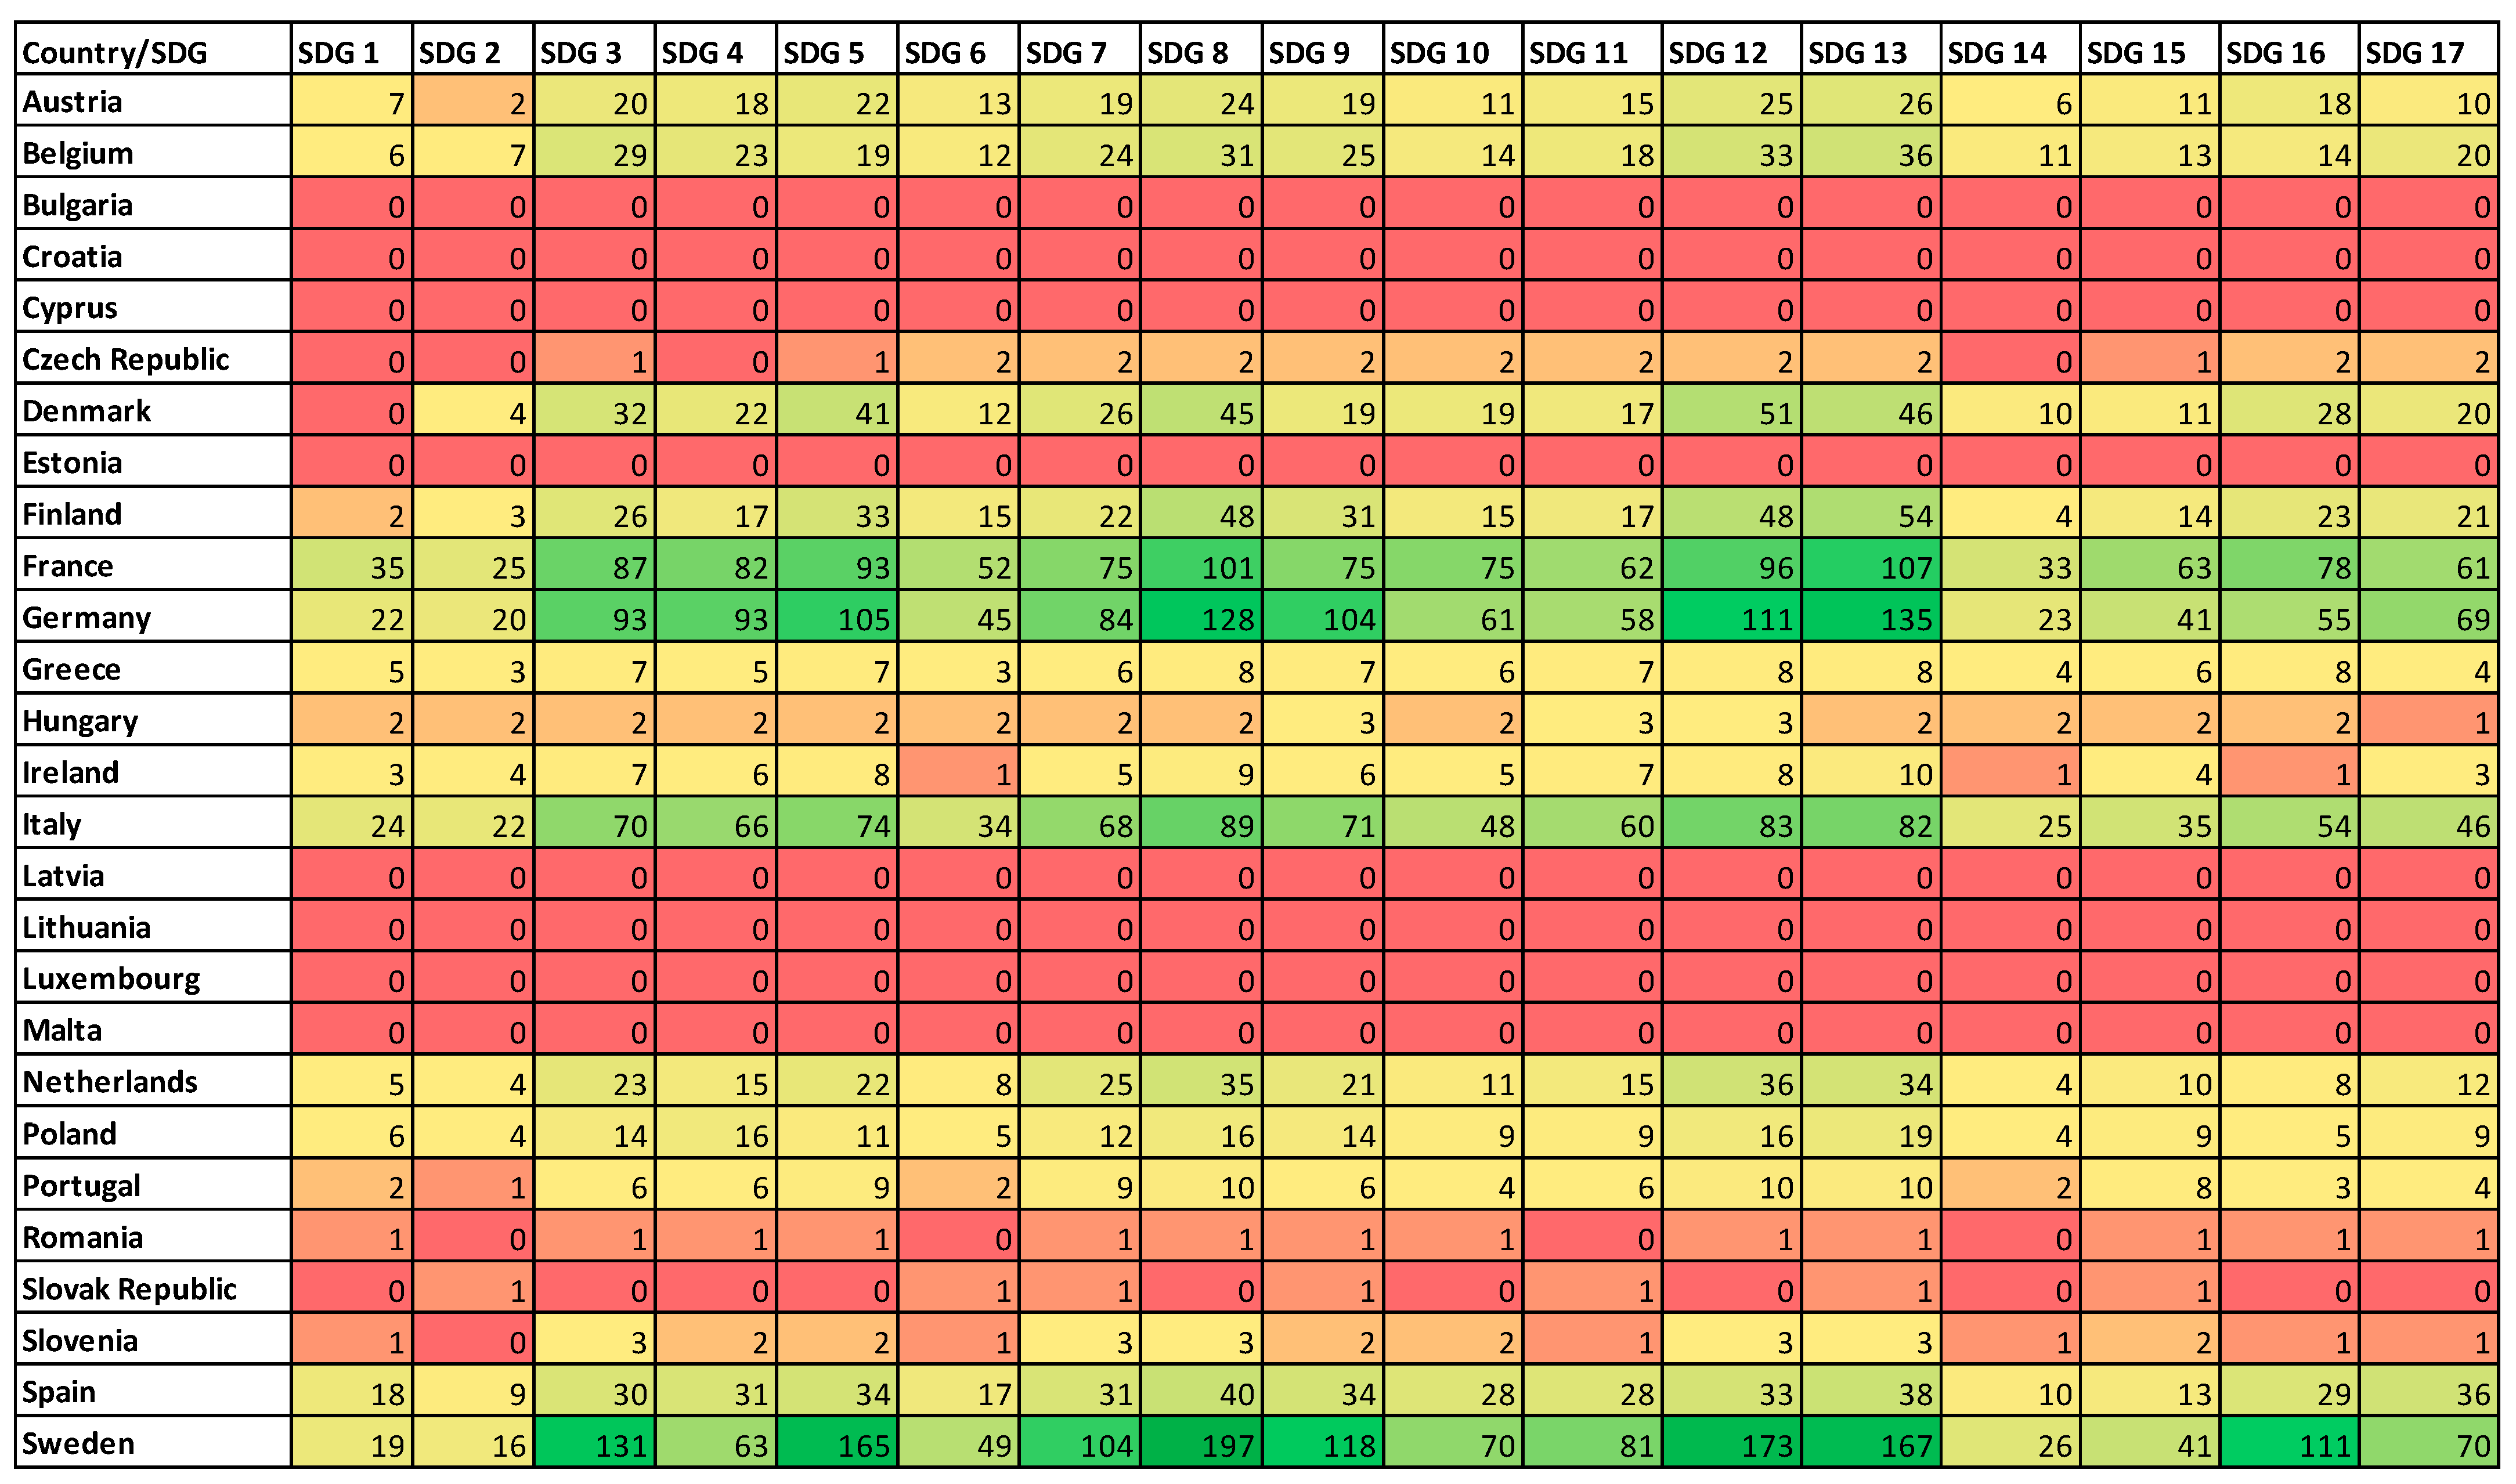
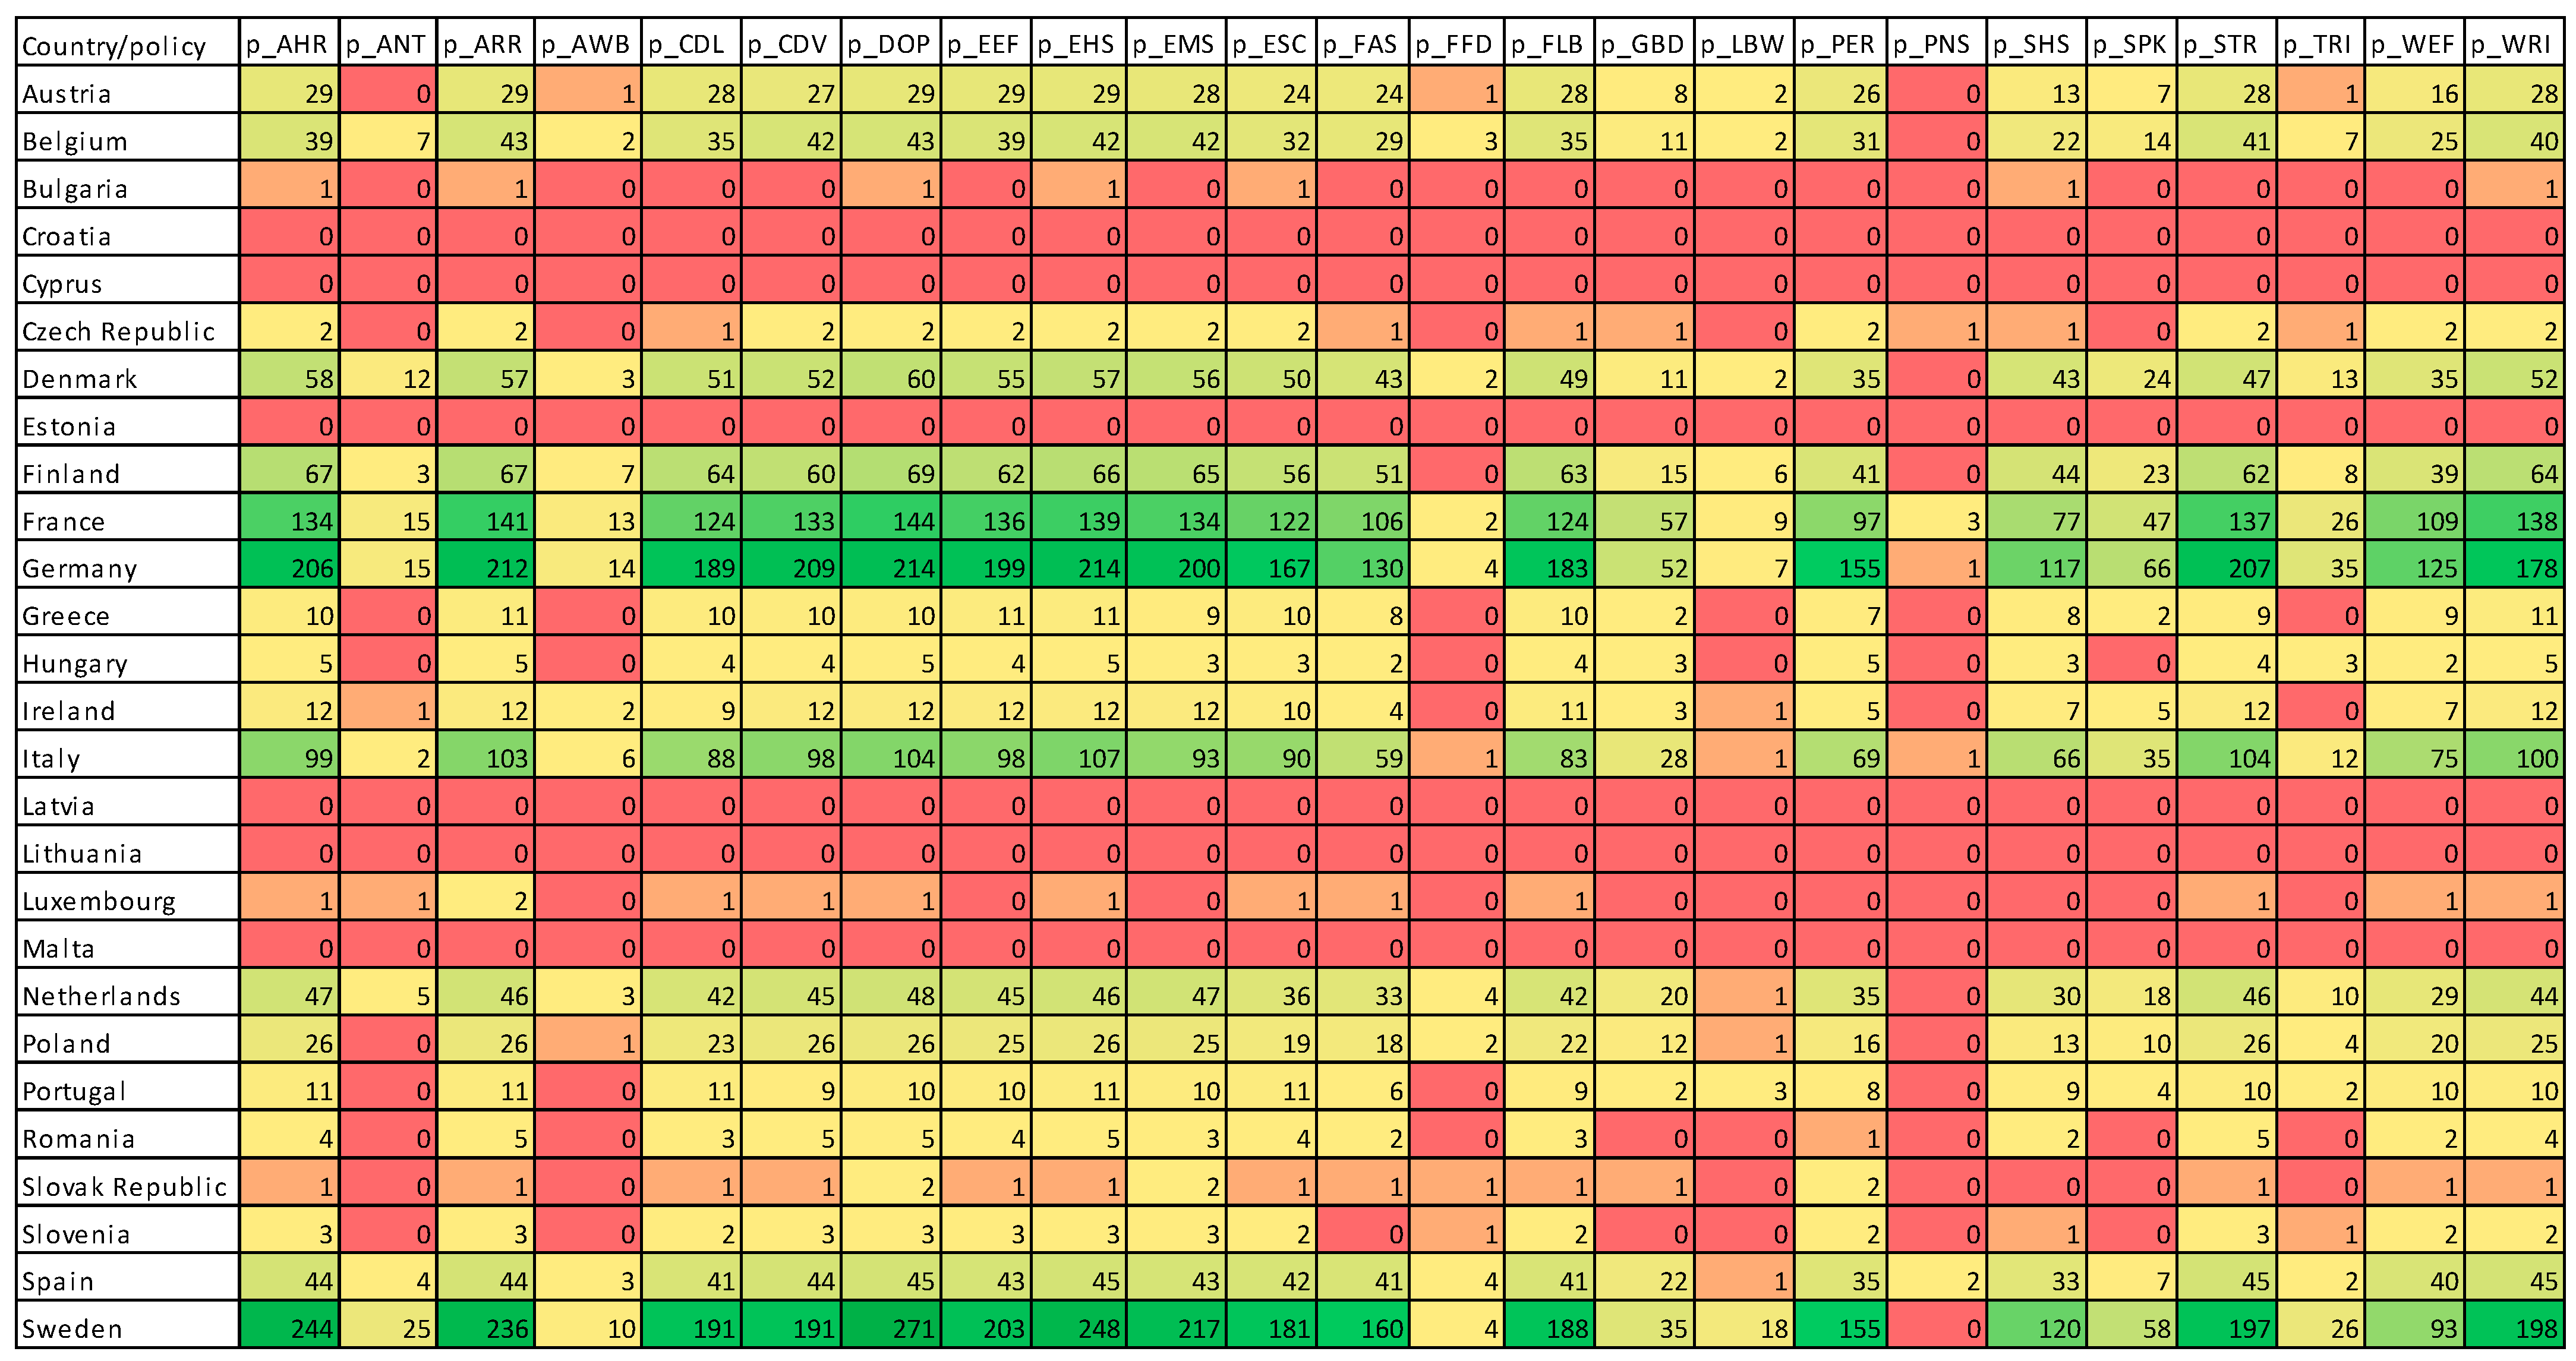
Disclaimer/Publisher’s Note: The statements, opinions and data contained in all publications are solely those of the individual author(s) and contributor(s) and not of MDPI and/or the editor(s). MDPI and/or the editor(s) disclaim responsibility for any injury to people or property resulting from any ideas, methods, instructions or products referred to in the content. |
© 2024 by the authors. Licensee MDPI, Basel, Switzerland. This article is an open access article distributed under the terms and conditions of the Creative Commons Attribution (CC BY) license (https://creativecommons.org/licenses/by/4.0/).