
The Evaluation and Comparison of Resilience for Shelters in Old and New Urban Districts: A Case Study in Kunming City, China


Abstract
1. Introduction
2. Study Area and Data
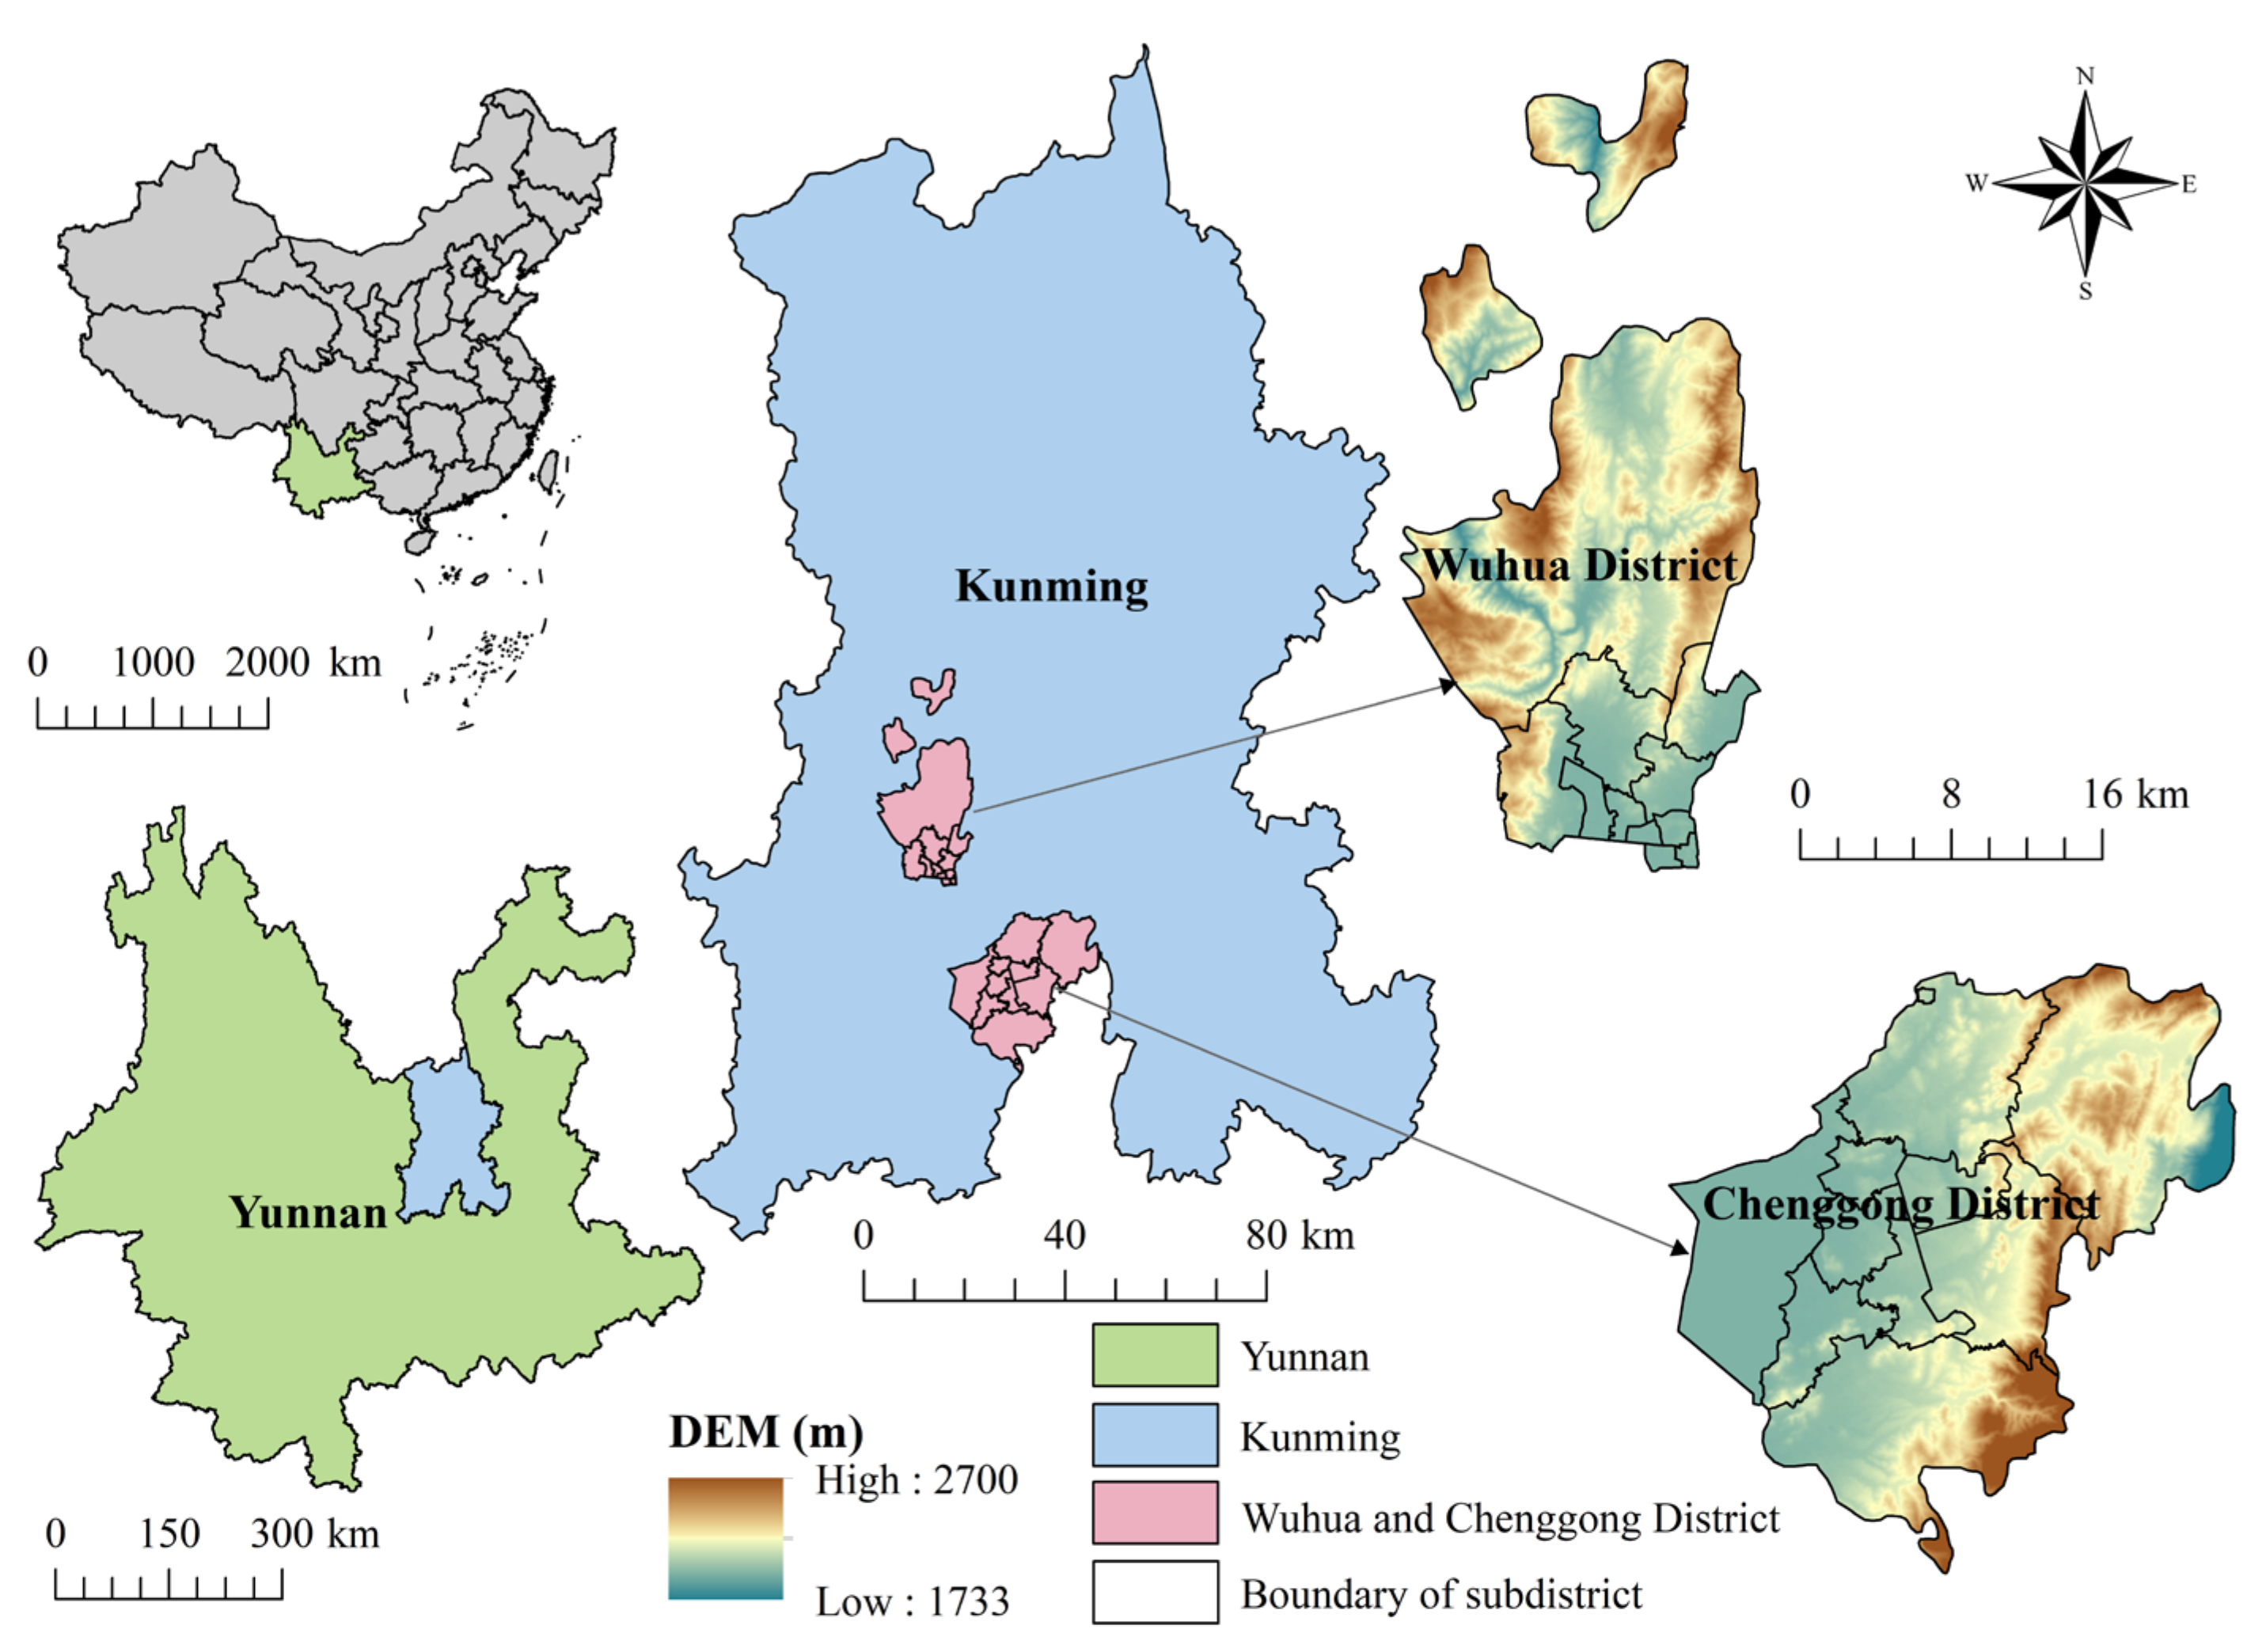
2.1. Study Area
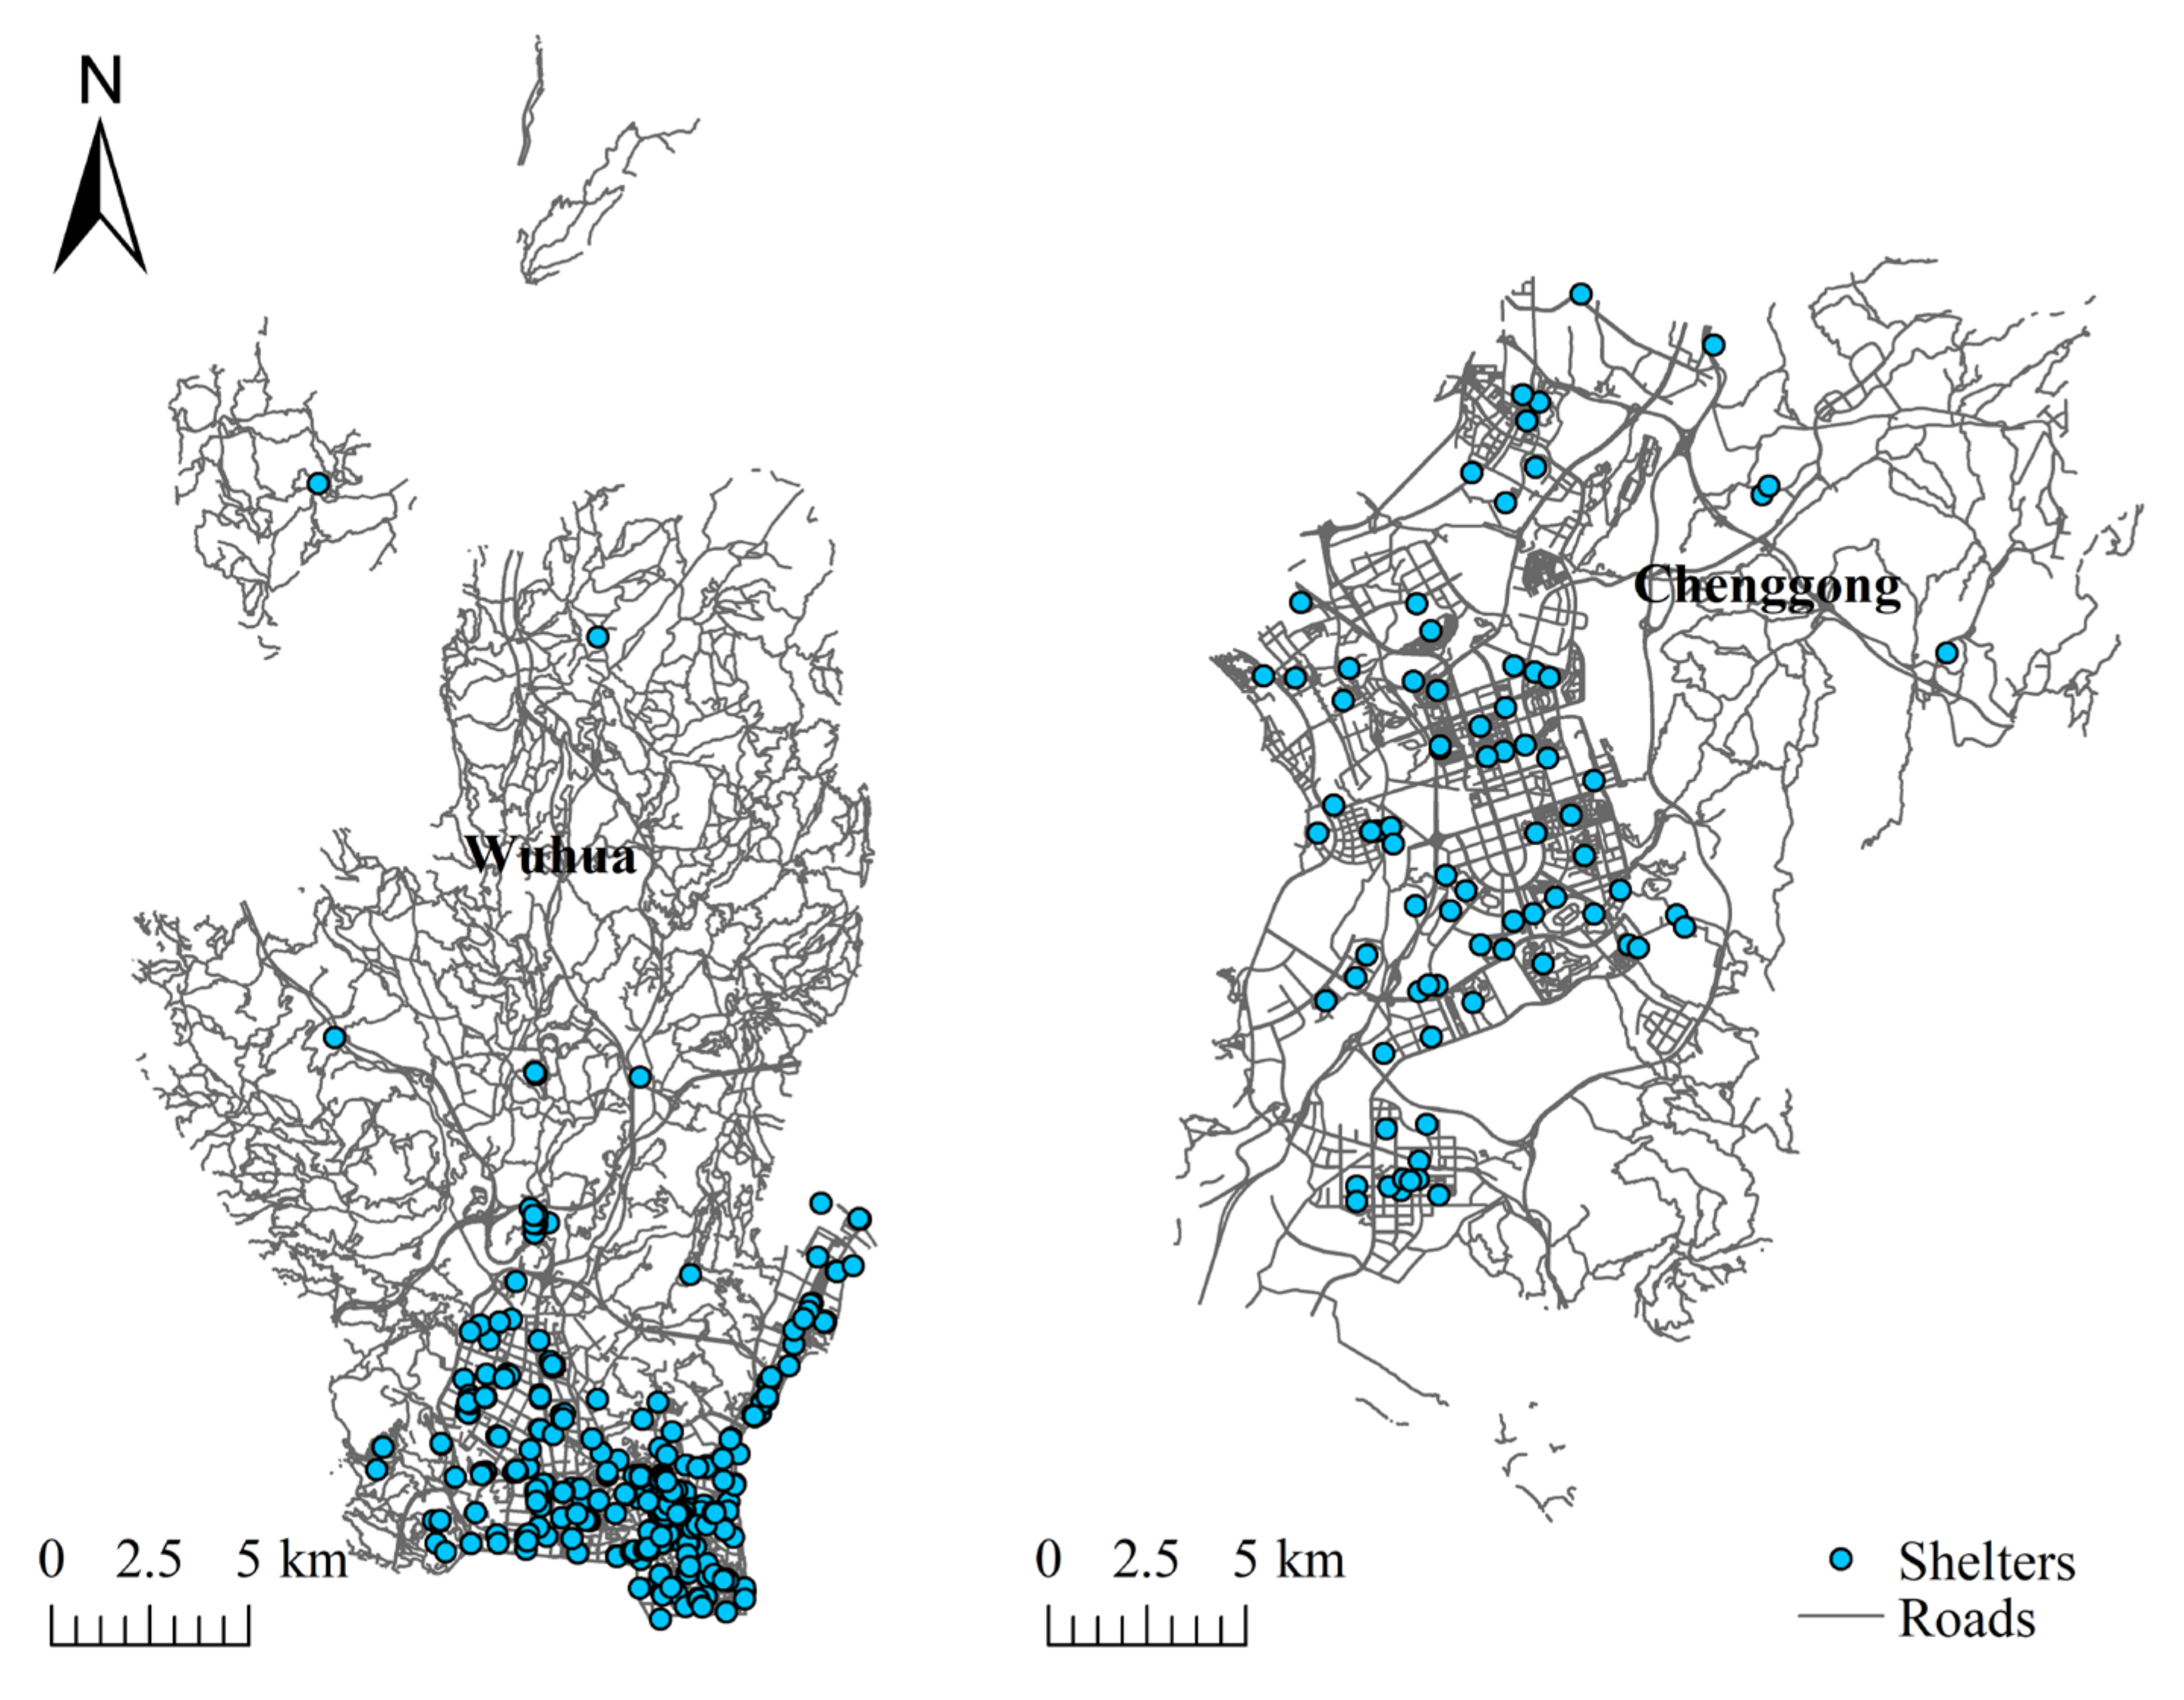
2.2. Data
3. Methodology
3.1. Nighttime Light Index Calculation
3.2. Data Normalization
3.3. Determination of Assessment Indicator Weights
3.4. Calculation of the Shelter Resilience Index
4. Results
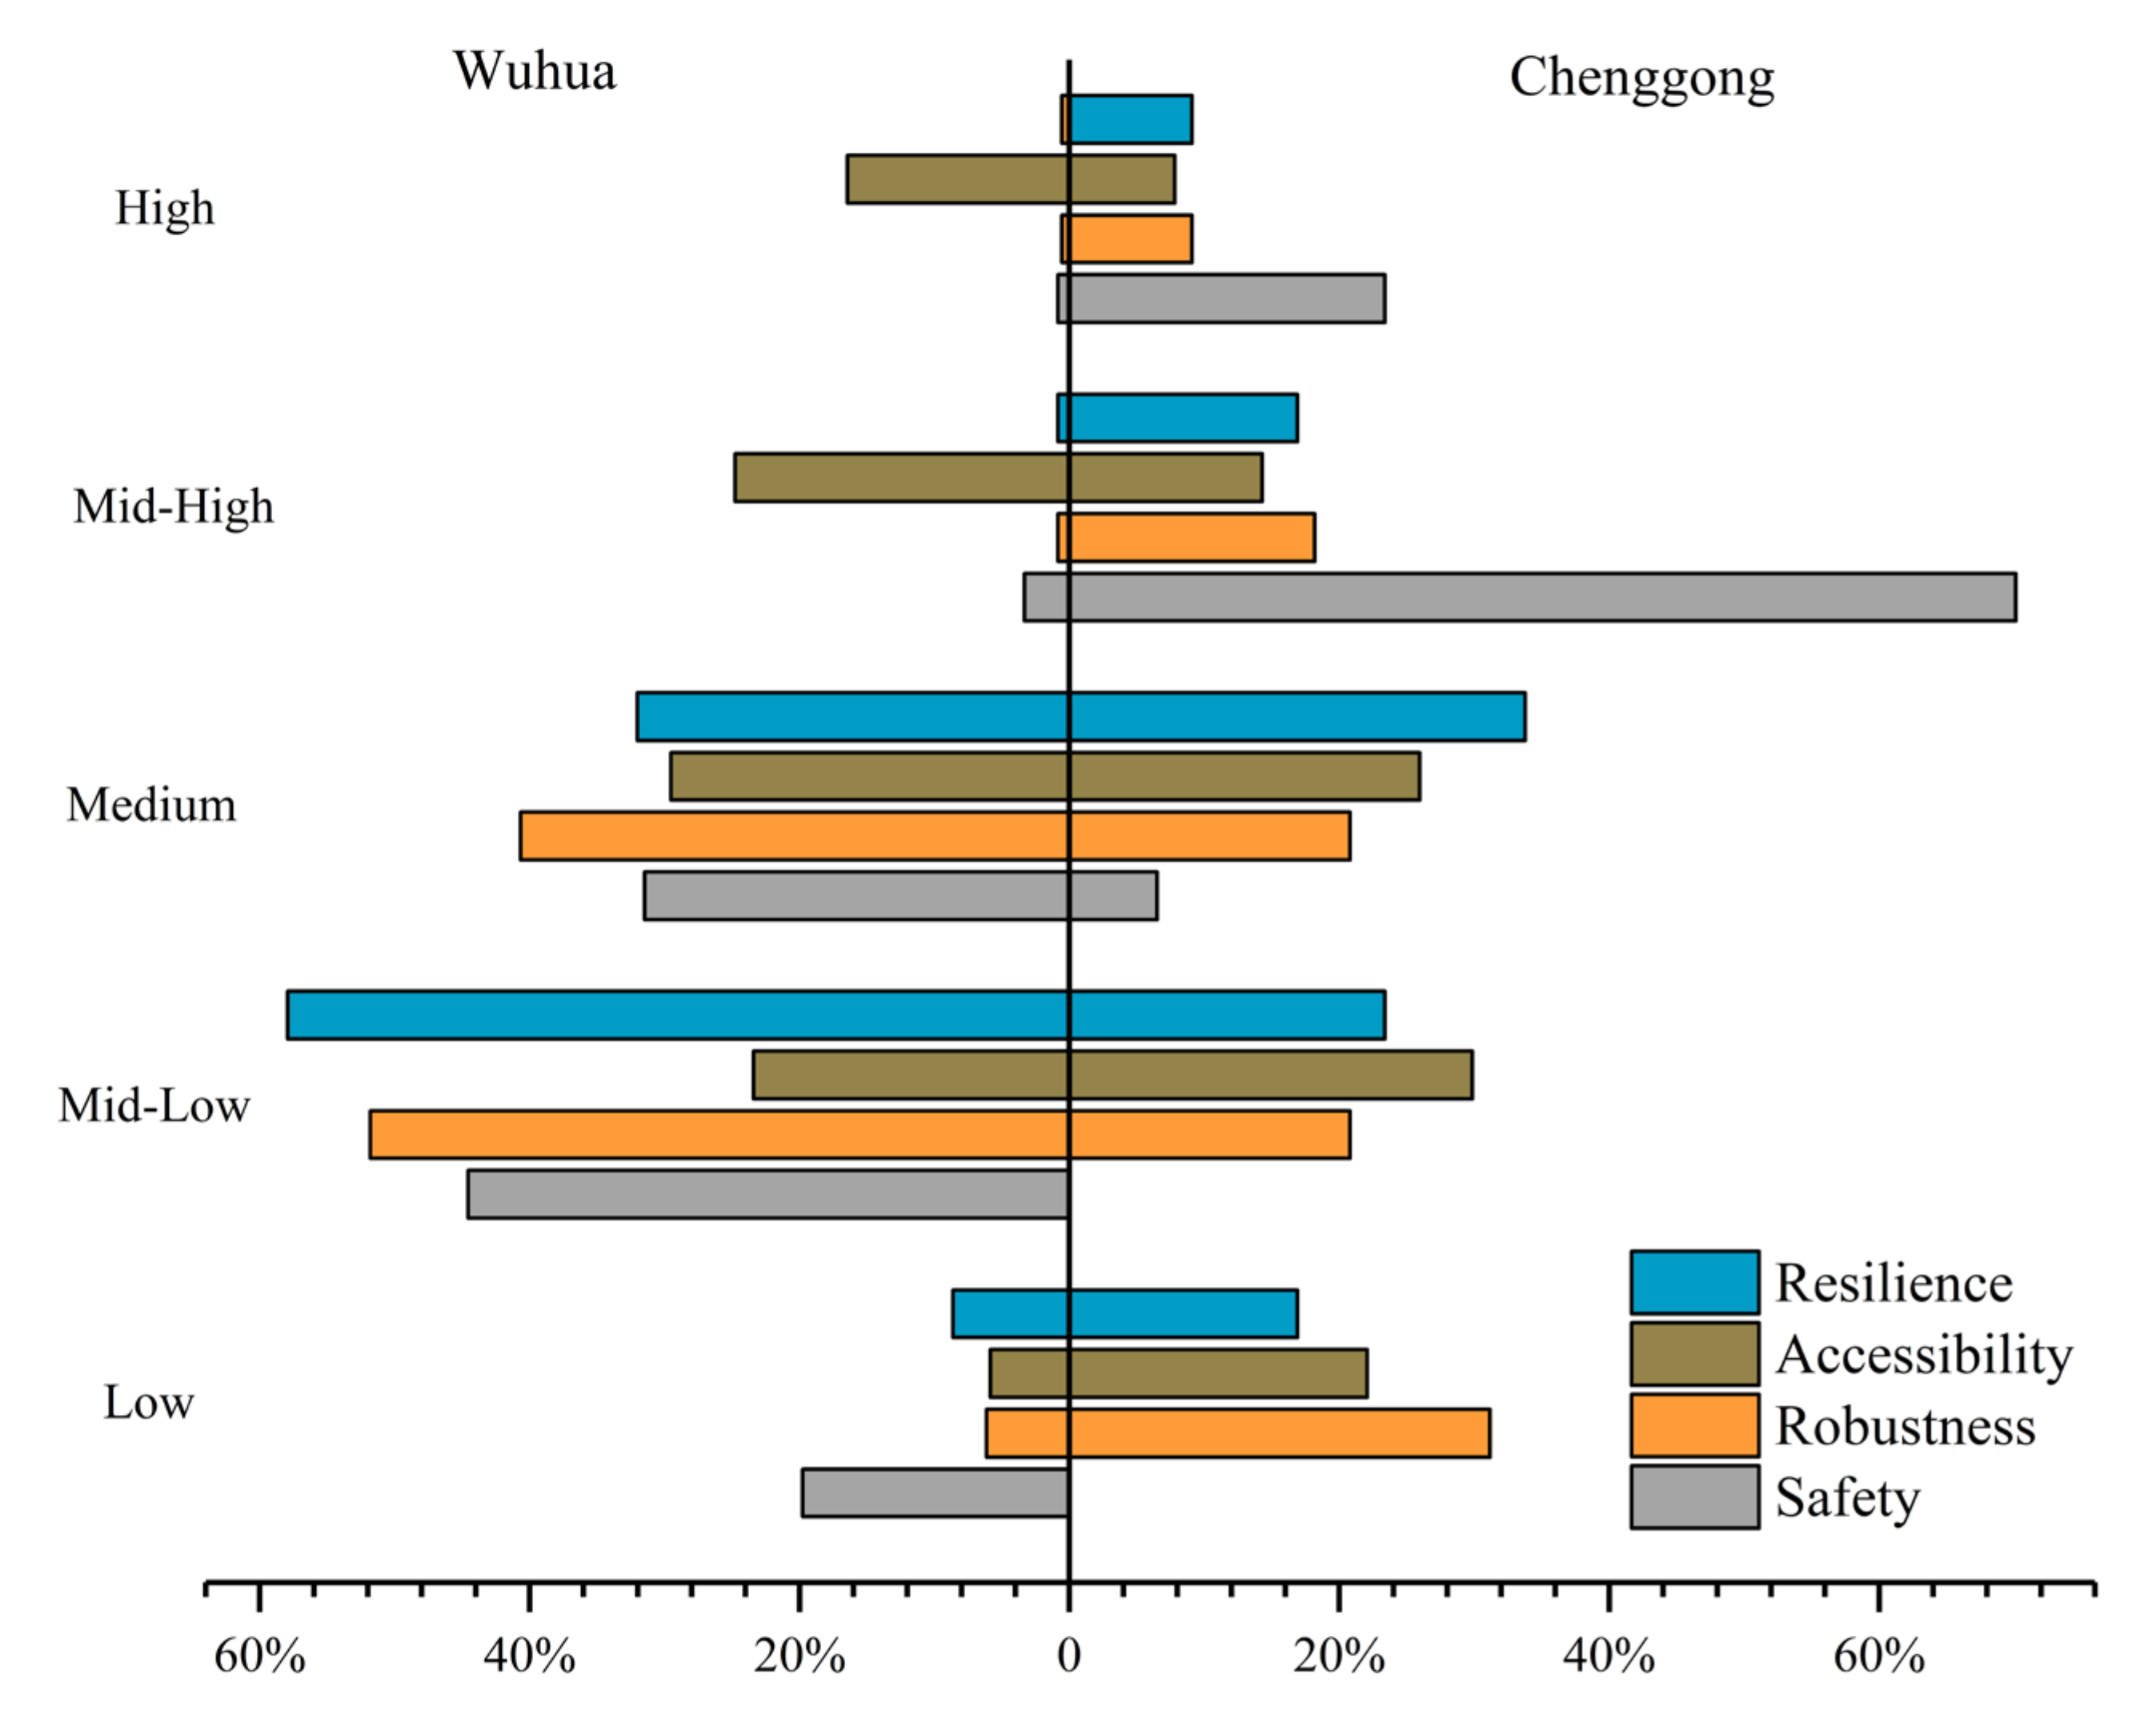
4.1. Percentage of Resilience Levels
4.2. Spatial Distribution of Resilience Assessment Criteria
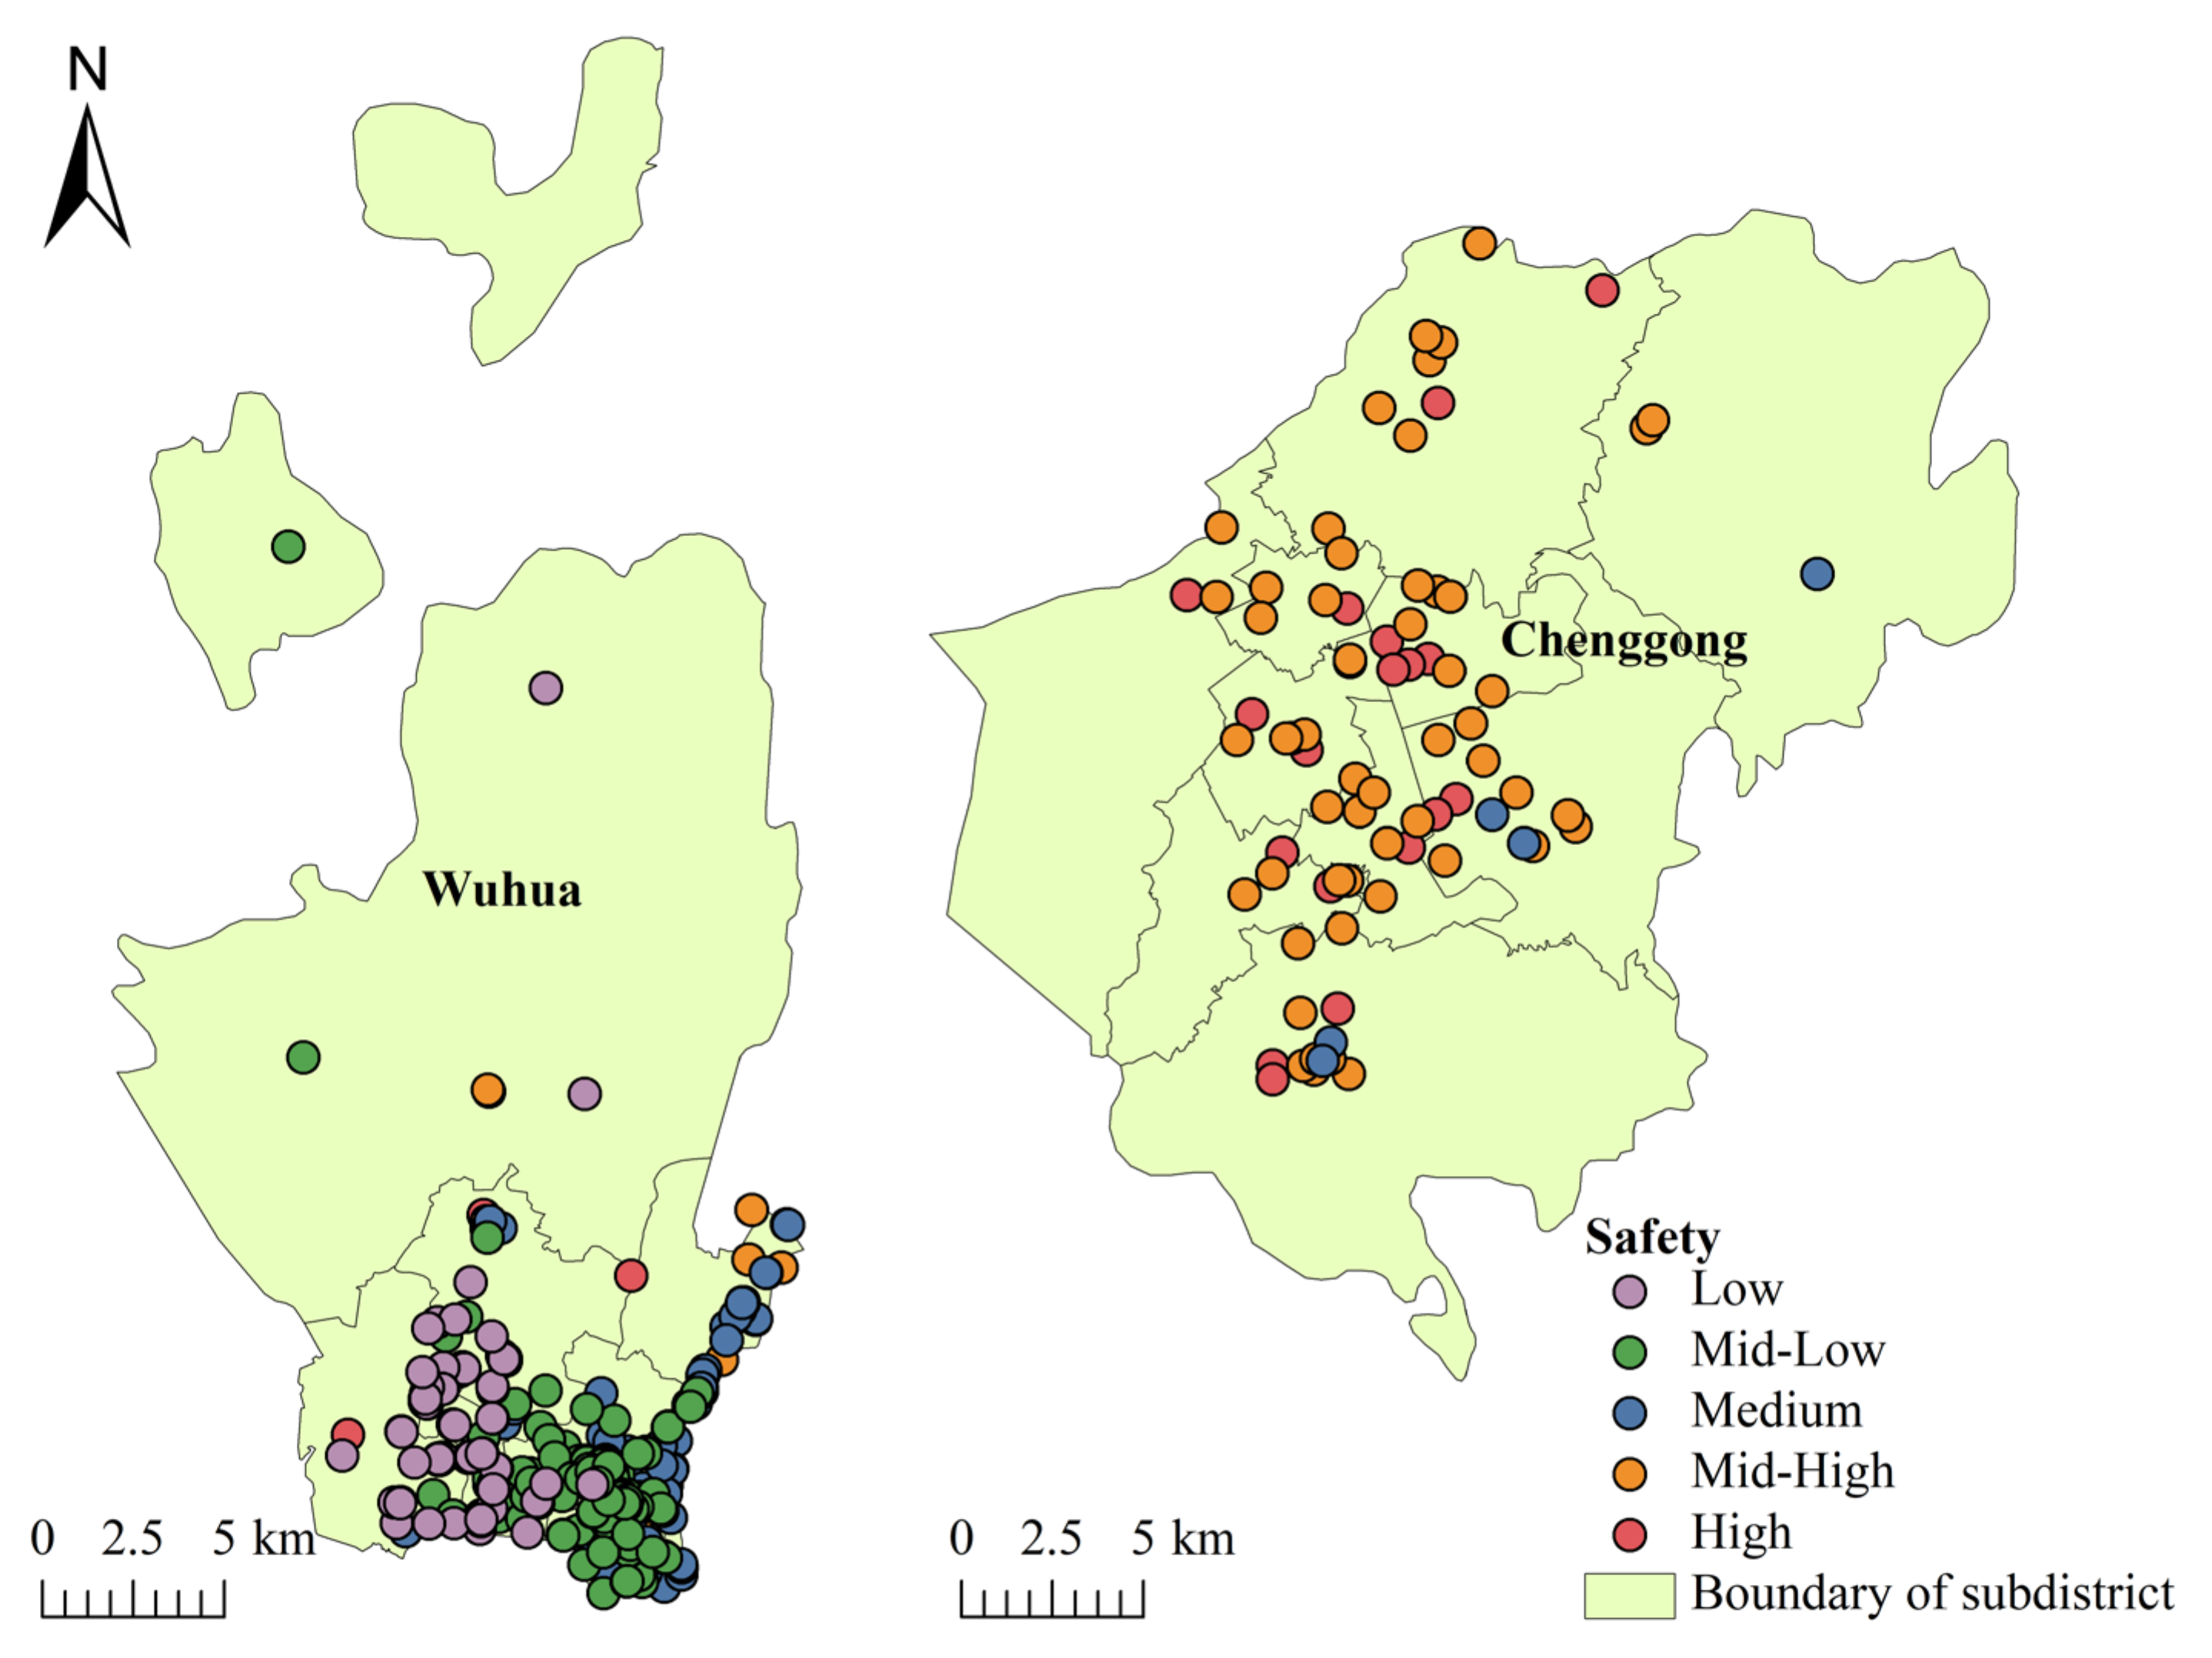
4.2.1. Safety
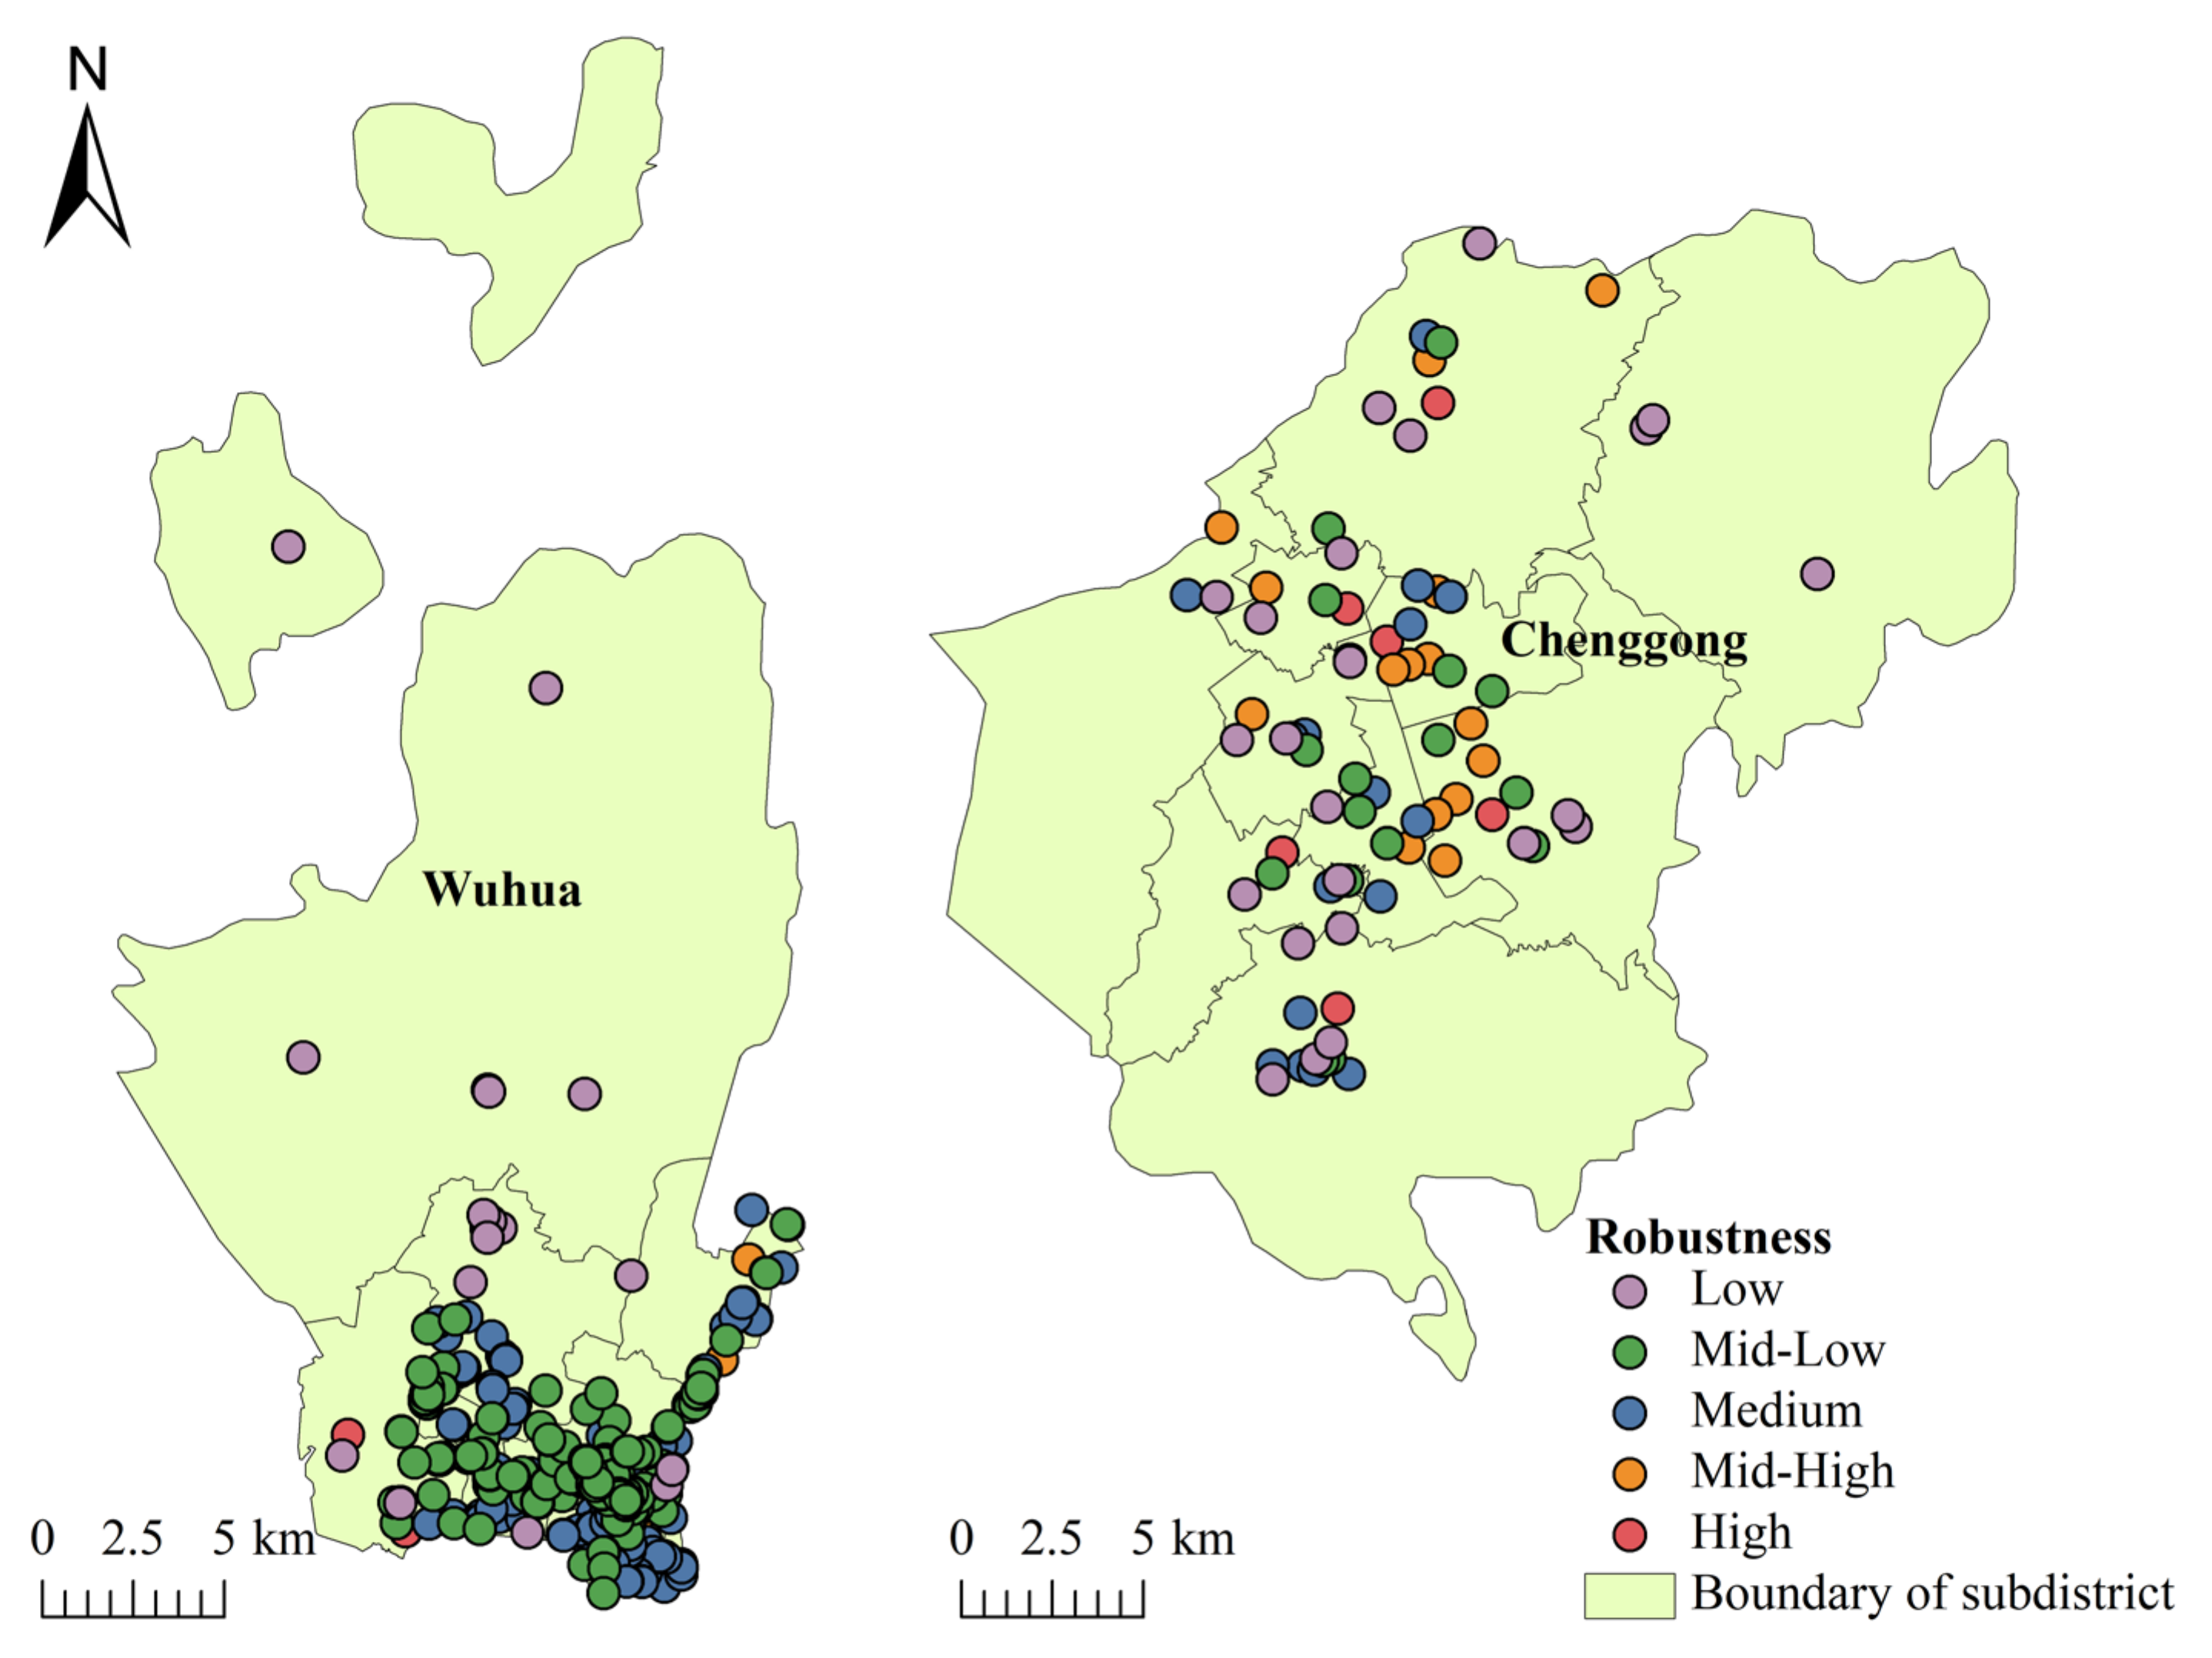
4.2.2. Robustness
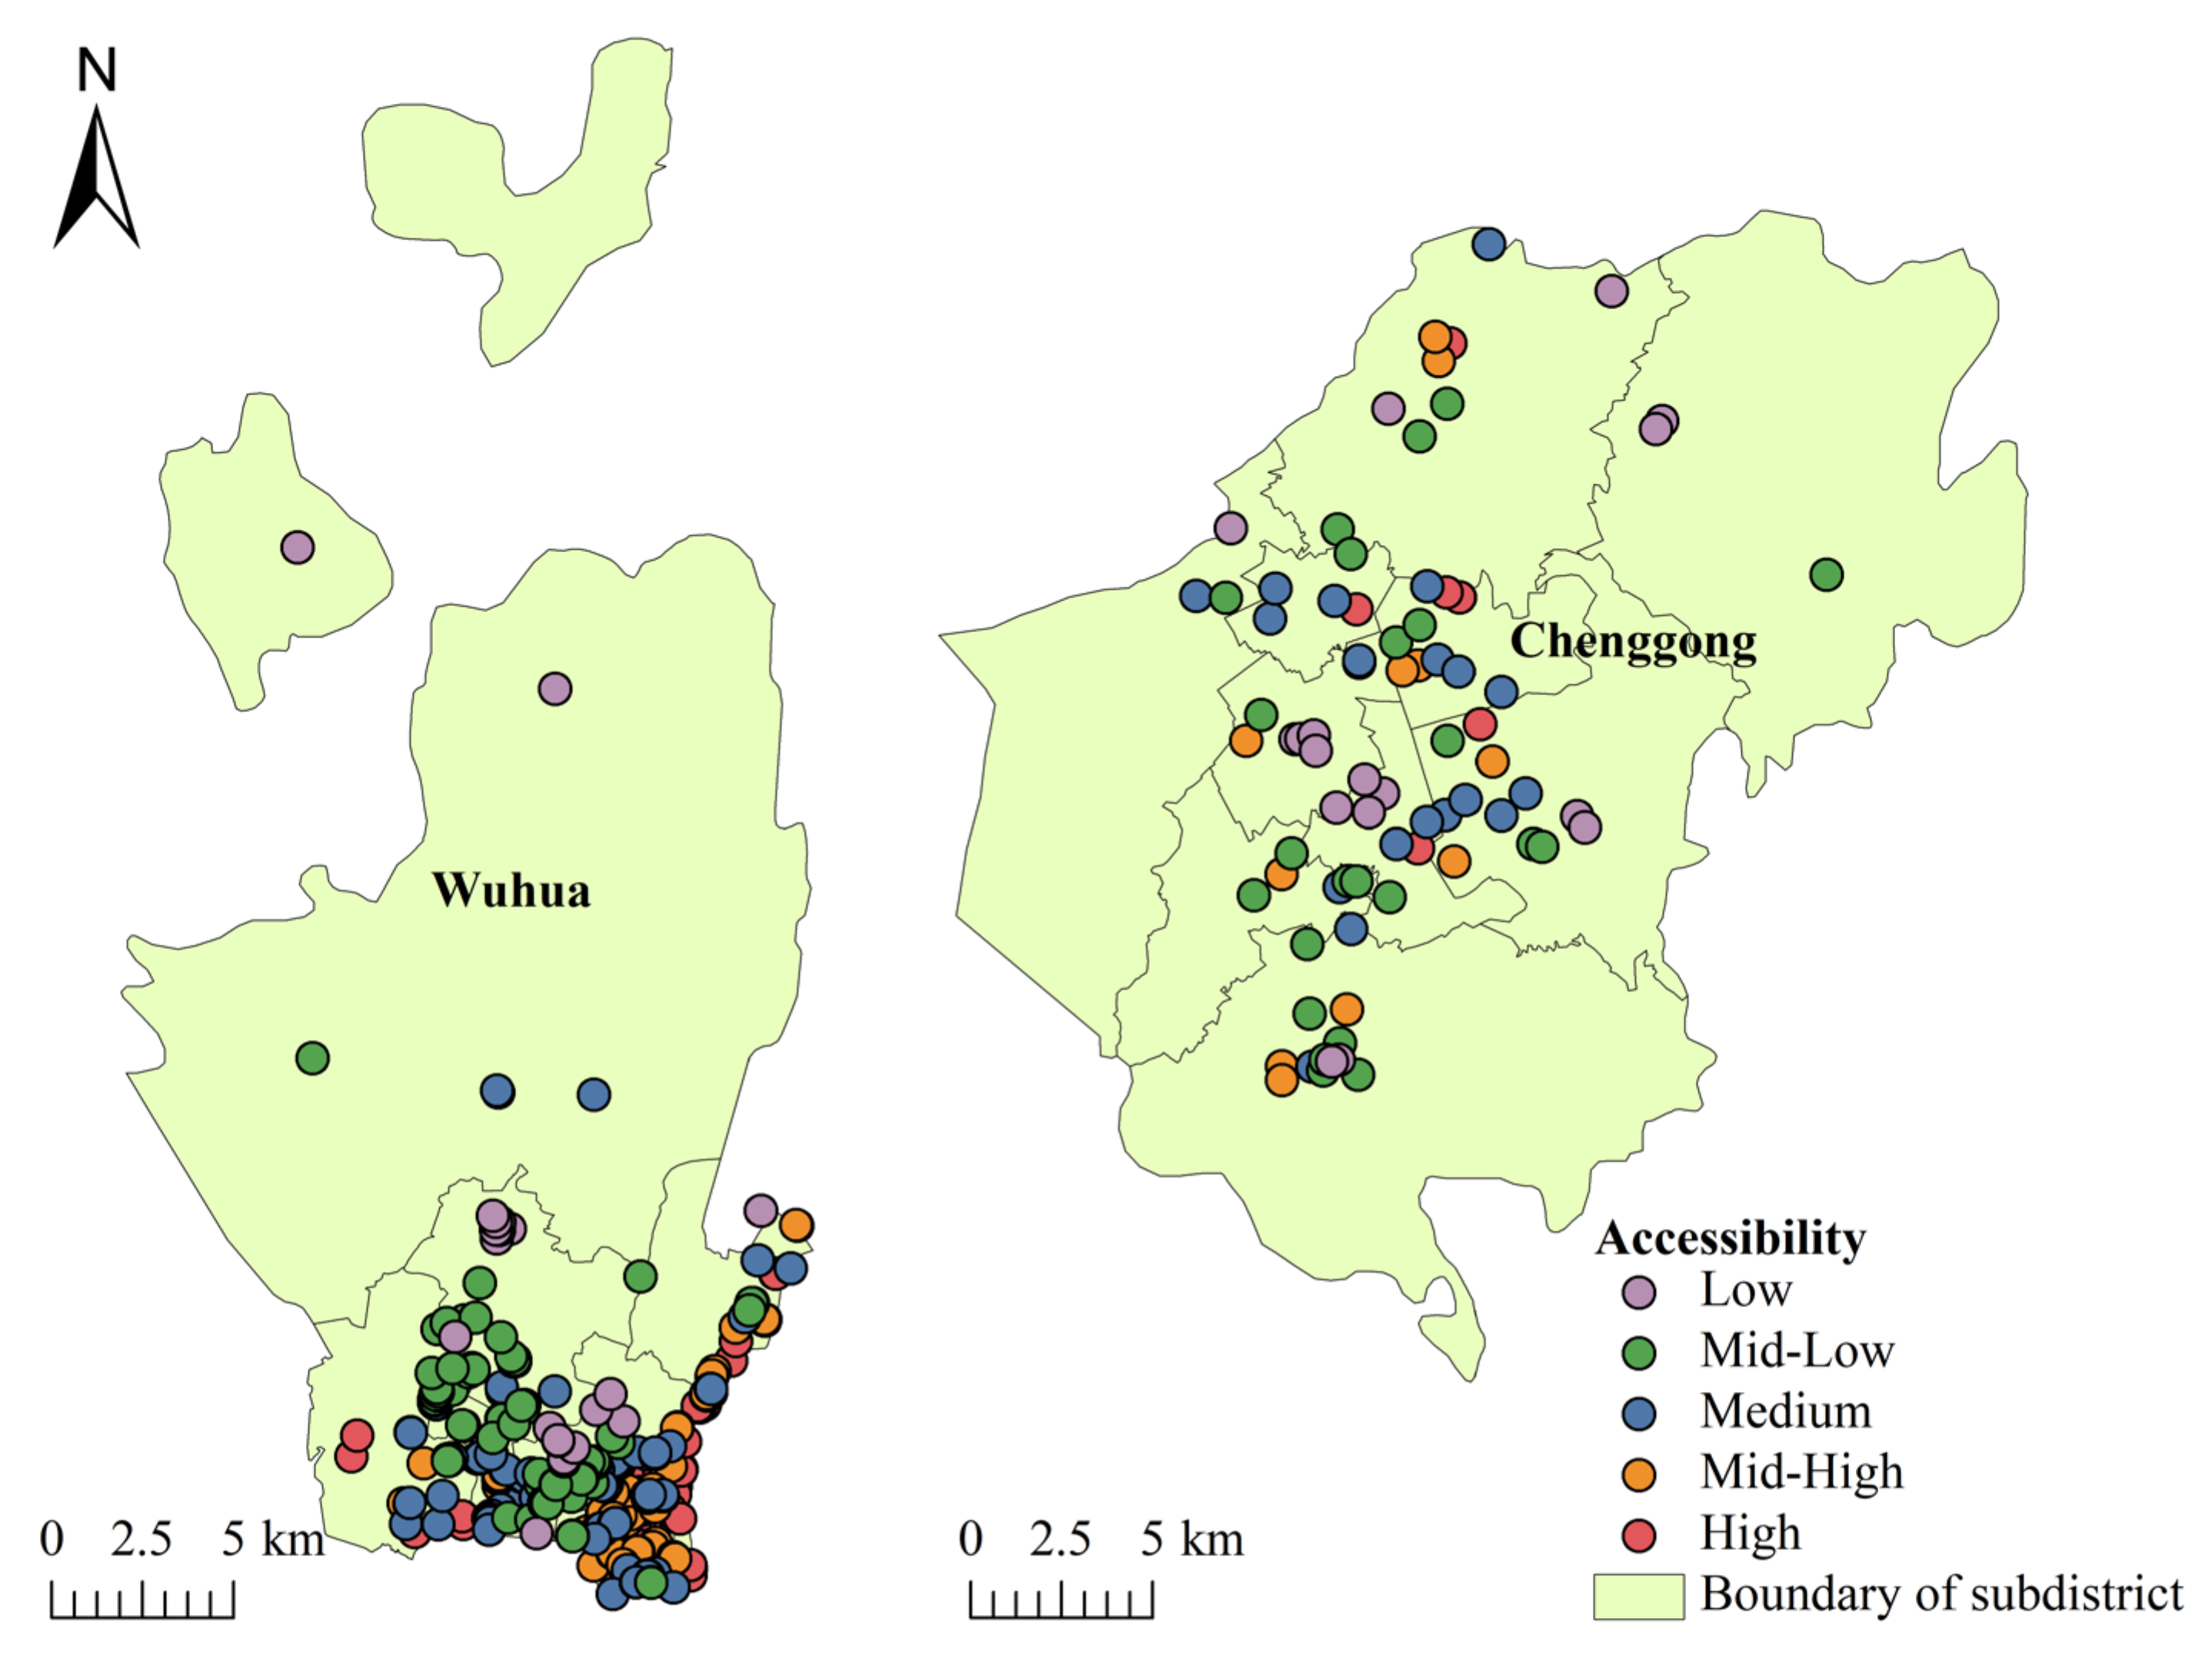
4.2.3. Accessibility
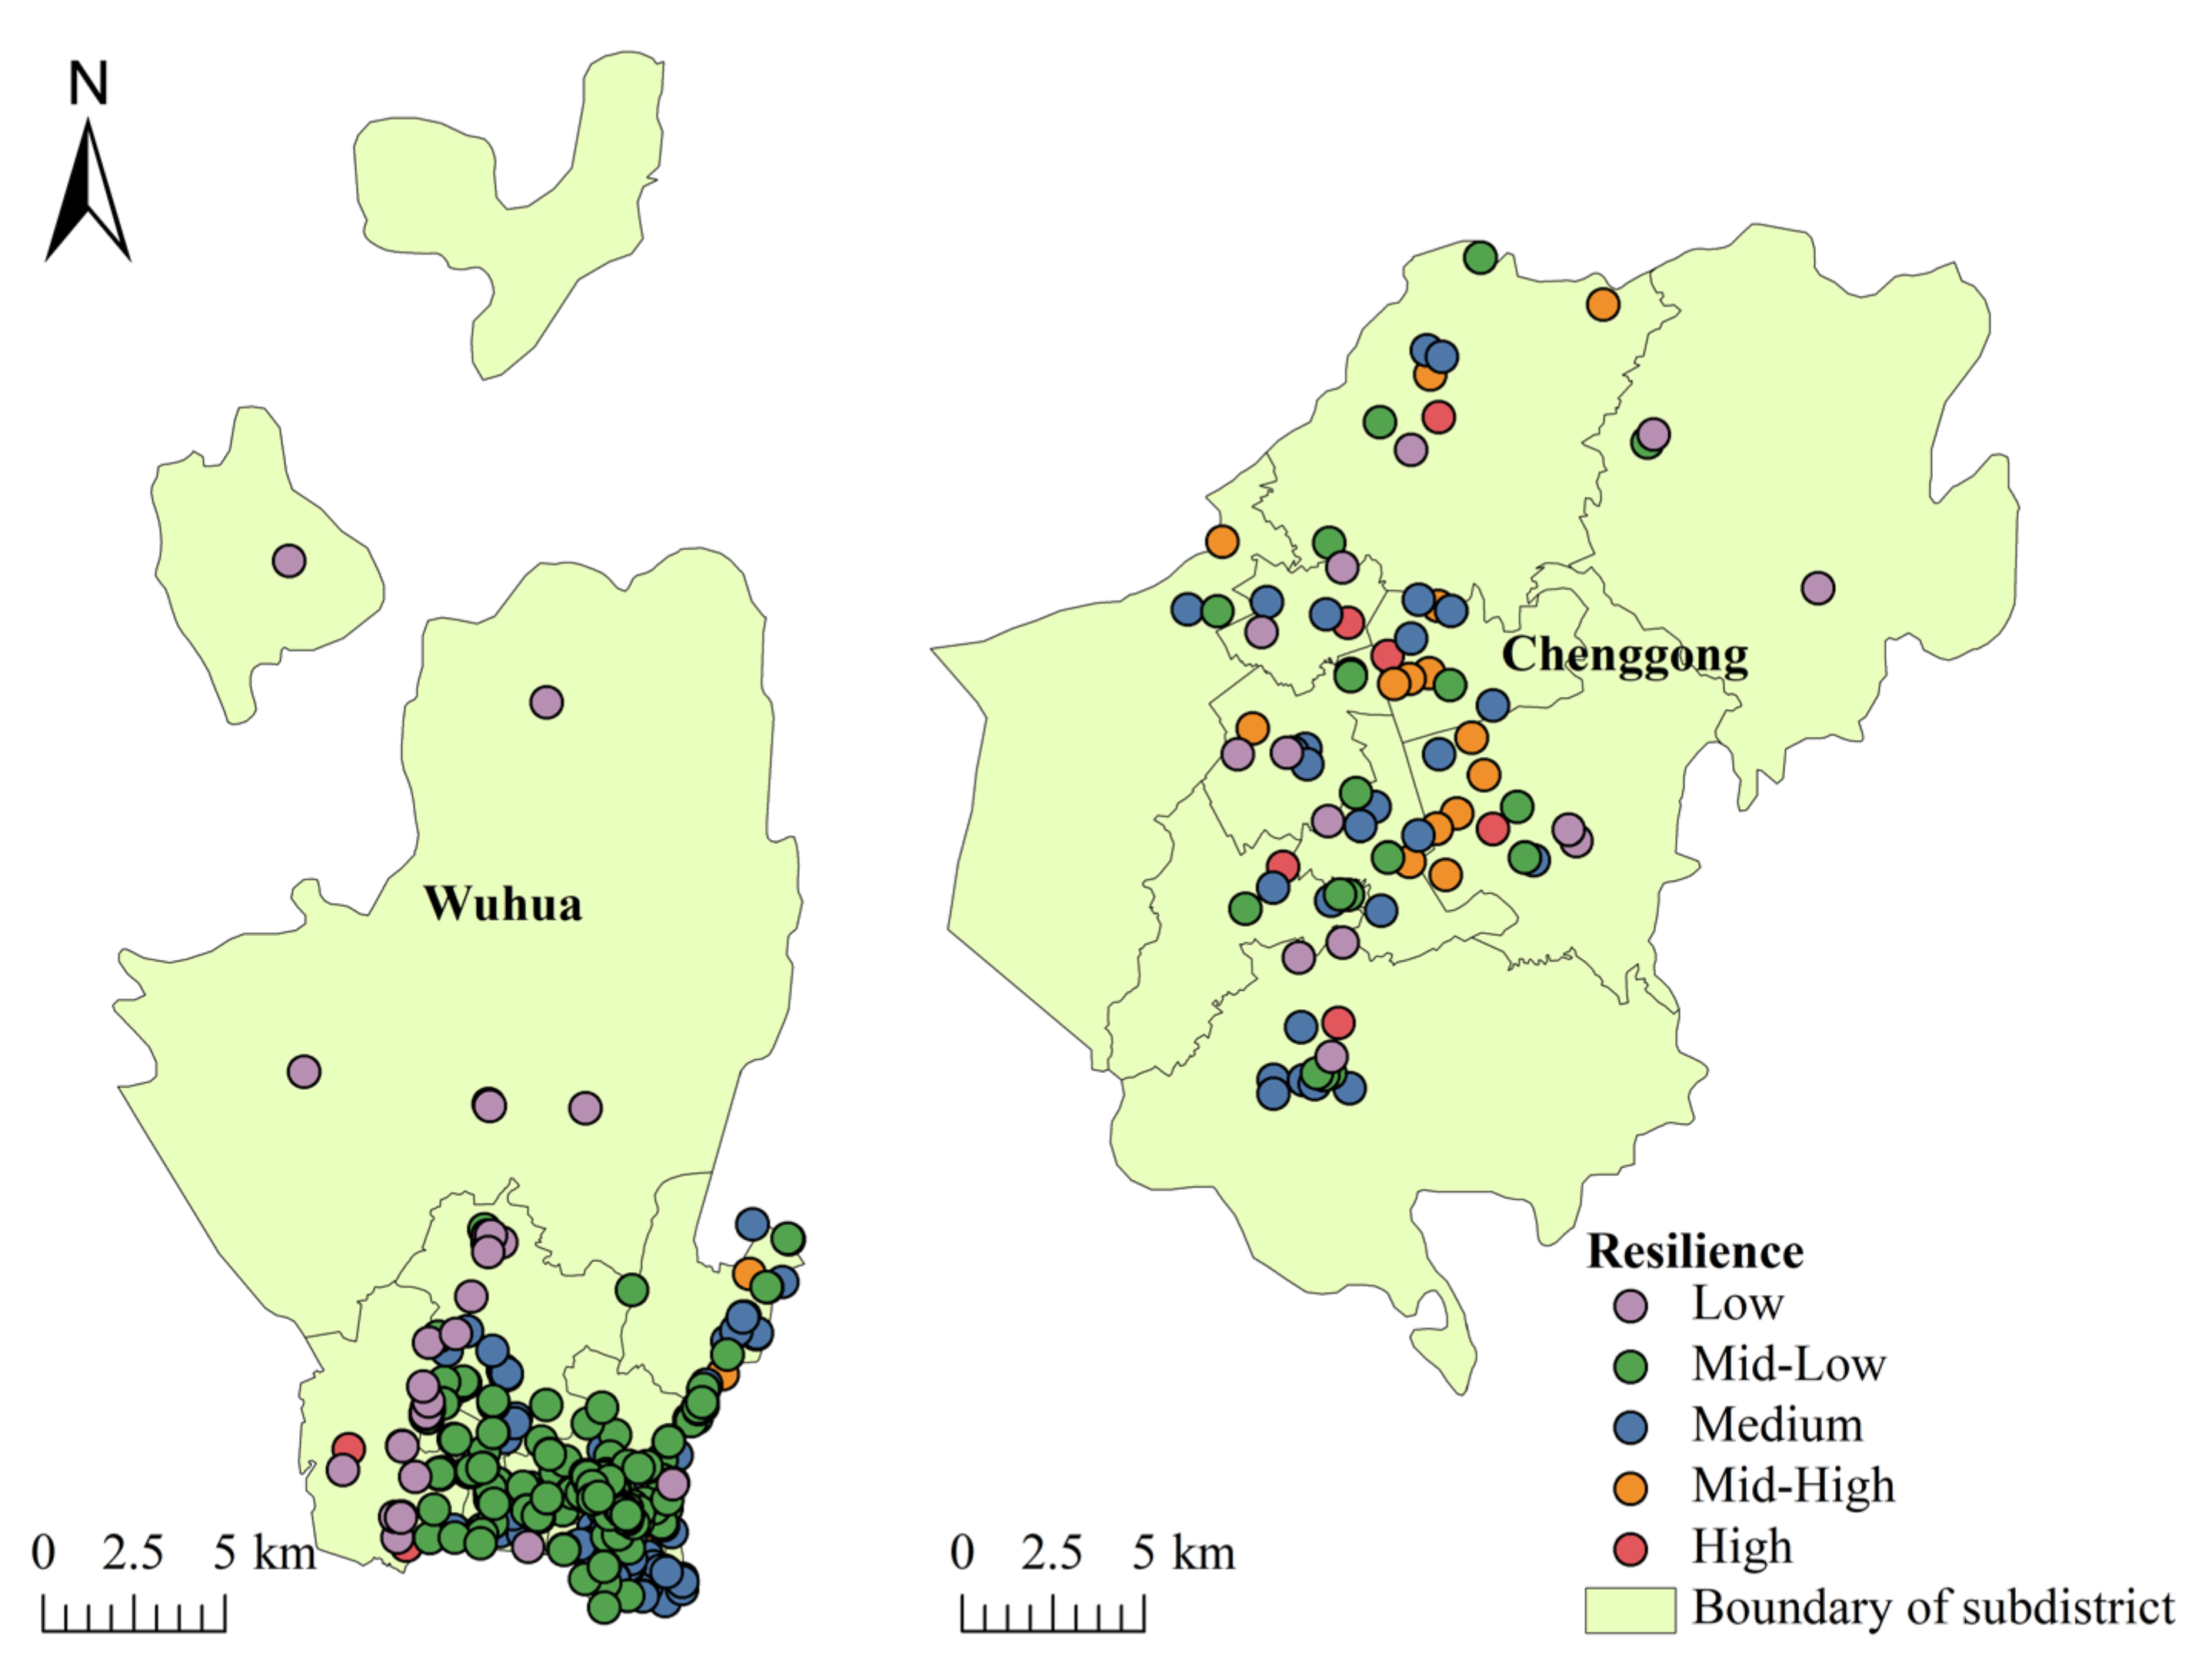
4.2.4. Resilience
5. Discussion
5.1. The Primary Contributions of This Study
- Comprehensive Resilience Assessment: This study provides a thorough evaluation of shelter resilience in Wuhua and Chenggong Districts, considering multiple dimensions such as safety, robustness, and accessibility. The multidimensional analysis offers a holistic perspective on the efficacy of evacuation sites in confronting natural disasters.
- Spatial Distribution Comparison: The study compares the spatial distribution of shelters in the old and new districts, highlighting differences in safety, robustness, accessibility, and overall resilience. These insights provide a foundation for tailored disaster risk management and urban planning strategies.
- Detailed Data and Visualization: The study presents detailed data and visualizations to elucidate and compare the resilience levels of shelters in Wuhua and Chenggong Districts. This information serves as a robust reference for urban disaster risk management and planning. Additionally, the study offers methodological insights and research ideas for similar endeavors in different contexts.
5.2. Possible Strategies for Enhancing Resilience
- Integrated Planning: Incorporate shelters as a fundamental component in the initial stages of urban planning. Strategically plan their locations, sizes, and numbers to ensure comprehensive coverage throughout the new urban area.
- Quality Construction: Emphasize high-quality construction practices by utilizing standardized materials. Ensure construction quality and safety by focusing on the configuration of essential facilities and equipment, such as fire-fighting systems, emergency lighting, and well-designed escape routes.
- Regular Maintenance and Repair: Implement a routine maintenance schedule to ensure the ongoing integrity and safety of existing shelters. Regular inspections and repairs are essential for upkeeping facilities and equipment.
- Tailored Resilience Improvement: Recognize the distinctive characteristics of buildings in old urban areas, including aging structures and those prone to collapse. Factor in these considerations during shelter design to enhance their resilience and adaptability to the unique challenges posed by old urban environments.
5.3. Limitations and Future Research Recommendations
6. Conclusions
Author Contributions
Funding
Institutional Review Board Statement
Informed Consent Statement
Data Availability Statement
Conflicts of Interest
References
- Liu, Y.; Liu, W.; Lin, Y.; Zhang, X.; Zhou, J.; Wei, B.; Nie, G.; Gross, L. Urban waterlogging resilience assessment and postdisaster recovery monitoring using NPP-VIIRS nighttime light data: A case study of the ‘July 20, 2021’ heavy rainstorm in Zhengzhou City, China. Int. J. Disaster Risk Reduct. 2023, 90, 103649. [Google Scholar] [CrossRef]
- Jiang, R.; Lu, H.; Yang, K.; Chen, D.; Zhou, J.; Yamazaki, D.; Pan, M.; Li, W.; Xu, N.; Yang, Y. Substantial increase in future fluvial flood risk projected in China’s major urban agglomerations. Commun. Earth Environ. 2023, 4, 389. [Google Scholar] [CrossRef]
- Buszta, J.; Wójcik, K.; Guimarães Santos, C.A.; Kozioł, K.; Maciuk, K. Historical Analysis and Prediction of the Magnitude and Scale of Natural Disasters Globally. Resources 2023, 12, 106. [Google Scholar] [CrossRef]
- Mazhin, S.A.; Farrokhi, M.; Noroozi, M.; Roudini, J.; Hosseini, S.A.; Motlagh, M.E.; Kolivand, P.; Khankeh, H. Worldwide disaster loss and damage databases: A systematic review. J. Educ. Health Promot. 2021, 10, 329. [Google Scholar] [PubMed]
- Wu, L.; Ma, D.; Li, J. Assessment of the Regional Vulnerability to Natural Disasters in China Based on DEA Model. Sustainability 2023, 15, 10936. [Google Scholar] [CrossRef]
- Cheng, Y.; Liu, H.; Wang, S.; Cui, X.; Li, Q. Global action on SDGs: Policy review and outlook in a post-pandemic era. Sustainability 2021, 13, 6461. [Google Scholar] [CrossRef]
- Schweizer, P.-J.; Renn, O. Governance of systemic risks for disaster prevention and mitigation. Disaster Prev. Manag. Int. J. 2019, 28, 862–874. [Google Scholar] [CrossRef]
- Cui, P.; Peng, J.; Shi, P.; Tang, H.; Ouyang, C.; Zou, Q.; Liu, L.; Li, C.; Lei, Y. Scientific challenges of research on natural hazards and disaster risk. Geogr. Sustain. 2021, 2, 216–223. [Google Scholar] [CrossRef]
- Khan, M.T.I.; Anwar, S.; Sarkodie, S.A.; Yaseen, M.R.; Nadeem, A.M.; Ali, Q. Natural disasters, resilience-building, and risk: Achieving sustainable cities and human settlements. Nat. Hazards 2023, 118, 611–640. [Google Scholar] [CrossRef]
- Bashawri, A.; Garrity, S.; Moodley, K. An overview of the design of disaster relief shelters. Procedia Econ. Financ. 2014, 18, 924–931. [Google Scholar] [CrossRef]
- Asgary, A.; Azimi, N. Choice of emergency shelter: Valuing key attributes of emergency shelters. Int. J. Disaster Resil. Built Environ. 2019, 10, 130–150. [Google Scholar] [CrossRef]
- Ma, Y.; Xu, W.; Qin, L.; Zhao, X. Site selection models in natural disaster shelters: A review. Sustainability 2019, 11, 399. [Google Scholar] [CrossRef]
- Fang, D.; Pan, S.; Li, Z.; Yuan, T.; Jiang, B.; Gan, D.; Sheng, B.; Han, J.; Wang, T.; Liu, Z. Large-scale public venues as medical emergency sites in disasters: Lessons from COVID-19 and the use of Fangcang shelter hospitals in Wuhan, China. BMJ Glob. Health 2020, 5, e002815. [Google Scholar] [CrossRef] [PubMed]
- Zhao, L.; Li, H.; Sun, Y.; Huang, R.; Hu, Q.; Wang, J.; Gao, F. Planning emergency shelters for urban disaster resilience: An integrated location-allocation modeling approach. Sustainability 2017, 9, 2098. [Google Scholar] [CrossRef]
- Wei, Y.; Jin, L.; Xu, M.; Pan, S.; Xu, Y.; Zhang, Y. Instructions for planning emergency shelters and open spaces in China: Lessons from global experiences and expertise. Int. J. Disaster Risk Reduct. 2020, 51, 101813. [Google Scholar] [CrossRef] [PubMed]
- Chen, W.; Zhai, G.; Ren, C.; Shi, Y.; Zhang, J. Urban resources selection and allocation for emergency shelters: In a multi-hazard environment. Int. J. Environ. Res. Public Health 2018, 15, 1261. [Google Scholar] [CrossRef]
- Klein, R.J.; Nicholls, R.J.; Thomalla, F. Resilience to natural hazards: How useful is this concept? Glob. Environ. Chang. Part B Environ. Hazards 2003, 5, 35–45. [Google Scholar] [CrossRef]
- Holling, C.S. Resilience and stability of ecological systems. Annu. Rev. Ecol. Syst. 1973, 4, 1–23. [Google Scholar] [CrossRef]
- Yin, H.; Xiao, R.; Fei, X.; Zhang, Z.; Gao, Z.; Wan, Y.; Tan, W.; Jiang, X.; Cao, W.; Guo, Y. Analyzing” Economy-Society-Environment” sustainability from the perspective of urban spatial structure: A case study of the Yangtze River Delta Urban Agglomeration. Sustain. Cities Soc. 2023, 96, 104691. [Google Scholar] [CrossRef]
- Sharifi, A. The Resilience of Urban Social-Ecological-Technological Systems (SETS): A Review. Sustain. Cities Soc. 2023, 99, 104910. [Google Scholar] [CrossRef]
- Ribeiro, P.J.G.; Gonçalves, L.A.P.J. Urban resilience: A conceptual framework. Sustain. Cities Soc. 2019, 50, 101625. [Google Scholar] [CrossRef]
- Masnavi, M.; Gharai, F.; Hajibandeh, M. Exploring urban resilience thinking for its application in urban planning: A review of literature. Int. J. Environ. Sci. Technol. 2019, 16, 567–582. [Google Scholar] [CrossRef]
- Zeng, X.; Yu, Y.; Yang, S.; Lv, Y.; Sarker, M.N.I. Urban resilience for urban sustainability: Concepts, dimensions, and perspectives. Sustainability 2022, 14, 2481. [Google Scholar] [CrossRef]
- Wu, Y.; Chen, S. Traffic resilience modeling for post-earthquake emergency medical response and planning considering disrupted infrastructure and dislocated residents. Int. J. Disaster Risk Reduct. 2023, 93, 103754. [Google Scholar] [CrossRef]
- Alawi, M.; Chu, D.; Hammad, S. Resilience of Public Open Spaces to Earthquakes: A Case Study of Chongqing, China. Sustainability 2023, 15, 1092. [Google Scholar] [CrossRef]
- Wu, Y.; Chen, S. Transportation Resilience Modeling and Bridge Reconstruction Planning Based on Time-Evolving Travel Demand during Post-Earthquake Recovery Period. Sustainability 2023, 15, 12751. [Google Scholar] [CrossRef]
- Liu, W.; Zhou, J.; Li, X.; Zheng, H.; Liu, Y. Urban Resilience Assessment and Its Spatial Correlation from the Multidimensional Perspective: A Case Study of Four Provinces in North-South Seismic Belt, China. Sustain. Cities Soc. 2023, 101, 105109. [Google Scholar] [CrossRef]
- Lin, Z.; Peng, S.; Ma, X. Research on the Spatial Pattern of Living Service Industry in Kunming City Based on POI Data. In Proceedings of the 2021 IEEE 4th Advanced Information Management, Communicates, Electronic and Automation Control Conference (IMCEC), Chongqing, China, 18–20 June 2021; pp. 299–303. [Google Scholar]
- Lu, X.-Y.; Chen, X.; Zhao, X.-L.; Lv, D.-J.; Zhang, Y. Assessing the impact of land surface temperature on urban net primary productivity increment based on geographically weighted regression model. Sci. Rep. 2021, 11, 22282. [Google Scholar] [CrossRef]
- Indirli, M. An historical flight and some open questions towards a pluralistic but holistic view of resilience. Geogr. Anthr. 2019, 2, 194–248. [Google Scholar]
- Indirli, M.; Borg, R.P.; Formisano, A.; Martinelli, L.; Marzo, A.; Romagnoli, F.; Romanelli, F. Building Resilience in Times of New Global Challenges: A Focus on Six Main Attributes. In Geohazards and Disaster Risk Reduction: Multidisciplinary and Integrated Approaches; Springer: Berlin/Heidelberg, Germany, 2023; pp. 293–319. [Google Scholar]
- Liu, K. GIS-based MCDM framework combined with coupled multi-hazard assessment for site selection of post-earthquake emergency medical service facilities in Wenchuan, China. Int. J. Disaster Risk Reduct. 2022, 73, 102873. [Google Scholar] [CrossRef]
- Cao, F.; Xu, X.; Zhang, C.; Kong, W. Evaluation of urban flood resilience and its space-time evolution: A case study of Zhejiang Province, China. Ecol. Indic. 2023, 154, 110643. [Google Scholar] [CrossRef]
- Ahmed, T.; Rehman, K.; Shafique, M.; Shah, N.A.; Azeem, M.W. Local-scale integrated seismic risk assessment using satellite data and field information in Northern Pakistan. Stoch. Environ. Res. Risk Assess. 2024, 1–22. [Google Scholar] [CrossRef]
- Zhang, Z.; Qian, Z.; Zhong, T.; Chen, M.; Zhang, K.; Yang, Y.; Zhu, R.; Zhang, F.; Zhang, H.; Zhou, F. Vectorized rooftop area data for 90 cities in China. Sci. Data 2022, 9, 66. [Google Scholar] [CrossRef]
- Yi, G.X.; Wen, X.Z.; Su, Y.J. Study on the potential strong-earthquake risk for the eastern boundary of the Sichuan-Yunnan active faulted-block, China. Chin. J. Geophys. 2008, 51, 1151–1158. [Google Scholar]
- Wu, B.; Yang, C.; Wu, Q.; Wang, C.; Wu, J.; Yu, B. A building volume adjusted nighttime light index for characterizing the relationship between urban population and nighttime light intensity. Comput. Environ. Urban Syst. 2023, 99, 101911. [Google Scholar] [CrossRef]
- Yu, B.; Zhou, Y.; Small, C.; Elvidge, C.D.; Chen, Z. Foreword to the Special Issue on Advances in Remote Sensing of Nighttime Lights: Progresses, Challenges, and Perspectives. IEEE J. Sel. Top. Appl. Earth Obs. Remote Sens. 2020, 13, 6454–6456. [Google Scholar] [CrossRef]
- Liu, Y.; Liu, W.; Zhang, X.; Lin, Y.; Zheng, G.; Zhao, Z.; Cheng, H.; Gross, L.; Li, X.; Wei, B. Nighttime light perspective in urban resilience assessment and spatiotemporal impact of COVID-19 from January to June 2022 in mainland China. Urban Clim. 2023, 50, 101591. [Google Scholar] [CrossRef]
- Liu, Y.; Liu, W.; Qiu, P.; Zhou, J.; Pang, L. Spatiotemporal Evolution and Correlation Analysis of Carbon Emissions in the Nine Provinces along the Yellow River since the 21st Century Using Nighttime Light Data. Land 2023, 12, 1469. [Google Scholar] [CrossRef]
- Patro, S.; Sahu, K.K. Normalization: A preprocessing stage. arXiv 2015, arXiv:1503.06462. [Google Scholar] [CrossRef]
- Zhu, Y.; Tian, D.; Yan, F. Effectiveness of entropy weight method in decision-making. Math. Probl. Eng. 2020, 2020, 3564835. [Google Scholar] [CrossRef]
- Malekinezhad, H.; Sepehri, M.; Pham, Q.B.; Hosseini, S.Z.; Meshram, S.G.; Vojtek, M.; Vojteková, J. Application of entropy weighting method for urban flood hazard mapping. Acta Geophys. 2021, 69, 841–854. [Google Scholar] [CrossRef]
- Ni, X.; Quan, Y. Measuring the Sustainable Development of Marine Economy Based on the Entropy Value Method: A Case Study in the Yangtze River Delta, China. Sustainability 2023, 15, 6719. [Google Scholar] [CrossRef]
- Kumar, R.; Singh, S.; Bilga, P.S.; Singh, J.; Singh, S.; Scutaru, M.-L.; Pruncu, C.I. Revealing the benefits of entropy weights method for multi-objective optimization in machining operations: A critical review. J. Mater. Res. Technol. 2021, 10, 1471–1492. [Google Scholar] [CrossRef]


| Target Level | Criterion Level | Indicator Level |
|---|---|---|
| Resilience | Safety | Slope |
| Distance from faults | ||
| Distance from Buildings | ||
| Robustness | Area | |
| Population density | ||
| TNLI | ||
| Accessibility | Distance from roads | |
| Distance from hospitals | ||
| Distance from water |
| Data Type | Data Sources | |
|---|---|---|
| Administrative boundary (2023) | http://www.ngcc.cn/ngcc/ (accessed on 1 November 2023) | |
| Shelters | Most (2023) | https://www.openstreetmap.org (accessed on 1 November 2023) |
| Supplement (2023) | https://earth.google.com/web/ (accessed on 1 November 2023) | |
| Road Network (2023) | https://www.openstreetmap.org (accessed on 10 November 2023) | |
| Buildings | 97% accuracy (2020) | https://data.tpdc.ac.cn/en/data/60dac98deec4-41df-9ad5-b1563e5c532c/ (accessed on 10 November 2023) |
| 100% accuracy (2023) | https://www.openstreetmap.org (accessed on 10 November 2023) | |
| Nighttime light (2022) | https://engine-aiearth.aliyun.com (accessed on 10 November 2023) | |
| Target Level | Criterion Level | Weight | Indicator Level | Weight |
|---|---|---|---|---|
| Resilience | Safety | 0.225 | Slope | 0.008 |
| Distance from faults | 0.080 | |||
| Distance from Buildings | 0.137 | |||
| Robustness | 0.756 | Area | 0.680 | |
| Population density | 0.037 | |||
| TNLI | 0.039 | |||
| Accessibility | 0.019 | Distance from roads | 0.004 | |
| Distance from hospitals | 0.002 | |||
| Distance from water | 0.013 |
| Subdistrict | Level | Safety | Robustness | Accessibility | Resilience |
|---|---|---|---|---|---|
| Wuhua | Low | 19.78% | 6.13% | 5.85% | 8.64% |
| Mid-Low | 44.57% | 51.81% | 23.40% | 57.94% | |
| Medium | 31.48% | 40.67% | 29.53% | 32.03% | |
| Mid-High | 3.34% | 0.84% | 24.79% | 0.84% | |
| High | 0.84% | 0.56% | 16.43% | 0.56% | |
| Chenggong | Low | 0.00% | 31.17% | 22.08% | 16.88% |
| Mid-Low | 0.00% | 20.78% | 29.87% | 23.38% | |
| Medium | 6.49% | 20.78% | 25.97% | 33.77% | |
| Mid-High | 70.13% | 18.18% | 14.29% | 16.88% | |
| High | 23.38% | 9.09% | 7.79% | 9.09% |
Disclaimer/Publisher’s Note: The statements, opinions and data contained in all publications are solely those of the individual author(s) and contributor(s) and not of MDPI and/or the editor(s). MDPI and/or the editor(s) disclaim responsibility for any injury to people or property resulting from any ideas, methods, instructions or products referred to in the content. |
© 2024 by the authors. Licensee MDPI, Basel, Switzerland. This article is an open access article distributed under the terms and conditions of the Creative Commons Attribution (CC BY) license (https://creativecommons.org/licenses/by/4.0/).
Share and Cite
Zhou, J.; Liu, W.; Lin, Y.; Wei, B.; Liu, Y. The Evaluation and Comparison of Resilience for Shelters in Old and New Urban Districts: A Case Study in Kunming City, China. Sustainability 2024, 16, 3022. https://doi.org/10.3390/su16073022
Zhou J, Liu W, Lin Y, Wei B, Liu Y. The Evaluation and Comparison of Resilience for Shelters in Old and New Urban Districts: A Case Study in Kunming City, China. Sustainability. 2024; 16(7):3022. https://doi.org/10.3390/su16073022
Chicago/Turabian StyleZhou, Jie, Wenyi Liu, Yu Lin, Benyong Wei, and Yaohui Liu. 2024. "The Evaluation and Comparison of Resilience for Shelters in Old and New Urban Districts: A Case Study in Kunming City, China" Sustainability 16, no. 7: 3022. https://doi.org/10.3390/su16073022
APA StyleZhou, J., Liu, W., Lin, Y., Wei, B., & Liu, Y. (2024). The Evaluation and Comparison of Resilience for Shelters in Old and New Urban Districts: A Case Study in Kunming City, China. Sustainability, 16(7), 3022. https://doi.org/10.3390/su16073022