Article

Stock of Carbon and Soil Organic Fractions in No-Tillage and Crop–Livestock Integration Systems

by
Camila dos Santos Ferreira
1,*,
Rose Luiza Moraes Tavares
1,*,
Silvio Vasconcelos de Paiva Filho
1,
Veridiana Cardozo Gonçalves Cantão
1,
Gustavo André Simon
1,
José Milton Alves
2,
Hemython Luis Bandeira do Nascimento
3 and
Ubirajara Oliveira Bilego
3
1
Postgraduate Program in Plant Production, Universidade de Rio Verde, Rio Verde 75901-970, GO, Brazil
2
Instituto Federal de Educação, Ciência e Tecnologia de Goiás, Rio Verde 75901-970, GO, Brazil
3
Centro Tecnológico, Cooperativa Agroindustrial dos Produtores Rurais do Sudoeste Goiano, Rio Verde 75913-899, GO, Brazil
*
Authors to whom correspondence should be addressed.
Sustainability 2024, 16(7), 3025; https://doi.org/10.3390/su16073025
Submission received: 21 February 2024 / Revised: 14 March 2024 / Accepted: 15 March 2024 / Published: 5 April 2024
(This article belongs to the Section Sustainable Agriculture)

Abstract

:
Soil use and management practices influence the quantity and quality of soil organic matter (SOM). From this perspective, the objective of this work was to evaluate the carbon stock and SOM fractions in a no-tillage (NT) and crop–livestock integration (CL) system in the Cerrado biome. The treatments were divided into four areas, subdivided into an area under NT with 11 years of cultivation, two areas under CL with 5 or 10 years of cultivation, and an area of native vegetation (NV). Undisturbed and disturbed soil (Ferralsols) samples were collected in layers 0.0–0.1, 0.1–0.2, 0.2–0.4, and 0.4–0.6 m for the evaluations of soil properties, including bulk density, weighted mean diameter, clay content, carbon stock, carbon stock of light and mineral fractions, humification rate, and carbon management index. The results obtained suggest that the environments with the highest conservation of the physical properties of the soil are those that contain the highest levels of stable C. The main mechanism for C protection in the systems evaluated was mainly associated with physical protection, promoted by soil aggregates, capable of keeping C protected, and mitigation of C into the atmosphere. The values of the carbon management index in the agriculture areas were >100, indicating that these production systems could approach the soil quality of the native vegetation reference system.

1. Introduction

Terrestrial ecosystems are fundamental to the carbon cycle, and soil is the largest pool of carbon [1]. Organic carbon (Corg) is stabilized in natural ecosystems; however, when areas of natural vegetation are converted to agricultural production areas, a decrease in C content is observed [2,3], especially when crop management substantially reduces residues’ input or increases the soil organic matter (SOM) decomposition rate by the action of microorganisms.
In Brazil, large soil C loss in the Cerrado has been observed due to agricultural expansion in this region, which begins with the conversion of native forests to agricultural areas, and this has implications for the global C cycle [2]. Global soil C losses due to the conversion of native vegetation to crops amount to an accumulated 133 Pg C in the top 2 m layer of soil [4].
Aiming to minimize these challenges, conservation production systems such as no-tillage (NT) and crop–livestock (CL) systems have been gaining ground to combine sustainability with high productivity [5]. The NT is the main agricultural system of grain production, with soybeans planted in the summer (September–February) and maize in the winter (February–June). In CL systems, soybeans are planted in the summer, and grazing with animals is carried out over the winter.
In these systems, it is common for soil disturbance to be restricted to the seeding row, reducing C losses and maintaining crop residues on the soil’s surface (coming mainly after the planting of maize in the NT and the forage crops in the CL), improving its physical, chemical, and biological properties [6,7,8] in addition to keeping more carbon stock compared to conventional tillage systems. A review study [2] on Cerrado soils demonstrated that these systems, when well-established, accumulate an average of 29.33 Mg ha−1 in the 0–10 cm layer, while the amount accumulated by native vegetation is 37.51 Mg ha−1.
Soil C-Stock can be used as an indicator of the sustainable functioning of an agricultural system [9,10]. In addition, assessments of the stock of organic matter fractions are important to identify the quality and functionality of the material added to the soil. Thus, the assessment of the quantity of total C stock, combined with the organic fractions in the soil, can indicate the level of sustainability of agricultural systems, with this assessment being based on an index (carbon management index—CMI) proposed by [11] which relates the potential of an area for carbon stock (C-Stock) to a reference area (without anthropogenic changes).
In this context, there are different fractions of SOM, such as physical fractions, with different molecular weights that reflect the availability of C in the soil, with the light fraction (C-LF) being more available and the mineral fraction (C-MIN) less available to soil microorganisms [12,13]. The C-LF fraction is related to SOM that is not linked to soil aggregates, which makes it more susceptible to the action of microorganisms and, consequently, accelerates decomposition [14]. It comes from plant residues, roots, and hyphae with recognizable cellular structures and is a fraction considered sensitive to short-term management practices; therefore, its determination is important in evaluating the management system adopted [15,16]. C-MIN is associated with clay minerals in the soil, presents more protected decomposed material, and, thus, does not suffer as much from the action of microorganisms. This is a fraction less sensitive to crop treatments in the short term [17].
The difference between this fraction and the dynamic C in the soil can be related to the cycling time. In [18], the author found two pools of carbon with different turnover times in Oxisols, with the labile fraction having a shorter turnover time than the recalcitrant fraction. The permanence of carbon in the soil is also influenced by the humification rate of the SOM, which refers to the rate at which organic matter is transformed into humus, a stable form of organic matter in the soil.
Through the relationship between organic fractions, the carbon management index (CMI) was created, aiming to respond to more SOM management practices and system sustainability [11]. However, there is no defined CMI standard for agricultural areas, as it is based on a comparison with a reference area; however, high CMI values are suggested to indicate soil quality or rehabilitation, while lower values indicate more oxidative environments of SOM [19].
Research on carbon management indices in different agricultural systems has shown that agricultural conservation systems can significantly increase carbon sequestration and improve soil quality. In [20,21], both found that moderate grazing intensities in integrated crop–livestock systems can lead to increases in soil carbon stocks, with the best balance between the CMI and animal productivity occurring at specific grazing intensities. The work in [22] further emphasized the importance of conservation practices, such as minimum tillage and organic amendments, in improving the CMI. These studies collectively underscore the potential of no-tillage and integrated crop–livestock systems in enhancing the CMI and mitigating carbon emissions.
Based on this, this work aimed to evaluate the carbon stock, SOM fractions, and CMI in a no-tillage (NT) and crop–livestock (CL) system in the Brazilian Cerrado.

2. Material and Methods

2.1. Experimental Area

The experiment was conducted at the COMIGO Technology Center (CTC), in Rio Verde, state of Goiás, Brazil. The climate is classified as B4 rB′4a′ (humid, small water deficit, mesothermal, and evapotranspiration in summer less than 48%), according to Köppen [23].
The soil under study was classified as a dystrophic Red Oxisol [24] or Ferralsols [25] containing 570 g kg−1 sand, 380 g kg−1 clay, and 50 g kg−1 silt. The chemical characterization of the soil is summarized as pH evaluated in solution with CaCl2 of 5.2, Ca, Mg, and Al of 2.6, 0.86, and 0.001 cmolc dm−3, respectively, K and P of 95.8 and 15.2 mg dm−3, and base saturation of 53.8%.
In this study, different agricultural production systems were evaluated: one area with 0.5 ha under a no-tillage system (NT), soybean (Glycine max)/maize (Zea mays) succession installed in 2010, and two areas of 1,97 ha under the crop–livestock integration system (CL), soybean/forage Urochloa hybrid cv. Mavuno succession, installed in 2011 and 2016. In the area’s use conversion process, native vegetation was removed, and the soil was disturbed with a plow at a depth of 60 cm to correct the pH and in-depth fertilization.
Liming and fertilization management is monitored annually with soil analysis, correction of pH, and fertilization when necessary, following management recommendations for the region. In general, it was applied both in NT and CL, with 2 t ha−1 limestone (neutralization potential of 74%), and fertilization was carried out in the furrow with 400 kg ha−1 of fertilizer 20-08-18, equivalent to 32, 80, 72 kg ha−1 nitrogen, phosphorus, and potassium, respectively, in addition to topdressing with 200 kg ha−1 fertilizer 20-00-20, equivalent to 40 and 72 kg ha−1 nitrogen and potassium, respectively.
For the CL system, Urochloa hybrid cv. Mavuno with grazing was rotated between 7 and 14 days, with 20 (twenty) Nellore calves in each paddock of 2930 m2 with an average mass of 260.4 kg per animal; the beginning of grazing occurred 85 days after sowing Urochloa.

2.2. Soil Sampling

Soil was collected on 7 October 2021, with 4 repetitions per area to a depth of 0.60 m. Disturbed and undisturbed soil samples were taken.
For this, four trenches (distanced by approximately 10 m) were opened for each system, with dimensions of 0.40 × 0.30 × 0.60 m in width, length, and depth, respectively, subdividing the sampling into layers of 0.00–0.10; 0.10–0.20; 0.20–0.40; and 0.40–0.60 m. Undisturbed samples were collected from each trench using 100 cm3 steel cylinders. Clods were removed from each depth to obtain aggregates measuring 4–2 mm, which were selected using a sieve. Around the trenches, disturbed soil samples were extracted using a Dutch auger at the same depths.

2.3. Soil Assessments

Undisturbed samples were used for soil bulk density analysis according to the methodology described by [26]. The aggregates were used to calculate the Weighted Mean Diameter (WMD) using the sieving method [27], and to quantify the WMD, the values were obtained in the respective dry and wet sieving to evaluate the Aggregate Stability Index (ASI) according to Teixeira et al. [26]:
ASI = (WMDwet/WMDdry) × 100
where:
A S I : Aggregate Stability Index (%);
W M D w e t : Weighted Mean Diameter of aggregates in wet sieving (mm);
W M D d r y : Weighted Mean Diameter of aggregates in dry sieving (mm).
Disturbed samples were used to determine soil texture following the method proposed by Teixeira et al. [26], total organic carbon (Corg) according to [28], and SOM fractions, with physical fractionation following the methodology proposed in [29] to obtain the light fraction (LF).
The method to obtain the light fraction (LF) consists of combining chemical dispersion of the soil with sodium hexametaphosphate, and subsequent separation based on size (53 µm sieve to retain the labile fraction associated with sand particles). The retained material was dried in an oven at 50 °C, weighed, and transferred to centrifuge tubes containing sodium iodide (NaI) solution with a density of 1.8 g cm−3. After centrifugation, the supernatant material was filtered and washed to remove NaI, and dried in an oven at 50 °C, thus obtaining the LF of SOM. The characterization of C in the light fraction (C-LF) was carried out using wet combustion, similar to that used for Corg. The carbon of the fraction associated with minerals (C-MIN) was determined from the difference between Corg and C-LF [30] (See Table S1).
Soil C-Stock and organic fractions (light fraction—LF and minerals–MIN) were calculated according to the equation below, with correction of the final calculation by mass soil equivalent [31], considering the treatment under native vegetation as a reference.
C-stock = Corg or Cfractions × Bd × depth
where:
C-Stock: carbon stock or organic fractions (kg m−2);
Corg: organic carbon content or SOM fractions (%);
Bd: bulk density (Mg m−3);
depth: soil depth (m).
The chemical fractionation was carried out to obtain the humic and fulvic acid fractions (C-HA and C-FA) according to the extraction methodology proposed by Benites et al. [32]. With this fraction, it was possible to determine the humification rate using the following relationships [33]:
HR = 100 × (C-HA + C-FA)/Corg
where:
HR: Humification rate (%);
C-HA: carbon from the humic acid fraction (g kg−1);
C-FA: carbon from the fulvic acid fraction (g kg−1);
Corg: total organic carbon (g kg−1).
Both the effect of the treatments and the capacity to store C were evaluated in a relative way by calculating the Carbon Management Index (CMI), which considers the quantity (CEI) and quality (IL) factors of soil C (See Table S1). This index was proposed by Blair [11] and combines quantitative (C-Stock) and qualitative (labile fraction) characteristics of SOM to evaluate the performance of a given management system. CMI values below 100 indicate harmful practices to maintaining SOM and soil quality.
CMI = CEI × LI × 100
where:
CMI: carbon management index;
CEI: carbon efficiency index;
LI: lability index;
CEI = Corg treatment/Corg reference area;
LI = L treatment/L reference area;
L = C-LF/C-MIN;
C-LF: Carbon of the light fraction;
C-MIN: Carbon of the mineral fraction.

2.4. Statistical Analysis

The statistical model for data interpretation was split plot, with production systems as the first factor and soil depth as the second. When interpreting data, an analysis of variance was applied, and to compare means, the Tukey test was applied at 5% probability using the Sisvar software (Version 5.8) [34]. Pearson correlation analysis was applied to understand the relations between soil properties.

3. Results and Discussion

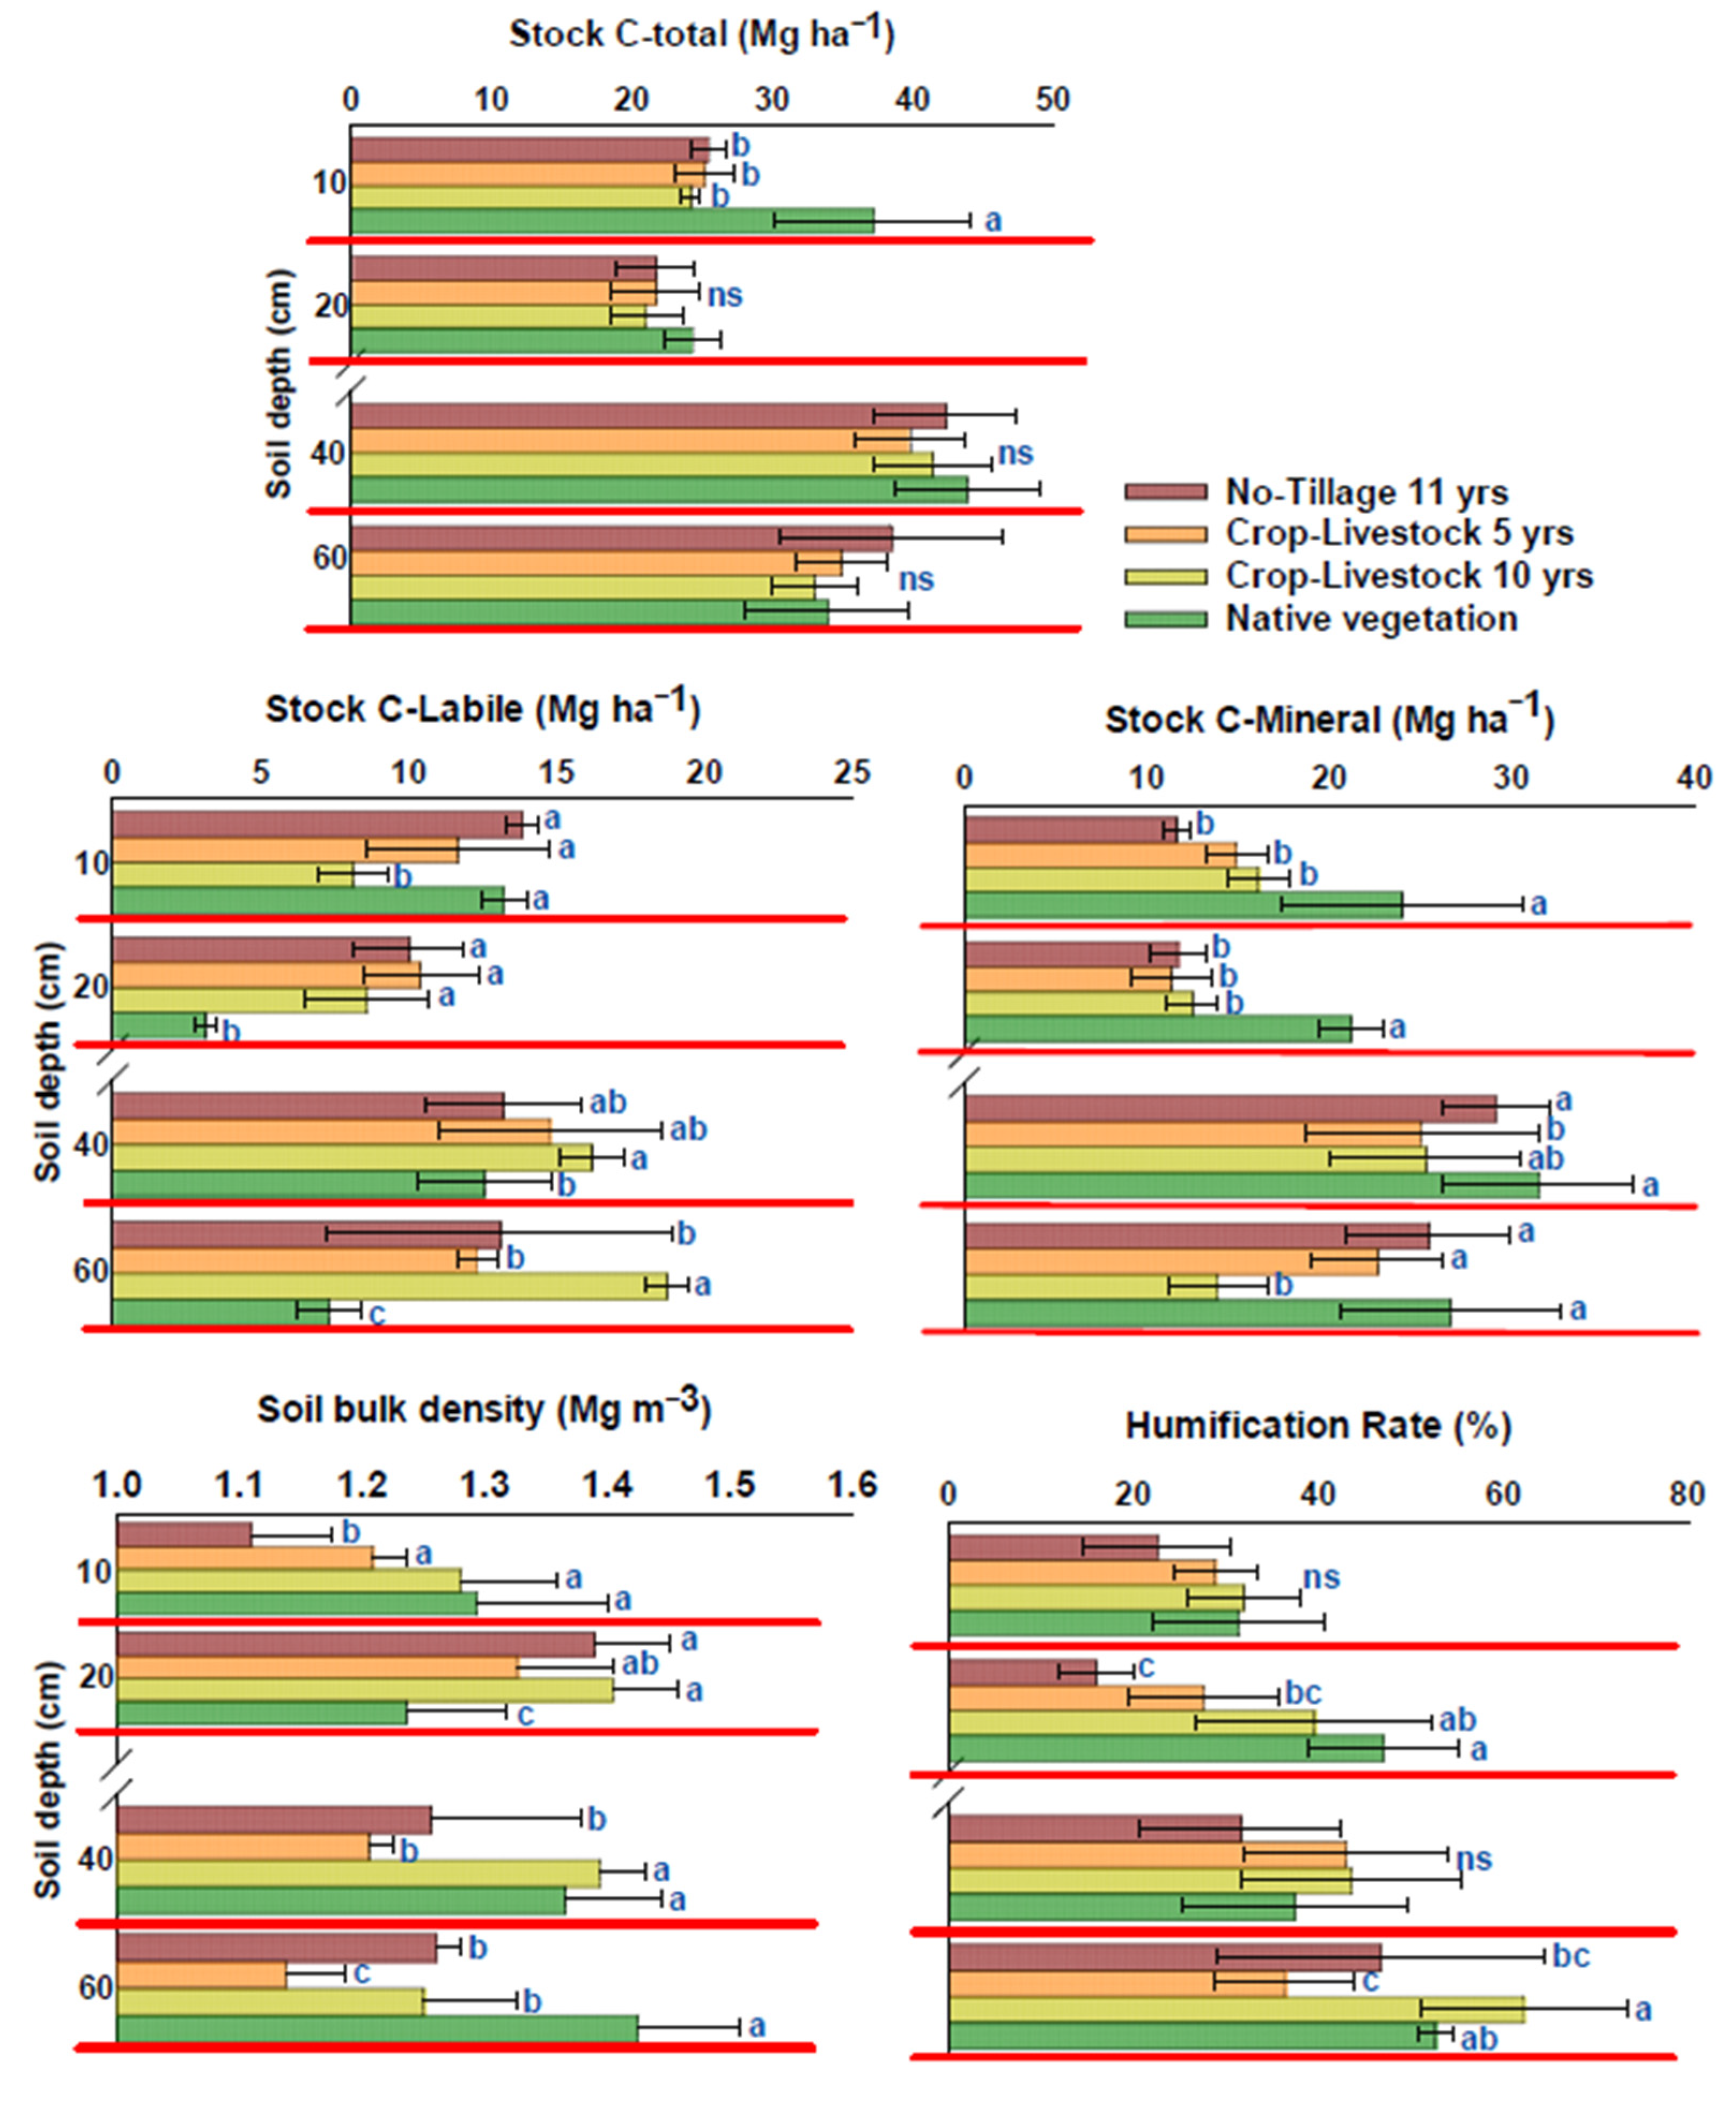
3.1. Physical Properties

The interaction between production systems and soil depth was not significant (p > 0.05) for clay, weighted mean diameter (WMD), and aggregate stability index (ASI), but the factors had an isolated effect on these variables.
The soils under the agricultural production system and native vegetation evaluated, despite being spatially close, have different soil textures regarding the clay content in the agricultural areas varying from 332.6 to 359.7 g kg−1 and the soil under native vegetation with 282.9 g kg−1 (Table 1).
The difference in clay content between agricultural areas and native vegetation was reported in a carbon stock review for soils in Cerrado [2]. According to the authors, areas under native vegetation, often used as a reference for soil C change estimations, presented, on average, lower clay contents compared to other land uses. Specifically, for croplands, overall clay contents are 25% higher than in native vegetation. In most cases, the farmers choose the least productive areas (e.g., sand areas) for native vegetation preservation, following the Brazilian law that requires that part of the agricultural area be preserved with native vegetation.
The weighted mean diameter (WMD) showed a significant difference between areas, with values between 1.21 and 0.37 mm, and was higher in the NV area, generally following the order NV > CL-10 > NT-11 > CL-5 (Table 1), demonstrating that the highest WMD values were found in the NT and CL areas with the longest history of implementation (Table 1), indicating the importance of maintaining these systems to improve the physical quality of the soil.
Higher WMD values were found in the deepest layer, probably due to the greater preservation of the soil in this layer. This is because, in agricultural management systems, the layer from 0 to 0.40 m is more susceptible to disturbance actions, whether for soil preparation purposes, fertility management, or decompaction [35].
As for the aggregate stability index, the NV and CL-10 areas presented higher ASI values, 24.93 and 19.37%, respectively, than CL-5, with 7.31%, indicating the benefit of CL-10 for the physical stability of soil aggregates (Table 1). A factor that may have contributed to this result is the lower change in the soil for a longer period (10 years). When evaluating the soil layer, the ASI presents a similar trend to the WMD, as they are dependent properties; thus, the ASI showed greater stability in the deeper layer (Table 1).
Soil bulk density was significant (p < 0.05) for all soil depths, with different responses depending on the depth assessed. For example, in the surface layer, it was possible to identify lower soil Bd in the NT-11 area, 1.11 Mg ha−1, than other areas with values of 1.20, 1.28, and 1.29 Mg ha−1 in soil under CL-5, CL-10, and NV, respectively (Figure 1).
The lower value of soil Bd in the NT-11 area can be attributed to the minimum soil disturbance during sowing using tools attached to the seeder, such as a rod or disc [36]. In this system, planting throughout the year is more frequent, that is, two harvests per year, which makes soil management more frequent compared to the CL system, characterized by soybean planting during the harvest and grazing management during the off-season. In the native vegetation area, the higher soil density may be related to the sandier texture of this soil.
In the 0.10–0.20 m layer, the agricultural areas showed higher bulk density, with values between 1.30 and 1.40 Mg ha−1, than the NV area, with 1.23 Mg ha−1 (Figure 1). In these agricultural systems, this layer, in general, is the most affected due to intensive and frequent machinery traffic, the weight of the machines tending to transfer tensions to the subsurface layers of the soil, causing compaction. According to [37], the soil layer with the highest compaction sensitivity is up to 0.20 m in no-tillage systems. In grazing systems, densification is more frequent in these superficial layers [38].
However, in the other layers (0.20–0.40 and 0.40–0.60 m), high bulk density values remained mainly in the NV area and lower in areas under NT-11 and CL-5. The hypothesis is that the higher density in the NV area is related to the higher amount of sand in the soil than in other areas since sand (particle density) tends to make the soil naturally denser.
In Brazilian soils, there is an increase in soil compaction with high levels of total and fine sand and a reduction in soil compaction with a higher amount of clay [39]. This is due to the smaller particle size (lower density of soil particles) and higher organic matter content in clay soils, which create more total pore space (macroporosity and microporosity). In contrast, sandy soils have higher-density particles (more macroporosity) and lower organic matter content, resulting in higher bulk density.

3.2. Total Carbon Stock and SOM Fractions

Differences in carbon stock (C-Stock) between production systems were only significant (p < 0.05) in the 0.00–0.10 m soil layer, with the highest C-Stock found in the NV area, with 37.19 Mg ha−2 followed by 25.48, 25.27, and 24.22 Mg ha−2 in NT-11, CL-5, and CL-10, respectively (Figure 1). This result can be explained by the conversion of natural vegetation areas to agricultural areas, the process of which reduces the C stock in the soil [3,40], mainly in the surface layer, which is more subject to constant changes during agricultural management.
Figure 1. Effect of agricultural production systems on total organic carbon stock and organic fractions evaluated at different soil depths. Means followed by different letters in each soil layer (delimited by the red line) are significantly different by Tukey’s test at 5% probability. ns: no significant difference.
Sustainability 16 03025 g001
For Freitas et al. [10], agricultural activities alter the accumulation of C due to the constant disturbances occurring in the system. For example, soil disturbance causes the breakdown of aggregates and exposes SOM to the action of biotic and abiotic factors, making it susceptible to accelerated decomposition and, as a consequence, less accumulation in the soil.
The carbon stock of the light fraction (C-Stock-LF) showed differences in all layers evaluated, with different response patterns found according to the depth evaluated. For the layer 0.00–0.10 m, the lowest soil C-Stock-LF was detected in the CL-10 area; however, when evaluating the other layers, in general, higher C-Stock-LF was observed in the soil of agricultural areas and lower in NV.
This effect can be because the agricultural systems evaluated have annual deposition of plant residues on the soil, which leaves a cover at different stages of decomposition due to the interaction between new and old residues and can reach approximately 7.0–10.0 Mg ha−1 in the region of Rio Verde, state of Goiás [41]. This constant input of residues makes labile organic fractions available in the soil in the short term, as this fraction comes from residues, roots, and hyphae, and the release of this fraction is related to the quantity and quality of residues in the soil [15,16,42,43].
According to [44], when there is a supply of quality carbon, there is a release of more labile fractions in the soil over time. When C is low-quality, the result is more recalcitrant fractions; this is because, according to the authors, during decomposition, plant litter is subjected to microbial activity that determines the quantity and chemical nature of decomposition products. Proportionally, more dissolved organic matter and more carbohydrates and peptides are formed from high-quality (e.g., fine roots and herbs) litter than low-quality (e.g., needle and wood) litter, which loses most of the C as CO2 [44]. The ultimate fate of the decomposition products depends on their interactions with the soil mineral matrix.
Thus, the NT and CL agricultural production systems demonstrated potential in keeping the SOM dynamics active, even with a more recent history of implementation. This is due to the minimum or no-tillage soil and annual residue deposition on the soil, which increases the quantity and quality of organic material in the soil [42,43]. Thus, these agricultural managements are recommended to achieve more sustainable agriculture, maintaining production combined with soil conservation.
The carbon stock associated with minerals (C-Stock-MIN) was significant at all depths, and in the 0.00–0.10 and 0.10–0.20 m layers, higher C-Stock-MIN in the soil was observed in NV, with 23.97 and 21.19 Mg ha−1, than in the NT and CL systems, with a variation of 11–16 Mg ha−1.
In deeper layers (0.20–0.40 and 0.40–0.60 m), in general, areas NV and NT-11 or CL-10 (with longer system implementation time) showed higher C-Stock-MIN than the CL-5 area, with a more recent implementation.
C-Stock-MIN represents a compartment with SOM more protected from decomposition, whose protection mechanism is associated with clay minerals, which was confirmed here by the significant correlation between C-Stock-MIN and clay of 0.30 (Table 2). Thus, proportionally more stable soil organic matter (SOM) accumulates in soils with a high soil matrix stabilization [13,44,45]. Furthermore, C-Stock-MIN showed a significant positive correlation with ASI (0.38) (Table 2), which may also explain the higher C-Stock-MIN in the NV area. As no anthropogenic changes occur in the soil structure in this area, C is better protected by aggregates and, therefore, more stable in the mineral fraction of the soil.
Most studies indicate that the C-MIN fraction, due to its recalcitrant nature, is not easily affected by land use or management practices in the short term [19,46], and the stable environment of NV provides a convenient environment for SOM stocks [47,48]. Furthermore, management with older implementation histories tends to result in a more stable type of SOM, with slower and more gradual decomposition.
Similarly [49], in the 0.10–0.20 m layer, higher C-Stock -MIN was verified in the soil under native Cerrado, with 32.04 Mg ha−1, than in areas under pasture and NT (3 years) with C-Stock-MIN of 10.14 and 10.56 Mg ha−1, respectively.
Table 2. Pearson correlation analysis for total carbon stocks in the soil (C-Stock), C stocks in the light fraction (C-Stock-LF), C associated with minerals (C-Stock-MIN), humification rate (HR), Carbon Management Index (CMI), clay, sand, bulk density (Bd), Weighted Mean Diameter (WMD), Aggregate Stability Index (ASI).
C-Stock-LFC-Stock-MINHRCMIClaySandBdWMDASI
C-Stock0.51 **0.87 **0.29 *−0.35 **0.22−0.150.040.37 *0.33 **
C-Stock—LF 0.050.160.21−0.070.25−0.170.120.08
C-Stock—MIN 0.24 *−0.55 **0.30 *−0.30 *0.140.35 **0.33 **
HR −0.030.01−0.240.070.50 **0.49 **
CMI −0.41 **0.180.20−0.24−0.23
Clay −0.55 **−0.140.37 **0.41 **
Sand −0.01−0.18−0.17
Bd 0.220.18
WMD 0.91 **
*: significant at 1%; **: significant at 5%.
The humification rate varied in the layers of 0.10–0.20 and 0.40–0.60 cm between production systems (Figure 1), and in layer 0.10–0.20 m, HR was higher in the soil under NV (47.09%) and lower in soil under NT 11 (15.90%). Therefore, out of 100% of the total organic carbon (Corg) in this layer in the NV area, 47% are humic substances (humic acid and fulvic acid). In the 0.40–0.60 m layer, the soil under CL-10 presented 62% HR, i.e., in this case, more than half of the organic C is in humic form.

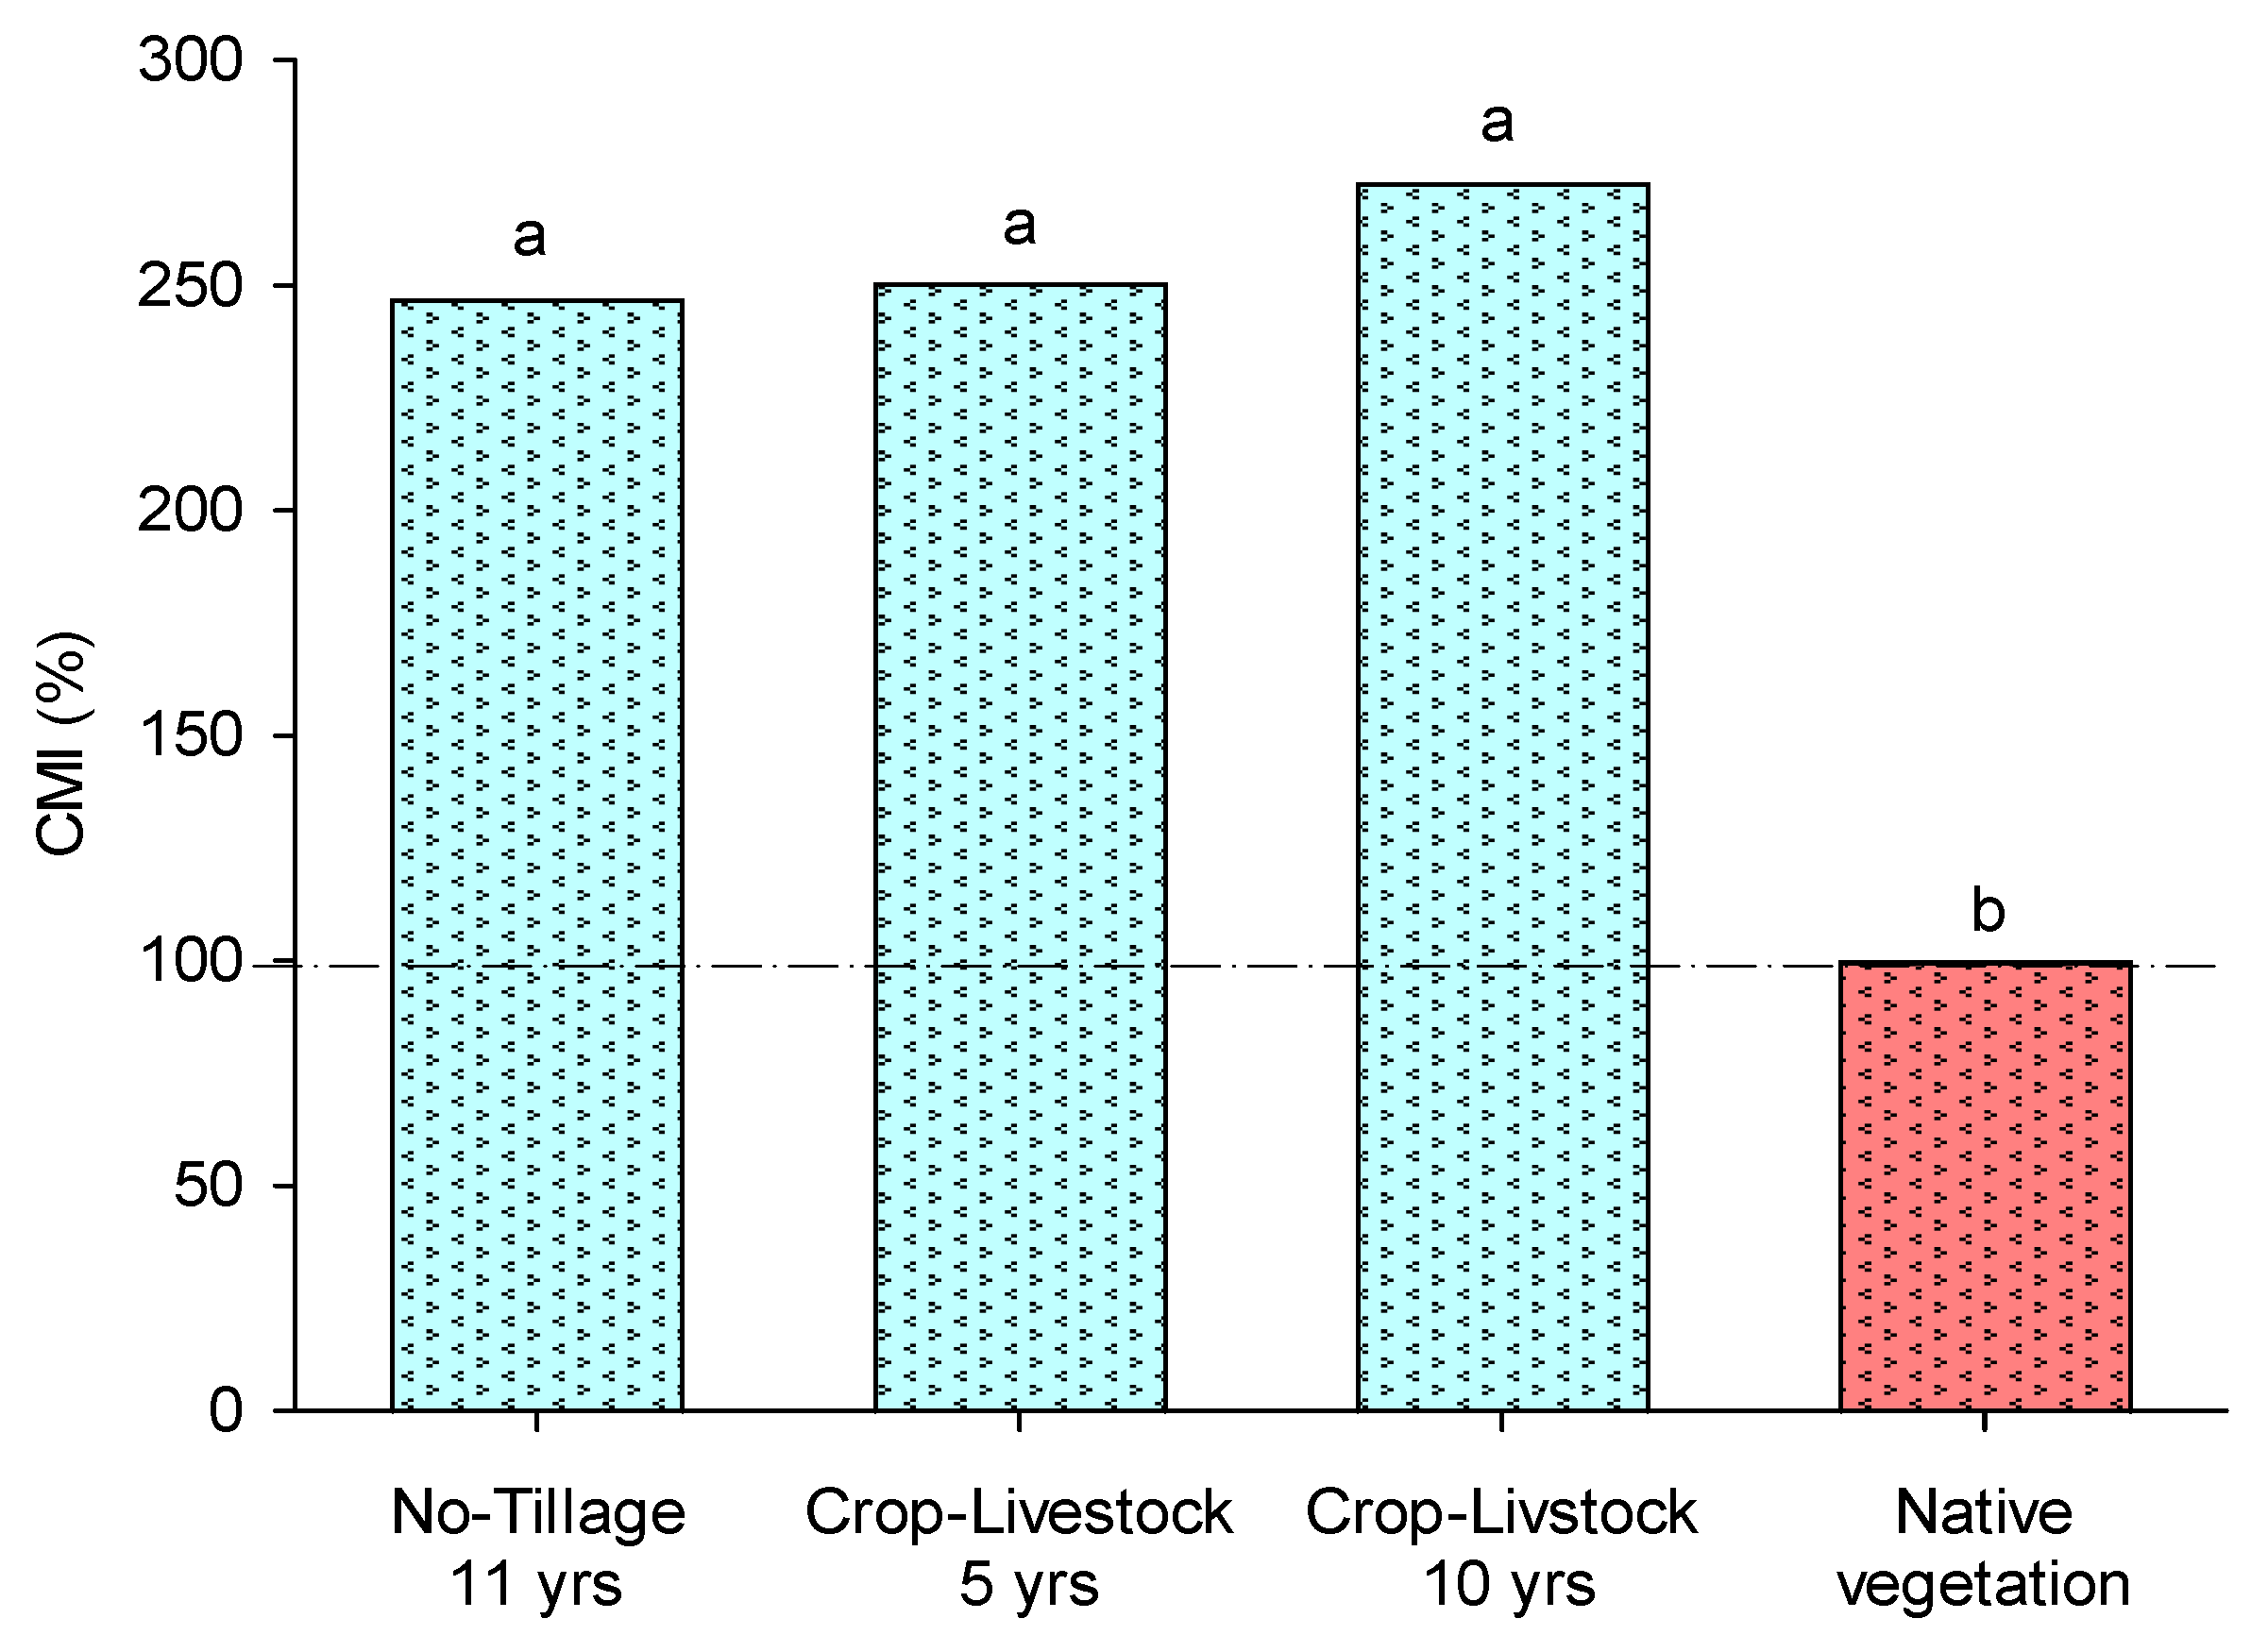
3.3. Carbon Management Index (CMI)

The carbon management index (CMI) showed no significant interaction between the evaluated systems and soil depth (p > 0.05); however, there was a significant difference between the systems. The CMI presented values > 100 (Figure 2). Thus, this result demonstrates the possibility of the evaluated production systems to reach the soil quality of the native vegetation reference system (CMI = 100%). This is because they are systems with annual inputs of residual biomass, increasing C inputs into the soil.
Particularly, CMI values in agricultural areas were higher compared to data from the literature [20,30,42,46]. However, it is important to note that the CMI focuses on the light fractions of SOM, whose results identified higher C-Stock-FL in agricultural areas than in the NV area at the 0.10–0.20 m layer.
The CMI calculation has been adopted to make comparisons regarding management systems, aiming to observe qualitative differences in the soil [12]. As the index focuses on labile carbon, the results indicated that NT and CL systems generated more labile SOM fractions, arising from the higher deposition of partially decomposed plant residues with short-term transformations [19]. Thus, for this study, the lower CMI was shown to be less labile but more stable, important for soil preservation and mitigation of C release into the atmosphere.
Other studies have shown the positive effect of no-tillage and cropping systems with a high input of plant residues on increasing CMI as a result of the labile amount of organic matter [30,46].
In a study by Assmann et al. [20], a long period of a crop–livestock integration under no-tillage promoted total, particulate, and mineral-associated organic carbon stocks similar to no-tillage areas, and they reported that CL using moderate grazing intensities is a promising food production system, with continuous improvements in the soil–plant–animal–atmosphere continuum, evolving to higher levels of organization, with positive feedbacks and source–sink relations. Another study [42] did not detect a significant difference in CMI in areas of crop–livestock integration, with a CMI of 124 compared to NT and pasture, with 82 and 136, respectively, using an area of native vegetation as a reference.

3.4. Correlation Analysis and Protection Mechanisms of C

C-Stock showed a significant correlation with the stock of all organic fractions evaluated, with higher correlations with C-Stock-MIN (0.87) and lower with C-Stock-LF (0.51) (Table 2), which indicated that the majority of soil carbon in the NT and CL systems is in the form of more stable fractions.
To reinforce this, the CMI, which takes into account the carbon lability index (more labile fractions), showed a negative correlation with C-Stock (−0.35) and C-Stock-MIN (−0.55), indicating that the systems evaluated tend to accumulate C in the soil with slower and more gradual transformations, favoring the carbon preservation in the soil.
In addition to agricultural management, the amount of clay in the soil is responsible for C dynamics, i.e., clay and CMI showed a negative correlation (−0.41), indicating that in areas with higher clay content, the transformations of C into fractions labile by microorganisms are less active and tend to keep C trapped on the clay surface, as a physical protection mechanism [44]. This interaction was confirmed by the significant correlation between clay and C-Stock-MIN (0.30).
This result helps us understand why clayey soils have higher SOM levels. According to [44], the amount of C in the soil occurs proportionally to its stabilization matrix. This is because clay has a strong interaction with organic particles in the soil, promoting mineral protection from SOM, preventing its mineralization by soil microorganisms, and, therefore, favoring its longer permanence in the soil. This SOM protection mechanism has already been proven in several studies [13,19].
In addition to the clay content, C-Stock-MIN showed a significant correlation with WMD (0.35) and ASI (0.33) (Table 2), indicating that in addition to mineral protection by sorption, this fraction is also protected within the clay soil aggregates, since clay is a component of the aggregates, with a positive correlation with WMD (0.37) and ASI (0.41).
The physical properties of WMD and ASI showed positive correlations with the stock of all fractions (except the labile fraction stock, C-Stock-LF). Thus, another protection mechanism for SOM is promoted by soil aggregates, i.e., the higher stability of aggregates will guarantee greater protection of the occluded C, which remains inside the aggregates [45,50]. The fractions with higher lability in the soil are usually not associated with this protection mechanism.
More frequent correlations of stocks with aggregation parameters than with clay were observed, which indicates that the main C protection mechanism in the evaluated systems is mainly associated with physical protection, promoted by soil aggregates, capable of maintaining protected C and soil with a more stable physical structure [50]. Therefore, the presence of more stable soil carbon fractions in NT and CL systems not only contributes to agricultural sustainability and productivity but also plays an important role in mitigating climate change and conserving natural resources.

4. Conclusions

The no-tillage and crop–livestock systems with the oldest history of implementation showed, similarly to native vegetation, better soil aggregate size and aggregate stability index compared to the area with more recent no-tillage implementation, indicating the importance of maintaining these systems to improve the structural quality of the soil.
Different agricultural production systems and implementation times did not influence C-stock differently. Despite that, most of the soil carbon in the no-tillage and crop–livestock systems is in the form of more stable fractions.
The main mechanism for protecting C in the systems evaluated is mainly associated with physical protection promoted by soil aggregates, capable of keeping C protected and consequently promoting soil with a more stable physical structure and releasing less C into the atmosphere.
The carbon management index showed no significant difference between agriculture areas. The values > 100 indicated that these production systems can approach the soil quality of the native vegetation reference system mainly due to the minimum soil tillage and maintenance of crop residues on the soil, thus increasing C inputs to the soil.

Supplementary Materials

The following supporting information can be downloaded at: https://www.mdpi.com/article/10.3390/su16073025/s1, Table S1: Mean values of total organic carbon (Corg), carbon of Light fraction (C-LF), carbon associated with minerals (C-MIN), Carbon efficiency indices (CEI), LI: lability index (LI) and carbon management index (CMI) with years of establishments and different production systems and soil depths.

Author Contributions

Conceptualization, C.d.S.F. and R.L.M.T.; methodology, C.d.S.F. and R.L.M.T.; software, C.d.S.F. and G.A.S.; validation, V.C.G.C., G.A.S. and J.M.A.; formal analysis, C.d.S.F., R.L.M.T. and G.A.S.; investigation, C.d.S.F.; resources, H.L.B.d.N. and U.O.B.; data curation, C.d.S.F. and S.V.d.P.F.; writing—original draft preparation, C.d.S.F.; writing—review and editing, R.L.M.T.; visualization, R.L.M.T.; project administration, R.L.M.T., H.L.B.d.N. and U.O.B. All authors have read and agreed to the published version of the manuscript.

Funding

This research was funded by Goias Research Foundation (FAPEG), grant number 202310267000260 and Pró-reitoria de Pesquisa e Inovação of Universidade de Rio Verde, grant number 5.01.1.23.031. The APC was funded in part by the Program in Crop Production of Universidade de Rio Verde and Pró-reitoria de Pós-Graduação of Universidade de Rio Verde.

Institutional Review Board Statement

Not applicable.

Informed Consent Statement

Not applicable.

Data Availability Statement

Study data can be obtained by request to the corresponding author or the first author via e-mail.

Acknowledgments

To Centro Tecnológico (CTC), Cooperativa Agroindustrial dos Produtores Rurais do Sudoeste Goiano for providing experimental areas and supporting field analysis.

Conflicts of Interest

The authors declare no conflicts of interest.

References

  1. Wang, D.; Li, C.; Parikh, S.J.; Scow, K.M. Impact of biochar on water retention of two agricultural soils—A multiscale analysis. Geoderma 2019, 340, 185–191. [Google Scholar] [CrossRef]
  2. Oliveira, D.M.S.; Tavares, R.L.M.; Loss, A.; Madari, B.E.; Cerri, C.E.P.; Alves, B.J.R.; Pereira, M.G.; Cherubin, M.R. Climate-smart agriculture and soil C sequestration in Brazilian Cerrado: A systematic review. Rev. Bras. Ciênc. Solo 2023, 47, e0220055. [Google Scholar] [CrossRef]
  3. Braida, J.A.; Reichert, J.M. Matéria orgânica e comportamento mecânico para fins de manejo de solo. In Agricultura Conservacionista No Brasil; Leite, L.F.C., Maciel, G.A., Araújo, A.S.F., Eds.; Embrapa: Brasilia, Brazil, 2014; pp. 309–361. Available online: http://livimagens.sct.embrapa.br/amostras/00054420.pdf (accessed on 14 March 2024).
  4. Intergovernmental Panel on Climate Change—IPCC. Climate Change 2022: Impacts, Adaptation, and Vulnerability; Contribution of Working Group II to the sixth assessment report of the intergovernmental panel on climate change; Cambridge University Press: Cambridge, UK, 2022. [Google Scholar]
  5. Brito, C.F.B.; Fonseca, V.A.; Silva, N.P.; Braga, S.S.; Godinho, F.L.; Kondo, M.K.; Portugal, A.F.; Megda, M.X. Alterações físicas e biológicas de um eutrustox (latossolo) sob plantio direto e preparo convencional no semiárido brasileiro. Cience Del Suelo 2018, 36, 148–155. Available online: https://ojs.suelos.org.ar/index.php/cds/article/view/417 (accessed on 14 March 2024).
  6. Lal, R. Restoring soil quality to mitigate soil degradation. Sustainability 2015, 7, 5875–5895. [Google Scholar] [CrossRef]
  7. Souza, E.D.; Carneiro, M.A.C.; Barbosa Paulino, H.; Ribeiro, D.O.; Bayer, C.; Rotta, L.R. Matéria orgânica e agregação do solo após conversão de “campos de murundus” em sistema plantio direto. Pesqui. Agropecu. Bras. 2016, 51, 1194–1202. [Google Scholar] [CrossRef]
  8. Rossetti, K.V.; Centurion, J.F. Estoque de carbono e atributos físicos de um Latossolo em cronossequência sob diferentes manejos. Rev. Bras. Eng. Agrícola Ambient. 2015, 19, 252–258. [Google Scholar] [CrossRef]
  9. Denardin, R.B.N.; Mattias, J.L.; Wildner, L.P.; Nesi, C.N.; Sordi, A.; Kolling, D.F.; Busnello, F.J.; Cerutti, T. Estoque de carbono no solo sob diferentes formações florestais. Ciênc. Florest. 2014, 24, 59–69. [Google Scholar] [CrossRef]
  10. Freitas, L.; Oliveira, I.A.; Casagrande, J.C.; Silva, L.S.; Campos, M.C.C. Estoque de carbono de latossolos em sistemas de manejo natural e alterado. Ciênc. Florest. 2018, 28, 228–239. [Google Scholar] [CrossRef]
  11. Blair, G.J.; Lefroy, R.D.B.; Lisle, L. Soil carbon fractions based on their degree of oxidation, and the development of a carbon management index for agricultural systems. Aust. J. Agric. Res. 1995, 46, 1459–1466. [Google Scholar] [CrossRef]
  12. Reis, D.A.; Lima, C.L.R.; Bamberg, A.L. Qualidade física e frações da matéria orgânica de um Planossolo sob sistema plantio direto. Pesqui. Agropecu. Bras. 2016, 51, 1623–1632. [Google Scholar] [CrossRef]
  13. Lacroix, E.M.; Masue-Slowey, Y.; Dlott, G.A.; Keiluweit, M.; Chadwick, O.A.; Fendorf, S. Mineral protection and resource limitations combine to explain profile-scale soil carbon persistence. J. Geophys. Res. Biogeosciences 2022, 127, e2021JG006674. [Google Scholar] [CrossRef]
  14. Maksimova, Y.G. Microorganisms and Carbon Nanotubes: Interaction and Applications (Review). Appl. Biochem. Microbiol. 2019, 55, 1–12. [Google Scholar] [CrossRef]
  15. Rangel, O.J.P.; Silva, C.A. Estoques de Carbono e Nitrogênio e Frações Orgânicas de Latossolo submetido a diferentes Sistemas de Uso e Manejo. Rev. Bras. Ciênc. Solo 2007, 31, 1609–1623. [Google Scholar] [CrossRef]
  16. Barreto, A.C.; Freire, M.B.G.S.; Nacif, P.G.S.; Araújo, Q.R.; Freire, F.J.; Inácio, E.S.B. Fracionamento químico e físico do carbono orgânico total em um solo de mata submetido a diferentes usos. Rev. Bras. Ciênc. Solo 2008, 32, 1471–1478. [Google Scholar] [CrossRef]
  17. Kunde, R.J.; Lima, C.L.R.; Anjos Silva, S.D.; Pillon, C.N. Physical fractions of organic matter in an Oxisol cultivated with sugarcane in the state of Rio Grande do Sul, Brazil. Pesqui. Agropecu. Bras. 2016, 51, 1520–1528. [Google Scholar] [CrossRef]
  18. Golchin, A.; Oades, J.M.; Skjemstad, J.O.; Clarke, P. Structural and dynamic properties of soil organic-matter as reflected by 13C natural-abundance, pyrolysis mass-spectrometry and solid-state 13C NMR-spectroscopy in density fractions of an oxisol under forest and pasture. Soil Res. 1995, 33, 59–76. [Google Scholar] [CrossRef]
  19. Sainepo, B.M.; Gachene, C.K.; Karuma, A. Assessment of soil organic carbon fractions and carbon management index under different land use types in Olesharo Catchment, Narok County, Kenya. Carbon Balance Manag. 2018, 13, 4. [Google Scholar] [CrossRef]
  20. Assmann, J.M.; Anghinoni, I.; Martins, A.P.; Costa, S.E.V.G.A.; Cecagno, D.; Carlos, F.S.; Carvalho, P.C.F. Soil carbon and nitrogen stocks and fractions in a long-term integrated crop–livestock system under no-tillage in southern Brazil. Agric. Ecosyst. Environ. 2014, 190, 52–59. [Google Scholar] [CrossRef]
  21. Silva, R.D.; Amado, T.J.C.; Ferreira, A.O.; Assmann, J.M.; Anghinoni, I.; Carvalho, P.C.F. Soil carbon indices as affected by 10 years of integrated crop–livestock production with different pasture grazing intensities in Southern Brazil. Agric. Ecosyst. Environ. 2014, 190, 60–69. [Google Scholar] [CrossRef]
  22. Ghosh, B.N.; Meena, V.S.; Alam, N.M.; Dogra, P.; Bhattacharyya, R.; Sharma, N.K.; Mishra, P.K. Impact of conservation practices on soil aggregation and the carbon management index after seven years of maize–wheat cropping system in the Indian Himalayas. Agric. Ecosyst. Environ. 2016, 216, 247–257. [Google Scholar] [CrossRef]
  23. Lopes Sobrinho, O.P.; Santos, L.N.S.; Santos, G.O.; Cunha, F.N.; Soares, F.A.L.; Teixeira, M.B. Balanço hídrico climatológico mensal e classificação climática de Köppene Thornthwaite para o município de Rio Verde, Goiás. Rev. Bras. Climatol. 2020, 27, 19–33. [Google Scholar] [CrossRef]
  24. Santos, H.G.; Jacomine, P.K.T.; Anjos, L.H.C.; Oliveira, V.A.; Lumbreras, J.F.; Coelho, M.R.; Almeida, J.A.; Araújo Filho, J.C.; Oliveira, J.B.; Cunha, T.J.F. Sistema Brasileiro de Classificação de Solos, 5th ed.; Embrapa: Brasília, Brazil, 2018; p. 355. [Google Scholar]
  25. World Reference Base for Soils Resources. 1998. Available online: https://edepot.wur.nl/493579 (accessed on 21 February 2024).
  26. Teixeira, P.C.; Donagemma, G.K.; Fontana, A.; Teixeira, W.G. Manual de Métodos de Análise de Solos, 3rd ed.; Embrapa: Brasília, Brazil, 2017. [Google Scholar]
  27. Kemper, W.D.; Chepil, W.S. Size distribution of aggregates. In Methods of Soil Analysis, Part 1: Physical and Mineralogical Properties, Including Statistics of Measurement and Sampling; Black, C.A., Ed.; American Society Agronomy: Madison, WI, USA, 1995; Volume 39, pp. 499–510. [Google Scholar]
  28. Sims, J.R.; Haby, V.A. Simplified colorimetric determination of soil organic matter. Soil Sci. 1971, 112, 137–141. [Google Scholar] [CrossRef]
  29. Cambardella, C.A.; Elliott, E.T. Participate Soil Organic-Matter Changes across a Grassland Cultivation Sequence. Soil Sci. Soc. Am. J. 1992, 56, 777–783. [Google Scholar] [CrossRef]
  30. Conceição, P.C.; Bayer, C.; Dieckow, J.; Santos, D.C. Physical fractionation of organic matter and carbon management index of an Alfisol subjected to conservation management systems. Ciênc. Rural 2014, 44, 794–800. [Google Scholar] [CrossRef]
  31. Ellert, B.H.; Bettany, J.R. Calculation of organic matter and nutrients stored in soils under contrasting management regimes. Can. J. Soil Sci. 1995, 75, 529–538. [Google Scholar] [CrossRef]
  32. Benites, V.M.; Madari, B.; Machado, P.L.O.A. Extração e Fracionamento Quantitativo de Substâncias Húmicas do Solo: Um Procedimento Simplificado de Baixo Custo; Embrapa Solos: Rio de Janeiro, Brazil, 2003; p. 7. Available online: https://www.embrapa.br/busca-de-publicacoes/-/publicacao/337076/extracao-e-fracionamento-quantitativo-de-substancias-humicas-do-solo-um-procedimento-simplificado-de-baixo-custo (accessed on 14 March 2024).
  33. Ciavatta, C.; Govi, M.; Vitori Antisari, L.; Sequi, P. Characterization of humified compounds by extraction and fractionation on solid polyvinylpyrrolidone. J. Chromatogr. A 1990, 509, 141–146. [Google Scholar] [CrossRef]
  34. Ferreira, D.F. Sisvar: A computer analysis system to fixed effects split plot type designs. Rev. Bras. Biom. 2019, 37, 529–535. [Google Scholar] [CrossRef]
  35. Souza, S.F.F.; Araújo, M.S.B.; Silva, M.S.L.; Reis, J.S. Estabilidade de agregados de solo em uma topossequência sob diferentes usos. Rev. Bras. Geogr. Física 2021, 14, 4066–4077. [Google Scholar] [CrossRef]
  36. Amami, R.; Ibrahii, K.; Znouda, A.; Abrougui, K.; Sayed, C. Influence of tillage systems on soil bulk density and carbon dioxide emissions in the Mediterranean context. Euro-Mediterr. J. Environ. Integr. 2021, 6, 16. [Google Scholar] [CrossRef]
  37. Nunes, M.R.; Denardin, J.E.; Pauletto, E.A.; Faganello, A.; Pinto, L.F.S. Mitigation of clayey soil compaction managed under no-tillage. Soil Tillage Res. 2015, 148, 119–126. [Google Scholar] [CrossRef]
  38. Bonetti, J.A.; Anghinoni, I.; Bredemeier, C.; Moraes, M.T.; Tormena, C.A.; Gubiani, P.I. Physical recovery of an Oxisol under an integrated crop-livestock system in southern Brazil. Arch. Agron. Soil Sci. 2021, 69, 507–518. [Google Scholar] [CrossRef]
  39. Rossetti, K.V.; Centurion, J.F. A Curva de compactação em Latossolo agrícolas deve ser sempre realizada sem reuso de amostras? Rev. Cienc. Agroambientais 2018, 16, 149–156. [Google Scholar] [CrossRef]
  40. Locatelli, J.L.; Santos, R.S.; Cherubin, M.R.; Cerri, C.E.P. Changes in soil organic matter fractions induced by cropland and pasture expansion in Brazil’s new agricultural frontier. Geoderma Reg. 2022, 28, e00474. [Google Scholar] [CrossRef]
  41. Ferreira, R.V.; Tavares, R.L.M.; Paiva Filho, S.V.; Marasca, I.; Silva, A.G. Off-season strategies to improve soil physical attributes in no-till system in the Brazilian Cerrado. Rev. Bras. Milho Sorgo 2020, 9, e1183. [Google Scholar] [CrossRef]
  42. Salton, J.C.; Mercante, F.M.; Tomazi, M.; Zanatta, J.A.; Concenço, G.; Silva, W.M.; Retore, M. Integrated crop-livestock system in tropical Brazil: Toward a sustainable production system. Agric. Ecosyst. Environ. 2014, 190, 70–79. [Google Scholar] [CrossRef]
  43. Roscoe, R.; Machado, P.L.O.A. Fracionamento Físico do Solo em Estudos da Matéria Orgânica; Embrapa Agropecuária Oeste: Dourados, Brazil, 2002; 86p, Available online: https://www.infoteca.cnptia.embrapa.br/bitstream/doc/246248/1/LV20023.pdf (accessed on 14 March 2024).
  44. Cotrufo, M.F.; Wallenstein, M.D.; Boot, C.M.; Denef, K.; Paul, E. The Microbial Efficiency-Matrix Stabilization (MEMS) framework integrates plant litter decomposition with soil organic matter stabilization: Do labile plant inputs form stable soil organic matter? Glob. Chang. Biol. 2013, 19, 988–995. [Google Scholar] [CrossRef]
  45. Frazão, L.A.; Cardoso, P.H.S.; Almeida Neta, M.N.; Mota, M.F.C.; Almeida, L.L.S.; Ribeiro, J.M.; Bicalho, T.F.; Feigl, B.J. Carbon and nitrogen stocks and organic matter fractions in the topsoil of traditional and agrisilvicultural systems in the Southeast of Brazil. Soil Res. 2021, 59, 794–805. [Google Scholar] [CrossRef]
  46. Bayer, C.; Martin Neto, L.; Mielniczuk, J.; Pavinato, A. Armazenamento de carbono em frações lábeis da matéria orgânica de um Latossolo Vermelho sob plantio direto. Pesqui. Agropecu. Bras. 2004, 39, 677–683. [Google Scholar] [CrossRef]
  47. Guareschi, R.F.; Pereira, M.G.; Perin, A. Deposição de resíduos vegetais, matéria orgânica leve, estoques de Carbono e Nitrogênio e Fósforo remanescente sob diferentes sistemas de manejo no cerrado Goiano. Rev. Bras. Ciênc. Solo 2012, 36, 909–920. [Google Scholar] [CrossRef]
  48. Melo, G.B.; Pereira, M.G.; Perin, A.; Guareschi, R.F.; Soares, P.F.C. Estoques e frações da matéria orgânica do solo sob os sistemas plantio direto e convencional de repolho. Pesqui. Agropecu. Bras. 2016, 51, 1511–1519. [Google Scholar] [CrossRef]
  49. Guareschi, R.F.; Pereira, M.G.; Perin, A. Frações da matéria orgânica em áreas de Latossolo sob diferentes sistemas de manejo no Cerrado do estado de Goiás. Semin. Ciênc. Agrárias 2013, 34, 2615. [Google Scholar] [CrossRef]
  50. Six, J.; Elliott, E.T.; Paustian, K. Soil macroaggregate turnover and microaggregate formation: A mechanism for C sequestration under no-tillage agriculture. Soil Biol. Biochem. 2000, 32, 2099–2103. [Google Scholar] [CrossRef]
Figure 2. Soil carbon management index (CMI) considering the 0.00–0.60 m soil layer in different production systems. Means followed by different letters are significantly different by Tukey’s test at 5% probability.
Sustainability 16 03025 g002
Table 1. Average values of clay, weighted mean diameter (WMD), and aggregate stability index (ASI) of the soil in an area under agricultural production systems and native vegetation in the Cerrado.
Clay (g kg−1)WMD (mm)ASI (%)
Agricultural systems
NT 11332.6 ab0.6 bc13.8 bc
CL 5345.7 ab0.3 c7.3 c
CL 10359.7 a0.9 ab19.3 ab
NV282.9 b1.2 a24.9 a
Depth (m)
0.00–0.10314.2 a0.70 bc12.6 b
0.10–0.20336.3 a0.47 c10.7 b
0.20–0.40340.1 a0.81 b17.4 ab
0.40–0.60n.d.1.16 a24.6 a
Means followed by different letters, in the same column, are significantly different by Tukey’s test, at 5% probability. NT-11: no-tillage system with 11 years of implementation; CL-5: crop–livestock system with 5 years of implementation; CL-10: crop–livestock system with 10 years of implementation; NV: native vegetation area; n.d.: not determined.
Disclaimer/Publisher’s Note: The statements, opinions and data contained in all publications are solely those of the individual author(s) and contributor(s) and not of MDPI and/or the editor(s). MDPI and/or the editor(s) disclaim responsibility for any injury to people or property resulting from any ideas, methods, instructions or products referred to in the content.

