Article

Does Digitalization Facilitate Environmental Governance Performance? An Empirical Analysis Based on the PLS-SEM Model in China

School of Economics and Management, Shanghai Ocean University, Shanghai 201306, China
*
Author to whom correspondence should be addressed.
Sustainability 2024, 16(7), 3026; https://doi.org/10.3390/su16073026
Submission received: 13 March 2024 / Revised: 31 March 2024 / Accepted: 2 April 2024 / Published: 5 April 2024

Abstract

:
The development of digitalization has brought about profound changes in government governance, enterprise production and residents’ daily lives. Whether digitalization inhibits environmental pollution is a question that needs to be answered urgently, as it is of great significance for addressing conflicts between human beings and the ecological environment. Moreover, it provides a theoretical basis for China’s green and sustainable development. China’s environmental governance model is in a new stage of “government, enterprise, and public” multifaceted governance. Therefore, this paper empirically analyzes the impact of digitalization on environmental governance performance and its mediating effect from a multidimensional perspective, using inter-provincial panel data from 2011 to 2020 as a sample and employing structural equation modeling. It is found that digitalization can significantly improve environmental governance performance, while mechanism analysis shows that digitalization improves environmental governance performance through improving government environmental regulation, public environmental participation, and corporate green technology innovation. Heterogeneity analysis shows that the contribution of digitization to environmental governance performance varies significantly according to geographic region and regional innovative capacity. Based on this, policy recommendations are proposed in terms of digitalization construction, the government, public and enterprises to form a multi-governance environmental governance system among the government, public and enterprises.

1. Introduction

A good ecological environment is a priority for improving people’s well-being and directly indicates the level of high-quality development of a country’s economy. With China’s reform and opening up, the scale of economic development continues to expand, and 30 years of rapid economic growth has led to serious environmental pollution problems which cannot be ignored [1], meaning that the comprehensive promotion of environmental governance work cannot be delayed. In order to improve the quality of the ecological environment, the government has promulgated and implemented a series of environmental policies over the past decade and has placed the construction of an ecological civilization in a prominent position, with the concept of “promoting green development” having become the consensus of society as a whole [2]. According to the “2020 China’s ecological environment situation bulletin”, 40.1% of cities above the prefecture level exceeded the ambient air quality standard in 2020 [3], 38.3 percentage points lower than in 2015 [4], showing that the ambient air quality of various has significantly improved. Although, at present, the public and the state are increasingly deepening their understanding of environmental protection and environmental governance, while environmental pollution has been reduced, the environmental carrying capacity of China’s economic system continues to face serious challenges. Establishing how to improve environmental governance performance in the process of economic development has become an important issue for the whole of society.
The digital economy, as a new economic form, has optimized and upgraded the economic structure, facilitating the high-quality development of the economy. It cannot be separated from the iterative development and popularization of the application of digital technology, and the in-depth integration of digital technology with economic and social life has promoted the digital transformation process [5]. Ecological and environmental issues are essentially development and lifestyle issues, so it is worth thinking about the logical connection between digital development and China’s environmental governance performance. Environmental governance targets vary across geographic regions, as do governance approaches, thus determining the diversity of environmental governance performance. In this study, environmental governance performance is defined as the actual effect of environmental pollution in production and living activities. Due to the complexity of environmental problems, environmental governance performance is affected by a variety of factors. Chinese scholars have extensively examined environmental governance performance from multiple perspectives, such as environmental regulation, social capital, and public participation [6,7,8,9,10]; their conclusions suggest that social capital, as a lubricant, effectively promotes residents’ environmentally friendly behaviors, while the government enforcement of environmental policies reduces carbon emissions and enhances environmental governance performance, and public participation can reduce environmental costs, play a supervisory role, and enhance environmental governance performance. Foreign scholars have also conducted relevant research and discussions on the crucial role of local governments in environmental governance performance and the promotion of environmental sustainability [11,12]. However, few studies have examined the impact of digitization on environmental governance in their analysis. The rapid development of digital technology has led to its far-reaching impact on the socioeconomic system and environmental governance. Environmental governance is the result of the joint participation of the government, the public and enterprises [13]. The state emphasizes the need to “form an environmental governance system in which government, enterprises and the public work together”. So, does the “digitization” level of different economic agents effectively promote the performance of environmental governance? The discussion of this question is not only conducive to the better promotion of digital development, but is also of great practical significance for the in-depth study of environmental governance methods and social sustainable development [14].
For the study of digital technology and environmental governance, the domestic literature in this field mainly focuses on the Internet, the development of information technology, environmental big data and other changes in environmental governance. The main areas of focus of these studies are as follows: improving the quality of the environment through the development of information technology and promoting the sustainable development of society and economy; the widespread application of data technology to promote the informatization of government environmental supervision and the dynamization of environmental monitoring [15], which demonstrates the wisdom of environmental governance; the development of information technology to promote the transformation of enterprises in an environmentally friendly direction by using green technological innovations, and the improvement of environmental governance through the integration of elemental resources and technological innovations [16,17,18]; and using the Internet to realize the real-time sharing of environmental information, and the innovation of ways and channels for public participation in environmental governance [19]. Big data can be used to facilitate the synergistic environmental governance of multiple economic agents and form a multifaceted model. There are also many scholars abroad who have made numerous contributions to this research area, and the earliest foreign countries defined the basic concept and connotation of the digital economy, and also performed relevant research on the measurement of the level of digital economic development [20,21]. In terms of the relationship between digitalization and environmental governance, foreign scholars believe that enterprises can enhance their innovation ability through digital technology and digital transformation, thus promoting environmental governance [22]; digital technology can help enterprises to achieve the optimal allocation of resources and reduce environmental pressure [23]; and digital technology, such as big data, can enhance the green technology innovation ability of enterprises, increase the competitive advantage of enterprises [24,25], and reduce the emission of pollution.
In addition, there are studies based on macro-level analysis, systematically constructing the framework of a digital governance system and promoting digital governance capacity [26]; there are also studies on the level of digitalization and public service construction [27], showing that digital technology can promote the dynamic governance and system optimization of social cities, providing an important support structure for the modernization of urban governance and the innovation of management modes [28,29]. The above studies provide a useful reference for analyzing the logical relationship between digitization and environmental governance performance, and few studies have examined the impact of digitization from the perspective of environmental governance performance. Considering this research gap, this paper conducts empirical analyses by using China’s provincial-level panel data from 2011 to 2020, explores the mediating effect and heterogeneity of digitalization affecting environmental governance performance, and puts forward relevant suggestions for digitalization to promote environmental governance performance. The possible marginal contributions of this paper are as follows: (1) Currently, there are fewer relevant studies focusing on the impact of digital development on environmental governance performance, and this paper provides a useful discussion of the environmental governance effects of digitalization from both theoretical and empirical perspectives, enriching the research on the influencing factors of environmental governance, and providing an effective supplement to the research related to the development of digitalization. (2) Structural equation modeling is used to explore the mechanism of the impact of digital development on environmental governance performance. (3) We verify whether there is heterogeneity in the impact of digitization on environmental governance performance in different geographic locations and different innovation-based capabilities. (4) The findings of this paper provide a reference for the government to effectively improve environmental governance and enterprises to better save energy and reduce emissions.

2. Theory and Hypothesis

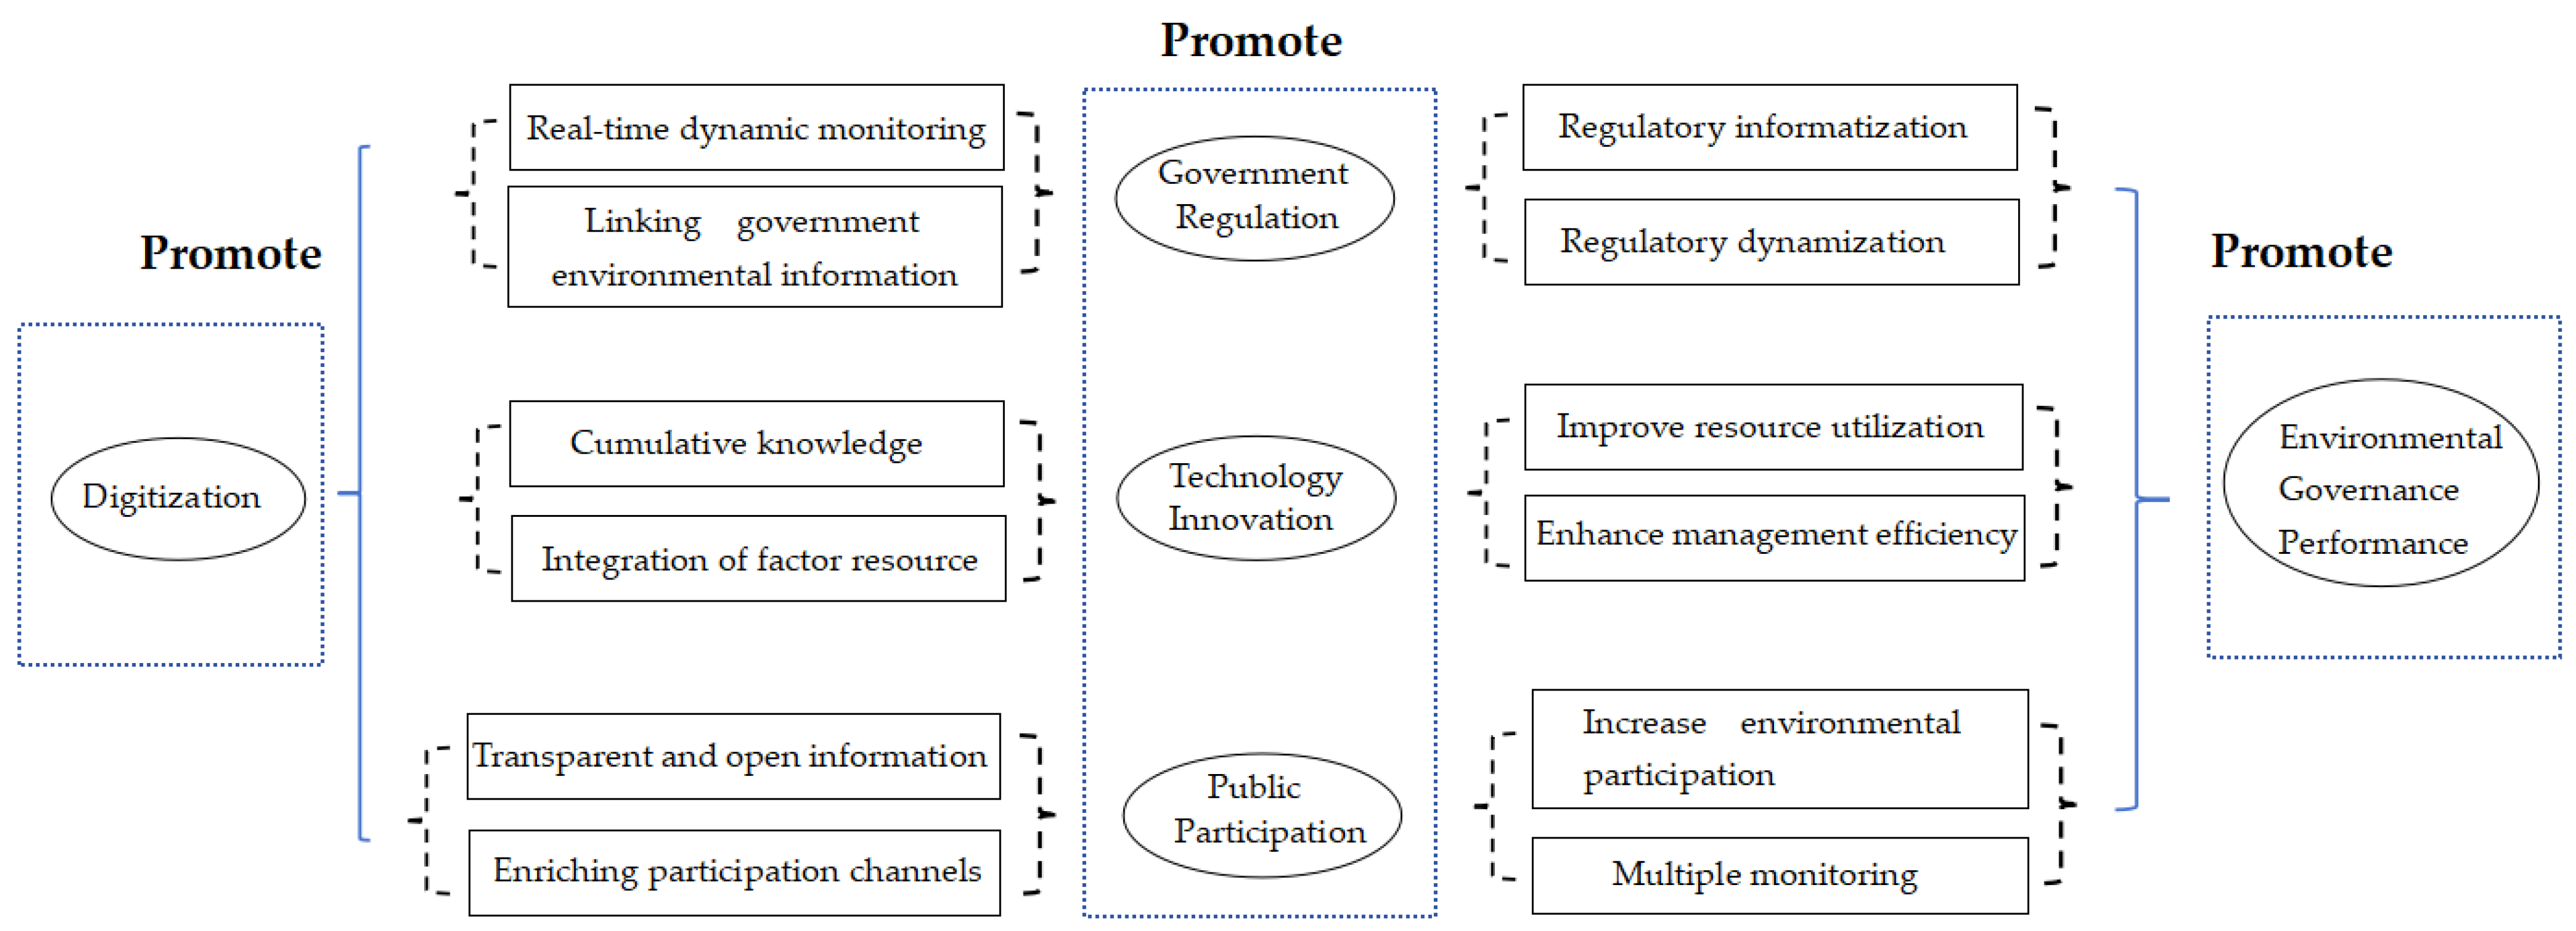
2.1. The Influence of Digitalization on Environmental Governance Performance

Digitization is an extension of informatization. Information is regarded as a very important factor of production [30], the conscious processing and handling of which is information technology, and after this processing the information produced is gradually transformed into new productive forces. With the widespread application and continuous development of information technology, informatization gradually extends to digitization. Informatization is the basis of digitalization, digitalization is an upgrade of informatization, and the initial definition of digitalization is the process of converting physical information into virtual information [31], while a more in-depth definition is the process of applying digital technology, as the application of digital technology is the basic tenet of digitalization. The rapid development of digitalization has led to the gradual enrichment of digital information, and the information processing capacity has developed. From the perspective of information technology, “information” is particularly important in promoting the process of environmental governance change [32]. The digital construction of information is the foundation of governance in the digital era, based on cloud computing, the Internet of Things and other new technologies for the real-time scientific and intelligent analysis of environmental governance data in order to improve environmental governance [33], promote diversified environmental governance and to enhance governance performance [34]. There are numerous studies based on digital technology discussing enterprise digital change from the perspective of enterprises and organizations in order to enhance enterprise innovation ability, improve enterprise competitiveness, and enhance enterprise economic efficiency [35]. In the field of environmental governance, there are also studies that demonstrate that Internet technology has a spatial spillover effect on environmental pollution, reducing the emission of environmental pollutants through other channels, thus improving environmental quality [23,36].
However, digitization is a complex process that involves various fields and is deeply integrated with various fields and socio-economic activities, so this paper explains the impact of digitalization on environmental governance performance by utilizing the Environmental Kuznets curve (EKC) theory [37]. This theory posits a significant inverted U-shaped relationship between environmental pollution levels and economic growth. It suggests that at lower levels of economic development, environmental pollution worsens with economic growth, but as economic development reaches a certain level, environmental pollution eases with economic growth. Scale effects, structural effects, technological effects, institutional effects and trade effects are indirect factors affecting environmental quality [38], mainly due to the early stage of economic development, as the transformation of the economic structure into an industrial structure deepens the degree of environmental pollution and increases the pressure on environmental governance; however, with the development of digitization, environmental pollution is reduced through technological innovation and structural adjustment, and the performance of environmental governance is enhanced [39]. Moreover, digitalization can promote the synergistic governance of multiple actors in environmental governance, realize the combination of efficient governmental environmental regulation and the real-time monitoring of public environmental pollution, promote technological innovation in enterprises, and improve the performance of environmental governance.
Based on the above analysis, this paper argues that digitalization may have a favorable impact on environmental governance performance and proposes the following hypothesis:
Hypothesis 1 (H1). 
Digitalization can positively facilitate environmental governance performance.

2.2. Digitalization, Government Environmental Regulation and Environmental Governance Performance

Government environmental regulation is an important factor affecting the performance of environmental governance. Currently, China’s environmental issues are increasingly undeniable, and environmental governance has become more challenging and complex. Research indicates that environmental regulation has a significant effect on emission reduction [40]. Increasing environmental regulation can improve environmental quality [8]; however, the problem of the incomplete implementation of government regulation still persists in China. Consequently, the government’s exclusive reliance on traditional environmental management methods poses certain challenges, including low regulatory efficiency and a reliance on a singular management approach. Digitalization presents a potential solution to these shortcomings by enhancing regulatory capabilities, such as using the Internet to monitor the environmental data dynamically [34]; government departments can use digital technology to share information with the public in real time to help the government to formulate environmental policies based on real-time data and so on.
One of the specific measures is the dynamization of environmental monitoring. Local governments use big data, cloud computing and other Internet technologies to dynamically monitor environmental information in real time [33], intelligently supervise the governance of the corporate environment, and integrate environmental monitoring data, which not only provides a basis for recognizing environmental problems and managing environmental pollution, but also provides technological support for the government’s decision making on emission reduction and improves the level of environmental governance in government departments. A second measure is government environmental supervision informatization. Environmental supervision plays an important role in environmental protection, and the government is the leading force in environmental protection. Digitalization helps local governments to govern the environment intelligently [28], and government environmental policies can operate in a more reasonable, scientific and real-time manner, thus improving the enforcement of environmental regulation. Accordingly, this paper proposes the following hypothesis:
Hypothesis 2 (H2). 
Digitization can improve environmental governance performance by facilitating government environmental regulation.

2.3. Digitalization, Green Technology Innovation and Environmental Governance Performance

Green technology innovation is defined as technology that can help realize sustainable development, help save resources and energy, help reduce environmental pollution, and improve environmental governance performance [41]. Digitalization promotes enterprise green technological innovation [42]: firstly, at the information level, enterprises integrate information through digitalization and enhance their information sharing ability, so as to realize the dynamic supervision of enterprises; in the process of enterprise production management, the integration of elemental resources is promoted [43], which in turn promotes enterprise green technological innovation. Secondly, at the knowledge level, green innovation can include multiple fields and disciplines, and digitization can encourage enterprises to pool and create knowledge in multiple fields, especially in environmental governance, and digitization encourages enterprises to realize collaborative innovation, thus realizing the reconstruction of knowledge between different fields and stimulating the green technological innovation of enterprises [44]. Thirdly, at the application level, digital finance is combined with information technology to promote green technology innovation and transformation in polluting industries [45].
Technological innovation promotes the optimization of the allocation of production factors, improves the efficiency of resource utilization [46,47], reduces environmental pollution caused by energy consumption, and improves environmental air quality. Some studies have argued that green technological innovation has environmentally friendly characteristics, utilizing the threshold effect to demonstrate that after the level of innovation exceeds the threshold, technological innovation enhances environmental governance performance through the role of intrinsic mechanisms [48]. The low-carbon strategy concurrently facilitates the digital transformation of enterprises, a phenomenon that resonates with the notable environmental benefits associated with digitalization [49,50]. It can be seen that green technology innovation plays an important role in reducing environmental pollution and improving environmental quality [51]. Accordingly, this paper proposes the following hypothesis:
Hypothesis 3 (H3). 
Digitalization can improve environmental governance performance by facilitating green technology innovation.

2.4. Digitalization, Public Environmental Participation and Environmental Governance Performance

The nature of environmental problems is a development and lifestyle issue that is complex and cannot be solved by the government or the market alone; the public plays a major role in environmental governance [52,53]. In recent years, the modes and channels of public participation have also expanded and been enriched, and public participation in public governance in the context of digitalization can help to build a pluralistic model of government governance [54]. The public can supervise the formulation of environmental policies and the governance process of local governments in multiple ways, so as to improve the performance of environmental governance; for example, the public can participate through new media channels such as environmental letters, telephone complaints, and online microblogging [55,56,57], so as to increase the degree of public appeals and effectively promote the government’s governance behavior. With the popularization of Internet technology, networks have become important support structures for the operation of the whole of society, and the Internet, as a sustainable interactive platform, promotes the participation of environmental governance subjects. The openness, interactivity and real-time characteristics of the Internet have advantages in the depth of public participation in environmental protection. With the development of digitalization provoking innovative applications in the field of environmental protection, digital technology facilitates the participation of more public forces in public governance, strengthens the degree of public participation in environmental governance, and improves the efficiency and level of public governance. Secondly, digital technology can quickly summarize and analyze the opinions put forward by the public, saving labor costs and improving work efficiency; the public use of cyberspace to quickly converge public opinion pressure [58] greatly reduces the cost and threshold of public participation and improves the quality of public participation. Based on this, this paper puts forward the following hypothesis:
Hypothesis 4 (H4). 
Digitization can improve environmental governance performance by facilitating public environmental participation.
Based on the above analysis, a schematic diagram of the impact mechanism of digitization is shown in Figure 1.

3. Research Design and Methodology

3.1. Model Settings

The PLS-SEM (partial least squares structural equation model), first proposed by Herman Wold (1975) [59], is a causal modeling approach that is now widely used in many fields, including economics, management, and psychology. The PLS-SEM has the following advantages: (1) it can realize the integrated application of multiple data analysis methods, which can both find the functional relationship between independent variables and dependent variables through the data and use the model rows to make predictions, as well as observing the interrelationships between variables through the simplified data structure; (2) PLS-SEM path modeling is accomplished with numerous latent and observed variables and is therefore more applicable when dealing with complex models; and (3) it is not only accurate for large-sample data, but is also applicable to small-sample data without the problem of model identification [60], thus greatly increasing the scope of its application.
The sample size of this study was relatively small, so we constructed a path model with the help of to analyze the causal relationship between digitalization and environmental governance performance. Smart-PLS3.0 does not need to evaluate whether the original data are normally distributed or not [61,62], and is able to set up the model flexibly, meaning that it is suitable for complex models containing multiple structures and multiple path relationships and can obtain stable parameter estimation results with a small sample. The first stage of this process involved the estimation of the measurement model, including reliability and validity tests. The second stage was structural modeling analysis, which focused on assessing and validating the path coefficients and explanatory power of the structural equation model in order to verify the reliability and validity of the constructed latent variables [63]. We tested the hypotheses using these two steps and by detecting the causal relationships between the latent variables.
Measurement modeling was used to describe the relationship between latent variables and their corresponding observed variables using the following equation:
x = Λ x ξ + δ
y = Λ y η + ε
where x and y are the vectors of exogenous and endogenous observed variables, respectively; x is the factor loading matrix on exogenous latent variables for exogenous observed variables; and δ and ε are the measurement error vectors.
The structural model was used to describe the path relationship between exogenous and endogenous latent variables and was formulated as follows:
η = B η + Γ ξ + ζ
where η and ξ are the vector of endogenous latent variables and the vector of exogenous latent variables, respectively; B denotes the relationship between the endogenous latent variables; Γ denotes the effect of the exogenous latent variables on the endogenous latent variables; and ζ is the error term of the structural equation.

3.2. Definitions of Variables

3.2.1. Environmental Governance Performance

Considering the comprehensive nature of environmental governance performance (EGP), this paper constructed a comprehensive environmental governance performance evaluation system from the perspectives of industrial governance, ecological governance, and life governance, and adopts the pollution removal rate for evaluation [64]. The variables studied included the general solid waste consolidation rate, the industrial SO2 removal rate, the greening coverage rate of built-up areas, the non-hazardous treatment rate of domestic waste and the urban sewage treatment rate.

3.2.2. Digitization

In statistics, there is still some controversy as to how to clearly quantify the level of digitalization development. Considering the connotations and characteristics of digitization and the core theory, relatively perfect evaluation indexes should be adopted to measure the level of digitization development. Eleven indicators were selected from the three dimensions of digitization foundation, digitization application and digitization development to build a comprehensive index system of digitization level [65,66,67,68].
Digital Foundations (DIGF). The construction of digital infrastructure sets out the development level of digitalization, which is the foundation of all digital technology-related research, and the conceptual classification of digital infrastructure is explicitly included in China’s regional digital development index report. The digital infrastructure indicators in this paper reflected the construction of digital infrastructure in each region through the mobile switch capacity per capita, the number of Internet broadband access ports per capita, the number of domain names, and the number of websites.
Digital Applications (DIGA). The application of digitalization is the embodiment of the development of digitalization. With a good digitalization environment, the application of digitalization can be carried out steadily, and the deepening of the application of data will bring about new industrial integration and business model innovation. This paper reflected the application process of digitization in each region through the number of Internet broadband access users, the Internet penetration rate, and the per capita telecommunication service volume.
Digital Development (DIGD). The development of the digital industry plays a supportive role for the improvement of the digitalization level and also promotes the adoption of digital technology in physical industries. Digitalization development indicators were measured according to the proportion of the number of people employed in digital industries to the total number of people employed at the end of the year, the proportion of fixed assets of digital industries to the investment in fixed assets of the whole of society, and the ratio of the income of digital industries to the GDP of the region, reflecting the development process of digitization in each region.
The evaluation indicators in the model are shown in Table 1.

3.2.3. Mediating Variables

Government Environmental Regulation (GER). Indicators such as the total per capita investment in pollution control, enterprise sewage charges, environmental protection expenditures, and investment in urban environmental infrastructure were selected to comprehensively reflect the intensity of government environmental regulation in each region [69,70].
Green technological innovation (GTI). The intensity of R&D investment, the number of green invention patent applications, and the market turnover of technological innovation were selected to comprehensively reflect the level of green technological innovation in each region [71].
Public Environmental Participation (PEP). The total number of Chinese National People’s Congress (NPC) recommendations, Chinese People’s Political Consultative Conference (CPPCC) proposals, telephone and Internet complaints received by ecological and environmental departments, and Baidu’s total search index for “environmental pollution” were selected to comprehensively reflect the degree of public environmental participation in each region [53,72].
The mediating variables indicators in the model are shown in Table 2.

3.3. Data Sources and Sample Selection

The panel data of 30 provinces and cities in China from 2011 to 2020 were selected as the study sample. The data in this paper were derived from the China Environmental Yearbook, the China Statistical Yearbook, the China Electronic Information Industry Statistical Yearbook and the China Research Data Platform.
After collecting data for all the observed indicators, the raw data needed to be processed, with missing values, outliers and standardization of the data being the primary areas of concern. The descriptive statistical analysis of the variables obtained after data processing is shown in Table 3.

4. Results

4.1. Measurement Model Results

The relationship between observed variables and latent variables was reflected through the measurement model, and this article tested the model for reliability and validity. Cronbach’s Alpha coefficient was used to test the internal consistency of the measurement indicators [73], and this study found that the Cronbach’s Alpha coefficients of each construct were greater than 0.7, and the combined reliability (CR) of each construct was around 0.9, indicating a high level of reliability. The loading coefficients of each index were higher than the recommended level of 0.7, meeting the requirements of this study, and the basic fit of the model was found to be good, as shown in Table 4.
Secondly, the model was tested for validity, which included the convergent validity test and the differential validity test [74]. After calculating the convergent validity of this model, the average variance extracted (AVE) of each construct was higher than the test standard of 0.5, as shown in Table 4, indicating that the model has good convergent validity. After calculating the discriminant validity, the root of the AVE value of each latent variable was found to be greater than the correlation coefficients of the other latent variables, as can be seen from the data in Table 5. Therefore, the measurement model has good discriminant validity.

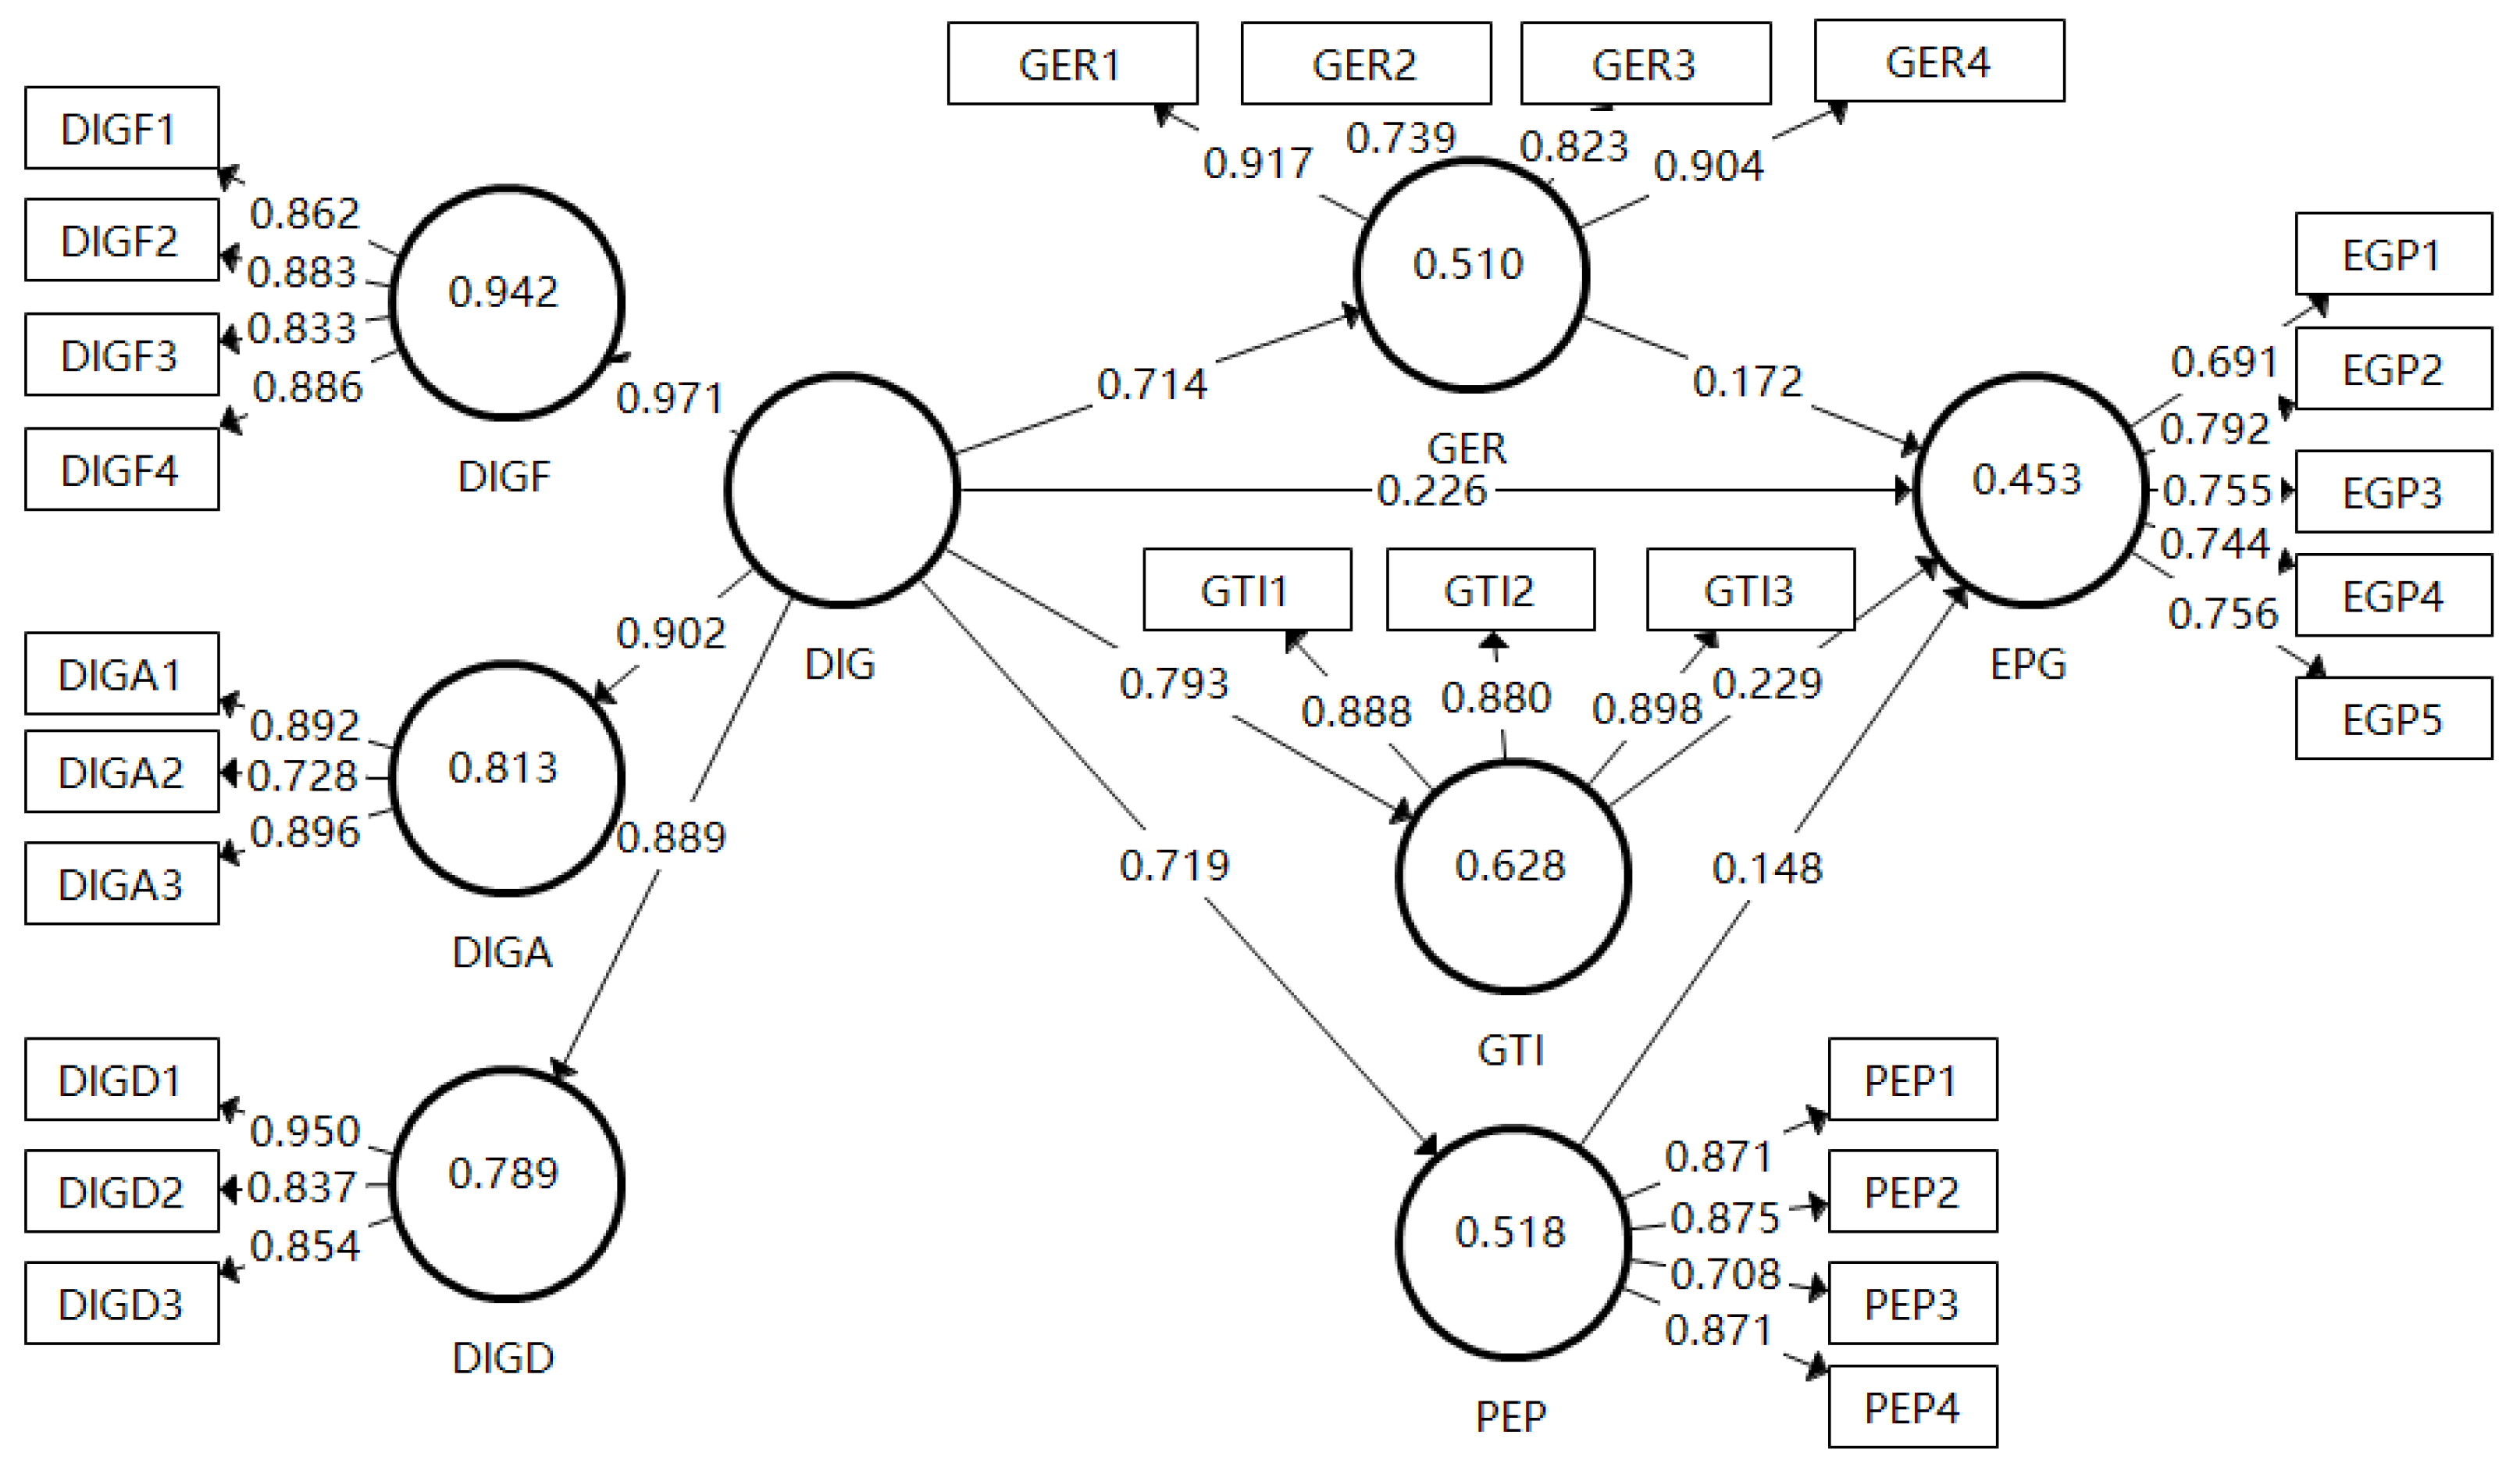
4.2. Structural Equation Model Results

In this study, SmartPLS 3.0 was used to analyze the data to obtain the path coefficients of the structural model, and the standard error of each path coefficient was calculated using the bootstrapping algorithm to obtain the T-value and p-value. The test results are shown in Table 6. The R2 and Q2 values were calculated by SmartPLS as the test indicators based on the predictive ability of the model, and the R2 value measured the explanatory ability of the derived concepts in the structural model, as shown in Table 7. The R2 value ranged from 0 to 1, with a higher value indicating higher explanatory ability. The explainable variance (R2) of each latent variable in this study ranged from 0.446 to 0.627, which was basically greater than 0.5, indicating that the explanatory power of the latent variables is strong.
Q2 reflects the contribution of the raw scores of the observed variables to the overall prediction accuracy of the structural model. When 0.02 < Q2 ≤ 0.15, a small effect is observed; when 0.15 < Q2 ≤ 0.35, a medium effect is observed; and when Q2 > 0.35, a large effect is observed. The Q2 values of the four endogenous latent variables are all greater than 0.15, further suggesting that the measurement model constructed in this paper is also valid.

4.3. Mediation Effect Analysis

There is a significant direct relationship between digitization and environmental governance performance, which proves that digitization can promote environmental governance performance, and H1 passes the 1% significant level test, meaning that this hypothesis is supported. As can be seen in Table 6, the p-value of each path coefficient, except for PEP → EPG, is less than 0.01, indicating that each path coefficient is highly significant.
The overall effect of digitization on environmental governance performance was further calculated, along with the direct effect and the indirect effect of each mediated regulation pathway and the variance accounted for (VAF) value, as shown in Table 8, which determines the magnitude of the indirect effect related to the total effect [75]. The VAF usually takes a value between 0 and 1. The closer the VAF value is to 1, the better the independent variables in the model explain the changes in the dependent variable. In the case of full mediation, the mediator variable fully explains the relationship between the independent and dependent variables when the VAF value is close to 1. In the case of partial mediation, the mediator variable only partially explains the relationship between the independent and dependent variables, and the VAF value will be between 0 and 1. The VAF of the mediated adjustment path in this study ranged from 25.8% to 44.3%, indicating a partial mediation effect.
Government environmental regulation, green technology innovation and public environmental participation are the mediating variables of digitization and environmental governance performance, and the results show that Hypothesis 2, Hypothesis 3 and Hypothesis 4 are all valid at the 1% significant level, with mediating effects of 0.123, 0.182 and 0.106, respectively, and the mediating effect of green technology innovation is more prominent. Therefore, it can be considered that the mechanism proposed in this paper is valid, i.e., digitalization can promote environmental governance performance through improving government environmental regulation, public environmental participation and green technology innovation.
The structural path diagram of the impact of digitization on environmental governance performance is shown in Figure 2:

4.4. Heterogeneity Analysis

4.4.1. Regional Heterogeneity Analysis

Considering that there may be differences in the level of digitalization development and the degree of environmental pollution in different geographic regions, this paper examines the impact of digitalization development on environmental governance in different regions, using the East, the Middle East, and the West as comparative samples [52]. The empirical results, as shown in columns (1) to (3) of Table 9, indicate that the impacts of digitization on environmental governance performance in different regions are positively promoted, with the values of the impacts in the central and eastern regions being larger than those in the western region. The possible reason for this is that the size of the impact of digitalization on environmental governance performance is subject to factors such as the investment in technology R&D, the regional information infrastructure and digital technology talents. The central and eastern regions are not only the more developed regions of the digital economy, but also the centers of China’s economy, population and industry, and they have a more advantageous position in terms of technology R&D investment, digital infrastructure and other aspects, meaning that the development of digitization has a more favorable role in promoting environmental governance in these regions, and the impact of digitization is more positive in the eastern and central regions than in the western region. The promotion of environmental governance is thus more obvious in these regions.

4.4.2. Innovative Capacity Heterogeneity Analysis

Examining the sample provinces may also reveal significant differences in technological innovation capacity, and thus the 30 provinces were divided into two groups, namely high-innovation-base-capacity provinces and low-innovation-base-capacity provinces, in order to test whether the impact of digitization on environmental governance performance is heterogeneous across provinces with different innovation capacities [16]. All provinces were grouped according to the Regional Innovation Capacity Evaluation Report 2020 as a reference, with the first class grouping being low-innovation-base-capacity provinces and the second and third class groupings being high-innovation-base-capacity provinces. The results show (see Table 9) that the path coefficient of digitization on environmental governance performance is still significantly positive, and the facilitating effect is higher in high-innovation-base-capacity provinces than in low-innovation-base-capacity provinces. This suggests that the facilitating effect of digitization on environmental governance performance does differ significantly across provinces with different innovation capacities, and the higher the innovation base capacity of the region, the stronger the facilitating effect of environmental governance. The reasons for this are as follows: regions with a high innovation base capacity tend to have more advanced technologies and digital tools, more highly qualified personnel, more policy support and investment in digital environmental governance from governments and relevant institutions as well as more developed industrial systems and innovation ecosystems, which help in scientific decision making and precise environmental governance and improve the overall level of governance.

5. Discussion

Through the above study, it is found that the path coefficient of DIG → DIGF is 0.971, the path coefficient of DIG → DIGA is 0.902, and the path coefficient of DIG → DIGD is 0.889, and all of them are significant at the 1% confidence level, which indicates that these indicators can effectively represent the concept of digitization. Through the path DIG → EGP, it can be seen that the direct effect of digitalization on environmental governance performance is 0.226, indicating that digitalization has a direct role in promoting environmental governance performance; through the paths DIG → GER→EPG, DIG→ GTI →EPG, DIG → PEP → EPG, it can be seen that digitalization can promote environmental governance performance through government environmental regulation, green technology innovation and public environmental participation. The indirect effects are 0.123, 0.182 and 0.106, respectively, and the mediating effect of green technology innovation is more prominent. The reason for this may be that green technology innovation can directly contribute to environmental governance performance by improving resource utilization efficiency, reducing emissions and pollutant discharges, and improving environmental quality. In contrast, although government environmental regulation and public environmental participation also have a positive effect on environmental governance performance, their influence is often more reflected in policy formulation, implementation and supervision, requiring more environmental management and social participation processes, and the path of influence is relatively more indirect and complex. Therefore, green technology innovation may play a more direct and critical role in digitizing environmental governance performance and may thus be more significant in its impact. This is similar to previous studies, demonstrating that at the government level, digitization enables the real-time dynamic monitoring of environmental data and the informatization of environmental regulation; at the enterprise level, digitization improves resource utilization and management efficiency through green technology innovation; and at the public level, digitization promotes the transparency and openness of information and improves public participation in environmental protection.
Previous studies have explored environmental governance from various perspectives, analyzing the barriers and pathways to intelligent environmental governance, but such studies have generally focused on the theoretical mechanisms within the governmental governance system, while environmental governance is the result of the joint participation of the government, the public and enterprises, so this paper analyzes it from multiple perspectives. Previous studies have mainly explored the differences in environmental governance performance resulting from geographical heterogeneity, overlooking the differences in regional innovation capabilities. This study therefore offers a more comprehensive perspective on environmental governance performance.
For the construction of an indicator system for environmental governance performance, based on three internationally popular framework systems, improved for specific research issues, the selection of indicators to achieve a comprehensive reflection of the evaluation object is vital. These three framework systems are widely used in the performance evaluation of organizations, quality management and other fields. Therefore, most scholars have adopted the multi-indicator comprehensive evaluation method to evaluate the performance of environmental governance, and this study selected indicators based on three aspects, namely industrial governance, ecological governance and life governance. For the construction of an indicator system for digitalization, current research is mostly based on the digital foundation, digital platform construction, the digital equipment and application level, the digital industry development, etc., among which the selected indicators may be different; there are also scholars who reflect the degree of development of digitalization by measuring the level of informatization and the level of development of the digital economy. This paper focused on the impact of the development of digitalization level on environmental governance, and from this perspective, the three dimensions of digitalization foundation, digitalization application and digitalization development were selected for assessment.
Regarding measurement methods, the entropy value method and principal component analysis are the two most commonly applied methods. The entropy value method calculates the selected indexes and finally obtains a composite index. Principal component analysis needs to standardize the data and reduce the data dimensionality. This study adopted PLS-SEM to construct the variable evaluation index system. Environmental governance performance was measured as a first-order latent variable: the selected indicators were associated with environmental governance performance to form a first-order latent variable model. Digitalization was measured as a second-order latent variables: on the basis of the first-order latent variable model, the first-order latent variables were used as indicators to construct a second-order latent variable (digitalization) model to ensure that the second-order latent variables could effectively explain the relationship between the first-order latent variables, and in this study, the digitalization foundation, digitalization application and digitalization development were used as first-order latent variables.

6. Conclusions

6.1. Research Finding

Based on the panel data of 30 provinces in China from 2011 to 2020, the evaluation indexes of digitization and environmental governance performance are established, and the impact of digitization on environmental governance performance is theoretically analyzed and empirically examined using structural equation modeling. The following main conclusions are drawn: digitization can directly and effectively improve environmental governance performance; mechanism analysis shows that digitization effectively improves environmental governance performance by improving the government’s environmental regulatory efforts, the degree of public participation in the environment, and the green technology innovation of enterprises, among which green technology innovation has the greatest impact; and heterogeneity studies have shown that the contribution of digitization to environmental governance performance varies significantly according to geographic region and innovation-based capabilities.

6.2. Policy Recommendations

First, we recommend that the government strengthen the construction of digital infrastructure, broaden the field of digital industry, further promote the rapid development of digitalization, and ensure that digitalization provides infrastructural safeguards for environmental governance. The development of digitalization is conducive to improving the performance of environmental governance, while strengthening the construction of digital infrastructure can lay a good foundation for the digital industry, promote the integrated development of digitalization and traditional industries, apply technologies such as 5G, cloud computing, and big data in the field of environmental governance, and improve the environmental governance system so as to enhance the scientific and effective nature of environmental governance.
In terms of governmental environmental supervision, local environmental constraints and environmental supervision should be strengthened. Empowered by digitalization, smart environmental governance can promote scientific environmental decision making and precise environmental governance and maximize the symbiosis and win–win situation between economic development and environmental protection. In terms of public participation in environmental governance, with the application of digitization, the new media monitoring mechanism should be further improved, public environmental participation channels should be expanded, public environmental participation pathways should remain unimpeded, and the public should be encouraged to participate in environmental governance through new media platforms. For enterprises, the research and development of green technology series matching small and medium-sized enterprises should be encouraged to reduce the cost of searching for internal and external knowledge as well as the cost of using green technology. Enterprises should enhance their adoption rate of green technological innovations, promoting their transformation in order to realize green technological innovations, improve the performance of environmental governance, and form a new model of government–enterprise–public multivariate environmental co-governance.
Third, in addition to its recommendations for governments, enterprises, and the public, this study is also useful for some professional groups and audiences. For consumers, for example, digitization can provide more information about the environmental friendliness of products and services, helping them to make greener purchasing decisions. At the same time, digitization can also provide convenient guidelines on environmentally friendly behaviors and motivate consumers to adopt a greener lifestyle. For educators, digitization can also provide real-time environmental data and case studies to help educators to better teach about environmental science and conservation.
Finally, heterogeneity analysis shows that environmental governance performance is also related to the endowment conditions of the region itself. Therefore, the government should formulate policies and plans to promote digitalization according to the scale of regional development, the level of digitalization, and the capacity of the innovation base, so that the effect of digitalization on environmental governance performance can be maximized.

6.3. Limitations and Prospects

(1)
The indicators for measuring digitization may be imperfect and the time span may be insufficient. In order to measure the level of development of digitization in China, taking into account the fact that some of the data are not easy to obtain, only 30 provinces were selected, with data spanning 10 years, and in the various yearbooks, we selected 11 indicators in order to build a system of indicators to measure the level of digitization in China. In this paper, considering the accuracy of the research data, only nine indicators were ultimately selected, but as the measurement of the level of digital development actually needs to take into account multiple dimensions and multiple perspectives, the indicator system is slightly insufficient. It is necessary to collect more comprehensive and richer data for analysis in subsequent research work.
(2)
The analysis of the impact mechanism of digitalization on environmental governance in this paper was based on three perspectives, limited by the lack of relevant data, making this study slightly less comprehensive. In the future, research should also consider other possible impact mechanisms and should be enriched in the knowledge base of other relevant theories.
(3)
The potential negative impacts of digitization should also be taken into account. This paper highlights the positive impacts of digitization on environmental governance. However, a more balanced view should be taken into account, i.e., the fact that there are potential negative impacts of digitalization, such as the digital divide issue and the energy consumption due to digital technologies. The COVID-19 pandemic has played a pivotal role in driving the global adoption of digital technologies but has also exacerbated the digital divide and inequalities among different societal groups. Therefore, in future digital research and policy making, it is essential to balance these potential negative impacts by adopting multifaceted measures, including narrowing the digital divide, promoting energy-efficient digital technologies, and implementing effective e-waste management strategies. Additionally, enhancing the digital literacy and awareness of stakeholders, fostering collaboration among the government, industry, and civil society, and incorporating sustainability considerations into digital initiatives would all contribute to mitigating these negative impacts while maximizing the benefits of digital transformation, thus ensuring that digital environmental governance can achieve a win–win situation regarding economic development and environmental protection.

Author Contributions

Conceptualization, X.S. and J.G.; methodology, J.G.; software, X.S. and J.G.; validation, J.G.; formal analysis, X.S. and J.G.; investigation, J.G.; resources, X.S.; data curation, J.G.; writing—original draft preparation, J.G.; writing—review and editing, X.S. and J.G.; visualization, X.S. and J.G.; supervision, X.S.; project administration, X.S. All authors have read and agreed to the published version of the manuscript.

Funding

This research was funded by the Major Projects of the National Social Science Fund, grant number 21ZDA087.

Institutional Review Board Statement

Not applicable.

Informed Consent Statement

Not applicable.

Data Availability Statement

The data presented in this study are available upon request from the corresponding author.

Acknowledgments

The authors would like to thank the reviewers for their expertise and valuable input.

Conflicts of Interest

The authors declare no conflicts of interest.

References

  1. Guo, K.; Li, Z.; Cao, Y.; Yang, Y. How Efficient Is the Environmental Pollution Control in China? Process Saf. Environ. Prot. 2023, 172, 998–1009. [Google Scholar] [CrossRef]
  2. Zhou, B.; Zeng, X.; Jiang, L.; Xue, B. High-Quality Economic Growth under the Influence of Technological Innovation Preference in China: A Numerical Simulation from the Government Financial Perspective. Struct. Change Econ. Dyn. 2020, 54, 163–172. [Google Scholar] [CrossRef]
  3. Yu, Y.; Li, K.; Duan, S.; Song, C. Economic Growth and Environmental Pollution in China: New Evidence from Government Work Reports. Energy Econ. 2023, 124, 106803. [Google Scholar] [CrossRef]
  4. Guo, B.; Wang, Y.; Zhang, H.; Liang, C.; Feng, Y.; Hu, F. Impact of the Digital Economy on High-Quality Urban Economic Development: Evidence from Chinese Cities. Econ. Model. 2023, 120, 106194. [Google Scholar] [CrossRef]
  5. Zhou, M.; Jiang, K.; Zhang, J. Environmental Benefits of Enterprise Digitalization in China. Resour. Conserv. Recycl. 2023, 197, 107082. [Google Scholar] [CrossRef]
  6. Zhao, S.; Teng, L.; Arkorful, V.E.; Hu, H. Impacts of Digital Government on Regional Eco-Innovation: Moderating Role of Dual Environmental Regulations. Technol. Forecast. Soc. Change 2023, 196, 122842. [Google Scholar] [CrossRef]
  7. Zhang, Y.; Wang, Y.; Luo, T.; Chen, M.; Li, J. How Does the Environmental Performance Assessment Promote Pollution Reduction: An Analysis of the First Obligatory Pollution Reduction Target Plan in China. Atmos. Pollut. Res. 2024, 15, 101962. [Google Scholar] [CrossRef]
  8. Zhang, Y.; Zhang, Q.; Hu, H.; Wang, C.; Guo, X. Accountability Audit of Natural Resource, Government Environmental Regulation and Pollution Abatement: An Empirical Study Based on Difference-in-Differences Model. J. Clean. Prod. 2023, 410, 137205. [Google Scholar] [CrossRef]
  9. Zhang, M.; Yan, T.; Gao, W.; Xie, W.; Yu, Z. How Does Environmental Regulation Affect Real Green Technology Innovation and Strategic Green Technology Innovation? Sci. Total Environ. 2023, 872, 162221. [Google Scholar] [CrossRef] [PubMed]
  10. Xu, Z.; Li, Y.; Wang, C.; Shan, J. Social Capital and Environmentally Friendly Behaviors. Environ. Sci. Policy 2024, 151, 103612. [Google Scholar] [CrossRef]
  11. Alpenberg, J.; Wnuk-Pel, T.; Henebäck, A. Environmental Orientation in Swedish Local Governments. Sustainability 2018, 10, 459. [Google Scholar] [CrossRef]
  12. Efthymiou, L.; Kulshrestha, A.; Kulshrestha, S. A Study on Sustainability and ESG in the Service Sector in India: Benefits, Challenges, and Future Implications. Adm. Sci. 2023, 13, 165. [Google Scholar] [CrossRef]
  13. Feng, M.; Chen, C.; Liu, J.; Jia, W. Does Central Environmental Protection Inspector Improve Corporate Social Responsibility? Evidence from Chinese Listed Companies. Sustainability 2022, 14, 15262. [Google Scholar] [CrossRef]
  14. Yang, L.; Lin, Y.; Zhu, J.; Yang, K. Dynamic Coupling Coordination and Spatial–Temporal Analysis of Digital Economy and Carbon Environment Governance from Provinces in China. Ecol. Indic. 2023, 156, 111091. [Google Scholar] [CrossRef]
  15. Zhao, X.; Lu, S.; Yuan, S. How Does the Digitization of Government Environmental Governance Affect Environmental Pollution? Spatial and Threshold Effects. J. Clean. Prod. 2023, 415, 137670. [Google Scholar] [CrossRef]
  16. Zhang, Z.; Zhou, Z.; Zeng, Z.; Zou, Y. How Does Heterogeneous Green Technology Innovation Affect Air Quality and Economic Development in Chinese Cities? Spatial and Nonlinear Perspective Analysis. J. Innov. Knowl. 2023, 8, 100419. [Google Scholar] [CrossRef]
  17. Zhang, W.; Zhao, J. Digital Transformation, Environmental Disclosure, and Environmental Performance: An Examination Based on Listed Companies in Heavy-Pollution Industries in China. Int. Rev. Econ. Finance 2023, 87, 505–518. [Google Scholar] [CrossRef]
  18. Yang, J.; Wang, Y.; Tang, C.; Zhang, Z. Can Digitalization Reduce Industrial Pollution? Roles of Environmental Investment and Green Innovation. Environ. Res. 2024, 240, 117442. [Google Scholar] [CrossRef]
  19. Zhang, M.; Yang, Y.; Du, P.; Wang, J.; Wei, Y.; Qin, J.; Yu, L. The Effect of Public Environmental Participation on Pollution Governance in China: The Mediating Role of Local Governments’ Environmental Attention. Environ. Impact Assess. Rev. 2024, 104, 107345. [Google Scholar] [CrossRef]
  20. Kling, R.; Lamb, R. IT and Organizational Change in Digital Economies: A Socio-Technical Approach. ACM SIGCAS Comput. Soc. 1999, 29, 17–25. [Google Scholar] [CrossRef]
  21. Zimmermann, H.-D. Understanding the Digital Economy: Challenges for New Business Models. SSRN Electron. J. 2000. [Google Scholar] [CrossRef]
  22. Subramaniam, M.; Youndt, M.A. The Influence of Intellectual Capital on the Types of Innovative Capabilities. Acad. Manag. J. 2005, 48, 450–463. [Google Scholar] [CrossRef]
  23. Moyer, J.D.; Hughes, B.B. ICTs: Do They Contribute to Increased Carbon Emissions? Technol. Forecast. Soc. Change 2012, 79, 919–931. [Google Scholar] [CrossRef]
  24. El-Kassar, A.-N.; Singh, S.K. Green Innovation and Organizational Performance: The Influence of Big Data and the Moderating Role of Management Commitment and HR Practices. Technol. Forecast. Soc. Change 2019, 144, 483–498. [Google Scholar] [CrossRef]
  25. Mubarak, M.F.; Tiwari, S.; Petraite, M.; Mubarik, M.; Raja Mohd Rasi, R.Z. How Industry 4.0 Technologies and Open Innovation Can Improve Green Innovation Performance? Manag. Environ. Qual. Int. J. 2021, 32, 1007–1022. [Google Scholar] [CrossRef]
  26. Zheng, L. Collaborative Governance of Haze Pollution between Local Governments. Alex. Eng. J. 2023, 65, 119–129. [Google Scholar] [CrossRef]
  27. Ruhlandt, R.W.S. The Governance of Smart Cities: A Systematic Literature Review. Cities 2018, 81, 1–23. [Google Scholar] [CrossRef]
  28. Xiao, X.; Xie, C. Rational Planning and Urban Governance Based on Smart Cities and Big Data. Environ. Technol. Innov. 2021, 21, 101381. [Google Scholar] [CrossRef]
  29. Zhang, Z.; Lin, X.; Shan, S. Big Data-Assisted Urban Governance: An Intelligent Real-Time Monitoring and Early Warning System for Public Opinion in Government Hotline. Future Gener. Comput. Syst. 2023, 144, 90–104. [Google Scholar] [CrossRef]
  30. Stark, D.; Castells, M. The Rise of the Network Society. Contemp. Sociol. 1997, 26, 725. [Google Scholar] [CrossRef]
  31. Negroponte, N. Being Digital, 1st ed.; Knopf: New York, NY, USA, 1995; ISBN 978-0-679-43919-6. [Google Scholar]
  32. Liu, Y.; Hao, Y. How Does Coordinated Regional Digital Economy Development Improve Air Quality? New Evidence from the Spatial Simultaneous Equation Analysis. J. Environ. Manag. 2023, 342, 118235. [Google Scholar] [CrossRef] [PubMed]
  33. Wu, Y.; Zhang, W.; Shen, J.; Mo, Z.; Peng, Y. Smart City with Chinese Characteristics against the Background of Big Data: Idea, Action and Risk. J. Clean. Prod. 2018, 173, 60–66. [Google Scholar] [CrossRef]
  34. Rathore, M.M.; Ahmad, A.; Paul, A.; Rho, S. Urban Planning and Building Smart Cities Based on the Internet of Things Using Big Data Analytics. Comput. Netw. 2016, 101, 63–80. [Google Scholar] [CrossRef]
  35. Wu, Y.; Hu, J.; Irfan, M.; Hu, M. Vertical Decentralization, Environmental Regulation, and Enterprise Pollution: An Evolutionary Game Analysis. J. Environ. Manag. 2024, 349, 119449. [Google Scholar] [CrossRef] [PubMed]
  36. Wu, L.; Wan, X.; Jahanger, A.; Li, M.; Murshed, M.; Balsalobre-Lorente, D. Does the Digital Economy Reduce Air Pollution in China? A Perspective from Industrial Agglomeration. Energy Rep. 2023, 9, 3625–3641. [Google Scholar] [CrossRef]
  37. Grossman, G.; Krueger, A. Environmental Impacts of a North American Free Trade Agreement; National Bureau of Economic Research: Cambridge, MA, USA, 1991; p. w3914. [Google Scholar]
  38. De Bruyn, S.M.; Van Den Bergh, J.C.J.M.; Opschoor, J.B. Economic Growth and Emissions: Reconsidering the Empirical Basis of Environmental Kuznets Curves. Ecol. Econ. 1998, 25, 161–175. [Google Scholar] [CrossRef]
  39. Zeng, J.; Yang, M. Digital Technology and Carbon Emissions: Evidence from China. J. Clean. Prod. 2023, 430, 139765. [Google Scholar] [CrossRef]
  40. Zhang, G.; Liu, W.; Duan, H. Environmental Regulation Policies, Local Government Enforcement and Pollution-Intensive Industry Transfer in China. Comput. Ind. Eng. 2020, 148, 106748. [Google Scholar] [CrossRef]
  41. Chen, F.; Wang, M.; Pu, Z. The Impact of Technological Innovation on Air Pollution: Firm-Level Evidence from China. Technol. Forecast. Soc. Change 2022, 177, 121521. [Google Scholar] [CrossRef]
  42. Dian, J.; Song, T.; Li, S. Facilitating or Inhibiting? Spatial Effects of the Digital Economy Affecting Urban Green Technology Innovation. Energy Econ. 2024, 129, 107223. [Google Scholar] [CrossRef]
  43. Xu, P.; Chen, L.; Dai, H. Pathways to Sustainable Development: Corporate Digital Transformation and Environmental Performance in China. Sustainability 2022, 15, 256. [Google Scholar] [CrossRef]
  44. Wang, F. The Intermediary and Threshold Effect of Green Innovation in the Impact of Environmental Regulation on Economic Growth: Evidence from China. Ecol. Indic. 2023, 153, 110371. [Google Scholar] [CrossRef]
  45. Li, J.; Zhang, G.; Ned, J.P.; Sui, L. How Does Digital Finance Affect Green Technology Innovation in the Polluting Industry? Based on the Serial Two-Mediator Model of Financing Constraints and Research and Development (R&D) Investments. Environ. Sci. Pollut. Res. 2023, 30, 74141–74152. [Google Scholar] [CrossRef]
  46. Wang, X.; Su, Z.; Mao, J. How Does Haze Pollution Affect Green Technology Innovation? A Tale of the Government Economic and Environmental Target Constraints. J. Environ. Manag. 2023, 334, 117473. [Google Scholar] [CrossRef] [PubMed]
  47. Dowlatabadi, H.; Oravetz, M.A. US Long-Term Energy Intensity: Backcast and Projection. Energy Policy 2006, 34, 3245–3256. [Google Scholar] [CrossRef]
  48. Yu, H.; Wang, J.; Hou, J.; Yu, B.; Pan, Y. The Effect of Economic Growth Pressure on Green Technology Innovation: Do Environmental Regulation, Government Support, and Financial Development Matter? J. Environ. Manag. 2023, 330, 117172. [Google Scholar] [CrossRef] [PubMed]
  49. Zhao, S.; Zhang, L.; An, H.; Peng, L.; Zhou, H.; Hu, F. Has China’s Low-Carbon Strategy Pushed Forward the Digital Transformation of Manufacturing Enterprises? Evidence from the Low-Carbon City Pilot Policy. Environ. Impact Assess. Rev. 2023, 102, 107184. [Google Scholar] [CrossRef]
  50. Jin, C.; Monfort, A.; Chen, F.; Xia, N.; Wu, B. Institutional Investor ESG Activism and Corporate Green Innovation against Climate Change: Exploring Differences between Digital and Non-Digital Firms. Technol. Forecast. Soc. Change 2024, 200, 123129. [Google Scholar] [CrossRef]
  51. Wu, D.; Xie, Y.; Lyu, S. Disentangling the Complex Impacts of Urban Digital Transformation and Environmental Pollution: Evidence from Smart City Pilots in China. Sustain. Cities Soc. 2023, 88, 104266. [Google Scholar] [CrossRef]
  52. Zhang, H.; Xu, T.; Feng, C. Does Public Participation Promote Environmental Efficiency? Evidence from a Quasi-Natural Experiment of Environmental Information Disclosure in China. Energy Econ. 2022, 108, 105871. [Google Scholar] [CrossRef]
  53. Wang, B.; Xu, S.; Sun, K.; Chang, X.; Wang, Z.; Zhao, W. Government Responsive Selectivity and Public Limited Mediation Role in Air Pollution Governance: Evidence from Large Scale Text Data Content Mining. Resour. Conserv. Recycl. 2022, 187, 106553. [Google Scholar] [CrossRef]
  54. Niu, Y.; Wang, X.; Lin, C. A Study on the Impact of Organizing Environmental Awareness and Education on the Performance of Environmental Governance in China. Int. J. Environ. Res. Public. Health 2022, 19, 12852. [Google Scholar] [CrossRef]
  55. Zhang, G.; Deng, N.; Mou, H.; Zhang, Z.G.; Chen, X. The Impact of the Policy and Behavior of Public Participation on Environmental Governance Performance: Empirical Analysis Based on Provincial Panel Data in China. Energy Policy 2019, 129, 1347–1354. [Google Scholar] [CrossRef]
  56. Wu, W.; Wang, W.; Zhang, M. Does Internet Public Participation Slow Down Environmental Pollution? Environ. Sci. Policy 2022, 137, 22–31. [Google Scholar] [CrossRef]
  57. Kathuria, V. Informal Regulation of Pollution in a Developing Country: Evidence from India. Ecol. Econ. 2007, 63, 403–417. [Google Scholar] [CrossRef]
  58. Chai, S.; Wei, M.; Tang, L.; Bi, X.; Yu, Y.; Yang, J.; Jie, Z. Can Public Opinion Persuade the Government to Strengthen the Use of Environmental Regulation Policy Tools? Evidence from Policy Texts. J. Clean. Prod. 2023, 434, 140352. [Google Scholar] [CrossRef]
  59. Ringle, C.M.; Sarstedt, M.; Straub, D.W. Editor’s Comments: A Critical Look at the Use of PLS-SEM in “MIS Quarterly". MIS Q. 2012, 36, iii. [Google Scholar] [CrossRef]
  60. Hair, J.F., Jr.; Sarstedt, M.; Hopkins, L.; Kuppelwieser, V.G. Partial Least Squares Structural Equation Modeling (PLS-SEM): An Emerging Tool in Business Research. Eur. Bus. Rev. 2014, 26, 106–121. [Google Scholar] [CrossRef]
  61. Hair, J.F.; Ringle, C.M.; Sarstedt, M. PLS-SEM: Indeed a Silver Bullet. J. Mark. Theory Pract. 2011, 19, 139–152. [Google Scholar] [CrossRef]
  62. Hair, J.F.; Sarstedt, M.; Ringle, C.M.; Mena, J.A. An Assessment of the Use of Partial Least Squares Structural Equation Modeling in Marketing Research. J. Acad. Mark. Sci. 2012, 40, 414–433. [Google Scholar] [CrossRef]
  63. Anderson, J.C.; Gerbing, D.W. Structural Equation Modeling in Practice: A Review and Recommended Two-Step Approach. Psychol. Bull. 1988, 103, 411. [Google Scholar] [CrossRef]
  64. Guo, K.; Cao, Y.; Wang, Z.; Li, Z. Urban and Industrial Environmental Pollution Control in China: An Analysis of Capital Input, Efficiency and Influencing Factors. J. Environ. Manag. 2022, 316, 115198. [Google Scholar] [CrossRef] [PubMed]
  65. Ma, X.; Feng, X.; Fu, D.; Tong, J.; Ji, M. How Does the Digital Economy Impact Sustainable Development?—An Empirical Study from China. J. Clean. Prod. 2024, 434, 140079. [Google Scholar] [CrossRef]
  66. Liu, J.; Yu, Q.; Chen, Y.; Liu, J. The Impact of Digital Technology Development on Carbon Emissions: A Spatial Effect Analysis for China. Resour. Conserv. Recycl. 2022, 185, 106445. [Google Scholar] [CrossRef]
  67. Warschauer, M. Dissecting the “Digital Divide”: A Case Study in Egypt. Inf. Soc. 2003, 19, 297–304. [Google Scholar] [CrossRef]
  68. Tchounwou, P. Digital Economy Development, Industrial Structure Upgrading and Green Total Factor Productivity. Int. J. Environ. Res. Public. Health 2004, 1, 1–2. [Google Scholar] [CrossRef]
  69. Wang, P.; Lu, Z. Strategic Interaction in Environmental Regulation and Sulfur Dioxide Emissions: Evidence from China. Sci. Total Environ. 2023, 875, 162620. [Google Scholar] [CrossRef]
  70. Wang, L.; Long, Y.; Li, C. Research on the Impact Mechanism of Heterogeneous Environmental Regulation on Enterprise Green Technology Innovation. J. Environ. Manag. 2022, 322, 116127. [Google Scholar] [CrossRef] [PubMed]
  71. Feng, Y.; Wang, X.; Liang, Z. How Does Environmental Information Disclosure Affect Economic Development and Haze Pollution in Chinese Cities? The Mediating Role of Green Technology Innovation. Sci. Total Environ. 2021, 775, 145811. [Google Scholar] [CrossRef]
  72. Wu, L.; Ma, T.; Bian, Y.; Li, S.; Yi, Z. Improvement of Regional Environmental Quality: Government Environmental Governance and Public Participation. Sci. Total Environ. 2020, 717, 137265. [Google Scholar] [CrossRef] [PubMed]
  73. Chaudhuri, S. Wage Inequality in a Dual Economy and International Mobility of Factors: Do Factor Intensities Always Matter? Econ. Model. 2008, 25, 1155–1164. [Google Scholar] [CrossRef]
  74. Wang, Q.; Zhang, W.; Tseng, C.P.M.-L.; Sun, Y.; Zhang, Y. Intention in Use Recyclable Express Packaging in Consumers’ Behavior: An Empirical Study. Resour. Conserv. Recycl. 2021, 164, 105115. [Google Scholar] [CrossRef]
  75. Abu Seman, N.A.; Govindan, K.; Mardani, A.; Zakuan, N.; Mat Saman, M.Z.; Hooker, R.E.; Ozkul, S. The Mediating Effect of Green Innovation on the Relationship between Green Supply Chain Management and Environmental Performance. J. Clean. Prod. 2019, 229, 115–127. [Google Scholar] [CrossRef]
Figure 1. Schematic diagram of the impact mechanism of digitization.
Sustainability 16 03026 g001
Figure 2. Structure path diagram of the structural equation model.
Sustainability 16 03026 g002
Table 1. Construction of digitization and environmental governance performance index system.
VariableIndexVariable Description
Digital FoundationsDIGF1Mobile switch capacity per capita
DIGF2Internet broadband access ports per capita
DIGF3Number of domain names
DIGF4Number of websites
Digital ApplicationsDIGA1Number of Internet broadband access subscribers
DIGA2Internet penetration
DIGA3Telecommunications services per capita
Digital DevelopmentDIGD1Number of employees in the digital industry as a percentage of the number of employees at the end of the year
DIGD2Ratio of fixed assets of digital industry to total investment in fixed assets of the whole society
DIGD3Ratio of digital industry revenue to GDP
Environmental Governance PerformanceEGP1General solid waste consolidation rate
EGP2Industrial SO2 removal rate
EGP3Greening coverage in built-up areas
EGP4Non-hazardous treatment rate of domestic waste
EGP5Urban sewage treatment rate
Table 2. Construction of mediating variable index system.
VariableIndexVariable Description
Government Environmental RegulationGER1Total investment in pollution control
GER2Enterprise sewage charges
GER3Expenditure on environmental protection
GER4Investment in urban environmental infrastructure
Green Technology InnovationGTI1R&D investment intensity
GTI2Number of patent applications for green inventions
GTI3Technology market turnover
Public Environmental ParticipationPEP1Total number of NPC recommendations undertaken
PEP2Total number of CPPCC proposals undertaken
PEP3Total number of telephone and Internet complaints received by the ecology and environment sector
PEP4Browser total search index for “environmental pollution”
Table 3. Statistical description of the sample data variables.
VariablesSizeMeanSTDMinimumMaximum
DIGF13001.7020.5330.8054.267
DIGF23000.4470.2180.0960.986
DIGF330094.88137.41.1882.5
DIGF430012.3216.250.1877.75
DIGA1300985.1824.441.63890
DIGA230052.312.7924.283.15
DIGA33000.3350.3510.0561.648
DIGD13000.04360.09460.0006810.658
DIGD23000.5270.4050.02282.024
DIGD33000.01830.02395.76 × 10−50.127
EGP130065.0218.9325.3999.83
EGP230078.6616.682499.98
EGP330039.573.54127.949
EGP430093.0710.7242.3100
EGP530090.957.3659.2100.3
GER1300295.7205.517.2952.5
GER230064,28356,7262849358,888
GER3300149.599.5121.23747.4
GER43000.8320.4810.0972.6
GTI13001.731.1270.416.44
GTI2300383153701332,269
GTI3300416.3819.30.5676316
PEP1300229.8170.411727
PEP2300298.5220.711974
PEP33003.223.9520.01229.56
PEP4300105.239.2217.77215.4
Table 4. Reliability and convergent validity analysis.
Latent VariableObserved VariableFactor LoadngStandard DeviationCronbach’s AlphaCRAVE
DIGFDIGF10.8620.0210.8890.9230.750
DIGF20.8830.017
DIGF30.8350.030
DIGF40.8870.015
DIGADIGA10.8910.0120.7900.8790.709
DIGA20.7290.021
DIGA30.8960.013
DIGDDIGD10.9500.0050.8560.9130.778
DIGD20.8380.022
DIGD30.8550.017
EGPEGP10.6910.0260.8070.8640.560
EGP20.7900.032
EGP30.7560.027
EGP40.7440.027
EGP50.7540.030
GERGER10.9170.0130.8720.9110.720
GER20.7360.041
GER30.8250.016
GER40.9040.013
GTIGTI10.8870.0190.8690.9180.790
GTI20.8820.014
GTI30.8990.013
PEPPEP10.8710.0210.8560.9010.696
PEP20.8740.021
PEP30.7080.030
PEP40.8710.009
Table 5. Discriminant validity (Fornell–Larcker criterion).
DIGEPGGERGTIPEP
DIG0.798
EPG0.6370.748
GER0.7140.570.849
GTI0.7930.5770.5910.889
PEP0.7190.5330.6880.4560.834
Table 6. Model path coefficient and hypothesis testing results.
PathPath CoefficientT Statisticsp-Value
DIG → DIGA0.902 ***64.9380.000
DIG → DIGD0.889 ***61.8080.000
DIG → DIGF0.971 ***270.7310.000
DIG → EPG0.226 ***3.0690.002
DIG → GER0.714 ***29.8540.000
GER → EPG0.172 ***3.3230.001
DIG → GTI0.793 ***47.0990.000
GTI → EPG0.229 ***4.0550.000
DIG → PEP0.719 ***32.0010.000
PEP → EPG0.148 ***2.5060.012
Notes: Significance levels are expressed as *** for 1%.These notation conventions apply consistently to the subsequent tables.
Table 7. R2 and Q2 values of the model prediction test.
EPGGERGTIPEP
R20.4460.5080.6270.516
Q20.2280.3300.4730.322
Table 8. Mediation effect testing results.
PathT-Valuep-Value95%CI HSupported
Direct effects
 DIG → EPG0.226 ***3.0690.002[0.080; 0.365] H1Yes
Indirect effects
Individual indirect effects VAF
 DIG → GER → EPG0.123 ***3.3550.001[0.049; 0.192]0.299H2Yes
 DIG → GTI → EPG0.182 ***3.9780.000[0.094; 0.274]0.443H3Yes
 DIG → PEP → EPG0.106 ***2.4970.013[0.018; 0.184]0.258H4Yes
Global indirect effect
 DIG → EPG0.411 ***5.9250.000[0.276; 0.549]
Total effect
 DIG → EPG0.637 ***28.2390.000[0.587; 0.676]
Notes: Significance levels are expressed as *** for 1%.
Table 9. Heterogeneity test.
Path(1)
Eastern
(2)
Central
(3)
Western
(4)
High-Innovation
(5)
Low-Innovation
LoadingpLoadingpLoadingpLoadingpLoadingp
DIG → EPG0.681 ***0.000 0.685 ***0.000 0.504 *** 0.000 0.613 *** 0.000 0.570 *** 0.000
DIG → GER → EPG0.214 ***0.001 0.356 ***0.000 0.141 *0.059 0.201 *** 0.000 −0.034 0.544
DIG → GTI → EPG0.237 ***0.005 0.121 *0.072 0.025 0.780 0.21 *** 0.000 −0.193 * 0.073
DIG → PEP → EPG−0.0220.787 0.107 *0.087 0.096 0.216 0.066 0.224 −0.069 0.368
Notes: Significance levels are expressed as *** for 1%, and * for 10%.
Disclaimer/Publisher’s Note: The statements, opinions and data contained in all publications are solely those of the individual author(s) and contributor(s) and not of MDPI and/or the editor(s). MDPI and/or the editor(s) disclaim responsibility for any injury to people or property resulting from any ideas, methods, instructions or products referred to in the content.

