Article

Assessment of the Hydrochemical Characteristics of the Carbon Observational Site ‘Carbon-Sakhalin’ (Aniva Bay, Sea of Okhotsk)

by
Vladimir Pishchalnik
1,2,
Stanislav Myslenkov
1,3,*,
Elena Latkovskaya
1 and
Victor Arkhipkin
1,3
1
Climate Center, Sakhalin State University, 290 Lenina Str., 693000 Yuzhno-Sakhalinsk, Russia
2
Institute of Marine Geology and Geophysics Far Eastern Branch of the Russian Academy of Sciences, 1B Nauki Str., 693022 Yuzhno-Sakhalinsk, Russia
3
Department of Oceanology, Faculty of Geography, Lomonosov Moscow State University, GSP-1, Leninskie Gory 1, 119991 Moscow, Russia
*
Author to whom correspondence should be addressed.
Sustainability 2024, 16(7), 3031; https://doi.org/10.3390/su16073031
Submission received: 17 February 2024 / Revised: 18 March 2024 / Accepted: 2 April 2024 / Published: 5 April 2024
(This article belongs to the Section Sustainable Oceans)

Abstract

:
Following a tendency of many economies to shift towards carbon neutrality, there came the necessity for certain regions to be assessed in terms of their greenhouse gas emissions from the ocean. A carbon polygon was created in Sakhalin Oblast in order to evaluate the carbon balance of this marine ecosystem in a sub-arctic region, with the possibility of deploying carbon farms for additional CO2 absorption. To obtain such an assessment, it seems crucial to analyze hydrochemical parameters that reflect the situation of the marine environment in Aniva Bay as a basis of the carbon polygon. The article presents the results of the analysis of hydrochemical parameters in Aniva Bay waters and their spatial and seasonal variability. This research was based on available published sources and measurement databases for the period of 1948–1994. Additionally, the review uses hydrochemical data for Aniva Bay in 2001–2013 weather station data for the period of 2008–2023 and weather station data for 2008–2023. Some tendencies were discovered for spatial and temporal distributions of oxygen, pH, and biogenic matter (inorganic phosphorus, inorganic nitrogen, silicon). In surface layers, the mean oxygen year maximum (9.1 mg/L) is registered with the beginning of photosynthesis, i.e., immediately after the ice melting in April. The highest pH values 8.26 are registered in the euphotic layer in May. The lowest pH values was in August (7.96) in the near-bottom layer. The maximum annual P-PO4 registered on the surface (>18 µg/L) immediately after ice melting, with a minimum (7.17 µg/L) at the end of July. Si-SiO3 concentrations have two maximums: at the end of June and at the beginning of October. N-NO2 concentration on the surface is >2 µg/L in mid-July and on the 50 m depth it is >3.5 µg/L in mid-September. Some spatial patterns of hydrochemical parameters were shown based on the analysis of maps.

1. Introduction

Aniva Bay, situated in the northern part of La Perouse Strait, washes the southern coast of Sakhalin Island and belongs to the Sea of Okhotsk water basin (Figure 1). Aniva Bay is important for transport and fishery activities. Large hydrotechnical structures are located on the Bay’s coastline: the sea port of Korsakov (annual cargo turnover of >1.5 mln tonnes) and the oil and liquefied natural gas terminal in the port of Prigorodnoye (cargo turnover of >1.5 mln tons) [1], which are potential sources of marine waters technogenic pollution. Moreover, Salmon Bay (Bukhta Lososey), in the southwestern part of Aniva Bay, is exposed to pollutants through river runoff from the coastal cities of Aniva and Korsakov and the densely populated Susunai Valley. Littoral eelgrass meadows (Zostera, Phyllospadix) and subtidal kelps of brown seaweeds (Saccharina japonica) create areas of intense primary productivity and large biomass of commercial species of fish and invertebrates. The total stock of the most harvested species of brown algae Saccharina japonica is estimated here at more than 40 thousand tons [2]. The water area suitable for extensive mariculture is 177,455 ha [3].
Aniva Bay is a part of the Sea of Okhotsk with the widest range of variability of natural conditions and difficult ice conditions. It makes it impossible to conduct seasonal field observations of greenhouse gas absorption and constant monitoring of the carbon balance of the water area. The biological pump is the main part of the ocean’s carbon pump [4,5,6]. Many environmental factors need the phytoplankton blooms as the main force of the biological carbon pump (sufficient illumination, nutrient content, acceptable temperature, a certain regime of salinity and hydrodynamics, and much more). The range of environmental conditions is specific for each climatic zone and it determines the value of the primary productivity of the water area and carbon flux. Thus, the hydrological and hydrochemical conditions of the water area determine the net absorption of greenhouse gases by the marine ecosystem. Therefore, it is important to have a full-scale basis for modeling the annual cycle of carbon change in a particular ecosystem.
Aniva Bay is the marine part of the carbon observational site ‘Carbon-Sakhalin’ which is organized on the base of Sakhalin State University. ‘Carbon-Sakhalin’ is a part of the carbon polygons project, which is supported by the Government of the Russian Federation. This project is part of the national plan for adaptation to climate change [7].
The Program of Carbon Polygon in the Sakhalin Region was approved on 23 September 2021 at the Expert Council on Scientific Support for the Development of Carbon Balance Control Technologies of the Ministry of Education and Science of the Russian Federation.
The observational site ‘Carbon-Sakhalin’ is one of the first marine polygons in Russia. In 2022, the first all-Russian experiment to limit greenhouse gas emissions was launched in accordance with Federal Law No. 34-FZ, dated 6 March 2022, “On conducting an experiment to limit greenhouse gas emissions in certain subjects of the Russian Federation”. To solve the problem of estimating and reducing CO2 emissions, as well as possible ways of sequestering carbon, the most studied water area of the Sea of Okhotsk was selected. Aniva Bay is located close to the scientific centers and has developed infrastructure that made it possible to ensure a successful start of the project.
The general project concept includes several aims:
-
Creating a network of carbon observational sites, which include terrestrial and marine areas in different climatic zones of Russia;
-
Investigation of the physical and biochemical processes that define the carbon cycle;
-
Measuring of emission and absorption of greenhouse gases (GHGs) using the standard equipment and methods;
-
Assessments of the regional biogeochemical carbon cycle and human impacts;
-
Investigation of the potential of GHG sequestration by natural ecosystems;
-
Development and testing of carbon balance control and technologies of GHG sequestration, and anthropogenic increase in the sequestration capacity of natural ecosystems within the framework of the “green” and “blue” economy.
Russia is still at the very beginning of the way to assess carbon emissions in the coastal zone of our seas. Research at the carbon observational site will certainly contribute to the sustainable development of the Sakhalin region.
The network of carbon polygons in Russia is created on a competitive basis and is funded by the Ministry of Science and Higher Education of the Russian Federation and businesses.
Financing is possible only after an assessment of the regional legislation in limiting greenhouse gas emissions, the regional system of carbon regulation, an inventory of all types of emissions and integral estimates of greenhouse gas emissions and absorption, the capabilities of scientific organizations, the complexity of the approach, and the presence of a variety of non-urbanized ecosystems.
The total greenhouse gas emissions in the Sakhalin Region were 12.333 million tons e-CO2; total net greenhouse gas absorption was 11.068 million tons e-CO2 (only by forest lands) in the Sakhalin Region in 2019 [8]. The total net greenhouse gas emissions in the Sakhalin Region amounted to 1.265 million tons of e-CO2 in 2019 [8].
Marine ecosystems and blue carbon were not included in the accounting. Therefore, the study of greenhouse gas fluxes in coastal marine ecosystems and the assessment of net absorption and emissions for subsequent inclusion in the national plan adaptation and mitigation of Russia is our strategic mission. The adaptation of the world’s Ocean Carbon Dioxide Removal (CDR) technologies through the development of mariculture farms will help the Sakhalin region quickly achieve carbon neutrality.
A marine carbon site is a sea area where we carried out a complex of measurements of meteorological, hydrological, hydrochemical (HCh) (including fluxes of carbon dioxide in the ocean-atmosphere system), hydrobiological parameters in both field and remote mode. Several important points about the development of the network of carbon polygons in Russia are presented in [9].
The absorption of carbon by marine ecosystems, based on both physical and biological processes, is most active in natural eelgrass meadows and kelps of seaweed (including maricultural), foreshores, and areas with high phytoplankton density (estuaries, lagoons, upwelling zones, areas of organic matter accumulation, etc.). However, simultaneously with carbon absorption is its emission, the so-called ‘breath of the sea’. This breath consists of CO2 emission through breathing hydrobionts, decomposition of organic matter by microorganisms, CO2 emission from seawater during storms, ice melting, etc. [10,11,12,13,14,15,16]. The processes described above make the baseline of absorption, which is unique for every body of water.
The combination of natural and anthropogenic conditions makes Aniva Bay essential for studying the biogeochemical carbon cycle in the marine ecosystem. The Bay is shallow (up to 100 m), convenient for field research by boats, its ice regime has been studied, and there are abundant natural macrophyte populations, large littoral tidal flats, and a flux of large rivers with wastewater. An interesting point that complicates the carbon balance of this reservoir is the natural and artificial salmon populations, which additionally bring in a large amount of organic matter. Therefore, Aniva Bay was chosen as the marine part of the carbon measurements test areas.
It is planned to install several stationary oceanographic platforms with a set of meteorological and hydro-hydrochemical sensors, conduct regular field sampling of water, ice, sediments, plankton, and benthos, including the winter ice period to calculate the baseline of CO2 absorption at the carbon site in Aniva Bay.
Another task of the ‘Carbon-Sakhalin’ site is to search for technologies for additional extraction of GHGs by the marine ecosystem. One of the most natural-like technologies of GHG sequestration, prevention of acidification and eutrophication in marine environments is the creation of seaweed farms, mussel farms, and integrated multi-trophic aquaculture farms. Such farms, with organisms of different trophic levels (autotrophic and heterotrophic), can significantly increase carbon absorption and decrease the concentration of biogenic elements to prevent eutrophication [13,17,18,19,20,21,22,23]. There is active development of algorithms to assess the intake capacity of bodies of water for such farms, risks of eutrophication, and interaction with natural populations [24,25,26,27]. Large kelp farms may decrease phytoplankton productivity due to the decrease in available nitrogen and phosphorus forms, which impacts the overall level of biological productivity in the area [28,29].
So, studies of the hydrochemical (nutrient) regime in Aniva Bay will identify suitable areas for the deployment of farms with essential hydrological and hydrochemical conditions and will help us plan the optimal number of carbon mariculture seaweed–bivalve farms. Management strategies for carbon farm deployment are aimed at limiting the area for farms, recommendations for placement sites and species composition. It is very important to improve the health and productivity of the Aniva Bay ecosystem and prevent eutrophication and damage of local ecosystems and biodiversity.
In general, modern hydrochemical data are the basis for assessments of the absorption capacity of marine areas for GHGs and help the regional government to make science-based decisions regarding economic and mitigation strategies for climate change in the region.
Understanding the hydrophysical variability is of utter importance for the research of processes of organic matter transformation and GHG emissions [30,31]. Since biogeochemical models [32,33,34,35] are used to assess GHG emissions on site, the hydrochemical characteristics of water areas are set as initial and boundary conditions. Taking into account climate change, it is essential to understand the seasonal and interannual variability of hydrochemical parameters of bay water, the tendencies of its changes, and the evaluation of its current state. Monitoring of various parameters at carbon sites using autonomous devices is very prospective research [36].
Aniva Bay is part of the Sea of Okhotsk and, at the same time, is influenced by the Sea of Japan, both of them play significant climate effects on the northern Pacific region. The interaction of subarctic and subtropical water masses in Aniva Bay creates a unique pattern of greenhouse gas flux from the northern Pacific region and back.
Therefore, the analysis of hydrochemical parameters in Aniva Bay provides information about the carbon cycle and fluxes of greenhouse gas emissions in part of the northern Pacific region.
In 1975, the National System for Environmental Observations and Control (NSEOC) was initiated in the Russian Far East. Within this system, seawater quality was monitored in Far Eastern seas and Aniva Bay, and this monitoring has been carried out with various regularity up to today [37].
The first fundamental overview of studies on the Sea of Okhotsk hydrochemistry was presented in a monograph Hydrometeorology and Hydrochemistry of Seas in the “Seas of the USSR” series [38]. However, the coarse spatial scale of the research (1 × 1°) did not permit us to provide details of the hydrochemical regime of Aniva Bay. The next large-scale review of hydrochemical research, conducted within the “Ecology of Russian Seas” project [39], was devoted to the Sea of Okhotsk and the Pacific Ocean water territories around the Kuril Straits, so Aniva Bay was not considered separately.
In 1998, the first version of the Hydrological and Hydrochemical Atlas of the Sakhalin shelf was created (“ATLAS” software № 930078) [40]. These applications permitted to plot maps of the seasonal distribution of hydrological sections in a 100-mile zone adjacent to Sakhalin, as well as the vertical distribution of parameters for intermediate oceanological stations in eight selected regions [41]. The program and paper version of the “ATLAS” has been widely used in the last decades by research institutions in the Far East as a practical reference guide during oceanological, hydrobiological, and numerical studies for the assessment of regime parameters of the marine environment in the Sakhalin shelf zone.
The first overall seasonal spatial distribution of hydrological and hydrochemical characteristics in Aniva Bay, based on the data from the “ATLAS” program, was calculated in a study guide [42] aimed at undergraduate students, PhD students, and researchers of Sakhalin State University. A more detailed edition, supplemented with results of the marine environment state modeling, was published in 2020 [43].
An analysis of separate characteristics of the hydrochemical regime of Aniva Bay is presented in a series of publications after hydrobiological studies were conducted, typically on micropolygons, in order to solve practical tasks [44,45,46]. Various aspects of the hydrochemical regime in Aniva Bay were discussed after the expedition results in works by the Sakhalin Scientific Research Institute of the Fish Facilities and Oceanography (SakhNIRO) [47,48,49].
There are a few significant articles devoted to the hydrochemical regime of the Sea of Okhotsk as a GHG absorber and the only source of intermediate water circulation in the northern Pacific Ocean. The available data from research vessels and satellites were summarized and they showed decreased water salinity, decreased dissolved oxygen, and increased transparency from a long-term perspective [50,51,52,53].
Biohydrochemical processes in the Sea of Okhotsk are still understudied, especially during ice season. It is known that cold conditions create a community of low-thermophilic nitrogen-fixing and photosynthetic microorganisms [54]. Concentrations of chlorophyll-a in the Sea of Okhotsk ice may reach 3.5 mg/m2, which indicates active vegetation of sea-ice microcoenosis [55] resulting in the formation of a specific oligotrophic under-ice layer of water [56]. Research demonstrated that during ice melt in the Sea of Okhotsk, sea-ice microcoenosis actively absorbs carbon dioxide. After the ice melts, these organisms take part in the formation of spring phytoplankton outbursts [57]. In the work by [58], the inflow of anthropogenic CO2 (CO2-antr) is calculated for 1993–2000, which made up 10 g C/m2 a year. Accumulation of CO2-antr for the same period for the whole Sea of Okhotsk is estimated be 0.78 Tg (1 Tg = 1012 g) C yr−1 over the entire Sea of Okhotsk. A few studies are devoted to the general analysis of hydrochemical parameters in other parts of the Sea of Okhotsk [59,60,61,62], but they do not consider Aniva Bay. Moreover, a significant climate effect was established from the Sea of Okhotsk on the northern Pacific region from the Sea of Okhotsk [63]. For example, the annual discharge of dissolved organic carbon from the Sea of Okhotsk into intermediate layer waters of the northern Pacific Ocean made up 68–72 Tg C yr−1 and dissolved organic nitrogen of 5.4 Tg N yr−1 [64].
Of course, volcanic eruptions can have a noticeable effect on the chemical composition of the atmosphere and ocean [65,66]. It is also necessary to pay attention to the work related to investigations about the coupled CO2 diffusion–reaction process influencing CO2 transport and the evolution of carbonate precipitation in diffusion-limited zones [67].
Thus, a detailed analysis of hydrochemical parameters in Aniva Bay is lacking and we are trying here to fill this gap. In this work, we supplement and reconsider the previously published preliminary results devoted to the HCh regime in Aniva Bay waters [41,42,43].
The principle motivation for this research is the need to have an understanding of spatial and temporal variability of HCh parameters for the upcoming work on modeling the carbon cycle and gas emissions. The aim of this study is to review all the available data and publications devoted to the analysis of spatial and temporal variability of oxygen, pH, inorganic phosphorus, inorganic nitrogen, and silica in Aniva Bay. Based on the available dataset of in situ measurements over 1975–1994, we try to reconstruct the annual cycle of HCh parameters and render maps of their spatial variability.
The next important purpose of this article is to provide a wide review of studies on hydrochemistry and modeling of the Sea of Okhotsk. Unfortunately, most of the studies have been published in highly specialized journals and books in the Russian language and access is therefore limited to Russian speakers.
This article consists of 5 sections. The Introduction focuses on the urgency of the topic, our motivation and aims. Section 2 gives a review of previously published research papers about HCh parameters in the Sea of Okhotsk and Aniva Bay. Section 3 describes the initial data and methods of their processing. Section 4 presents the results of the analysis of HCh parameters seasonal variability in Aniva Bay. Section 5 is devoted to discussion, and Section 6 provides our conclusions.

2. Review of Hydrochemical Regime of the Sea of Okhotsk and Aniva Bay Waters

In [38], initial data for the hydrochemical analysis of the Sea of Okhotsk waters were taken from all the available research vessel deep water measurements obtained from 51,607 stations during 1930–1988. It is worth noting that water temperature was recorded at all oceanographic stations, while dissolved oxygen was measured only at 9236 stations, with inorganic forms of P, N, and Si measured at 1478, 1637, and 2239 stations, respectively. All the available data, after clearing, were sorted in 1-degree squares and then these datasets were divided into months. For every square, statistics were calculated (mean, maximum, minimum values, and mean-squared deviations for all elements at all standard sample depths), which were related to its center. From the obtained numerical data, maps were plotted for the spatial and temporal distribution of parameters across the entire Sea of Okhotsk water territory. Vertical distribution graphs were also plotted for separate squares.
The conducted studies permitted the formulation of the basic features of the HCh regime of the Sea of Okhotsk in general. Thus, we confirmed the consistency of the main salt composition of the water in different parts of the Sea of Okhotsk on the surface and in the water column. A similarity was noted between the main salt composition of seawater and the main salt composition of waters in the adjacent part of the Pacific Ocean, which has the overall tendency of vertical distribution for nearly all elements of the salt composition—their concentrations increase with depth. It was also shown that it makes sense to divide and analyze the Sea of Okhotsk water column into several layers depending on the intensity of thermodynamical, chemical, and biological processes taking place there. These layers are surface, intermediate, and deepwater ones.
The surface layer clearly demonstrates seasonal changes in HCh parameters (apart from dynamically active sea zones) down to the depths of 150–250 m. In spring and summer, most of the water territory of the sea exhibits subsurface oxygen (up to 14.5 mg/L) and phosphorus (P-PO4) maximums, as well as subsurface minimums of P-PO4 and silica, which coincide with the oxygen maximum. This layer also has the highest values of hydrogen parameters (pH), up to 8.1–8.4. The depth of oxygen compensation varies from 30 to 70 m. The concentration of nitrite-nitrogen (N-NO2) does not exceed 0.001–0.0015 Nmg/L (in dynamically active zones, it rises up to 0.002–0.004 Nmg/L), P-PO4—0.09 Pmg/L, and silica—1.7 Simg/L.
It was found that there are no seasonal changes in values of HCh parameters in the intermediate layer. The lower boundary of this layer is the oxygen minimum layer where its concentration drops until 1.1–1.8 mg/L (saturation 12–18%). The thickness of this oxygen minimum layer varies from 200–500 m in most parts of the sea to 1200–1500 m in the Kuril Straits in zones with active mixing. Remarkable characteristics are lower oxygen concentration, minimum pH (down to 7.5–7.8) and nitrite-nitrogen values, and maximum alkaline values (up to 2.50–2.70 mmol/L). Concentrations of inorganic phosphorus and silica reach their maximums at the lower boundary of the layer (up to 0.08–0.14 Pmg/L and 4.0–6.0 Simg/L, respectively).
Characteristic features of HCh variability in the deepwater layer are increased oxygen concentrations up to 2.5–3.0 mg/L across the entire basin (saturation up to 22–27%), decreased silica and stable P-PO4, pH, and alkaline. Concentrations of nitrite-nitrogen drop until analytical zero here [38].
A series of studies of comprehensive oceanological research of the Sea of Okhotsk ecosystem was carried out by the laboratory of marine ecology of the Russian Research Institute of Fishery and Oceanography (VNIRO) in 1990–1994 [39]. A joint monograph presents the results of full-scale expeditions in the Sea of Okhotsk in 1990–1994 carried out by the laboratory of Marine Ecology VNIRO, together with researchers from the Pacific branch of the Federal State Budget Scientific Institution, the Russian Federal Research Institute of Fisheries and Oceanography (TINRO) and the Shirshov Institute of Oceanology of Russian Academy of Sciences. The indisputable value of these studies is the systematic approach to the analysis of the results obtained during five expeditions with the use of modern equipment. The conclusions in this work regarding hydrochemistry, based on high-accuracy data from flow automatic analyzers, permitted us to check and verify currency fields with respect to HCh parameters and to assess phytoplankton production with respect to a decrease in dissolved inorganic nitrogen (inorganic nutrients) in the eutrophic layer over the period from the beginning of its vegetation to the moment of research.
New methods of registration of organic and mineral compounds of phosphorus, nitrogen, and silica made it possible to finalize the balance of various inorganic nutrient forms, single out the “new” primary production based on the inorganic nutrients recycling, which does not reach higher trophic levels, i.e., does not create a biological ground for a fishery. A stable maximum of chlorophyll-a concentration above the thermocline was established during a detailed study of the vertical structure of phytopigments. In most cases, this maximum is much higher than the upper extremum at depths of 10–20 m. It is exactly here where the “new” primary production is created in summer when the main inorganic nutrients supply above the thermocline has already been assimilated. In the second half of summer, there is a change in phytocoenosis around the lower maximum of chlorophyll. Diatomic plankton slowly decreases and, in some cases, it is substituted for peridinials.
Instrumental measurements confirmed the fact that inorganic nutrients content rises due to autumn–winter convective mixing. The concentration of inorganic nutrients is quite high across the entire Sea of Okhotsk: 0.0558–0.0744 mgP/L for inorganic phosphorus, 0.210–0.420 mgN/L in total for all forms of inorganic nitrogen, and 0.840–1.680 mgSi/L for silica. Maximum concentrations are registered in the areas of continental slopes of the Sakhalin and the Kamchatka, where they match the anti-cyclonic eddies. The deepwater layer of the sea demonstrates the least variety of inorganic nutrients, although shallow-water shelf areas also have lower concentrations. In summer, the content of inorganic nutrients drops drastically compared to winter and, unlike the pre-vegetational period with its lack of nitrogen, shows a deficiency of silica. The lack of inorganic forms of nitrogen and phosphorus is mostly compensated by their regeneration during the decomposition of organic matter and metabolic processes of marine hydrobionts, as well as the ability of phytoplankton to consume nitrogen and phosphorus organic compounds. Meanwhile, silica is regenerated rather slowly; hence, it is relatively deficient compared to nitrogen and phosphorus [39]. Unfortunately, the water territory of Aniva Bay was not included in such research.
In [42,43], one can find the most comprehensive analysis of HCh regime of the La Perouse Strait waters, conducted on the basis of mean average calculations of O2, pH, P-PO4, N-NO2, and Si with the “ATLAS” software for 1975–1994 [40,68]. However, these data provide only partial information on the HCh regime in Aniva Bay. The characteristics of Aniva Bay obtained from this application were used as input parameters for the modeling of hydrological, HCh parameters, and transformation of petroleum hydrocarbons in the bay [43,69,70,71,72]..
Seasonal research of HCh parameters (salinity, contents of oxygen, ammonium ions, nitrate nitrogen, inorganic phosphorus, silica, and chlorophyll-a) was conducted in the southern part on Aniva Bay and the adjacent La Perouse Strait water territory in 1996–1997 [73]. The analysis of rather patchy information on the seasonal inorganic nutrients variation demonstrates low values of inorganic phosphorus—down to 0.0803 mgP/L. For ammonium nitrogen (N-NH4) the concentrations varied between 0 to 0.0676 mgN/L, for nitrate nitrogen (N-NO3)—from 0 to 0.2366 mgN/L, for silica—from 0.0224 to 0.9436 Si/L. Maximum concentrations of inorganic forms of N and P were recorded in June, and Si in March.
Complex seasonal research of hydrochemical and hydrobiological parameters in Aniva Bay was carried out on standard cross-sections by SakhNIRO in 2001–2013 (five sets of measurements a year in 2001, 2002, 2009, and three sets in 2013) [44,45,47,49,73]. In hydrological spring 2001–2002 (April–June), the concentrations of all inorganic nutrients above the thermocline were low due to high amounts of phytoplankton. However, below the thermocline these numbers were quite high, reaching 0.0088 mgN/L for nitrite nitrogen, 0.5418 mgN/L for nitrate nitrogen, 0.0701 mgP/L for inorganic phosphorus, and 1.1312 mgSi/L for silica. The same inorganic nutrients distribution (minimum above the thermocline and maximum below it) was observed in summer (August). In autumn (October–November) low values of inorganic nutrients in the surface water layer remained because of the phytoplankton bloom, while the inorganic nutrients reserve in deepwater layers remained unchanged. In 2009 and 2013, the peculiarities of vertical inorganic nutrients distribution in spring demonstrated poorer upper layer. The concentrations were as follows: N-NO2—0–0.0103 mgN/L; N-NO3—0–0.4551 mgN/L; P-PO4—0–0.1734 mgP/L; and Si—0.0111–1.6382 mgSi/L. In summer (July–first third of September) the inorganic nutrients vertical distribution was similar. As for the values of concentrations, inorganic phosphorus dropped significantly, while silica increased because of the shift in the type of phytoplankton from diatomic to peridinial. At the same time, the values for inorganic nitrogen were similar to those in spring: N-NO2—0–0.0101 mgN/L; N-NO3—0–0.3792 mgN/L; P-PO4—0–0.1002 mgP/L; and Si –0.0437–1.8161 mgSi/L. In autumn (October–November) the maximum concentrations of nitrite and nitrate nitrogen remained almost unchanged (maximum 9.8 mgr N-NO2/L and 382.2 mgr N-NO3/L), while the values for inorganic phosphorus and silica rose considerably (up to 0.1967 mgP/L and 2.5875 mgSi/L).
Thus, we can conclude that the most complete hydrochemical research of Aniva Bay was conducted between 1975 and 1994. In the last 30 years, the studies have been inconsistent, which makes it impossible to assess carbon balance in the water basin correctly based on field measurements.

3. Data and Methods

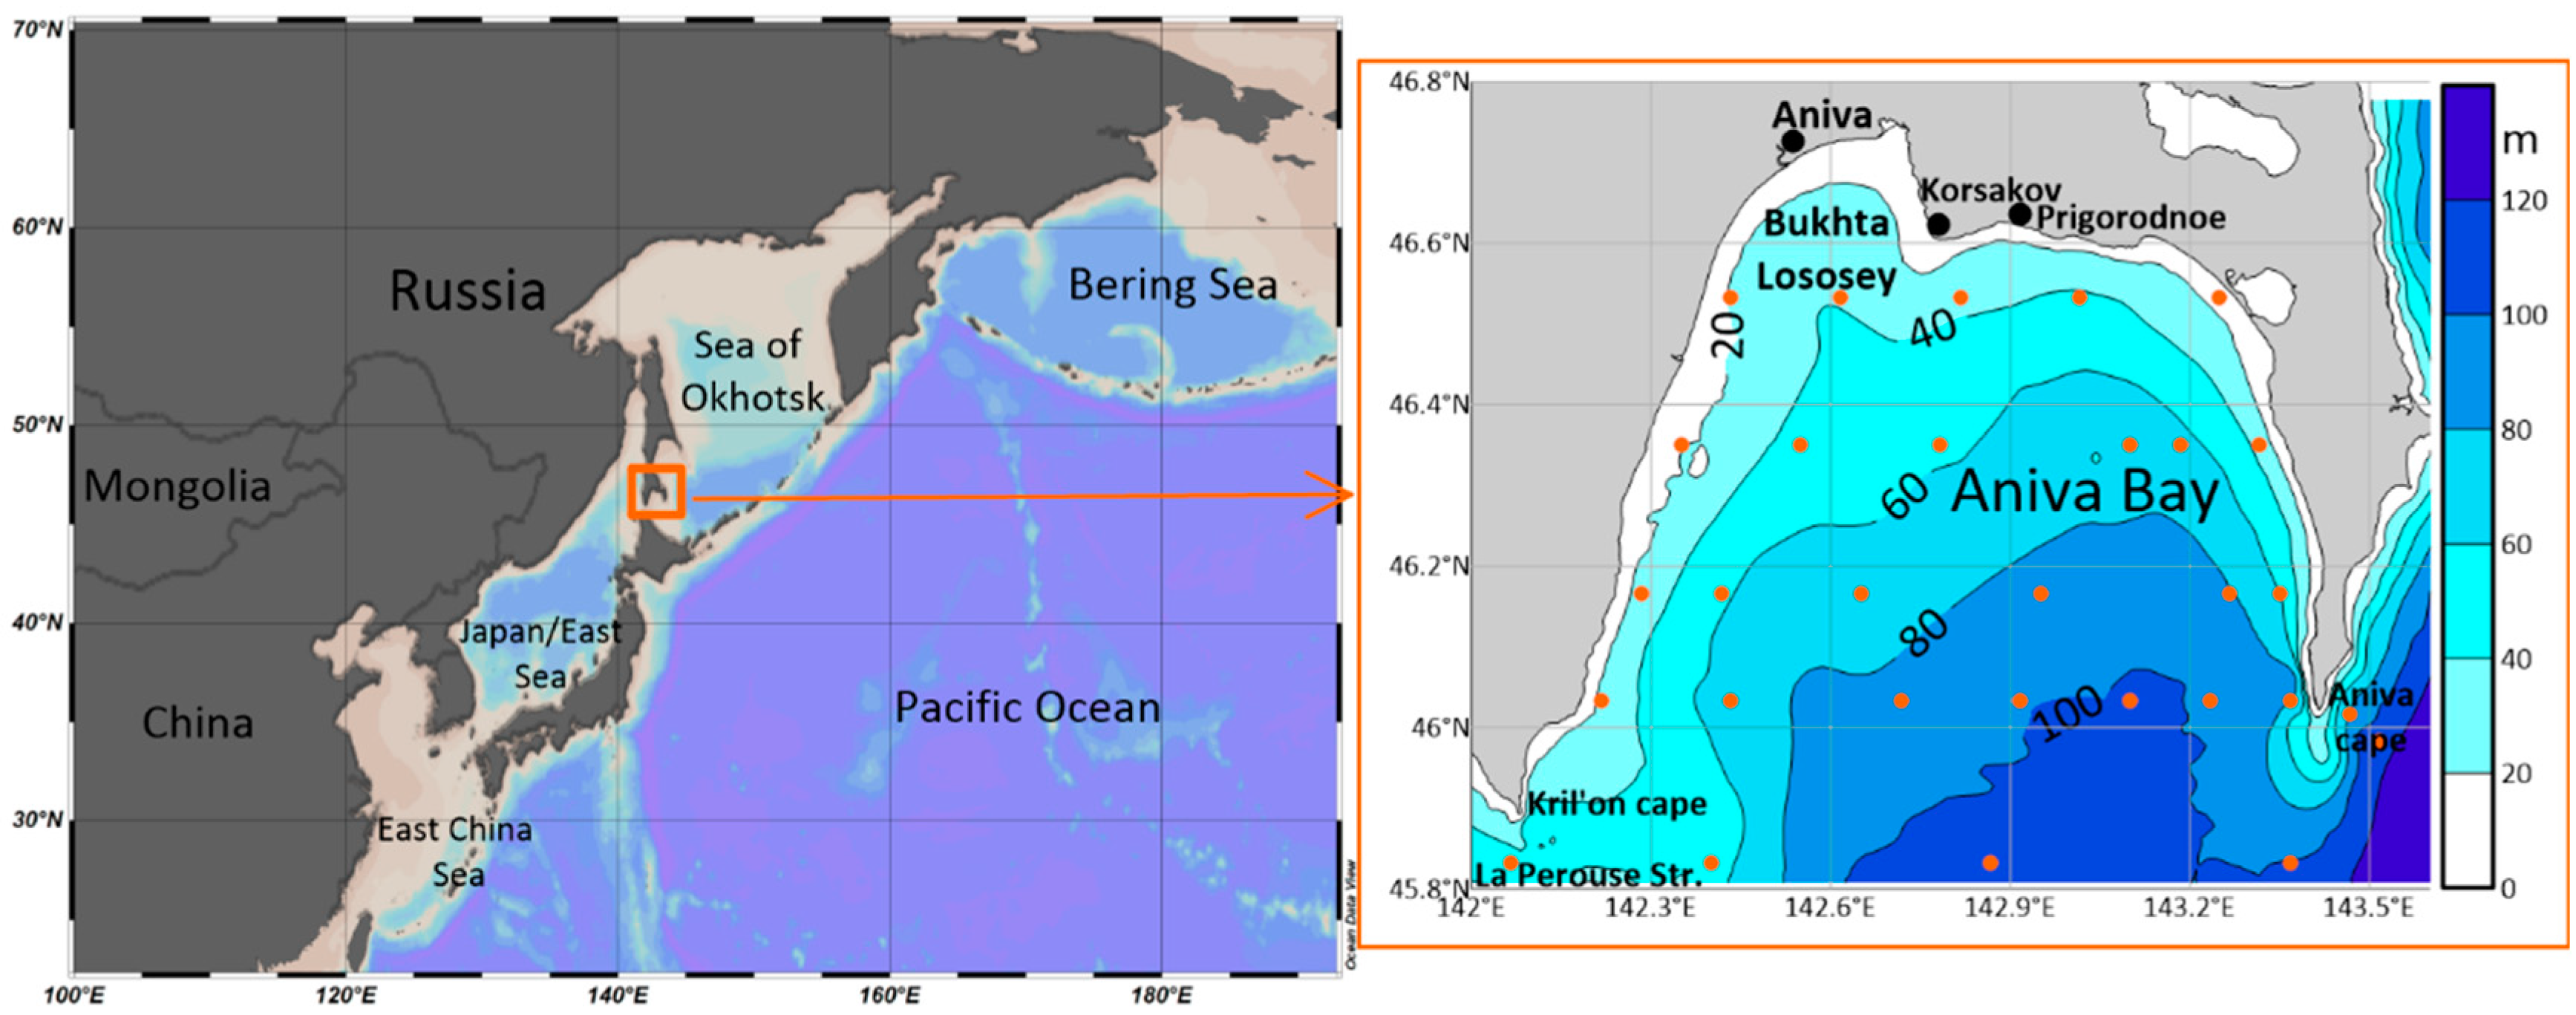
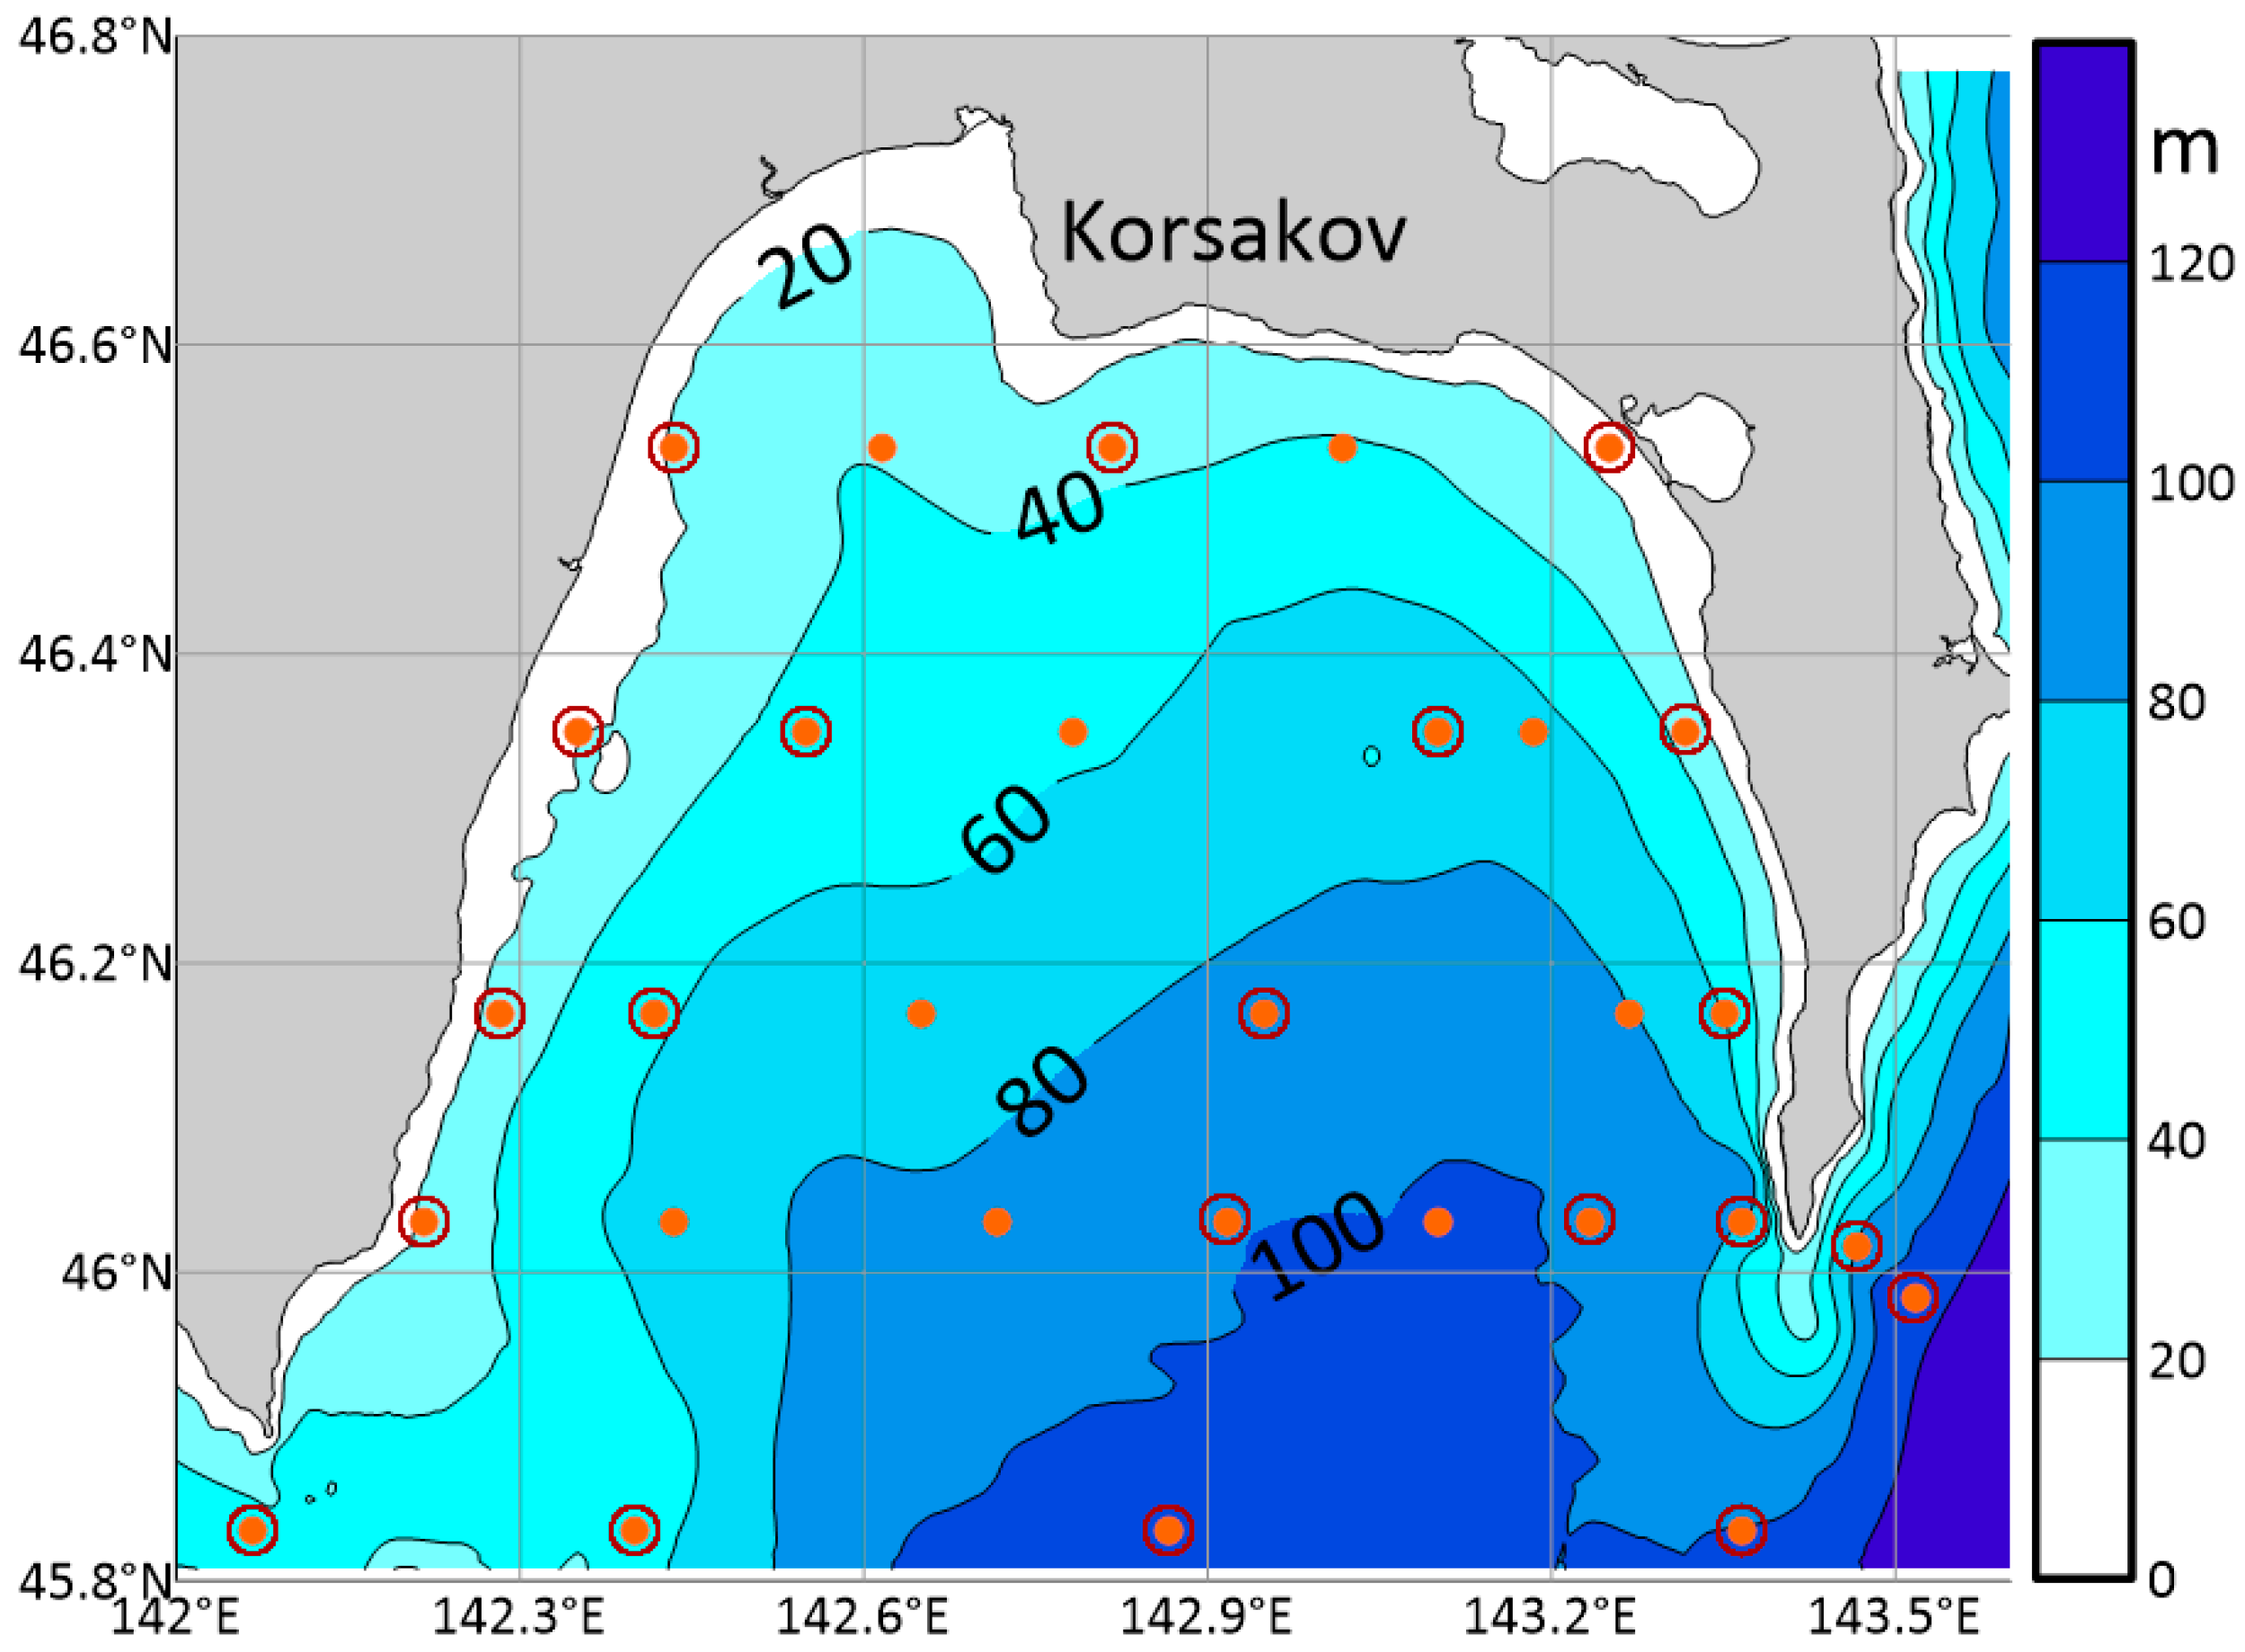
3.1. Field Measurement Data

This study uses mostly the database from the “ATLAS” software [40], which includes stations taken on the standard cross-section grid (Figure 2). A detailed analysis of the structure of field measurements is given in [41]. On board the research vessels, HCh observations were typically conducted ‘via station’ because marine water sampling is very time-consuming. That is why the number of HCh observations is less that hydrological ones. The calculations of seasonal variability of HCh parameters in Aniva Bay were based on observation data from 15 stations over the period of 1975–1994 (Table 1).
Averaged parameters for seasonal variability analysis were calculated as follows: all observations at every oceanographic station and every standard sampling depth over every parameter over the period of 1975–1994 were sorted according to their dates in format MMDD (irrespective of the year), and the running average procedure was applied with a window of 1 month (Figure 3). In order to obtain reliable evaluations, the sliding window should be wide enough, but, at the same time, narrow enough so that observations from the dataset could be considered homogeneous in their average and dispersion. A calendar month matched our conditions most precisely. The window was shifted with a 1-day step, then a spline was computed on the obtained values and the averaged parameter was derived with a time step of 5 days.
Thus, based on observation data and applying objective interpolation and running average across 15 stations in Aniva Bay, arrays of HCh parameters were obtained with a time step of 5 days from April until November. The data arrays were calculated for standard sampling depth of 0, 10, 20, 30, 50, and 100 m for the following parameters: O2, pH, P-PO4, and N-NO2 и Si-SiO3. Additionally, we added six more stations from the same dataset to the southern boundary of the bay to improve visualization on the maps of distribution of the studied parameters (Figure 2). Linear interpolation was used for the maps visualization process.

3.2. Methods of Monitoring of Hydrochemical Parameters

Regular monitoring of HCh parameters of the marine environment on the Sakhalin shelf (including Aniva Bay) was initiated in 1975 within the NSEOC program. Before hydrological probing systems (e.g., CTD-probe MARK-IIIB, etc.) were introduced into regular deepwater research in the late 1980s–early1900s, dissolved oxygen concentration in water was determined on board the vessel using the iodimetric method (the Winkler test, accuracy ±0.28 mg/L). Hydrogen content (pH) was determined with the potentiometric method by means of various pH meters. The accuracy of pH determination depends of the accuracy category of a device and makes ±0.01/0.02 units [74].
Before fluid analyzers and flow analyzers of different types appeared in the mid-1990s, the inorganic nutrients concentrations were defined by means of a colorimetric method. Phosphates in terms of phosphorus were defined by applying the modified Murphy–Riley method with ascorbic acid as a reductant and tartaric emetic as a catalyst (method sensitivity 0.00025 mg/L, mean absolute error 1.1%). Nitrites in terms of nitrogen were calculated applying the Griess test, based on diazotization of nitrites with sulfanilic acid and the following interaction of diazocompound with a-naphtylamine (minimum detectable limit 0.0005 mg/L, mean absolute error 15%, method accuracy 0.0001 mg/L). Silica was defined applying the Dienert and Wandenbulcke method modified by VNIRO, based on colorimetrization of yellow silicomolybdic complex in UF spectrum with metholsulphite as a reductant (mean absolute error of 2.5–5%, method accuracy of 0.001–0.050 mg/L for various silica content in marine water). All results were calculated in terms of elements. All methods are rather simple and convenient for field work [74].

4. Results

4.1. Analysis of Seasonal Variability of Hydrochemical Parameters in Aniva Bay

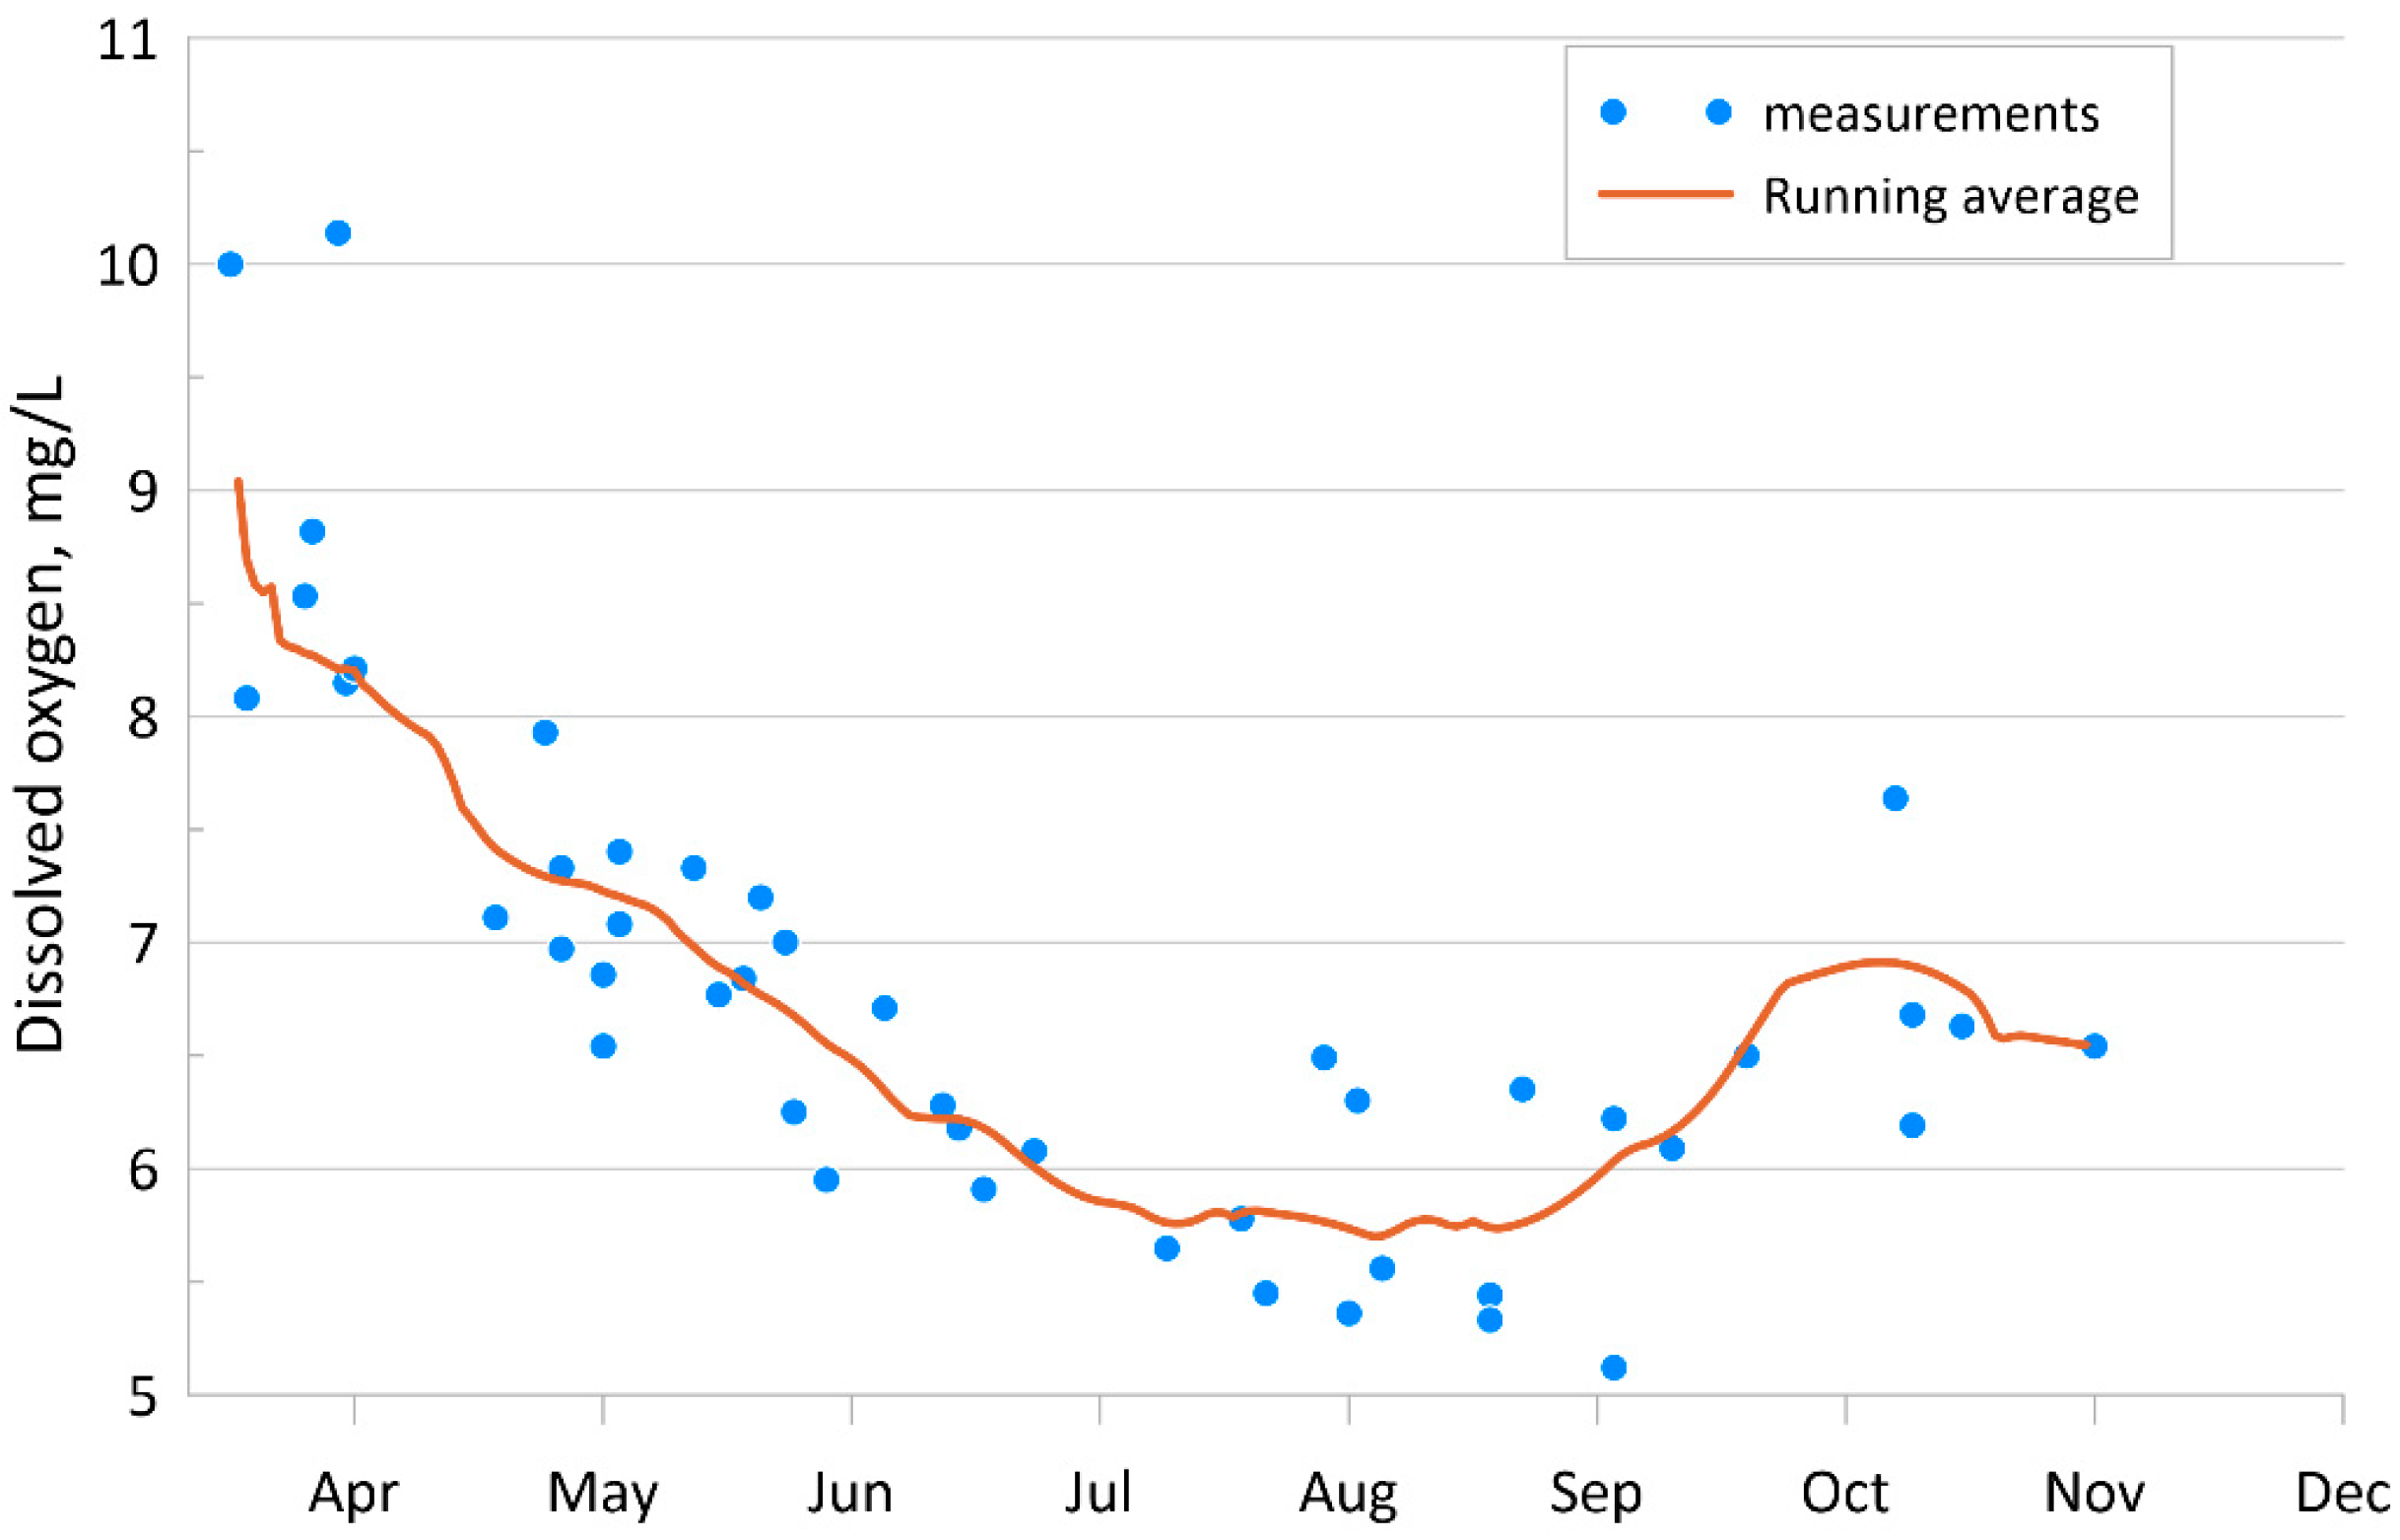
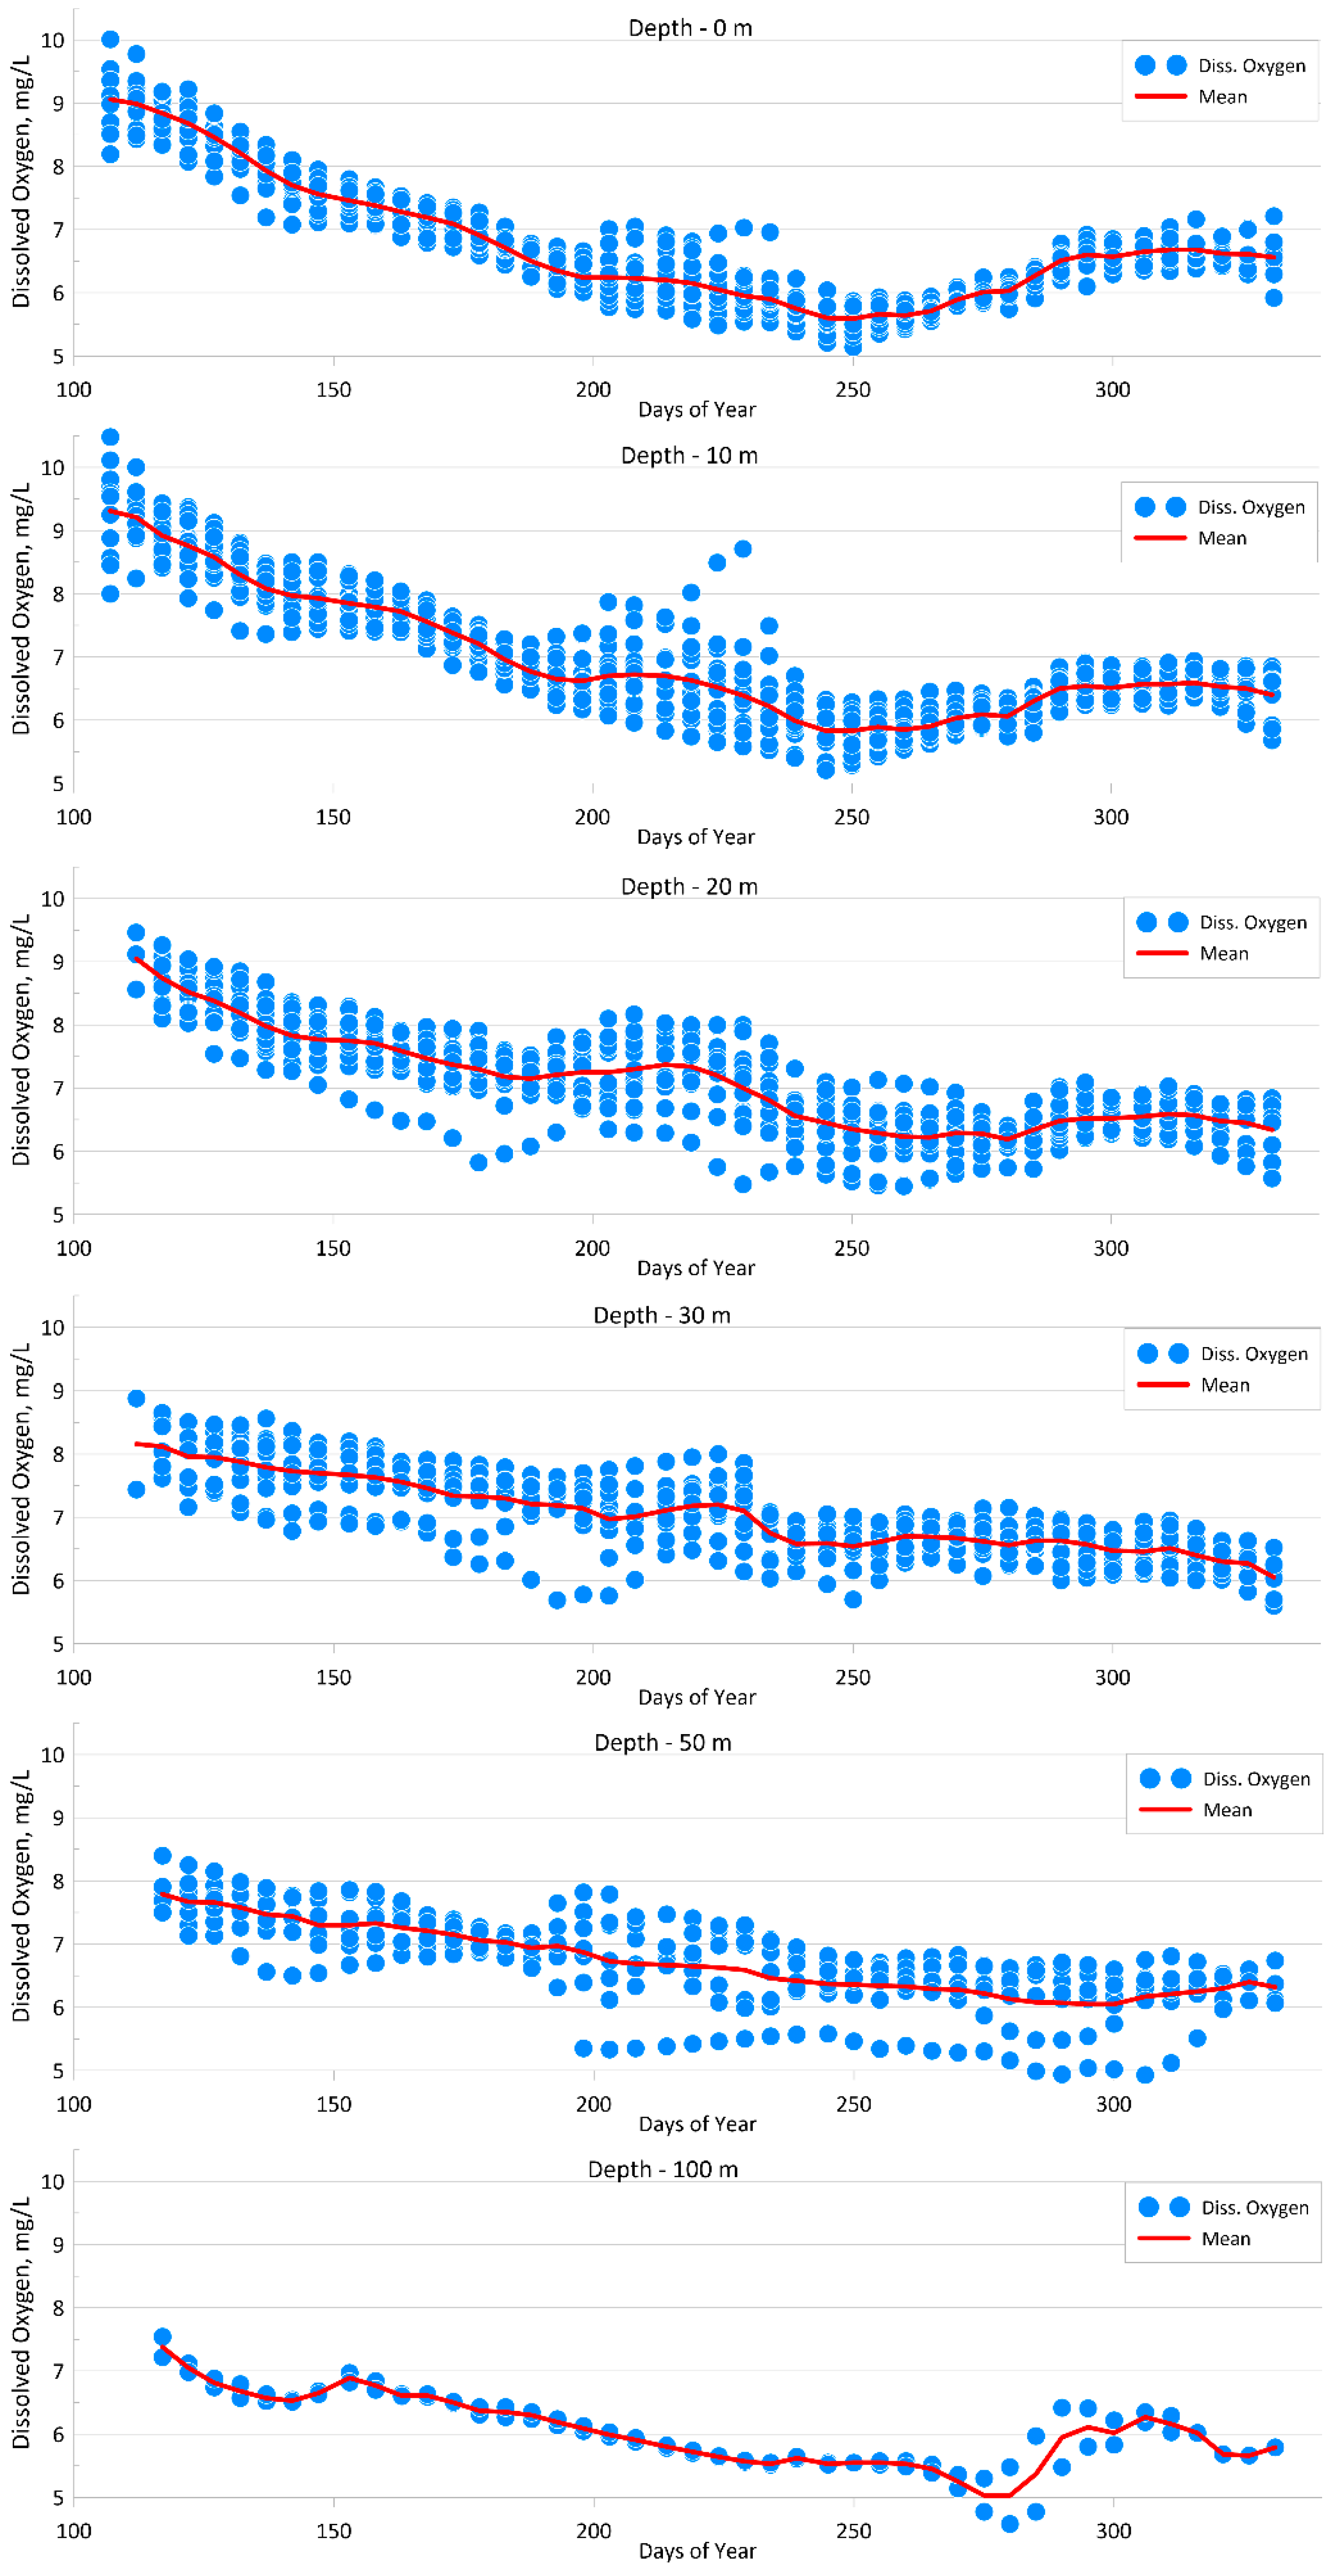
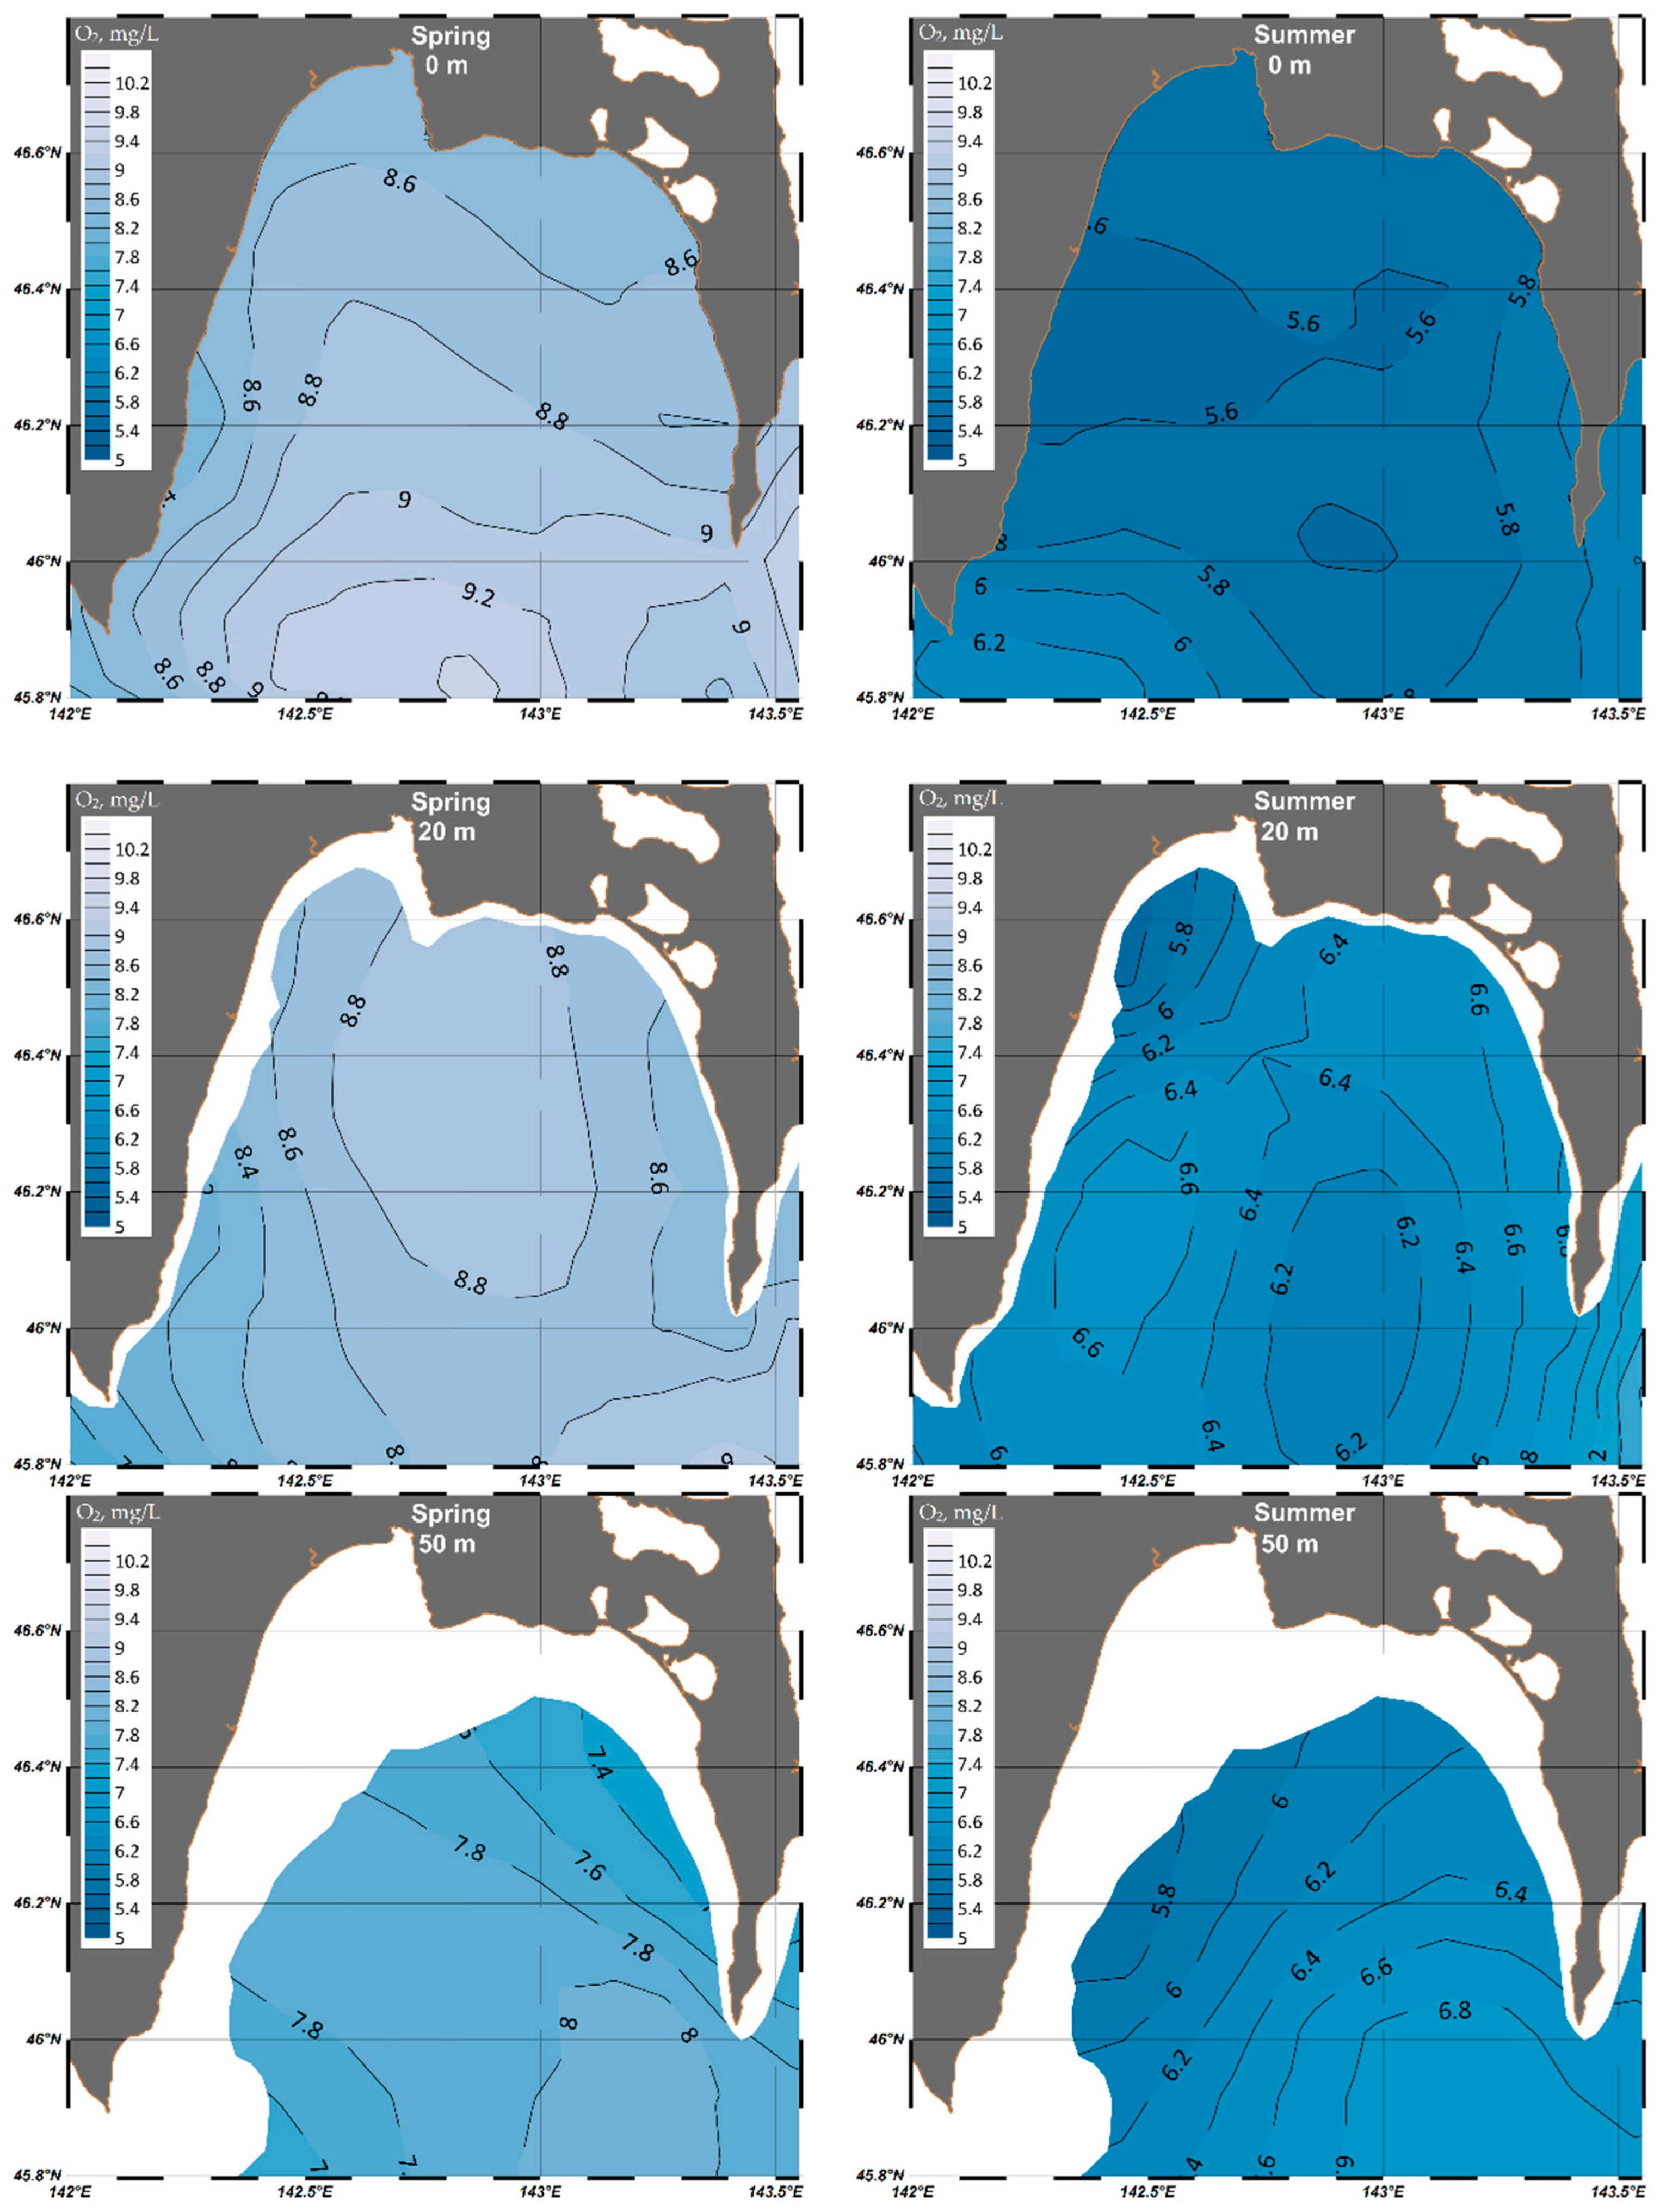
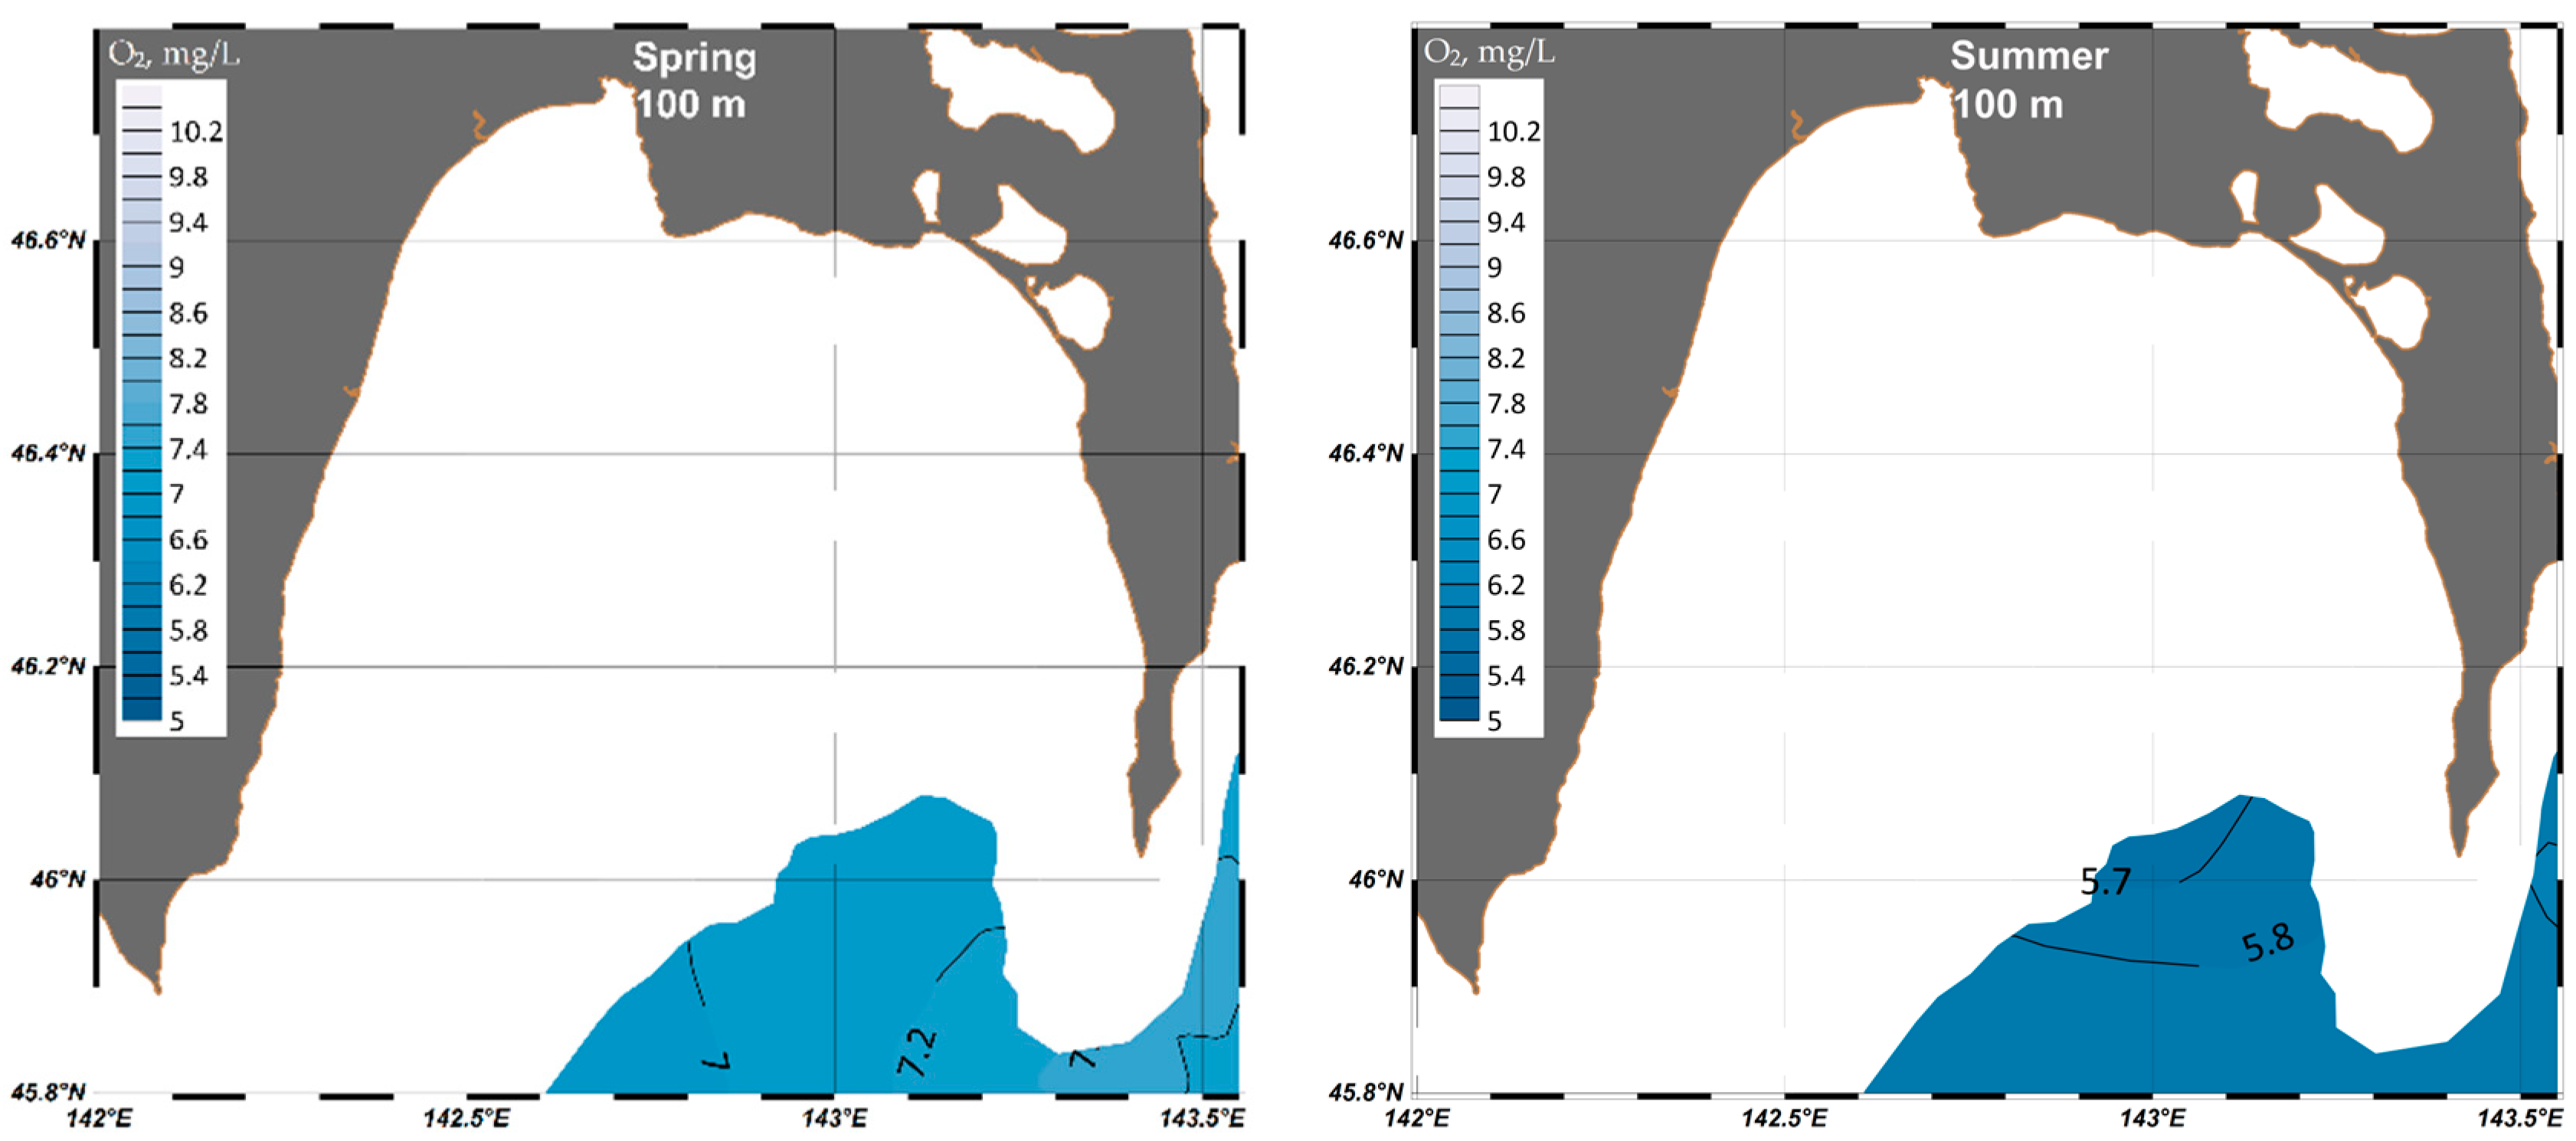
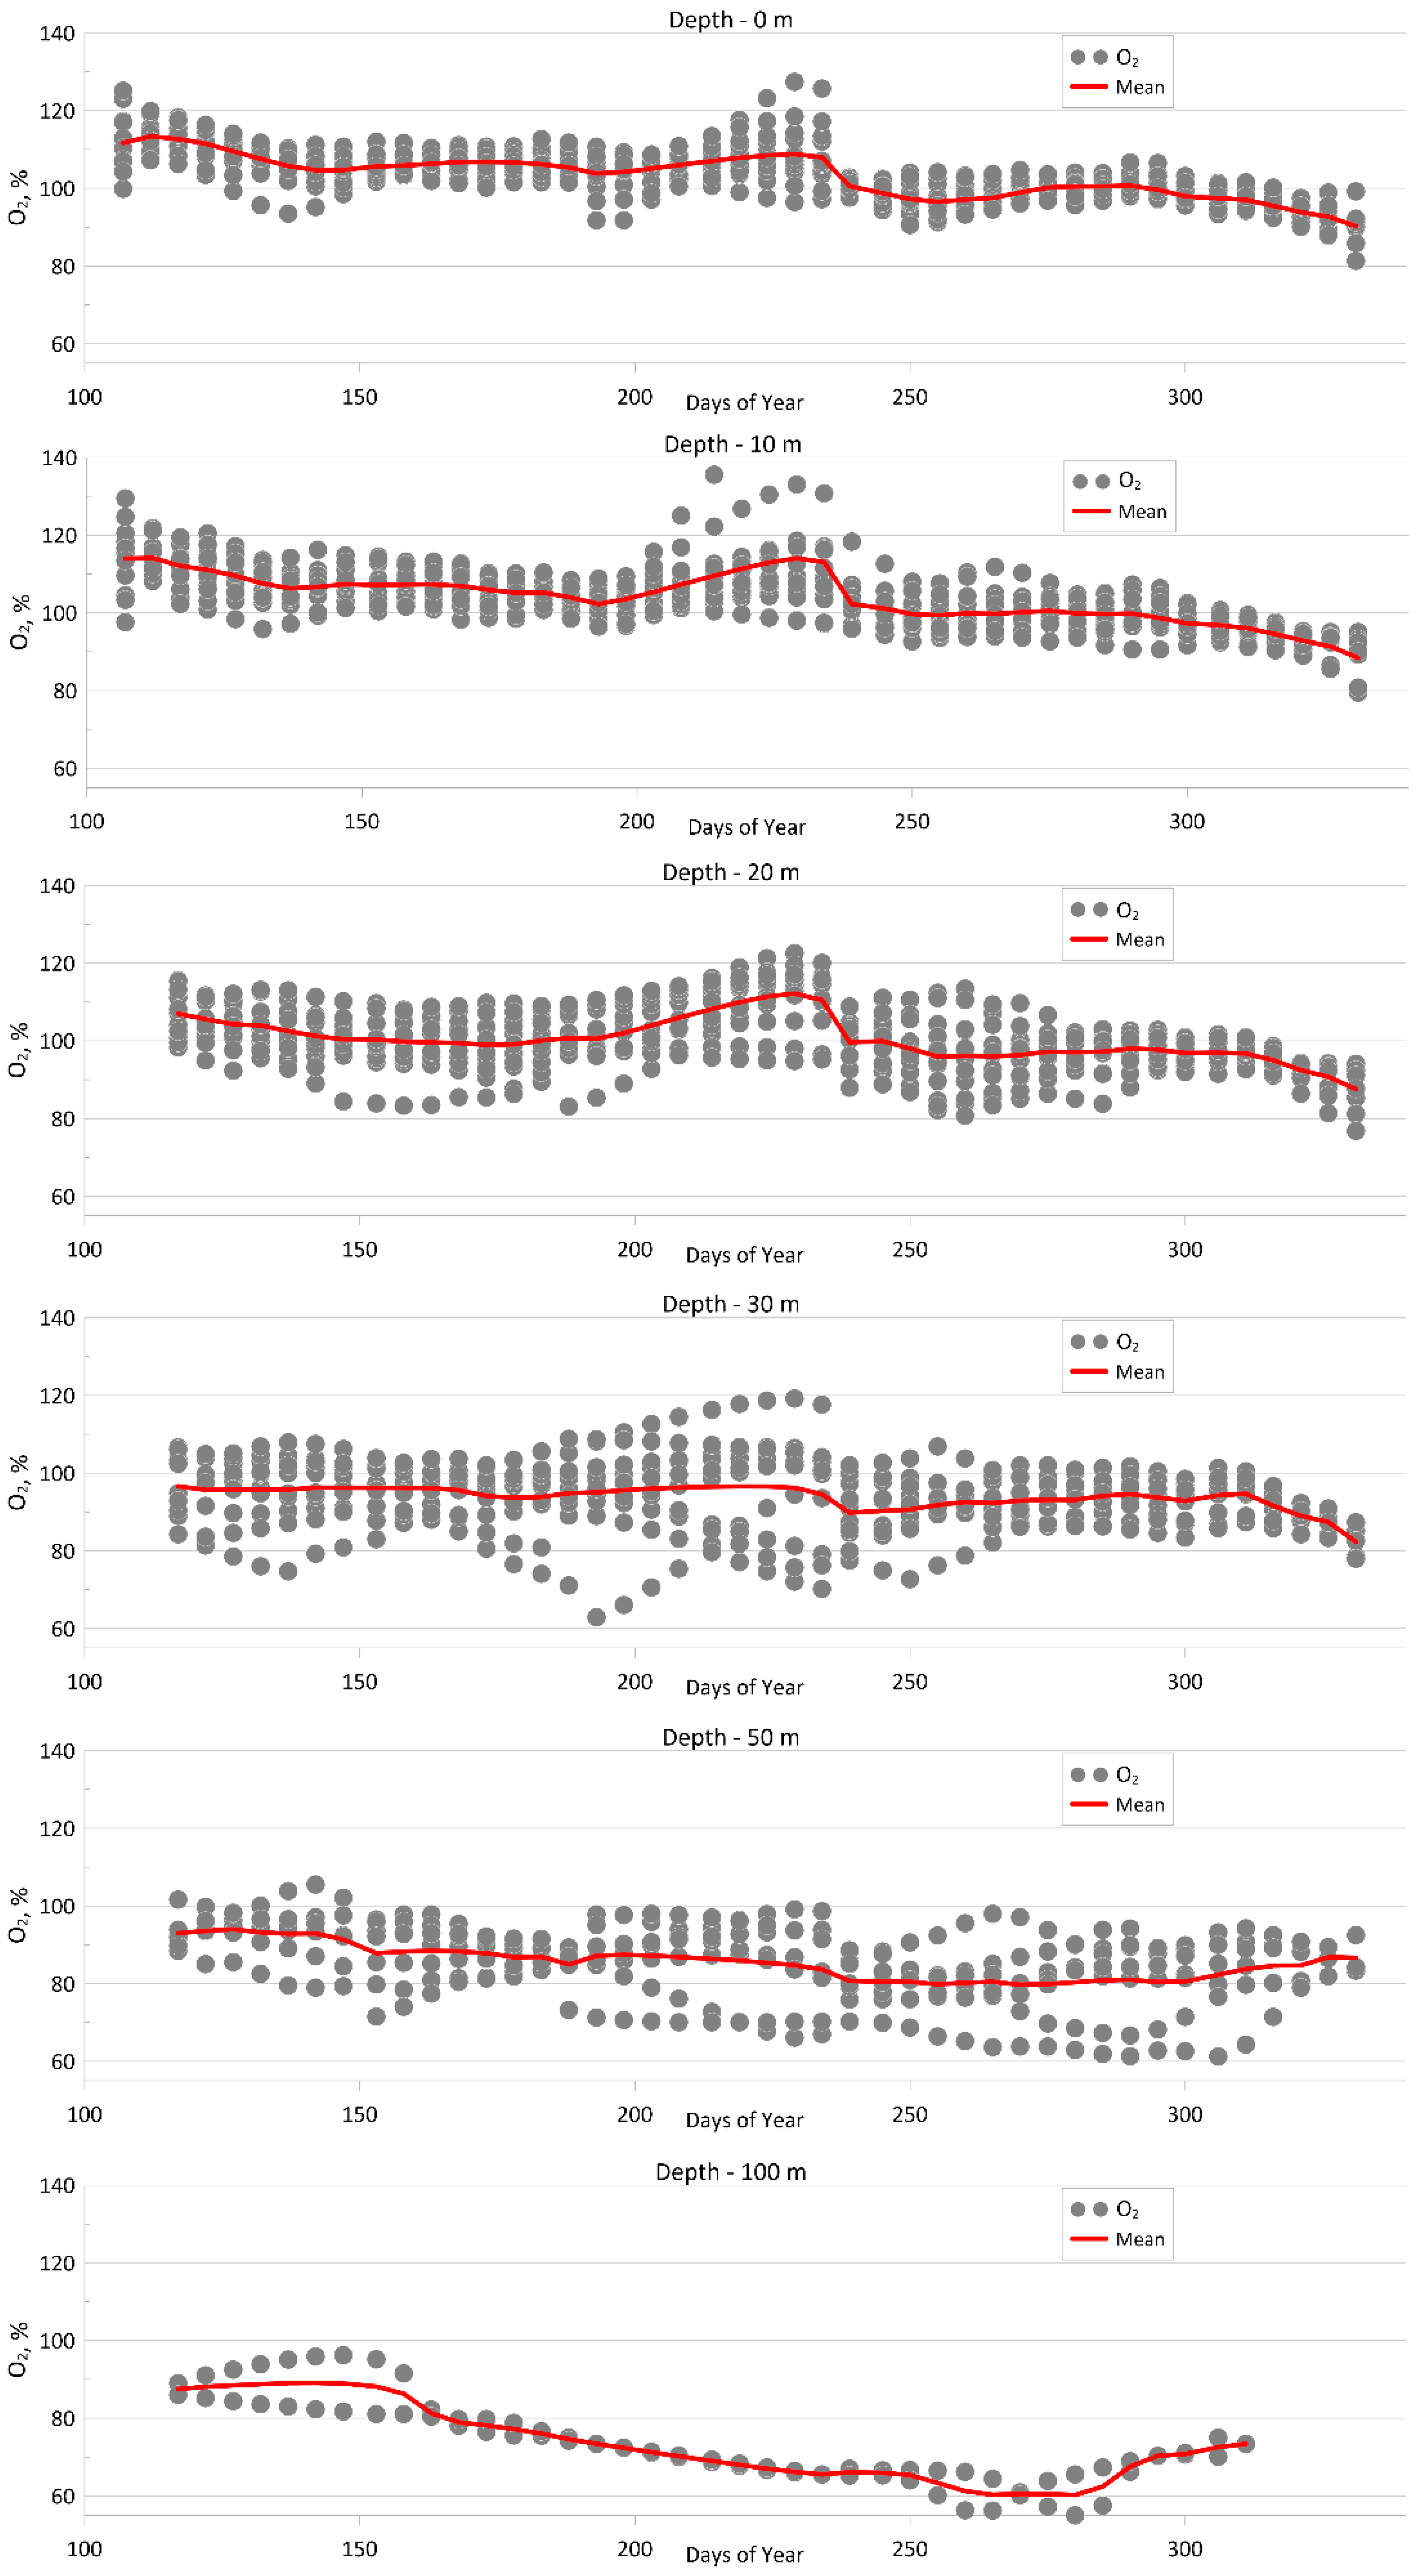
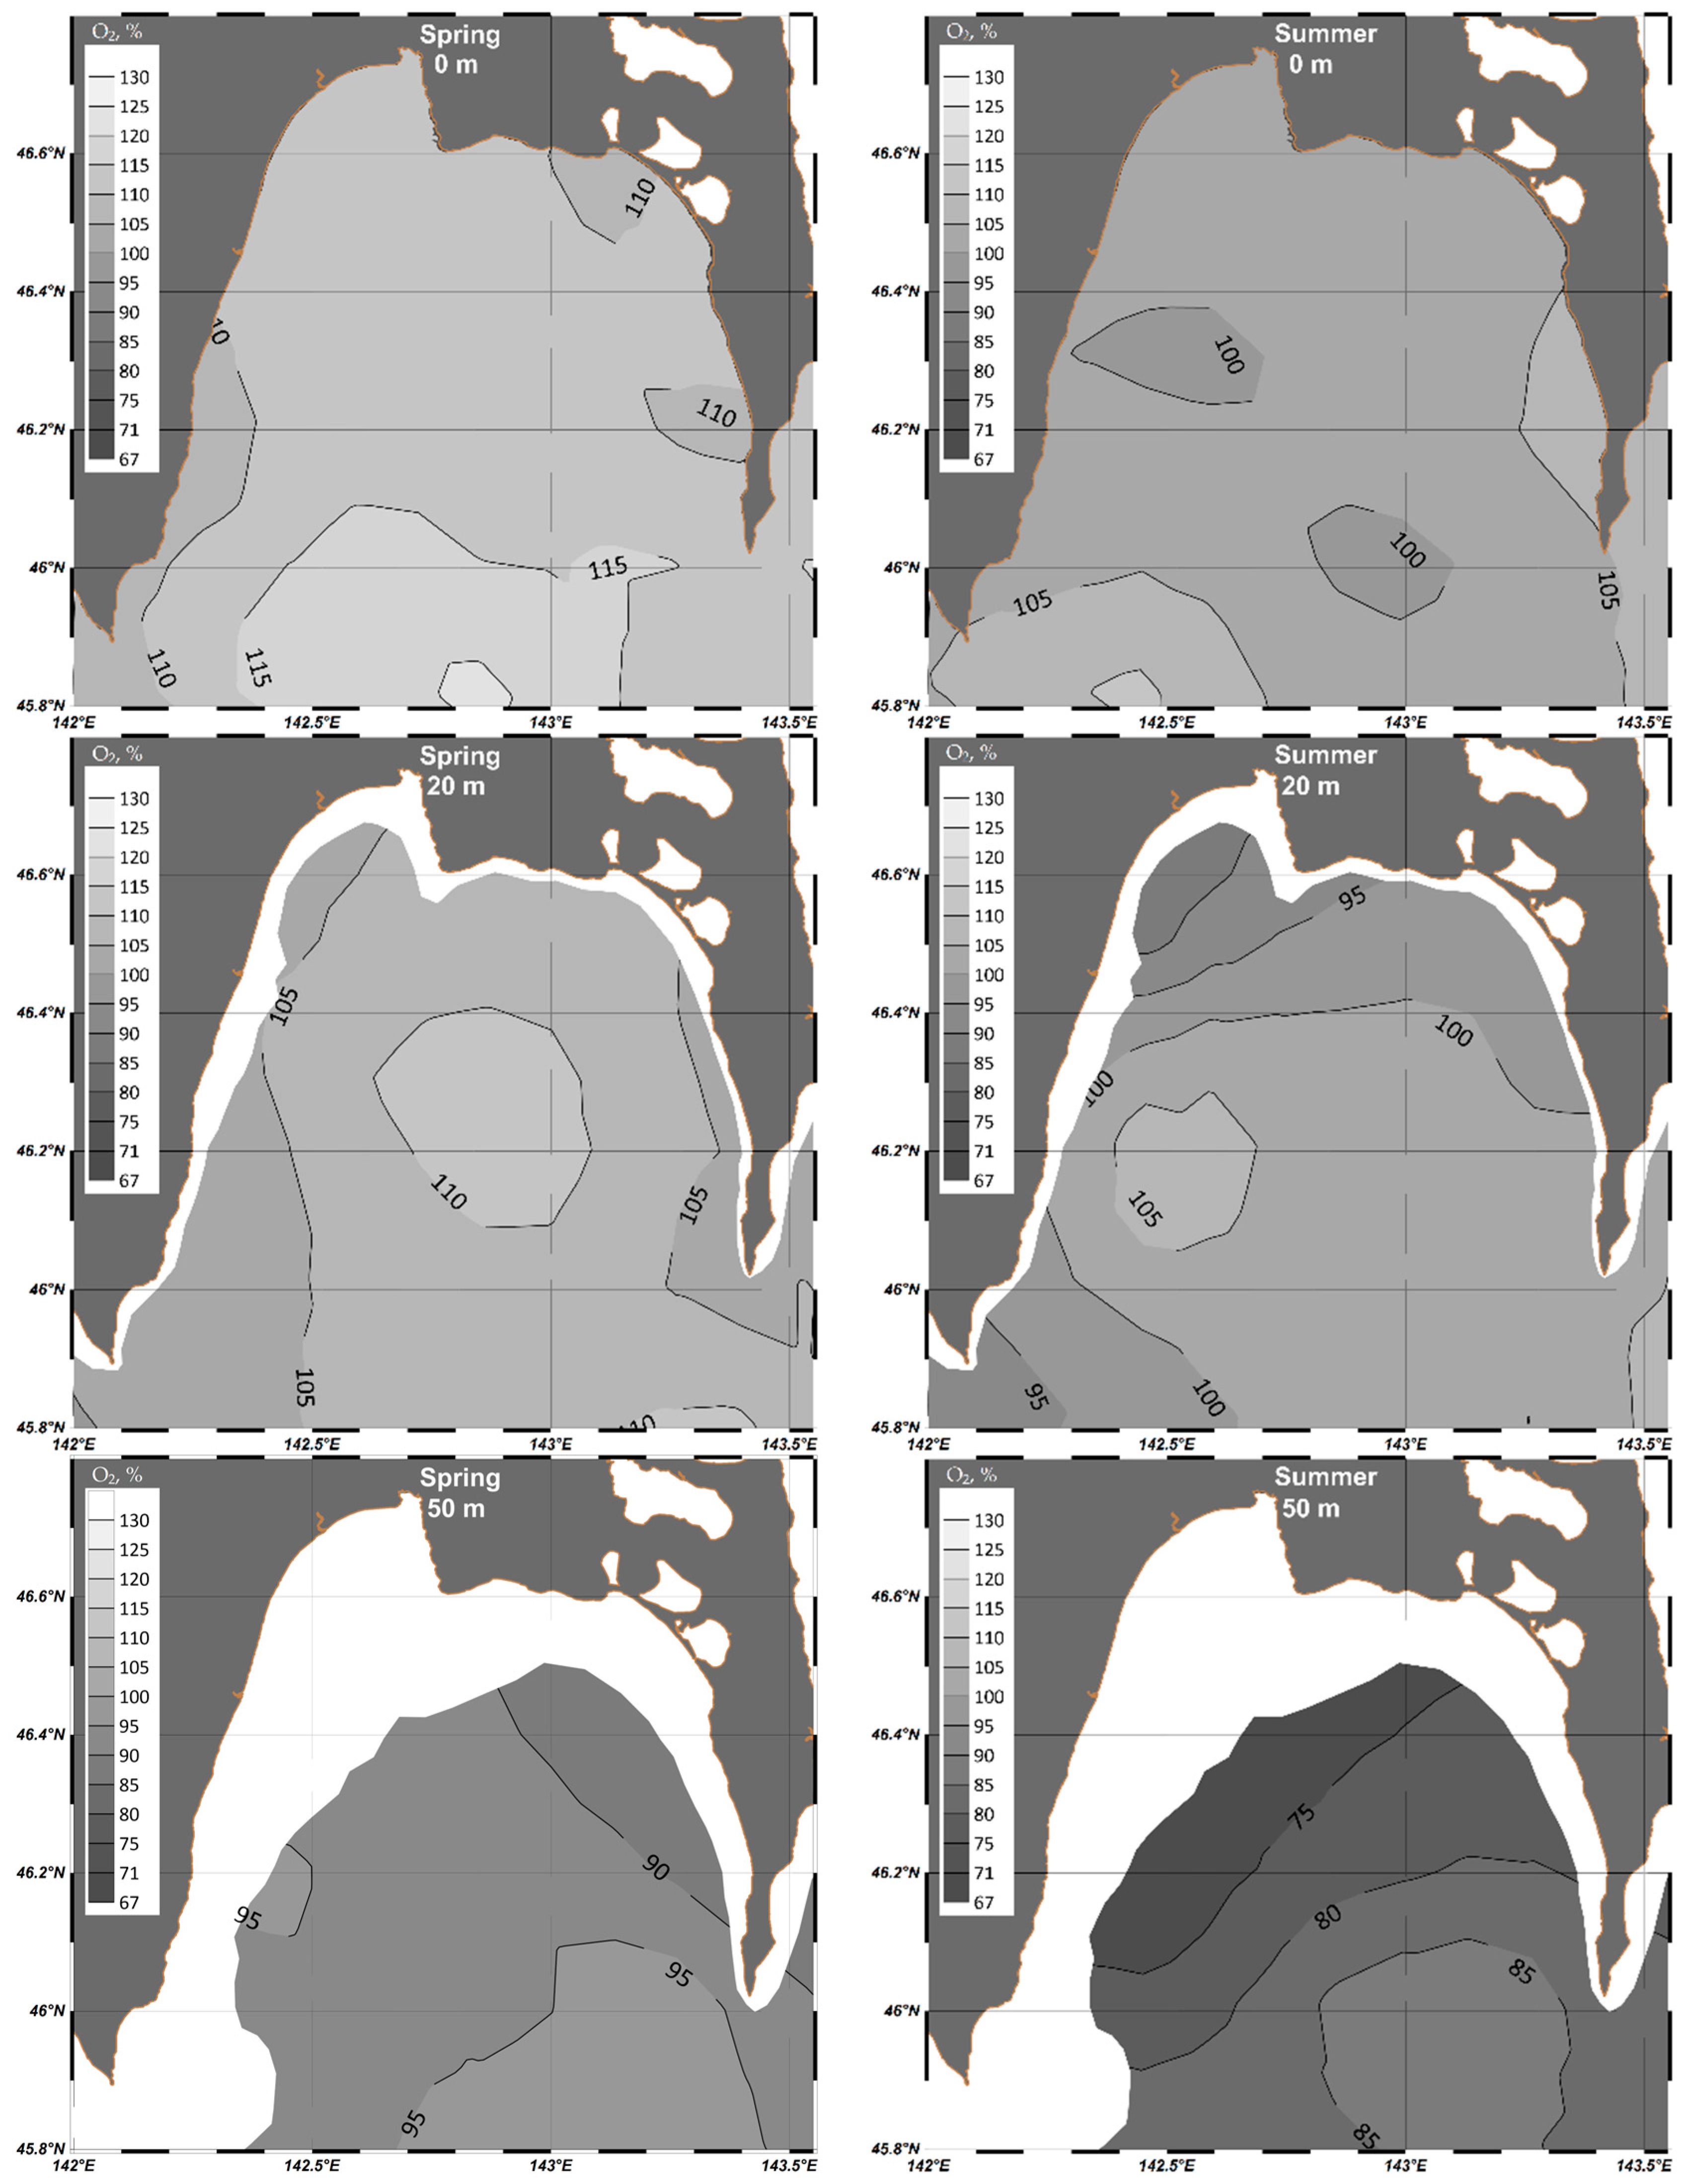
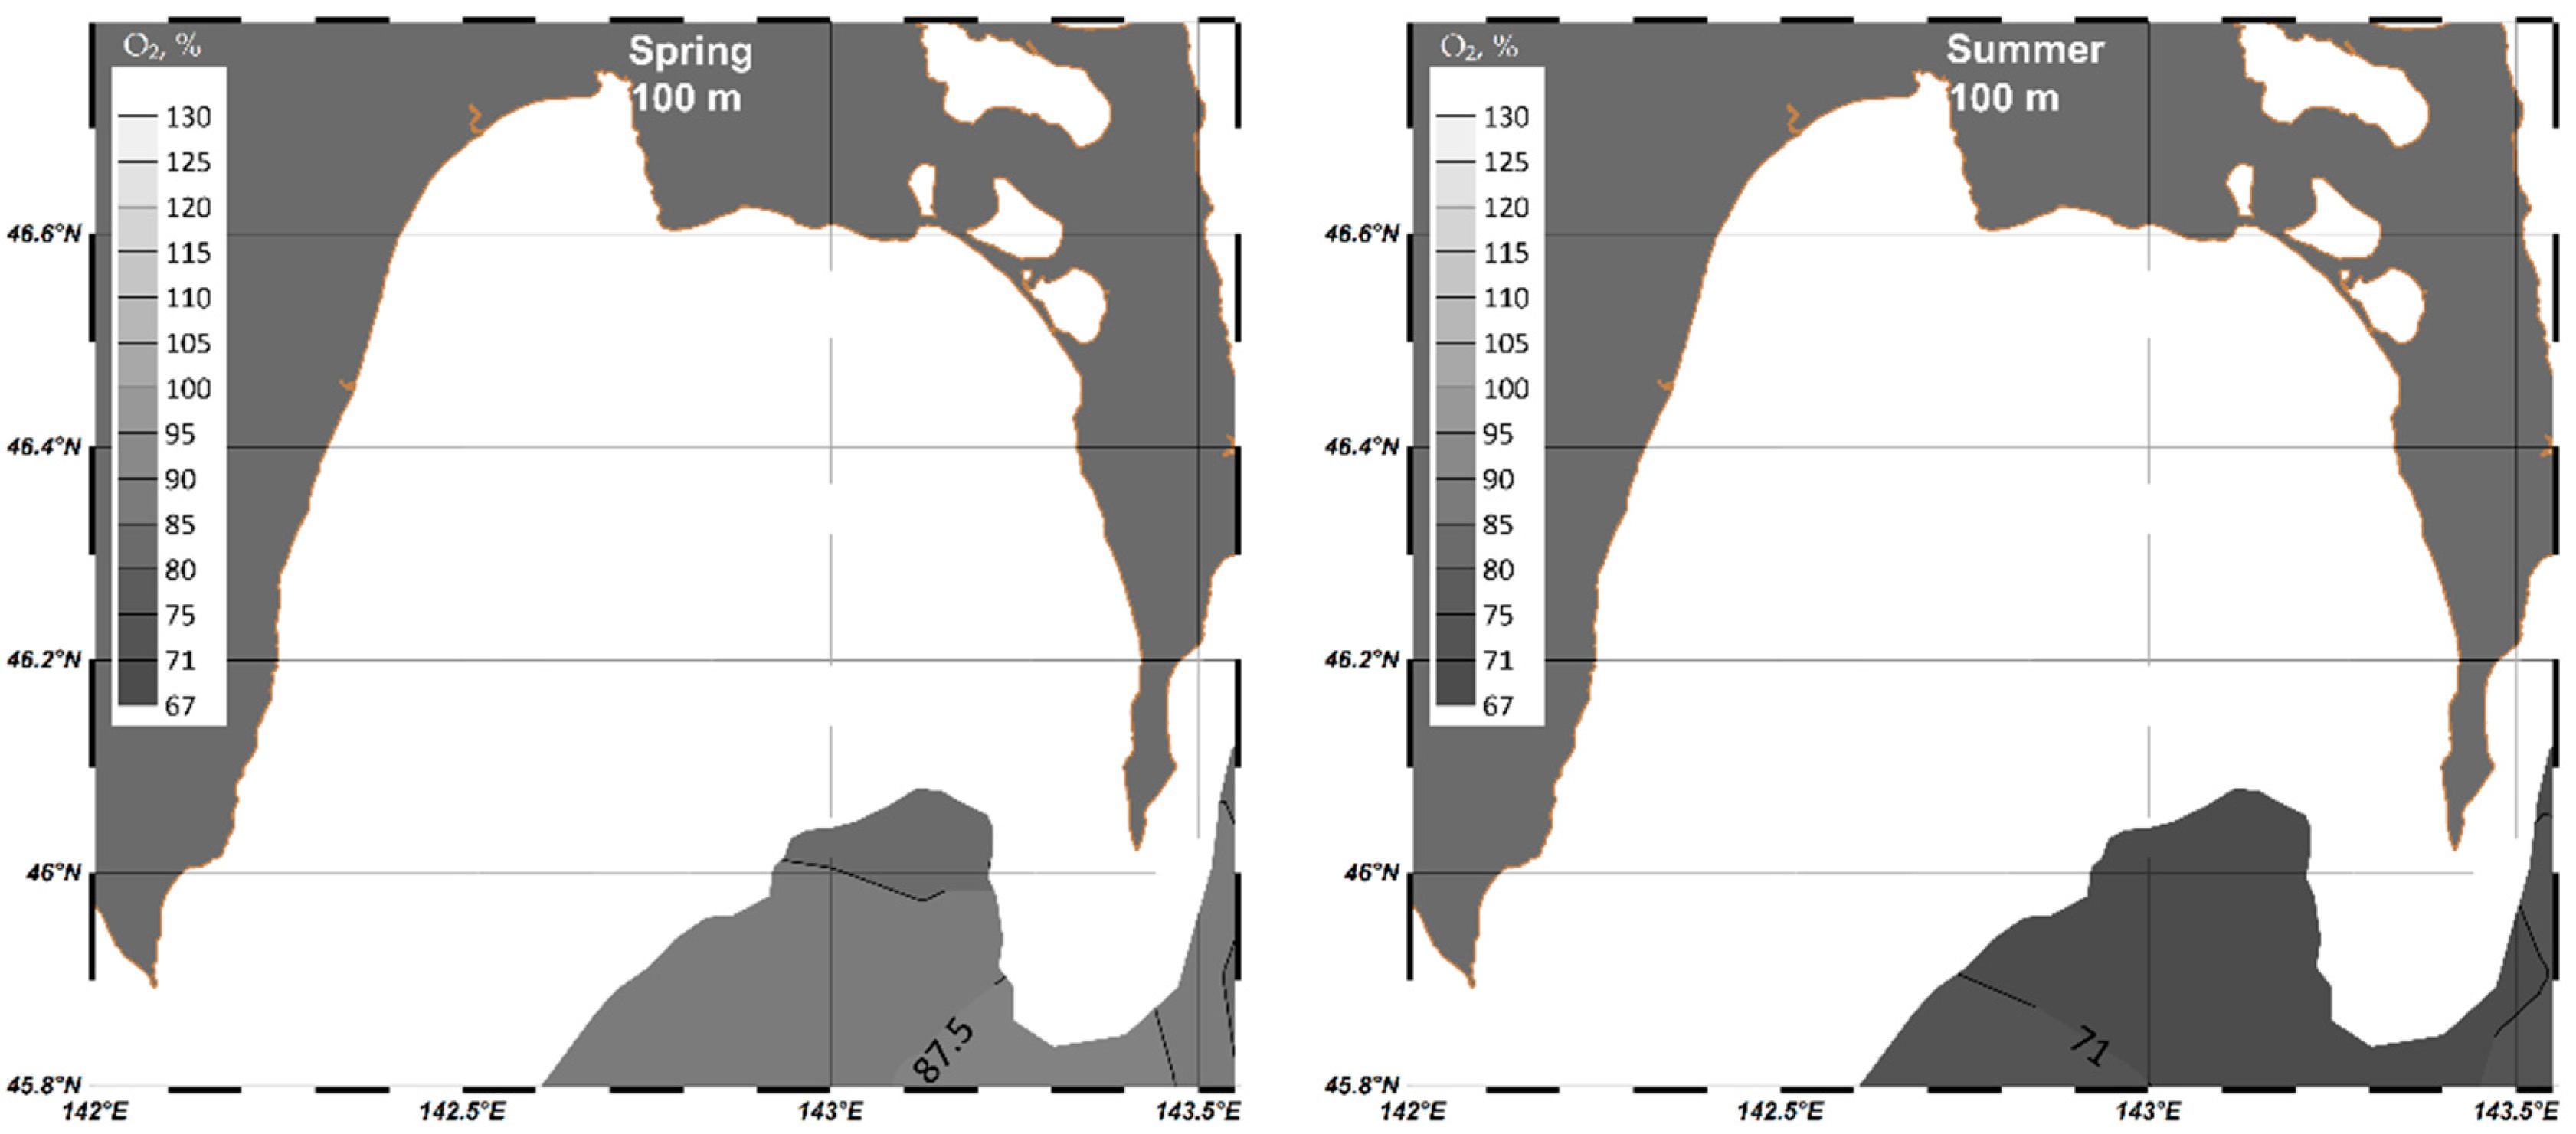
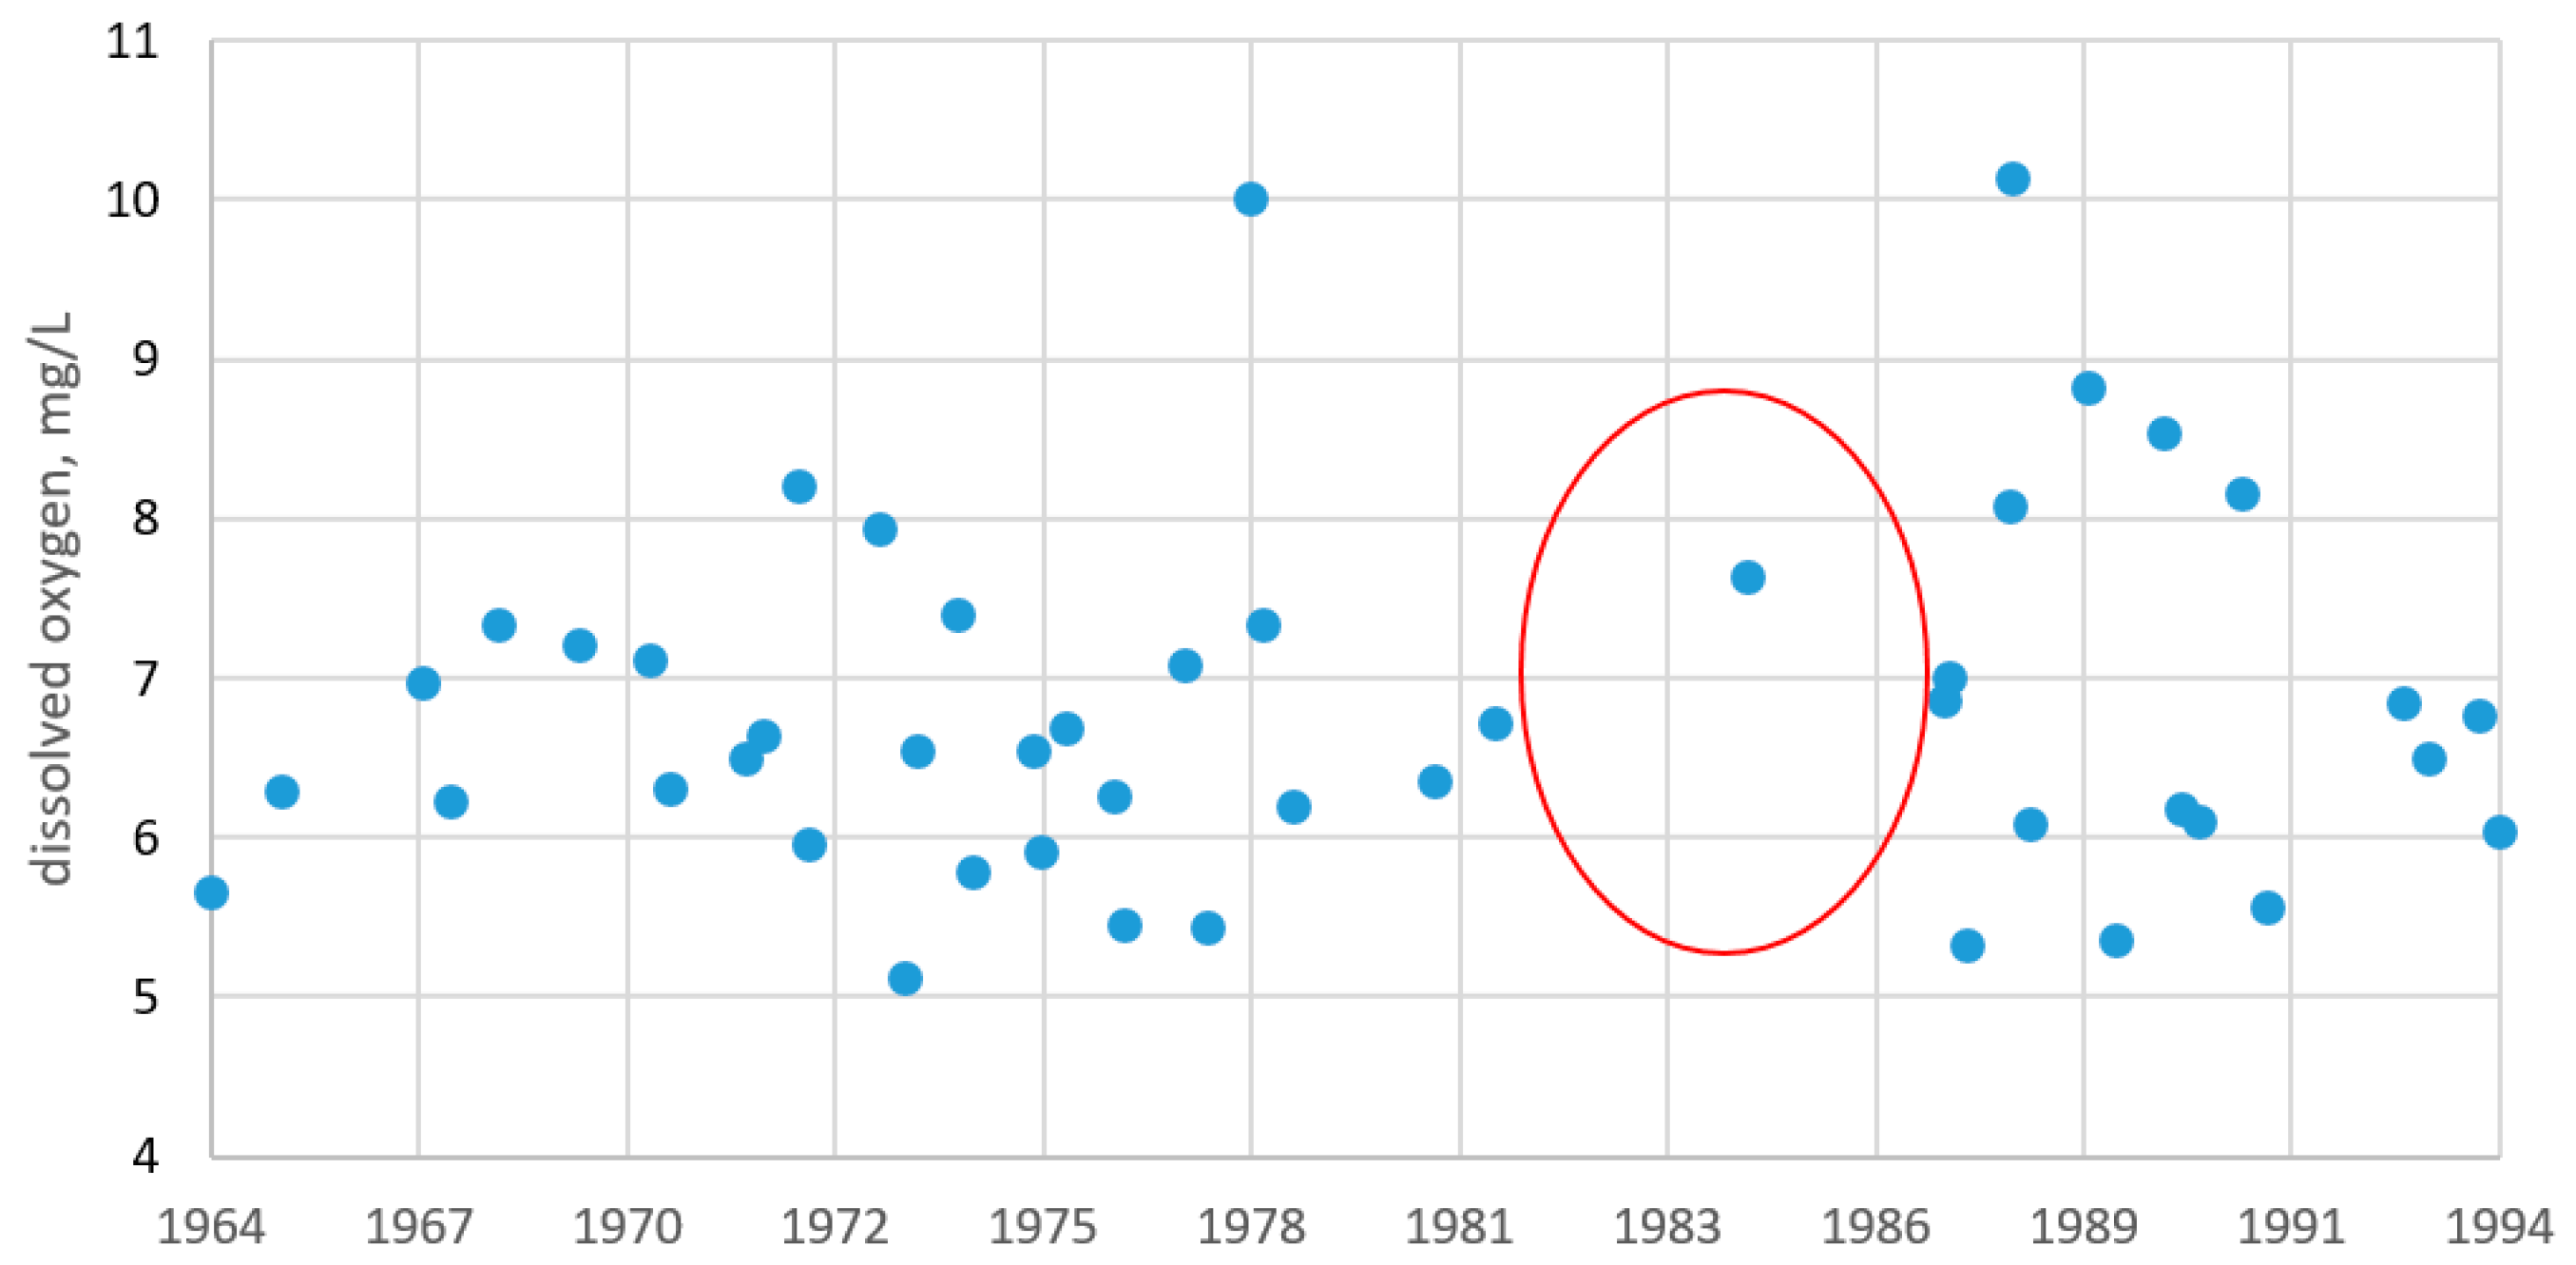
4.1.1. Dissolved Oxygen
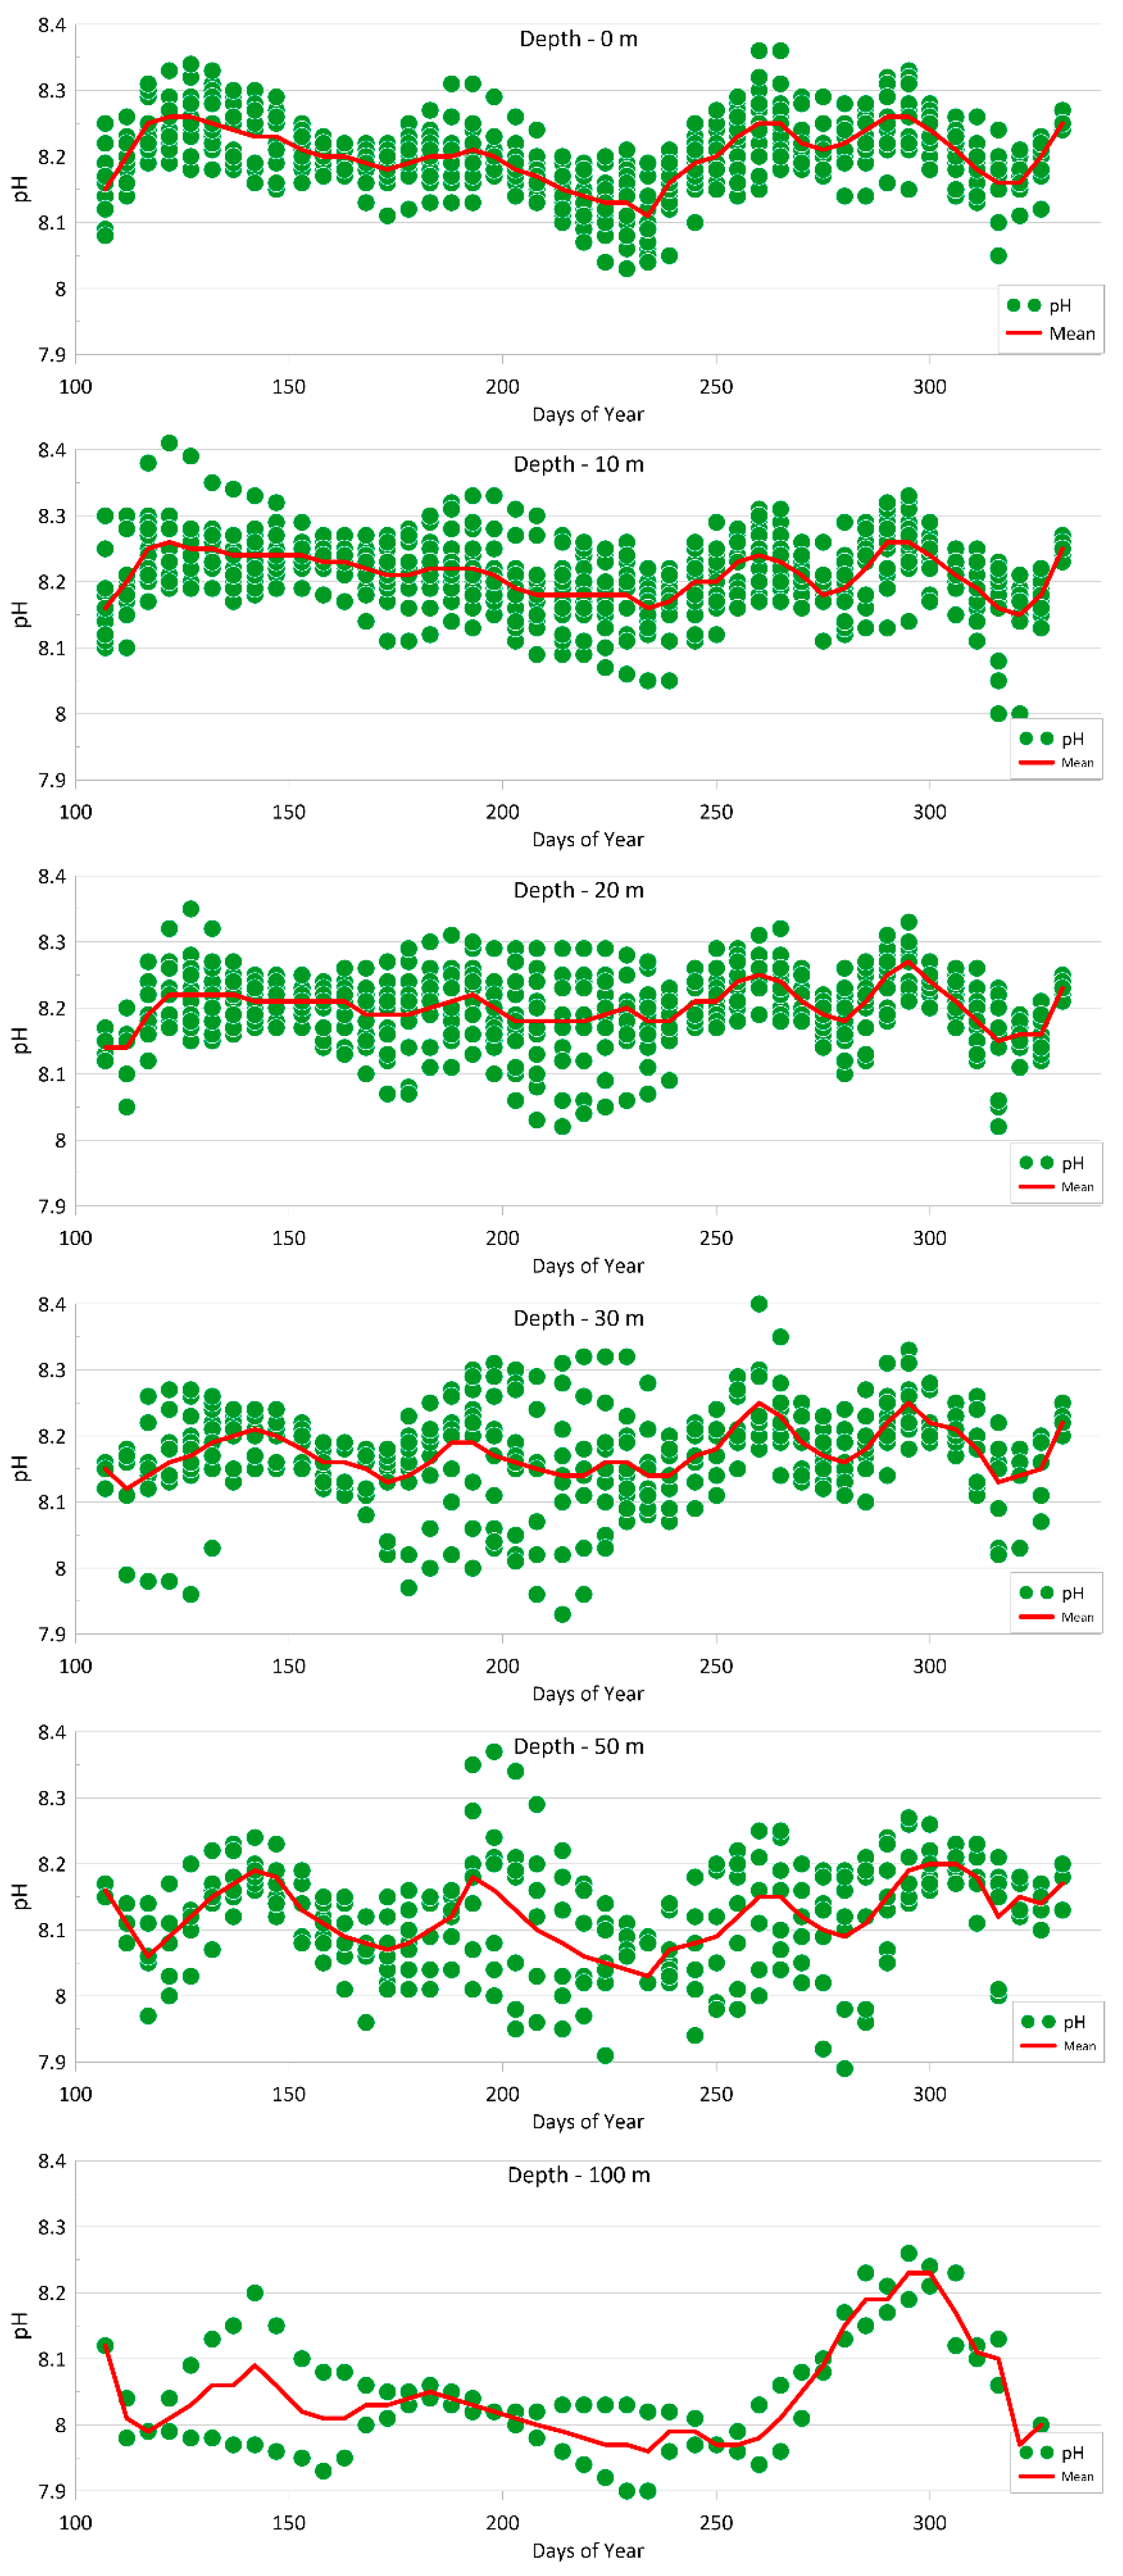
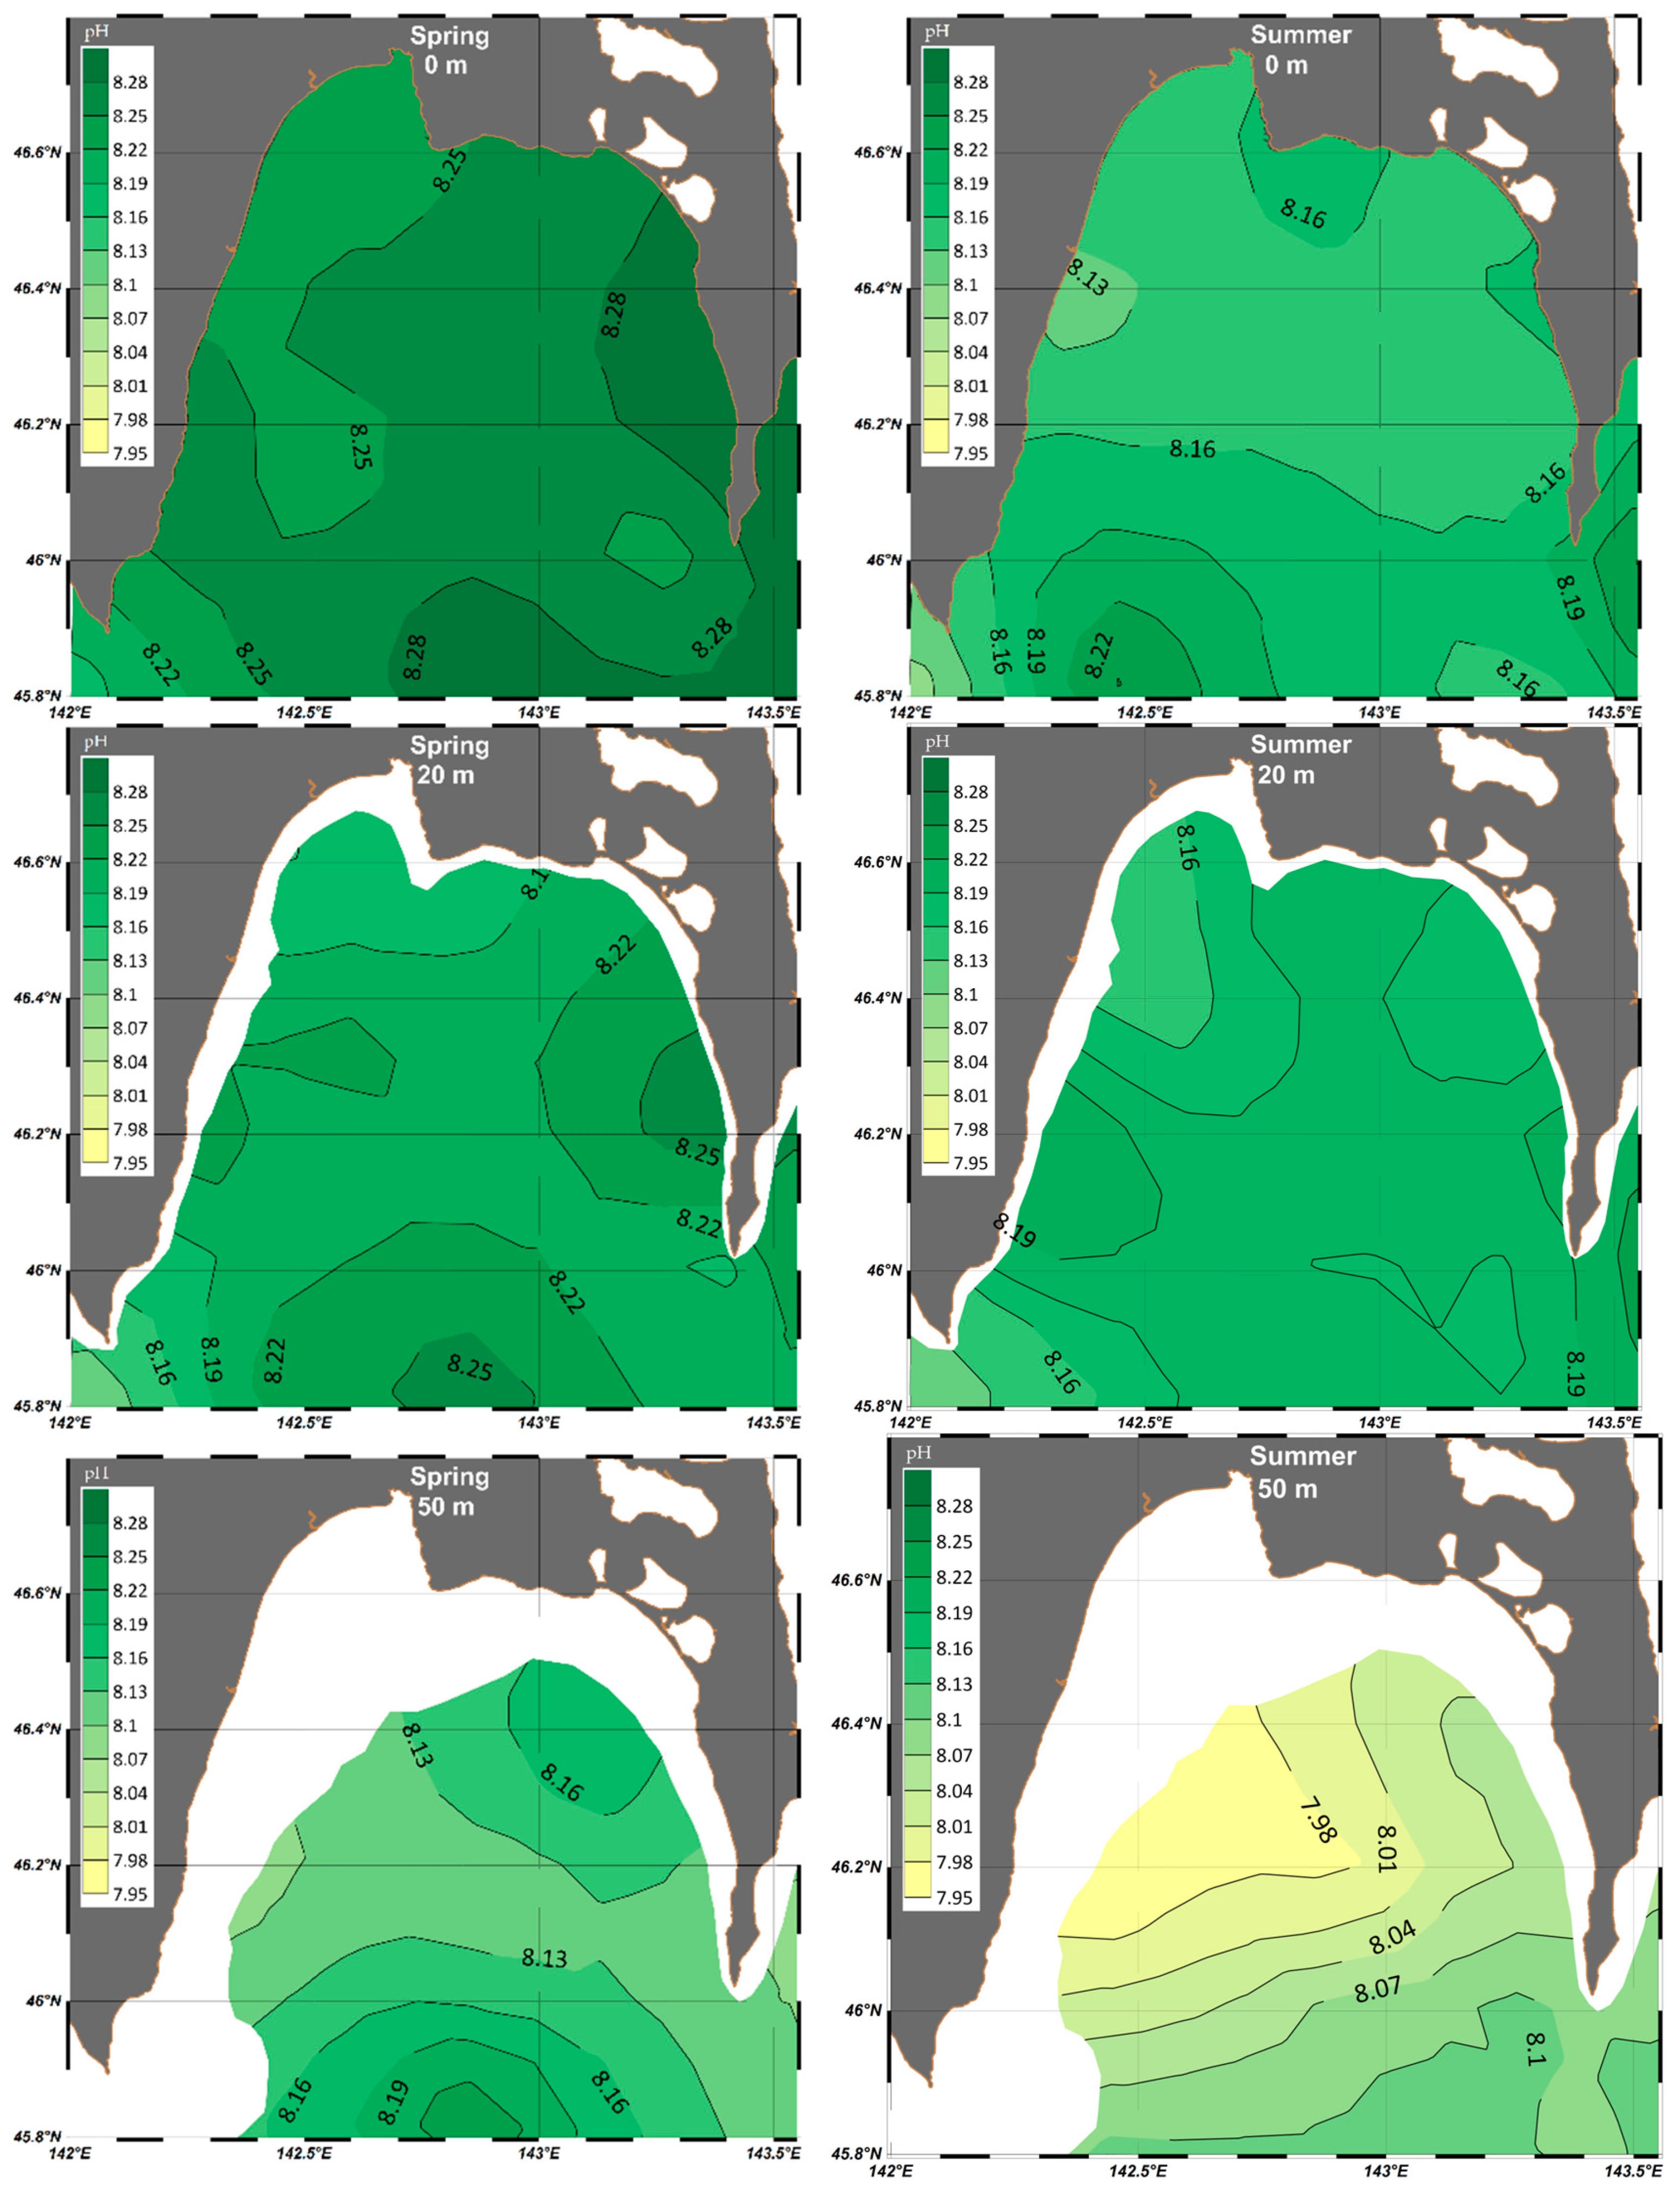
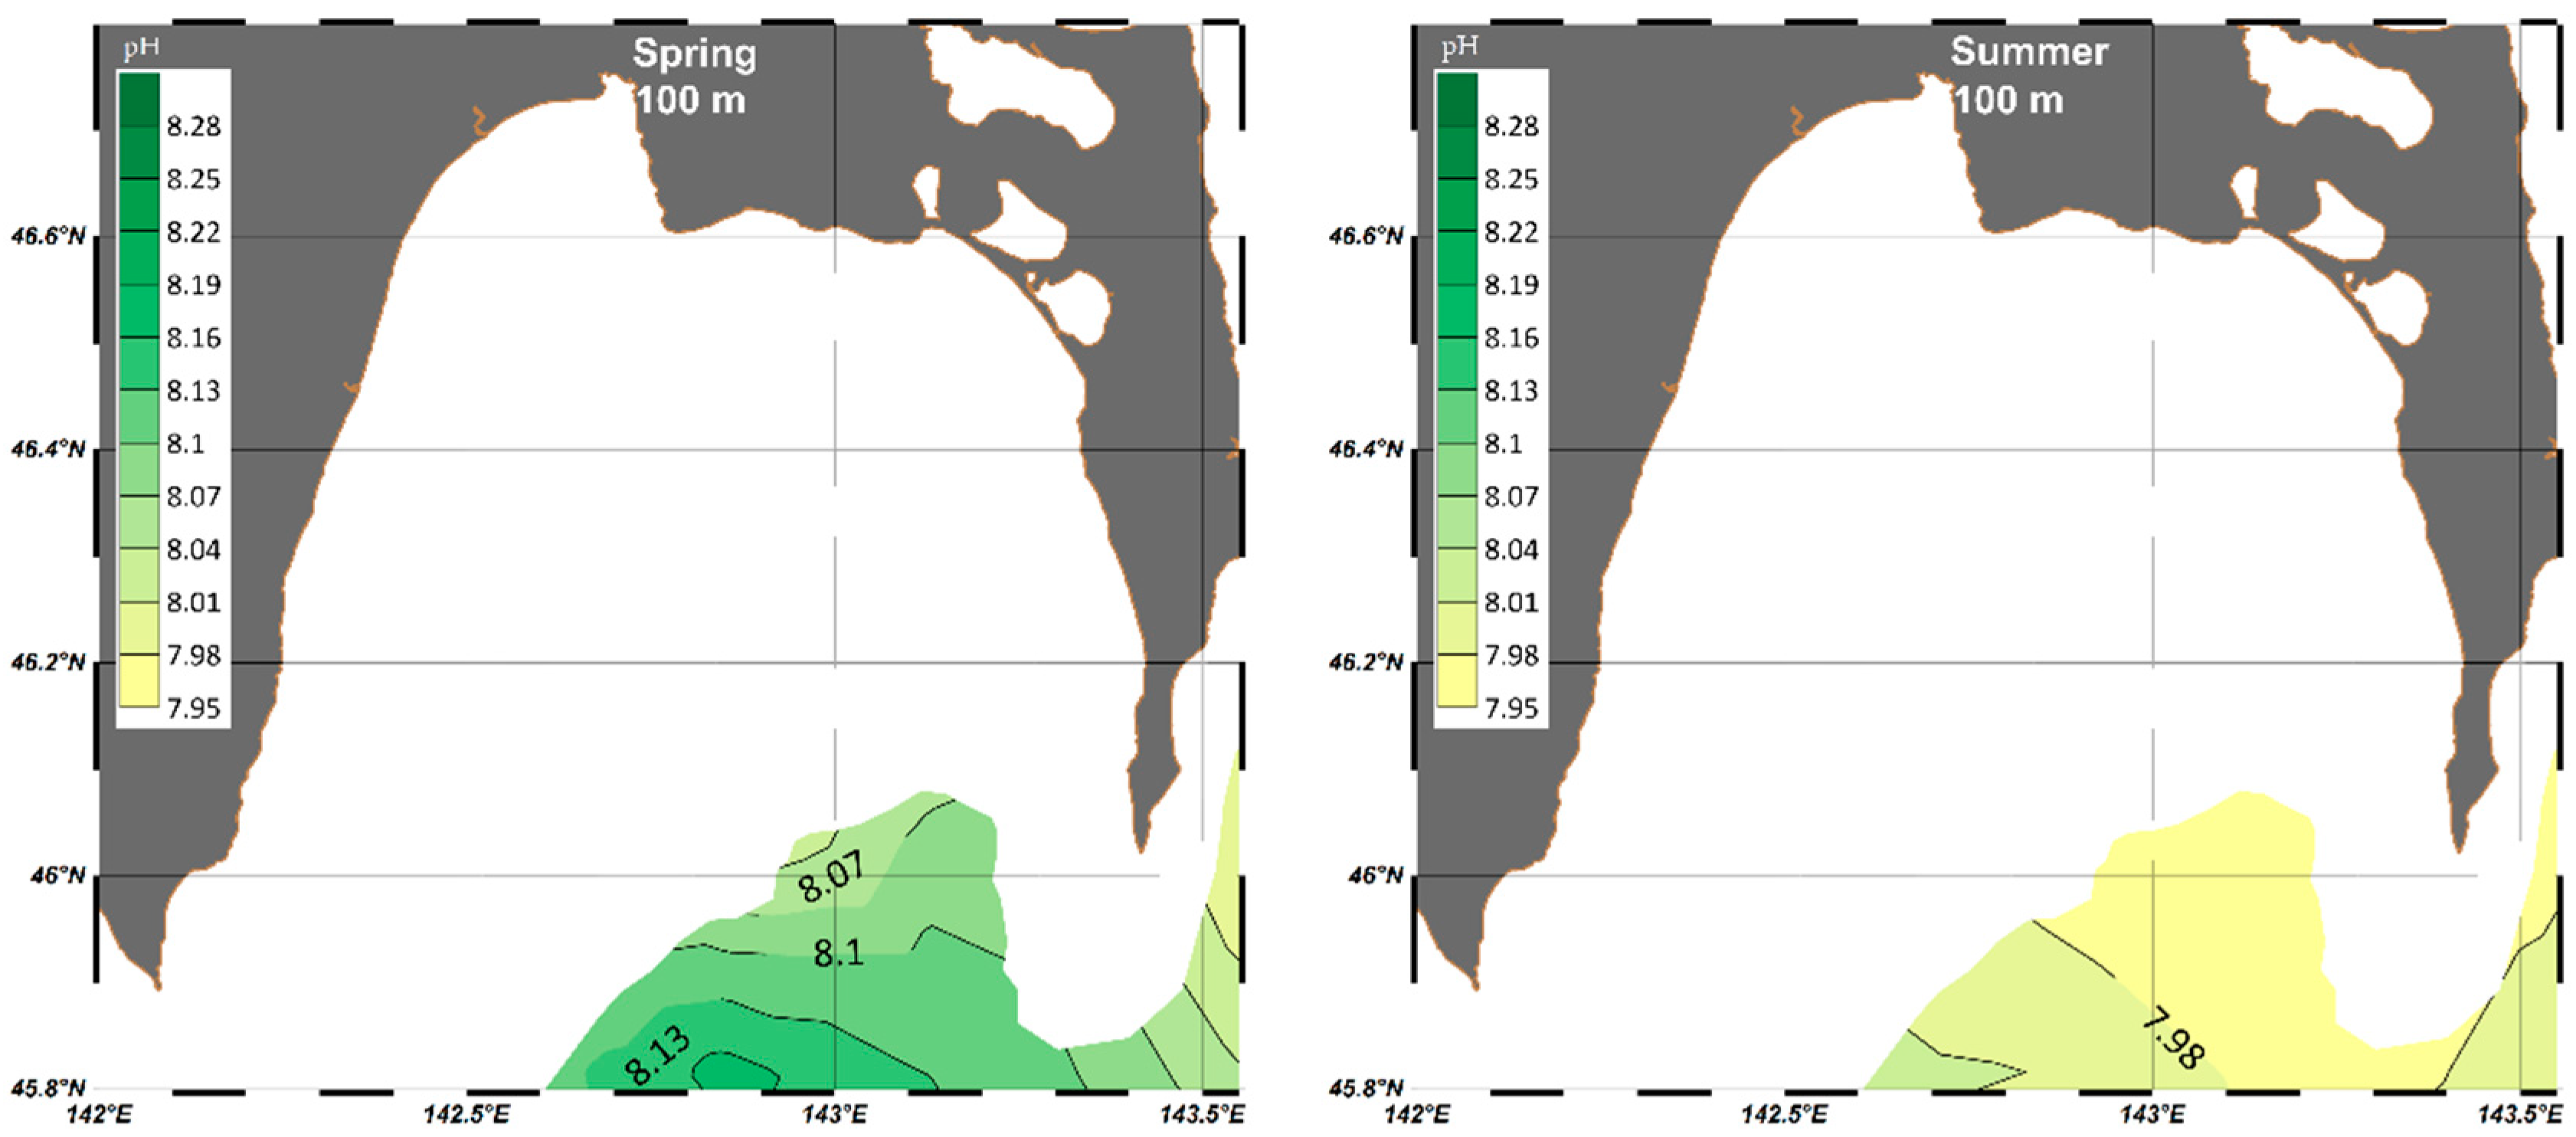
The dynamics of oxygen dissolved in water (hereafter, oxygen), as well as carbon dioxide, in surface layers, is defined by the relation of oxygen-producing processes (CO2 absorption) during photosynthesis with oxygen consumption (CO2 emission) during oxidation of organic matter [75]. The determining factor influencing these processes is temperature regime, so the diagrams of annual variability of oxygen (especially in surface layers) often correlate well with the diagrams of annual variability of temperature. They are their mirror representations. The study [43] showed that, as a result of winter convection, temperature across all of Aniva Bay becomes negative by mid-February (the difference in absolute temperature values in surface and near-bottom layers is ~1 °C). According to our analysis (diagrams of mean oxygen with a time step of 5 days based on all 15 stations in the bay), in surface layers the estimated mean oxygen year maximum (9.1 mg/L) is registered with the beginning of photosynthesis, i.e., immediately after ice melting in April (Figure 4).
Note that the blue dots indicate the average long-term value for each station on a specific date and the red line indicates the average value from all stations in Aniva Bay (Figure 4). The mean oxygen minimum in surface layers (5.6 mg/L) is registered immediately after the water temperature maximum at the beginning of September. The oxygen minimum on the 100 m layer is observed at the end of September (<5.0 mg/L) and does not coincide in time with the water temperature maximum, which was registered in December. The water temperature and salinity on the surface and bottom layer based on [41], and total precipitation for each month of the year (based on Korsakov weather station data for the period of 2008–2023, www.rp5.ru (accessed on 20 February 2024)) are shown in Figure 5 as additional information to the analysis. At the end of October–early November, there is a clearly visible second mean oxygen maximum (6.7 mg/L). The incoming mixed waters, rich in oxygen and inorganic nutrients, most likely condition it during the autumn intensification of the East Sakhalin Current. Thus, Aniva Bay demonstrates a tendency typical of high latitude ocean zones—absorption of oxygen from the atmosphere in the cold season and its emission back to the atmosphere with the water heating.
The analysis of diagrams of mean average values of oxygen with a time step of 5 days permits to single out two additional features in the annual oxygen cycle in the upper 30 m layer: a local minimum in mid-July and a local maximum at the beginning of August. The formation of the summer maximum is likely to be connected with a sharp increase in precipitation by 60–80% compared to May and June. Consequently, there was an additional inflow of inorganic nutrients, which activates photosynthesis in the euphotic layer [76].
The spatial analysis of mean oxygen distribution in Aniva Bay for spring (26 April) and summer (26 August) is presented in Figure 6. Since the oxygen concentration in the bay is determined by the relation between red–ox processes, one can state that with the deepening of the lower boundary of the pycnocline, oxygen production begins to prevail over its consumption. This dependency does not work in coastal and shallow waters of the bay due to wave mixing, photosynthesis and advection. Meanwhile, fragments of quasi-stationary mesoscale eddy structures, typical of the La Perouse Straight, are identified from sharp gradients on the standard depths in the studied areas [43]. Thus, in the central part of the bay, at the 20 m depth (Figure 6), there is an oxygen maximum and oxygen minimum at 20 m and 50 m depth in the eastern part of the bay. This is probably due to an anticyclonic eddy in the central part and upwellings in the eastern part [43,72].
A combination of hydrological, hydrochemical, and hydrobiological processes in the water in the bay gives the interesting patterns observed in the oxygen saturation (oxygen saturation is the ratio (as a percent) of measured oxygen concentration to the oxygen concentration of water at equilibrium, with the atmosphere based on potential temperature and salinity). As can be seen from the diagram of the annual cycle of oxygen saturation, the upper 20 m layer of Aniva Bay during water heating is oversaturated with oxygen saturation (~114%). In other words, there is oxygen emission into the atmosphere (Figure 7).
On the contrary, during the water cooling stage, oxygen absorption from the atmosphere prevails, which results in the formation of a local minimum in the annual cycle in September–October. The summer maximum of oxygen saturation in the euphotic layer in August (~114%) can be explained by an additional inflow of inorganic nutrients due to a sharp (>30%) increase in precipitation in the annual cycle and, consequently, in the river discharge (Figure 5e). The local maximum at the end of October is caused by storm mixing and increased precipitation, which results in the oxygen saturation of upper layers with inorganic nutrients and causes an autumn burst of phytoplankton bloom [77]. The maximum range (80% to 114%) of oxygen saturation at 30–50m depth and caused by dynamic and hydrobiological processes. Minimal values (60%) of oxygen saturation are registered in September–October in the near-bottom layer (Figure 7).
The obtained analysis results do not contradict the traditional understanding of the oxygen cycle in the Aniva Bay waters [43]. Still, similar to the case with dissolved oxygen, the annual cycle of oxygen saturation clearly demonstrates the summer intermediate maximum. From single measurements data, in winter, there is a gradual decline in dissolved oxygen concentrations from the surface to the bottom combined with the overall slight oxygen undersaturation (96–98%) due to the fact that the very process of oxygen absorption by water through the ice cover is rather slow. It is worth noting that the undersaturation of surface waters in the cold season is a typical characteristic of the Sea of Okhotsk in general [38].
In spring, on the maps of spatial distribution in the surface layer, there is an increased oxygen saturation practically everywhere: >115% on the surface and from 105 to 110% on the 20 m depth (Figure 8). Interestingly, from the increased values (>110%), the downwelling zone is clearly distinguished on the 20 m depth in the center of the anticyclonic eddy. The oxygen concentration at 50 and 100 m depths is >90% and <90%, respectively. At the same time, along the underwater slope in the eastern part of the bay, the deepwater upwelling zone is identified from the decreased oxygen values.
In summer, slight oversaturation with oxygen is registered on the surface with separate local zones of slight undersaturation (Figure 8). The upwelling zone is identified from increased concentrations (>105%) at the south-eastern coast of the bay. In subsurface layers, the decreased oxygen content is observed in water mixing zones in shallow areas and zones of inflow of warm subtropical waters in Aniva Bay to the south of Cape Kril’on. In near-bottom areas, the relative oxygen concentration drops to <75% in some places. From the plotted maps of spatial and temporal distribution of relative content of dissolved oxygen, one can clearly see structural features of water dynamics and, overall, they confirm the proposed earlier understanding of the oxygen cycle in Aniva Bay [43].

4.1.2. pH Value

The variations in pH value are closely related to oxygen and carbon dioxide concentrations. The CO2 absorption from the atmosphere, CO2 emission by breathing marine organisms and decomposition of organic matter leads to decreased pH, i.e., to increased acidity of marine water. On the contrary, when CO2 is emitted into the atmosphere and absorbed during photosynthesis, pH is growing. All these factors complicate manyfold the overall pattern of pH distribution in space and time.
Across the entire water column in the bay, the common features of the pH value annual cycle are spring (end of April–May) and autumn (October–November) maximums and summer (August) minimum (Figure 9). Characteristically, there is a local maximum in July, which signals the processes of CO2 absorption during a short-term activation of photosynthesis on account of additional inorganic nutrient income with precipitation. On the surface, it is emitted into the atmosphere. A short-term local pH minimum at the end of September is formed at the start of storm water mixing and includes the upper 50 m layer. The first consequence of water mixing is an intensive decomposition of inorganic nutrients matter and increasing CO2 content. Then, followed by growing inorganic nutrient concentrations, autumn phytoplankton bloom is developed and the end of October manifests the second peak of autumn pH maximum. The extremums are observed to form later with depth. On the diagrams of the annual cycle, the highest depth-weighed pH values are registered in the euphotic layer in May (8.26) and the lowest in August (8.11). The lowest pH values in near-bottom layers was in August (7.96) (Figure 9).
With the increase in temperature on the surface layer, the pH value tends to decrease. A peculiar trait of vertical pH distribution is the presence of a maximum in the photosynthesis layer (because of lowered CO2 concentrations). However, it settles a bit later than the oxygen maximum. Below this layer, the pH values decrease under the influence of the oxidation of organic matter (CO2 is accumulated) and the growth of hydrostatic pressure [39].
Special features of pH spatial and temporal distribution are formed under the influence of quasi-stationary dynamic structures with a diameter of 20–50 miles (Figure 10). The outlines of pronounced eddies are clearly visible in the figures, including the traits characteristic of the distribution of pH value itself.
In spring, in the surface layer, the north-western part of Aniva Bay stands out with lowered pH on the surface (<8.25) and in the 20 m layer (<8.21). This is the zone of increased anthropogenic load, which takes in the bulk of melt-water incoming due to spring floods from the most densely populated Susunay Valley. At the same time, along the eastern coast of the bay, with increased pH stands out the upwelling zone from the surface (>8.28) to the 50 m depth (>8.16). Minimum pH values in this period are observed in the deepest part of the bay at the 100 m depth (Figure 10).
In summer, across the bigger part of the basin in the surface layer, the pH values are ~8.15. On the southern boundary of Aniva Bay, from the increased pH values (>8.22), a cold spot can be identified, which is formed due to the uplifting of bottom waters in the area of Kamen Opasnosti (45°47,5′ N, 142°13,4′ E), where active photosynthesis takes place. A slightly higher pH value (~8.19) on the 20 m depth across the bulk of the bay is conditioned by photosynthesis, which stops at such depths. Then, with the increase in depth, the pH value drops abruptly (<7.98). In terms of spatial location, this is in full agreement with the zone of minimal concentrations of dissolved oxygen (Figure 6 and Figure 8).

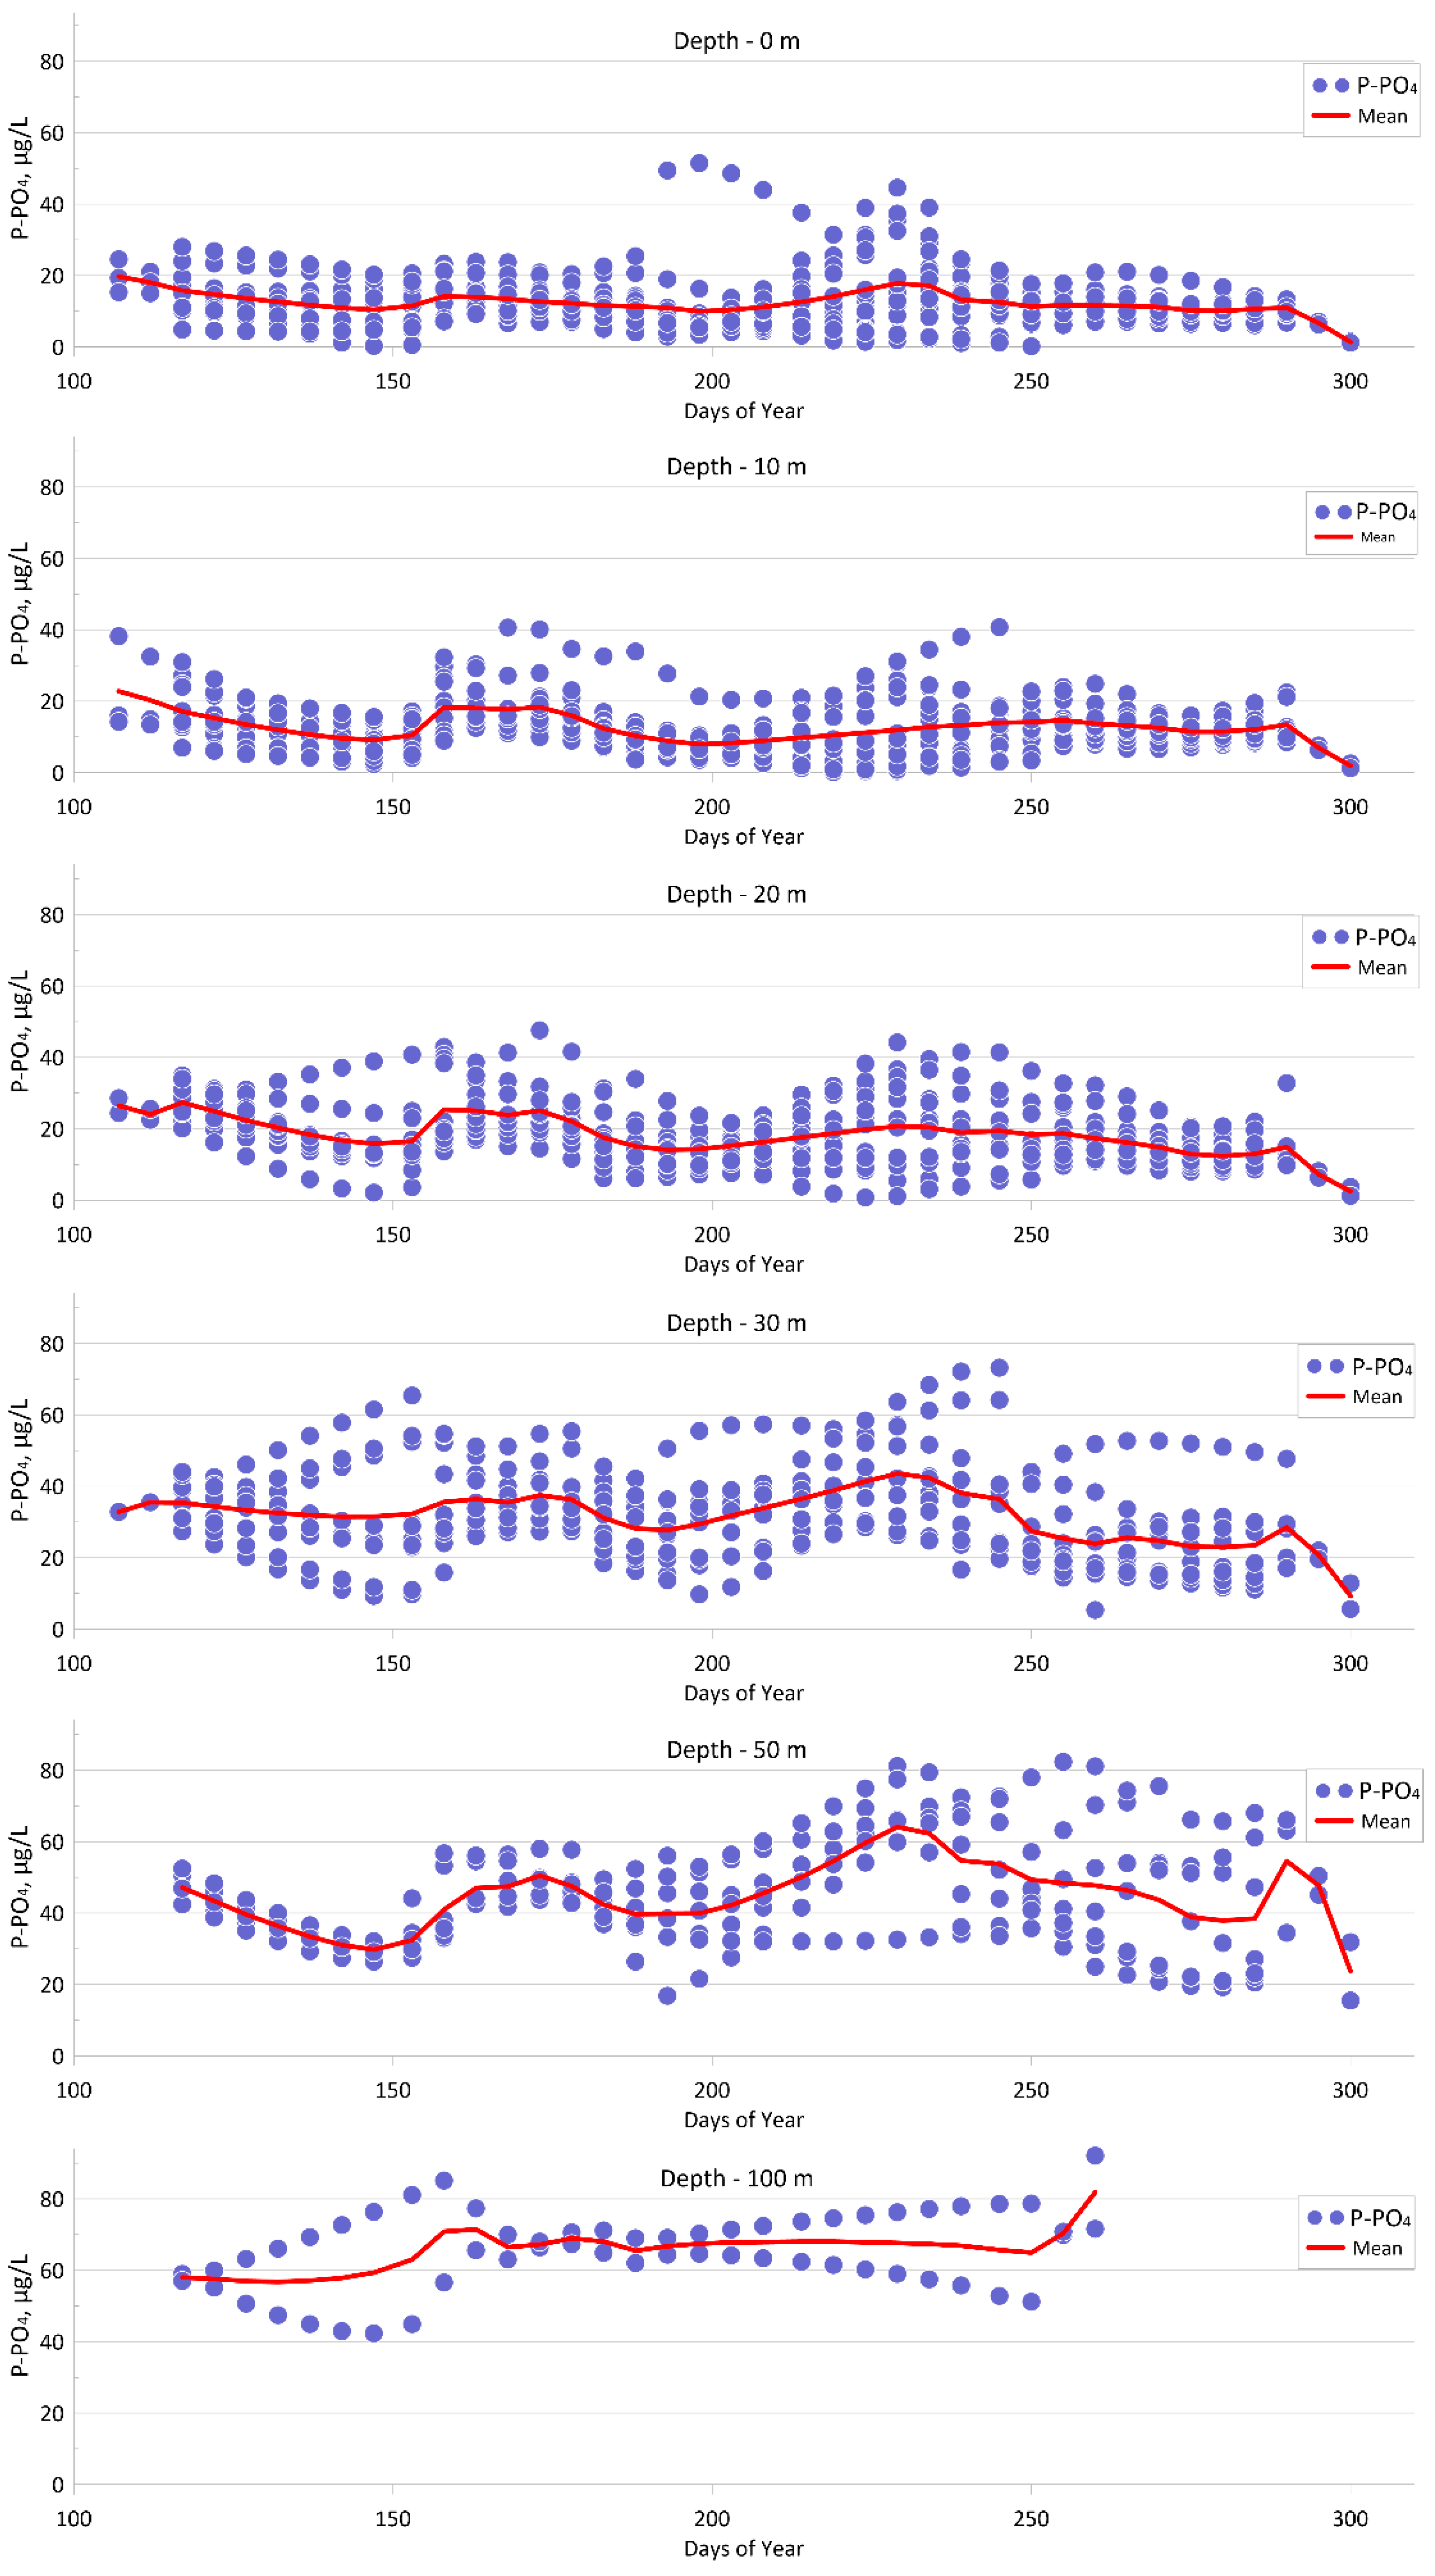
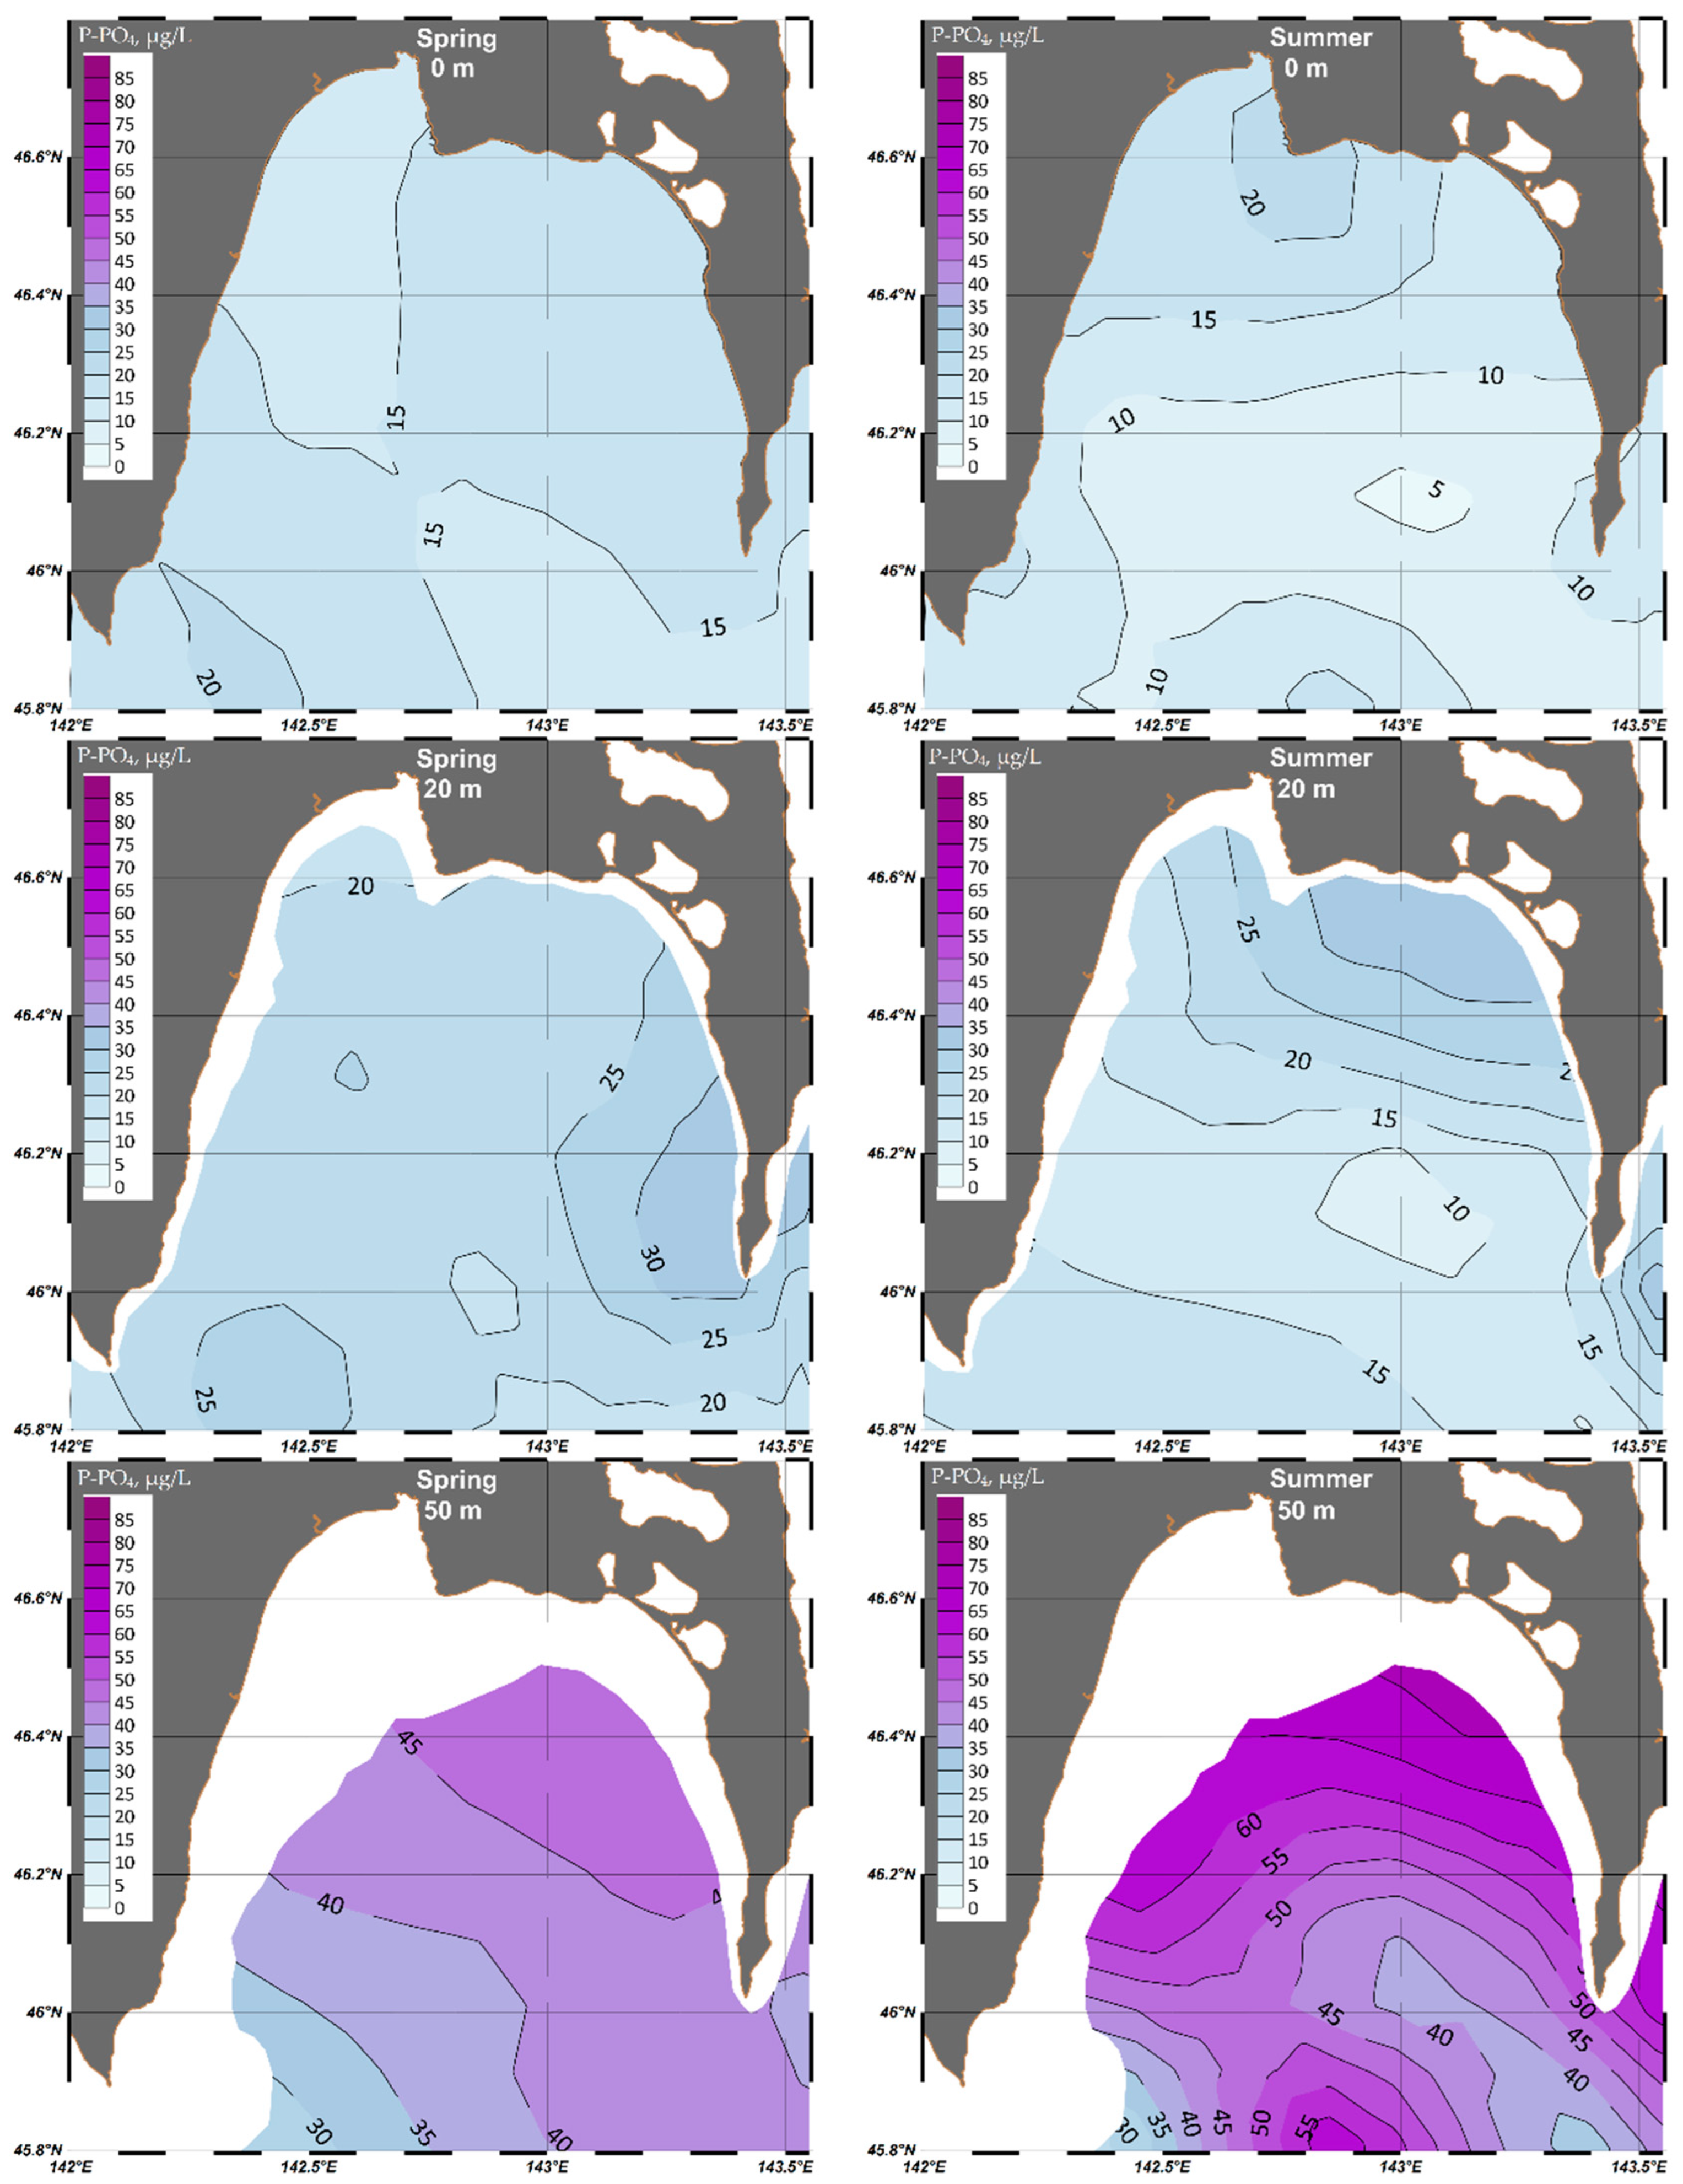
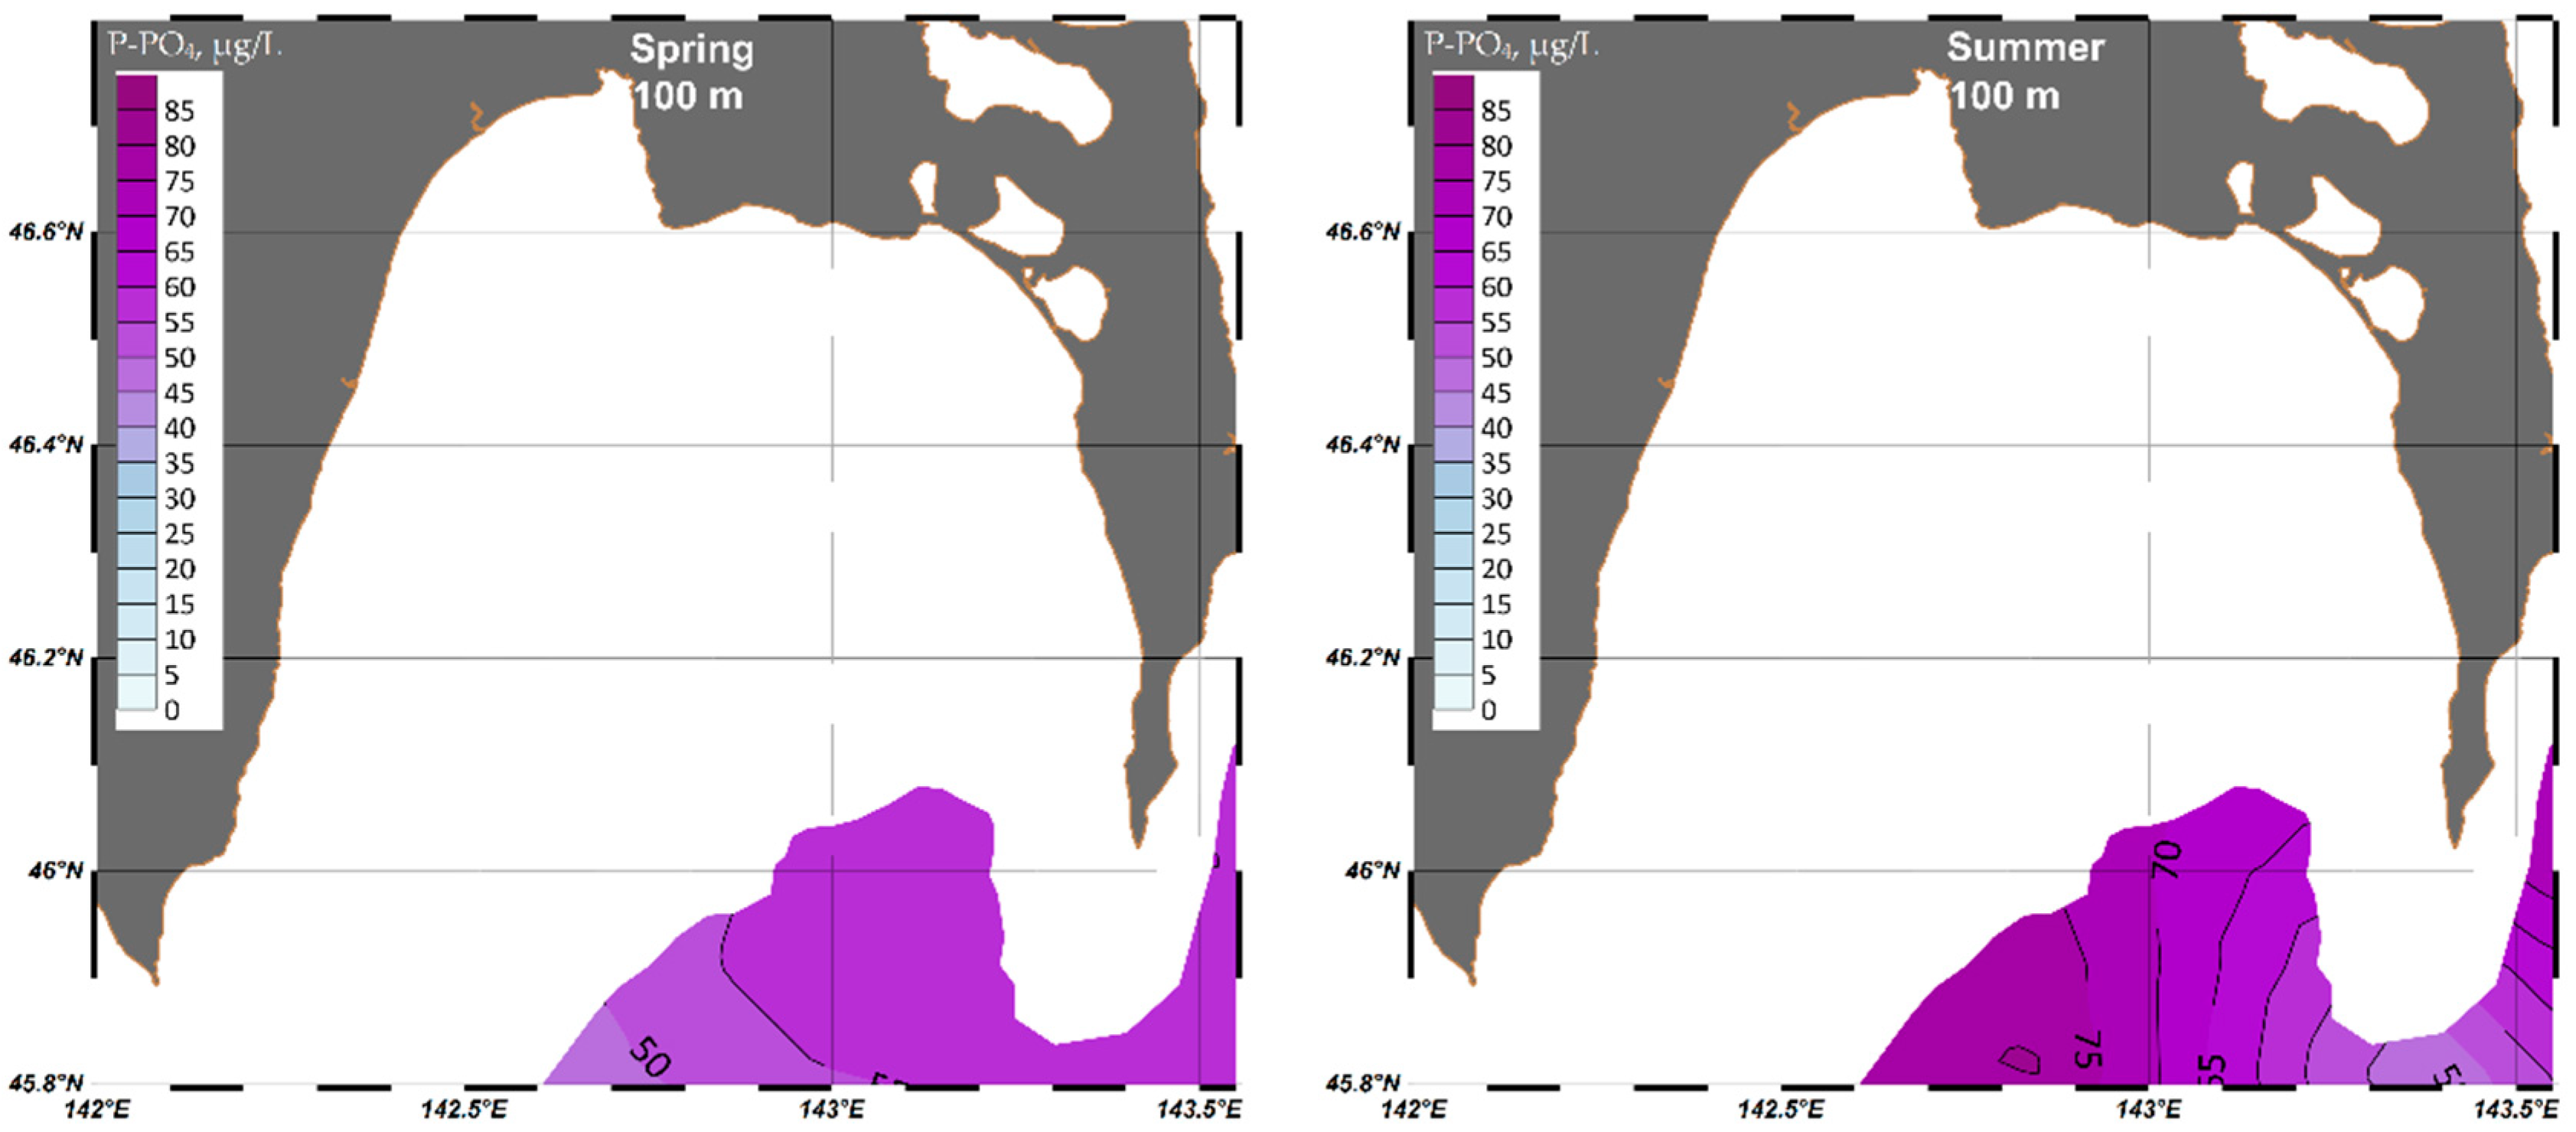
4.1.3. Phosphate (P-PO4)

Next, we will provide an analysis of inorganic nutrients (nitrite (N-NO2), phosphate (P-PO4), and silicate (Si-SiO3).
Inorganic nutrients are a constant part of the biological mass of organisms and are vital for metabolism. The biggest variations in inorganic nutrient concentrations are registered in the euphotic layer, where they are actively consumed by living phytoplankton and certain types of bacteria while producing organic matter. Increasing concentration of inorganic nutrients in surface waters caused by intermediate waters rising during winter convection, vertical circulation (mesoscale eddies, coastal upwelling, storm mixing, winter convection), as well as inflow with river discharge and precipitation. That is why the spatial and temporal distribution of inorganic nutrients, as well as dissolved oxygen, may be a sensitive indicator of water dynamics, taking into account its outstanding part in biochemical processes.
Phosphorus compounds are present in marine water in very small amounts. Together with nitrogen compounds, they take part in protein production and, consequently, may limit phytoplankton growth. The annual cycle of phosphate (P-PO4) in Aniva Bay waters is generally characterized by winter maximum and spring–summer minimum, conditioned by their active consumption in the euphotic layer. From summer to autumn, the total content of phosphates increases [43].
Further, the 5-day time step in our calculations permits us to specify several new features of the annual cycle of phosphate (P-PO4) (Figure 11) compared to previously published [43] results. The first local minimum in the upper layers is registered at the end of May (10–11 µg/L for a depth of 0–10 m), and the second in the second half of July (8–10 µg/L for a depth of 0–10 m)). Between them, there is a local P-PO4 maximum in the second half of June (18 µg/L for a depth of 10 m and 51 µg/L for a depth of 50 m). The second local maximum is registered in the second half of August. Interestingly, in the subsurface, 0–20 m layer absolute values of the second local maximum are comparable to winter ones, but on the 30–50 m depth, they are 3–5% greater. Both local P-PO4 maximums coincide with local pH minimums in time (Figure 9). Mean average P-PO4 values range from ~10 µg/L in surface layers to ~40 µg/L in the 50 m layer (Figure 11).
In autumn and winter, higher inorganic nutrient concentrations in Aniva Bay are caused for two reasons: (1) decline of photosynthesis and (2) intensified advection of biogenic matter with the East Sakhalin Current waters. With the autumn-winter intensification, the East Sakhalin Current prevents fresher waters of the bay from flowing into Sakhalin Gulf. Around the 50 m isobath, a nearly vertical boundary is formed with the bay waters [69]. Along the coast from Cape of Elizabeth to Mys Terpeniya the Western Current periphery interacts additionally with freshened waters rich in inorganic nutrients due to the autumn flood of the Sakhalin rivers. This phenomenon is clearly manifested on seasonal maps of the distribution of salinity, water density, phosphates, and silicates for the entire shelf of the Sakhalin island [41]. In October–November, these waters reach the area of the La Perouse Strait, and subsequently penetrate the Aniva Bay, causing not only a general decrease in salinity by 0.6–0.7% relative to its summer values, but also a rapid increase in the concentration of nutrients in the water.
The maximum annual P-PO4 calculated content on the surface (>18 µg/L) is registered immediately after ice melting and the minimum (7.17 µg/L) is at the end of July. As the layer with active photosynthesis goes deeper, the P-PO4 minimum is settled in later: e.g., on the 50 m depth, it is registered in October (~40 µg/L). Near-bottom layers of the deepwater part of Aniva Bay are characterized by the overall tendency of insignificant fluctuations of P-PO4 concentrations from spring to summer and their further growth from summer to autumn in the range of 60–70 µg/L (Figure 12). Spring concentrations of P-PO4 are rather homogeneous and are ~15 µg/L. With depth, the increased P-PO4 concentrations are clearly traced in the eastern part of the bay in the upwelling zone. At the same time, in the deepwater area mean average P-PO4 concentrations range from 50 to 70 µg/L (Figure 11).
In summer, increased P-PO4 in surface layers is observed in the north-western (>15 µg/L on the surface) and north-eastern (>25 µg/L in the 20 m depth) parts of the bay (Figure 12). Then, with depth, the concentrations rise everywhere in the upwelling zone, up to >70 µg/L in the 50 m depth. The same P-PO4 concentration values are registered in the deepwater part of the bay in the 100 m layer. This fact is circumstantial proof that in summer the inflow of near-bottom waters in the central part of the bay becomes stronger, which results in an almost twofold increase in P-PO4 concentrations in the 50 m depth as compared to spring (Figure 12).

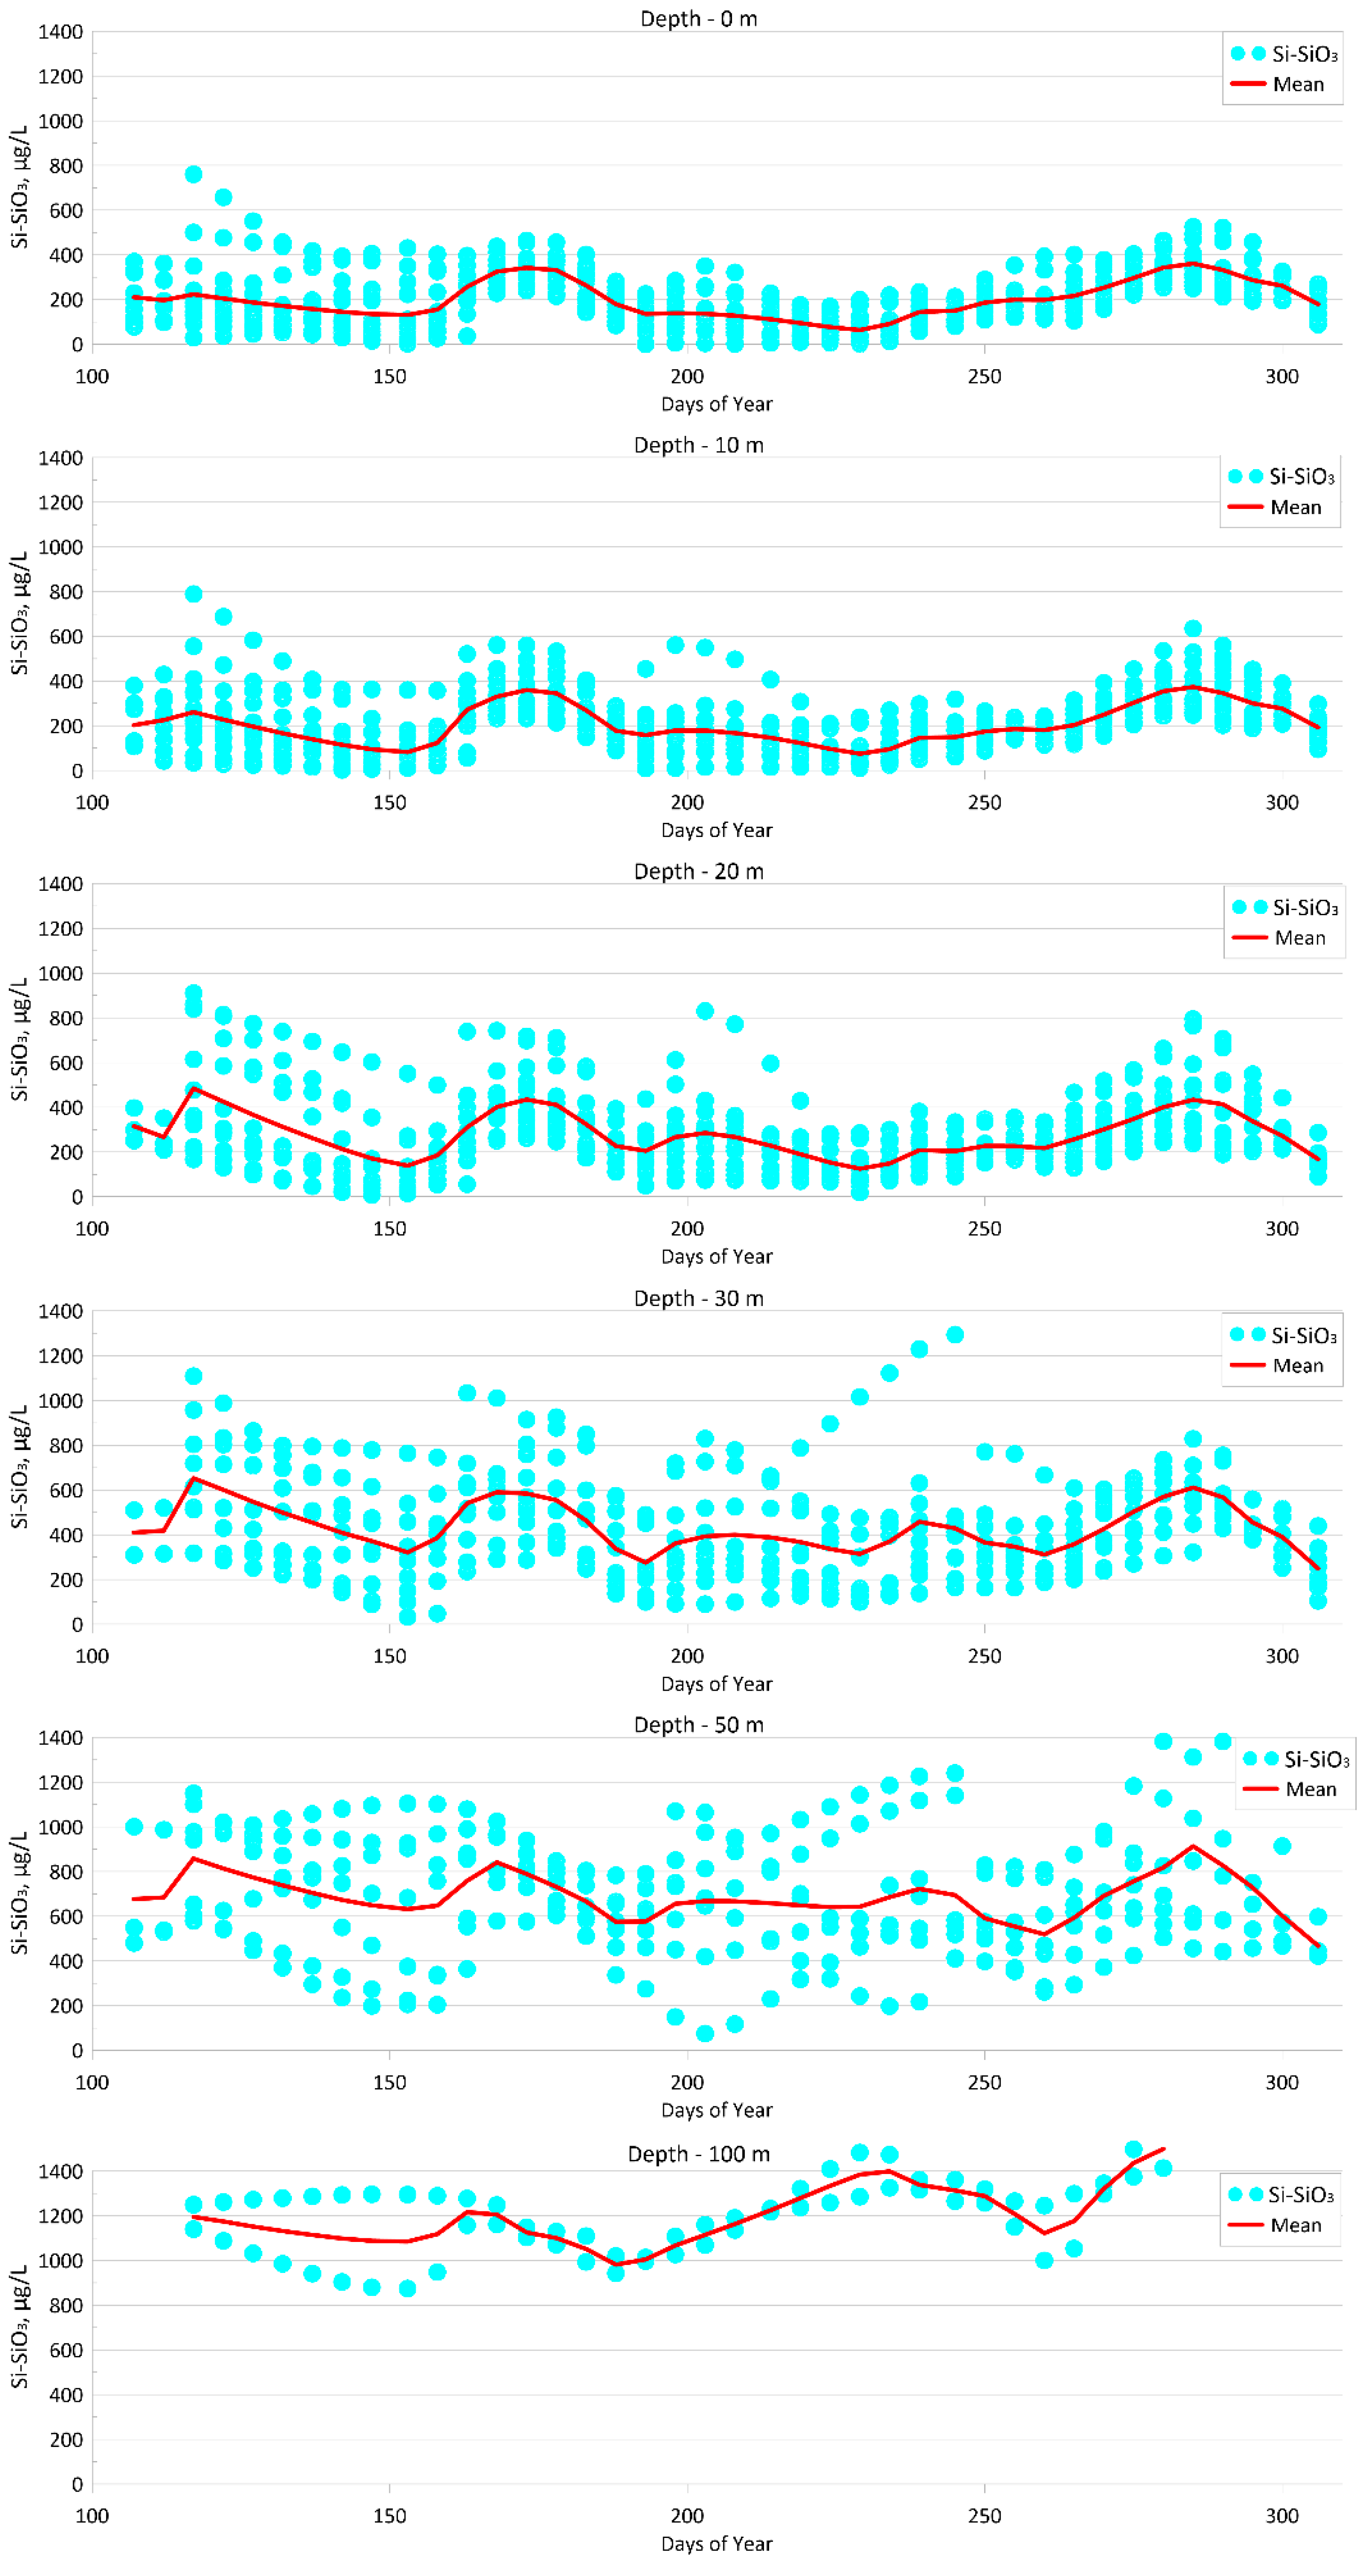
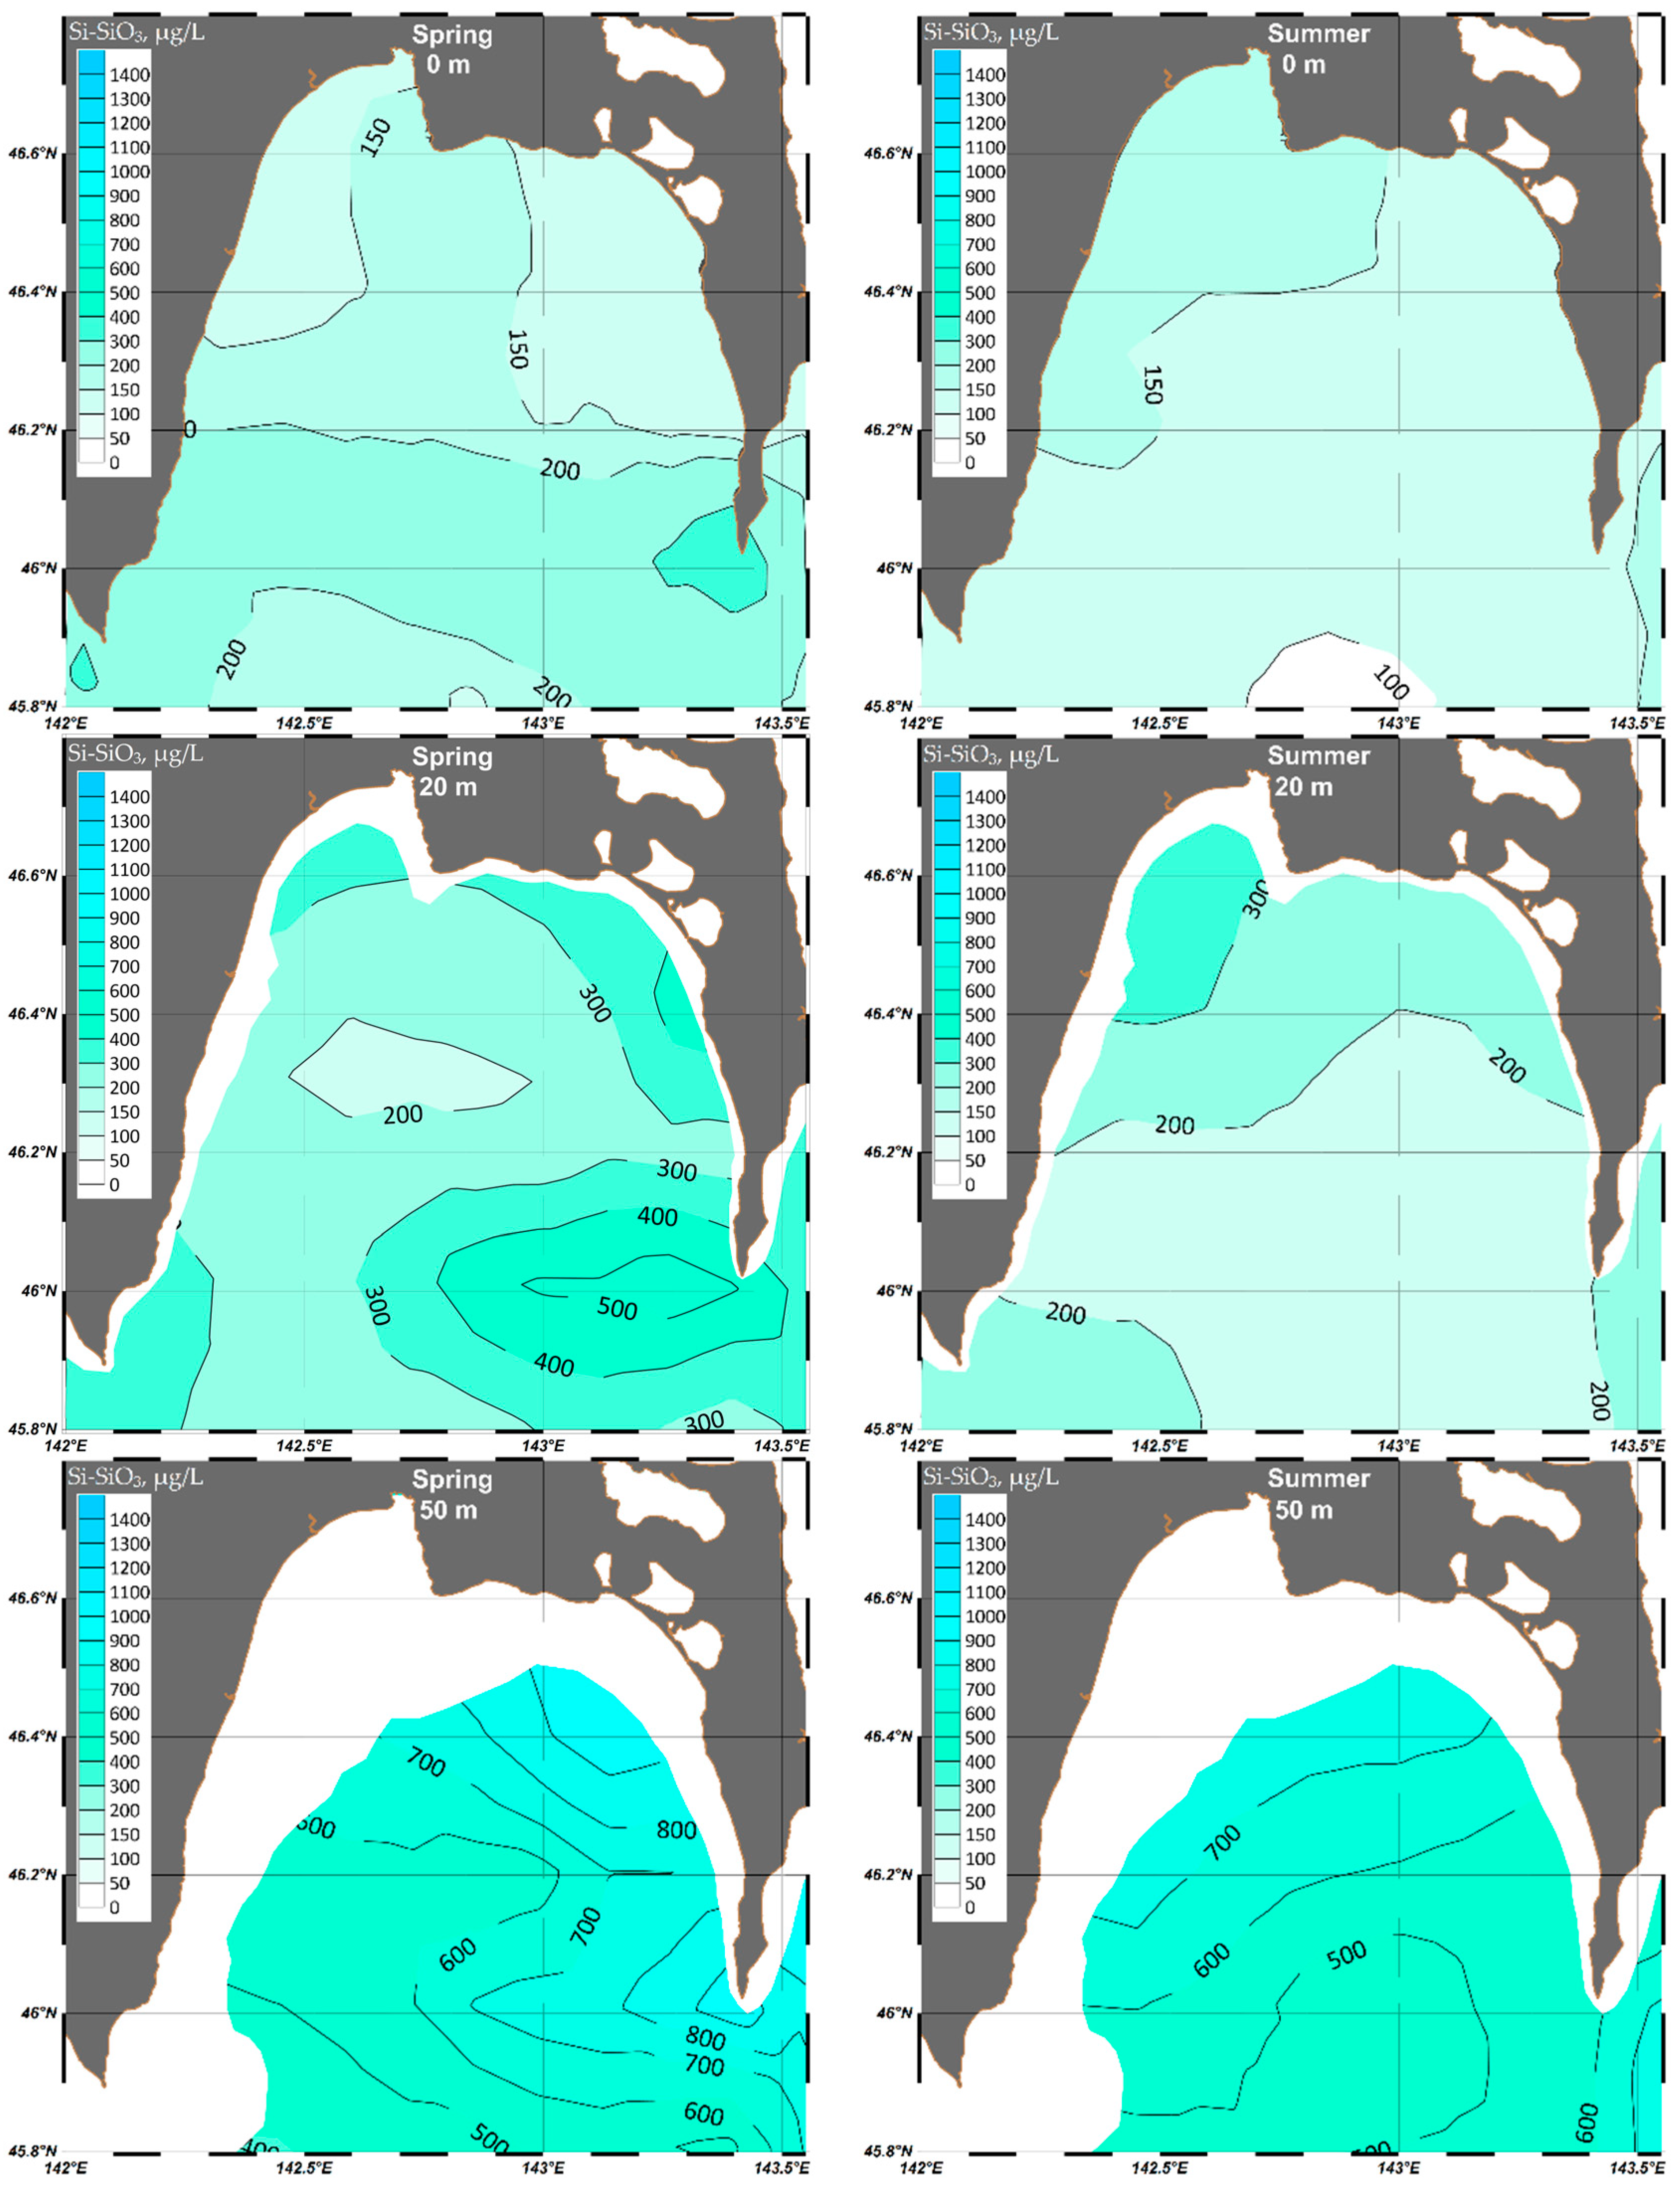
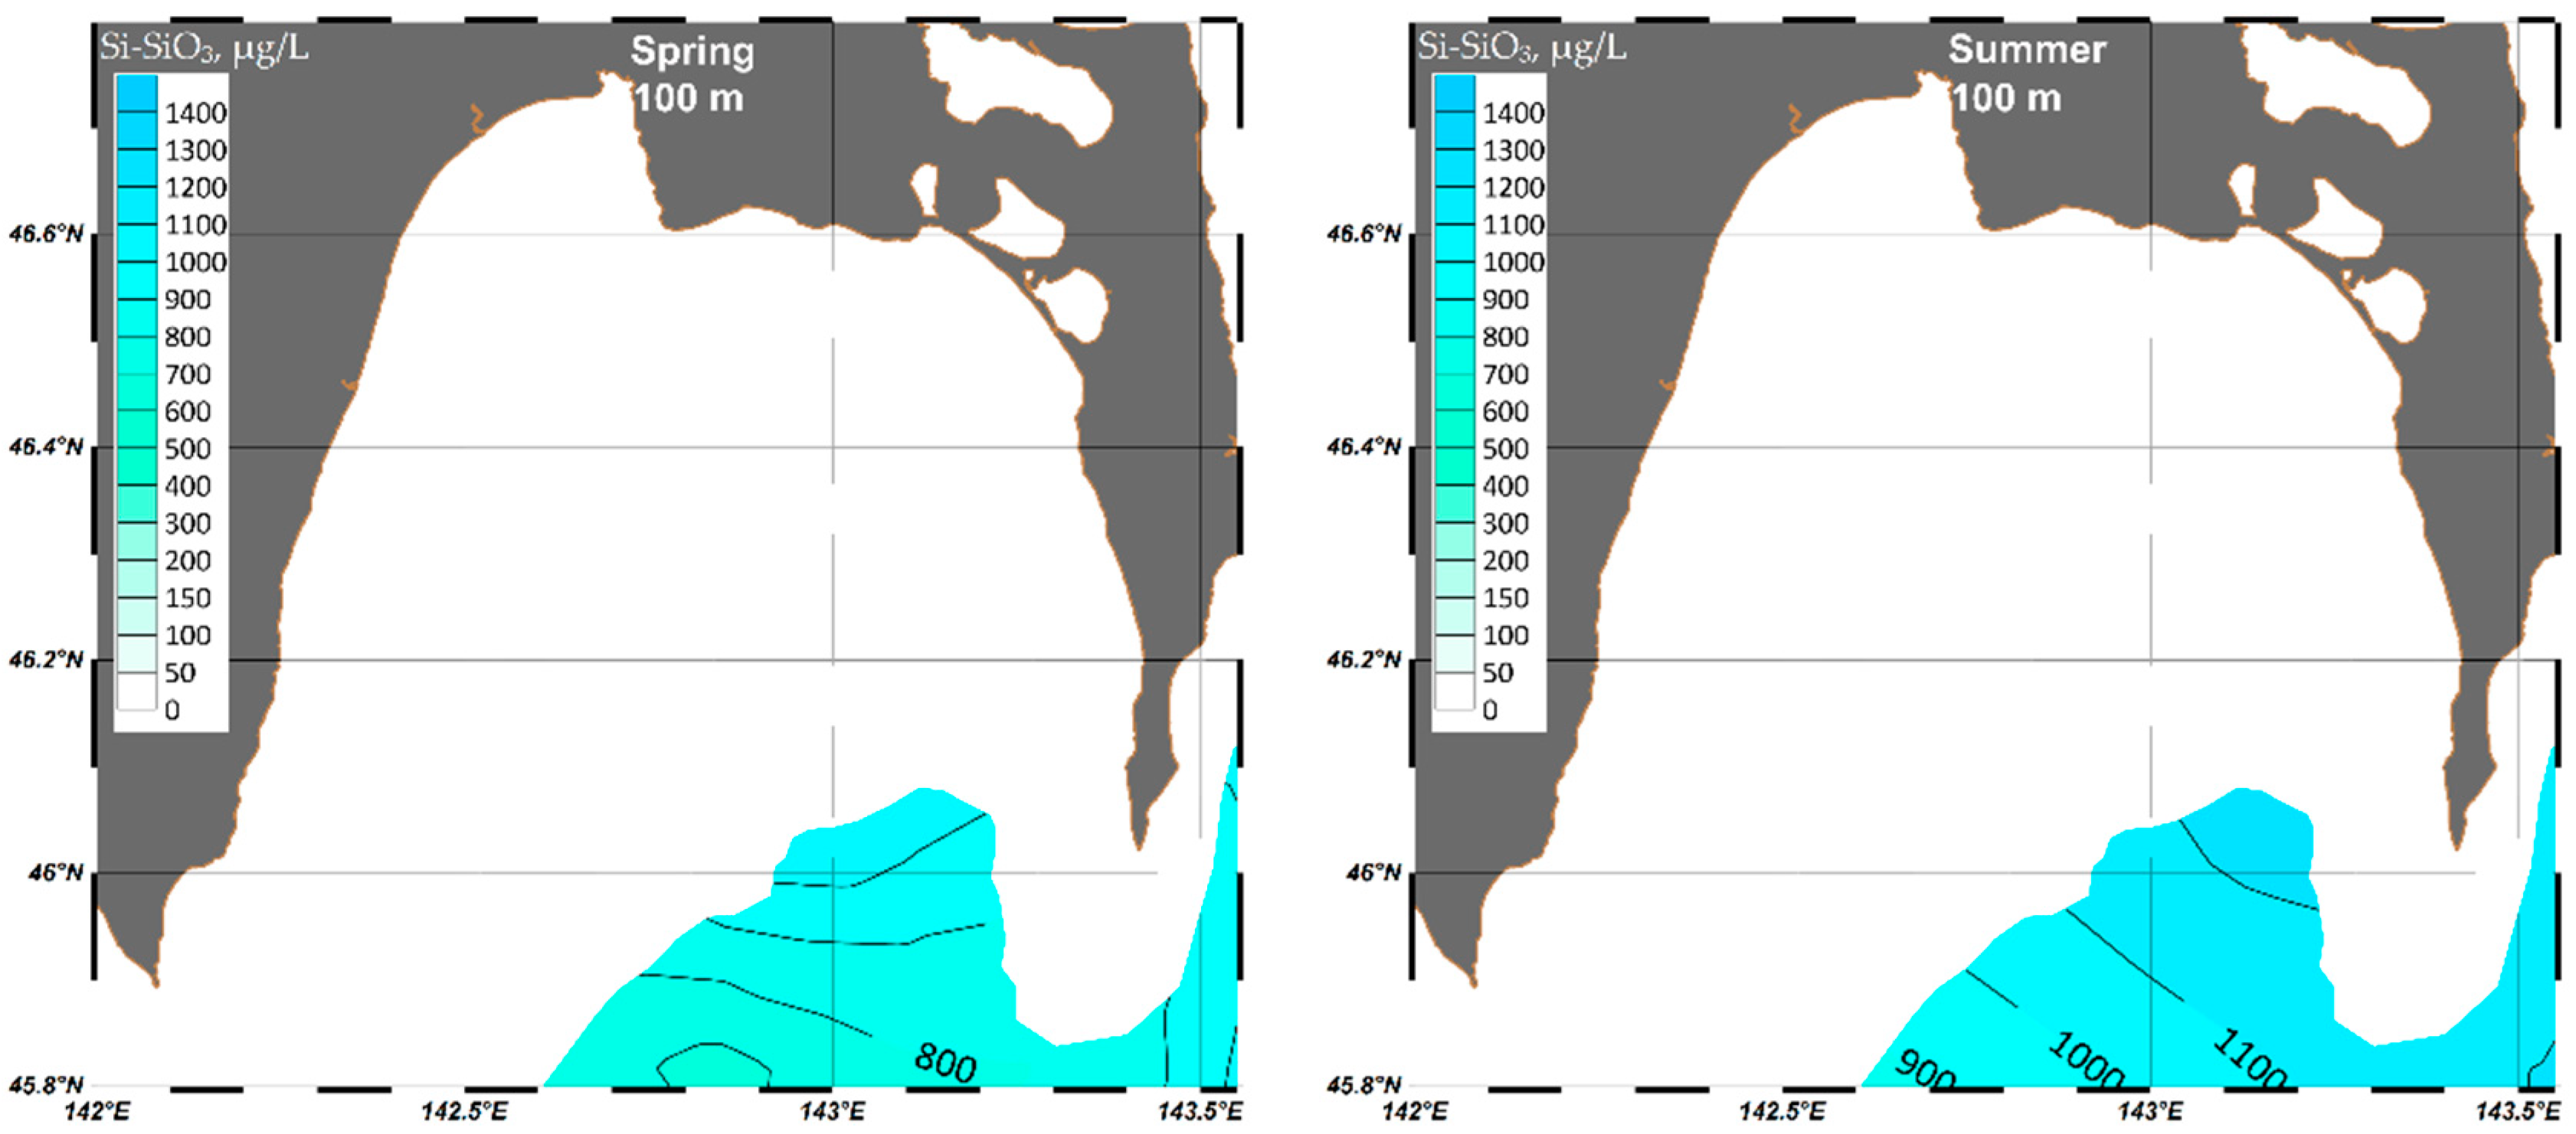
4.1.4. Silicate (Si-SiO3)

Silicon is a compound of skeletal formations of marine organisms. Its content in seawater is significantly higher than for other inorganic nutrients and is measured in a wide range from units to hundreds and thousands of µg/L. The main sources of silicon compounds in natural waters are processes of chemical erosion and dissipation of siliceous material, and in oceanic waters, continental drains [77]. For a long time, it was assumed that Far Eastern seas are related to the North Pacific zone of higher concentrations of silicic acid in the surface layer. However, comprehensive studies conducted with the new instrumental and methodological base in 1990–1994 showed that in the surface layer, there is a relative excess of silicates only at the start of phytoplankton vegetation [78]. In summer on the bigger part of the Sea of Okhotsk, unlike during the pre-vegetation phase, there is a deficiency of silicates instead of nitrogen. According to the stoichiometric relation for natural phytoplankton populations, C:Si:N:P = 106:23:16:1, and the relations Si/P, Si/N, and N/P are 23, 1.4, and 16, respectively [79]. In Aniva Bay, the relations Si/P and Si/N become less than 1.4 and 23, respectively. The lack of nitrogen and phosphorus is compensated to a great extent by their regeneration during the decomposition of organic matter and metabolism of marine hydrobionts, as well as the ability of phytoplankton to use nitrogen and phosphorus-containing organic compounds. At the same time, silicate regeneration happens very slowly, so it is relatively deficient compared to nitrogen and phosphorus. The authors claim that, in the long run, it will be silicates that will limit the phytoplankton production in the Sea of Okhotsk, apart from upwelling zones [80]. Higher levels of silicon are observed in the bottom sediments as well, which is more proof that biogenic processes of silica deposition to the bottom prevail [81,82].
In the season changes of silicate (Si-SiO3) concentrations, there are two maximums comparable in their absolute values: at the end of June and at the beginning of October, with mean average values of >340 µg/L on the surface and >800 µg/L on the 50 m depth. The main minimum falls in mid-August is <70 µg/L on the surface and ~640 µg/L on the 50 m depth (Figure 13). While the first maximum is very clear in all the water columns and matches the phosphate maximum, the second one matches in time with pH maximum and nitrites minimum. Mean average silicate concentrations on the surface reach ~200 µg/L, and in the near-bottom depths they reach ~500 µg/L.
On the surface of the bay, the silicate distribution is rather homogeneous. In spring, the concentration is lower (<150 µg/L) in the shallow waters along the north-western and eastern coasts of the bay in the areas with active photosynthesis (Figure 14). Maximum concentrations (>250 µg/L) are registered at Cape Aniva because of the rise of deep water sliding over the underwater part of the cape, which is manifested in other depths, too. In summer, the north-western part of the bay stands out with increased concentrations (>150 µg/L), as it collects most of the river discharge. Below the pycnocline, the concentrations of silicate, as well as phosphate, increase everywhere: on the 50 m depth in spring in the upwelling zone > 900 µg/L, and in summer in the central part of the bay > 900 µg/L.

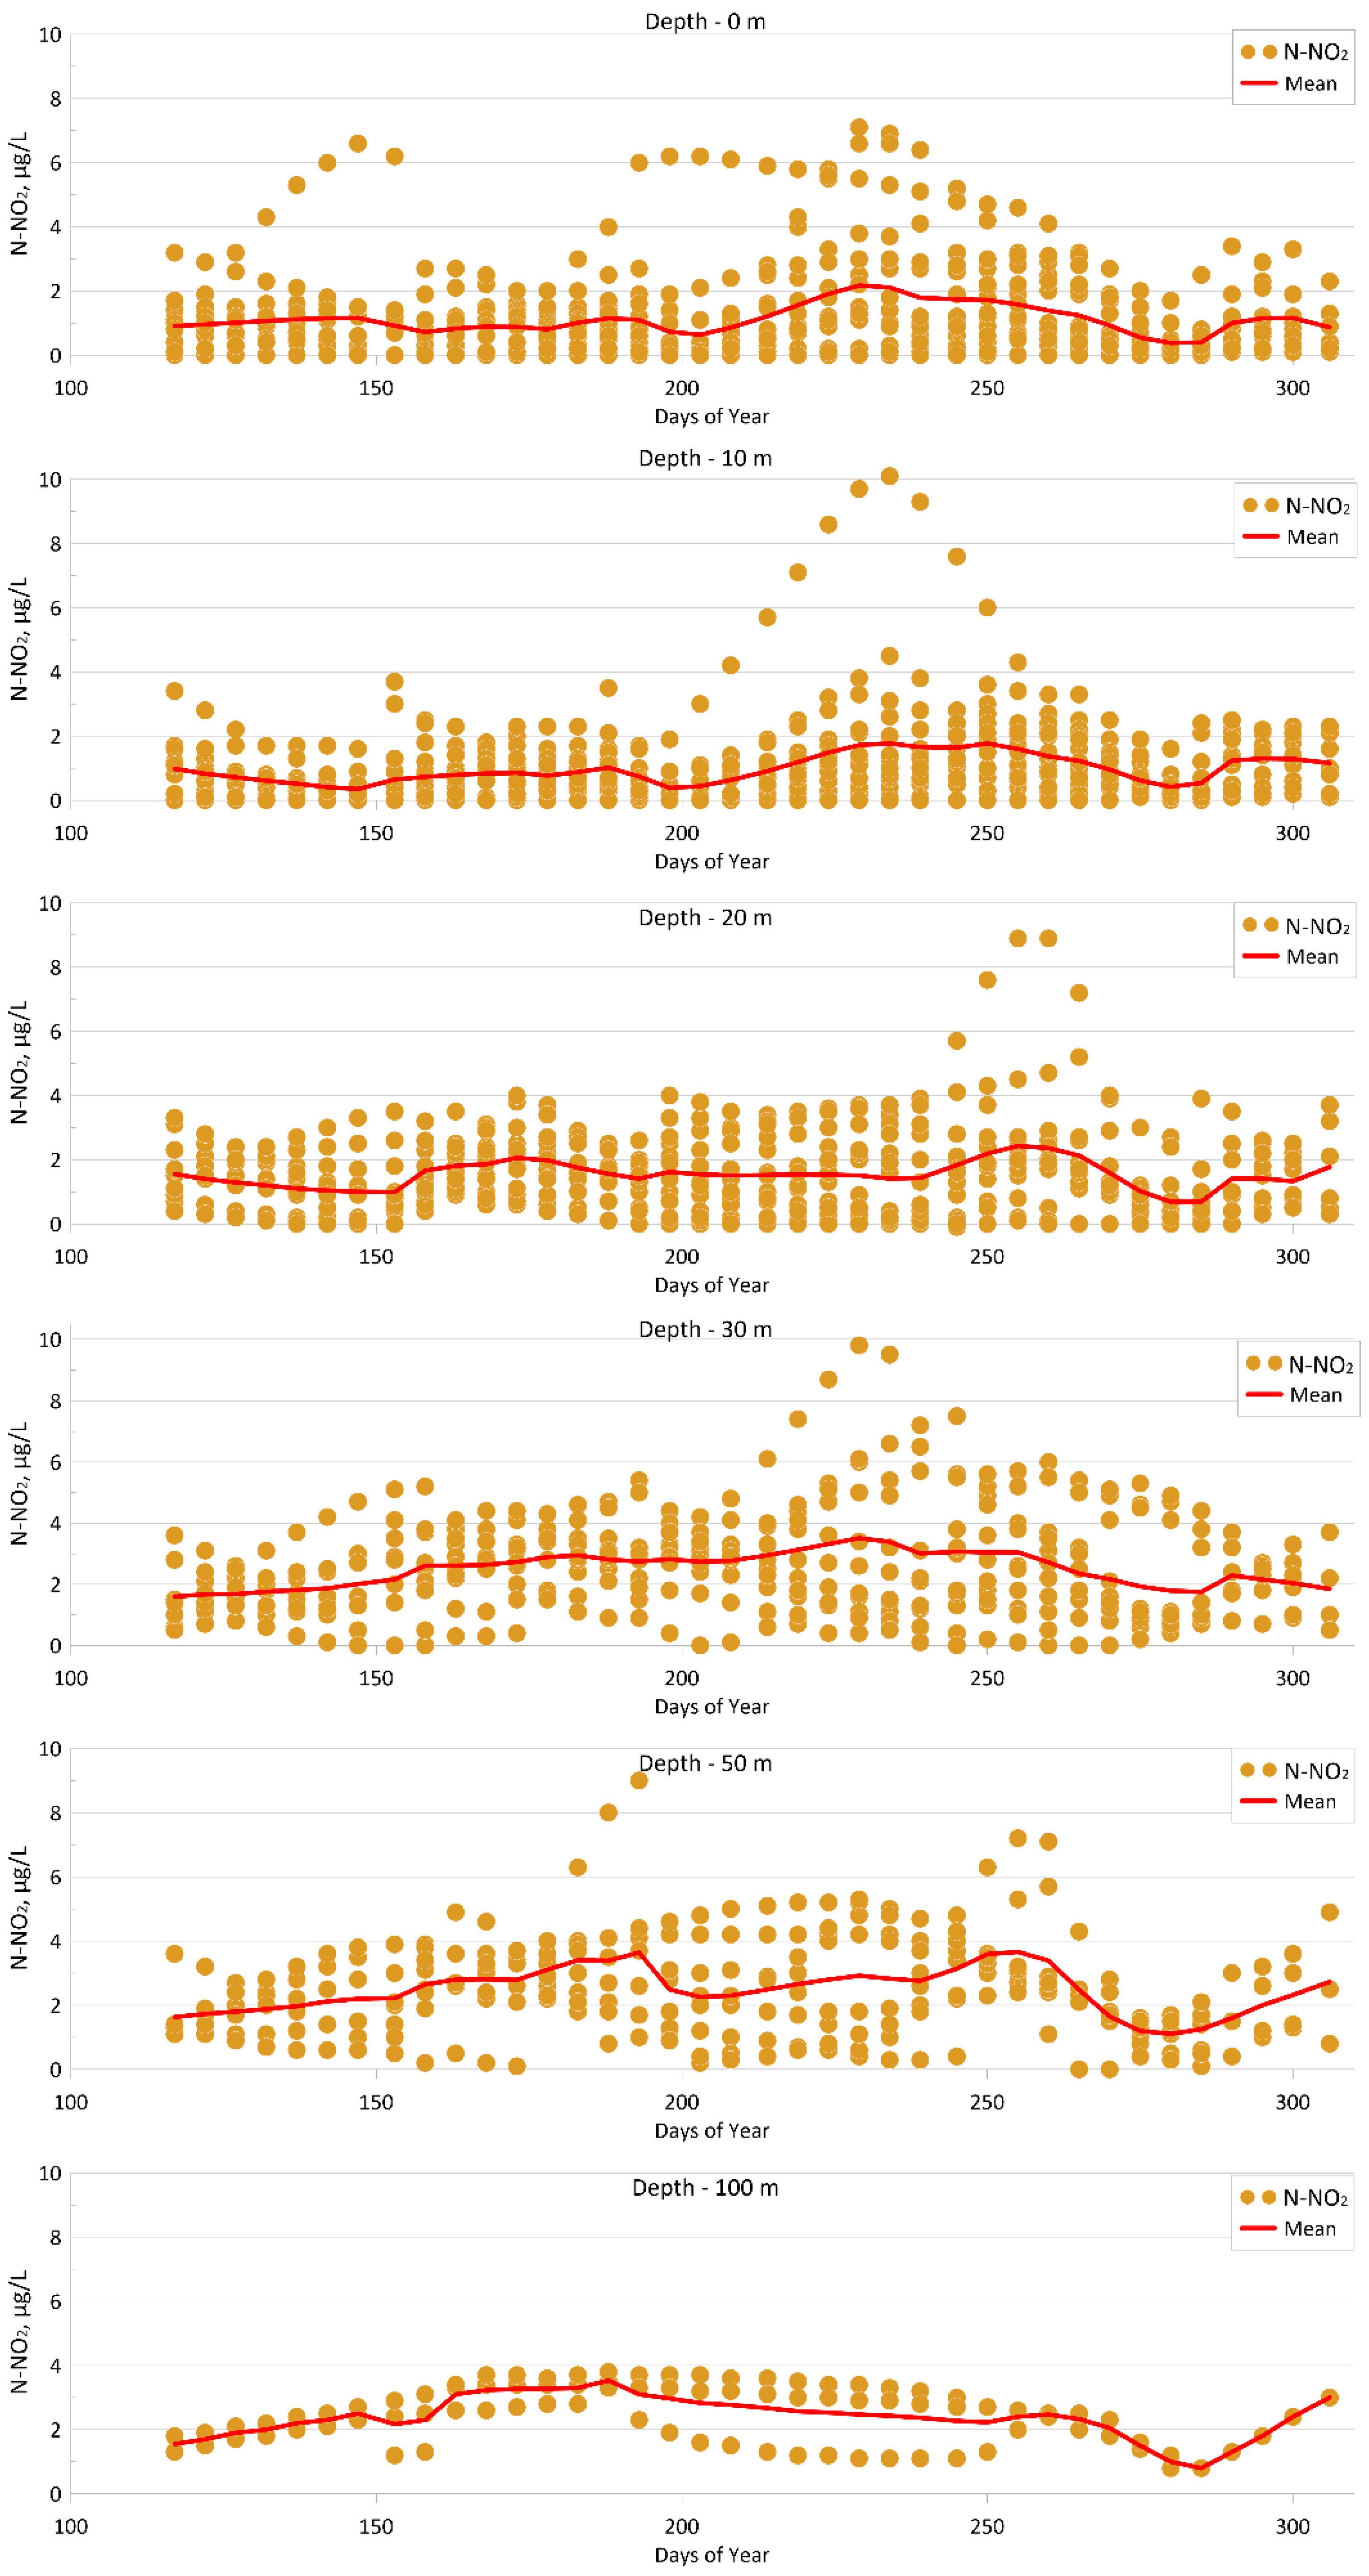
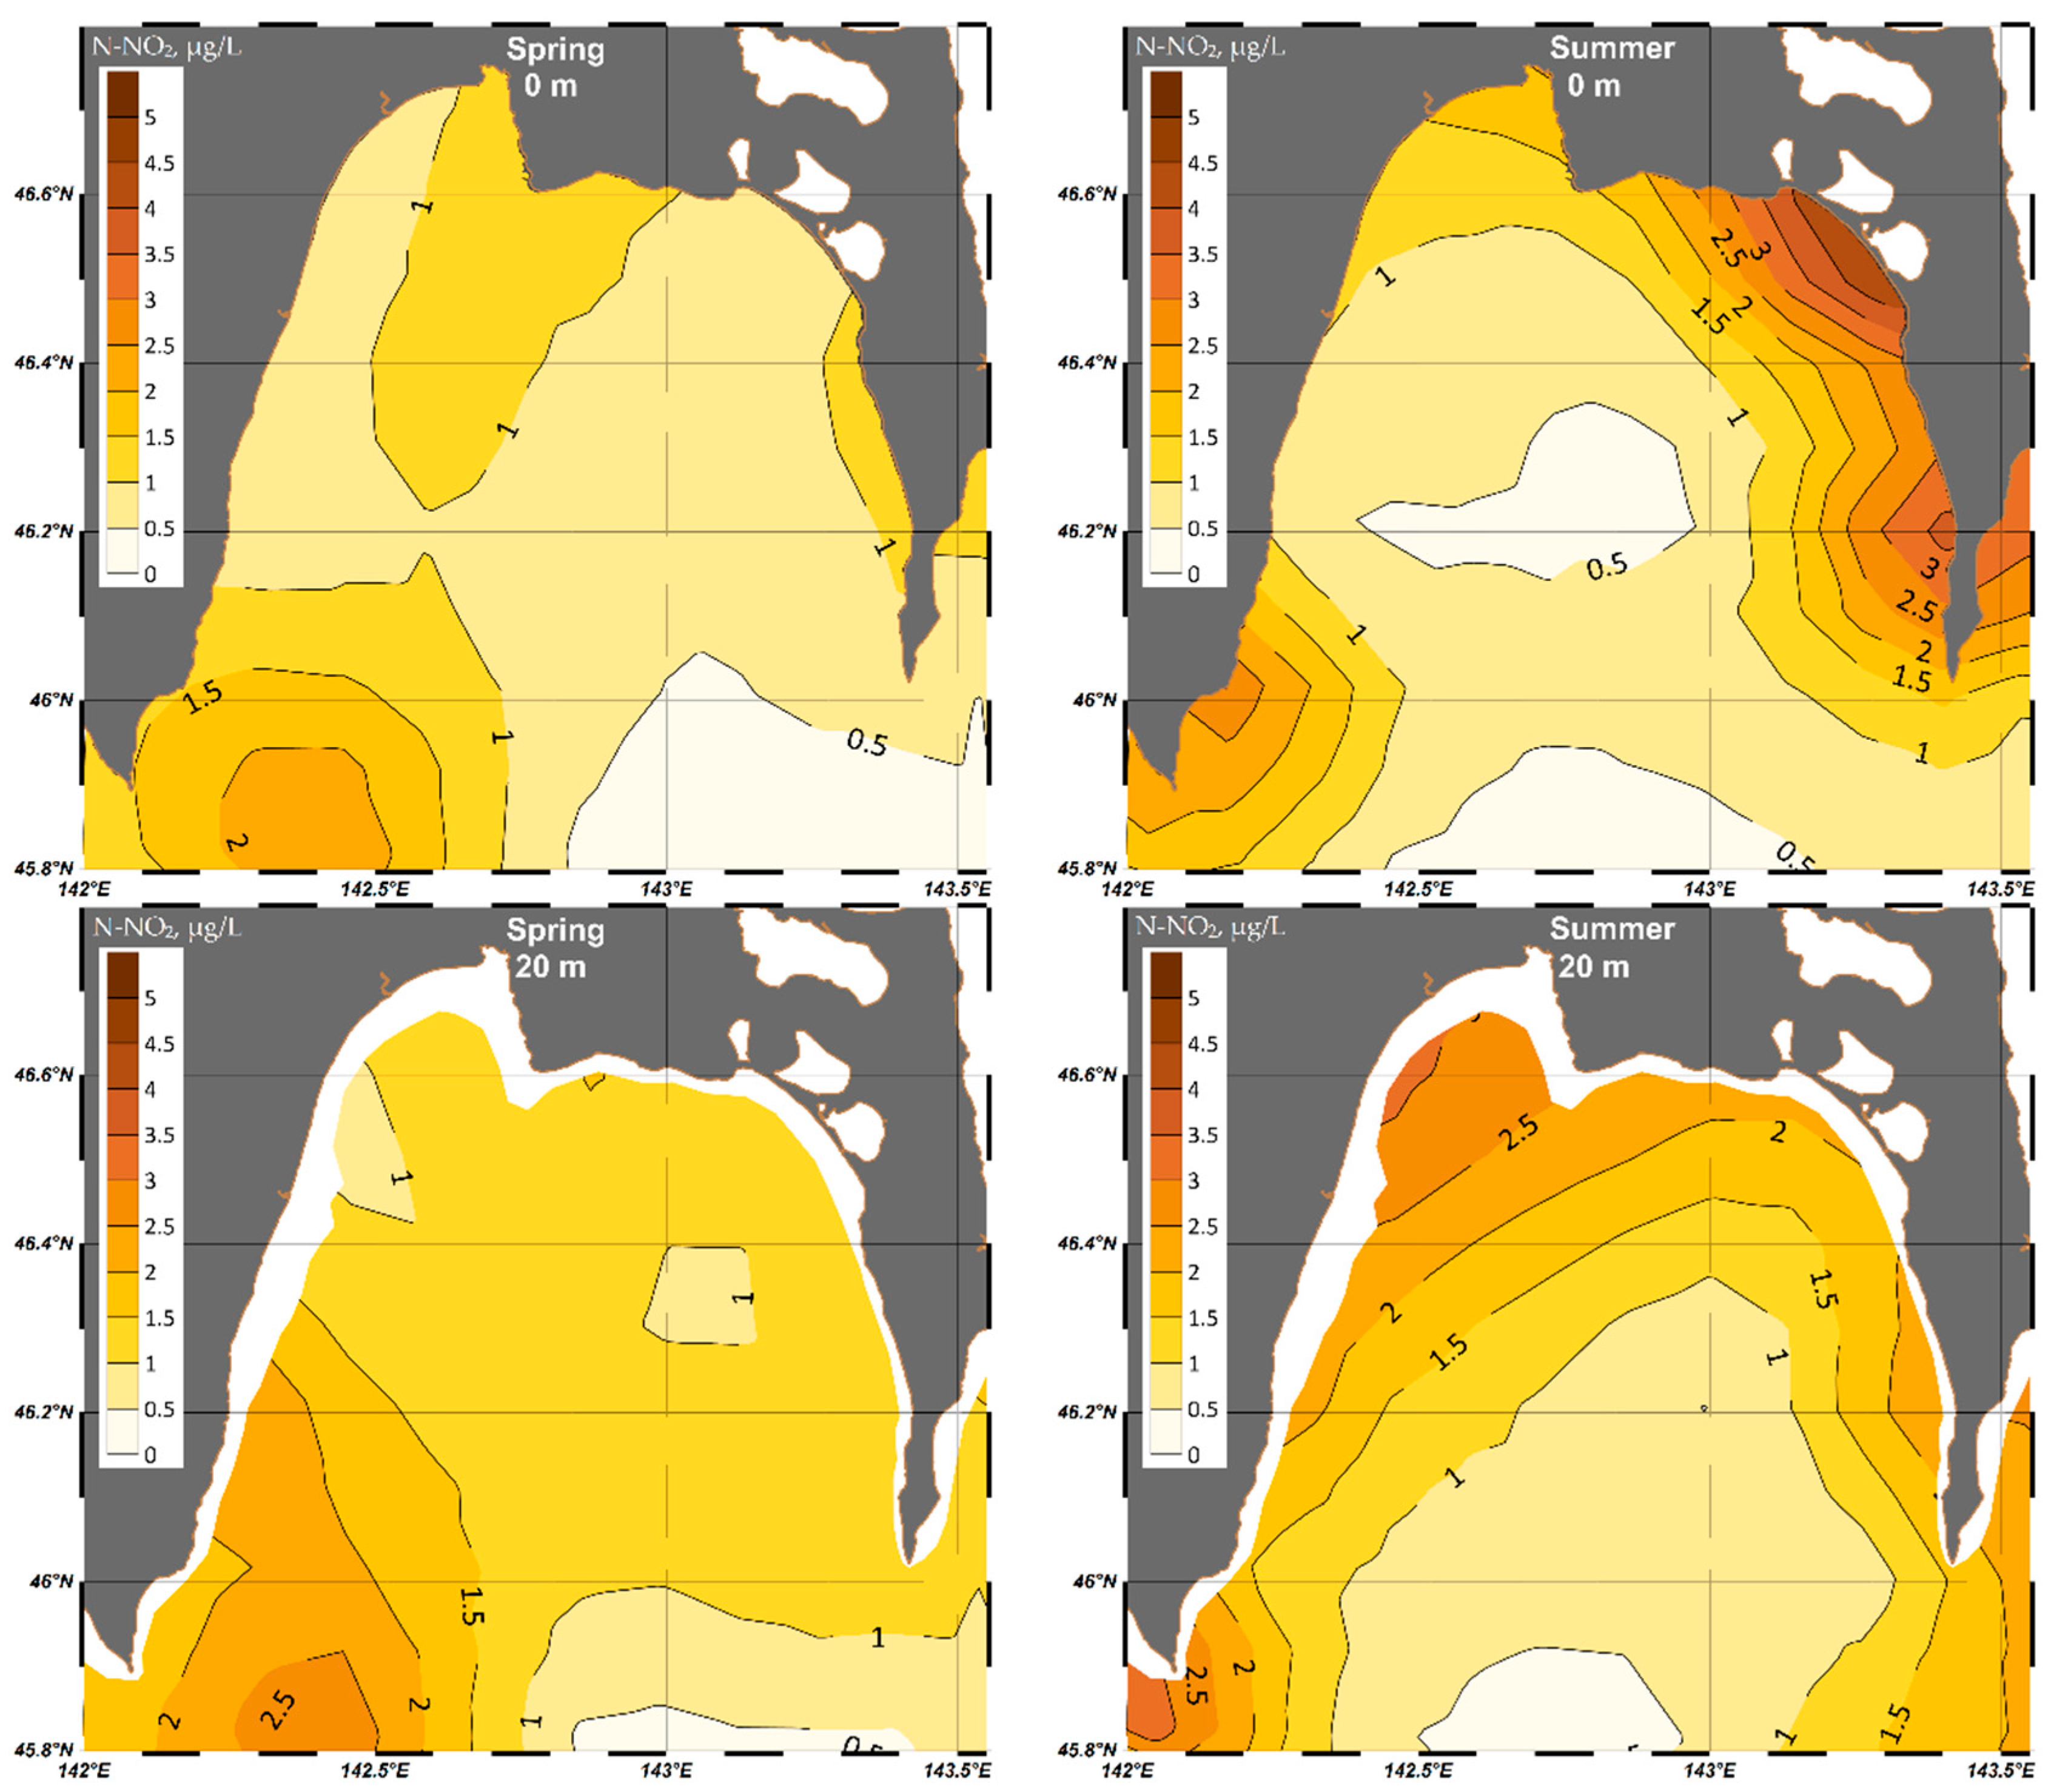
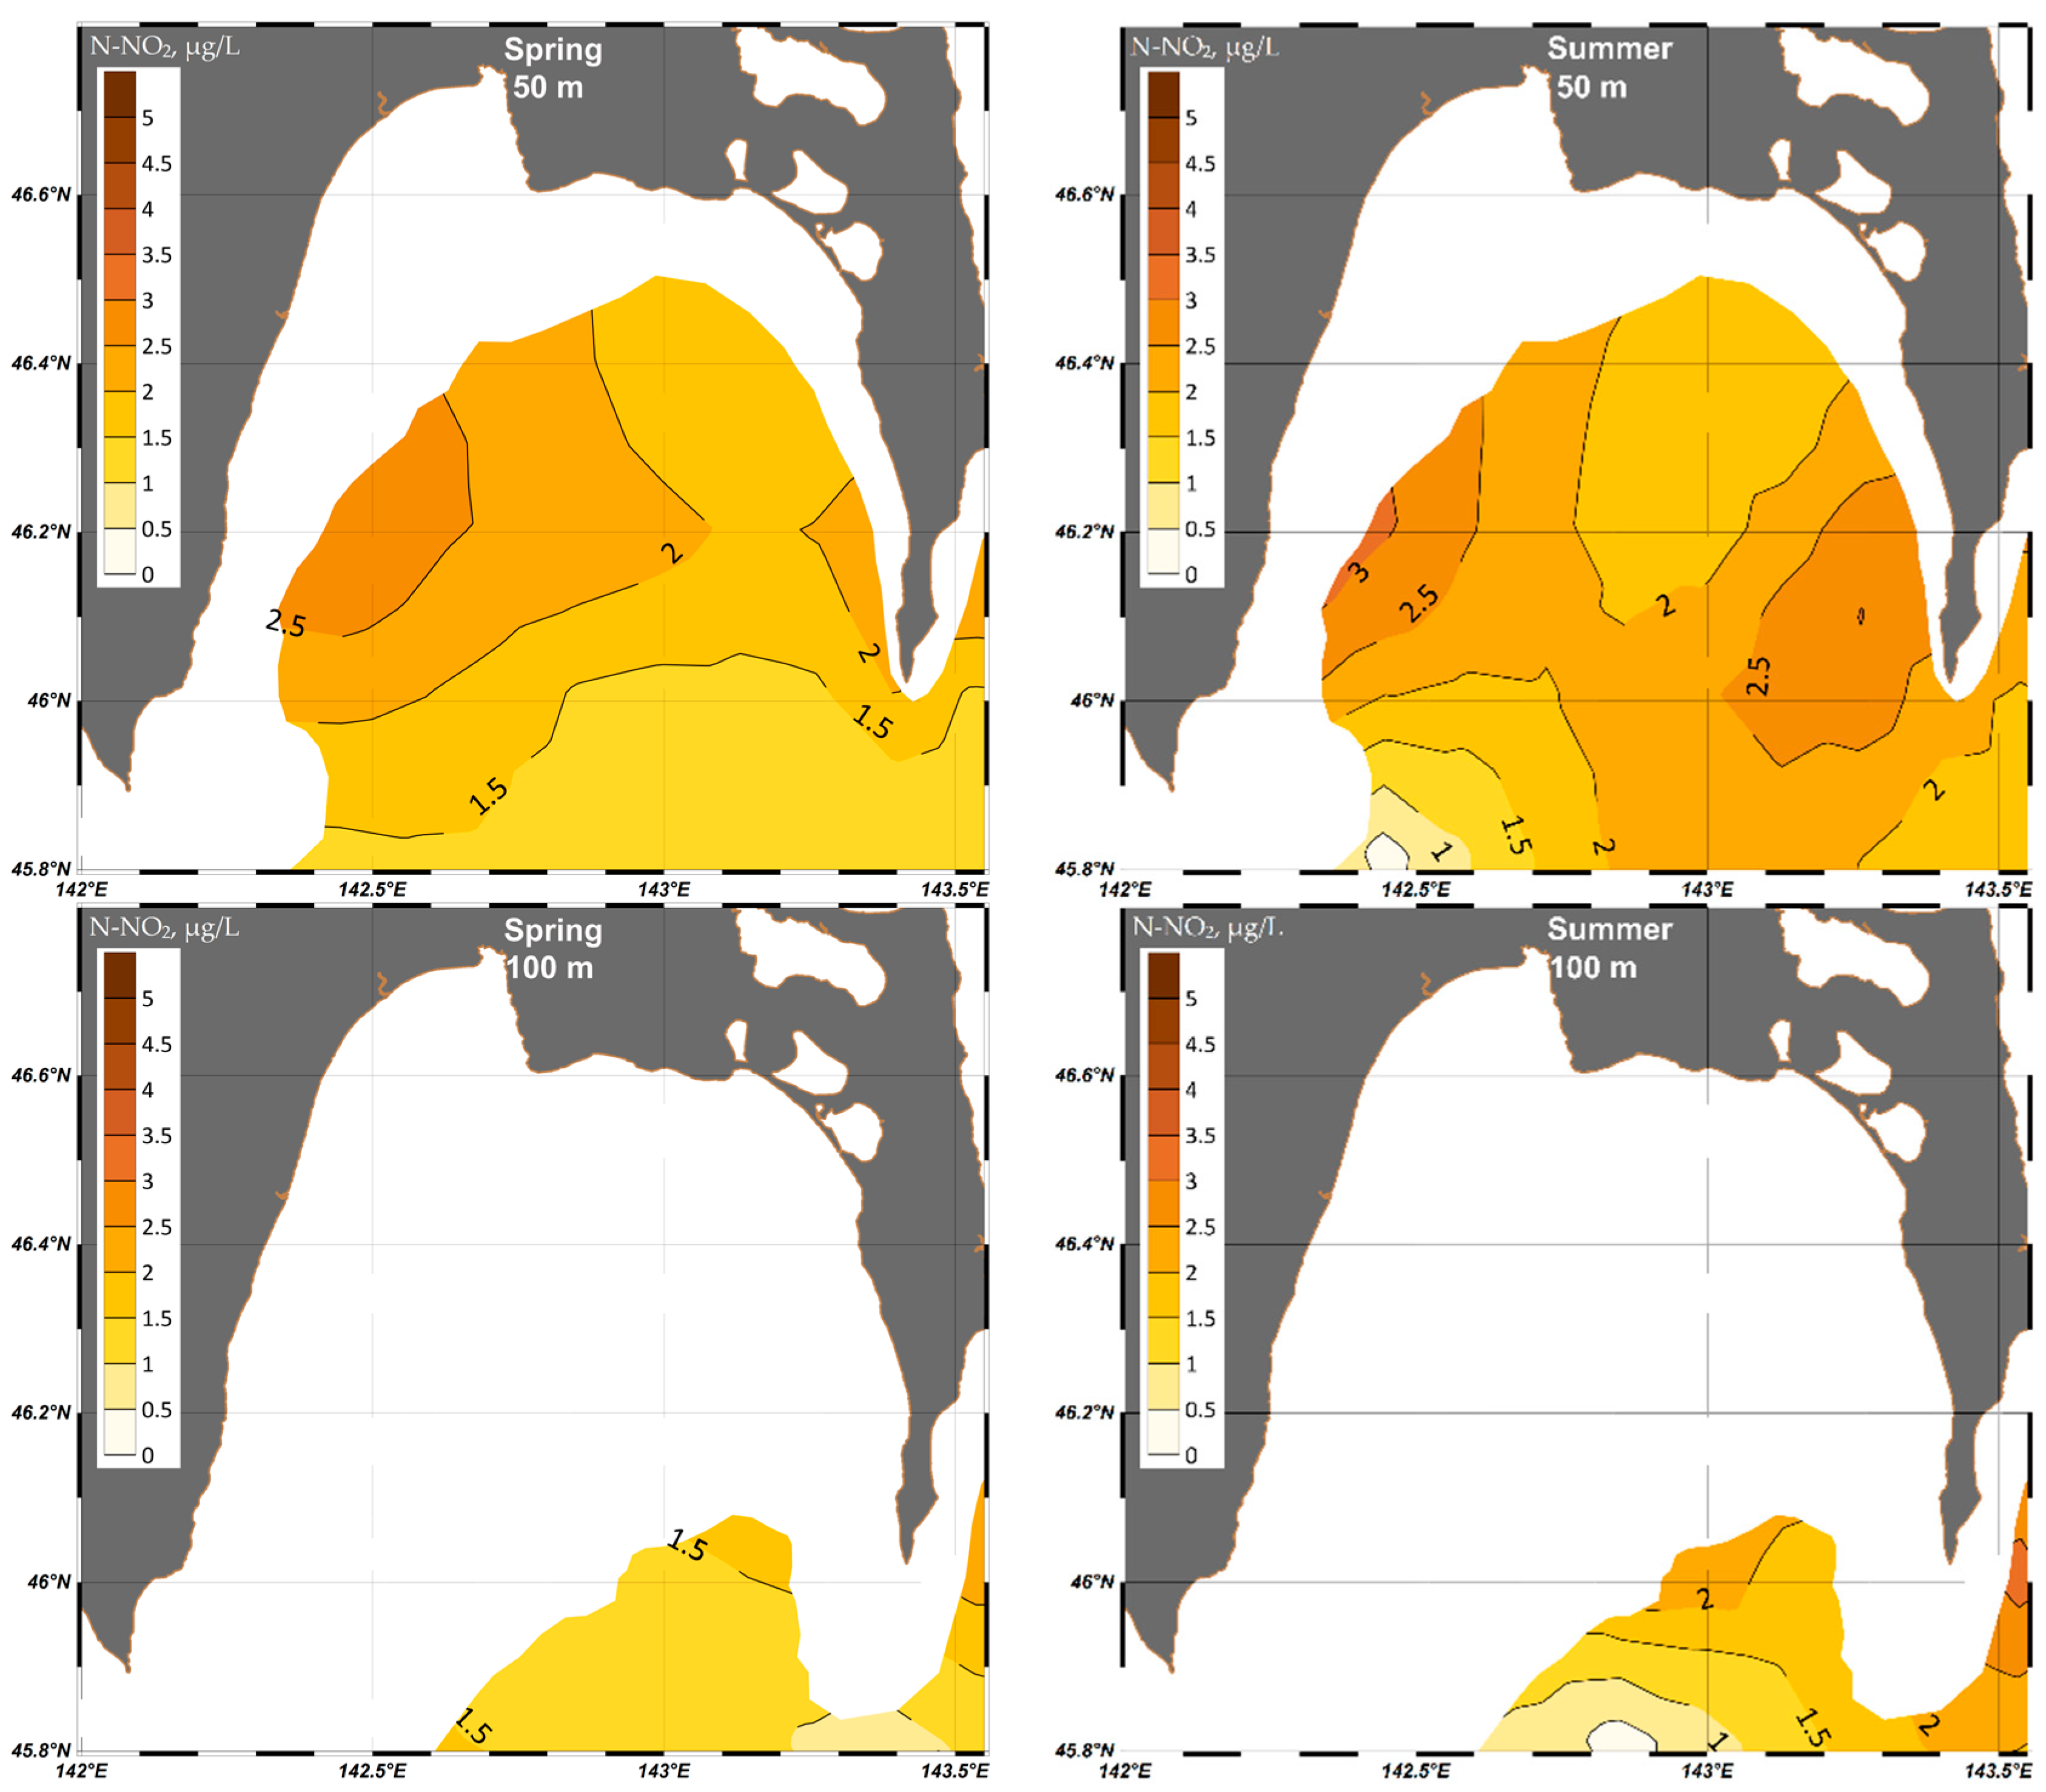
4.1.5. Nitrite (N-NO2)

Nitrites are an intermediate form of decomposition of organic matter in marine water, which is finally oxidated until nitrates. Nitrates is actively consumed by phytoplankton and denitrifying bacteria. Diatomic and green microalgae are able to reduce nitrates to nitrites [39]. An important source of saturation of surface waters with nitrates is atmospheric precipitations, but the basic needs of living organisms are fulfilled on the account of internal nitrogen cycle in the water mass. More than 65% of combined nitrogen is stored in marine water in the form of nitrates. However, due to the difficulty of their analytical identification, their spatial and temporal distribution is poorly studied. At the same time, the simplicity and high sensitivity of methods for nitrite nitrogen identification make this least significant nitrogen form more studied than the nitrate one. Nitrite nitrogen is an indicator of red–ox processes. Nitrite concentration depends on the amount of decomposed organic material reflecting the synthesis process that has already finished. Moreover, the resupply of combined nitrogen occurs due to river runoff and precipitation. In deep waters, there usually are no nitrites, while on the surface, high nitrite concentrations are registered in areas with intensive water rising. All the water area of the Sea of Okhotsk is characterized by a constant relative nitrogen deficit (relation N/P < 16) [78,82].
A peculiar feature of the annual cycle of nitrite N-NO2 concentration in Aniva Bay, related to the subarctic structure, is the summer maximum in the 0–50 m layer. Mean average values on the surface are >2 µg/L in mid-July, and on the 50 m depth they are >3.5 µg/L in mid-September (Figure 15). It settles in simultaneously with pH and silica minimums, with an annual cycle maximum of P-PO4 and a local oxygen maximum. This indicates active multidirectional hydrological, hydrochemical, and hydrobiological processes. In near-bottom depths, the nitrite N-NO2 maximum (>3.5 µg/L) is registered at the end of June. The main annual cycle minimum for all depths is observed at the end of September. It is conditioned, the same as with maximums of inorganic phosphorus and silica, by the start of the storm season and active water mixing. Local nitrite minimums in the euphotic layer are registered at the end of May and in mid-June.
The spatial–temporal distribution of nitrite N-NO2 generally agrees with the distribution of P-PO4 and silica. In spring, higher values of nitrite N-NO2 (>1 µg/L) mark the zone of river discharge in the north-western part and the upwelling zone along the eastern coast (Figure 16). At the southwestern border of the Bay, the impact of water rising is very distinct at Kamen Opasnosti, where nitrite N-NO2 values make > 2 µg/L.
The highest concentrations of nitrites are registered at the end of summer and autumn, when the newly formed organic matter decomposes actively and photosynthesis slows down. At the same time, higher values of inorganic nitrogen forms, coming from the activated process of organic matter decomposition, may indicate water pollution. As follows from the conditions of nitrification, a considerable increase in intermediate products of oxidation should be registered under oxygen deficit. It preconditions the peculiar feature of the vertical distribution of ammonia nitrogen and nitrite—the subsurface maximum under the photosynthesis zone, where oxygen concentration drops sharply. In open deepwater areas, there is a thermodynamical tendency for turning all forms of nitrogen into nitrates, so in deep layers, only final compounds of oxidation and mineralization of organic matter are accumulated [39].
In summer, on the surface, the spatial picture of nitrite N-NO2 remains the same, but their concentration in upwelling zones grows up to 2.5–4 µg/L (Figure 16). Meanwhile, the center of anticyclonic eddy is manifested more clearly from the nitrite N-NO2 minimum (>0.5 µg/L) compared to other inorganic nutrients. The center is visible not only on the surface, where water goes down, but also located at deeper depths [43]. The character of the spatial distribution of nitrites at the 50 m depth logically matches the distribution of other parameters, since their vertical distribution is defined by biochemical processes of assimilation and regeneration of biogenic elements, as well as the presence of quasi-stationary eddy formations.

5. Discussion

As was shown in [72], the Aniva Bay basin is occupied by a subarctic water mass. In the warm season, it is represented by a subsurface Sea of Okhotsk water mass of summer modification and the very Sea of Okhotsk water mass (SOWM). In the cold season, it is only SOWM. The La Perouse Strait basin, which includes Aniva Bay, contains the surface Pacific water mass in the form of the Soya Current all year round (part of the subtropical water mass of the Sea of Japan). The subarctic water structure occupies from 60% (in May) to 90% (in November) of the strait. Between the mentioned structures, there is a distinct border throughout the year, but it does not stop the interpenetration of water masses under certain hydrological conditions, which makes the hydrological and HCh regime of both La Perouse Strait and Aniva Bay much more complicated.
Seemingly, there is enough data for the analysis of the HCh regime in Aniva Bay (we used data from more than 600 stations for oxygen and about 300 for biogenic elements); however, these measurements are spaced in time very inhomogeneously. Oceanographic expeditions were in different years on different dates, so it does not seem possible to reconstruct the annual cycle of parameters correctly with statistical methods. The number of measurements also changes greatly from year to year (from 1981 to 1987, there were fewer observations than in other years) (Figure 17). Hence, it is not possible to obtain trustworthy climatic norms for the studied parameters for the time intervals recommended by the World Meteorological Organization [83], since an uneven number of observations in separate years influences the mean values of calculated parameters.
The question of statistical analysis of raw data, especially if they are distributed unevenly in space and time, is always controversial. However, the method chosen here of objective interpolation with a running average proves its consistency in the example of correct results of the combined hydroecological CNPSi model and the oceanographic model of Bergen University [84,85,86].
In the future, it is assumed that simulations should be carried out within the works on carbon polygon, with reviewed input data and three models applied: a new version of “ATLAS”-2018 [68], a new version of CNPSi-model [87], and a more actual, compared to the oceanographic model of Princeton University [88].
Still, the lack of field observations in the cold season does not permit us to evaluate the “sea breath” during the ice cover settling and melting, which has been seriously underestimated just recently [56,57]. The analysis of all-year-round variations of inorganic nutrients and NF concentrations is crucial for the understanding of biohydrochemical patterns of their transformation, specific features of spatial distribution and the formation of plankton communities that define the CO2 absorption. That is why it is essential to assess the hydrochemical water conditions as a basis for the experimental carbon site and the evaluation of carbon emission and absorption. Inorganic nutrient concentrations can even be used to identify water masses, which has not been completed yet for the studied water basin.
Also important is the issue of the increasing anthropogenic impact that occurs as a result of the industrial development of the Sakhalin region. The construction of a liquefied natural gas terminal, the development of related infrastructure, and a large number of tourists—all these factors will lead to a change in the balance of the ecosystem.
It is also necessary to mention important works related to the use of various nanorods for the conversion of CO2, which subsequently leads to the restoration of the environment [89,90].
Our results showed that the availability of nutrients is sufficient for the mass placement of mariculture marine farms in the coastal zone of Aniva Bay. It is especially important we are shown that the areas with the maximum nutrient run-off (mineral phosphorus and nitrogen) are Salmon Bay and the east coast. It is a better site for sanitary seaweed plantations for wastewater treatment or rapid absorption of CO2 from the atmosphere [91]. Our calculations show that when growing brown algae Saccharina japonica in Aniva Bay for the purpose of decarbonization, it is possible to additionally sequestrate up to 49.5 thousand tons of C [86]. Successful cultivation of algae, their timely removal from the environment (before the destruction of the thallus) and the production of biochar from them with further industrial use [92,93,94] will increase the absorption of CO2 from the atmosphere and have a positive impact on the carbon balance of the entire region. Experimental measurements of CO2 fluxes in the area of mariculture farms have shown a noticeable photosynthetic absorption of CO2 from the environment [95,96,97,98].
The authors are not aware of any works with analysis of long-run seasonal variations of concentrations of organic and inorganic nutrient fractions in the Sakhalin shelf water basins. When hydrochemical research of the World Ocean was on the rise in the 1970s due to a new instrumental base, Aniva Bay was an internal body of water. Then, the introduction of a 200-mile economic zone in 1979 made it practically inaccessible for international researchers. All studies conducted by the manages of the Sakhalin shelf projects were strictly formalized and the research results are their property. So, in our calculations, we used only (mostly) open access national observation materials. Thus, the analysis of instrumental observations data and numerical simulation results presented here can be recommended for the baseline evaluation and calculation of carbon emissions on the carbon site in Aniva Bay.
The authors understand that field data from the analysis of hydrochemical parameters have limitations and uncertainties in assessing greenhouse gas emissions from marine ecosystems.
The greatest uncertainty in estimating fluxes GHGs by field research data comes from sampling conditions and spatial–temporal variability of hydrochemical parameters: sampling time, depth, surface insolation, waves, tidal phase, time after rain or storm, and other natural parameters. Sampling difficulty from large areas in a short time period and sampling inability during the ice period also limit the use of direct field data to calculate the annual balance of GHGs. Some greenhouse gases, like methane, can be challenging to quantify accurately using only hydrochemical data (bacterioplankton investigation is needed).
Climate change has made it impossible to use a long historical series of direct hydrochemical observations to assess the current state of the carbon balance of marine ecosystems.
We would like to show the several alternative approaches to flux GHG estimation used by scientific groups:
-
In situ gas sensors and continuous monitoring systems (including eddy covariance techniques) on ocean platforms, vessels, and ferries can provide real-time data on gas emissions more effectively than discrete sampling;
-
Biomolecular marker techniques like DNA-based analyses or genetic markers can identify specific microbial communities responsible for greenhouse gas production, offering insights into potential emission sources;
-
Isotope tracing methods can trace the origin and transformation of greenhouse gases, providing insights into their production pathways and helping quantify emissions more accurately;
-
Remote sensing and imaging spectral investigations by unmanned aerial vehicles and satellite-based remote sensing technologies offer broad coverage and continuous monitoring of large marine areas;
-
Integrated modeling approaches with machine learning techniques.

6. Conclusions

This study is a comprehensive analysis of a great number of published materials regarding hydrochemistry in Aniva Bay and the Sea of Okhotsk. Apart from the literature review, we analyzed the diagrams of the annual cycle of long-run mean hydrochemical values in Aniva Bay from averaged data of r/v observations with a time step of 5 days. It allowed us to not only confirm the main features of the hydrochemical regime described earlier [43], but to add significant details to this picture.
The annual cycle of dissolved oxygen (especially in surface layers) is negatively related to the water temperature and, basically, so are their mirror reflections. The main maximum is observed in spring (>9.3 mg/L or >114% at the 10 m depth) after ice melting in the bay, and the main minimum (<5.6 mg/L or <97% on the surface) in the beginning of September. A more detailed analysis in the upper 30 m layer reveals a local minimum in mid-July and a local maximum in the first half of August. In the central part of the bay, a maximum of oxygen is observed at the horizon of 20 m, probably caused by eddy dynamics.
The following features are observed in the annual pH cycle for all depths: maximums 8.25–8.26 in April–May, September, and November; minimum in August. The local pH maximum in the euphotic layer (8.22) is formed in July and is a consequence of additional inorganic nutrient inflow with precipitation and increased rate of CO2 absorption during short-term active photosynthesis.
The annual cycle of phosphates in Aniva Bay is characterized by winter maximum (>19 µg/L on the surface, >47 µg/L on the 50 m depth) and summer minimum (<10 µg/L on the surface, <40 µg/L on the 50 m depth). A more detailed analysis demonstrates two local maximums: in the second half of June in the 0–50 m layer (comparable to winter maximum in absolute values) and in mid-August (comparable to winter maximum in absolute values on the 0–20 m depth and exceeding it by 20–30% in the 30–50 m depth).
There are two maximums of silica concentrations at the end of June and the beginning of September. Mean values are >340 µg/L on the surface and >800 µg/L on the 50 m depth. The main minimum is in mid-August with <70 µg/L on the surface and ~640 µg/L on the 50 m depth.
The summer maximum nitrites concentrations in the 0–50 m layer have average values of >2 µg/L in mid-June on the surface and >3.5 µg/L on the 50 m depth in mid-September. Its temporal scale matches the pH and silica minimums, as well as the maximum in the year’s cycle of phosphates and a local oxygen maximum.
Hence, this study presents the analysis of the data from instrumental observations of hydrochemical parameters for the previous climatic period. It is an important step towards the assessment of the carbon balance in Aniva Bay, chosen as the carbon site in Sakhalin Oblast. The performed data unification minimizes errors of further numerical calculations of baseline absorption and emission of carbon in Aniva Bay.
The obtained results can be used to study the ecological state of coastal waters, the carbon cycle and the GHG analysis in other water areas. As recommendations for politicians, businesspersons and scientists, we can offer the following basic approaches: complex approach including simultaneously measuring meteorological, hydrological and biohydrochemical parameters; using the autonomous stations for continuous monitoring; uniform measurement standards; and involvement of scientists and high-level specialists. These approaches will make it possible to implement both environmental and business projects related to the environmental sustainability of the coastal zone, the carbon cycle, mariculture, transport and recreation.
The obtained results systematize and significantly complement previously performed studies. Based on our results, expeditionary research in Aniva Bay can be planned, and an important practical significance is the use of our results for the research and validation of biogeochemical models.
Knowledge of seasonal and spatial variability of hydrochemical parameters in the water area of Aniva Bay, jointly with data on hydrological factors (water circulation, ice conditions, etc.), is a very important factor when choosing a location for the construction of a carbon landfill, carbon farms and other marine facilities, as well as for calculating various risks associated with carbon emissions.

Author Contributions

The concept of this study was developed by V.P. and V.A. conducted numerical simulations. V.P., E.L., S.M. and V.A. carried out analysis, visualization, and manuscript writing. All authors have read and agreed to the published version of the manuscript.

Funding

This work is funded by the Ministry of Science and Higher Education of Russia, under the theme “Carbon balance of biomorpholithosystems of the coast and adjacent marine areas of the marginal seas of the Far East”, FEFF-2022-0027, Sakhalin State University.

Institutional Review Board Statement

Not applicable.

Informed Consent Statement

Not applicable.

Data Availability Statement

Data available on request due to privacy restrictions.

Conflicts of Interest

The authors declare that the research was conducted in the absence of any commercial or financial relationships that could be considered potential conflicts of interest.

References

  1. Shcherbanin, Y.A.; Golyzhnikova, D.Y. Export Cargo Flows via Russian Maritime Ports: Oil Cargo—Some Considerations) (30 April 2019). Russ. Foreign Econ. J. 2019, 4, 18–36. Available online: https://ssrn.com/abstract=3973394 (accessed on 20 February 2024).
  2. Aminina, N.M.; Vishnevskaya, T.I.; Galanin, D.A.; Repnikova, A.R.; Guruleva, O.N. Description of Saccharina japonica commercial stock in the Aniva Bay (Okhotsk Sea). Izvestiya TINRO 2014, 178, 116–123. [Google Scholar] [CrossRef]
  3. Maslennikov, S.I. Marine Biological Resources in the Far Eastern Coast: Their Rational Use from Ecological and Economic Viewpoints. In Energy and Environment in Slavic Eurasia: Toward the Establishment of the Network of Environmental Studies in the Pan-Okhotsk Region; Slavik Research Center, Hokkaido University: Sapporo, Japan, 2008; pp. 89–125. [Google Scholar]
  4. Ricour, F.; Guidi, L.; Gehlen, M.; DeVries, T.; Legendre, L. Century-scale carbon sequestration flux throughout the ocean by the biological pump. Nat. Geosci. 2023, 16, 1105–1113. [Google Scholar] [CrossRef]
  5. Claustre, H.; Legendre, L.; Boyd, P.W.; Levy, M. The Oceans’ Biological Carbon Pumps: Framework for a Research Observational Community Approach. Front. Mar. Sci. 2021, 8, 780052. [Google Scholar] [CrossRef]
  6. Pipko, I.I.; Pugach, S.P.; Luchin, V.A.; Francis, O.P.; Savelieva, N.I.; Charkin, A.N.; Dudarev, O.V.; Semiletov, I.P. Surface CO2 system dynamics in the Gulf of Anadyr during the open water season. Cont. Shelf Res. 2021, 217, 104371. [Google Scholar] [CrossRef]
  7. Carbon Supersites. Available online: https://carbon-polygons.ru/en/ (accessed on 20 February 2024).
  8. Report on the Inventory of Anthropogenic Emissions by Sources and Removals by Sinks of Greenhouse Gases in the Sakhalin Region for 2019–2021. IGC&E. 2021. Available online: https://ecology.sakhalin.gov.ru/fileadmin/user_upload/Doklad_o_kadastre_Sakhalinskoi_oblasti_za_2019_g.pdf (accessed on 20 February 2024).
  9. Abakumov, E.; Polyakov, V. Carbon polygons and carbon offsets: Current state, key challenges and pedological aspects. Agronomy 2021, 11, 2013. [Google Scholar] [CrossRef]
  10. Fourqurean, J.W.; Duarte, C.M.; Kennedy, H.; Marbà, N.; Holmer, M.; Mateo, M.A.; Apostolaki, E.T.; Kendrick, G.A.; Krause-Jensen, D.; McGlathery, K.J.; et al. Seagrass ecosystems as a globally significant carbon stock. Nat. Geosci. 2012, 5, 505–509. [Google Scholar] [CrossRef]
  11. Pendleton, L.; Donato, D.C.; Murray, B.C.; Crooks, S.; Jenkins, W.A.; Sifleet, S.D.; Craft, C.B.; Fourqurean, J.W.; Kauffman, J.B.; Marbà, N.; et al. Estimating Global “Blue Carbon” Emissions from Conversion and Degradation of Vegetated Coastal Ecosystems. PLoS ONE 2012, 7, e043542. [Google Scholar] [CrossRef] [PubMed]
  12. Duarte, C.M.; Losada, I.J.; Hendriks, I.E.; Mazarrasa, I.; Marbà, N. The role of coastal plant communities for climate change mitigation and adaptation. Nat. Clim. Change 2013, 3, 961–968. [Google Scholar] [CrossRef]
  13. Sondak, C.F.A.; Chung, I.K. Potential blue carbon from coastal ecosystems in the Republic of Korea. Ocean Sci. J. 2015, 50, 1–8. [Google Scholar] [CrossRef]
  14. Pessarrodona, A.; Moore, P.J.; Sayer, M.D.J.; Smale, D.A. Carbon assimilation and transfer through kelp forests in the NE Atlantic is diminished under a warmer ocean climate. Glob. Change Biol. 2018, 24, 4386–4398. [Google Scholar] [CrossRef]
  15. Afanas’ev, V.V.; Latkovskaya, E.M.; Uba, A.V.; Levitsky, A.I. Carbon Sequestration in the Coastal Marine Biomorpholithosystems of the Salmon Bay of Aniva Bay. In Physical and Mathematical Modeling of Earth and Environment Processes—2022, PMMEEP 2022; Karev, V.I., Ed.; Springer Proceedings in Earth and Environmental Sciences; Springer: Cham, Switzerland, 2023. [Google Scholar] [CrossRef]
  16. Zhong, C.; Li, T.; Bi, R.; Sanganyado, E.; Huang, J.; Jiang, S.; Zhang, Z.; Du, H. A systematic overview, trends and global perspectives on blue carbon: A bibliometric study (2003–2021). Ecol. Indic. 2023, 148, 110063. [Google Scholar] [CrossRef]
  17. Wang, Y.; Yang, W.; Cai, Y.; Fang, Z.; Zhao, X.; Zhang, Q.; Yuan, H.; Lin, N.; Zou, C.; Zheng, M. Macroalgae culture–induced carbon sink in a large cultivation area of China. Environ. Sci. Pollut. Res. 2023, 30, 107693–107702. [Google Scholar] [CrossRef] [PubMed]
  18. Tang, Q.; Zhang, J.; Fang, J. Shellfish and seaweed mariculture increase atmospheric CO2 absorption by coastal ecosystems. Mar. Ecol. Prog. Ser. 2011, 424, 97–104. [Google Scholar] [CrossRef]
  19. Lai, Q.; Ma, J.; He, F.; Zhang, A.; Pei, D.; Yu, M. Current and Future Potential of Shellfish and Algae Mariculture Carbon Sinks in China. Int. J. Environ. Res. Public Health 2022, 19, 8873. [Google Scholar] [CrossRef] [PubMed]
  20. Park, J.-S.; Shin, S.K.; Wu, H.; Yarish, C.; Yoo, H.I.; Kim, J.K. Evaluation of nutrient bioextraction by seaweed and shellfish aquaculture in Korea. J. World Aquac. Soc. 2021, 52, 1118–1134. [Google Scholar] [CrossRef]
  21. Myers, C.R.; Subban, C.V. Ocean Deacidification Technologies for Marine Aquaculture. J. Mar. Sci. Eng. 2022, 10, 523. [Google Scholar] [CrossRef]
  22. Troell, M.; Henriksson, P.J.G.; Buschmann, A.H.; Chopin, T.; Quahe, S. Farming the Ocean—Seaweeds as a Quick Fix for the Climate? Rev. Fish. Sci. Aquac. 2023, 31, 285–295. [Google Scholar] [CrossRef]
  23. Gu, Y.; Lyu, S.; Wang, L.; Chen, Z.; Wang, X. Assessing the carbon sink capacity of coastal mariculture shellfish resources in China from 1981–2020. Front. Mar. Sci. 2022, 9, 981569. [Google Scholar] [CrossRef]
  24. Campbell, I.; Macleod, A.; Sahlmann, C.; Neves, L.; Funderud, J.; Øverland, M.; Hughes, A.D.; Stanley, M. The Environmental Risks Associated With the Development of Seaweed Farming in Europe—Prioritizing Key Knowledge Gaps. Front. Mar. Sci. 2019, 6, 107. [Google Scholar] [CrossRef]
  25. Romanyuk, V.A.; Pishchalnik, V.M.; Shumilov, I.V. Features of the ice regime of Aniva Bay (Sea of Okhotsk) as a risk factor in the planning of mariculture farms. Process. GeoMedia 2022, 4, 1820–1826. [Google Scholar]
  26. García-Poza, S.; Leandro, A.; Cotas, C.; Cotas, J.; Marques, J.C.; Pereira, L.; Gonçalves, A.M.M. The Evolution Road of Seaweed Aquaculture: Cultivation Technologies and the Industry 4.0. Int. J. Environ. Res. Public Health 2020, 17, 6528. [Google Scholar] [CrossRef] [PubMed]
  27. Bhuyan, M.S. Ecological risks associated with seaweed cultivation and identifying risk minimization approaches. Algal Res. 2023, 69, 102967. [Google Scholar] [CrossRef]
  28. Aldridge, J.N.; Mooney, K.; Dabrowski, T.; Capuzzo, E. Modelling effects of seaweed aquaculture on phytoplankton and mussel production. Application to Strangford Lough (Northern Ireland). Aquaculture 2021, 536, 736400. [Google Scholar] [CrossRef]
  29. Cakmak, E.K.; Hartl, M.; Kisser, J.; Cetecioglu, Z. Phosphorus mining from eutrophic marine environment towards a blue economy: The role of bio-based applications. Water Res. 2022, 219, 118505. [Google Scholar] [CrossRef] [PubMed]
  30. Orekhova, N.A.; Konovalov, S.K.; Polukhin, A.A.; Seliverstova, A.M. Oxygen and pCO2 in the Surface Waters of the Atlantic Southern Ocean in 2021–2022. Water 2023, 15, 1642. [Google Scholar] [CrossRef]
  31. Schulz, K.G.; Maher, D.T. Atmospheric Carbon Dioxide and Changing Ocean Chemistry. In Marine Pollution—Monitoring, Management and Mitigation. Springer Textbooks in Earth Sciences, Geography and Environment; Reichelt-Brushett, A., Ed.; Springer: Cham, Switzerland, 2023. [Google Scholar] [CrossRef]
  32. Xue, Z.; He, R.; Fennel, K.; Cai, W.-J.; Lohrenz, S.; Huang, W.-J.; Tian, H.; Ren, W.; Zang, Z. Modeling pCO2 variability in the Gulf of Mexico. Biogeosciences 2016, 13, 4359–4377. [Google Scholar] [CrossRef]
  33. Luo, X.; Wei, H.; Liu, Z.; Zhao, L. Seasonal variability of air-SEA CO2 fluxes in the yellow and east China Seas: A case study of continental shelf SEA carbon cycle model. Cont. Shelf Res. 2015, 107, 69–78. [Google Scholar] [CrossRef]
  34. Lu, Z.; Gan, J.; Dai, M. Modeling seasonal and diurnal pCO2 variations in the northern South China Sea. J. Mar. Syst. 2012, 92, 30–41. [Google Scholar] [CrossRef]
  35. Leonov, A.V.; Pishchal’nik, V.M.; Petukhov, V.I.; Petrova, E.A.; Chicherina, O.V. Biohydrochemical Studies of the Intra-Annual Nutrient Dynamics in the Northeastern Shelf Waters of the Sakhalin Island. IOP Conf. Ser. Earth Environ. Sci. 2019, 272, 032241. [Google Scholar] [CrossRef]
  36. Ostrovskii, A.G.; Emelianov, M.V.; Kochetov, O.Y.; Kremenetskiy, V.V.; Shvoev, D.A.; Volkov, S.V.; Zatsepin, A.G.; Korovchinsky, N.M.; Olshanskiy, V.M.; Olchev, A.V. Automated Tethered Profiler for Hydrophysical and Bio-Optical Measurements in the Black Sea Carbon Observational Site. J. Mar. Sci. Eng. 2022, 10, 322. [Google Scholar] [CrossRef]
  37. State Standard GOST 17.1.3.08-82; State Committee of the USSR for Standards. Nature Protection. Hydrosphere. Procedures for Quality Control of Marine Waters. IPK Izdatelstvo Standartov: Moscow, Russia, 1982; 6p. (In Russian)
  38. Hydrometeorological Conditions and Oceanological Basis of the Formation of Bioproductivity. In Hydrometeorology and Hydrochemistry of the Seas, Vol. 9: Sea of Okhotsk, Issue 2; (In Russian). Terziev, F.S. (Ed.) Gidrometeoizdat: St. Petersburg, Russia, 1993. [Google Scholar]
  39. Sapozhnikov, V.V. New perceptions of the functioning of the Okhotsk Sea ecosystem. In Complex Studies of the Okhotsk Sea Ecosystem; VNIRO: Moscow, Russia, 1997; pp. 5–7. (In Russian) [Google Scholar]
  40. Pishchalnik, V.M.; Bobkov, A.O. Author’s Certificate for Software Application “ATLAS”; No. 930078; RosAPO: Moscow, Russia, 1993. (In Russian) [Google Scholar]
  41. Pischalnik, V.M.; Bobkov, A.O. Oceanographic Atlas of Sakhalin Shelf. Part 1 and 2; SakhGU: Yuzhno-Sakhalinsk, Russia, 2000. [Google Scholar]
  42. Pishchal’nik, V.M.; Bobkov, A.O. Modeling Natural Processes Based on “Sakhalinskii Shel’f” GIS; SakhGU: Yuzhno-Sakhalinsk, Russia, 2008. [Google Scholar]
  43. Pischalnik, V.M.; Bobkov, A.O. Digital Technologies for Modeling Natural Processes; SakhGU: Yuzhno-Sakhalinsk, Russia, 2020; p. 164. [Google Scholar]
  44. Koreneva, T.G.; Latkovskaya, E.M. Characterization of the variability of waters in Aniva Bay based on phytoplankton pigment content. Voda Khim. Ekol. 2013, 10, 68–78. (In Russian) [Google Scholar]
  45. Koreneva, T.G.; Latkovskaya, E.M.; Chastikov, V.N. Seasonal dynamics of hydrological and hydrochemical characteristics and chlorophyll a concentration in Aniva Bay in 2003. Voda Khim. Ekol. 2014, 4, 33–45. (In Russian) [Google Scholar]
  46. Mogilnikova, T.A.; Polteva, A.V.; Latkovskaya, E.M.; Leonov, A.V.; Pokrashenko, S.A.; Pishchalnik, V.M. Sea-Ice and Under-Ice Microalgae and Heterotrophic Bacteria: Evolution in Sakhalin Island Coastal Waters; REA Special Issue №1; Dalnauka: Vladivostok, Russia, 2009; pp. 129–145. (In Russian) [Google Scholar]
  47. Kantakov, G.A.; Stonik, I.V.; Selina, M.S.; Orlova, T.Y. Advection, vertical stability of waters and features of phytoplankton existential distribution in Aniva Bay of the Okhotsk Sea during 2001–2003. Trudy SakhNIRO. 2007, 9, 295–324. (In Russian) [Google Scholar]
  48. Kas’kova, V.O.; PoIteva, A.V.; Latkovskaya, E.M. Seasonal dynamics of petroleum products concentration and petroleum-oxidizing microorganisms abundance in the coastal zone of Aniva Bay. Trudy SakhNIRO. 2005, 7, 375–384. (In Russian) [Google Scholar]
  49. Propp, L.N.; Gavrina, L.Y.H. Seasonal variations of compound nutrients and productional characteristics in the Aniva Bay waters by the results of expeditional reserches in 2001–2021. Trudy SakhNIRO. 2005, 7, 111–155. (In Russian) [Google Scholar]
  50. Chen, C.-T.; Yu, S.; Huang, T.-H.; Bai, Y.; He, X. Changes in Temperature, Chlorophyll Concentration, and Secchi Disk Depth in the Okhotsk Sea from 1998 to 2016. In Changing Asia-Pacific Marginal Seas; Chen, C.T.A., Guo, X.Y., Eds.; Springer: Singapore, 2020; pp. 57–68. [Google Scholar] [CrossRef]
  51. Chen, C.-T.; Yu, S.; Huang, T.-H.; Bai, Y.; He, X.; Lui, H.-K. Temperature and Secchi Disk Depth Increase More Rapidly in the Subpolar Bering/Okhotsk Seas Than in the Subtropical South China Sea. Water 2023, 15, 98. [Google Scholar] [CrossRef]
  52. Nakanowatari, T.; Mitsudera, H. Long-term trend and interannual to decadal variability in the Sea of Okhotsk. In Changing Asia-Pacific Marginal Seas; Chen, C.T.A., Guo, X.Y., Eds.; Springer: Singapore, 2020; pp. 19–56. [Google Scholar] [CrossRef]
  53. Nishioka, J.; Mitsudera, H.; Yasuda, I.; Liu, H.; Nakatsuka, T.; Volkov, Y.N. Biogeochemical and physical processes in the Sea of Okhotsk and the linkage to the Pacific ocean. Prog. Oceanogr. 2014, 126, 1–7. [Google Scholar] [CrossRef]
  54. Sato, T.; Shiozaki, T.; Taniuchi, Y.; Kasai, H.; Takahashi, K. Nitrogen fixation and diazotroph community in the subarctic Sea of Japan and Sea of Okhotsk. J. Geophys. Res. Ocean. 2021, 126, e2020JC017071. [Google Scholar] [CrossRef]
  55. Granskog, M.A.; Nomura, D.; Müller, S.; Krell, A.; Toyota, T.; Hattori, H. Evidence for significant protein-like dissolved organic matter accumulation in Sea of Okhotsk sea ice. Ann. Glaciol. 2015, 56, 1–8. [Google Scholar] [CrossRef]
  56. Ardyna, M.; Mundy, C.J.; Mayot, N.; Matthes, L.C.; Oziel, L.; Horvat, C.; Leu, E.; Assmy, P.; Hill, V.; Matrai, P.A.; et al. Under-Ice Phytoplankton Blooms: Shedding Light on the “Invisible” Part of Arctic Primary Production. Front. Mar. Sci. 2020, 7, 608032. [Google Scholar] [CrossRef]
  57. Yan, D.; Yoshida, K.; Nishioka, J.; Ito, M.; Toyota, T.; Suzuki, K. Response to Sea Ice Melt Indicates High Seeding Potential of the Ice Diatom Thalassiosira to Spring Phytoplankton Blooms: A Laboratory Study on an Ice Algal Community From the Sea of Okhotsk. Front. Mar. Sci. 2020, 7, 613. [Google Scholar] [CrossRef]
  58. Wakita, M.; Watanabe, Y.W.; Watanabe, S.; Noriki, S.; Wakatsuchi, M. Oceanic uptake rate of anthropogenic CO2 in a subpolar marginal sea: The Sea of Okhotsk. Geophys. Res. Lett. 2003, 30, 2252. [Google Scholar] [CrossRef]
  59. Tishchenko, P.Y.; Lobanov, V.B.; Semkin, P.Y.; Sergeev, A.F.; Anisimova, E.V.; Barabanshchikov, Y.A.; Melnikov, V.V.; Ryumina, A.A.; Sagalaev, S.G.; Ulanova, O.A.; et al. Hydrochemical Study of Academy Bay (Sea of Okhotsk). Oceanology 2022, 62, 80–92. [Google Scholar] [CrossRef]
  60. Sapozhnikov, V. Hydrochemical Atlas of the Sea of Okhotsk, International Ocean Atlas Series, Volume 3, Russian Federal Institute of Fisheries and Oceanography; Bremerhaven, PANGAEA: Moscow, Russia, 2001. [Google Scholar]
  61. Nedashkovsky, A.P.; Khen, G.V.; Savelieva, N.I. Chemical patterns of the TINRO Basin (Okhotsk Sea) in abnormally cold years. Izvestiya TINRO 2018, 194, 86–98. (In Russian) [Google Scholar] [CrossRef]
  62. Sasano, D.; Takatani, Y.; Kosugi, N.; Nakano, T.; Midorikawa, T.; Ishii, M. Multidecadal trends of oxygen and their controlling factors in the western North Pacific. Glob. Biogeochem. Cycles 2015, 29, 935–956. [Google Scholar] [CrossRef]
  63. Gordeev, E.I.; Girina, O.A.; Lupyan, E.A.; Sorokin, A.A.; Kramareva, L.S.; Efremov, V.Y.; Kashnitskii, A.V.; Uvarov, I.A.; Burtsev, M.A.; Romanova, I.M.; et al. The VolSatView information system for Monitoring the Volcanic Activity in Kamchatka and on the Kuril Islands. J. Volcanolog. Seismol. 2016, 10, 382–394. [Google Scholar] [CrossRef]
  64. Apollaro, C.; Fuoco, I.; Gennaro, E.; Giuliani, L.; Iezzi, G.; Marini, L.; Radica, F.; Di Luccio, F.; Ventura, G.; Vespasiano, G. Advanced argillic alteration at Cave di Caolino, Lipari, Aeolian Islands (Italy): Implications for the mitigation of volcanic risks and the exploitation of geothermal resources. Sci. Total Environ. 2023, 889, 164333. [Google Scholar] [CrossRef] [PubMed]
  65. Chen, M.; Zhang, Y.; Liu, S.; Zhao, C.; Dong, S.; Song, Y. CO2 transport and carbonate precipitation in the coupled diffusion-reaction process during CO2 storage. Fuel 2023, 334, 126805. [Google Scholar] [CrossRef]
  66. Kawasaki, K.; Tachibana, Y.; Nakamura, T.; Yamazaki, K. Role of the cold Okhotsk sea on the climate of the North Pacific subtropical high and Baiu precipitation. J. Clim. 2021, 34, 495–507. [Google Scholar] [CrossRef]
  67. Sohrin, R.; Imanishi, K.; Suzuki, Y.; Kuma, K.; Yasuda, I.; Suzuki, K.; Nakatsuka, T. Distributions of dissolved organic carbon and nitrogen in the western Okhotsk Sea and their effluxes to the North Pacific. Prog. Oceanogr. 2014, 126, 168–179. [Google Scholar] [CrossRef]
  68. Pishchalnik, V.M.; Bobkov, A.O. Author’s Certificate for Software Application “ATLAS-2018”; No. 2019665674; RosAPO: Moscow, Russia, 2019. [Google Scholar]
  69. Pishchal’nik, V.M.; Leonov, A.V. Studying the Ecosystem Functioning Conditionsin Aniva Bay—La Perouse Strait. Water Resour. 2003, 30, 569–588. [Google Scholar] [CrossRef]
  70. Leonov, A.V.; Pishchal’nik, V.M. Biotransformation of Organogenic Substances in the Aniva Bay Waters: Assessment with the Use of Mathematical Modeling. Water Resour. 2005, 32, 508–523. [Google Scholar] [CrossRef]
  71. Leonov, A.V.; Pishchal’nik, V.M. Analysis of Conditions of Petroleum Hydrocarbon Transformations in Seawater and Simulation of This Process in Aniva Bay. Water Resour. 2005, 32, 653–666. [Google Scholar] [CrossRef]
  72. Pishchal’nik, V.M.; Arkhipkin, V.S.; Leonov, A.V. Thermohaline Analysis of the La Perouse Strait Water. Water Resour. 2005, 32, 13–22. [Google Scholar] [CrossRef]
  73. Propp, L.N.; Gavrina, L.Y. Seasonal variations of hydrological and hydrochemical parameters and chlorophyll-a in the La Perouse (Soya) Strait and adjacent regions of the Sea of Okhotsk and Japan Sea in 1996–1997). Trudy SahNIRO 2019, 15, 243–279. [Google Scholar]
  74. RD 52.10.243-92. Guidance Document 52.10.243-92: Guidelines for the Chemical Analysis of Sea Waters; SG Oradovsky (Ed.) SPb.: Gidrometeoizdat, Russia, 1993; 264p. (In Russian) [Google Scholar]
  75. Alekin, O.A.; Lyahin, Y.I. Ocean Chemistry; Gidrometeoizdat Publ.: Leningrad, Russia, 1984; 343p. (In Russian) [Google Scholar]
  76. Research and Applied USSR Climate Reference Book No 3. Part 1–6, V. 13; Gidrometeoizdat: Leningrad, Russia, 1990; 724p. (In Russian)
  77. Alekin, O.A. Basics of Hydrochemistry; Gidrometeoizdat Publ.: Leningrad, Russia, 1970; 444p. (In Russian) [Google Scholar]
  78. Arzhanova, N.V.; Zubarevich, V.L. Chemical Basis of Bioproductivity of the Sea of Okhotsk. In Complex Studies of the Okhotsk Sea Ecosystem; VNIRO: Moscow, Russia, 1997; pp. 86–92. [Google Scholar]
  79. Redfield, S. The Influence of Organisms on the Composition of Seawater; Redfield, S., Ketchum, B.H., Richards, F.A., Eds.; The Sea New York: New York, NY, USA, 1963; Volume 2, pp. 26–77. [Google Scholar]
  80. Arzhanova, N.V.; Zubarevich, V.L. Seasonal Changes in Nutrient Contents in the Sea of Okhotsk as a Base for Estimation of the Phytoplankton Production. In Complex Studies of the Ecosystem of the Sea of Okhotsk; Sapozhnikov, V.V., Ed.; VNIRO: Moscow, Russia, 1997; pp. 92–97. (In Russian) [Google Scholar]
  81. Bruevich, S.V. Chemistry of the Pacific Ocean; Nauka: Moscow, Russia, 1966; 360p. (In Russian) [Google Scholar]
  82. Sapozhnikov, V.V. Formation of the Basic Salt Composition of Seawater and Its Physico-Chemical Properties in “The Pacific Ocean”; Mysl’: Moscow, Russia, 1982. (In Russian) [Google Scholar]
  83. WMO. Guidelines on the Calculation of Climate Normals; WMO: Geneva, Switzerland, 2017; Available online: https://library.wmo.int/opac/doc_num.php?explnum_id=4166 (accessed on 18 January 2018).
  84. Pishchal’nik, V.M.; Arkhipkin, V.S.; Leonov, A.V. Reconstruction of the Annual Variations of Thermohaline Characteristics and Water Circulation on the Northeastern Sakhalin Shelf. Water Resour. 2014, 41, 385–395. [Google Scholar] [CrossRef]
  85. Pishchalnik, V.M.; Arkhipkin, V.S.; Leonov, A.V. Modeling mean month thermohaline patterns and water circulation on southwestern shelf of Sakhalin. Izvestiya TINRO 2017, 191, 160–175. (In Russian) [Google Scholar] [CrossRef]
  86. Leonov, A.V.; Arkhipkin, V.S.; Pishchalnik, V.M.; Latkovskaya, E.M. Modeling the dynamics of dissolved oxygen concentration in waters of the Aniva bay (the Sea of Okhotsk). Lomonosov Geogr. J. 2023, 78, 77–85. [Google Scholar] [CrossRef]
  87. Leonov, A.V. Modeling of Natural Processes Based on the Simulation Hydrogeoecological Model of Transformations of S, N, P, and Si Compounds: An Educational Aid; SakhGU: Yuzhno-Sakhalinsk, Russia, 2012. (In Russian) [Google Scholar]
  88. Blumberg, A.F.; Mellor, G.L. A Description of a Three-Dimensional Coastal Ocean Circulation Model. In Coastal and Estuarine Sciences; AGU: Washington, DC, USA, 1987; pp. 1–16. [Google Scholar]
  89. Khan, I.; Yuan, A.; Khan, S.; Khan, A.; Khan, S.; Shah, S.; Luo, M.S.; Yaseen, W.; Shen, X.; Yaseen, M. Graphitic Carbon Nitride Composites with Gold and ZIF-67 Nanoparticles as Visible-Light-Promoted Catalysts for CO2 Conversion and Bisphenol A Degradation. ACS Appl. Nano Mater. 2022, 5, 13404–13416. [Google Scholar] [CrossRef]
  90. Khan, I.; Kang, K.; Khan, A.; Jiyuan, G.; Khan, S.; Khan, S.; Basir, A.; Sadiq, S. Efficient CO2 conversion and organic pollutants degradation over Sm3+ doped and rutile TiO2 nanorods decorated-GdFeO3 nanorods. Int. J. Hydrogen Energy 2023, 48, 32756–32770. [Google Scholar] [CrossRef]
  91. Spillias, S.; Valin, H.; Batka, M.; Sperling, F.; Havlík, P.; Leclère, D.; Cottrell, R.S.; O’brien, K.R.; McDonald-Madden, E. Reducing global land-use pressures with seaweed farming. Nat. Sustain. 2023, 6, 380–390. [Google Scholar] [CrossRef]
  92. Belmesov, A.A.; Glukhov, A.A.; Kayumov, R.R.; Podlesniy, D.N.; Latkovskaya, E.M.; Repina, M.A.; Ivanov, N.P.; Tsvetkov, M.V.; Shichalin, O.O. Using Aquatic Plant-Derived Biochars as Carbon Materials for the Negative Electrodes of Li-Ion Batteries. Coatings 2023, 13, 2075. [Google Scholar] [CrossRef]
  93. Tsvetkov, M.; Zaichenko, A.; Podlesniy, D.; Latkovskaya, E.; Tsvetkova, Y.; Kislov, V. Thermogravimetric analysis of gasification and pyrolysis of algae biomass. E3S Web Conf. 2024, 498, 02002. [Google Scholar] [CrossRef]
  94. Tsvetkov, M.; Zaichenko, A.; Podlesniy, D. Thermodynamic assessment of gasification and pyrolysis of marine algae to produce hydrogen-containing gas. E3S Web Conf. 2023, 419, 01010. [Google Scholar] [CrossRef]
  95. Han, T.; Shi, R.; Qi, Z.; Huang, H.; Gong, X. Impacts of large-scale aquaculture activities on the seawater carbonate system and air-sea CO2 flux in a subtropical mariculture bay, southern China. Aquac. Environ. Interact. 2021, 13, 199–210. [Google Scholar] [CrossRef]
  96. Zhang, Y.; Zhang, J.; Liang, Y.; Li, H.; Li, G.; Chen, X.; Zhao, P.; Jiang, Z.; Zou, D.; Liu, X.; et al. Carbon sequestration processes and mechanisms in coastal mariculture environments in China. Sci. China Earth Sci. 2017, 60, 2097–2107. [Google Scholar] [CrossRef]
  97. Liu, Y.; Zhang, J.; Wu, W.; Zhong, Y.; Li, H.; Wang, X.; Yang, J.; Zhang, Y. Effects of Shellfish and Macro-Algae IMTA in North China on the Environment, Inorganic Carbon System, Organic Carbon System, and Sea–Air CO2 Fluxes. Front. Mar. Sci. 2022, 9, 864306. [Google Scholar] [CrossRef]
  98. Shi, X.; Xu, Y.; Dong, B.; Nishino, N. Mariculture carbon sequestration efficiency in China: Its measurement and socio-economic factor analysis. Sustain. Prod. Consum. 2023, 40, 101–121. [Google Scholar] [CrossRef]
Figure 1. Location of Aniva Bay in the Sea of Okhotsk. Standard hydrological marked by orange dots.
Sustainability 16 03031 g001
Figure 2. Map of standard hydrological (orange dots) and hydrochemical stations (dots which in red circles) in Aniva Bay.
Sustainability 16 03031 g002
Figure 3. Example of calculation of seasonal cycle of dissolved oxygen using running average based on multiyear data for one station.
Sustainability 16 03031 g003
Figure 4. Annual variability of mean dissolved oxygen (mg/L) on different sampling depths in Aniva Bay based on dataset 1975–1994.
Sustainability 16 03031 g004
Figure 5. The multiyear average value of water temperature (a,b), salinity (c,d) for all stations in Aniva Bay based on dataset 1975–1994 [41] and average total precipitation on weather station Korsakov (e) for the period of 2008–2023.
Sustainability 16 03031 g005
Figure 6. Spatial distribution of mean dissolved oxygen (mg/L) on different sampling depths in Aniva Bay in spring and summer based on dataset 1975–1994.
Sustainability 16 03031 g006aSustainability 16 03031 g006b
Figure 7. Annual cycle of mean oxygen saturation on different sampling depths in Aniva Bay based on dataset 1975–1994.
Sustainability 16 03031 g007
Figure 8. Spatial distribution of mean oxygen saturation (%) on different sampling depths in Aniva Bay in spring and summer based on dataset 1975–1994.
Sustainability 16 03031 g008aSustainability 16 03031 g008b
Figure 9. Annual cycle of mean pH on different sampling depths in Aniva Bay based on dataset 1975–1994.
Sustainability 16 03031 g009
Figure 10. Spatial distribution of mean pH on different sampling depths in Aniva Bay in spring and summer based on dataset 1975–1994.
Sustainability 16 03031 g010aSustainability 16 03031 g010b
Figure 11. Annual cycle of mean phosphate (P-PO4, µg/L) on different sampling depths in Aniva Bay based on dataset 1975–1994.
Sustainability 16 03031 g011
Figure 12. Spatial distribution of mean phosphate (P-PO4, µg/L) on different sampling depths in Aniva Bay in spring and summer based on dataset 1975–1994.
Sustainability 16 03031 g012aSustainability 16 03031 g012b
Figure 13. Annual cycle of mean silicate (Si-SiO3, µg/L) on different sampling depths in Aniva Bay based on dataset 1975–1994.
Sustainability 16 03031 g013
Figure 14. Spatial distribution of mean silicate (Si-SiO3, µg/L) on different sampling depths in Aniva Bay in spring and summer based on dataset 1975–1994.
Sustainability 16 03031 g014aSustainability 16 03031 g014b
Figure 15. Annual cycle of mean nitrite (N-NO2, µg/L) on different sampling depths in Aniva Bay based on dataset 1975–1994.
Sustainability 16 03031 g015
Figure 16. Spatial distribution of mean nitrite (N-NO2, µg/L) on different sampling depths in Aniva Bay in spring and summer based on dataset 1975–1994.
Sustainability 16 03031 g016aSustainability 16 03031 g016b
Figure 17. The density of dissolved oxygen observations at the station №3 in the surface layer in 1964–1994.
Sustainability 16 03031 g017
Table 1. The number and composition of hydrochemical observations conducted in Aniva Bay over the period of 1975–1994.
ParameterO2pHP-PO4N-NO2Si-SiO3
Number of stations in the “ATLAS” database603581257263295
Disclaimer/Publisher’s Note: The statements, opinions and data contained in all publications are solely those of the individual author(s) and contributor(s) and not of MDPI and/or the editor(s). MDPI and/or the editor(s) disclaim responsibility for any injury to people or property resulting from any ideas, methods, instructions or products referred to in the content.

