1. Introduction
Food production systems, in terms of how food ends up from production to table, involve a complex network of stakeholders. Many challenges have emerged due to consumers’ demand for sustainable, variable, economical, and healthier food sources, along with food safety, which has become a significant matter since an ingredient produced by a producer may end up in a great number of products distributed at many market points [
1]. The latter includes primary food sources that originate in a society and are part of their cultural heritage.
Tracing information about these sources could foster economic development in an area for local food developers and touristic development, as it will encourage visitors who care about sustainability to consume local food products of a certified identity. Therefore, considering all factors (economic, cultural, food supply crisis, etc.) related to sustainable food management, it is pronounced that traceability management in food supply chains has become essential and one of the most important factors both for the more demanding and suspicious consumers interested in sustainability and for businesses in order to ensure quality and visibility and avoid the economic impacts of product recalls caused by deficiencies in food supply chains.
Traceability concerns all stages of food production and should be studied multidimensionally, considering producers, distributors, retailers, and consumers. The term “traceability” is framed by relevant legislation and regulations aimed at ensuring quality and sustainability throughout the food chain. According to [
2], traceability is the ability to retrieve past, present, and potentially future information about the state (e.g., location) of an object. The collection of such information should be rigorously formalized in compliance with mandatory regulations, international standards, and certification requirements, while also relying on agreements among a number of cooperating companies. At this point, automation in data collection enhances the precision and reliability of the identification of the traced unit [
3]. FBO (Food Business Operators) is responsible for the assurance of prescribed requirements towards achieving food safety in business, which is a crucial factor in traceability. Among the challenges FBO has to face is the accountability of third-party arrangements that are processed by third-party food producers [
4].
As far as food legislation is concerned, EU law focuses on the interests of EU consumers, but it does not offer specific rights or remedies to consumers; it is only a general consumer protection law through the product liability legislation, while other obligations of public authorities come second to the obligations of FBO [
5]. The US legislation for food safety introduces a model that evaluates and ranks a comprehensive list of commodity–hazard pairs and the associated commodities to inform the Food Traceability List (FTL). The commodity–hazard pairs are structured according to data and information relevant to seven criteria (frequency of outbreaks and occurrences of illnesses; severity of illness; likelihood of contamination; potential for pathogen growth with consideration of shelf life; manufacturing process contamination probability and industry-wide intervention; consumption rate and amount consumed; and cost of illness) described in the report Methodological Approach to developing a Risk-Ranking Model for Food Tracing FSMA Section 204 [
6].
Traceability standards and guidelines are also set by several organizations, such as ISO (International Organization for Standardization), WHO (World Health Organization), and FAO (Food and Agriculture Organization of the United Nations). ISO 22000 [
7] maps out the way that enterprises demonstrate their ability to control food safety hazards and can be used regardless of their size and position in the food chain. Hazard Analysis and Critical Control Points (HACCP) has been applied to control the safety of food and drinking water production. HACCP works proactively in order to assure food safety rather than randomly monitoring a product, as it involves the identification of critical points to control hazards and establishes corrective actions when needed throughout production and distribution [
8].
Maybe the most important problem in constructing a traceability system for agricultural products is the asymmetry of information along the supply chain. The importance of information becomes a serious matter as it optimizes the internal operation of enterprises and enhances sharing, communication, and cooperation between all parts of the supply chain. As far as the production, processing, circulation, and consumption of agricultural products are concerned, the complexity and particularities of the operations for producing a food product on a farm may disrupt the dissemination of information about their quality and origin, leading to low competitiveness and reputation. A traceability system could establish records of the planting and further production procedures that will inform consumers, thus amplifying their trust and the responsibility of the production [
9]. According to [
10], an information model that supports traceability should define the traceable units in consonance with the requirements of the production process, while all transitions between traceable units should be recorded along with all equipment used in the production process and the relations between production equipment and traceable units. The information model should be kept as simple and generic as possible so it can be extended to meet needs in a certain value chain.
Section 2 describes the new technologies used nowadays for the development of traceability systems, while the following section analyzes traceable information in the agricultural supply chain and the contribution of new technologies to their detection and recording.
The purpose of this paper is to suggest a complete traceability system using augmented reality (AR) as a tool to create a user-friendly interface for all stakeholders in the food supply chain. We also validated a prototype system implementation using Unity. With the use of AR, decentralization, real-time data collection, disposal, modularity, service orientation, and new business models can be implemented along the supply chain. AR can create a variety of techniques to handle problems and enhance interactive relations between customers with the use of minimal resources [
11]. According to the existing studies, several scattered aspects of traceability systems have been established that refer either to consumers/visitors or to producers and intermediate stakeholders who deal with origin, storage, processing, transformation, safety, and nutritional facts. However, an AR application that offers an interconnected, user-friendly interface where each of the abovementioned aspects can be inserted and the application can detect the appropriate traceability data has not been traced. The
Section 4 of this paper covers related work that has been conducted on the use of AR in the traceability domain.
We present our application in
Section 5 by first introducing four research questions that examine the usability and validity of a complete AR-based traceability system for customers. The design of the system is presented next, which embraces traceability technologies, as overviewed in
Section 2, and supports necessary traceability information, as researched in
Section 3. The focus of the system is to provide a holistic solution for all interested parties in traceability (farmers, companies, and customers) by letting traceability information propagate among them. A prototype of the system has been implemented in Figma that showcases three usage scenarios for the three main user categories. In order to proceed with the evaluation, we partially implemented the system as a Unity application addressed to the needs of customers. End-users acting as consumers evaluated the application’s usability and indicated whether they would choose healthy food products with certain dietary values, ensuring sustainability during purchase, consumption, and waste management. The evaluation process and results are presented in
Section 6, along with a discussion of whether the research goals were met.
Section 7 concludes the paper and presents future work.
2. Traceability-Related Technologies
Many technologies have been employed in order to develop traceability systems, either combined with others or as standalones, and several usability approaches are referred to in the bibliography. In this section, we mention technologies and related traceability methods. Many of these technologies have been in use for many years, but when combined with newer ones, such as AR, they could be appropriate for the implementation of the “backend” part of a completed traceability system directed towards sustainable food management from production to consumption and addressed to each stakeholder’s needs.
Wireless sensor networks (WSNs) rely on a number of distributed smart micronodes working together to complete their processing of data collected during user transmissions, offering flexibility in terms of changing the nodes’ location and internet connectivity. A sensor is a device that collects specified measured data and converts them to a useful signal according to a specific rule, so a sensor node is capable of converting physical and chemical quantities or biomass into electrical signals, obtaining data from physical environments, and receiving and sending messages [
12]. The traceability and management of supply chains based on a WSN were examined experimentally in [
12], and despite all the disadvantages such as errors, loss, abnormalities, and uncertainty of network, it led to better statistical effects and more comprehensive statistics than traditional supply chain information traceability management methods.
Attempting an aggregated view of technologies and their applications in agriculture, ref. [
13] mentions the Global Positioning System (GPS) and Geographical Information System (GIS) combined with WSNs to enhance productivity. The most common use of GPS in agriculture is for yield mapping, the appropriate use of fertilizer/pesticide applications, and the measurement of harvester travel speed and flow rate of material. Its popularity is a result of its high accuracy when determining real-time position, time, and direction, allowing crop soil and water measurements to be mapped [
14].
GIS technology offers geospatial information, management tools, and methods for using those data. All those remote sensing technologies acquire data about crops and soil using sensors mounted on various equipment (such as drones), which, after being collected, are processed by computers to aid agricultural decision-making systems. GIS technology in agriculture has helped in the development of spatially explicit frameworks that support agricultural databases and real-time interactive systems. GIS is applied to precision agricultural automated farm systems, crop yield forecasting, climate change detection, and real-time monitoring of crop production to improve production and food safety [
15]. The computer network offers farmers high-resolution satellite images of their own crops, which can provide a wealth of information. Using GIS analysis, farmers can plan accordingly. With the help of GPS and digital maps, trucks assist in conducting farm work and preventing diseases and insects in time [
16].
Moreover, artificial intelligence (AI) could be used to perform complex tasks and forecasting, while drones could monitor the agricultural supply chain in real-time and robots could enhance its operational efficiency. Cloud computing is a useful platform for storing and analyzing the large amount of data derived from agricultural activities. Ref. [
13] shows that the Internet of Things (IoT) supports interoperability among several different connected devices in order to obtain real-time data on the supply chain. A WSN, as mentioned above, is an empowering technology in the IoT as it implements interconnectivity among diverse devices.
Barcodes are used to trace products, and they provide information depending on their version. One-dimensional barcodes are an important method of data collection, such as expiration dates and serial numbers. Two-dimensional barcodes look like squares, including tiny individual dots, and if printed on a small label, they can hold a clear message. Multidimensional barcodes store information both in the x and y axes and the colors, and they obviously provide much more information. They can be designed into a variety of patterns in order to form unique characters, graphs, or logos [
17].
Likewise, a QR code is a medium to transfer information used in product traceability as well as many other fields (mobile payment, document verification, etc.). The main advantage of the QR code is its error correction capability, which allows the barcode reader to retrieve the data correctly if portions of the QR code are damaged by using the Reed Solomon correction algorithm to realize this fault tolerance. Since there are various versions of QR codes, it is obvious that larger QR code versions and error correction levels offer a higher data payload and reliability [
1].
Radio Frequency Identification (RFID) is a technology that allows a seamless contactless link between physical objects and their digital natives, permitting each of them to be automatically identified by utilizing wireless communications to extract identifiers from RFID tags attached to objects. An RFID system consists of three primary components [
2]:
Tags are attached to objects and use an integrated circuit or chip that stores the identified information and an antenna to communicate the information using radio waves.
RFID readers communicate with tags using a radio frequency interface. Communication between a reader and a tag involves obtaining data, writing data to the tag, or sending commands to the tag in order to affect its behavior. The readers consist of their own source of power, processing capability, and antenna, while most modern RFID readers are equipped with networking capabilities (Wi-Fi or LAN) to allow readers to be networked with other computing hardware.
Backend systems: The readers are connected to a computer network in which the data are collected and processed, which may belong to a single organization or be shared, enabling cooperation between business stakeholders.
Near Field Communication (NFC) is a wireless close-range (a few centimeters) connectivity technology derived from RFID technology that allows data trade between two devices. NFC has been widely integrated into mobile devices such as smartphones, tablets, and notebooks and has led to the implementation of applications addressed to the end user. The fact that the NFC works at short distances ensures fast data exchange. NFC always involves an initiator and a target. The initiator generates an RF field that can power a passive target. NFC technology offers the advantage that all data could be read by the initiator simply by approaching a tag, as long as it has the ability to perform several data rewrites, data encryption, and a simple procedure for reading the tags [
18].
Blockchain is a way to store cryptographically linked records in a peer-to-peer network. The records concern all parties across the supply chain [
19]. As a distributed and decentralized technology, it is a set of time-stamped blocks linked by a cryptographic hash. Transactions are contained in the blocks, which are distributed to a network consisting of participants. They are transparent to participants with access to the blockchain, and they cannot be deleted or altered. A consensus mechanism is set to ensure the trust of nodes and determine the validity of the record [
20]. In the case of conflicting transactions on the network, only one is selected to become part of the block, while all transactions on a blockchain network are verified by a process known as mining, which returns rewards to the node containing proof of work of a given difficulty. The blockchain is replicated among the nodes in the blockchain network, and each node can read the transactions [
21]. Transactions are automated by smart contracts, which are software programs that automatically execute and enforce underlying agreements. Blockchains are either public or private, but in some cases, a combination of them is implemented. On a purely public blockchain, all stakeholders can view all transactions, while on a private blockchain, only users with the needed rights can access data [
22].
AR systems have three basic characteristics: (a) they combine real and virtual environments; (b) they interact in real time; and (c) in addition to the fact that they are described as an intermediate state between a real and virtual environment, they are registered in 3D. AR applications are categorized into two types: (a) image-based, which means they are initiated by specific labels (e.g., QR codes) or they are marker-less, and by tracking a photo of the real environment, the display of multimedia content is triggered; or (b) location-based, which means they are triggered by the arrival of a person at a certain location. They may be implemented from scratch by using an existing AR platform or an underlying OS-dependent toolkit. AR systems have already been employed in several sectors of food sciences, such as food production and safety, analysis of food ingredients, training operations in food production companies, and the promotion and sales of food products, either as sole products or as meals through restaurants [
23].
Concerns and Challenges about Technologies Used in Traceability Systems
Technologies mainly used in traceability systems (e.g., barcodes or QR codes) are prone to mistakes and inaccuracies as far as traceability information is concerned because they usually require human operators. Other problems may occur from hardware failures.
Printed bar codes are vulnerable to alterations caused by dust, dirt, etc. that reduce their visibility, while reading is achieved by a certain line of sight. Barcode scanners can read only one label at a time, making the whole procedure time-consuming, and additionally, it is not possible to collect environmental information using them [
24].
Although issues such as delays in transactions may occur with the aforementioned technologies, giving precedence to the use of RFID technology in traceability systems, there are also some weaknesses that concern it as well. The need to rely on a reader for data collection often leads to the production of incorrect data, as RFID readers may report a tag identifier that is not stored on a tag (ghost reads), resulting in erroneous data that are difficult for an information system to handle. The fact that readers may miss identifying an object or that a device may temporarily malfunction may cause a systematic error in events generated at a node. There is also the possibility that an object may be in transit between two nodes at a given time, so at the time that it arrives at a node, it has not yet been identified. The special case that a node at a partner organization does not release containment relationships that involve child products joining or leaving parent products induces inaccurate information regarding the complete life history of a specific product [
25]. To all the above, we should also add the fact that a tag cannot autonomously initiate communication, along with the limitations in environmental sensing and the high cost, which still seems to be a burden of RFID use [
26].
A number of concerns about RFID systems were very clearly identified by the research of [
27], especially for their use with passive tags. In addition to the fact that passive RFID systems are the most promising for their low-cost ubiquitous tagging capability for most supply chain management applications, they demand a very high design cost since every aspect of an RFID system affects every other aspect, and there is no possibility of modularly implementing them.
Since a reader that communicates with a passive tag also powers it, any modulation of the signal causes a reduction in the power of the tag. Modulating information spreads the signal in the frequency domain, and this spread (called the “side band”), along with the maximum power transmitted, is regulated by local government bodies, limiting the rate of information to be sent from a reader to the tag. The use of the same signal for powering and communication of the passive tags provides little available power to the digital portion of the integrated circuit of the tag, and additionally, the length of transactions with the tag is limited to the time for which the tag is expected to be powered and within communication range, while governmental regulations may further limit communication timings.
Lastly, concerns about the use of RFID systems are linked to the fact that the coding and modulation used in RFID communications are limited by the power and modulation/demodulation capabilities of the tags and the communications regulations that define the allowed bandwidth of signal transmissions. The great difference in power between the outgoing signal from the reader and the reflected signal from the tag and the inability of the transponders to discriminate between two readers communicating with them simultaneously are also concerns added to the above.
The use of WSNs is often associated with the loss of sensor data due to network or hardware problems. Battery power loss, random interferences by the surroundings, and a high bite error rate of wireless transmission might be some of the causes of such data losses that are crucial, especially when functionalities such as environmental monitoring (temperature, humidity, etc.) of perishable foods during the journey from production to consumption are concerned [
28].
Despite the good performance that a number of experimental measurements have shown with the integration of blockchain technology and other IoT technologies compared to only ΙοΤ technologies, there have also been a number of disadvantages associated with the use of blockchain. For example, since blocks are added to the blockchain, they cannot be deleted, so storage becomes an important issue. Additionally, the number of transactions per unit time is limited, while the privacy of transactions is not ensured when their contents are available to the public [
29].
3. Traceable Information and Logistic Activities along the Agricultural Supply Chain: The IoT Support
The basic characteristics of a traceability system, according to the FSA (Food Standards Agency), are [
30]:
The ability to identify all the linked information regarding all the intermediate procedures recorded between production stages through the supply chain.
The ability to uniquely identify all the batches or ingredients at any point of the supply chain as they change identity through processing or combination procedures.
A system to link all these data.
Traceability can be classified into three types depending on the direction of information recall:
back (supplier’s) traceability, internal or process traceability, and
forward (client’s) traceability. In order for a traceability system to be efficient, it has to support both forward and backward traceability [
24]. Although the current traceability systems focus on quality, all the information is written in simple text without providing intuitive information to consumers or other stakeholders [
31]. Implementing new technologies in agricultural supply chains provides the opportunity for each stakeholder to realize real-time agricultural supply chain traceability, along with the advantage that the supply chain becomes independent in reacting to the problems in it and agile in adapting to the dynamic environment [
13]. Technological facilitators allow the food industry to develop an efficient, collaborative, and robust role and enhance traceability from cultivation to the production chain in food processing environments [
32].
Making a step forward, ref. [
33] proposed a traceability model aimed at the final consumer’s awareness about sustainable food management based on IoT technologies, which consists of four layers. The “Food Lifecycle Layer” aims to retrieve information related to the product and the production processes. The “Sensing Layer” is able to collect data from the selected task and actor and could be composed of several kinds of sensors. The “Analytics” and “Visualization” layers could be used as a marketing strategy and were proposed to convey the food traceability information to the final consumer.
According to [
10], an information model that aims to process development and product differentiation during processing should contain as small as possible traceable units defined according to the properties and requirements of the production process. Traceable units are defined as final products as well as raw materials and intermediate products used in the production process, as well as all the equipment used for transfer and storage during the process. Ref. [
34] mentions that, apart from the technological stabilization of biological systems along with solutions in processing in this direction, there should exist a tracking system for this information.
An important traceable aspect that may lead to product losses, apart from poor quality of raw materials and violations of the production stage, is storage conditions. Especially in agriculture, storage refers to the deposits of farm products, fertilizer, grains, feed, and related supplies, as well as processing goods, in facilities or containers, in order to prevent contamination or for times when production cannot meet demand [
35]. Although it may be apparent, we should define that storage is related to two dimensions: warehousing and packaging. Warehousing and packaging could mostly be considered logistic activities, though they are an integral part of the food supply chain and many traceable data about products are directly associated with them.
As far as the dimension of warehousing is concerned, the research in [
36] demonstrated a direct dependence between the storage duration, the storage temperature, and the ripening speed of agricultural products. Studying the aspect of storage, ref. [
34] developed software solutions to optimize energy consumption and improve storage stability since almost half of all food products are perishable and an appropriate storage system is required.
Regarding storage, ref. [
30] acknowledged the importance of safe storage and processing when making food crops more durable, attractive, and valuable and proceeded to list aspects of storage methods according to the kind of crops and classification of storage: Storage duration, which refers to the time interval needed for preserving agricultural materials until needed; scale of storage size, referring to the amount of agricultural material preserved at a specific time; and principle of storage, referring to physical, chemical, or biological storage.
The selection of sites for agricultural product warehouses is also an important issue that motivated the research in [
37], and the authors came to the conclusion that the attributes that needed to be analyzed are unique and in compliance with the needs and features of each agricultural company and that accessibility to the storage place is probably the most important factor for site selection.
When a product reaches the shelf of a retail store, it is of great importance that it be contained not only in an attractive package but also in a useful package for the consumer. Modern packaging involves technologies such as the IoP (Internet of Packaging) and is an application of IoT to packaging. Among the technologies related to IoP, AR capabilities (such as Snapchat digital scans) on packaging may guide consumers’ choices and provide them with meaningful experiences with brands. The integration of technology in packaging offers a significant number of advantages. such as quick identification of food fraud points, sustainable management of food and packaging waste, price changes depending on the product’s freshness, and traceability information [
38].
Ref. [
39] classifies packages according to their constitutive materials: plastic, cellulosic, ceramic, and metal, and based on their ability to degrade or not. In addition, if the package comes from natural products, it is characterized as bio-based or bio-sourced. Effective packaging could increase the shelf life of fruits and vegetables and allow product traceability. Apart from the main goal of packaging, which is to reduce food losses by having the appropriate chemical and physical performance that allows food preservation, a reduction in ecological impact is of great interest, which is enhanced with the use of agricultural waste (such as banana leaves) for designing bio-sourced packaging. Though it is difficult for a product to be commercialized without packaging, this fact includes the paradox of the negative environmental effect if the waste of the packages is not appropriately managed [
32].
Ref. [
40] refers to packaging as a differentiation tool that provides an interface between the product and the consumer, helping it to be sold successfully, especially outside local markets. Packaging also extends postharvest quality and condition, making it handy and mobile and preventing contamination through the stages of transportation and distribution, enabling the delivery of marketing messages. As a consequence, traceability elements are included in packages such as shipment, transporting and marketing labels, weight, place of origin, size and grade, temperature of storage, and pesticides used during production.
Research in [
41] highlighted the benefits of an improved packaging system that could be generated. From the supplier’s side, a sufficient packaging system offers less waste, more quantity, and easy transportation and handling, while from the consumer’s side, it offers less waste as well, better price, durability, easy transportation, less labor costs, and convenient selling. As far as seeds are concerned, packaging is crucial for preservation, gemination, and the seeds’ health, while also providing traceable information.
One more advanced type of packaging is active and intelligent (A&I) packaging based on deliberate interactions with food or the food environment in order to extend shelf life and maintain or improve food quality. It is implemented when labels are either incorporated into or printed onto a food packaging material. Intelligent tags such as electronic labeling, designed with ink technology in a printed circuit, and built-in battery radio-frequency identity tags, all placed outside the primary packaging, increase the efficiency of the flow of information (quality, trace of critical points, etc.) [
42]. Information on intelligent packaging is addressed to processors, retailers, and consumers. Intelligent packaging is a step forward to avoid food waste and improve food traceability. It takes advantage of detectors, sensors, or devices able to exchange information on the packaging system, while much progress has been made towards the application of RFID in tracking the temperature of food along the food chain [
43]. Another new technology discussed in [
44] is a biosensor, which is an analytical device that converts a biological response to a measurable signal (e.g., electrical), providing direct digital information about food quality instead of analog information.
Lastly, waste trace and management are important aspects in every branch of industry. The food industry is not excluded as it generates a great amount of organic waste, mainly composed of raw materials that cannot be further reused. Waste management is a crucial factor that determines the sustainability of the company. According to [
45], companies connected with the manufacture or use of goods in general have the chance to affect waste reduction by engaging the public in such initiatives as recycling or reusing rather than discarding an item.
Food waste has been a concern for many researchers, such as in [
46], and seems to correlate with many factors. They concluded that annual food waste is related to the rate of urbanization in the population. Countries with an aging population or a high percentage of people living in rural areas seem to produce less food waste, unlike countries where their customs, such as festivals, special occasions, and social events, require them to provide more food than needed. Furthermore, food and organic waste occurs at the post-harvest and processing level, especially in developing countries, due to poor agricultural practices, restrictions in technological financial and labor aspects, or improper storage, processing, and transport, while in developed countries, food waste results mostly from excessive cooking and overshopping driven mostly by consumers’ attitudes. And, in addition to the fact that many governmental, regional, and local authorities worldwide have introduced regulatory and economic measures in an effort to reduce household food waste, the research of [
47] has shown that well-defined regulations and policies are more valuable than fiscal measures and economic incentives against household waste. They also suggest that research concerning sustainable management of household food waste should consider cultural predispositions, behavioral and attitudinal patterns, environmental awareness, and socio-economic characteristics.
In sustainable waste management, the concept of the circular economy model of production and consumption focuses on extending the life cycle of products through procedures such as reuse, repair, refurbishment, and recycling of materials or products. The metaverse environment, on the other hand, could play a critical role in the circular economy strategy in line with the Sustainable Development Goal (SDG 12) of the United Nations in terms of providing a platform for sustainable consumption and production and a safe context to educate and enhance the awareness of the public about the circular economy model and the adoption of sustainable behaviors (reducing waste, recycling, composting, etc.). The benefits of virtual education could be transferred into real life, and the metaverse could be utilized as a repository of data for waste management strategies and provide a platform for collaboration and information sharing among waste management professionals and policymakers. The metaverse also has the potential to revolutionize the way society perceives waste by engaging virtual environments to provide data on waste management practices and platforms for businesses and organizations to test and implement circular economy practices [
48].
4. Augmented Reality-Assisted Traceability along the Agricultural Supply Chain
Even though AR is regarded as a variation in virtual environments, it offers the important advantage of allowing users to see the real world with superimposed virtual objects, either upon the real objects or composited with the real world. Therefore, AR could be a useful tool to supplement agricultural production and retail agricultural products in terms of production traceability and sustainability. It could assist in the implementation of the “front-end” of a completed traceability system and efficiently support the needs of producers, processing companies, retail companies, and consumers by providing an easy and functional environment to employ a variety of activities. It also offers an environment for users to obtain awareness about sustainable production, processing, and food management methods.
AR allows situated analysis with a group of information resulting from complex and heterogeneous data. As soon as the information is presented, AR has the potential to provide useful content. AR supports collaboration and many different kinds of display that vary in dependence on the cost of the targeted scenarios. Different AR setups are important to best suit farmers’ needs and assist in planning future farm development. Last but not least is the potential for new farmers to be trained quickly by attending a training scene and then sharing that view, including all relevant data, with a remote expert [
49].
Workers in the food industry should also be appropriately trained in the demands of food safety. AR could provide mentoring without requiring any extra time from experts to train new workers. AR can be considered a digital extension of the five senses and can provide real-time feedback to workers on performing food safety behaviors in the work environment, which in turn may increase productivity, provide quick access to important workplace information, enhance teamwork, and simplify current practices [
50].
The proper time for harvesting agricultural products is not always obvious, even for experienced farmers, because fruits and vegetables have different ripening times, even on the same plant. AR could facilitate the choice of harvesting time and keep records about it in terms of traceability, as has been implemented by [
51].
An important issue in agricultural production is the early diagnosis and recording of crop diseases and the factors that may lead to such diseases, as well as ways of prevention. AR seems to be a helpful tool, as evidenced by the prototype created by [
52], which uses AR to detect or prevent grey mold disease in real time. Regarding healthy crops, the correct identification of harmful or helpful pests and the correct use of pesticides are important issues. An AR application should offer such information, like in [
53], in which an AR application was developed to identify insects, propose solutions, and share relevant information. Soil sampling and processing constitute a crucial agricultural and traceability factor, as pointed out in [
54] by a soil sampling method based on the determination of sampling locations with the use of drone images after plowing. The method guides farmers to the sample points with the aid of AR glasses.
As far as retail is concerned, the research in [
55] revealed some significant results regarding the use of AR technology. The potential deployment of mascots, personalities, and spokespersons to address consumers directly increases consumers’ confidence in AR and influences their perception of the retail environment, as well as the fact that AR facilitates the convenience of transactions. In relation to this approach are the experiments of the authors in [
56], who used HoloLens and a virtual avatar describing the product, and [
57], who used AR to shrink, amplify, or hide products in a food retail place in order for customers to select the appropriate products.
Nutritional information is usually acquired manually, leading to a time-consuming and often unreliable result. AR techniques are able to offer a food intake assessment along with the nutritional value of the food being consumed.
As nutrition is the main purpose of consuming a food product, an important issue is for the consumer to be properly informed about the presence of nutritional or harmful ingredients contained in a food product, such as by using Prodiscan [
58], which is an AR application aimed at raising a consumer’s awareness of harmful ingredients in certain food products and consumption limitations. Moreover, considering obesity as a disease affecting a great number of people in many countries, an application informing them about the calories in each meal would be very useful, such as ARIF, which uses AR to provide calorie information for their staple food [
59]. Additionally, ref. [
60] suggested a model composed of three components: object recognition in order to obtain information on the food type and the portion, nutrition information retrieval and machine learning, and AR to present nutrient facts in addition to the real-world object. Similarly, the MANGO application [
61] provides dietary information assistance about fruits and vegetables using AR and mobile phones.
An AR-based head-mounted system that enables the user to see food nutrition information overlaid on items in a real supermarket was developed by [
62], whereas [
63] suggested an AR application that supports navigation within a grocery store by recommending appropriate products to consumers or identifying products to avoid due to health concerns.
As already mentioned, packaging constitutes a substantial element for the protection, easier usage, traceability, and transportation of a product in accordance with food safety regulations. In this direction, ref. [
64] developed the Safe Food AR application, with which users are able to receive a reality extension containing detailed information on the origin and content of the product.
Innovations in packaging are forced by the changing needs of consumers, shelf-life extension, cost efficiency, environmental issues, requirements regarding consumer health and safety, changes in retail and distribution practices, and globalization. The technique of connected packaging brings the engagement and interaction of the online world to the consumer using a variety of technologies. The use of packaging-directed AR positions packaging in the consumer’s real world and provides a way for them to compare products and decide which one to purchase [
65].
Innovation
This paper deals with the development of an AR traceability application, FoodTrace, which supports sustainability for packaged farm products hosted on market shelves. The motivation arises from the observation that all related work we searched refers partially to traceability aspects and supportive technologies, and we have not found an AR traceability application that deals with all aspects, starting from production and ending with the consumer, utilizing all known or available technologies and equipment.
From the farmers’ side, our research revealed that in addition to the fact that a lot of work has been conducted concerning appropriate equipment and technology to assist precise and sustainable production [
13,
14,
15,
54], there is a lack of an AR application that, by combining with the above and being easy to use, helps them to choose a cultivation that is in their better interest, accurately and easily registers and saves all the appropriate data about it, keeps records that can be easily visualized and thus better understood, and promotes their products to companies and eventually to consumers. This need has become more meaningful nowadays because the relevant legislation [
4,
5] about food products has been better formulated, consumers have become more demanding, and their preferences seem to be shifted to traditional products and a healthier and more sustainable lifestyle.
Companies receive products en masse from many farms and proceed either with processing or only with packaging them in specific portions for sale at the market. After searching the relevant work that has been conducted, we found that many different technologies and equipment have been employed to register and save the appropriate traceable data of each product, though companies seem to act independently after receiving a product and do not continue to add to the content filled out by farmers [
64,
65]. Our application proposes a central database being filled in with the appropriate data from both farmers and companies, utilizing AR representations and prompts to train and guide the workers in charge to fulfill this duty easily and accurately.
As far as consumers are concerned, after studying the relevant work, we found plenty of AR applications that inform them about the food they are about to consume in several ways [
56,
57,
58,
59,
60,
61,
62,
63]. We have not yet discovered any application that informs the consumer holistically about the traceable data of the product and its history as part of the cultural heritage of the production site and at the same time suggests sustainable manners of waste management, proposals of healthy meals, or suggestions or tips to avoid some products while giving them the opportunity to compare the price or check out the shelf conditions utilizing AR diagrams and indicators.
In this direction, the AR application we propose could train farmers and company workers to accurately register fundamental traceability data and consumers to search for and utilize these data. It could also be useful to enhance the preference for local products with sustainability and cultural impact among companies and consumers and create trusting relations between all parties.
5. Methodology
This methodology includes the qualitative characteristics, the design, and the definition of potential users of the FoodTrace application. It starts with the research questions that guided the evaluation of the implementation of the application in the following section. More specifically, the steps we followed are:
Definition of the research questions.
Qualitative characteristics and design of the application based on a literature review.
Determination of three user categories: farmers, companies, and customers who are involved in the life cycle of sustainable food product production.
Presentation of application functionality for all user categories theoretically and through usage scenarios based on the implemented prototype in Figma.
Implementation of a prototype in Unity supporting the functionality of customers in order to be used in the evaluation.
Evaluation procedure and results.
Discussion about the validity of the research questions.
5.1. Research Questions
Based on the previous discussion about related work and intended innovation by our application, the research questions we pose towards the implementation and evaluation of the application relate to the usability of the application and to what extent such an application could help consumers in their dietary habits and the selection of appropriate food products while ensuring sustainability. More specifically, the research questions are:
RQ1: Is the application usable enough regarding interactivity and appearance?
RQ2: Is the application providing enough information about the origin of food products?
RQ3: Is the application supporting enough healthy food choices?
RQ4: Is the application ensuring sustainability regarding food selection, consumption, and waste management?
5.2. Design of the FoodTrace AR Application
We consider the most valuable characteristic of the AR application to be the involvement of all potential parties from production to consumption of a farm product appearing at a consumption point in terms of traceability. Additionally, we propose that data be filled automatically where possible in order to avoid mistaken or incomplete entries. Data can be retrieved or added according to user category and are available after signing up and choosing the appropriate profile, i.e., farmer/producer, processing company, or consumer. All the data inserted and retrieved from all interested parties are stored in a central database, and access to them is possible through a network connection provided by the application. Throughout the design of the application and the prototype steps, it is illustrated when and how database content is used by the application. The decision to deploy a central database ensures that all content is updated instantly, enabling companies and, finally, consumers to have access to the most recent information about food primary sources and products, respectively.
Farmers can easily edit and obtain the necessary data by using appropriate mobile devices, and data are saved in the application’s database so that they are available to farmers as well as to other interested parties. Location-based identification of farmers’ properties and basic recognition of soil type, humidity, and temperature conditions that allow certain types of cultivation and profit estimation per cultivation are also taken into account. Farmers may enter data about their products to be used for further processing by companies. Data are entered automatically by scanning or choosing from drop-down menus or manually, where automatic completion is not possible. Data include production details, dietary properties, and the sustainability and heritage values of the products. QR codes or relevant standardized icons are used as markers for identifying objects by farmers and throughout the functionality of the application because of the difficulty in the recognition of different shapes and colors that farm products may have, even if they are of the same kind.
As far as companies are concerned, the projection of the farm product in the package and packaging type, along with all traceable information, is supported, along with the potential to scan or further explore data about ingredients and other information already entered by farmers in the application’s database. They may also parametrize virtual representations that display information about the farm, cooking methods, shelf conditions, and environmental management. Furthermore, diagrammatic representations of prices, dietary facts, health suggestions, and packaging methods may be prepared by companies and be available to consumers when they scan the QR code or an icon on the product. Location-based identification applies to companies too, helping them track close suppliers, reducing CO2 emissions, and enhancing environmental sustainability.
Regarding consumers, the FoodTrace application assists them in choosing food products according to health, nutritional, and sustainability criteria. It also offers them the section “Cooking Methods” as a pillar to sustainable food management, which is connected to education related to cooking and food management in the home and information about the farm where the production was initiated in order to raise awareness among consumers about the quality of the product and to prioritize local farms. This is in accordance with [
46], which has shown that people living in rural areas interact directly with agricultural processes, have a sense of what their food is made of, and tend to produce less food waste, which also applies when the distance between the production and consumption places is small. The same research has shown that food waste increases due to urbanization and the transformation of consumer habits. The application virtually shows customers how the packaging and food waste of grocery products should be discarded and promotes the environmental benefits of recycling that are more intuitive, as these occur “downstream” of the discarding of an object, avoiding landfill emissions or substitution of virgin material in future production [
45]. The application also favors the consumption of healthy food [
45] by giving information about nutritional facts and health suggestions, as well as assisting in the avoidance of wastefulness as a way of saving money by using the Price Change section.
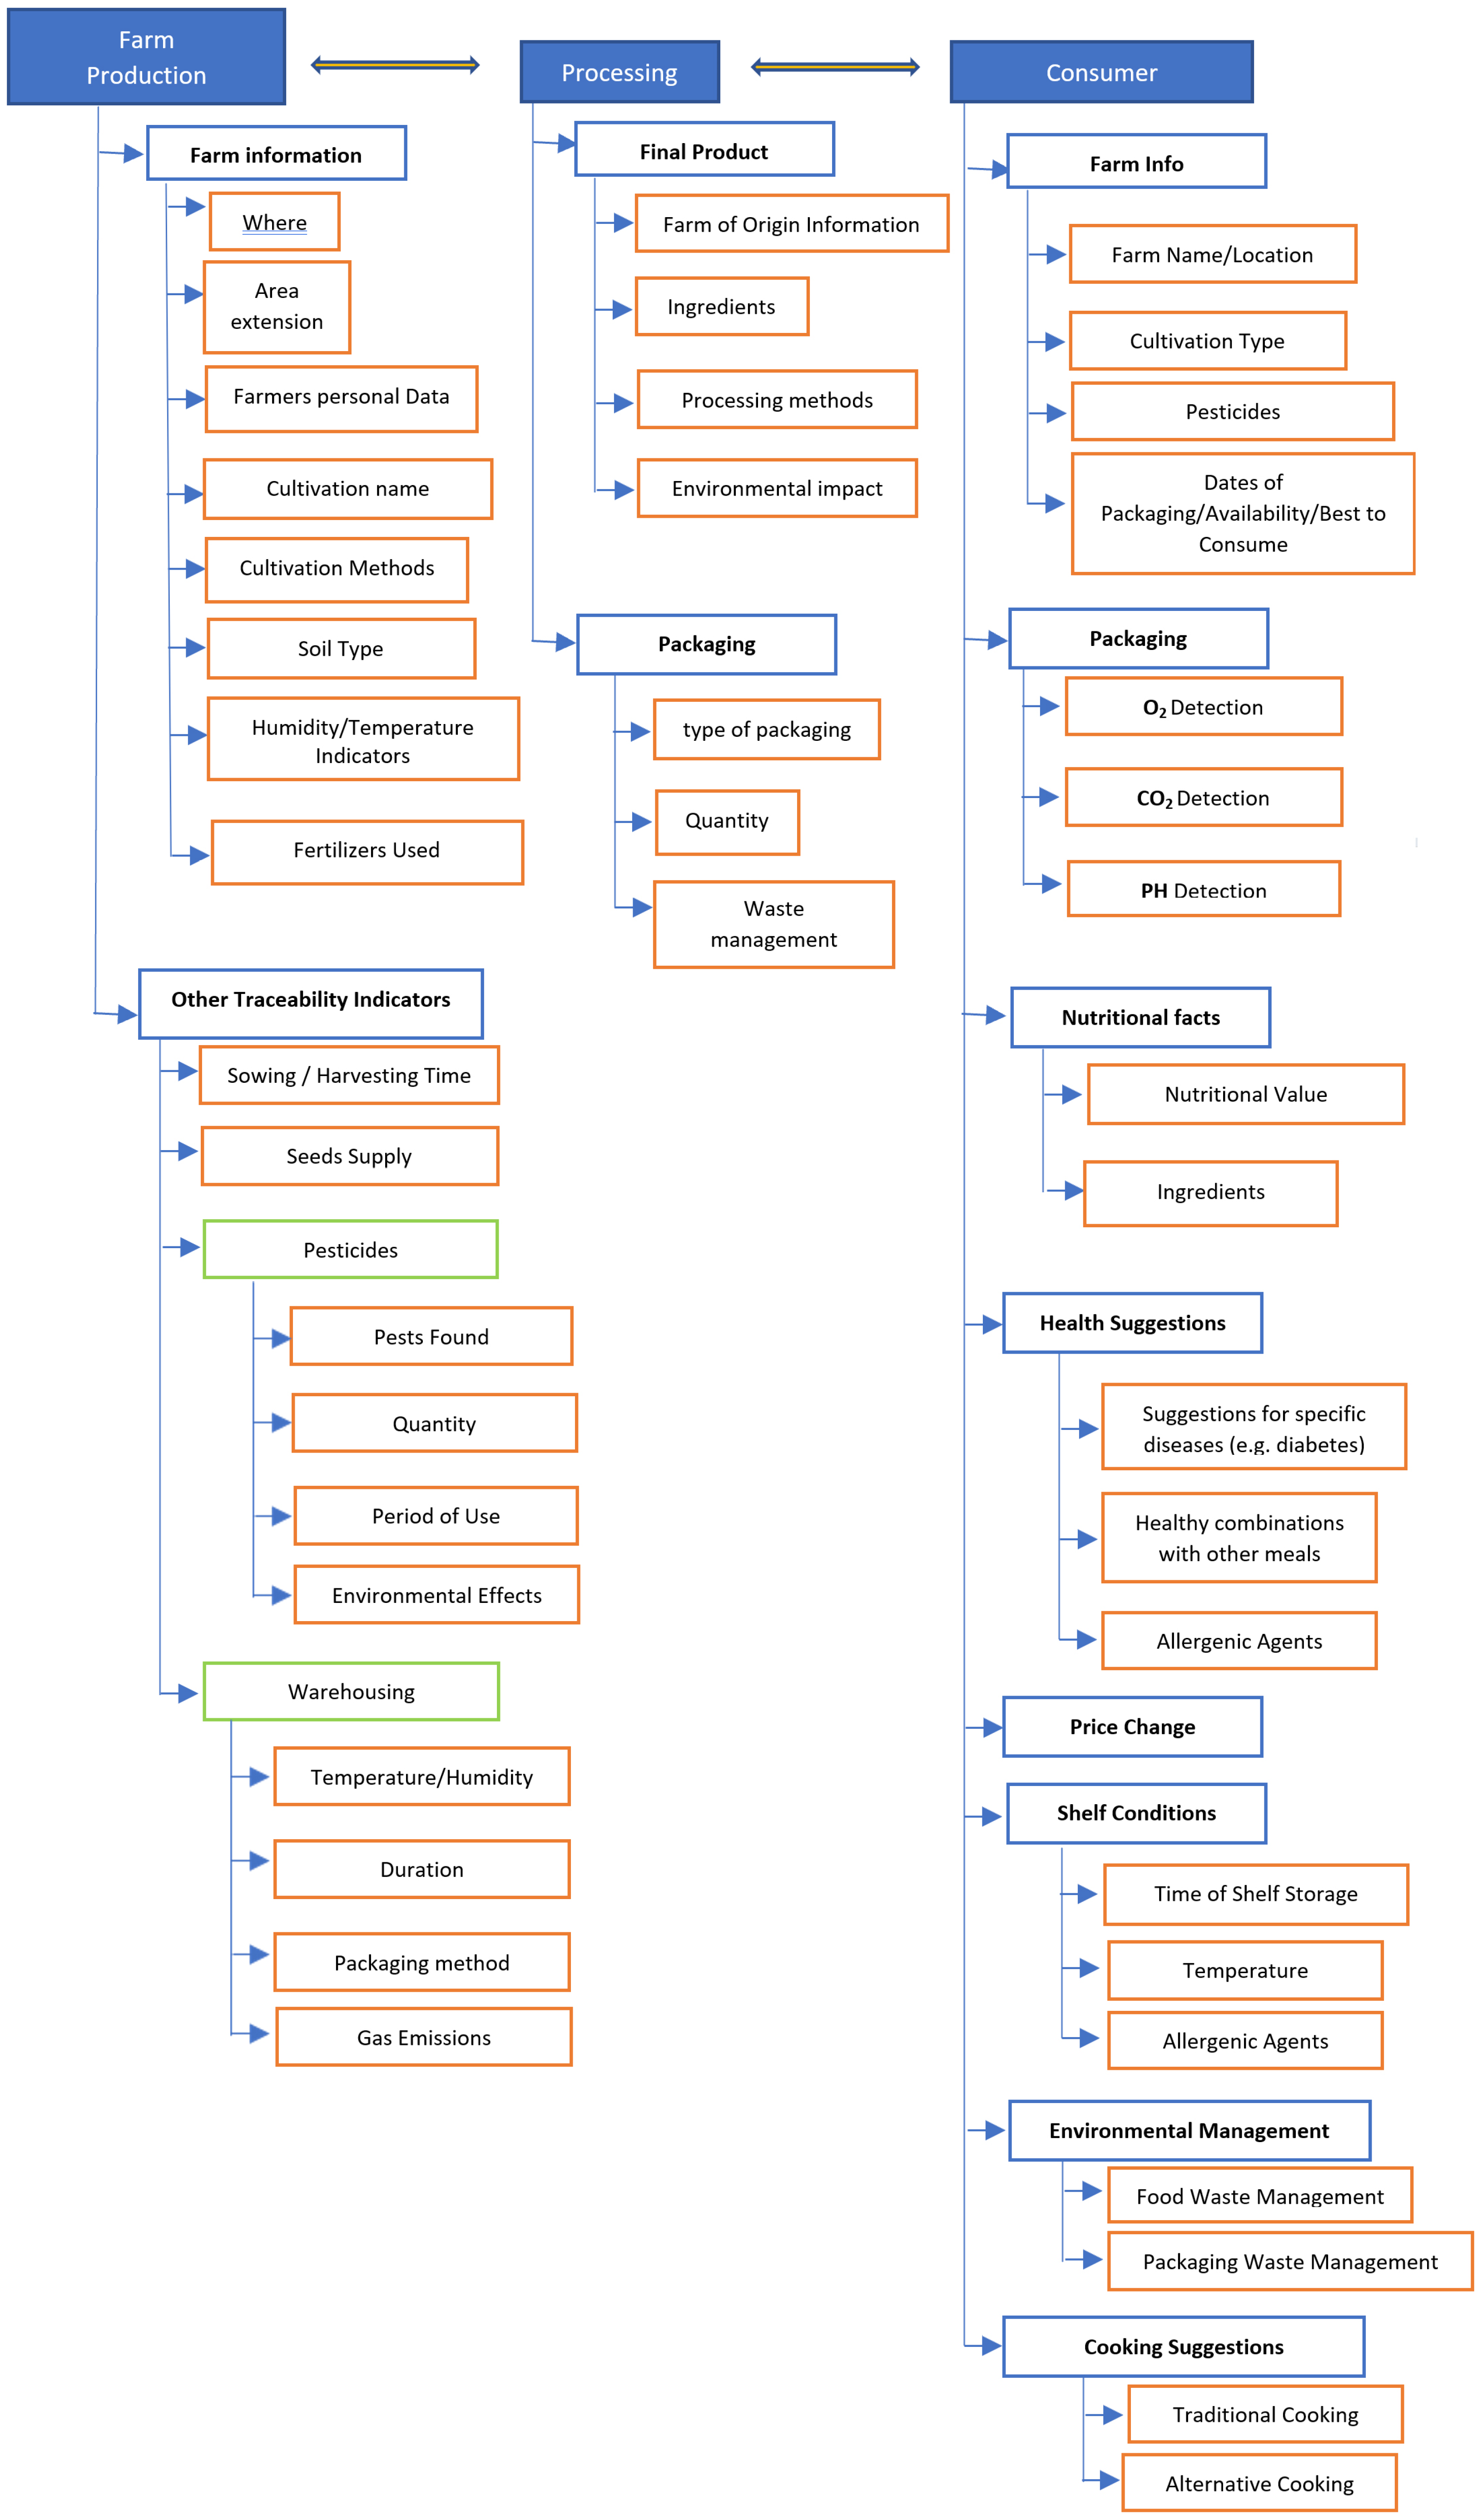
Figure 1 presents the application’s content structure. The “Farm Production” section provides information about the farm itself and traceability information of the farm product, while the “Processing” section has information about the procedure followed in order for the final product to appear on a market shelf, as well as the packaging method and data. Finally, the “Consumer” section is devoted to all the information that could possibly concern the consumer, such as the farm of origin, information provided by the packaging, nutritional facts, health suggestions, price changes, shelf conditions, environmental management, and cooking suggestions. To promote sustainability, environmental effects are taken into consideration at each level, using virtual representations to depict food and packaging waste management. Additionally, the application suggests proper cooking methods to preserve cultural heritage, enhance local awareness of food sustainability, and reduce food waste.
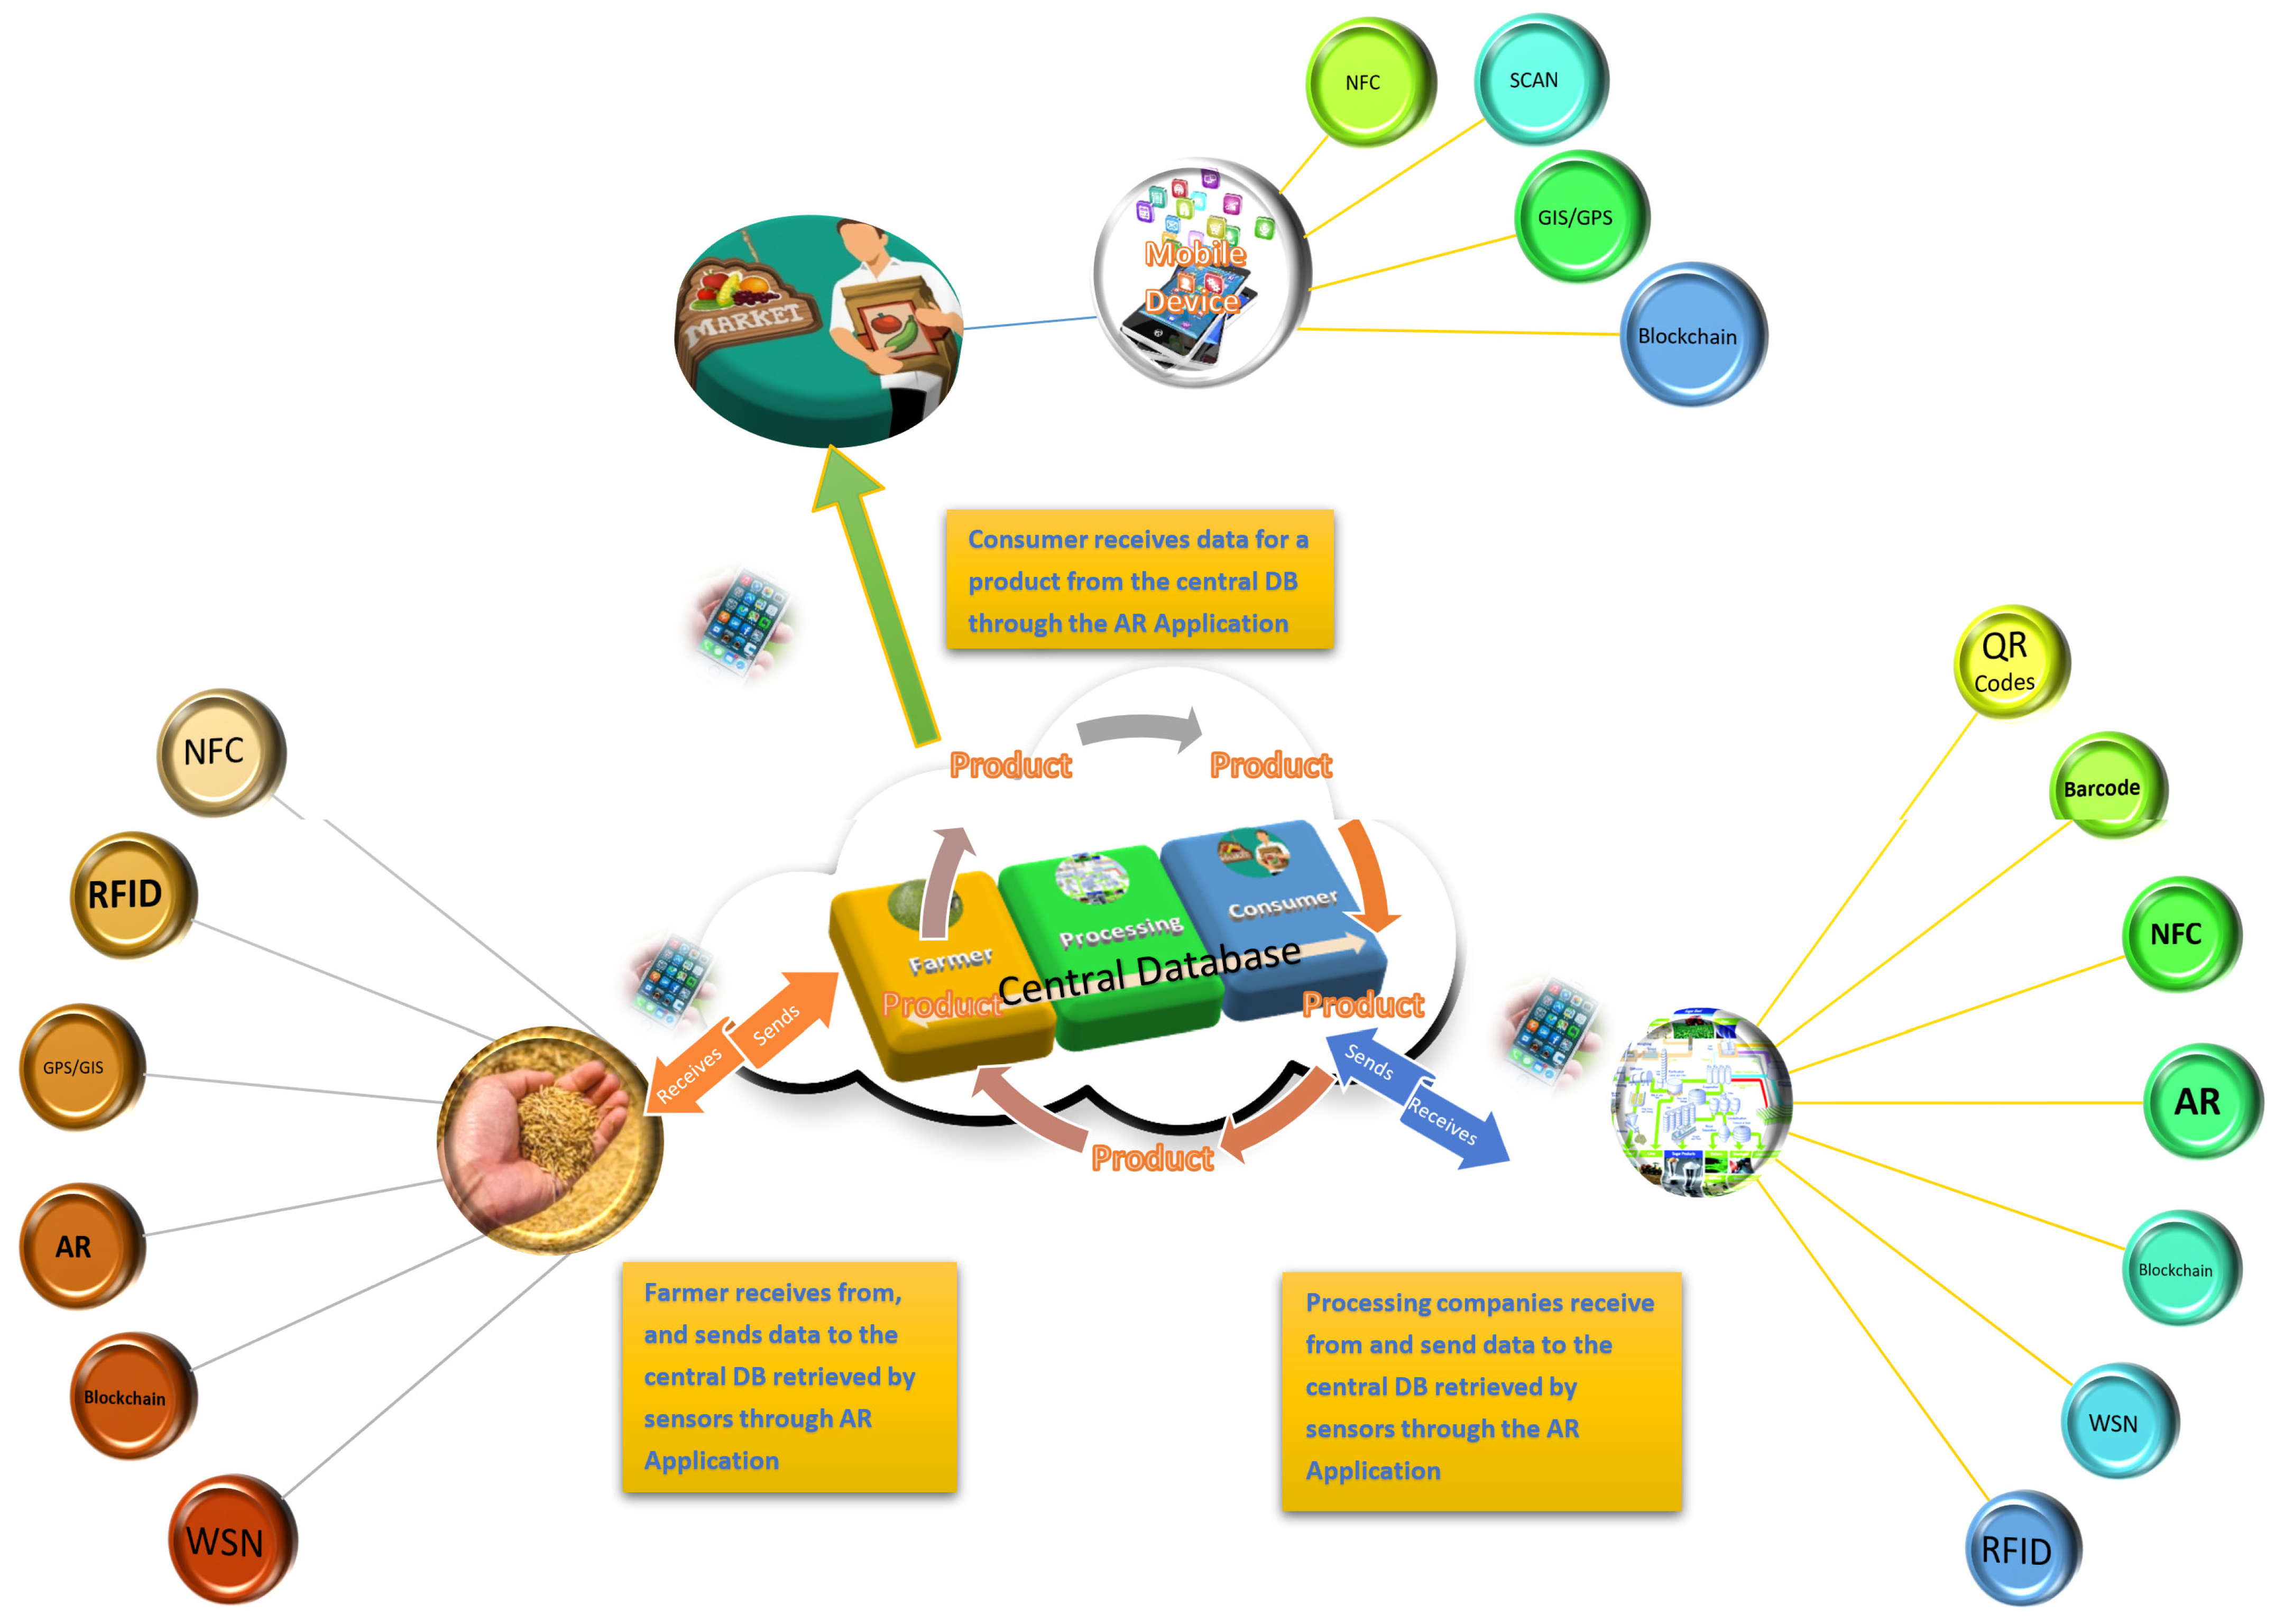
Figure 2 shows the interconnection among the different users. Every party operates with the use of a mobile device. Related technologies such as NFC and WSNs cooperate with the mobile device to gather data from or send data to the central database in such a way that the data are always quickly updated and available to all parties according to their roles.
Based on these figures and on a full-scale implementation for farmers to plan their cultivations, GPS from their mobile device allows them to visualize their property’s location with respect to the map components [
14], and then an AR superimposed image of the property is used to divide it into sections, letting farmers plant different cultivations in each section. Data from this procedure are saved in the central database (DB). To decide which cultivation should be planted in each part, a farmer is able to retrieve soil type data (soil fertility, soil physical, soil chemical, and geomorphological properties) from the central database that is connected to an integrated system of wireless sensors and GIS. The farmer scans the soil with the mobile device’s camera, causing a query to be sent to the central DB in order for the scanned image to be matched with the saved ones, and then the application proposes suitable cultivations for each section by using an AR representation of them.
For farmers to monitor the development of crops and estimate their yields, WSNs consisting of soil moisture and temperature sensors combined with GIS can be applied to appropriately selected spots of the field to transfer data wirelessly to the central DB and can be utilized in combination with atmosphere and temperature data received from the farmers’ mobile device. WSNs can also be employed to provide soil information (soil fertility, soil physical, soil chemical, and geomorphological properties), monitor drought conditions, scan for pests and crop diseases, and inform a decision about whether to use fertilizers. Drones with an antenna can be used at this point as a remote sensing tool to collect data from nodes applied to the field to monitor crops [
15]. All this information is combined to produce AR diagrams, which show the specific conditions in a part of the field and the required actions when scanning it through the mobile device. Nearly the same technical set-up can be applied to monitor and record warehousing conditions.
As for companies, all useful information about the farm of origin can be saved and acquired by scanning a QR code or a barcode attached to each package using a mobile device. Companies can retrieve information about the use of fertilizers in the form of AR diagrams in order to categorize a product as organic, as well as an AR representation of warehousing conditions and production date from the central DB in order to confirm freshness. In case the final product is processed before reaching consumers, workers can scan the rest of the ingredients to be used or, alternatively, fill in a preset form. The processing data are saved in the central DB and can be retrieved whenever needed. The flow of information, such as quality and the trace of critical points, can be ensured either with RFID tags attached to the final package or QR codes or barcodes and visualized through AR.
Regarding consumers, all available information can be retrieved from the central DB and visualized through the FoodTrace application. For the retrieval of shelf conditions, an implementation that includes NFC tags is required. NFC tags can monitor time and temperature and can be retrieved and updated in the central DB. FoodTrace retrieves the NFC tag ID and uses it to query the database for the relevant information. A Unity plugin enables communication between the mobile app and the central DB and is linked to the tag. The application then presents the data in the form of AR representations on the consumer’s mobile device.
5.3. Prototype
We have implemented a prototype of the whole application in Figma (figma.com) at
https://www.figma.com/proto/BgzcAU5iEJbI9zGsH0kCOi, which demonstrates the main interactivity as used by a farmer, a company, and a consumer. For the assessment of the application, an indicative part of the consumer role has been implemented in Unity, as shown in
Section 5.5. The demo is presented for the three different user roles in the following sections. References indicate similar functionality described in related work.
5.4. Farmer Functionality
The part of the application concerning the farmers aims to gather most of the information about the farm that produced a product and make it available to the rest of the stakeholders who are supposed to process or consume the final product. It is important to mention that the relevant information should be saved in or retrieved from the application’s database. Information such as humidity, temperature, or soil composition should be retrieved with the use of one of the aforementioned technologies [
13,
14,
15,
54]. However, in the present demonstration, we have simulated the gathering of this information and focused on traceable information about packaged farm products on a market shelf and the contribution of AR in this endeavor (numbers in parentheses correspond to Figma screens).
Since farmers are the initial group of users entrusted with importing all relevant information about a farm product, the first option on the starting screen is “Producer” (1). By choosing this option, they can first use GPS [
13,
14] to demarcate their property (2). Then, the farmer can see an AR representation of the property on the mobile device’s screen and AR indicators of soil temperature, humidity, and basic soil data retrieved from appropriate sensors, as well as a menu to choose the season of cultivation. The farmer can then exit the application without saving the data retrieved until that time, or touch the button “Save” to continue (3). Choosing the “Save” option leads to a screen where the farmer has to fill out the appropriate identity data for the farm in a preset form linked to the database (4).
The next step is to divide the property into sections if there are different cultivations using the AR representation (5) or skip this step (“Skip” button). Since all useful data (temperature, humidity, soil data, and season) have been retrieved in the first step, the application proceeds to the suggestion of possible cultivations, displaying them as AR representations (6) and an AR diagrammatic representation of their cost per m2 in order to calculate the return profit. Farmers can choose among the proposed cultivations, or they can use the linked database to search for other possibilities (“Choose Cultivation” → 6).
After choosing the desired cultivation, the farmer proceeds to complete a preset form with information such as the cultivation name, sowing time, harvesting time, seed supply, pesticides used, warehousing conditions, and packaging methods (7). They can also choose to link their cultivated products to history/heritage data from preset lists according to their area. Sowing and harvesting time are completed by using the electronic calendar of the mobile device; the seed supplier field is filled in by scanning the seeds’ package; and the packaging method field is completed by making the appropriate choice from a relevant database (“Seeds Supply” → 8).
Since pesticides seem to be an important factor for the health of both the farm product and the consumer and also an important aspect of environmental sustainability, the application proposes a detailed account of the pests traced and the pesticides used in each cultivation (“Pesticides” → 9). This could be accomplished with various technologies like GPS or AR [
14,
40,
52,
53,
54]. Diagrammatic representations of data like the quantity of pesticides used per m
2 are also contained in the application so farmers can adhere to usage limits recommended by the law.
Lastly, warehousing and the prevailing conditions are crucial for the maintenance of freshness and the high quality of farm products (“Warehousing conditions” → 10). Our application proposes full registration of the warehousing conditions using temperature and humidity sensors and an electronic calendar for registering the duration of warehousing before availability in the market and environmental burden, along with AR representation of these data [
35,
37,
58].
Moreover, farmers can view AR suggestions for improvements to their cultivation methods or for additional farming products they can cultivate in order to enhance their income and take advantage of their equipment and property in a sustainable manner (“Search suggestions” → 11). Screens 8, 9, 10, and 11 stem from Screen 7.
5.5. Company Functionality
Companies are the receivers of the farm products. They are charged with processing them or properly packing them in appropriate quantities so they can be distributed and sold on market shelves. Before accessing the application’s potential functions, a company user should choose the second option in the starting screen, “Company” (1), and then sign up and fill out a form containing the company credentials (2). The data of all the companies signed up are stored in the application’s database and are available to farmers, companies, and consumers.
Each company can locate close suppliers using geolocation or retrieve information from the database (filled in with data at the Farmer stage). Companies acquire traceable data and an AR representation for each farm product by scanning the QR code on their package (3) and then viewing the information about the farm product (4).
For the next step, a company may proceed to processing the primary food products (5), and there is an AR representation of all the ingredients available from which users can choose the appropriate ones by touching them on the screen, scanning them, or writing them down on a preset form (“Ingredients” → 6). They may also choose packaging materials (“Packaging” → 7). The composition, processing information, and packaging method of the final product are saved in the application’s database.
5.6. Consumer Functionality
The consumer, who is the final receiver of a food product, is offered an environment providing useful information about farm products to be bought and consumed. A consumer chooses “Customer” from the initial screen (1) and scans a product found in a food market (2). A menu appears on the screen of the mobile device (3). Menu options are (starting from the top icon button and then moving clockwise): “Suggested Cooking Methods”, “Packaging”, “Environmental Management”, “Health Suggestions”, “Nutritional Facts”, “Price Change”, “Shelf Conditions”, and “Farm Info”. After choosing one of the menu options, the others (which are still functional) appear on a smaller side of the screen, and the information requested unfolds on the rest of the screen as multimedia content. The content corresponding to different screens displayed after touching each button is:
Suggested Cooking Methods (4): Suggested traditional cooking methods with history/heritage information, alternative cooking methods, healthy combinations with other products, and portion sizes to avoid food waste.
Packaging (5): Packaging method, oxygen detection, PH detection, and CO2 emissions.
Environmental Management (6): Guide for packaging and waste rejection.
Health Suggestions (7): Allergenic agents, health issues prevented by consuming the specific product, and recommendations for individuals with certain ailments to avoid this product.
Nutritional Facts (8): Full record of the nutritional facts of each product.
Price Change (9): Diagrammatic representation of price changes depending on season or on the duration that the product is hosted on the shelf.
Shelf Conditions (10): Record of the humidity and temperature of the shelf hosting the product and the time of shelf storage.
Farm Info (11): Information about the farm of origin of the product, location, type of cultivation, pesticides used, and harvesting time.
5.7. Prototype Implementation
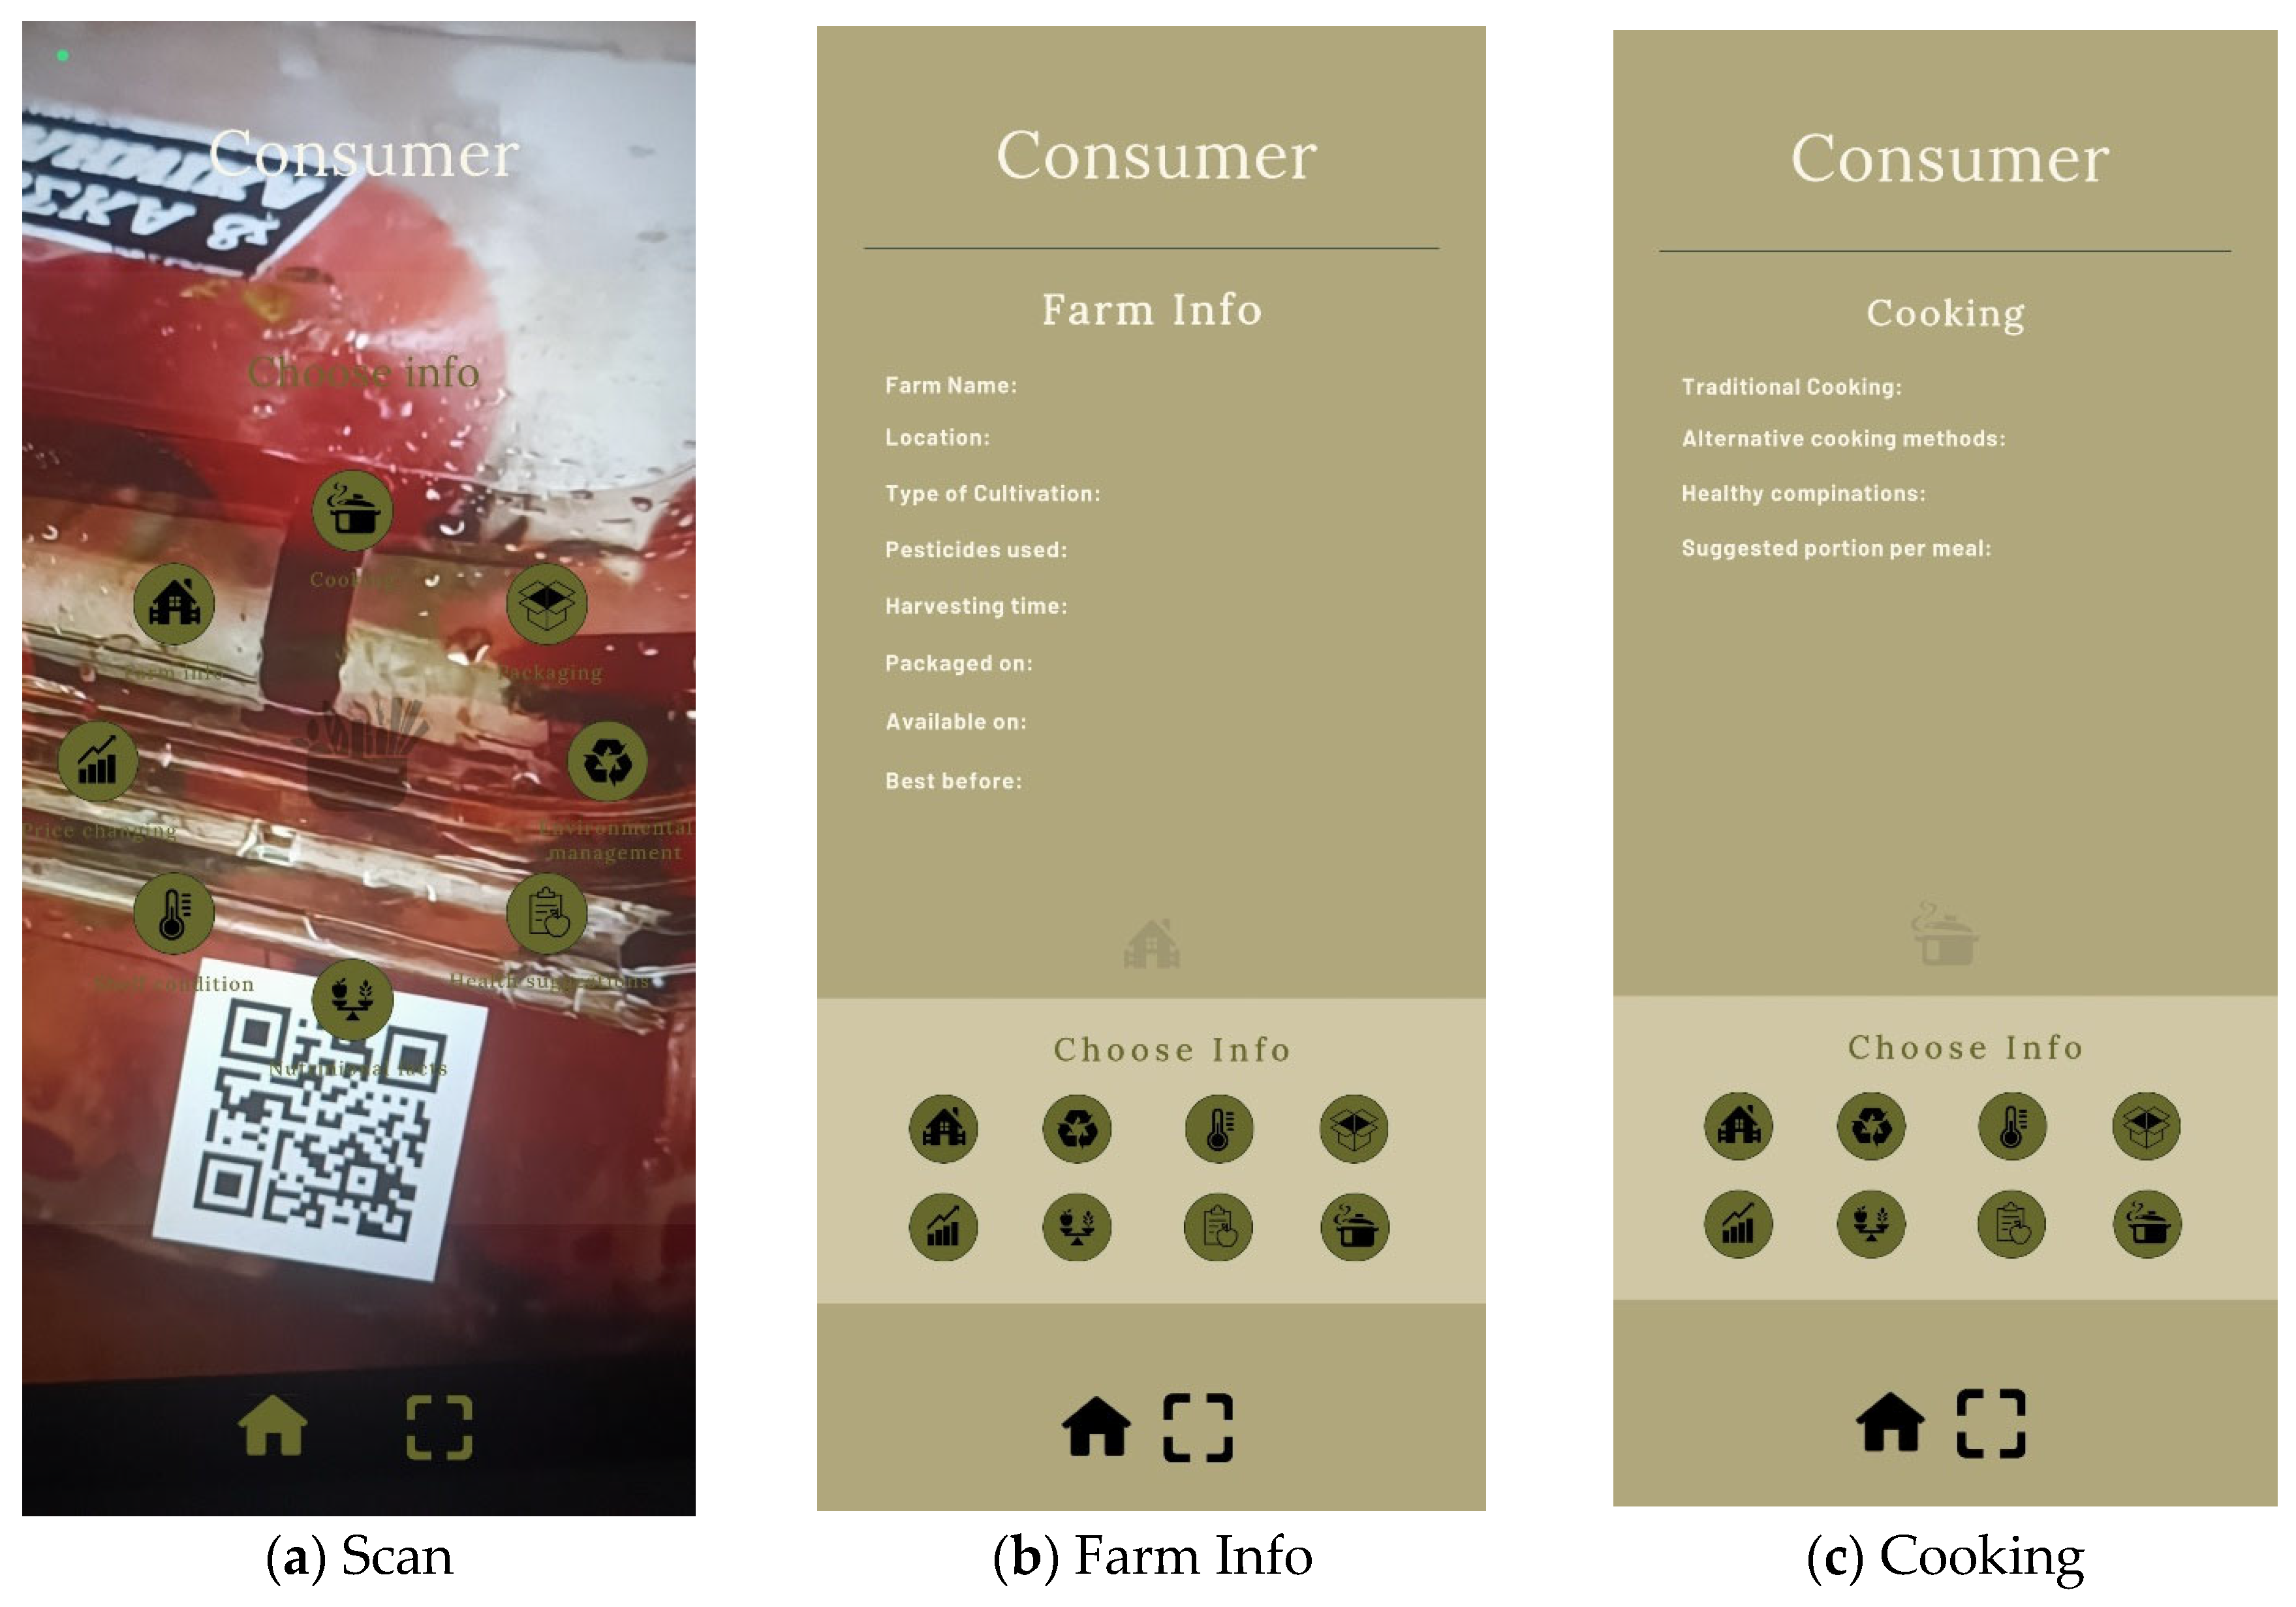
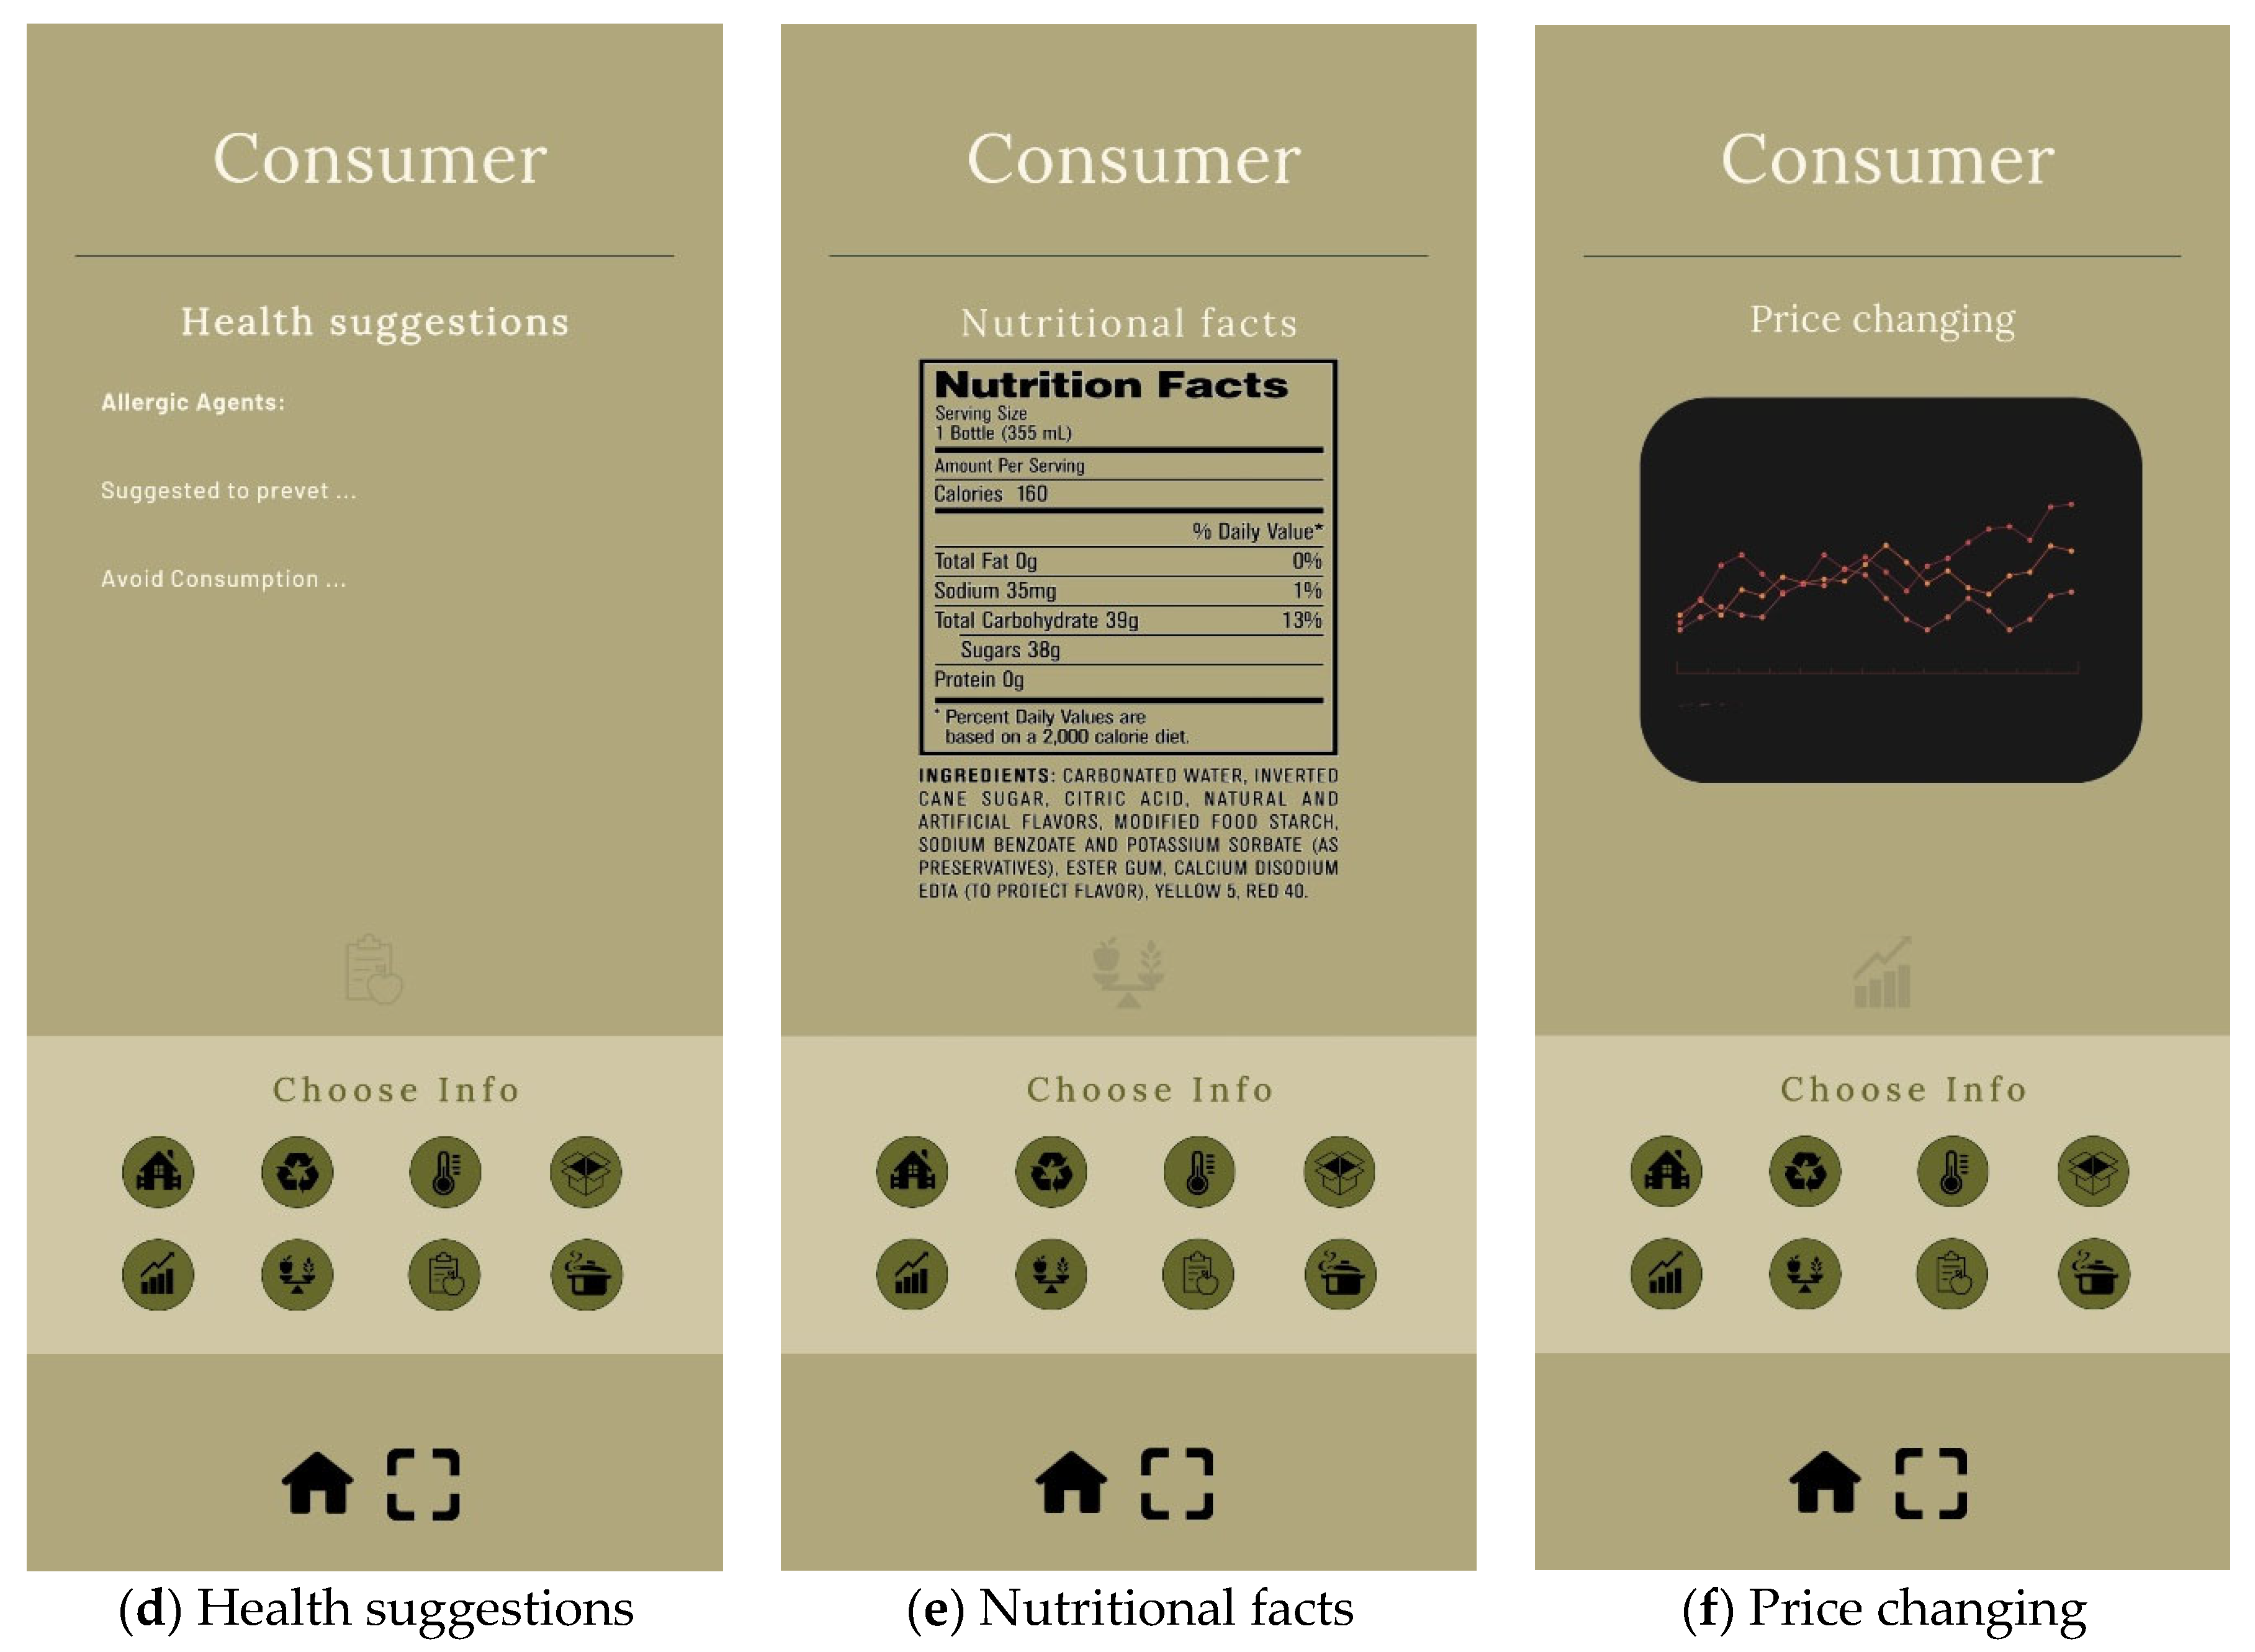
Apart from the Figma prototype, the part of the application that was implemented and evaluated addressed the consumers who would decide to buy a farm product from a market shelf. The implementation supports the following usage scenario:
A consumer visits a food market and decides to buy a farm product after having decided to consume it in combination with other products. The consumer approaches the shelf and scans (Step 2) a package of organic tomatoes. A menu appears on the mobile device, and the consumer chooses to view information about the farm of origin (Button: “Farm Info”, Step 3).
He/She next wants to find ways to accompany the specific product with others in order to prepare a healthy meal and touches the “Suggested Cooking Methods” button (Step 4) for suggestions. Provided that a healthy meal should avoid an incorrect combination of ingredients, the consumer touches the “Health Suggestions” button (Step 5) to obtain the corresponding information. He/she verifies the nutritional facts (Button: “Nutritional Facts”, Step 6) and price fluctuation (Button: “Price Changing”, Step 7) before making the final decision to buy the product. The steps are enumerated in the following list and include references to screenshots of the application shown in
Figure 3. Screenshots were captured during the operation of the application on a smartphone, implemented in Unity as mentioned below.
Figure 3 also displays the main menu in
Figure 3a and how menu buttons are aligned at the bottom of the screen in the rest of the screenshots when choosing an option.
Navigation Step by Step:
Download the app
Touch Scan for a bunch of tomatoes (
Figure 3a)
Touch Button: Suggested Cooking Methods (
Figure 3c)
Touch Button: Health Suggestions (
Figure 3d)
Touch Button: Nutritional Facts (
Figure 3e)
Touch Button: Price Changing (
Figure 3f)
To implement the application, we utilized Adobe Photoshop, Unity, and Vuforia. The Vuforia platform was used to implement the recognition of the product as soon as it is scanned by the mobile device so that the relevant information is displayed on the screen. It is a well-known platform to develop extended reality applications for mobile devices, as it tracks flat images and 3D objects from the real world using edge detection algorithms along with AI-enabled vision. All parts of the application, such as the icons, buttons, etc., were integrated with the use of Unity, which is a cross-platform game engine, offering a suitable environment for three-dimensional (3D) and two-dimensional (2D) games and interactive simulations. The background, buttons, and logo were produced or processed from free web icons by utilizing Adobe Photoshop CS6. We have uploaded the application at
https://drive.google.com/file/d/17cSJX61nSxjei9rEQhzvvUoqvuwED03N. It should be noted that the database is not implemented in this early prototype, but we plan to employ open-source technologies such as MySQL and PHP to host and access content, respectively, through the Unity environment, as we already have in other of our implementations [
66]. RFID sensor access in Unity will also be implemented through plugins. We have already described a full-scale implementation, engaging all technologies and sensors in
Figure 2.
6. FoodTrace Evaluation
6.1. Evaluation Methodology
This section presents the evaluation methodology of the FoodTrace application along with the evaluation results. Although we have proceeded with preliminary testing with a relatively small sample pool of 26 individuals, we consider the results for our tool to be promising since all the participants were randomly selected people who were shopping in markets, and the only prerequisite was for them to own a mobile device with a camera and to be adults. Although most of them had not used such an application before, they rated it highly and did not find it difficult to use.
The FoodTrace application was evaluated by a set of end-users, acting as consumers, regarding (a) usability by employing SUS; (b) the use of the application for everyday food choices through a questionnaire; and (c) missing information they would like the application to contain, proposed through open-ended questions. A total of 14 men and 12 women between the ages of 25 and 59 participated in the evaluation from the city of Myltilene, Greece. All participants signed a consent form, citing that we respect their privacy data according to EU law.
Taking into consideration that most of them were not familiar with the use of an AR application, a short explanatory document was initially delivered to them, and a brief tutorial occurred before they participated in the evaluation.
The evaluators were then asked to search a package of organic tomatoes to identify what kind of information they could obtain regarding the product. They then had to use the application to obtain further information about the product. The participants were asked to download and install the application on their mobile devices and, after scanning the product and navigating to all available information, to participate in the three evaluation modules. The whole procedure lasted about fifteen minutes, and the participants were instructed not to interact with each other before answering the questionnaire. Since a farm product cannot be preserved under room conditions, the package was delivered empty so that evaluators could trace the information based on it. They had to scan a picture of it in order to initiate the application.
The first evaluation module group aimed to assess the usability of the application. The System Usability Scale (SUS) [
67] method was used, which provides a reliable tool for measuring usability and consists of a 10-item questionnaire with five response options available: “Strongly Disagree”, “Disagree”, “Neither Agree Or Disagree”, “Agree” and “Strongly Agree”. Usability analysis was performed with the use of the SUS Analysis Toolkit [
67], and detailed findings are available upon request. The form containing the ten questions is shown in
Table 1 and was created in Google Forms. Since the research took place in Greece, both the questionnaire and the explanatory document were translated in Greek, which was the native language of the participants. A complete questionnaire is shown in
Appendix A.
The second group of questions was to evaluate the use of such an application for everyday food choices (
Table 2). The questionnaire was drafted with the aim of assessing the value of the application in food choices and how it could contribute to food sustainability and waste management. Moreover, it aims to investigate the possible enhancement of a relationship of trust between producers, processors, and consumers. Once again, it was created in Google Forms with five possible response options ranging from “Strongly Agree” to “Strongly Disagree”.
Lastly, the third part contains three open-ended questions to encourage evaluators to propose missing information they would like the application to contain and to illustrate the most attractive and useful elements of it (
Table 3). This last part will provide us with insights and improvements for the application.
6.2. Results of the SUS Evaluation
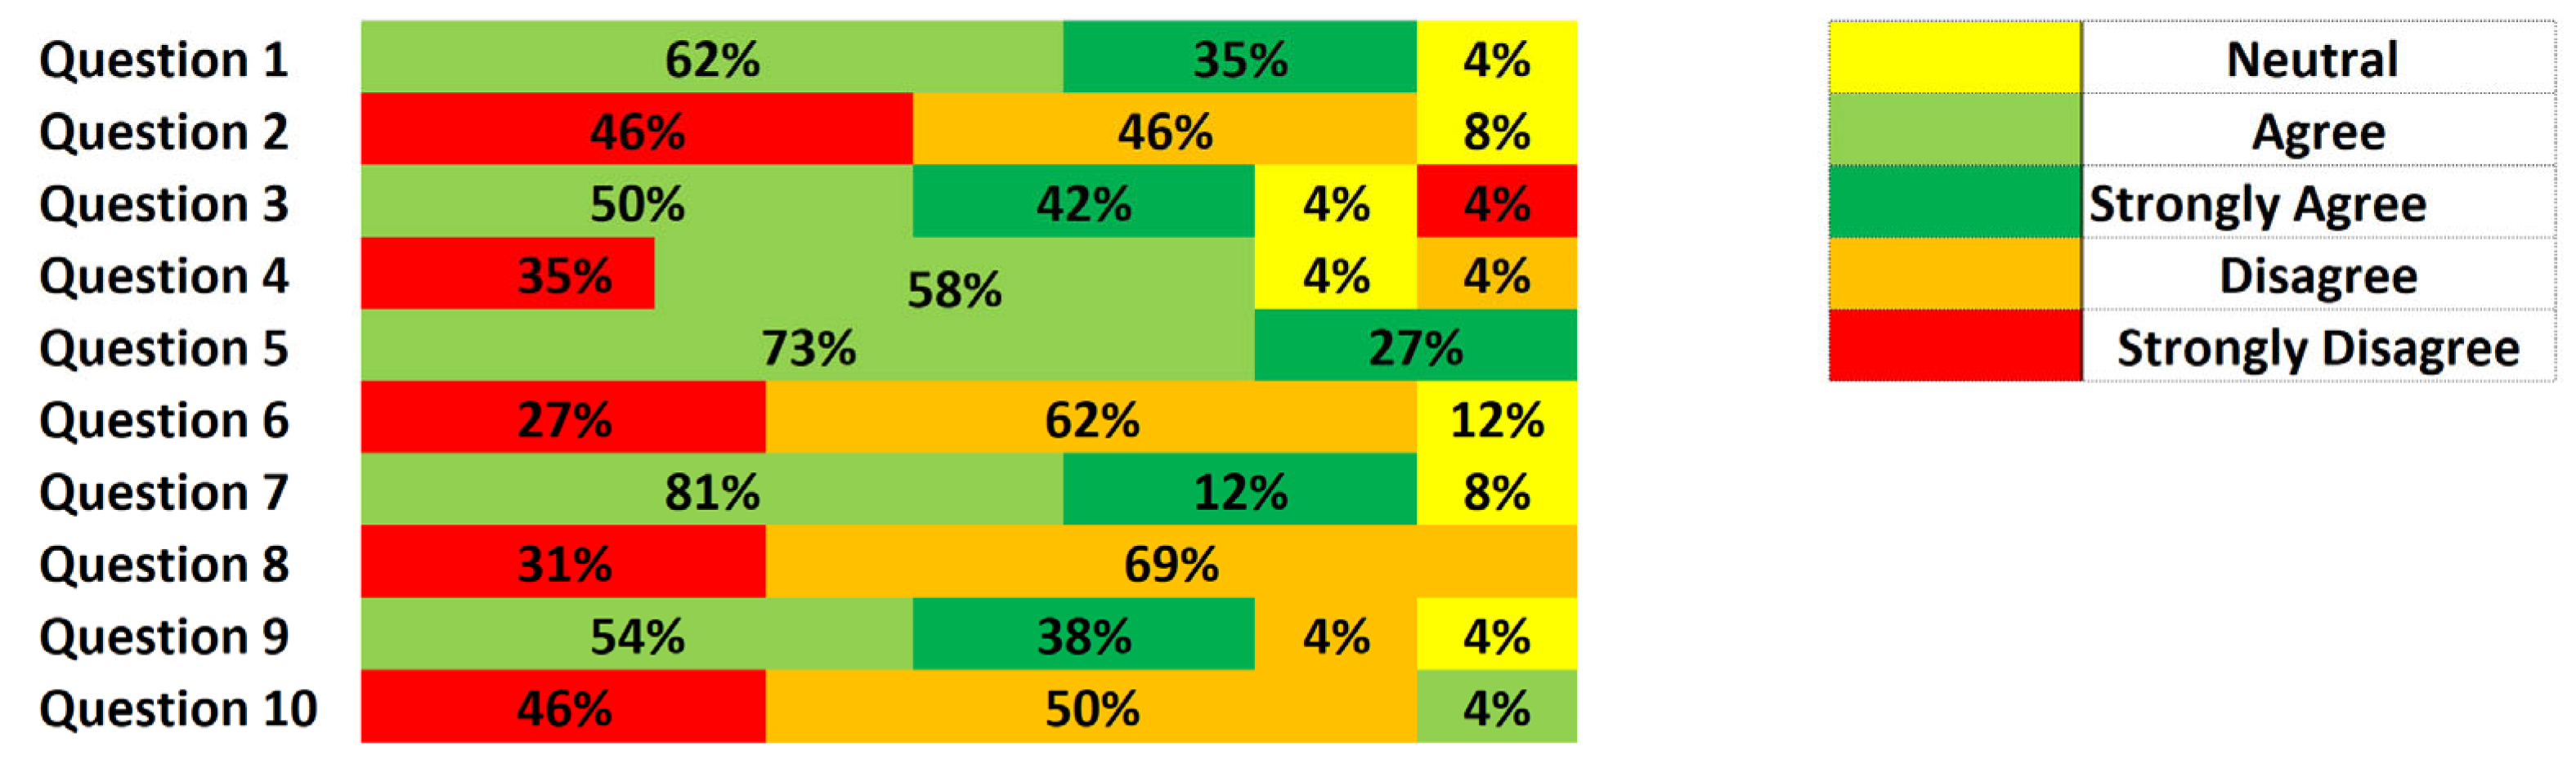
The results of the first part of the assessment, concerning the usability of the application, are presented in
Figure 4. They were converted into percentages using the SUS Analysis Toolkit.
As shown in
Figure 4, most of the participants would like to use the application frequently and did not find it complex but rather easy to use. Participants did not think that there was a need for technical support. They also pointed out that the various functions of the application were well integrated and that there were no inconsistencies. A high percentage of the participants felt confident using the application and believed that most of the users would learn to use it very quickly, disagreeing that it was cumbersome to use it. Ultimately, almost everyone disagreed that a lot of things needed to be learned in order to use the application.
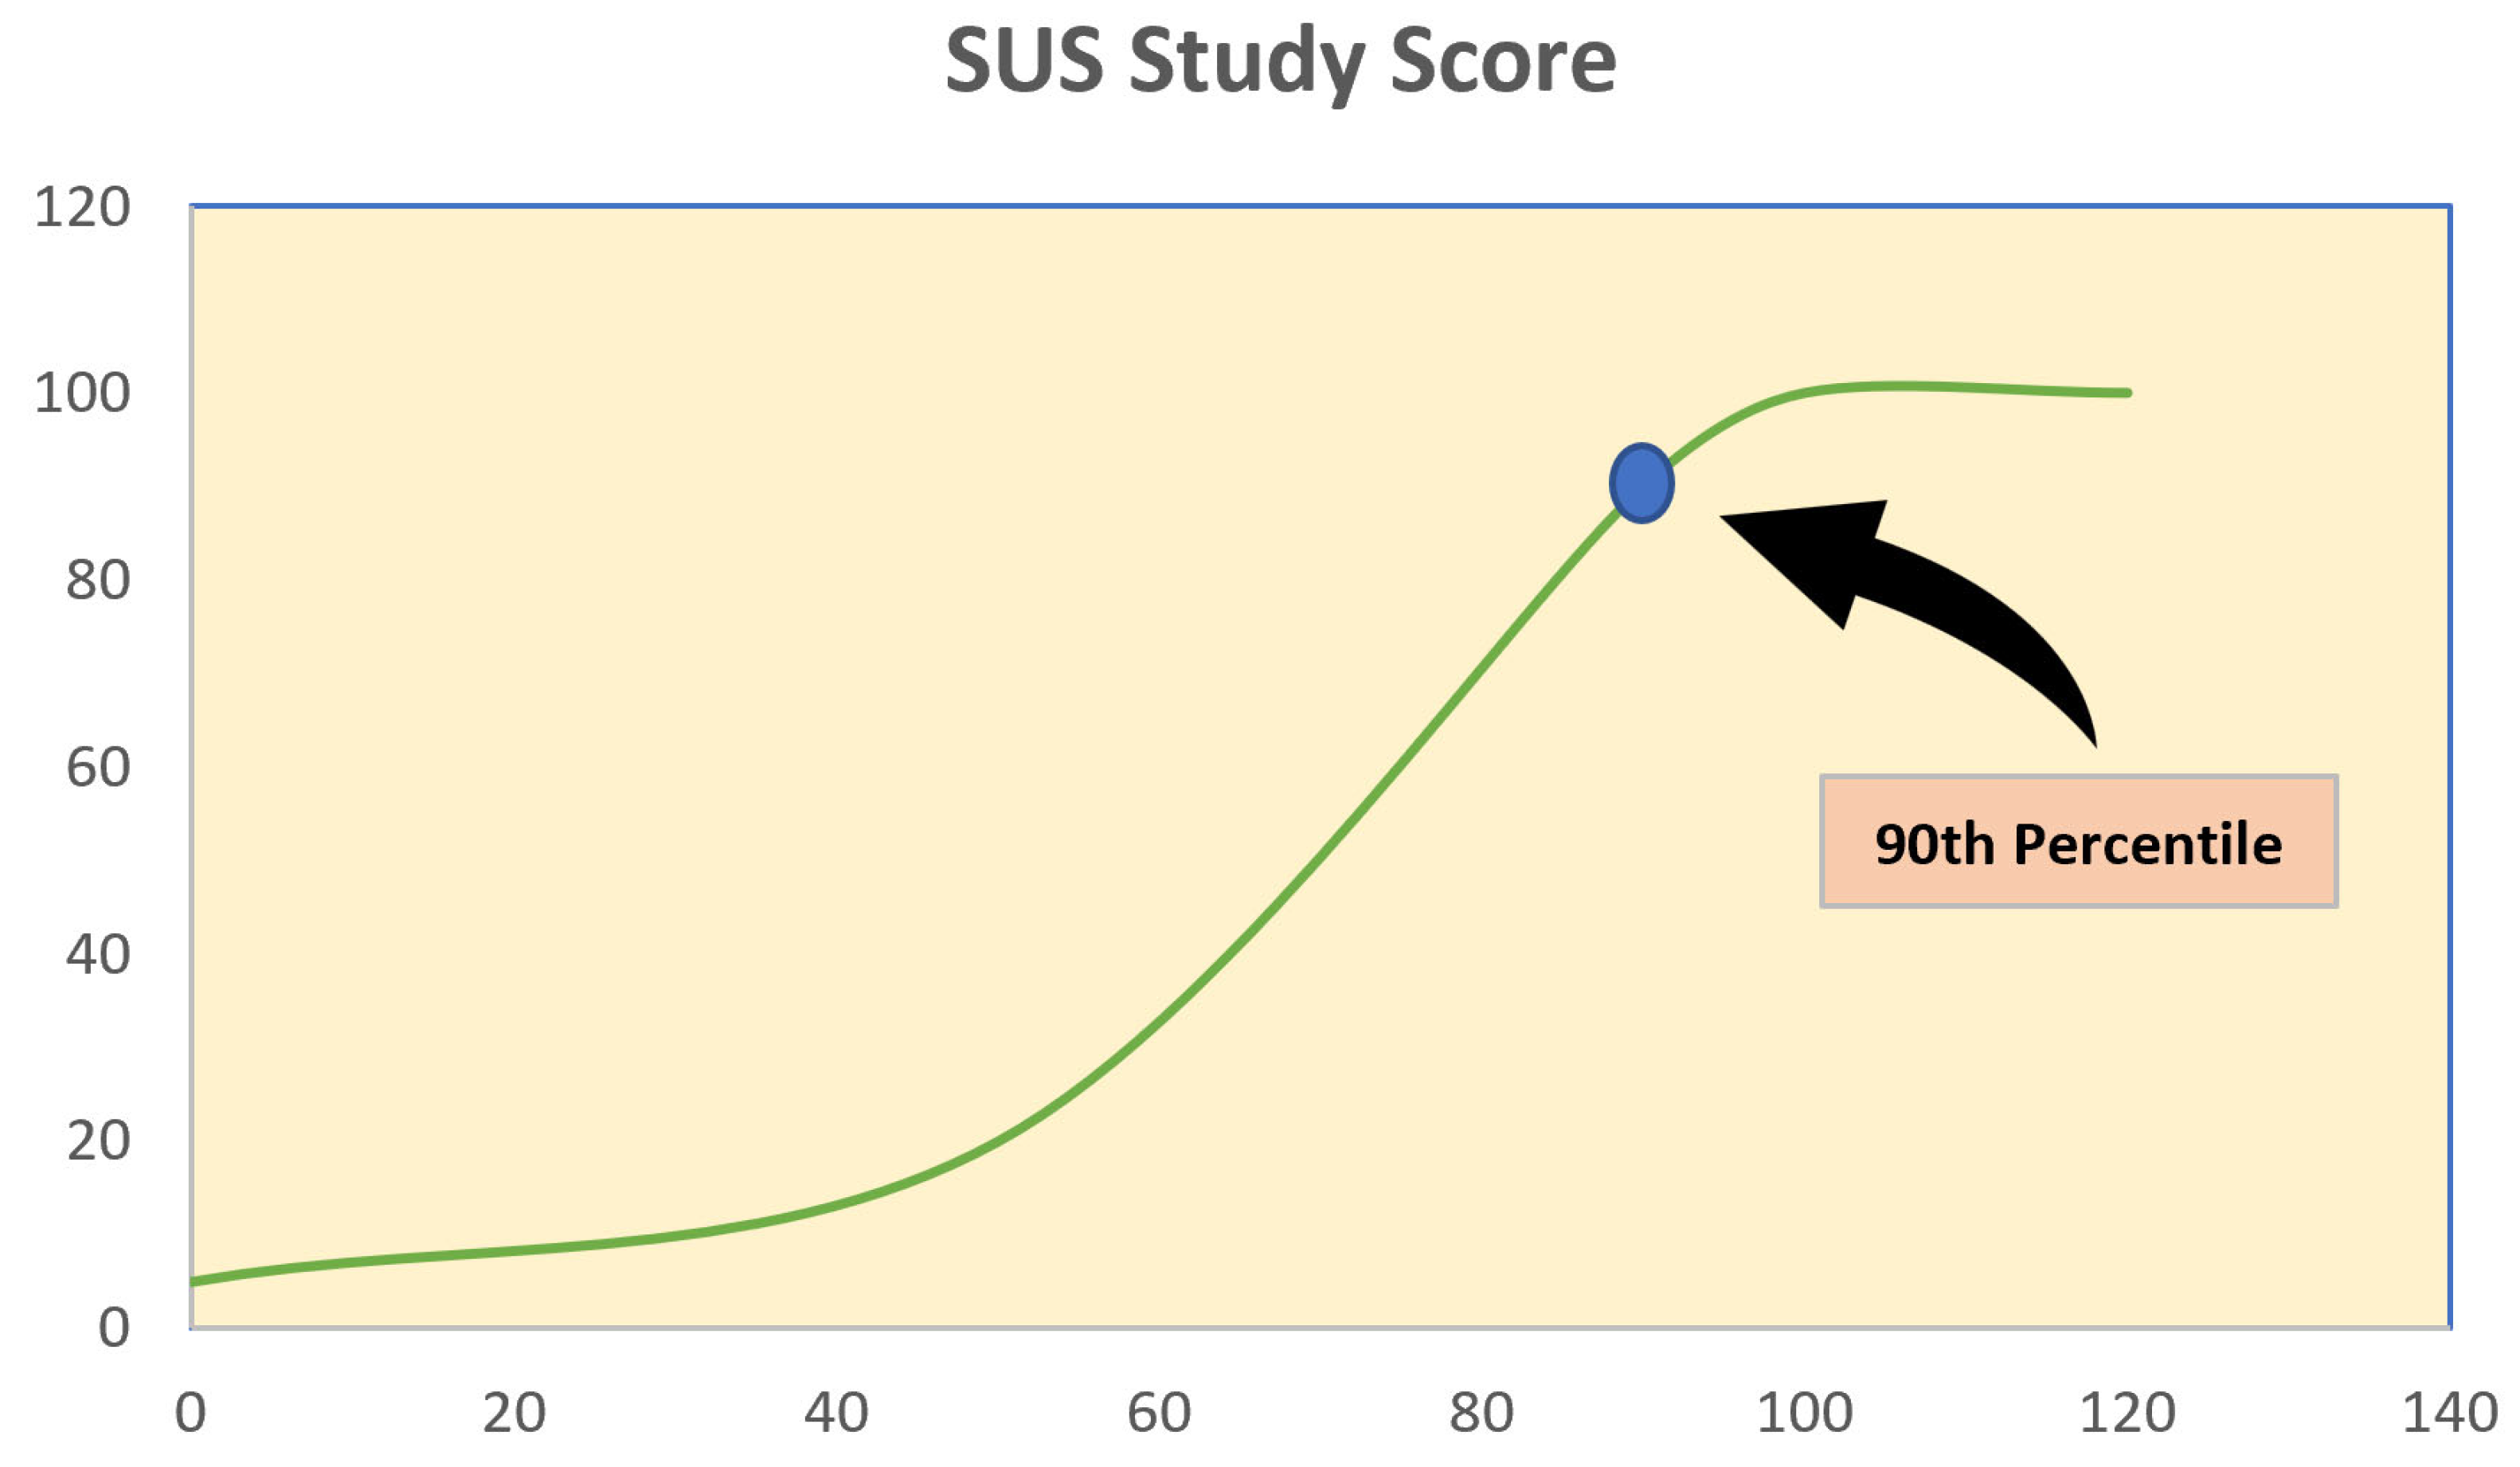
Generally, the SUS study score was 81.54%. The median was 80, along with a standard deviation of 8.44 (
Figure 5).
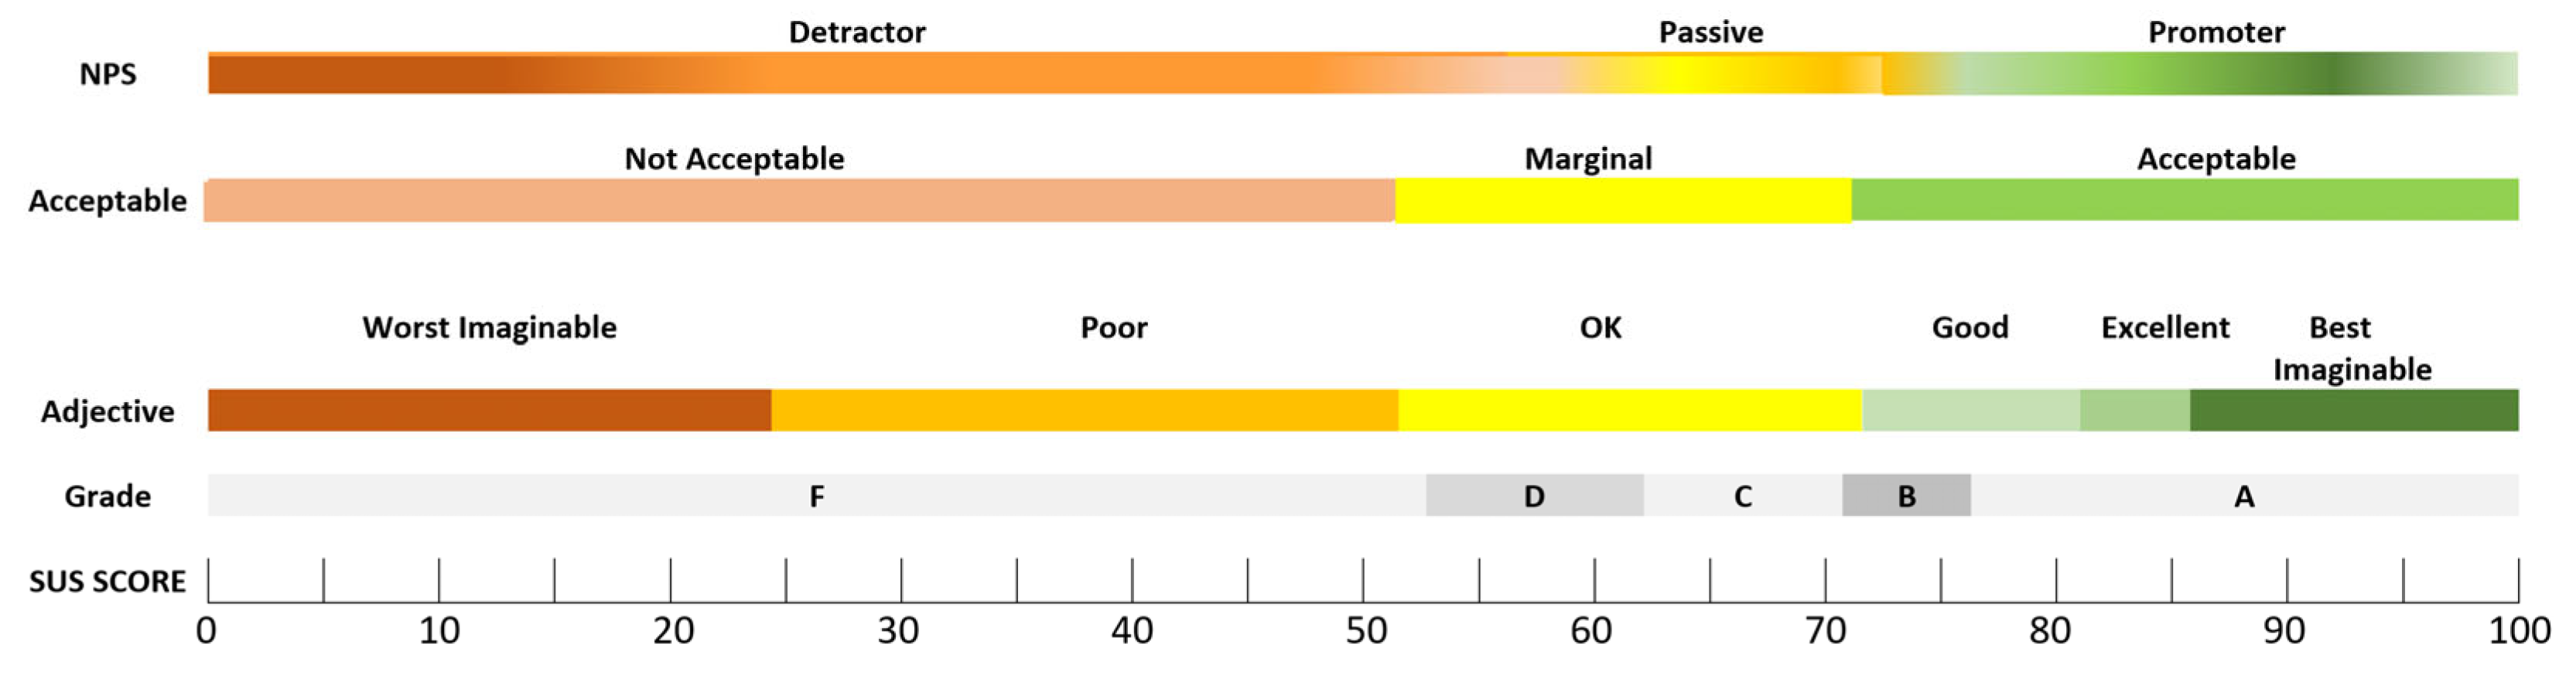
As far as the Adjective Scale is concerned, the application scored an Excellent and was graded as an A. The Adjective Scale [
68] reviews the SUS study scores on descriptive adjectives ranging from “Worst Imaginable” to “Best Imaginable” (
Figure 6).
Summarizing the findings of our research in terms of usability, we ascertained that the participants in our research found the application easy to use without technical support, and they believe that the same applies for other users as well. They found that the various functions of the application were well integrated, and they would like to use it frequently.
6.3. Results of Consumers’ Assessment in Real Life
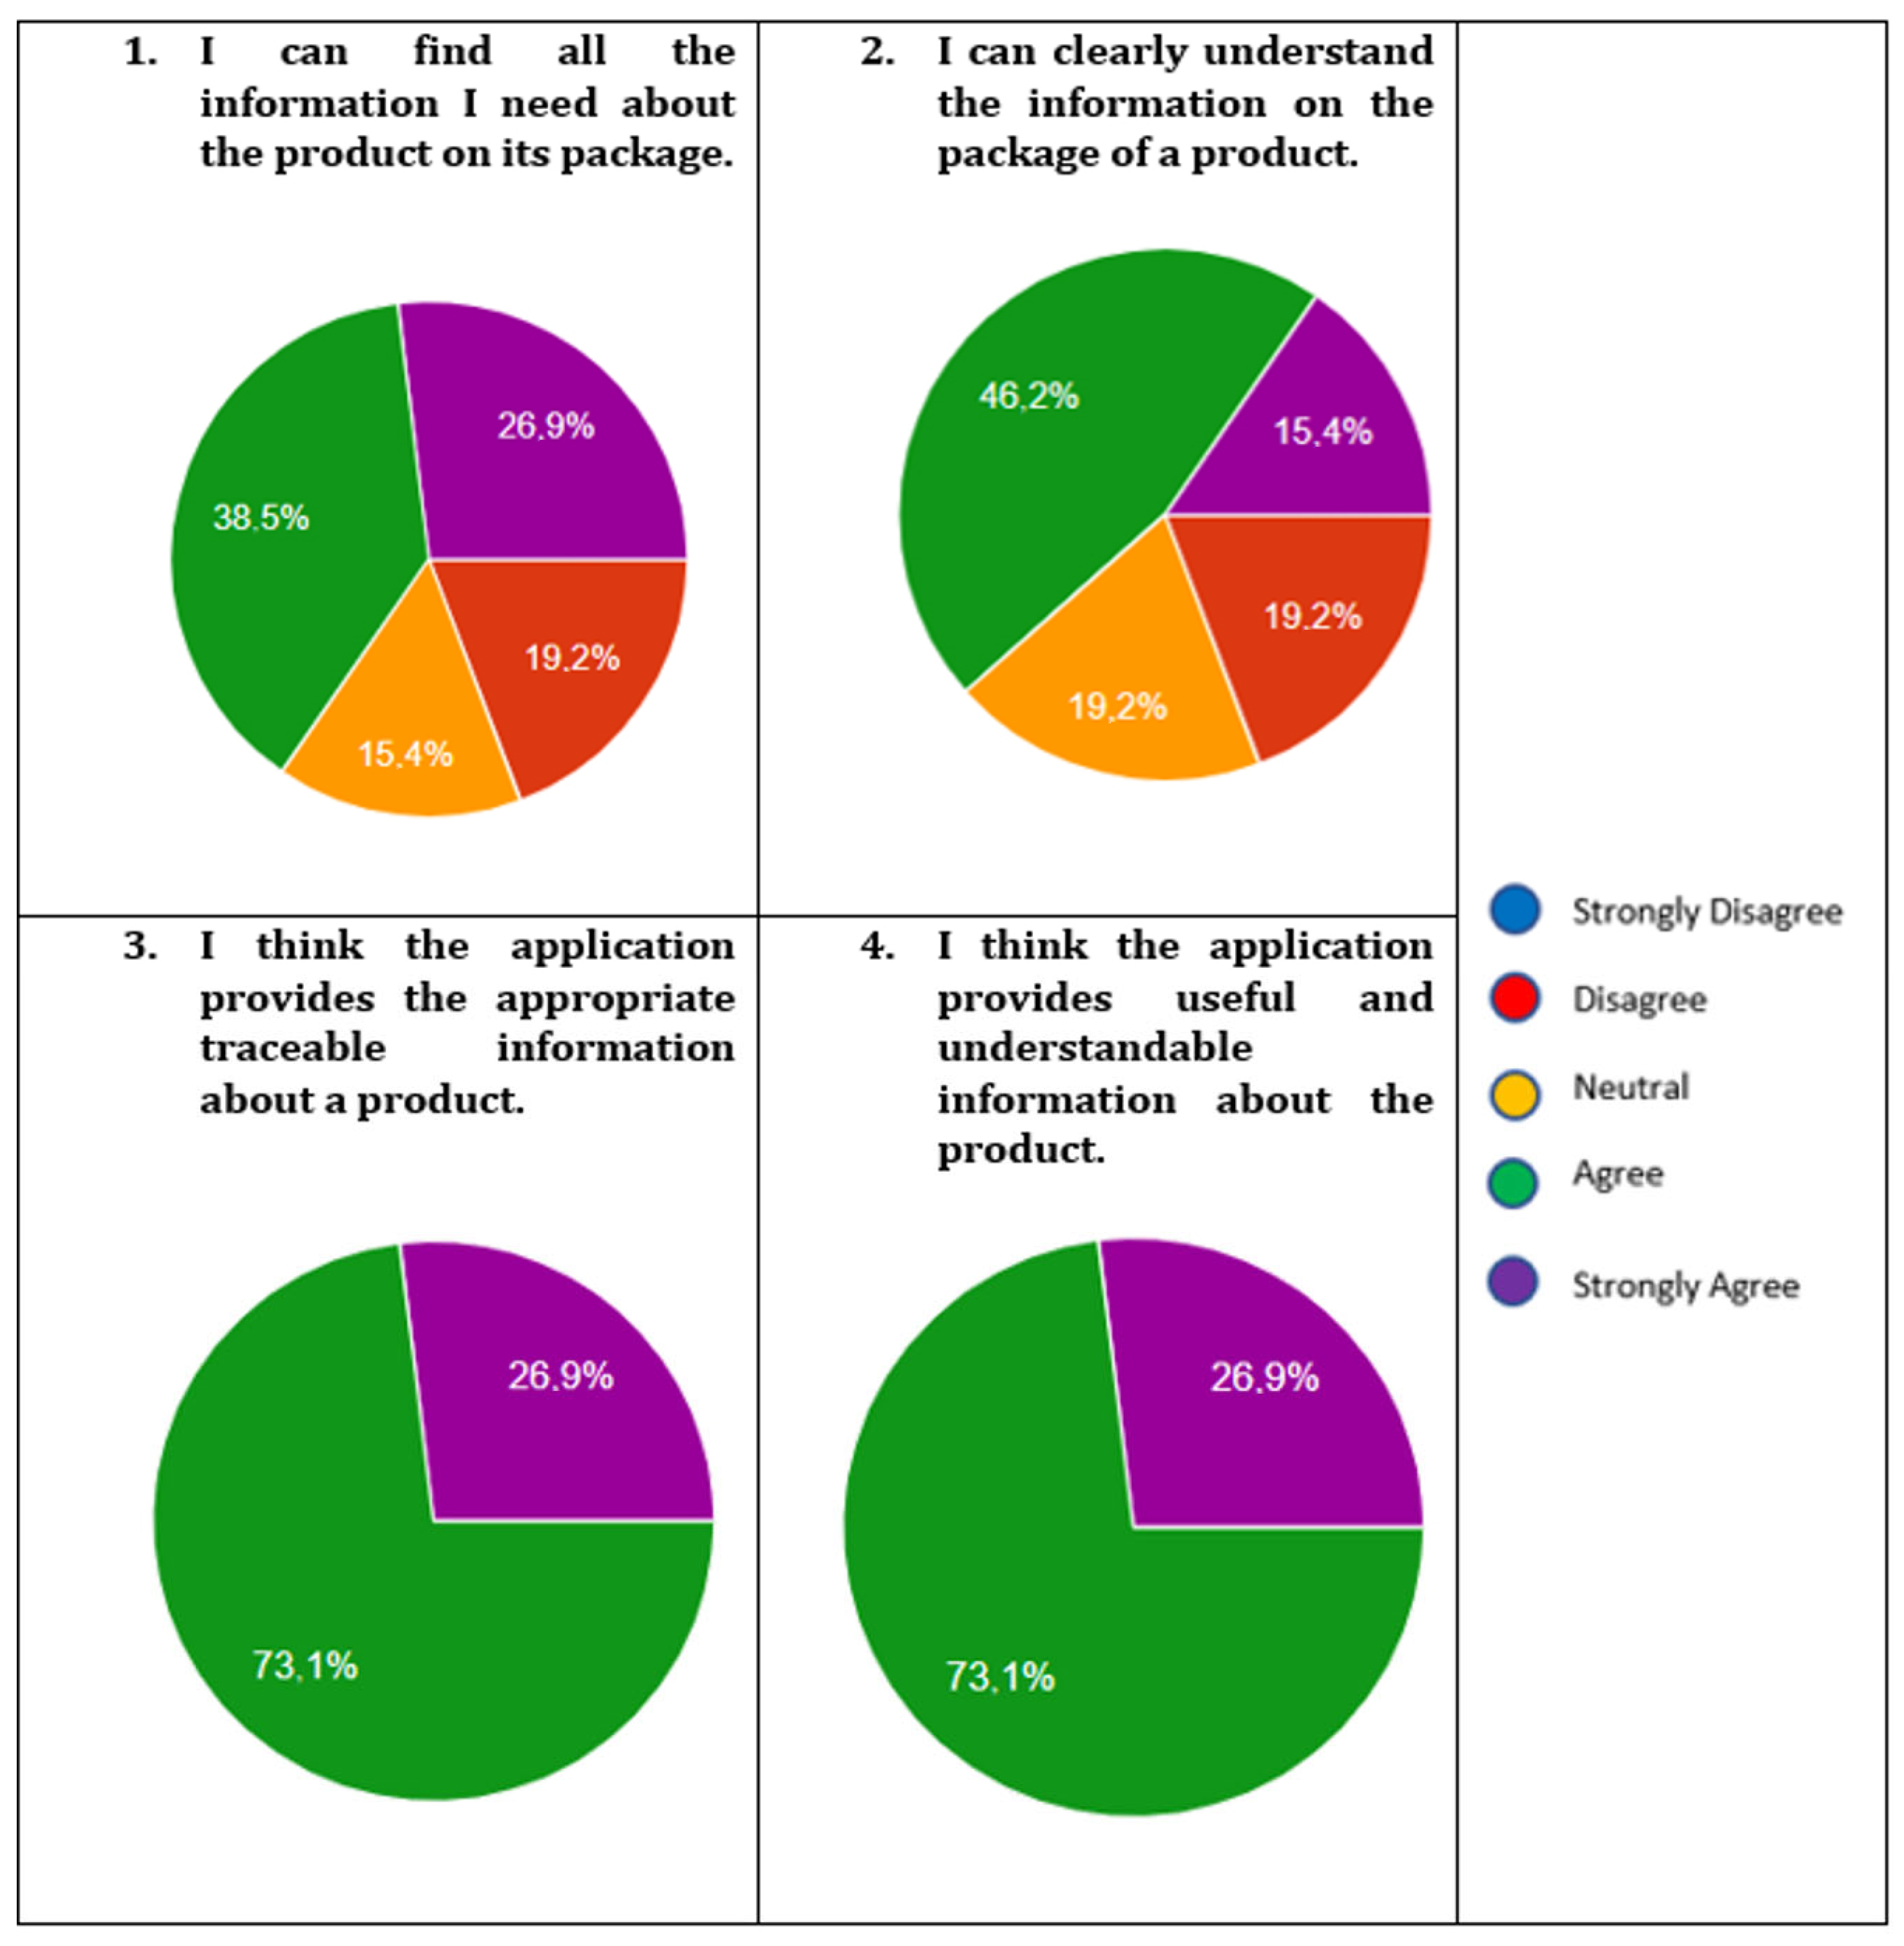
This part of the assessment concerns the utilization of the application by users acting as consumers in a supermarket and their point of view in real-life conditions. The first two questions were about the information provided on a product package and whether the information was understandable. Most of the evaluators stated that they could find all the information they needed on the package and that they could clearly understand it. All of the evaluators agreed that the application provided appropriate traceable information about the product, and the same percentage thought that the application provided useful and understandable information about the product (
Figure 7).
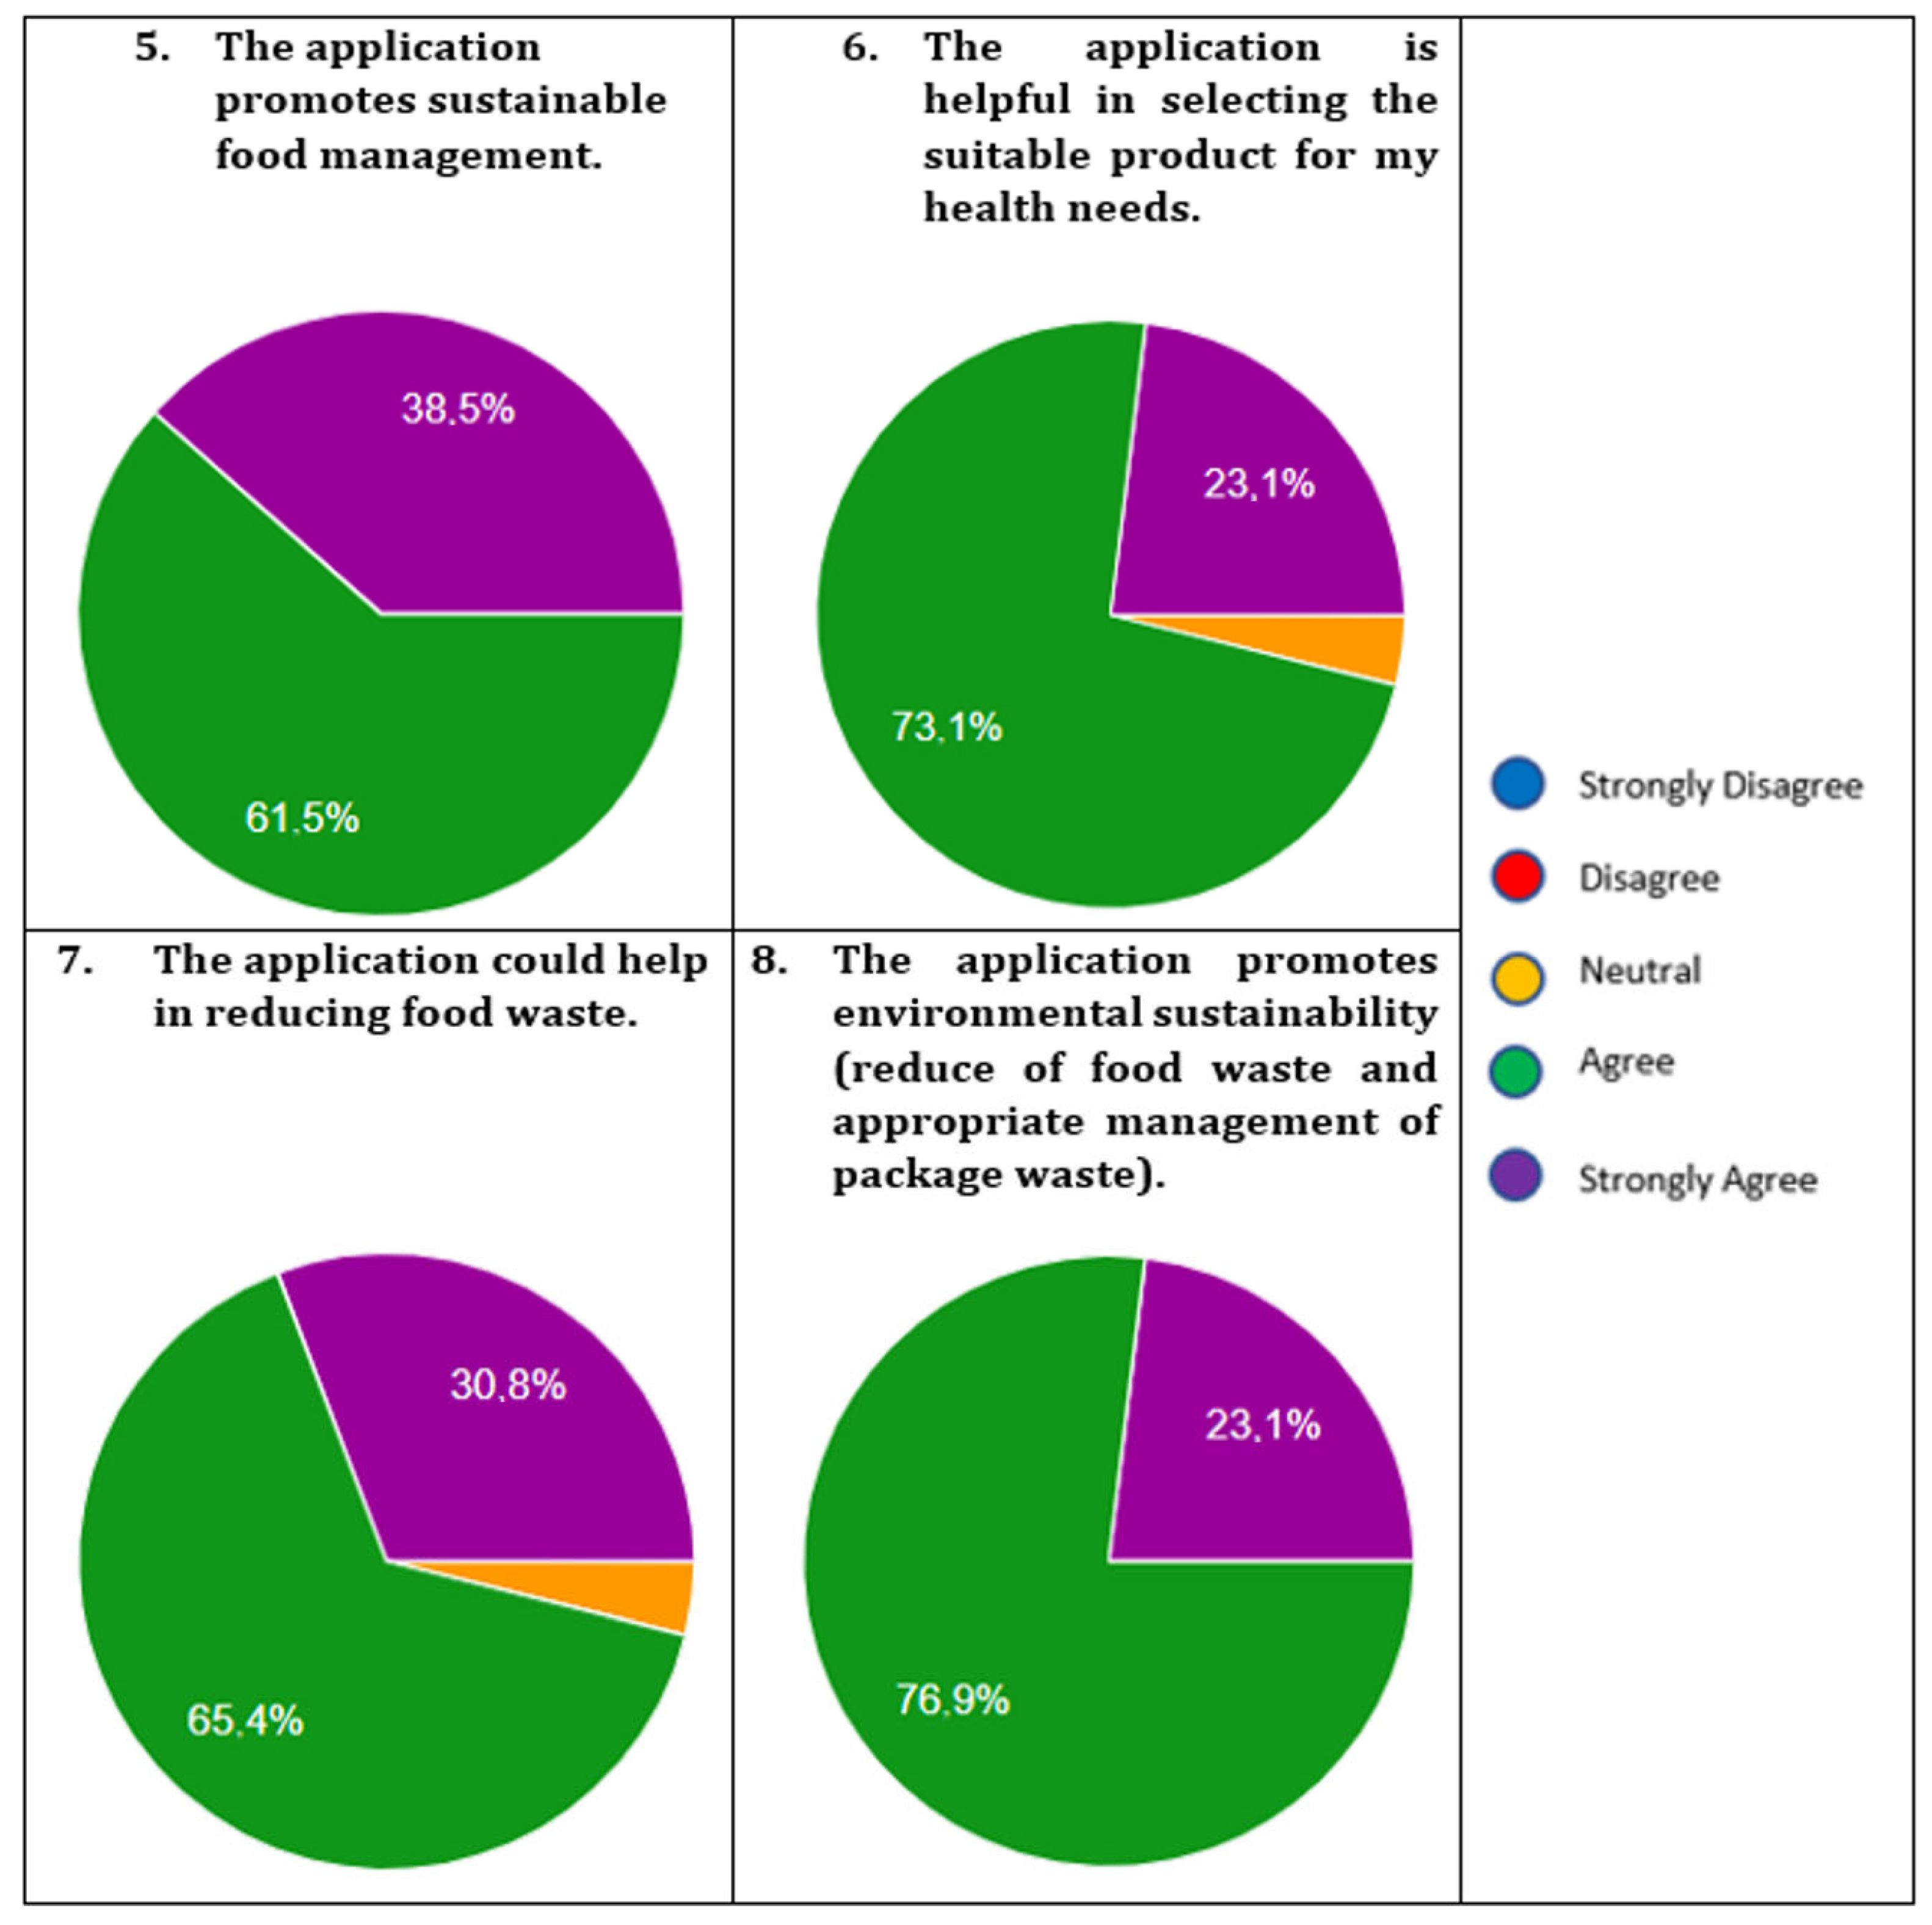
Most evaluators agreed that the application promoted sustainable food management and that it was helpful in selecting a suitable product for a consumer’s health needs. Regarding food waste, most assumed the application was related to this topic, whereas all participants agreed that it promoted environmental sustainability in terms of reducing food waste and managing package waste (
Figure 8).
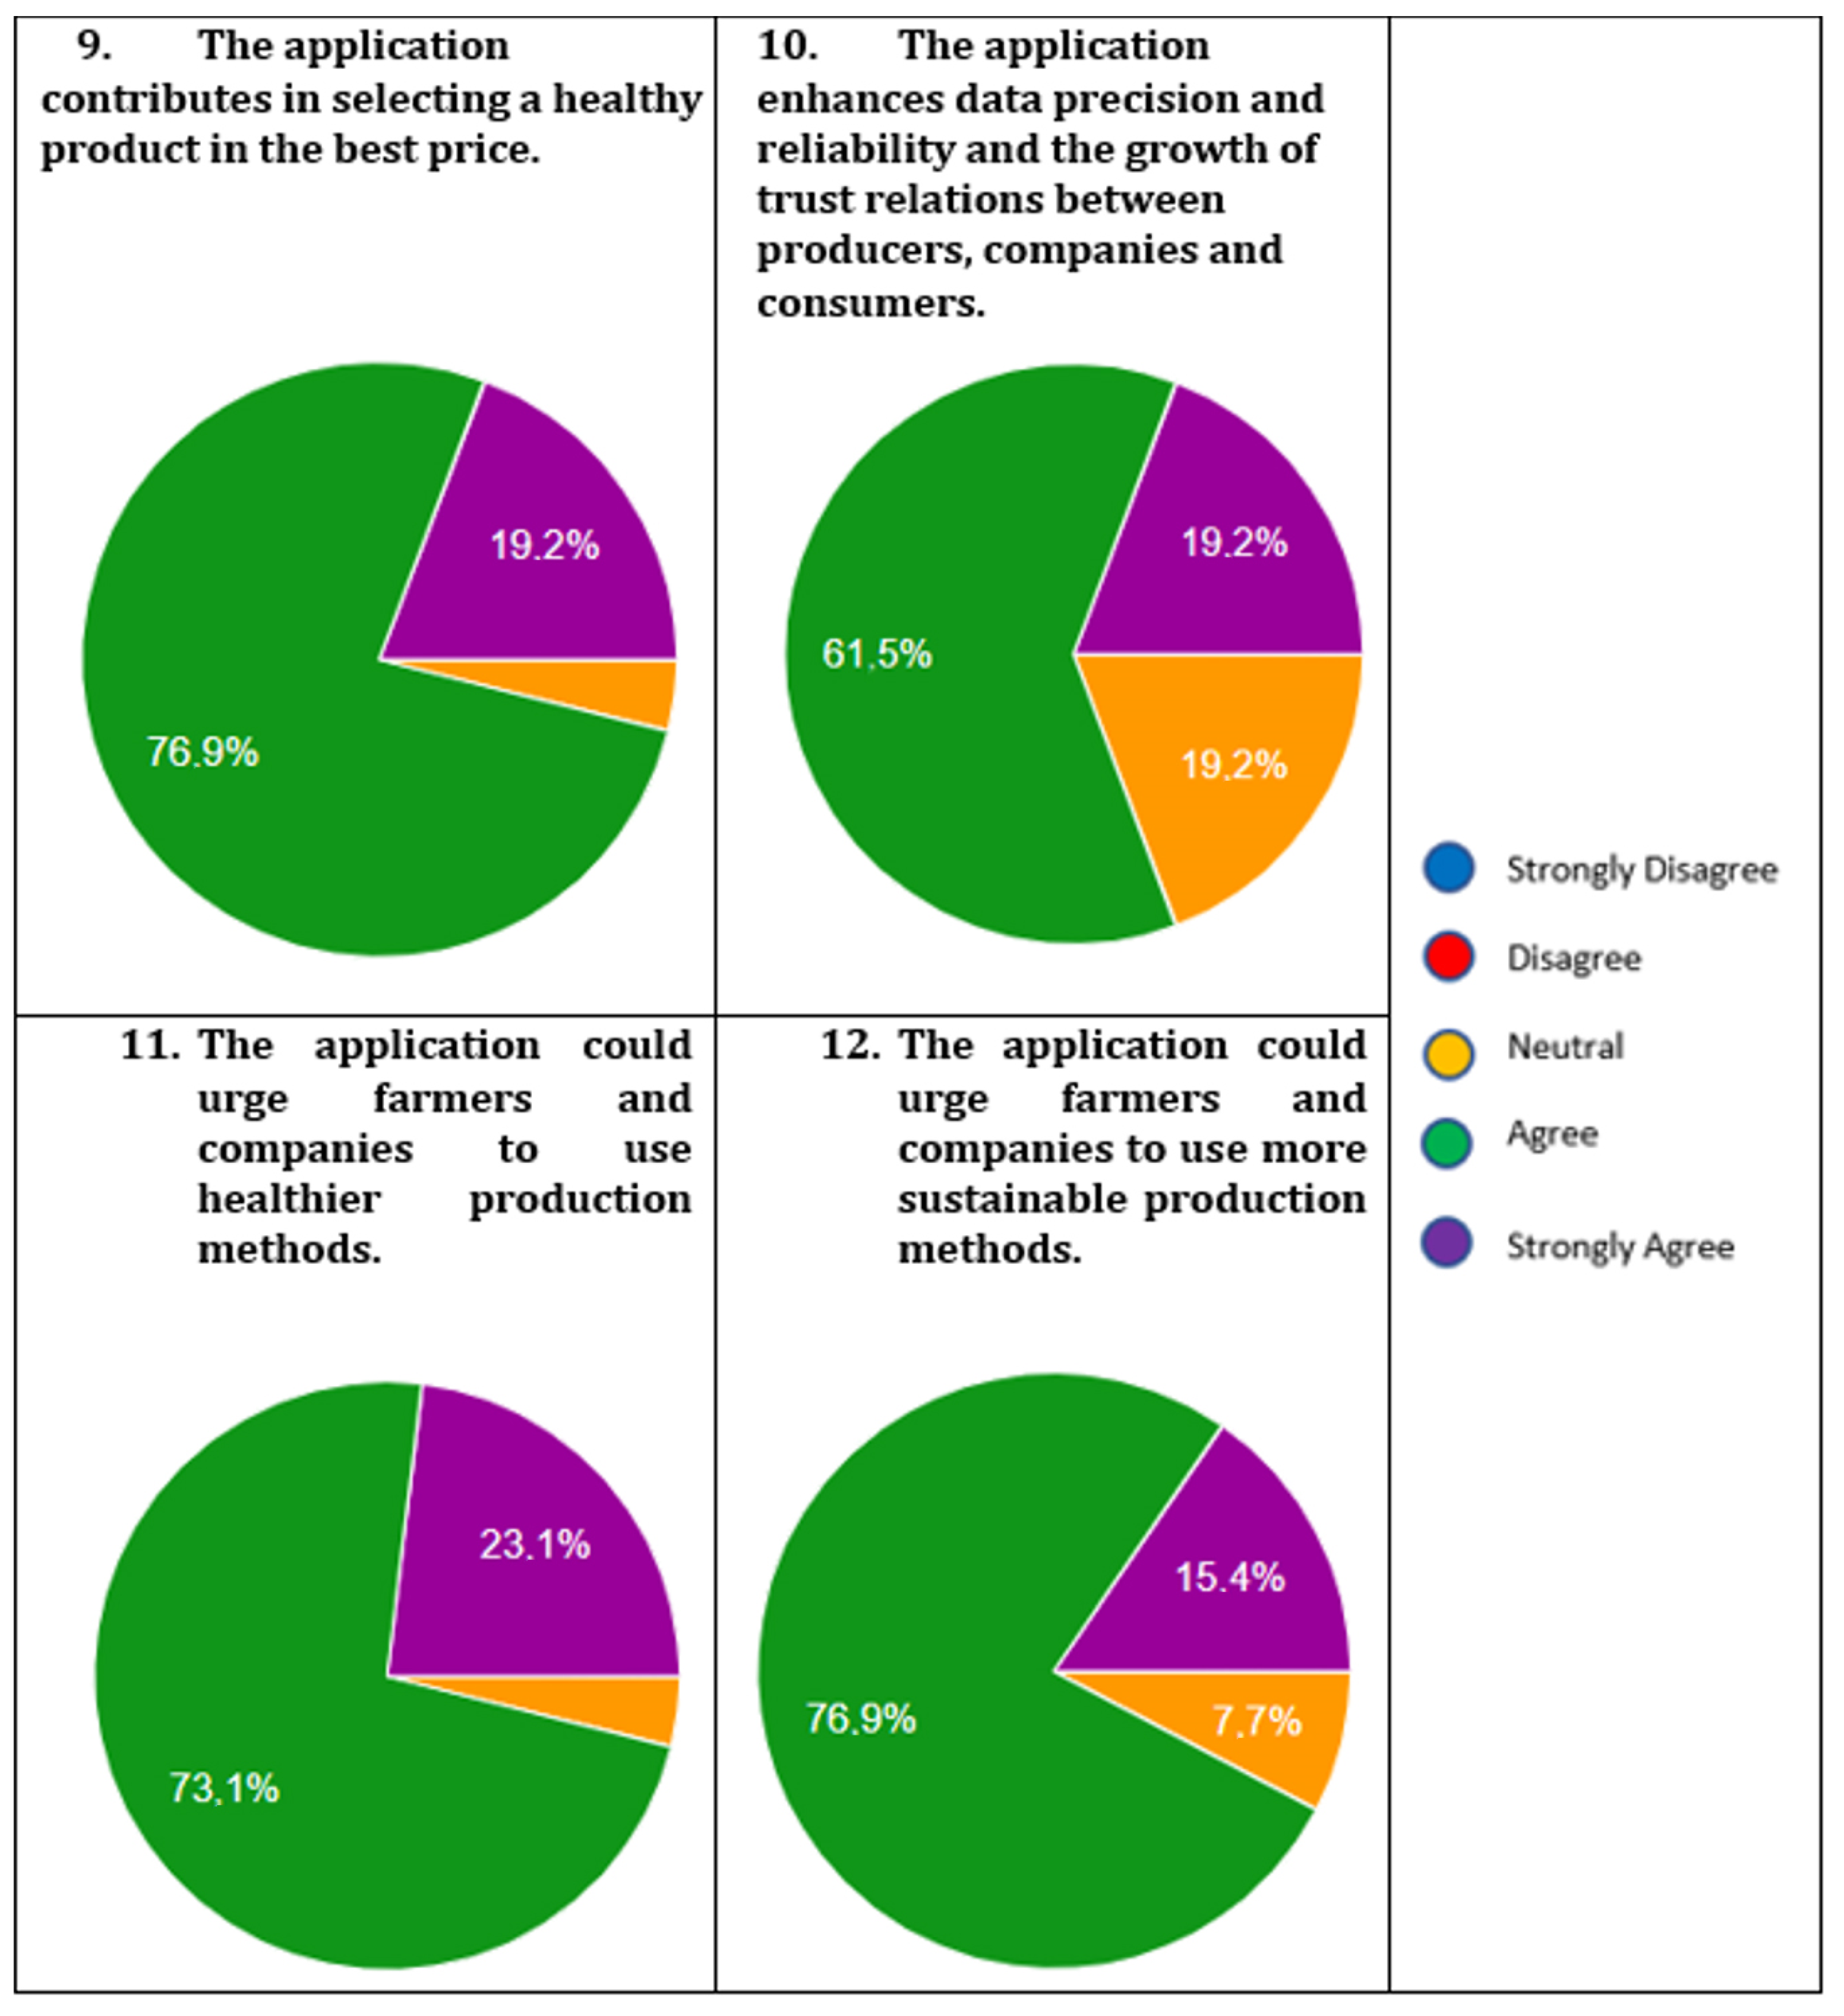
Regarding the selection of a healthy product at the best price (Question 9), most of the evaluators felt that the application could support this decision and enhance the relations of trust among consumers, companies, and producers (Question 10). Finally, questions 11 and 12 were about healthier and more sustainable production methods. Participants answered that the application could urge farmers and companies to use healthier production methods and that it could facilitate more sustainable production methods (
Figure 9).
6.4. Suggestions for Improvements
Regarding the suggestions stated in the three open-ended questions, evaluators suggested it would be useful for the harvesting time of the product to be converted to days so that the time needed from production to placement on the market shelf is more obvious to consumers. This should be combined with comparison data about similar products from other farmers and price comparison information. More personalized information, such as a gradation of the conciseness of specific ingredients and an audible notification when certain limits are exceeded, in addition to a purchase history, would also be very useful.
An attractive feature of the application indicated by the evaluators was that customers can obtain information for a specific product across the whole supply chain until its arrival on the market shelf and that they can check shelf conditions and possible alteration of the product along with price fluctuation. Evaluators also found estimated nutritional facts and information about chemicals and pesticides used during their processing to be useful. Food and environmental sustainability were also important to them, along with preserving traditional food products and learning their history, health suggestions, cooking recommendations, and disposal tips.
For further improvement, evaluators suggested: the option of choosing between at least two languages for searching the information; the existence of an age indicator for the product; the ability to search for violations of labor and environmental legislation along the entire production–circulation chain; and transport conditions and duration. Regarding environmental sustainability, they proposed a percentage indication of the contribution of each product to recycling and how food waste should be reclaimed as animal feed or materials for students of agriculture, dietetics, food technology experiments, etc.
6.5. Impact on the Research Questions
Returning to the research questions posed in
Section 5, we discuss whether each of them has been addressed adequately by the application and its evaluation.
RQ1: Answers in the first part of the questionnaire were related to usability and prove by a large percent (81.54% SUS study score) that the evaluators were fond of using the application without experiencing any particular difficulties and even suggesting new usability features in Part C of the questionnaire, such as choice of language, searching the interface about labor and environmental legislation, etc.
RQ2: The application provided enough information about the origin of the food products, as expressed by the mostly positive answers to questions 1, 2, 3, 4, and 10 of Part B of the questionnaire, stating that they understood the information provided about the ingredients and the origin of the food products.
RQ3: Similarly, the application supported healthy food choices as evaluators responded positively to questions 6, 9, and 11 of Part B of the questionnaire, ensuring users would choose products from responsible farmers and companies.
RQ4: Sustainability regarding food selection, consumption, and waste management was supported more than adequately by the application, as evaluators expressed through questions 5, 7, 8, and 12 of Part B, along with propositions to strengthen sustainability in Part C.


