1. Introduction
The critical examination of natural resource management and the ramifications of human development on the environment was prominently articulated at the United Nations Conference on the Human Environment, held in Stockholm, Sweden, in 1972. During this seminal event, it was discerned that the trajectory of human evolution could adversely impact sustainability across three pivotal dimensions: economic, social, and environmental [
1]. Sustainability has been increasingly perceived as a multifaceted construct, necessitating a broad spectrum of indicators for a comprehensive understanding of some elements that influence the system [
2].
One of the most formidable challenges is the identification of pertinent indicators that not only guide the trajectory toward sustainability but also effectively assess the impact of community-centric interventions [
3]. Moreover, it is paramount to maintain a balanced representation of indicators across the economic, social, and environmental dimensions to ensure a nuanced and equitable evaluation of the determinants of sustainability [
4]. In this context, certain entities, such as the United Nations Commission on Sustainable Development, established in 1992, have been instrumental in developing and proposing comprehensive indicators that encompass social, environmental, economic, and institutional facets for national-level sustainability assessment [
5].
Despite a global consensus on the imperative of sustainability, a standardized methodology for its quantification, crucial for the formulation of sustainable development strategies remains elusive [
6]. The repercussions of this lack of consensus are manifest in escalating economic, productive, and social disparities, alongside a persistent and growing rural indebtedness. These trends not only exacerbate the challenges faced by rural communities but also diminish the viability of rural livelihoods [
7]. In Colombia, the contrast in socioeconomic conditions is especially stark. According to data from the National Planning Department (DNP), the incidence of multidimensional poverty in rural regions during 2021 and 2022 was notably higher, at a rate of 3.1 times greater than that observed in urban centers [
8].
The Colombian rural sector is predominantly engaged in agriculture, characterized by extensive, low-productivity models. This is evidenced by the fact that of the 43 million hectares designated for agricultural use, 34 million are devoted to livestock farming, an industry fraught with significant environmental concerns, including deforestation and greenhouse gas emissions. Despite these challenges, livestock farming contributes 1.7% to the national gross domestic product (GDP) and 25% to the agricultural GDP [
9]. In the department of Nariño, the rural reality is stark, with nearly 50% of the population residing in rural areas, contrasting sharply with the 23% national average. This demographic distribution has profound implications for development paradigms and the formulation of sustainable public policies [
10]. The Nariño economy is heavily reliant on agricultural production, which accounts for approximately 15% of the departmental GDP, a figure that is 2.4 times the national average [
9]. Dominant crops include coffee, potatoes, bananas, cocoa, and oil palm, collectively representing 56% of the total cultivated area. The productivity per hectare for these crops falls below national averages, reflecting traditional agricultural practices characterized by low productivity, outdated tools, and antiquated methodologies [
11].
This backdrop underscores the urgency for transitioning to sustainable agriculture, typically defined as an approach that aims for long-term yield stability through environmentally friendly technologies. It is essential to view the agricultural system as an ecosystem, where the focus extends beyond high yields of individual crops to the optimization of the entire system. An integral evaluation of this system requires analyzing an array of variables related to diverse factors [
6]. Traditionally, agricultural production methods have been evaluated predominantly through economic parameters. However, in adopting a sustainability-oriented approach, it is critical to include environmental and social aspects in these evaluations to provide a holistic view of agroecosystems in terms of economic and social welfare, as well as in the preservation and regeneration of the natural resources involved in the production process [
2].
Sustainable development within agricultural sectors is a multifaceted concept that necessitates a comprehensive approach to effectively address the unique challenges. The concept extends to identifying territorial units based on their unique agricultural and rural development challenges. This is achieved through the characterization of various differentiation criteria, including ecology, means of production, production systems, and social group dynamics, among others. A thorough understanding of the functioning of each unit and the interactions among them is imperative [
12]. Agricultural production can contribute to sustainable development in various ways.
In pursuit of sustainable development, it is imperative to consider a holistic framework that encompasses multiple dimensions of sustainability. This research posits that the three critical dimensions essential for assessing sustainability within agricultural production systems are social, environmental, and economic. Each dimension plays a pivotal role in the overall sustainability of agricultural practices and their ability to contribute to a sustainable future. Socially, the production of nutritious and safe food at reasonable prices generates employment, reduces health risks, and mitigates poverty [
13]. This dimension focuses on the social implications of agricultural production, including labor conditions, community well-being, and food security. Environmentally, it enables the efficient use of renewable and non-renewable resources, along with the rational use of agrochemicals. The environmental dimension addresses the need for agricultural practices to maintain and enhance the natural resource base upon which the agricultural economy depends, including efficient use of renewable and non-renewable resources, minimizing the impact of farming on the environment, and promoting biodiversity. Economically, it promotes the fair trade of food products [
14]. The economic dimension involves practices that foster long-term profitability and stability, ensuring that agricultural production can continue to contribute to the economy without depleting resources. To address sustainability, several factors must be contextualized, including economic, environmental, and social aspects.
Sustainability cannot be analyzed in isolation but rather from a holistic perspective. In other words, the system comprises multiple interrelated variables that can be influenced by external factors [
4]. Community participation is crucial in such environments for linking and characterizing their skills, attitudes, and values as key actors in achieving the set objectives. Thus, this research aims to characterize the productive units of 122 fruit growers from 6 municipalities in Nariño in terms of sustainable development. Furthermore, indicators representative of the economic, social, and environmental dimensions will be identified to assess the sustainability of the production systems.
2. Materials and Methods
The study was conducted in six municipalities of the Nariño department, including Arboleda, Ipiales, El Peñol, La Florida, Providencia, and Sandoná. The environmental conditions of each locality are described in
Table 1. Regarding edaphic characteristics, the area under study is characterized by superficial soils of volcanic origin with low organic matter content, medium natural fertility, and high susceptibility to erosion [
15].
The rational use of natural resources and the economic and social development of fruit growers were evaluated using the methodology proposed by Sepúlveda et al. [
16] and Parchomenko et al. [
17]. Accordingly, indicators of sustainable development were established, and represented in social, economic, and environmental dimensions. The variables were determined through a review of the specialized literature related to sustainability analysis in agricultural production systems [
16,
17]. A total of 62 variables (
Supplementary Table S1) were selected to simultaneously evaluate the 3 dimensions in each of the municipalities. Data were collected through visits to each of the fruit growers’ farms and via semi-structured surveys. A comprehensive exploration of the quantitative variables’ multidimensionality was conducted through principal component factor analysis (PCFA). Concurrently, a multiple correspondence analysis (MCA) was employed to delve into the associations among categories. By harnessing these sophisticated multivariate analysis methodologies, we were able to scrutinize the intricate relationships between the response variables and the various associations pertinent to each municipality.
As a result of the data collection, qualitative variables were obtained. Chi-square tests were conducted to determine if there is a significant association between the variables and municipalities (
p < 0.05). The variables were associated with the three dimensions that determine the sustainability of a system (economic, social, and environmental) and were analyzed using MCA for each dimension [
18]. Based on the coordinates from a general MCA of the evaluated variables, a hierarchical clustering was performed using the Ward method, to form groups that might have similar strengths and weaknesses in the three dimensions. The MCA was conducted using the FactoMiner statistical package [
19] and the graphs were created using the ggplot2 library [
20] in R software v4.2.0 [
21]. This type of clustering was carried out to describe and identify the common needs of the producers and to subsequently guide specific development strategies more efficiently.
From the general MCA, the variables that contributed the most to the first three factors were selected as indicators for the construction of the General Sustainability Index (GSI) (
Table 2). The selected set of categorical variables received a positive relationship value when the characteristic contributed to the stability of the system. In this way, an increase in the value of the variable had a positive benefit for sustainable development in any of the three dimensions. Subsequently, the original variables were standardized so that all indicators were set on a common scale from 0 to 1. For the transformation of the variables, the relativization function described by the United Nations Development Program (UNDP) was used to calculate the Human Development Index [
22], as follows:
For indicators that exhibited an inverse relationship, the following equation was used:
where
X = Variable or indicator of the sustainability degree for each dimension.
m = The minimum value of the variable or indicator.
M= The maximum value of the variable or indicator.
Finally, a network graph was constructed to observe the strengths and weaknesses of the sustainability indicators in each municipality, using the ggplot2 library [
23] in R software v4.2.0 [
21]. The PCFA was conducted with all indicators on the same scale. To assess the suitability of the data for PCFA, the Kaiser–Meyer–Olkin test was performed [
24]. For the construction of the GSI, it was necessary to estimate the contribution of each indicator to the total principal inertia of the PCFA results. The first components were selected according to their contributions to the total inertia of the data variability (
Table 3).
Finally, the GSI was determined based on the methodology proposed by Sepúlveda et al. [
16] and modified by Farfán and Hincapié [
25]. From the PCFA, the values of the communalities (percentage of the variance explained by the principal components of the determined original variable) were obtained to weight the variable group of each indicator, as indicated in the following equation:
where
GSI = General Sustainability Index
Economic dimension parameters: Ve = economic variables, ne = number of economic variables, fpe = economic weighting factor
Social dimension parameters: Vs = social variables, ns = number of social variables, fps = social weighting factor
Environmental dimension parameters: Va = environmental variables, na = number of environmental variables, fpa = environmental weighting factor
By the estimation of the GSI in each municipality, its system state level in the productive system is determined (
Table 2). The results of the GSI were plotted in a network and bar graph.
3. Results
The primary data analysis played a crucial role in characterizing the study population based on their needs and strengths in the three sustainability-associated dimensions. The chi-square test unveiled variables that lack a significant level of association with the municipalities. For instance, regarding certification, almost all fruit growers indicated that they lack it. Generally, the municipalities are more accurately depicted by economic and environmental indicators compared to social variables, which showed a greater dispersion on the perceptual map (
Figure 1,
Figure 2 and
Figure 3). The results demonstrate interdependent relationships among the studied dimensions. In Ipiales, producers display superior economic and environmental conditions (
Figure 1,
Figure 2 and
Figure 3). In contrast, the lowest biodiversity and economic indicators were noted among fruit growers in the municipality of Sandoná (
Figure 1,
Figure 2 and
Figure 3). The findings suggest that improving the economic conditions of the rural sector could also promote environmental sustainability. The association values of Dim 1–3 on the maps ranged between 8.1–20.3% (
Figure 1,
Figure 2 and
Figure 3). Dim1 and Dim2, as extracted through multiple correspondence analysis, represent orthogonal axes in the perceptual map (
Figure 1,
Figure 2 and
Figure 3). These dimensions encapsulate key information regarding the inter-relationships among the variables characterizing the sustainability dimensions under scrutiny.
The economy is the main driver of sustainable development.
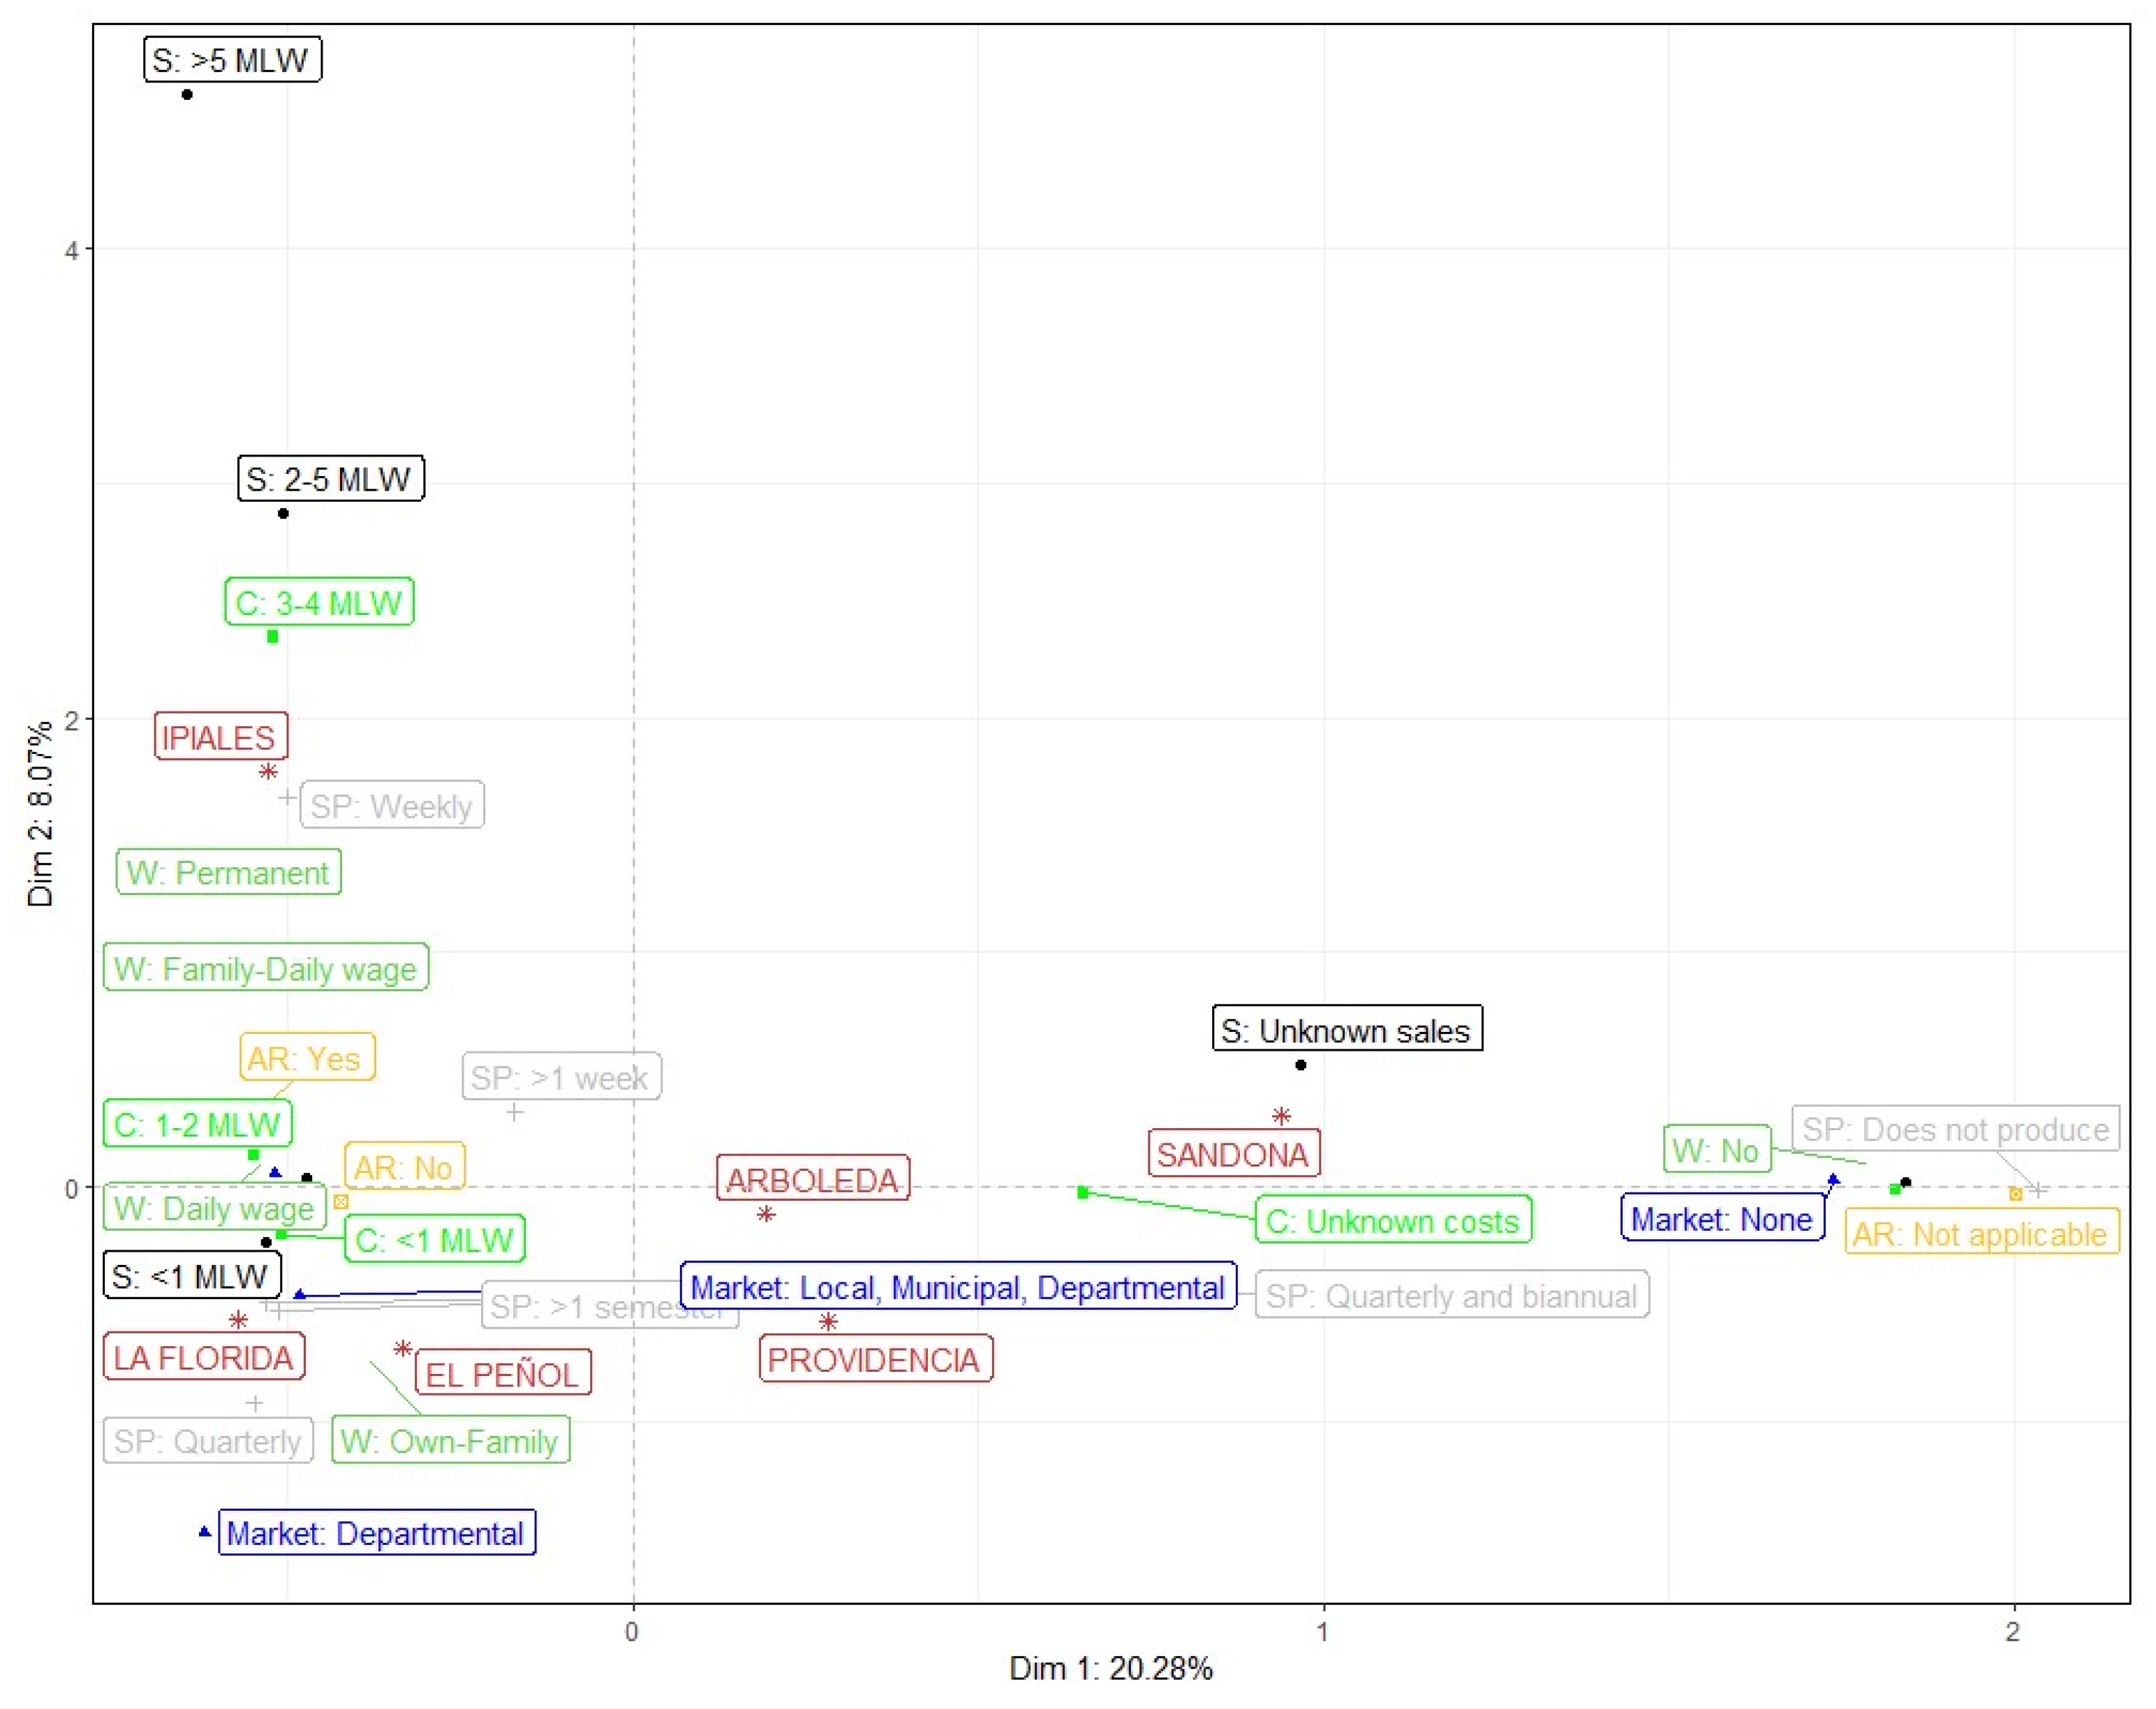
Fruit growers in the municipalities of Arboleda, Providencia, and mainly Sandoná exhibit a stronger association with poorer economic indicators (
Figure 1). The fruit growers lack associated productive control indicators, such as accounting records, cost and sales management, sales frequency, labor, or market characterization (
Figure 1). In El Peñol and La Florida, fruit growers are more acquainted with these accounting supports (
Figure 1). Most fruit growers in these municipalities report that both production costs and sales fall below the minimum legal monthly wage (MLMW) (
Figure 1). Likewise, labor is family-based, and sales are mainly carried out every three months in the departmental market. On the other hand, Ipiales boasts the best economic indicators. In Ipiales, fruit growers have stable, family-based labor and wages, likely contributing to the rise in production costs (between three and four MLMWs) (
Figure 1). Nevertheless, fruit growers in Ipiales demonstrate greater opportunities to increase sales frequency, and their income can reach up to five MLMWs (
Figure 1).
The environment and biodiversity are closely linked.
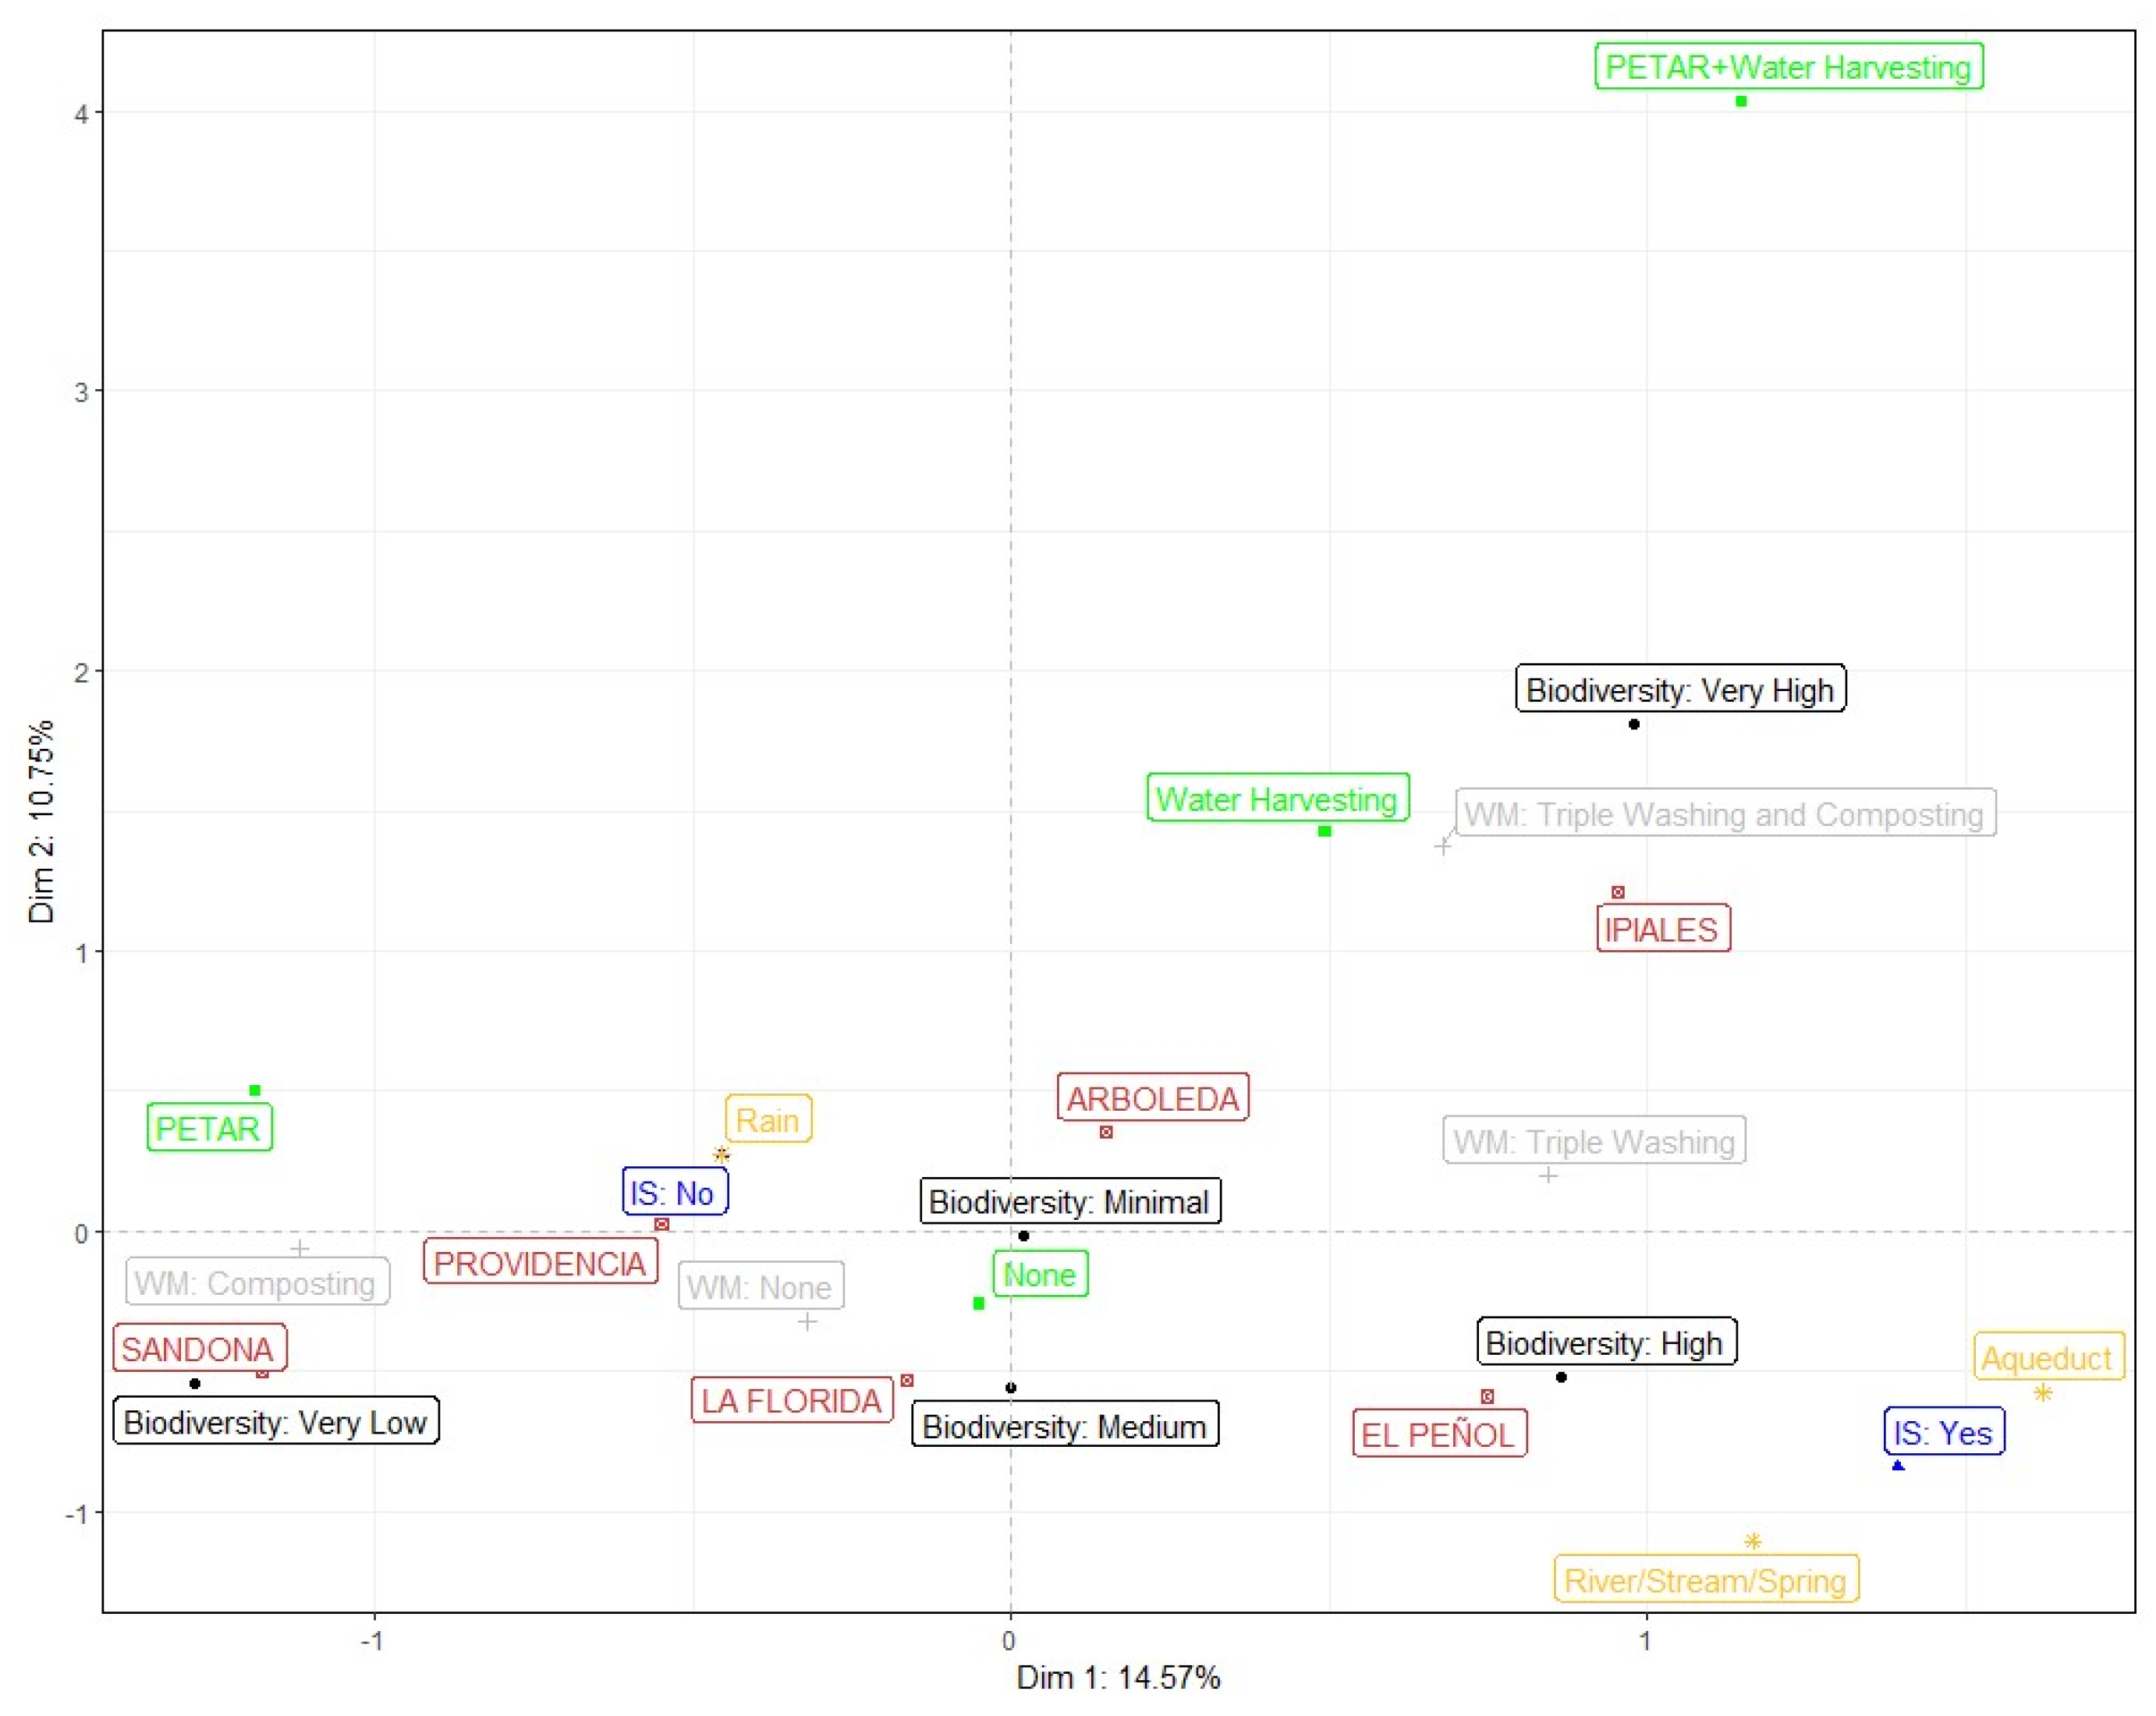
The fruit growers from El Peñol and particularly those in Ipiales were characterized as having the best association values in terms of crop diversity and good waste management practices (
Figure 2). In contrast, fruit growers in the municipalities of Sandoná had the lowest association values concerning crop diversity on their farms, followed by those in the municipality of Providencia (
Figure 2). Furthermore, in these municipalities and La Florida, most fruit growers lack irrigation systems and adequate waste management procedures, with agricultural productivity largely depending on the rainy season (
Figure 2). Conversely, fruit growers in El Peñol use irrigation systems, drawing water from districts, aqueducts designated for agricultural purposes, rivers, streams, and springs (
Figure 2).
There is a pressing need for greater involvement from the public sector.
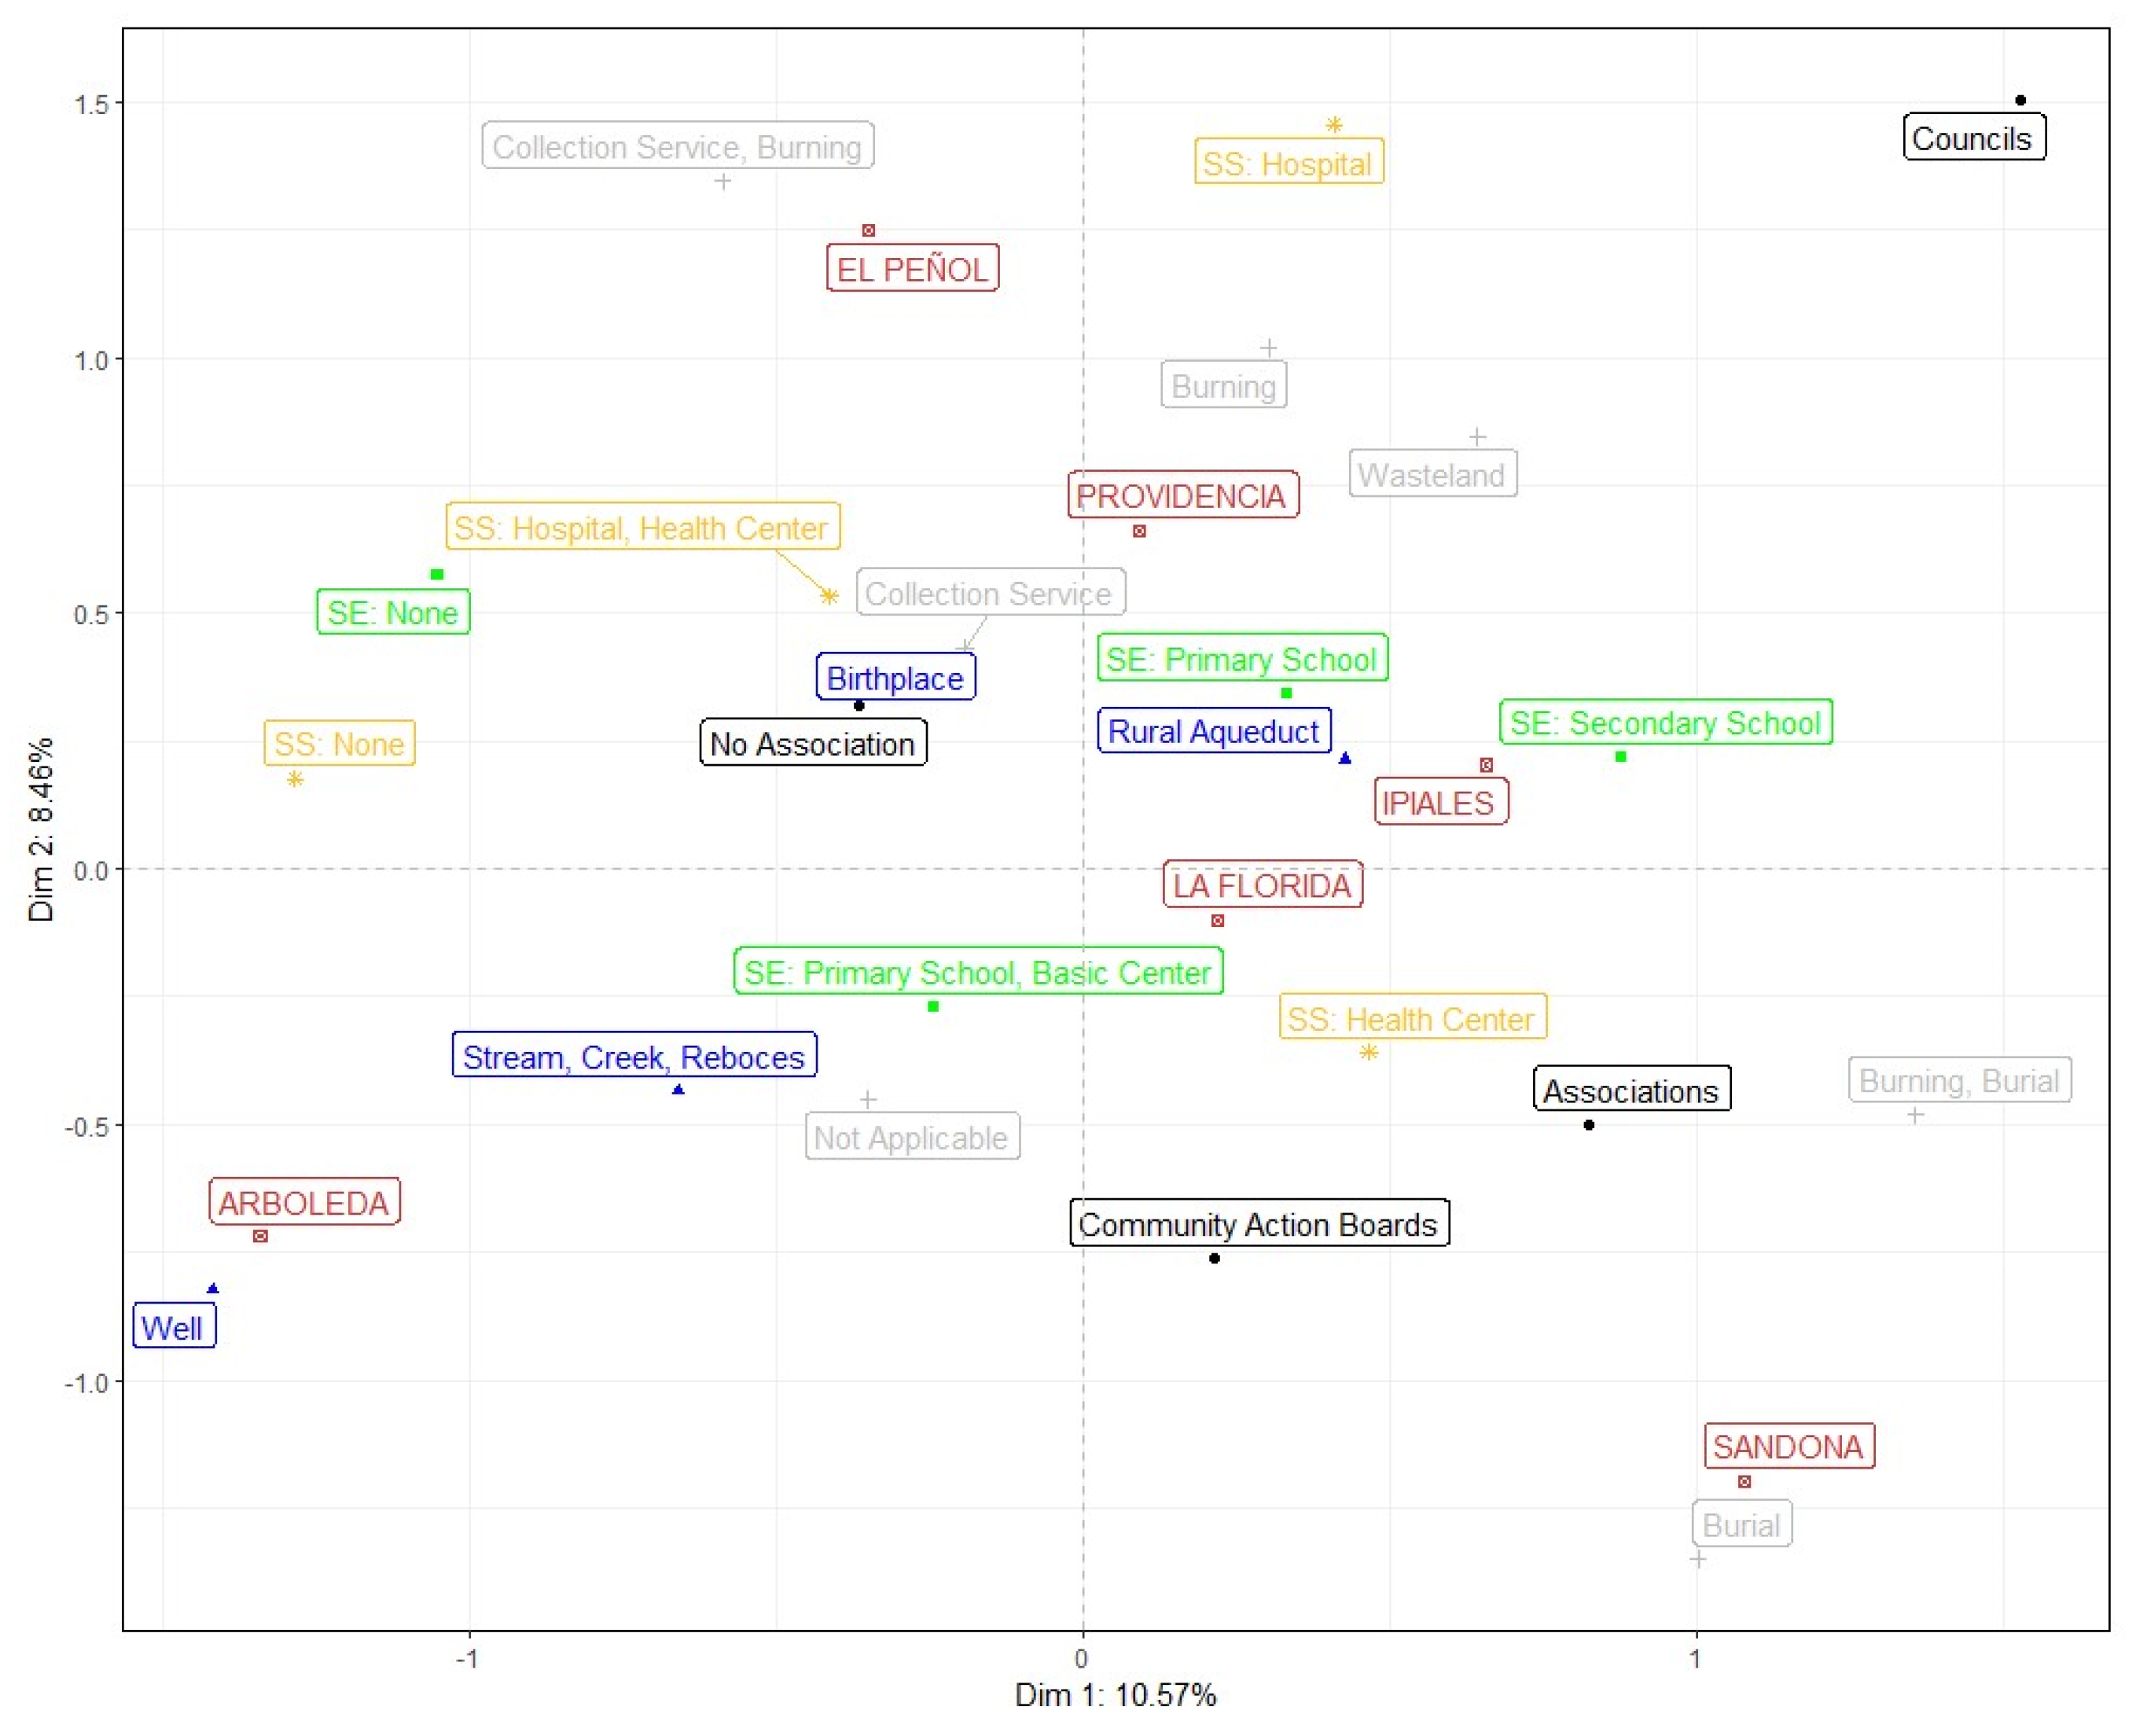
The results revealed a significant level of participation in community initiatives, such as community action boards and associations, among fruit growers in Sandoná and La Florida (
Figure 3). Conversely, fruit growers in other municipalities report lower participation rates in such collective endeavors (
Figure 3). In terms of essential services, fruit growers in Ipiales and Providencia benefit from access to high-quality education systems and clean water sources (
Figure 3). In contrast, fruit growers in Arboleda rely on wells, streams, brooks, or aqueducts for water access (
Figure 3), potentially exposing them to health risks due to inadequate water quality. In this context, fruit growers in the municipality of El Peñol highlight challenges in accessing health centers or posts and educational institutions (
Figure 3). Furthermore, in this municipality and Providencia, the absence of household waste collection services results in waste disposal through burning and dumping in vacant lots (
Figure 3). These results demonstrate the existing gaps in the public education and sanitation sectors in certain municipalities.
Five major groups encapsulate the individual needs and strengths of the fruit growers.
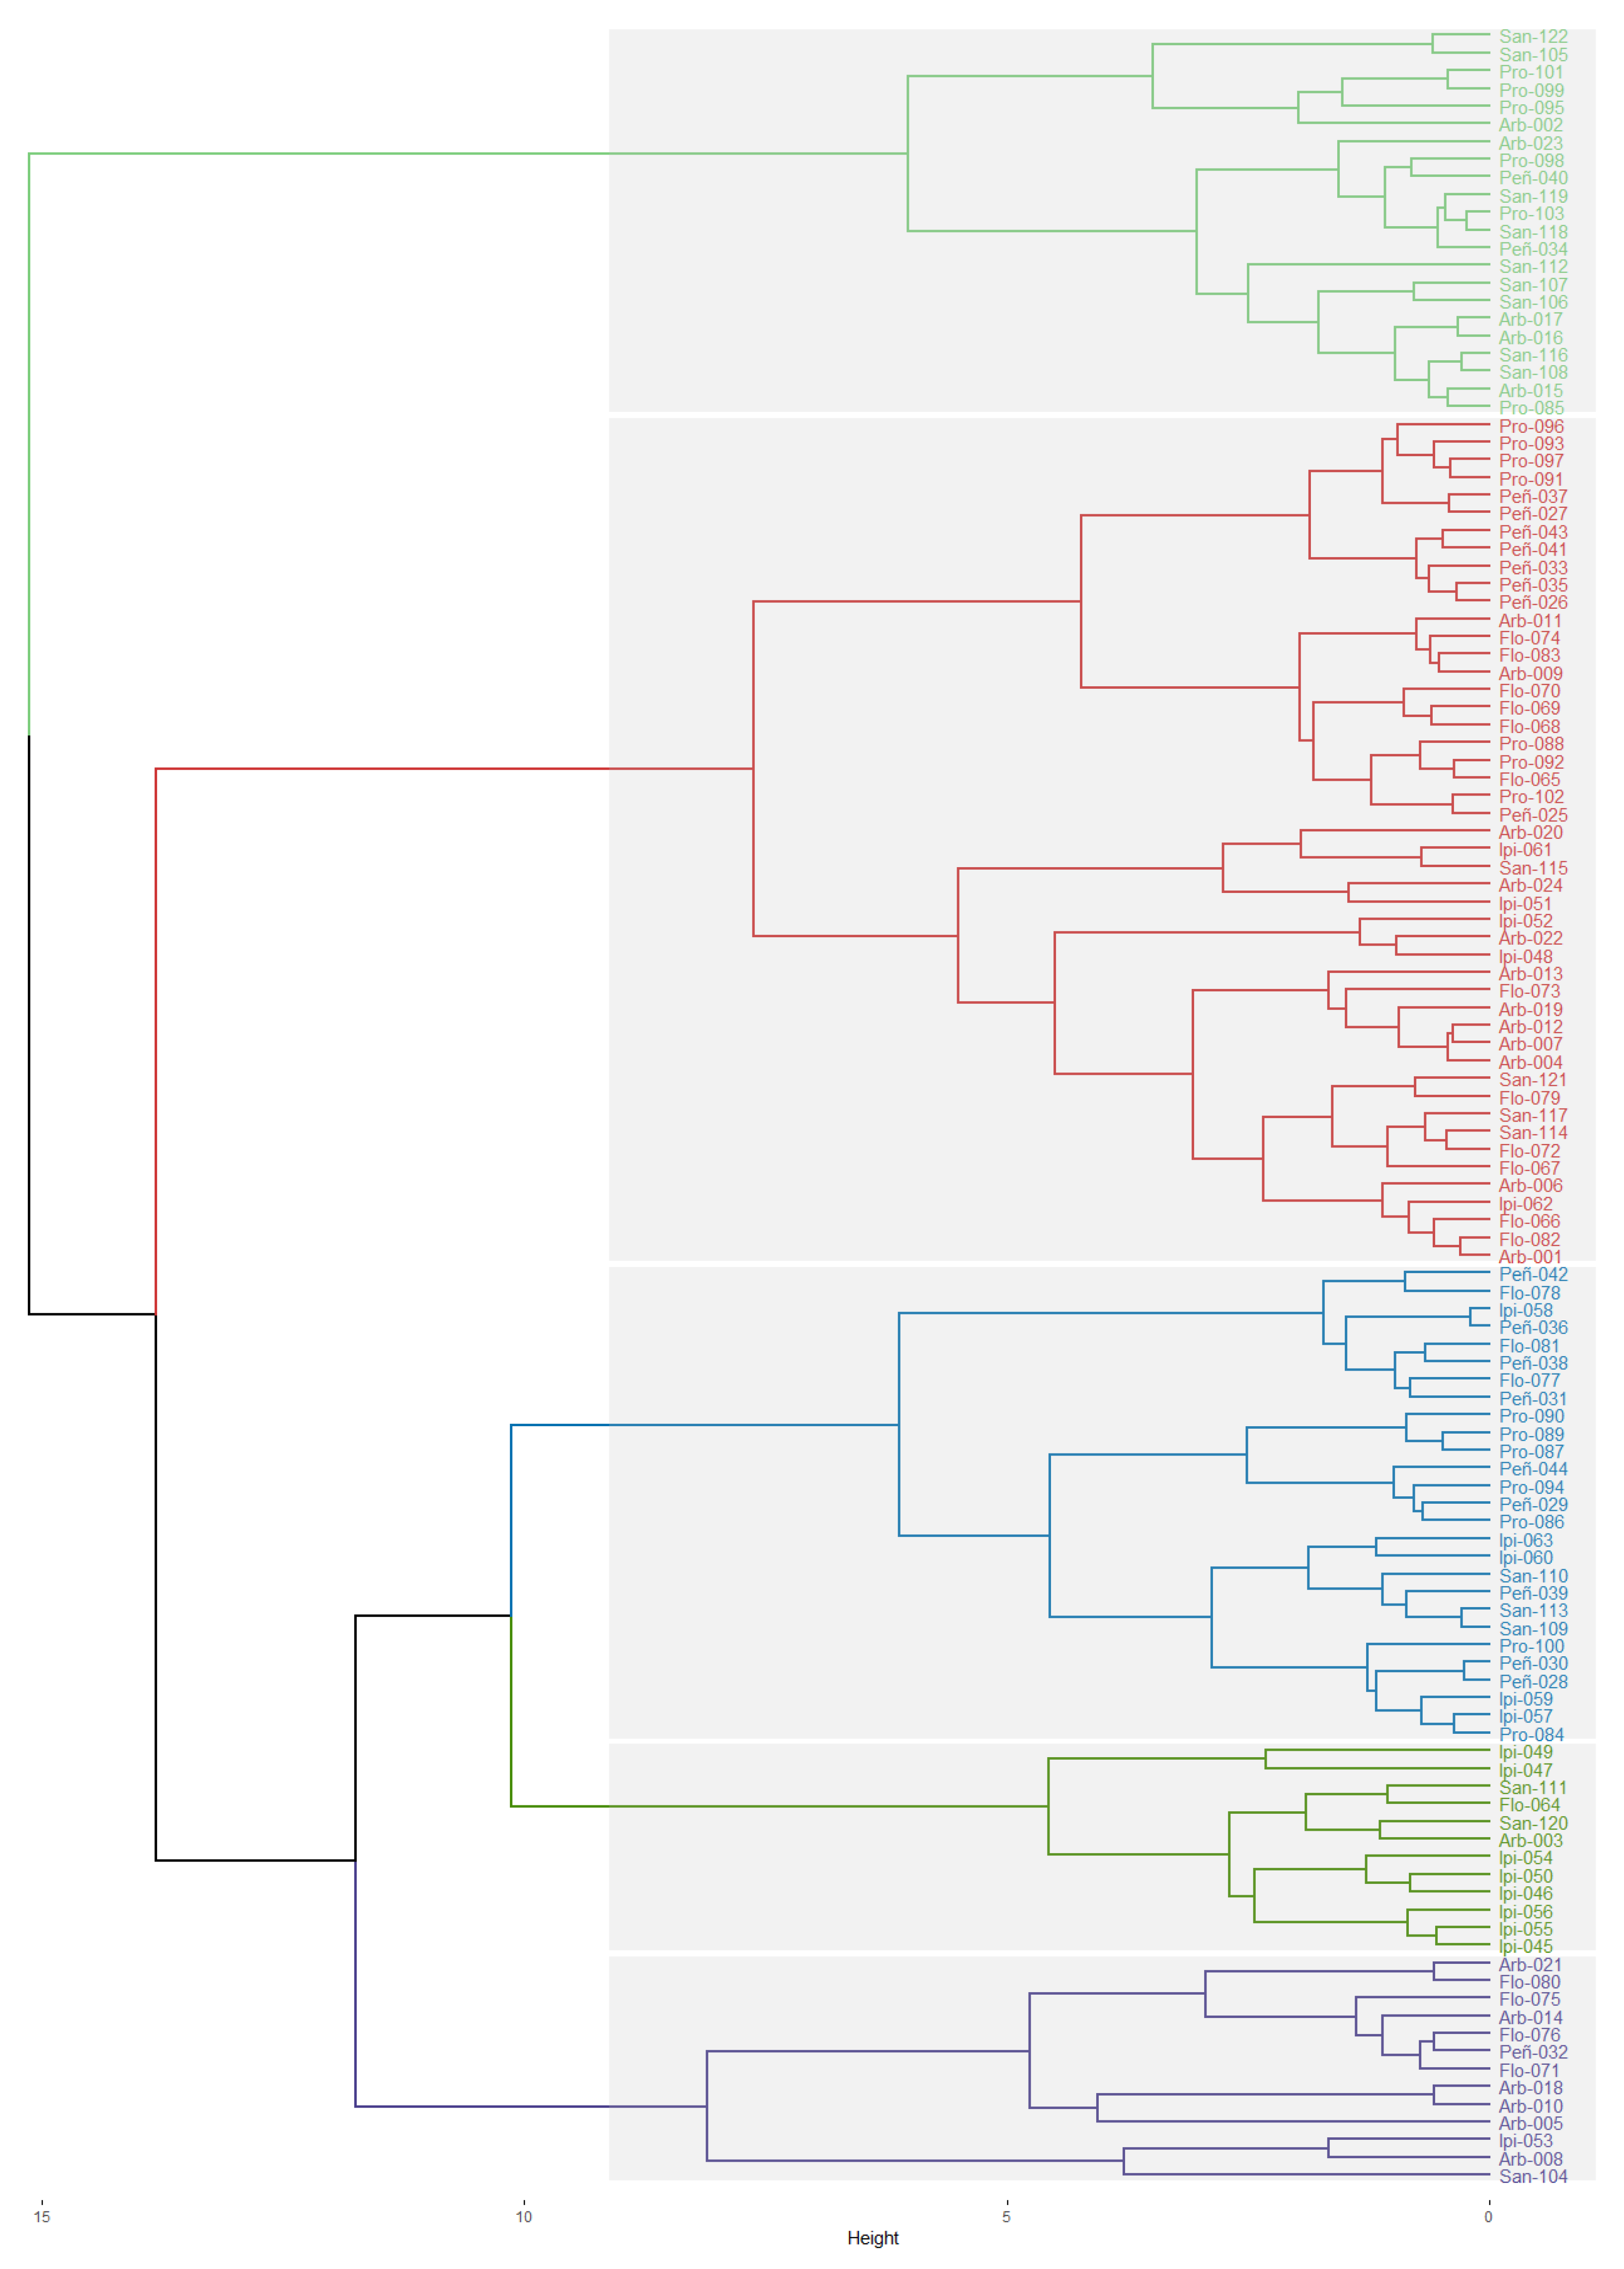
The results of the clustering analysis revealed the individual priorities of the study population, forming at least five major groups (
Figure 4). Geography strongly influences the formation of these groups. For instance, Group 1 comprises 46% of producers from the municipality of Providencia, while 66.7% of individuals in Group 2 are from Ipiales and share similar characteristics (
Figure 4). Group 3 consists of 50% of producers from Arboleda and La Florida. The most significant integration in Group 4 is from El Peñol (33%), and in Group 5, from Sandoná (40%). Producers from Providencia belong only to Groups 3, 4, and 5 (
Figure 4). This demonstrates that the policies of each municipality strongly influence the opportunities, decisions, and outcomes of the fruit growers. Moreover, the structural analysis of the population can be useful in identifying risks in sustainability indicators, planning individual interventions, and developing public policies and territorial government plans.
These results highlight the diversity of situations and needs within the studied groups, underscoring the importance of designing tailored approaches and specific measures to address the challenges in each dimension of sustainability. In this context, members of Group 1 possess extensive experience in the productive sector, with the majority having more than eight years of experience. They are also characterized by owning brick homes with complete services, although they face challenges in managing household waste. In contrast, Group 2 requires priority actions to improve specific social conditions, such as access to public services, like sewage, potable water, waste collection, and technical assistance.
On the other hand, Group 3 exhibits positive sustainable development indicators. The availability of necessary tools for agricultural practices, the availability of labor and corresponding occupation, cost recording, technical support, training, and education level enable integrated pest and disease management. Additionally, the environmental and economic dimension indicators are outstanding in the clustering analysis. Contrastingly, the 27 individuals in Group 4 show a lower degree of sustainability in the social dimension indicators, highlighting a lack of home ownership, limited access to public services, low capacity for generating their income, and high dependence on activities external to their productive units. Finally, individuals in Group 5 require the implementation of strategies to correct aspects in the economic dimension. Despite having available land, they lack experience in agricultural activities and have not received training, resulting in the lack of development of productive activities generating their own income.
In all six municipalities, there is a pressing need for corrective measures across a wide range of sustainability indicators.
The MCA revealed that the first three axes or factors collectively explain 47.4% of the nature of the evaluated productive units. Therefore, the total variability information can be summarized in these dimensions, allowing for the explanation of their characteristics in the selected indicator variables (
Table 3). From the analysis of the variables’ contribution to the formation of the axes, it is established that Dimension 1 gathers the largest proportion of the original variability and is related to economic-type characteristics associated with the marketing channel of the produced goods, the frequency of product generation, sales revenue, production costs, labor, and accounting records. The second dimension was mainly constituted by social-type variables, with housing infrastructure conditions and the availability of services, especially access to potable water, as notable indicators. Finally, Dimension 3 was formed by indicators associated with variables of integrated crop management, and the use and management of water, soil, and waste (
Table 3).
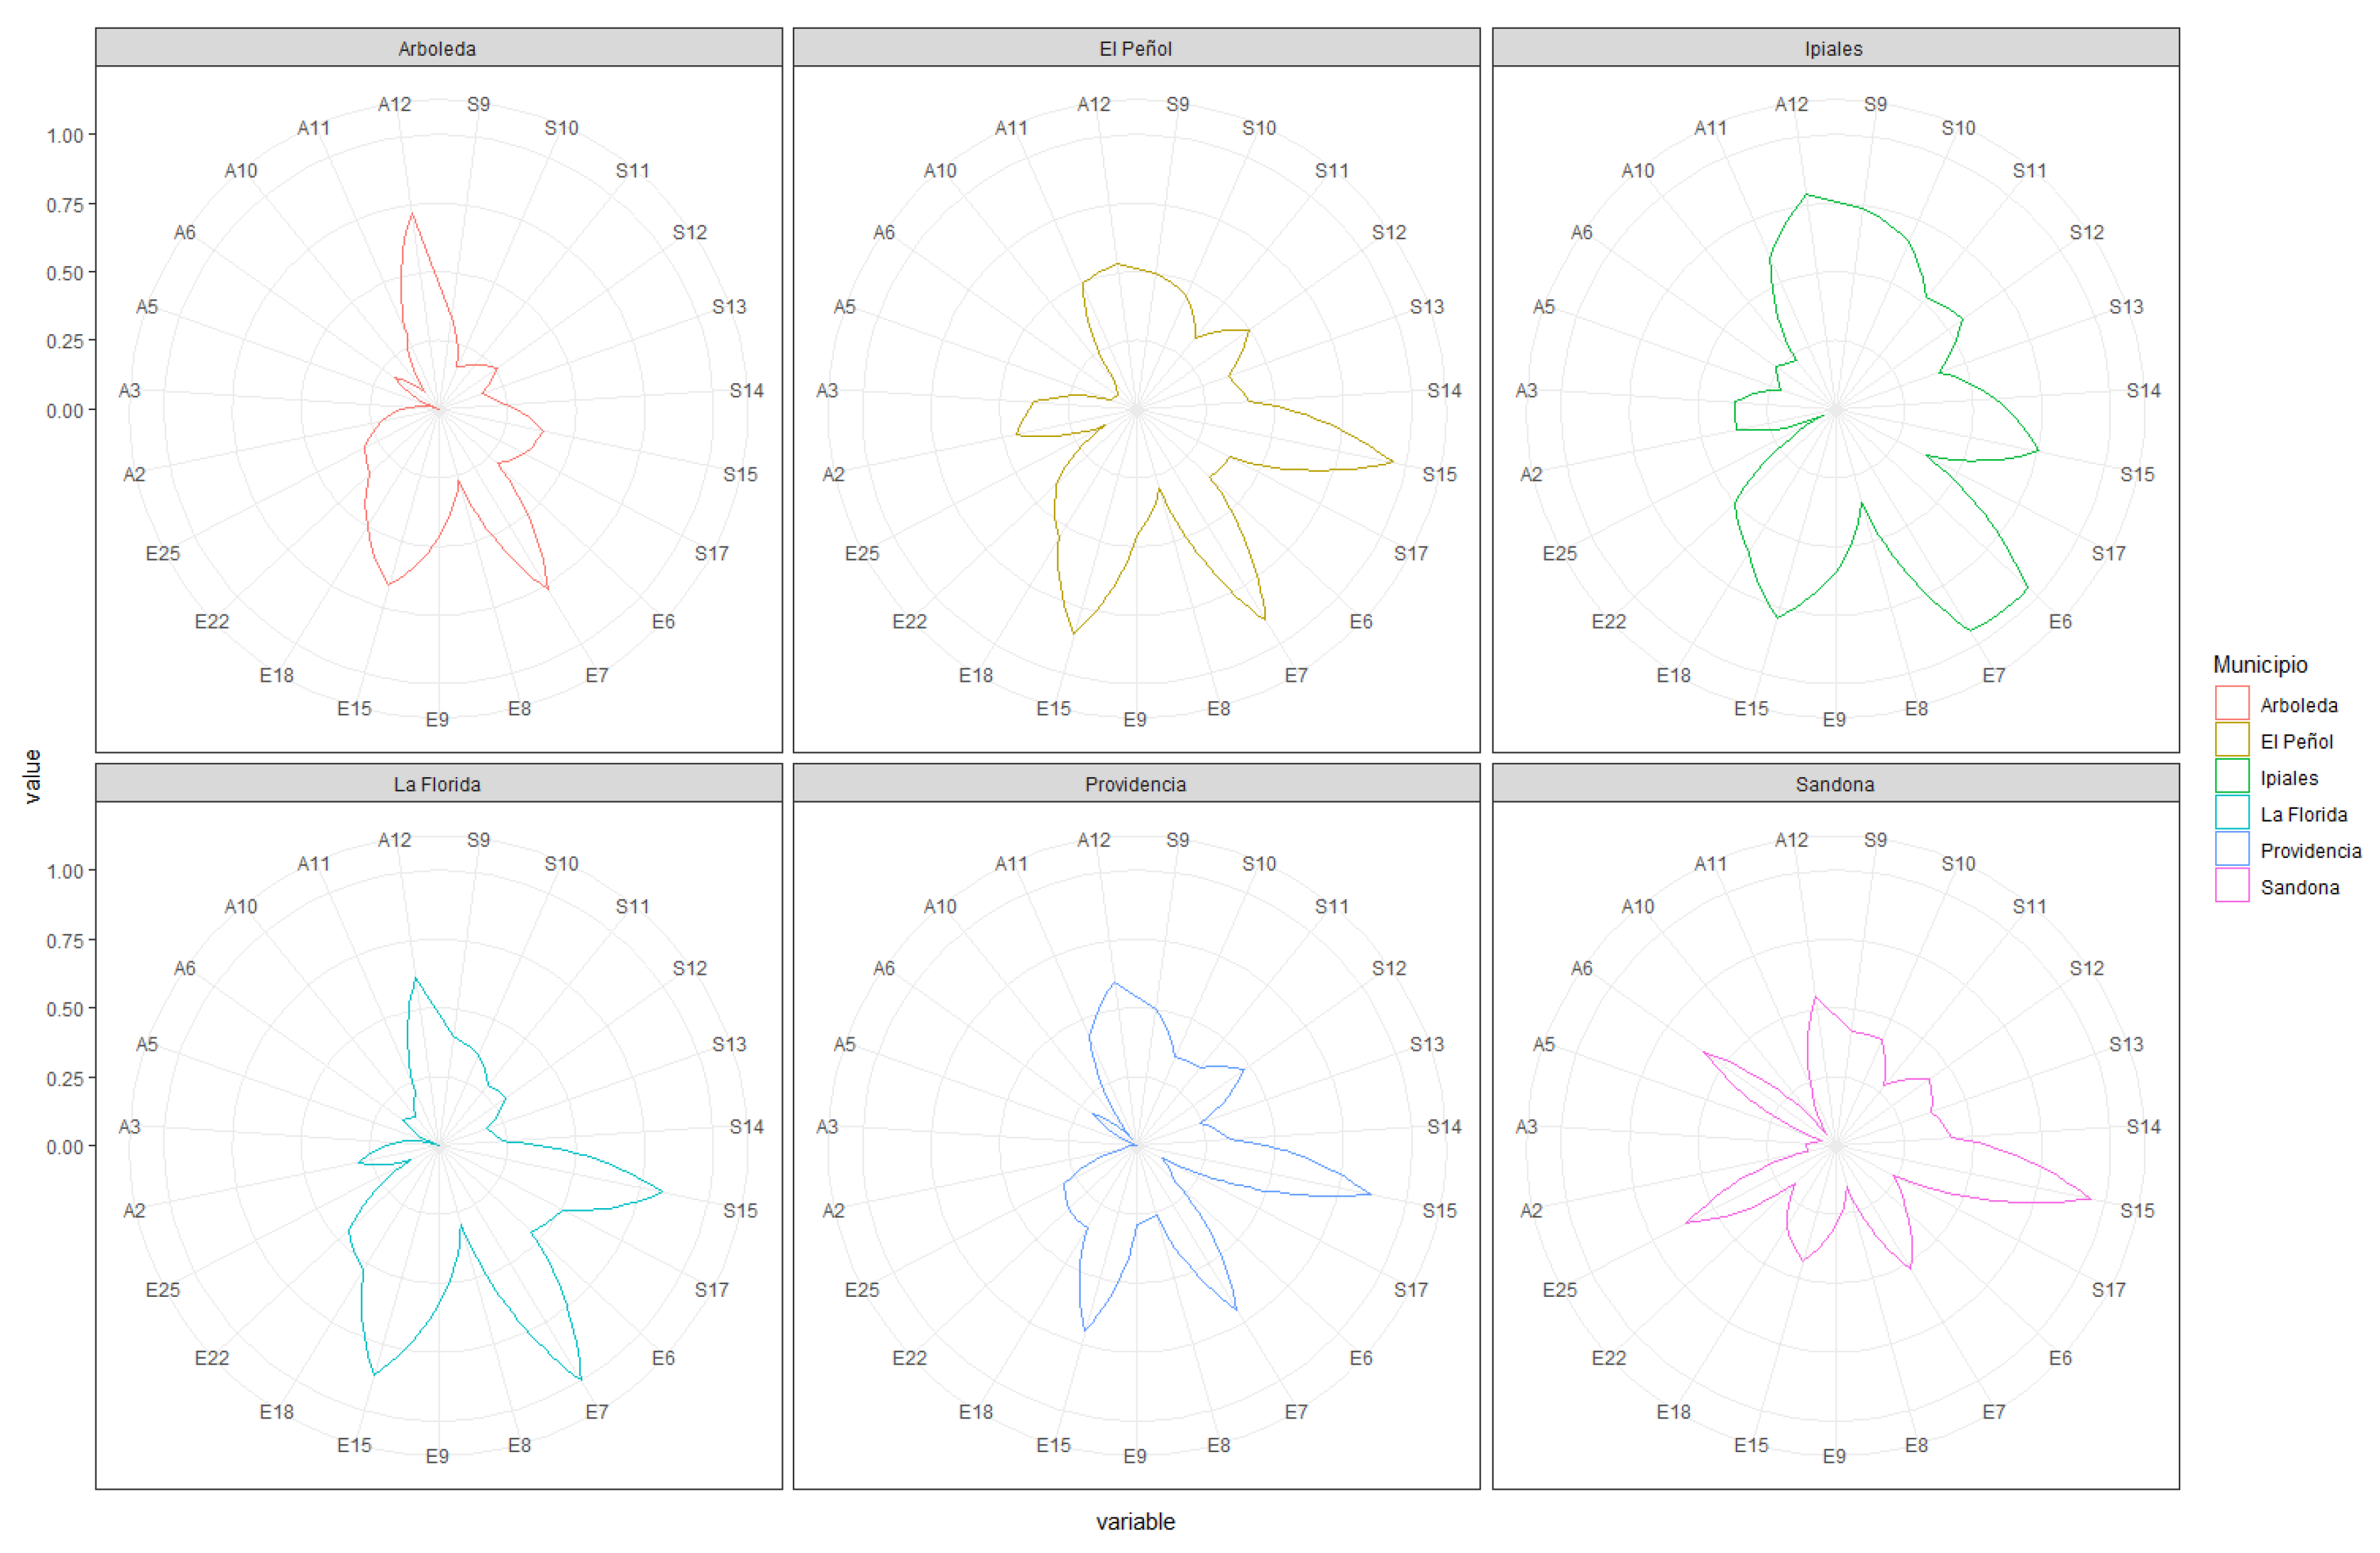
Fruit growers reported low levels of sustainable development for almost all the studied indicators (
Figure 5). In general, environmental indicators obtained the lowest scores in all municipalities except for indicator E12, which suggests that fruit growers maintain good practices in agrochemical management (
Figure 5). Similarly, nearly all the indicators of the social dimension had values below 0.5 in all municipalities, except for S15, showing that the water supply system for capturing, transporting, treating, storing, and distributing water on most plots is adequate (
Figure 5). On the other hand, economic indicators obtained the most positive values for sustainability, especially in the municipalities of Ipiales, La Florida, and El Peñol (
Figure 5).
This trend towards economic stability likely had a positive influence on the construction of the GSI. The PCFA of the selected set of indicators revealed that the communalities making the most significant contribution to the total inertia were the economic variables, constituting a weighting factor almost double that of the social and environmental dimensions (
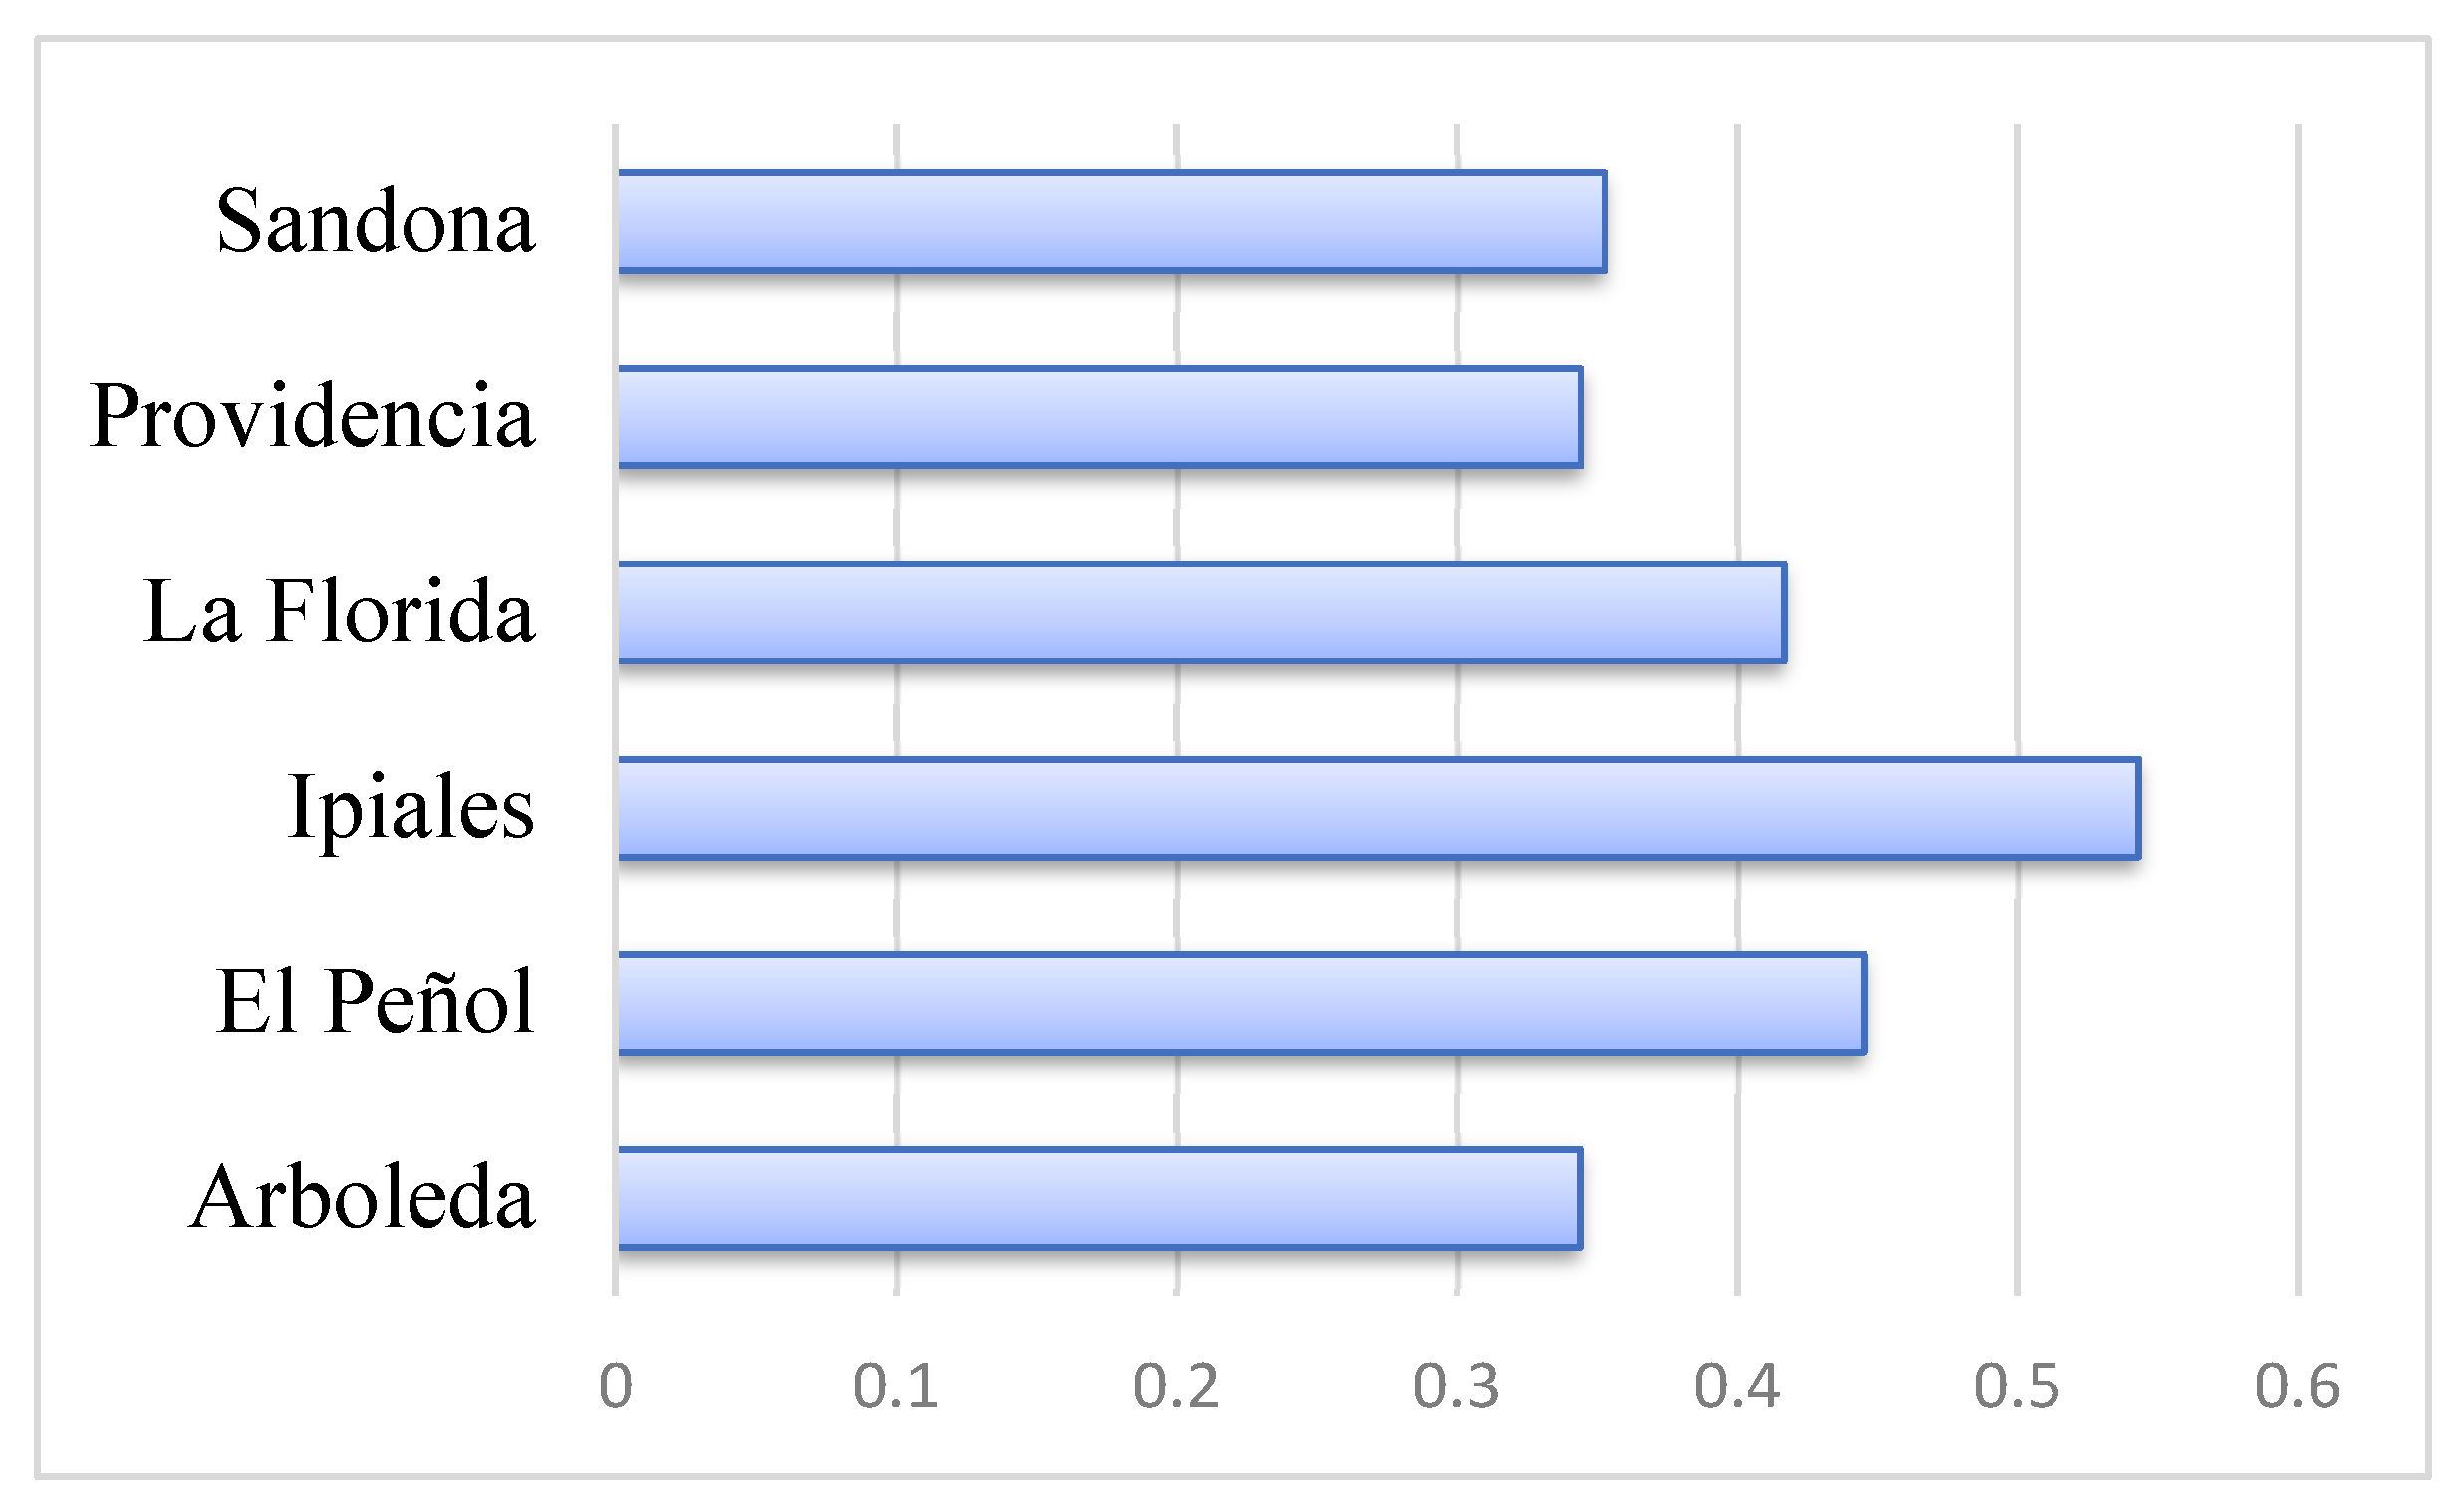
Table 3). Thus, the GSI ranged between 0.34 and 0.54, indicating that the degree of sustainability in the production systems is between critical to unstable levels (
Figure 6). The most critical GSI values were observed in the municipalities of Arboleda, Providencia, and Sandoná (
Figure 6). In the municipalities of Ipiales, El Peñol, and La Florida, the degree of sustainability was slightly higher (unstable), likely due to better economic conditions, as previously described (
Figure 6). Nevertheless, corrective measures and public policies are still required to increase the degree of sustainability to ensure the long-term sustainable development of the municipalities.
4. Discussion
Characterizing the population enables more efficient management of aspects related to sustainability. One of the global challenges faced by human rights advocates is identifying the interrelations between the environment and poverty [
26]. We demonstrate here that the economic component predominates over the other two dimensions that determine sustainable development. The results show that there may be a primary link between the possibility of obtaining better economic income and environmental care. Thus, fruit growers with better economic conditions also have more favorable indicators for environmental care. In Ipiales and Sandoná, for example, there is a contrasting inequality in economic and environmental well-being that reflects the interrelation between these two dimensions.
The low profitability of the rural sector does not generate sufficient resources to cover costs and family needs, let alone invest in natural heritage. Consequently, poverty is one of the factors involved in the failure of environmental education [
27,
28]. In other words, producers are concerned with addressing their most immediate needs. The progress of humanity in the long term depends mainly on the economic and social growth policies of each country [
4]. Therefore, to promote environmental sustainability, it will be necessary to improve the economic conditions of peasant families.
The economic sustainability of fruit growers may depend on financial education. According to Castro-Castro et al. [
13], the lack of organization and accounting records is one of the key factors determining the productivity of any business. Fruit growers must be aware of the cash flow of their production systems to design economic growth plans and strategies. Fruit growers in municipalities with the best financial conditions, like Ipiales, El Peñol, and La Florida, are more familiar with accounting records, indicating greater financial intelligence. On the other hand, productive alternatives to the agricultural sector can be a significant engine for rural productivity. Other sources of income can generate new employment opportunities that can absorb the growing population, supplementing household incomes in rural areas [
29].
Productivity growth must also be linked to the possibility of accessing better markets. Traditional markets and limited marketing tools result in low and unattractive agricultural incomes for fruit growers. Municipalities with the best economic indicators have the possibility of accessing better prices in the departmental market. Establishing new marketing routes could be another strategy to improve marketing processes. However, not all agroecosystems have the ability to market their products nationally or internationally due to the lack of minimum safety requirements [
30]. The same authors argue that new supply strategies and changing the relationship with consumers are needed, which can be provided by short food supply chains.
Public power, the market, and civil society are important protagonists in this process of reinventing marketing models. Increasingly, consumers want to know where their food comes from and how it is produced. This demand can be leveraged to increase the added value of agricultural products. In this process, short chains play an indispensable role in the organization of markets and help to improve both the income of producers and the food conditions of the population.
After meeting basic needs, it becomes crucial to sustain or enhance present benefits over time. Achieving sustainable growth poses a major challenge, as enhancements in the productive system can lead to environmental imbalances [
5]. Given the finite nature of natural resources on our planet, economic efficiency must be complemented by sustainable ecological strategies. Soil, the atmosphere, and genetic resources are limited. Consequently, a multidimensional analysis is necessary to study the dynamic behavior of sustainability.
Multivariate analyses offer a preliminary approximation of the degree of development in the various dimensions that integrate into sustainability. The use of MCA and PCFA allowed for retaining the most significant indicators on the overall level of sustainability, which were found in the social and economic dimensions (
Table 3). The negative and positive weightings were very similar among the social and economic indicators and different compared to the environmental dimension (
Table 3). This behavior indicates that social and economic performance have similar patterns, which are in turn separate from environmental aspects, as demonstrated by Mirshojaeian Hosseini and Kaneko [
31] and Moreno-Miranda and Dries [
32]. There are two types of fruit growers: those oriented towards maintaining a balance with the environment, making better use of natural resources, and a second group of producers who are more competitive, with a social and economic orientation, making more intensive use of natural resource exploitation [
31,
32]. This difference could be related to the size of the family group and the age of the fruit growers. According to the literature, younger individuals are associated with better economic performance in the rural sector, while older household heads generate greater environmental performance [
33]. Overall, there are two profiles of producers, some more responsible with financial sustainability and others more responsible with environmental sustainability.
The communalities indicate that the largest proportion of the variance explained by the economic dimension is almost double the value of the sum of the variables that make up the environmental and social dimensions (
Table 3). The economic dimension can have a positive synergism with the other dimensions of sustainability. Comprehensive strategies should seek to maximize economic conditions and environmental quality jointly [
34]. Some practices, such as ecotourism, have contributed to generating economic growth for local fruit growers as well as improving environmental quality and the beauty of the natural surroundings [
35]. Economic growth with an ecological focus could be crucial for improving income, social capital, and environmental capital.
The cluster analysis did not show an association between producers and the geographical and political conditions of each municipality (
Figure 4). The five groups formed suggest that fruit growers do not have a sustainable identity associated with local conditions, even though one group was predominantly composed of individuals from Ipiales (66.6%) (
Figure 4). In this case, the clustering might be a result of the fact that most participants from this municipality are indigenous, potentially exhibiting greater similarities among individuals, primarily in economic practices and adaptation to the natural and social environment. However, a lack of cultural structure was observed in the variables that determine human and environmental development.
It is critically important and pressing to consolidate development policies for culturally shaping sustainable development approaches [
36,
37]. The creation of state policies could have a more significant impact on promoting sustainability than municipal norms and regulations. National regulatory frameworks could contribute to the conservation of natural resources, access to equity, social justice, and the implementation of circular economies and responsible economies. However, public policies are not sufficient to guarantee sustainability. The effective implementation of the legal framework, proper supervision, active citizen participation, and the private sector are significant parameters in the models of implementing sustainable growth [
38].
Monitoring sustainability through indicators revealed the most deteriorated points in the three dimensions (
Figure 5). Except for some indicators (A12, S15, E7, E15), all showed instability values about sustainable development, according to the scale proposed by Sepúlveda et al. [
16]. The results demonstrate that environmental integrity is the most affected of the three sustainability dimensions (
Figure 5). Thus, environmental balance is the most sensitive of all components determining sustainable development, as suggested by Usubiaga-Liaño and Ekins [
39] when analyzing other communities. The negative effects of human development on sustainability put the natural resources of one of the world’s most biodiverse countries at risk [
40].
In general, the 23 development indicators revealed that the municipalities of Arboleda, Providencia, and Sandoná presented critical IGS values, indicating that these localities are the most affected by sustainability degradation (
Figure 6). Although the municipalities of El Peñol, Ipiales, and La Florida scored higher on the IGS, the instability indicators demonstrate that there are still serious environmental, social, and economic issues to be resolved. The low IGS values suggest that, in the region, there is a need for improvement measures in the practices of preserving natural capital and human well-being.
The municipality of Ipiales achieved the highest overall sustainability index score compared to five other municipalities, a result that can likely be attributed to its more concentrated cultural identity focused on environmental care, largely due to its predominantly Indigenous population. Furthermore, these Indigenous communities receive substantial financial resources from both national and international sources, which could positively impact awareness and conservation efforts of natural resources, as demonstrated by Li et al. [
41]. For instance, subsidies and incentives for the agricultural sector have enhanced water use efficiency, which is crucial for sustainable development [
42]. This unique blend of cultural heritage and financial support underscores the importance of integrating traditional knowledge with modern conservation practices, highlighting how Indigenous stewardship can lead to superior sustainability outcomes.
Colombia has been recognized as a multiethnic and multicultural nation since 1991, as it is registered in its political constitution. Particularly, the indigenous population in Colombia has a normative statement that currently develops essential, economic, and social rights [
43]. The ecological representation of the indigenous population has been positioned as a strong environmental point and, eventually, as a cultural statement that promotes the sustainable development of territories [
44]. Results achieved in Ipiales could suggest a potential relationship between sustainability and both investment and efforts toward promoting social justice in the indigenous population in Nariño. Nevertheless, a broad discussion about the impacts of government support is needed in terms of sustainability in the function of social groups inside peasant guilds, as well as the relationship between the reactive position of both government entities and organizations and environmental emergencies around indigenous territories for future works.
Similar studies have been proposed to monitor sustainable development in Colombia. In Bogotá, for example, values of 0.55 (on a 0–1 scale) have been recorded, placing it at rank 88 out of 106 cities studied around the world [
45]. Machine learning algorithms used to calculate sustainability indices in Colombian cities reveal the panorama of sustainable development [
46,
47,
48], which will allow the government to make more informed decisions. Although these studies were conducted using different metrics and with urban populations, the results are consistent with those recorded in this study. The metrics used for understanding sustainability on a national, regional, or local scale are important for advancing the protection of non-renewable resources in the long term [
46]. The findings presented in this study will inform the development of programs and policies designed to foster community advancement and facilitate the journey toward sustainable development.


 ,
, 


