Article

Optimizing Biogas Production and Digestive Stability through Waste Co-Digestion

1
Department of Environmental Sciences, The University of Lahore, Lahore 54000, Pakistan
2
Department of Botany and Microbiology, College of Science, King Saud University, Riyadh 11451, Saudi Arabia
3
Energy, Environment and Society, School of Humanities, Social Science and Law, University of Dundee, Dundee DD1 5HW, UK
4
Department of Pharmacy, University of management and Technology, Lahore 54770, Pakistan
*
Author to whom correspondence should be addressed.
Sustainability 2024, 16(7), 3045; https://doi.org/10.3390/su16073045
Submission received: 24 January 2024 / Revised: 21 March 2024 / Accepted: 29 March 2024 / Published: 6 April 2024
(This article belongs to the Special Issue Anaerobic Digestion and Sustainable Integrated Biorefinery)

Abstract

:
This study aimed to enhance the nutrient balance of municipal solid waste (MSW), characterized by a high carbon-to-nitrogen (C/N) ratio, which is a critical factor in the anaerobic digestion process. The investigation involved the addition of MSW, which is rich in carbon content, to food waste (FW) with high nitrogen content. The goal was to determine an optimal co-substrate mixing ratio of MSW and FW for anaerobic co-digestion at mesophilic temperatures, aiming to improve process stability and performance to achieve higher biogas yield. The co-digestion experiments encompassed five mixing ratios of MSW and FW with C/N ratios of 20, 25, 30, 35, and 40 under mesophilic conditions in a laboratory. The results indicated that the highest specific biogas yield, reaching 827 L/kg VS, was attained when the co-substrate feedstock had a balanced C/N ratio of 20, surpassing the 520 L/kg vs. obtained from MSW digestion alone. As the proportion of MSW increased in the co-substrate mixing feedstock, the biogas production rate decreased. Additionally, the study explored the optimal substrate-to-inoculum (S/I) ratio, focusing on the co-substrate feedstock with a C/N ratio of 20. Four S/I ratios (0.5, 1.0, 1.5, and 2.0) were examined, revealing that the highest specific biogas yield, at 642 L/kg VS, occurred at an S/I ratio of 0.5. An accumulation in volatile fatty acids (VFAs) was observed at higher S/I ratios, attributed to the lower abundance of inoculum microorganisms in the anaerobic digestion process. Overall, the findings suggested that the optimum C/N ratio for co-digestion of MSW and FW falls within the range of 20–25/1, while the preferred S/I ratio is 0.5.

1. Introduction

A significant magnitude of fossil fuels is currently employed worldwide for energy production. These fuels not only impose economic burdens but also contribute significantly to the rise in greenhouse gas emissions. Despite modern optimized techniques aiming for cleaner end products, the associated costs continue to escalate. In contrast, renewable energy sources derived from domestic waste are emerging as more economical alternatives. These products, often sourced from cheaper raw materials, predominantly consist of waste materials with limited opportunities for recycling or reuse, exacerbating the strain on landfill sites [1,2].
The increasing organic content in landfill dumps with a high degradation capacity poses a considerable contemporary challenge. The rapid decomposition of organic matter, especially those with higher moisture content, results in increased leachate production, necessitating extensive wastewater treatments. The waste management industry faces persistent challenges, such as limited land availability, leading to issues like odor and groundwater pollution [3,4].
Municipal solid waste (MSW), categorized as degradable biomass, can serve as a substrate for energy generation. In Pakistan, the per capita MSW production rate varies from 0.38 to 0.61 kg/day, with an annual increase of 3.4% [5]. About 67% of MSW in Pakistan is disposed of in landfills, with 33% undergoing recycling or composting. Notably, relic landfills hold approximately 60% of biodegradable materials [6,7].
Globally, in California alone, 42 million tons of MSW were landfilled in 2007 [8]. The carbon-based fraction of MSW, when naturally degraded in landfills, produces several gases, including potent greenhouse gases like methane. Given that methane has a significantly higher global warming potential than carbon dioxide [9], a strategy for the sustainable management of organic waste, particularly food and agricultural waste, is imperative. Anaerobic digestion emerges as an environmentally friendly option for this purpose [10,11].
The carbon-rich content of municipal solid waste makes it a valuable renewable energy resource, leading to the adoption of Waste-to-Energy (WTE) technologies for combined heat and power (CHP) production [12]. With municipal solid waste generation outpacing urbanization rates, an estimated 2.2 billion tons per year are projected by 2025, and 4.2 billion tons by 2050 [12]. In China alone, approximately 30 million tons of food waste are generated annually, constituting 37% to 55% of MSW [13].
Anaerobic digestion (AD) proves effective for biomasses with high organic contents, converting degradable organic waste into bio-methane, a versatile fuel for heat and electricity generation [14]. However, the inhibition of AD may occur with certain single substrates due to unbalanced nutrient presence in the feedstock [15]. Intermediate products like total ammonia nitrogen (TAN) and volatile fatty acids (VFAs) can accumulate during AD, potentially leading to reduced methanogen activity and overall process failure [16].
Maintaining an optimal carbon-to-nitrogen (C/N) ratio is crucial when the considering anaerobic digestion and co-digestion of different mixtures. Researchers often suggest an optimum C/N ratio in the range of 20–30 for higher biogas yield during anaerobic co-digestion [17]. Adjusting the C/N ratio by co-digesting substrates with lower and higher ratios can enhance digestion performance. Municipal solid waste, comprising paper and paperboard with a C/N ratio ranging from 173 to 1000, was the focus of this study [18].
This paper focuses on the impact of the C/N ratio on biogas potential during the anaerobic co-digestion of MSW with food waste (FW) at different C/N ratios. MSW, characterized by low nitrogen and high carbon content, was co-digested with high-degradable FW possessing high nitrogen content. This approach mirrors similar methods used in the co-digestion of sewage sludge and MSW [19]. The co-digestion of cattle manure slurry with fruit and vegetable wastes has also been explored, blending high C/N ratio with low C/N ratio feedstocks to enhance digester performance [15]. Studies have shown that co-digestion of sisal pulp and fish waste increased methane yield by 59 to 94% compared to individual digestion [20]. Another example is the anaerobic co-digestion of food waste and rice straw, demonstrating improved biogas production with optimal nutrient balance [13]. Co-digestion contributes to a more stable pH and enhances methanogenic activity due to a better buffering effect. The objective of this study is to co-digest MSW with a high C/N ratio with FW with a low C/N ratio to evaluate the potential of co-substrates, considering the effects of mixing ratio and different C/N ratios on biogas yield and process stability.
The current work integrates sustainability by utilizing diverse waste streams to maximize biogas production efficiency and ensure stable digestion processes. By converting organic waste into renewable energy, this approach promotes resource conservation, reduces greenhouse gas emissions, and fosters a circular economy mindset, contributing to a future with more sustainable energy.

2. Materials and Methods

2.1. Raw Materials and Activated Sludge

Food waste (FW) sourced from a restaurant in Sahiwal City, Pakistan, was processed for experimentation. After the removal of bones and plastic materials, the FW underwent grinding using a blender (Waste King, Model SS3300, North Olmsted, OH, USA). The resulting ground FW was then preserved in a refrigerator at −20 ± 1 °C until needed for further analysis. Municipal solid waste (MSW) was acquired from a mechanically treated plant located in Tariq Bin Zaid Colony City, Sahiwal, where daily household waste undergoes mechanical mixing. The majority of municipal solid waste comprised wastepaper, used tissue paper, and cardboard materials. Activated sludge (AS) was collected from a pilot-scale anaerobic plant operating under mesophilic conditions. The AS was stored at 4 °C prior to its use. The characteristics of FW, MSW, and AS can be found in Table 1.

2.2. Experimental Design

To conduct a systematic investigation, two consecutive laboratory-scale experiment setups were employed. For all co-digestions, mesophilic conditions were maintained using a temperature-controlled incubator, applied to 1 L bottles with a working volume of 0.7 L. Prior to anaerobic digestion (AD), each bottle was securely sealed with airtight rubber corks to prevent any potential leakage. Subsequently, nitrogen gas was purged into each bottle for a duration of 7–8 min to eliminate any residual air presence. The performance of anaerobic digestion of municipal solid waste depends on the particle size. In order to contribute to improving the efficiency of the biogas process, mechanical pretreatments such as a rotary drum were used as an effective technology for MSW separation and pretreatment prior to use. Anerobic digestion could enhance the biogas production by 18–36%. Other mechanical methods that can be used to reduce particle size are a rotary screen, screen press, and disc screen shredder with a magnet [21].

2.2.1. Experimental Conditions

Experimental Conditions for Experiment 1

In the initial trial, a combination of MSW and FW was blended on a vs. basis, with ratios of 22.39:1, 7.92:1, 4.0:1, 2.97:1, 2.06:1, yielding the M1, M2, M3, M4, and M5 substrate mixtures, respectively. Table 2 provides details on the composition and C/N ratio of these substrates for various mixing proportions. Each mixture received a 10 gVSL−1 organic loading rate (OLR), and an inoculum of activated sludge was introduced to maintain an S/I ratio of 0.5. The remaining volume was filled with water. As a control, three bottles containing only activated sludge were included. In this experiment, the S/I (substrate to inoculum) ratio was fixed at 0.5; moreover, its effect was checked on different C/N ratio mixtures M1, M2, M3, M4, M5. The C/N ratio for all substrate mixtures was determined using Equation (1).
C N = F W T S × T O C + S W T S × T O C F W T S × T O N + S W T S × T O N
where FW is the weight of food waste (as received), SW is the weight of MSW (as received), TS is total solid, TOC is total organic carbon (dry mater %), and TON is total organic nitrogen (dry mater %).

Experimental Conditions for Experiment 2

After analyzing the initial experimental findings, the co-substrate feedstock composed of municipal solid waste (MSW) and food waste (FW) with a C/N ratio of 20 was chosen for the subsequent experiment. A constant organic loading rate (OLR) of 10 g VSL−1 was applied across all substrate-to-inoculum (S/I) ratios. The co-digestion of MSW and FW, in combination with the inoculum, was conducted to achieve S/I ratios of 0.5, 1, 1.5, and 2.0, respectively. The composition of the inoculum and the mixed substrates for the second experiment is shown in Table 3. The choice for C/N taken as 20 and S/I changed based on the previous study that shows that the production of bio-gas is maximum at a C/N ratio of 20.
The experiment was conducted in triplicate to prevent errors. Each bottle underwent manual shaking for 4–5 min to ensure uniformity in the loaded slurry. The daily biogas volume for each bottle was measured using the water displacement method. Anaerobic digestion (AD) was maintained until no additional biogas was generated by the bottles.

2.3. Kinetic Model

The Gompertz growth equation was used to develop a kinetic model and was then used to calculate the cumulative methane yield as a BMP test [22].
B G = B G p e x p R m e B G P ( λ t ) + 1
where BG is the cumulative methane yield (mL g vs.−1), BGp is the methane yield potential (mL g vs.−1), Rm is the maximal daily methane potential (mL g vs.−1 d), λ is the time lag for bacterial growth, t is digestion time, and e = 2.72.
The kinetic model was chosen based on the specific system or process being studied, as well as the goals of the investigation. It also allows for the estimation of parameters that can be compared with experimental data. This often involves fitting the model to experimental observations to determine the values of rate constants, equilibrium constants, or other parameters.

2.4. Analytical Methods

The TS, VS, pH, alkalinity, and total ammonia nitrogen (TAN) were computed following the APHA guidelines (1998). Total carbon (TC) and total nitrogen (NT) were determined using the TC analyzer (Skalar Primacsslc, Breda, The Netherlands) and the total Kjeldahl nitrogen analyzer (Model KDN-2c, Shanghai, China). Lignin, hemicellulose, and cellulose (LHC) contents were derived using the methods proposed by Soest, Robertson, and Lewis [23]. Daily biogas volume was measured through the water displacement method, and the cumulative biogas volume was subsequently calculated. The measured biogas volume was converted to standard temperature and pressure (STP) using the ideal gas law. This volume was then utilized to calculate the mass of methane (CH4) based on its respective content. Gas compositions were analyzed daily using a gas chromatograph (GC) (SP-2100, BeifenRuiLi Co., Beijing, China) equipped with a molecular sieve (TDX-01) packed 2 m × 3 mm stainless-steel column and a thermal conductivity detector (TCD). The oven, injector port, and TCD temperatures were maintained at 140, 150, and 150 °C, respectively, with argon gas serving as the carrier gas at a flow rate of 30 mL/min. Methane production was obtained by multiplying daily biogas production by the daily methane content. To determine daily biogas yield, the volume of biogas produced each day was divided by the initial vs. that loaded into the reactor. Cumulative biogas yield was calculated by summing the daily biogas yield at the completion of each test. Statistical analysis of all data was conducted using the ANOVA tool in Origin version 8.5.1.

2.5. Theoretical Methane Yield and Biodegradability

Buss Well’s equation, represented as Equation (3), was employed to determine the empirical formula for municipal solid waste (MSW) and food waste (FW). By considering the mass content and molar mass of each constituent element, the chemical formulas for MSW and FW were established as Ca1Hb1Nc1Od1 and Ca2Hb2Nc2Od2, respectively. The theoretical methane yield (TMY) for both substrates was then computed using Equation (4).
C n H a O b N c + n a 4 b 2 + 3 c 8 H 2 O n 2 + a 8 b 4 + 3 c 8 C H 4 + n 2 a 4 + 3 c 8 C O 2 + c N H 3
T M Y = 100 × 22.4 × n 2 + a 8 b 4 3 c 8 12 n + a + 16 b + 14 c

3. Results and Discussion

3.1. Effect of C/N Ratio on Anaerobic Digestion Performance and Stability

An elevated accumulation of ammonia, attributed to a lower C/N ratio, can lead to a rise in pH levels, thereby causing inhibition in the digestion process [24]. The pH levels of all co-substrates were monitored both before and after anaerobic digestion (AD). The digestate pH for P1 and P2 co-substrates exhibited an increase due to their high FW content. Nevertheless, the overall pH of the digestate remained within the optimal range of 7.0–8.0 [25,26].
When the C/N ratio is high, meaning there is an excess of carbon relative to nitrogen, it can lead to carbon limitation for microbial growth. Microorganisms may struggle to access sufficient nitrogen for their metabolic processes, leading to slower growth rates and changes in community composition. Some microbes may be favored over others, depending on their ability to efficiently utilize available nitrogen sources.
Conversely, a low C/N ratio indicates an excess of nitrogen relative to carbon. In this case, microbial growth may be limited by carbon availability. Microbial communities can shift towards species that are better adapted to utilizing carbon-rich substrates. This could lead to changes in the dominance of certain microbial populations within the community [27,28].

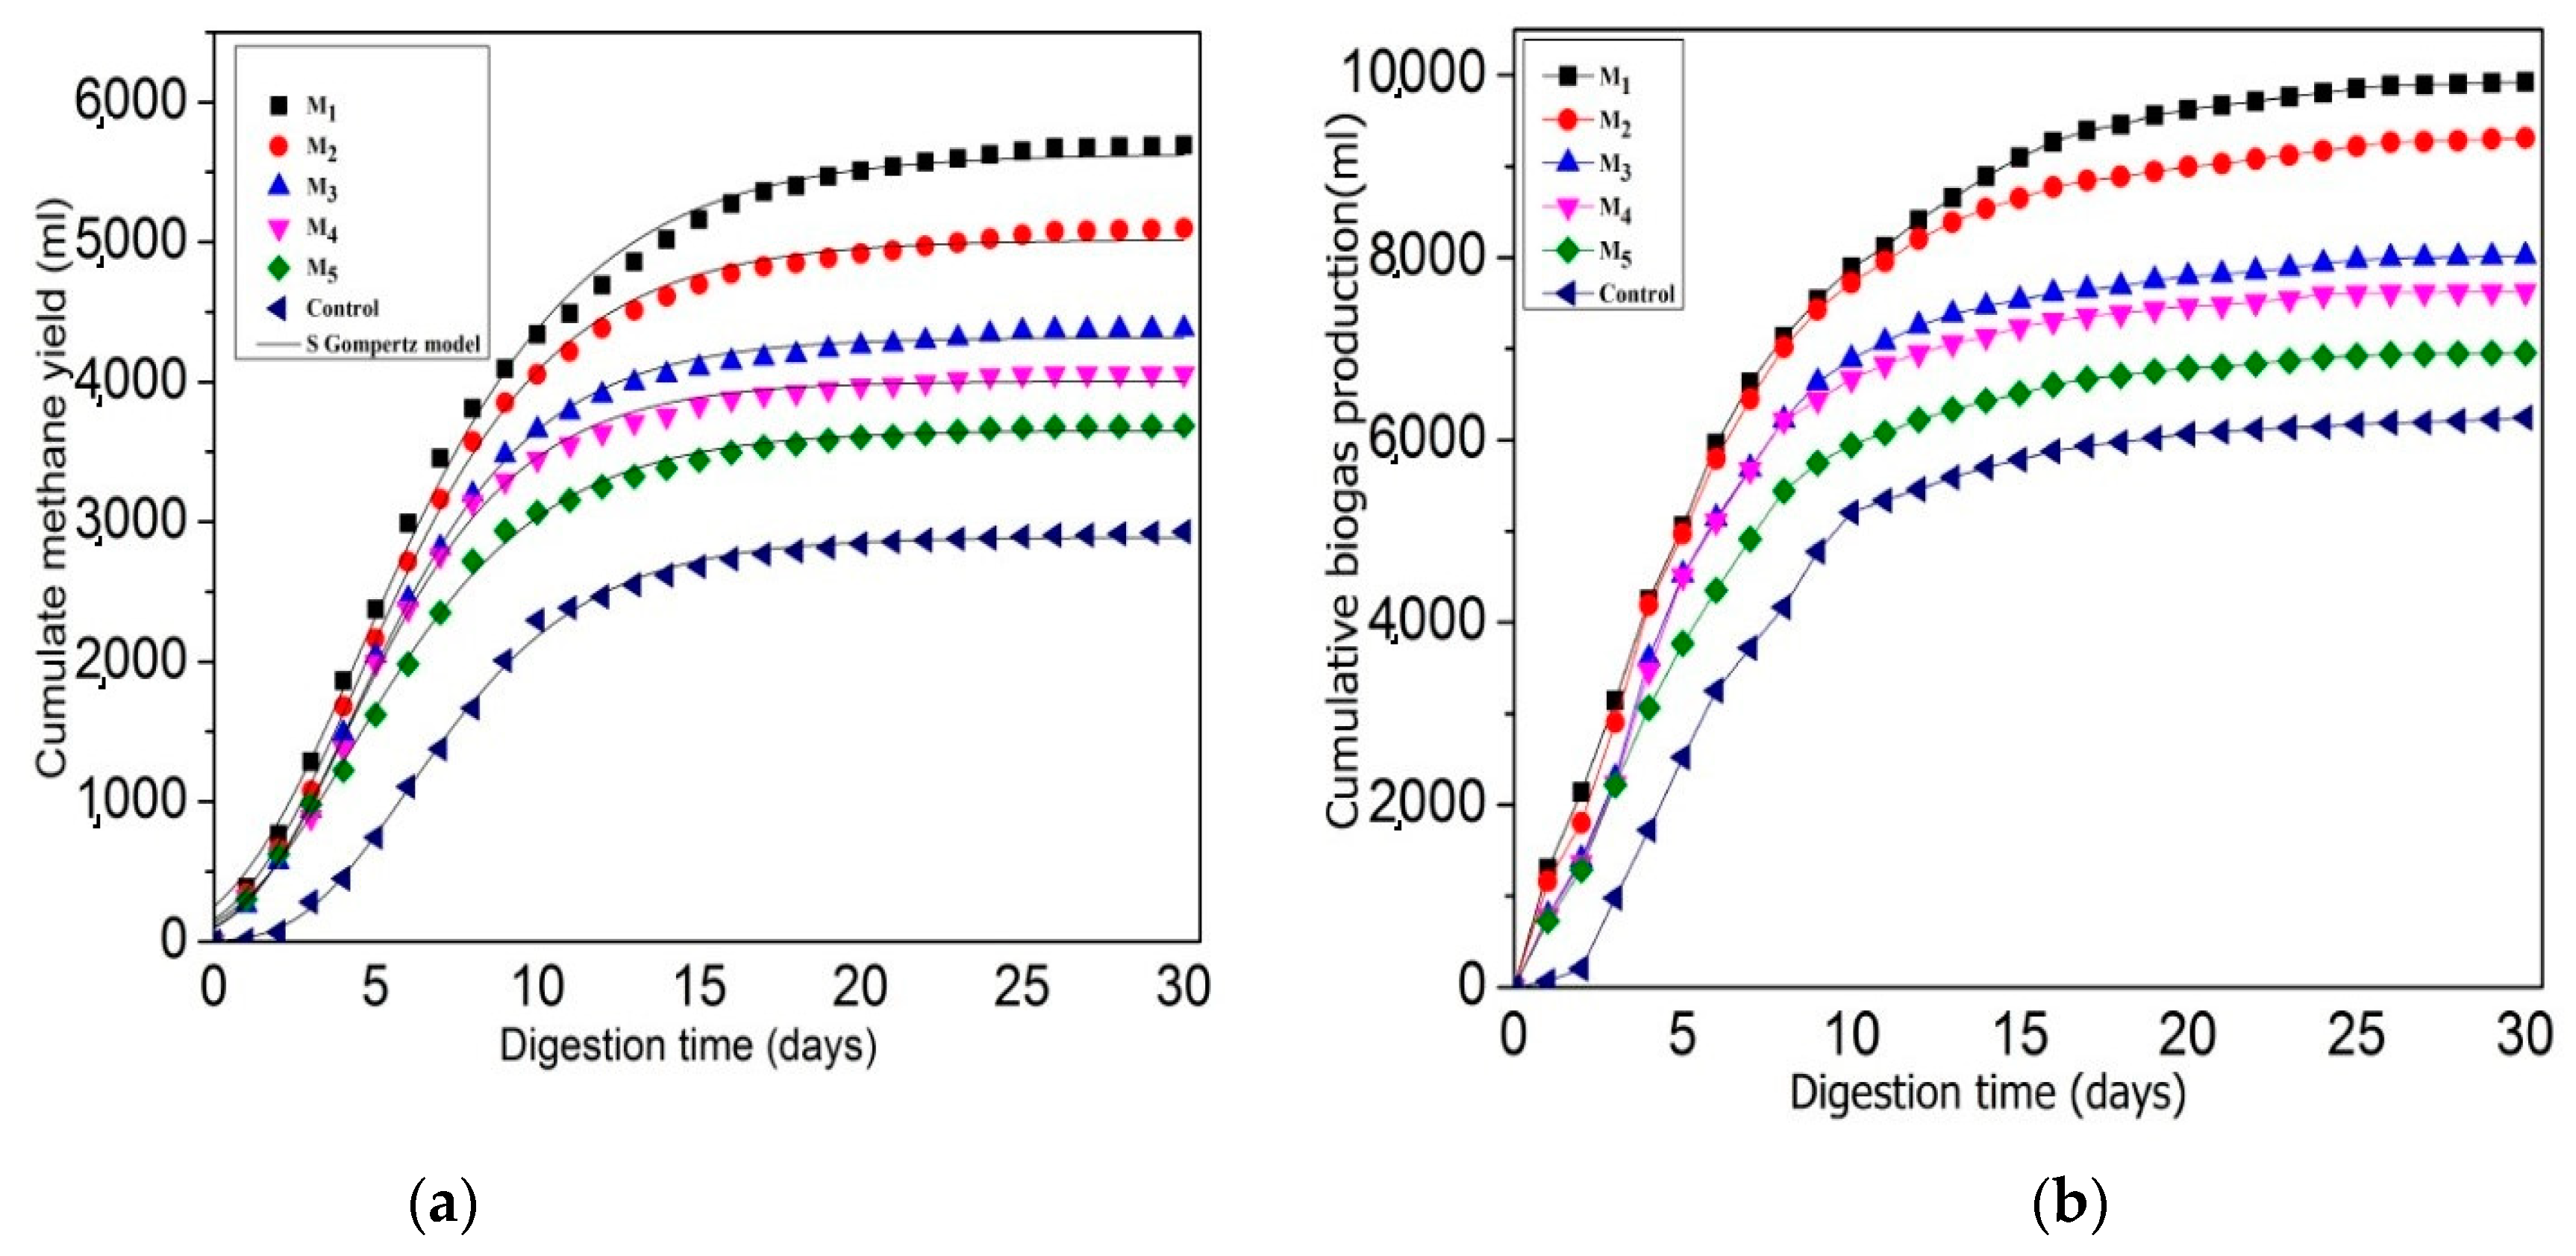
3.1.1. Effect of C/N Ratio for Biogas and Bio-Methane Yield

Figure 1 illustrates the daily biogas and bio-methane yield for various co-substrate mixtures. After a 30-day digestion period, the specific biogas yield of co-substrate mixtures M1, M2, M3, M4, and the mono substrate containing MSW reached 825, 765, 680, 645, 585, and 530 L kg−1 VS−1, respectively. Approximately 95–97% of the total biogas production occurred within the first 20 days of the digestion period for all co-substrate mixtures.
Figure 2a,b illustrates the cumulative methane and biogas yields for various C/N ratio. Notably, co-substrate mixture M1 exhibited the highest cumulative biogas and bio-methane yields, possibly attributed to rapid ammonia consumption during the methanogenesis stage, leading to reduced biogas production in substrates with higher C/N ratios [29]. Statistical analysis revealed a significant difference (p < 0.05) between M1 and M5. Alternatively, the biodegradability of co-substrates increased with an increase in the fraction of FW from 10% to 90% [30]. Moreover, the tendency for the rapid degradation of non-structural carbohydrates, coupled with their pH-lowering characteristic, poses a potential risk of disrupting the anaerobic digestion (AD) process [31,32]. Additionally, their high cost presents a challenge in their utilization as a carbon feedstock within AD plants. Consequently, structured polysaccharides have become widely favored as carbon feedstock in biogas facilities. Taking these factors into account, there is a suggestion that appropriately processed fibrous materials could serve as valuable feedstock, exhibiting methane generation rates comparable to non-structural carbohydrates but with enhanced stability [33]. Furthermore, organic waste such as MSW, which contains a relatively high lignocellulosic content, may have hindered the digestion process in other co-substrate mixtures [34]. These findings align with similar studies on co-mixing substrates, where biogas yield was 531 L Kg-1 VS-1. when food waste was co-digested with manure under the same operating conditions [35]. Additionally, co-digestion of food waste with rice husk resulted in the highest biogas yield of 584 LKg-1 at a 20 C/N ratio [36,37]. Since Raposo et al. [38] found that methane generation for starch and cellulose in AD under mesophilic temperature settings utilizing different inoculum was similar, it is hypothesized that methane production under the same carbon content would also be similar. Because of this, the maximum methane output assumes that the carbon content alone affects it and that it may not vary depending on the type of carbon [39].

3.1.2. Effect of C/N Ratio for Digestate Stability

The key indicators for assessing the stability of digestate include the pH value, TAN concentration, and the TVFA/alkalinity ratio. Notable variations were observed in the initial and final pH values of the co-substrate mixtures (M1–M5) due to VFA production during anaerobic digestion (AD). Despite these variations, all digestate samples remained within the stable pH range of 6.5–8 [25].
The average TAN concentration exhibited a decline from 1.29 to 0.67 g/L for M1–M5, with M1 and M2 showing higher TAN concentrations attributed to the protein-rich nature of food waste (FW). The breakdown of protein compounds likely led to the conversion of ammonia into ammonium bicarbonate, resulting in elevated TAN levels. Another parameter indicating digester stability is the TVFA/Alkalinity ratio, which consistently remained below 0.4 for all co-digestate mixtures, confirming their stability [40].
In the context of potential inhibition, propionate concentrations exceeding 1000 ppm can hinder the AD process [41]. However, the VFA concentrations in this study’s digestate samples ranged from 50 to 150 mg/L, well below the inhibitory threshold. The comprehensive evaluation of digester stability and performance is summarized in Table 4.

3.1.3. TS and VS Reduction

The characteristic of biomass degradation depends upon the reduction of total solids (TSs) and volatile solids (VSs). Effective degradation is indicated by higher values of TS and vs. reduction. In the case of co-substrate mixtures M1, M2, M3, M4, and M5, the TS reduction was higher compared to the sole municipal solid waste (MSW) substrate. This finding aligns with the hypothesis of the study. A higher vs. reduction corresponds to an increased biogas yield, as the trend in vs. conversion mirrors that of biogas production. Among the substrate mixtures, M1 exhibited the highest biogas production rate and demonstrated the greatest vs. reduction. The vs. conversion from M1 was 1.29 times higher, and the TS reduction was 1.23 times higher than those of M2, M3, M4, and M5, respectively. This can be attributed to the higher proportion of food waste in M1 compared to the other four co-substrate mixtures. Food waste constitutes 75% of easily biodegradable organic matter [42,43]. Studies, such as those by Brown and Li [44], have reported similar results, indicating that a higher fraction of food waste leads to increased vs. reduction. Conversely, the substrate mixture M5, with a C/N ratio of 40, exhibited the lowest TS and vs. reduction. Detailed values for TS and vs. reduction are provided in Table 4.

3.2. Effect of S/I Ratio on Anaerobic Digestion Performance and Stability

M1, identified as the optimal C/N ratio in experiment 1, was employed in subsequent investigations to assess the impact of various S/I ratios. The performance of the digesters was evaluated based on specific biogas yield and the reduction of TS and vs. after 30 days of anaerobic co-digestion. Each reactor received a loading of 10 gVS/L, and four different S/I ratios (0.5, 1.0, 1.5, and 2.0) were tested at a temperature of 35 ± 2 °C. The average results of the reactors were analyzed under standard temperature and pressure (STP) conditions.
A high substrate-to-inoculum ratio means there is a plentiful supply of nutrients relative to the initial microbial population. In this scenario, microbial growth is often limited by the availability of inoculum rather than substrate. This can lead to rapid proliferation of microbial populations, potentially resulting in shifts in community composition as certain species outcompete others for resources.
Conversely, a low substrate-to-inoculum ratio implies that there are limited nutrients available compared to the initial microbial population. This can result in competition among microbial species for limited resources, potentially leading to changes in community structure as certain species are favored over others based on their metabolic capabilities and resource utilization efficiency [45].
Overall, both the C/N ratio and substrate-to-inoculum ratio play important roles in shaping microbial community structure by influencing nutrient availability and microbial growth dynamics. Understanding and manipulating these parameters are essential for controlling and optimizing microbial processes in various applications such as bioremediation, composting, and wastewater treatment [46].

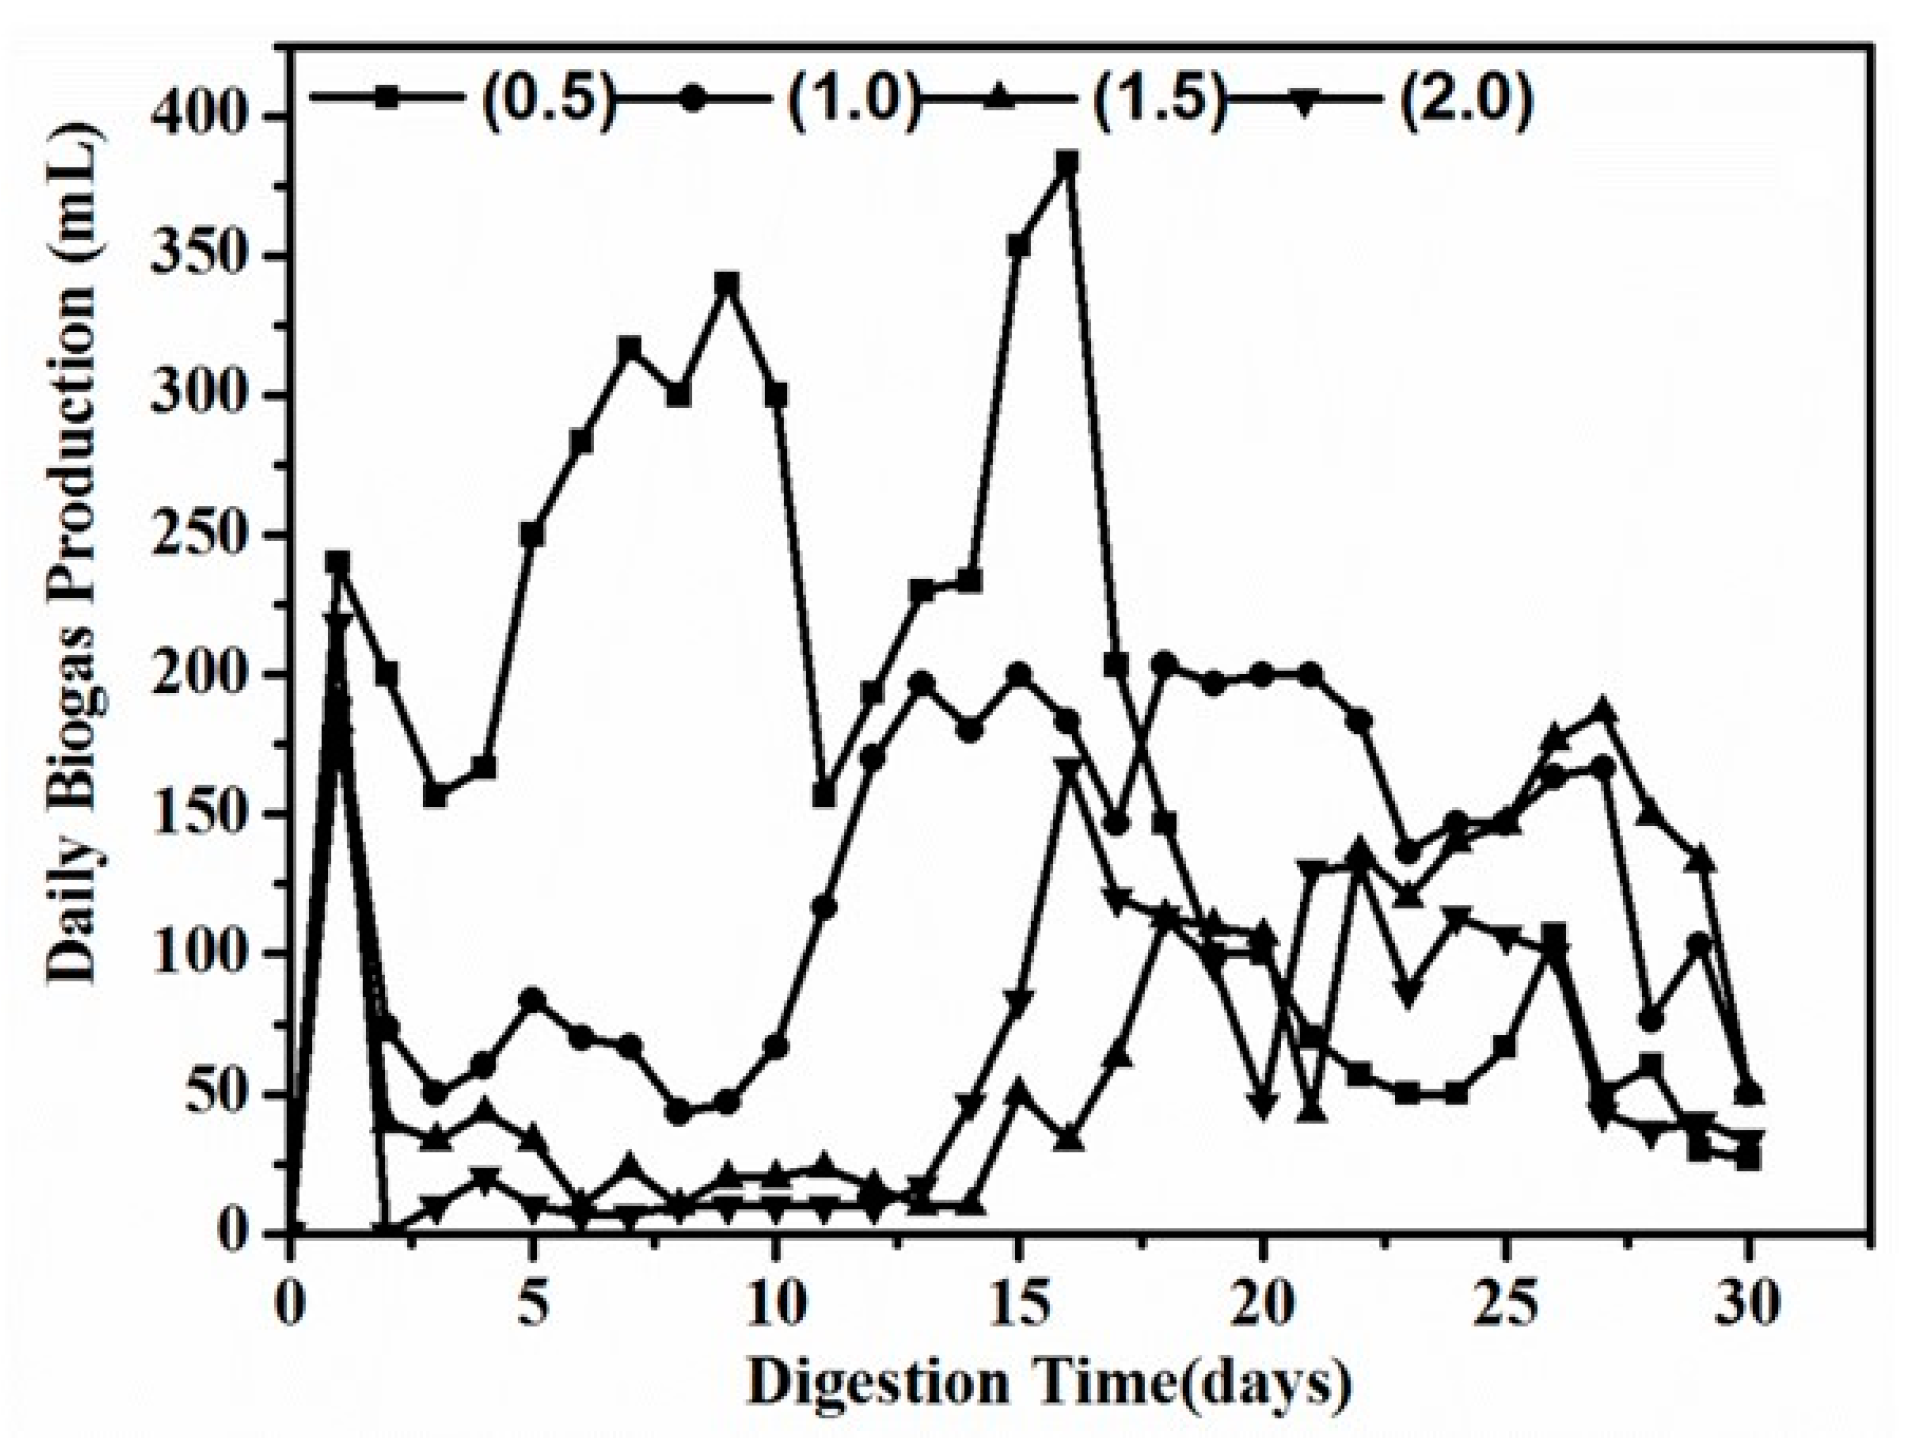
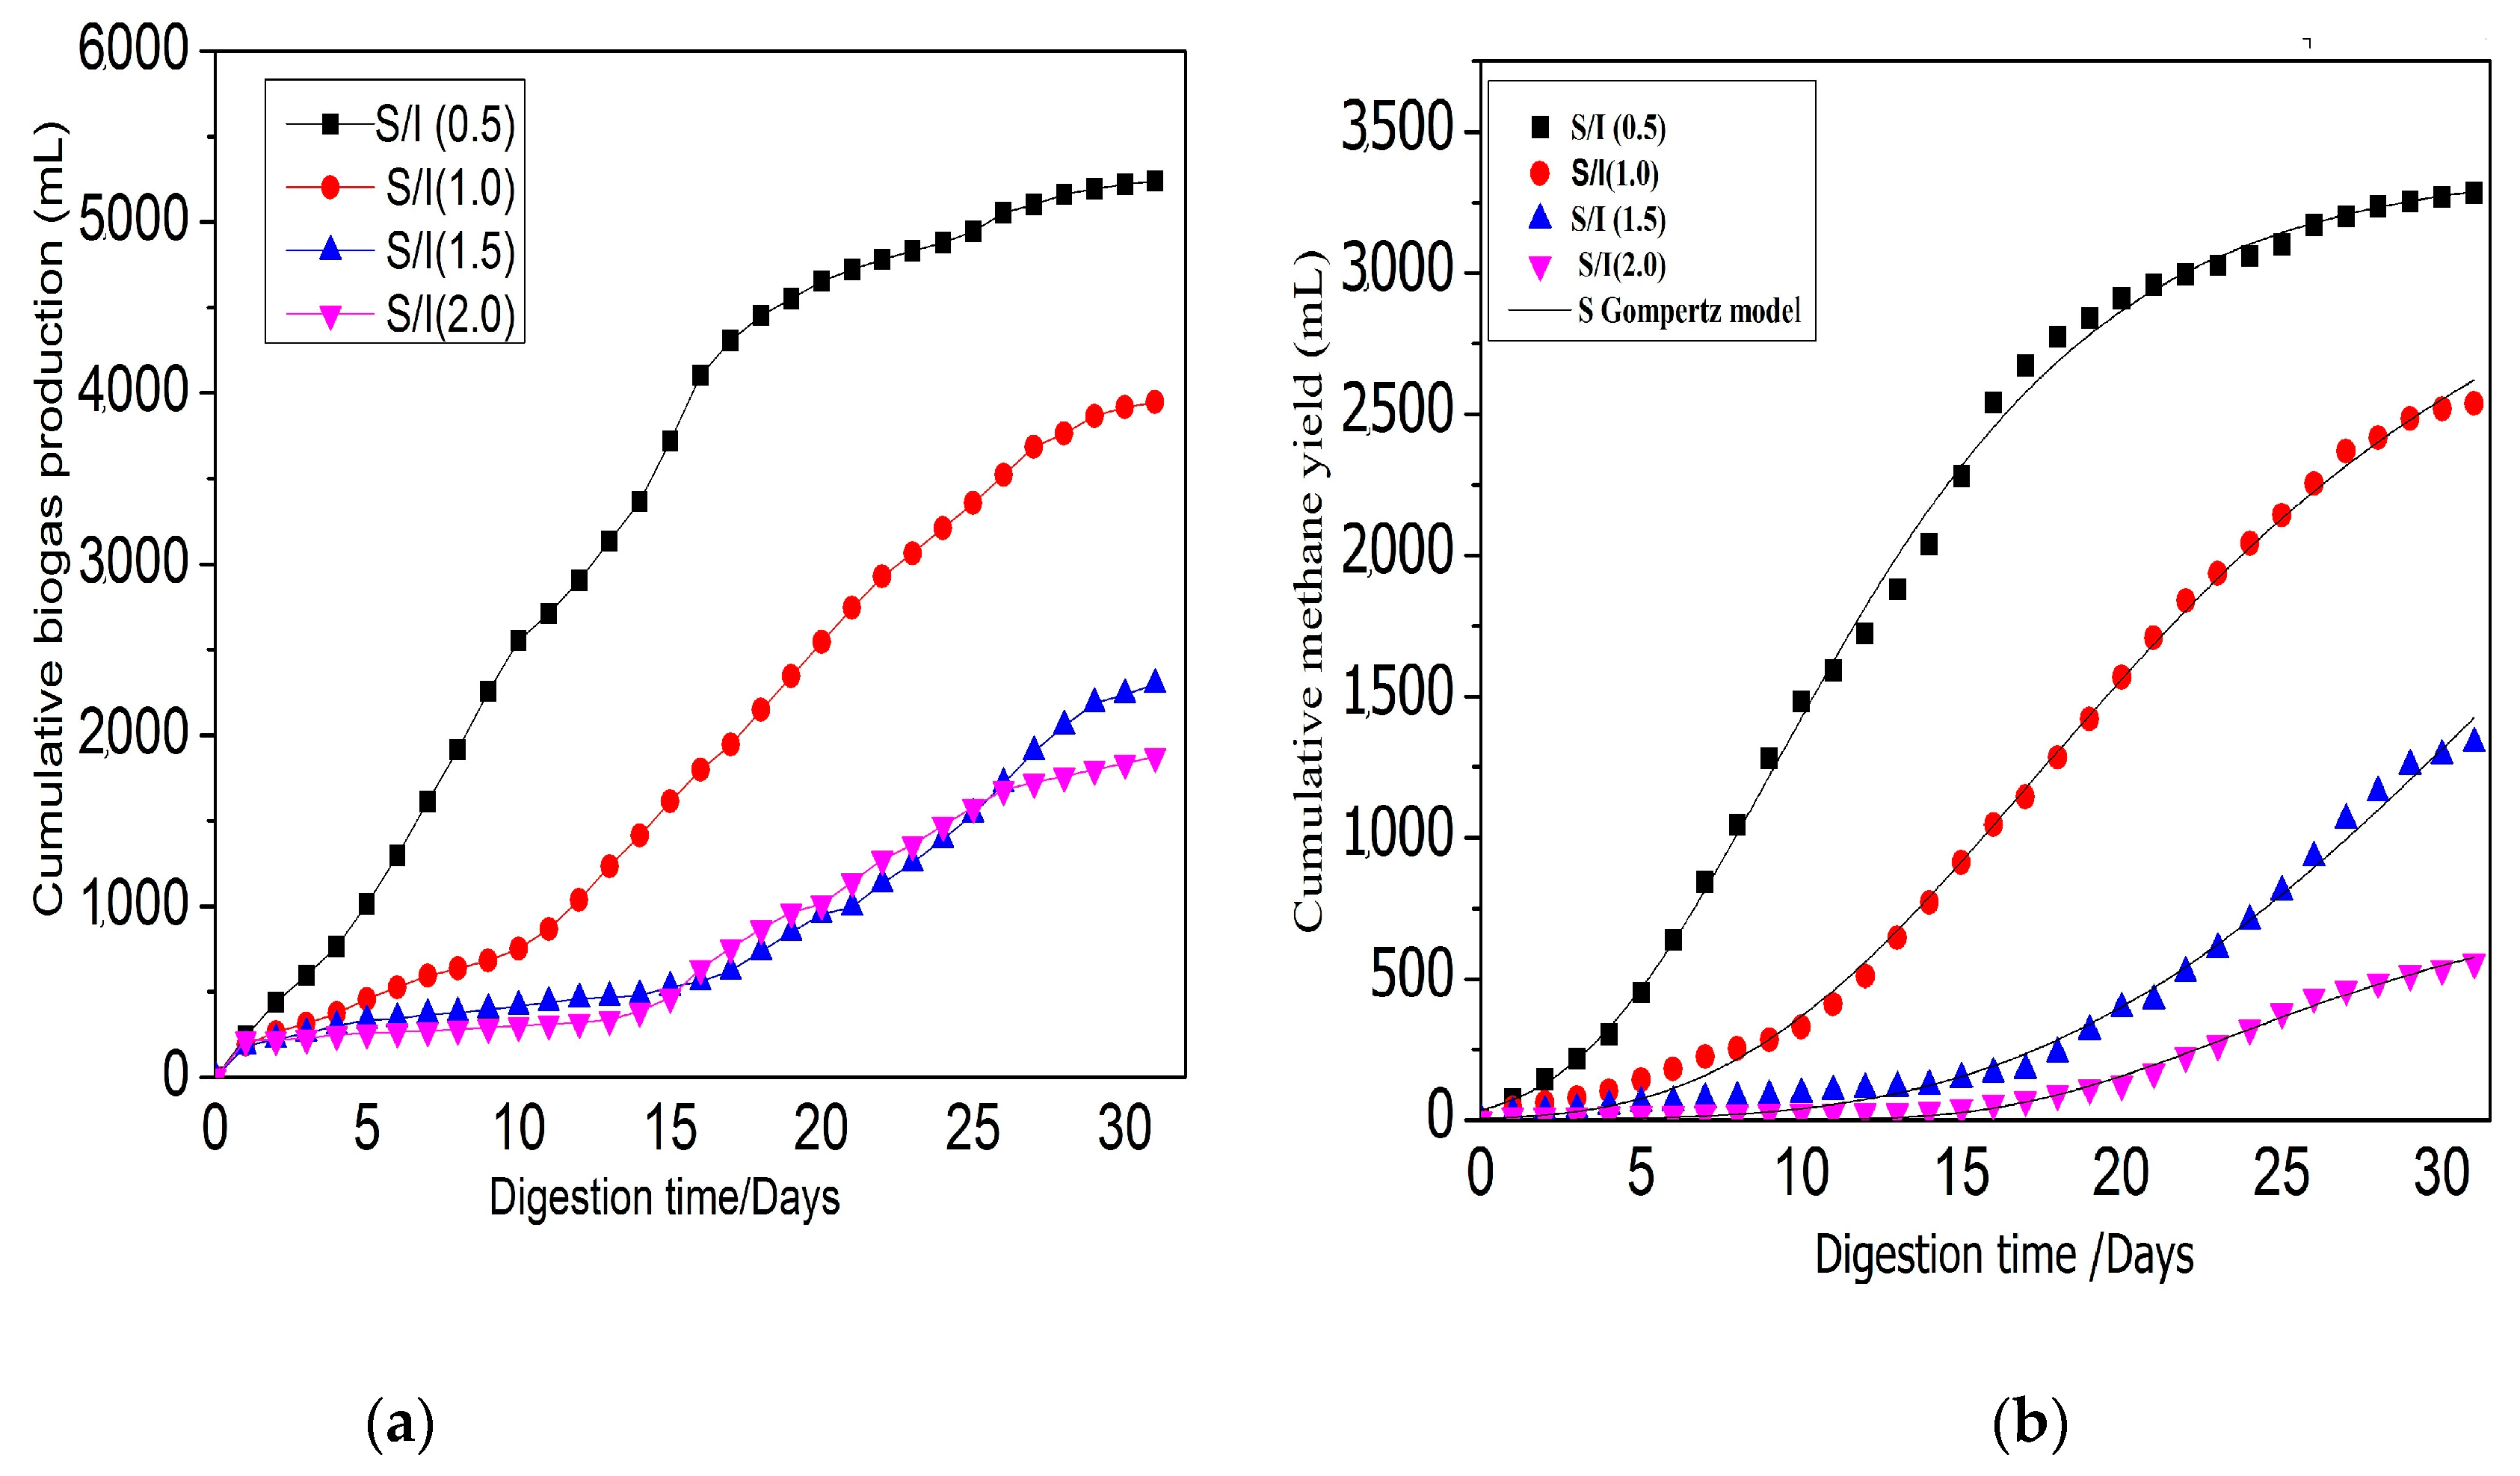
3.2.1. Effect of S/I Ratio for Biogas and Bio-Methane Yield

Figure 3a,b illustrates the cumulative methane and biogas yields for various S/I ratios. The specific biogas yields at S/I ratios of 0.5, 1.0, 1.5, and 2.0 were 640, 495, 347, and 230 L·Kg−1VS−1, respectively. Notably, the reactor with a 0.5 S/I ratio exhibited the highest biodegradation rate compared to other ratios. The 0.5 S/I ratio co-mixture substrate generated 88% of the total biogas yield in the initial 20 days, with minimal biogas production in the last 10 days. In contrast, S/I ratios of 1.0, 1.5, and 2.0 produced 84%, 69%, and 83%, respectively, of the total biogas within 26 days, with the remaining produced in the last 4 days of anaerobic digestion (AD). The decline in biogas production may be attributed to the lower sludge content in the 1.0–2.0 S/I ratio reactors, potentially causing an imbalance in microorganism activity. The rate of substrate biodegradation and the digestion time are contingent on the activity and concentration of microorganisms in the anaerobic digester [47,48].

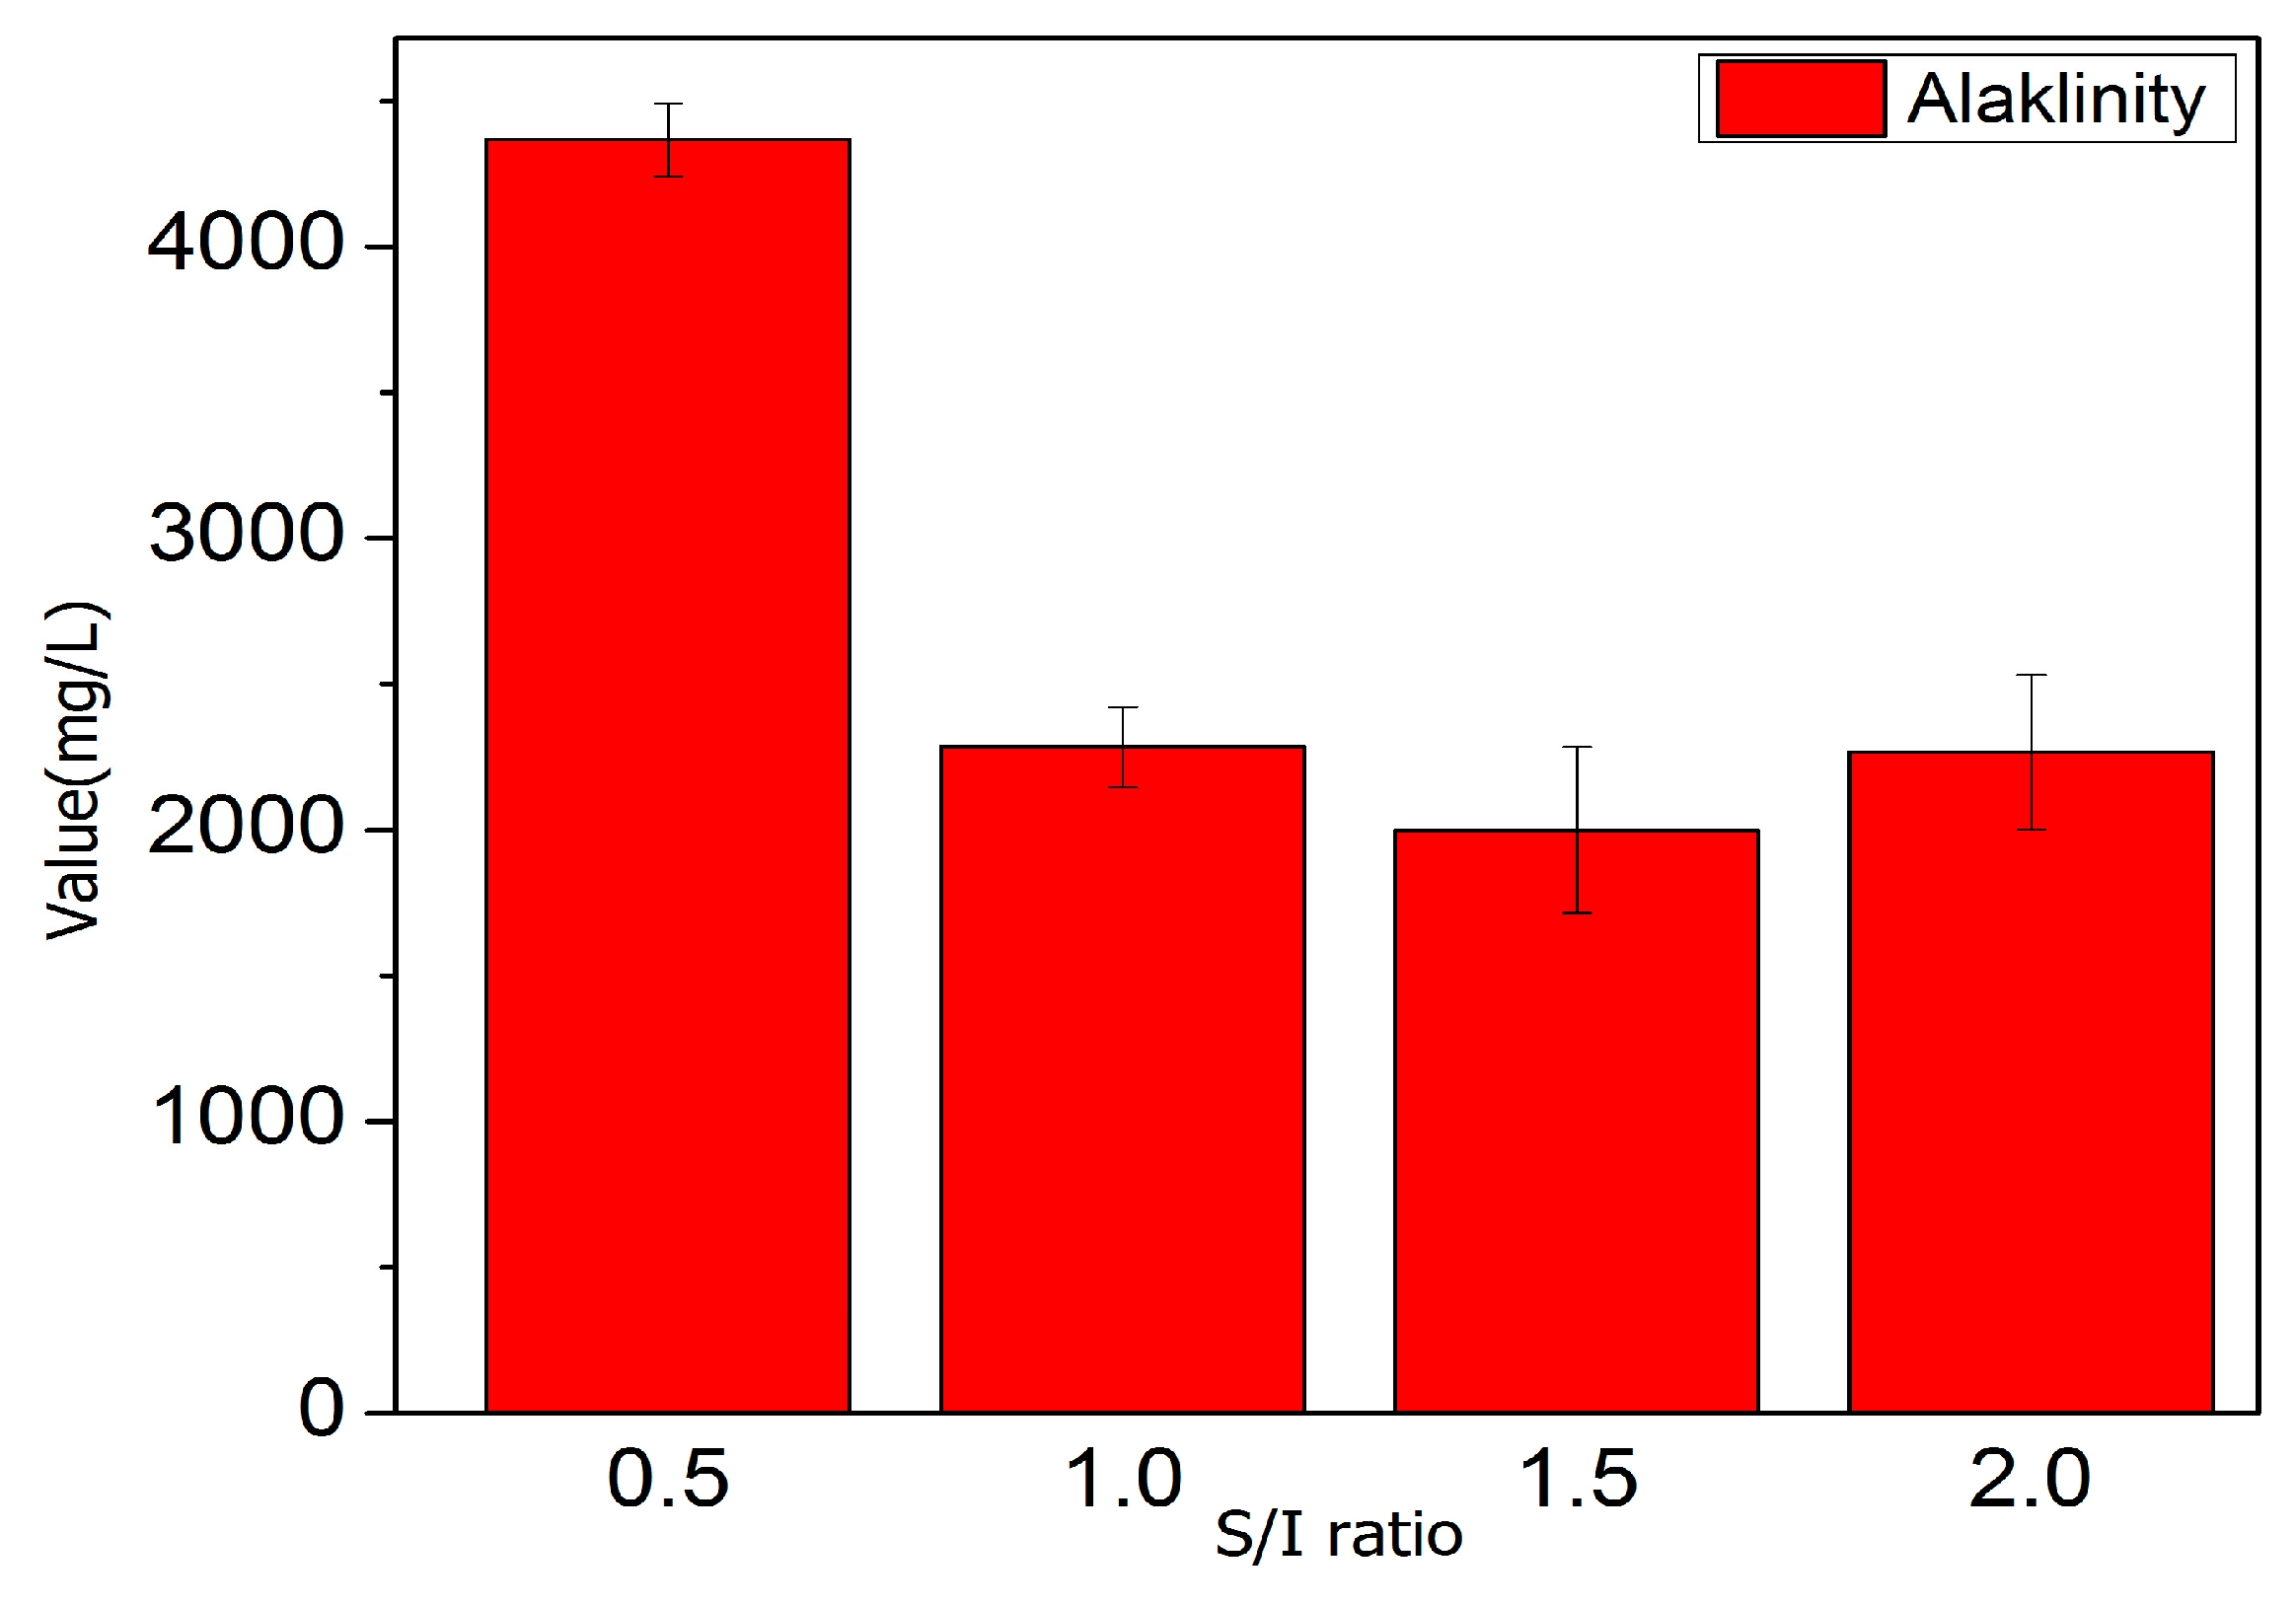
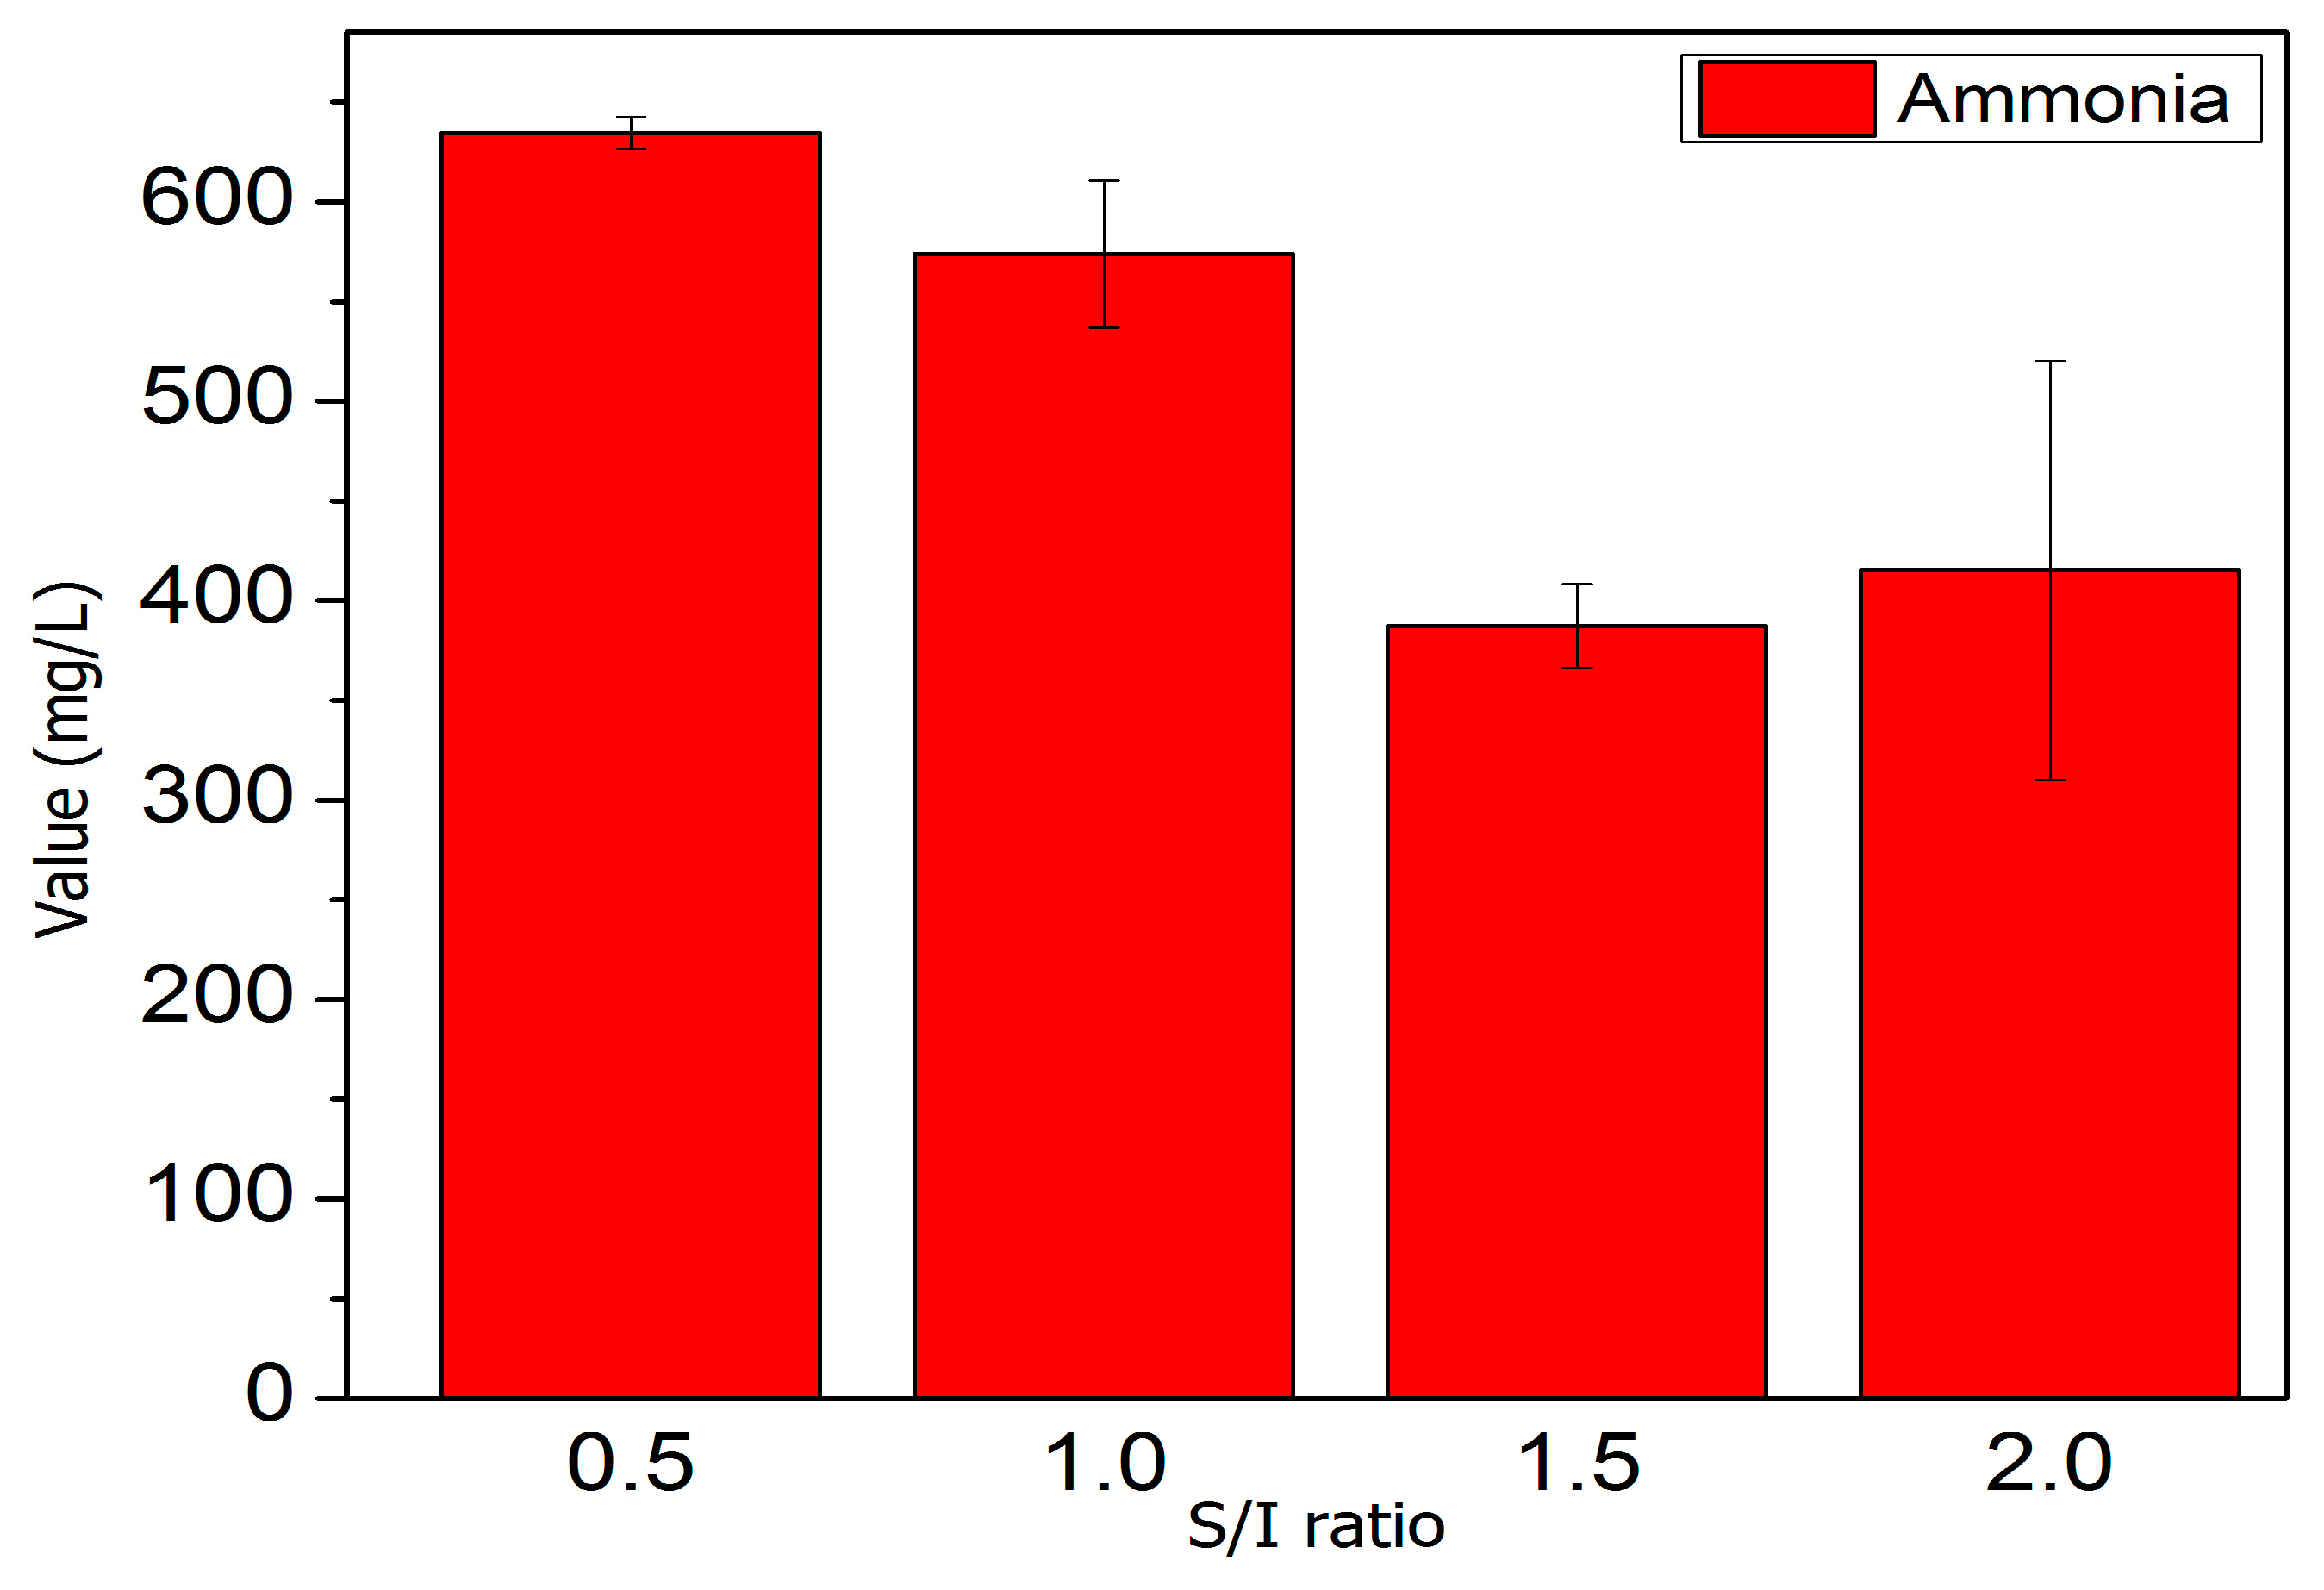
3.2.2. Effect of S/I Ratio on Digester Stability and PH

Digester stability was assessed by analyzing samples post-digestion. Figure 3 shows the effect of S/I ratio The lowest biogas production was observed at a substrate-to-inoculum ratio from 1.5 to 2.0, attributed to a disrupted affiliation between the feedstock and inoculum microorganisms. The pH of the digester with a substrate-to-inoculum ratio of 0.5 remained stable throughout the digestion period, ranging from an initial pH of 7.44 to 7.47. The balanced affiliation between feedstock and inoculum microorganisms resulted in a stable pH and an enhanced buffering effect in the digestion medium [49,50]. The pH is one of the important parameters to indicate stability during AD, and methanogenesis is most active near pH 7 [51]. On the other hand, it is inhibited in the condition of over pH 8 [52].
In digesters with a substrate-to-inoculum ratio from 1.5 to 2.0, a pH drop occurred after 3 days of the startup phase. This decrease in pH was attributed to a low amount of inoculum, leading to increased volatile fatty acid (VFA) concentration and reduced digester stability, resulting in no biogas production [22]. The insufficient amount of inoculum also contributed to a low rate of hydrolysis, requiring more time for complete substrate biodegradation and causing a slow production of VFA [53,54]. The pH drop in these digesters was recorded at 7.38 and from 7.28 to 5.54–5.32. A pH below 6.5 in anaerobic digestion is considered an inhibitor for biogas production [55]. To rectify this, the alkaline reagent calcium hydroxide Ca(OH)2 was used to adjust the pH from 5.54–5.32 to 7–8, within the suitable range for anaerobic digestion. Following pH adjustment, the digester was restarted for biogas production. An unbalanced proportion of feedstock and inoculum microbes in the digester led to a sharp failure in the process [56]. Post-digestion, the characteristics of the digestate for all substrate-to-inoculum ratio digesters are detailed in Table 5.

3.2.3. Graphically Examined Process Stability

The equilibrium affiliation between feedstock microorganisms should lead to a stable pH increase, enhancing the buffering effect of the digestion medium [14]. Digesters with an S/I ratio from 1.5 to 2.0 were found to experience a drop in pH within 3 days of the startup phase. The pH decrease ranged from 7.38 to 5.54–5.32, and pH levels below 6.5 in anaerobic digestion could inhibit biogas production [44]. Alkaline reagent calcium hydroxide was used to readjust the pH from 5.54–5.32 to 7–8, bringing it within the appropriate range for AD. After 6 days of pH readjustment, the digester resumed biogas production. The pH drop was attributed to the low quantity of the inoculum added, which may need to be increased to enhance VFA concentration and minimize digester imbalance, ensuring biogas production [47,57]. A lower amount of inoculum results in a slower rate of hydrolysis and requires more time for complete substrate biodegradation, prolonging digestion time [55]. High ammonia nitrogen concentrations can increase pH levels, which have been shown to inhibit the AD process when exceeding 3000 mg/L [58,59].
During the AD process, proteins yield Ammonia and Nitrogen, which can hinder the process in two ways: through the inhibition of methane production by ammonium ions and through the disruption of proton balance by hydrophobic ammonia [19,60,61]. Research comparing feedstocks with carbon-to-nitrogen ratios of 27 and 32 found that a higher ratio resulted in a 30% reduction in ammonia concentration in the effluent, indicating its potential impact on process efficiency [62].

3.2.4. Biodegradability and Methane Yield

Table 5 displays the impact of biodegradability at four distinct S/I ratios post-digestion. The highest biodegradability was witnessed at an S/I ratio of 0.5, with a methane yield of 401 L/kg vs. and a biodegradability rate of 67%. Conversely, at an S/I ratio of 2.0, the methane yield hit 118 L/kg VS, accompanied by a biodegradability rate of 18%. Notably, the biodegradability rate at an S/I ratio of 0.5 surpassed other ratios (1.0, 1.5, and 2.0) by 1.28 times. Also Figure 4 and Figure 5 shows the total nitrogen and total ammonia content that varies with SI/I ratio. Lower S/I ratios foster a harmonious interaction between inoculum microbes and substrate, resulting in elevated biodegradability and methane yield. Conversely, S/I ratios exceeding 2 lead to process instability, marked by acidification and the accumulation of VFAs. The production of VFAs stems from the unsterilized process and the low buffering capacity of the system [63,64].
The modified Gompertz model has been extensively utilized in simulating microbial growth kinetics and the formation of bio-products. However, a significant limitation of this model lies in its inability to satisfy the initial condition of bio-products. This study addresses this issue by developing a generalized Gompertz model and its two-parameter variant for microbial growth, both of which can revert to the original Gompertz model. Additionally, an extension of the microbial growth model incorporates bio-product production and substrate consumption through respective yield coefficients. These models ensure adherence to the initial conditions of microbial growth, bio-products, and substrate consumption.
In anaerobic digestion, the efficiency of the process is commonly estimated using the cumulative gas volume produced and the specific volume (gas volume per gram of initial volatile solid (VS) or chemical oxygen demand (COD)) [65].

3.3. Kinetic Model

The Gompertz growth equation was applied to conduct a nonlinear regression analysis on the cumulative methane yield resulting from various C/N ratios and S/I ratios in different feedstocks. Table 6 illustrates the outcomes of nonlinear regression analysis on the cumulative methane yield after digestion for different C/N and S/I ratios.
In the case of the co-substrate mixture M1 with a C/N ratio of 20, the cumulative methane yield increased from 5745 to 5895 mL g V−1, and the maximum daily methane yield also rose from 545 to 615 mL g V−1. Statistical analyses indicated a significant difference (α < 0.05) between M1 and M5, respectively. These findings suggest that an increased C/N ratio (from 20 to 25) resulted in lower biodegradability during digestion. Co-substrate mixture M1 exhibited a higher methane potential (5895 mL g V−1), as predicted using the Gompertz growth equation.
Similar trends were observed in the cumulative methane yield for different S/I ratios. When co-substrate mixture M1 was examined at varying S/I ratios (ranging from 0.5 to 2.0), the cumulative methane yield at S/I 0.5 decreased from 3543 to 3385 mL g V−1. Although the maximum daily methane yield increased from 245 to 255 mL g V−1, the cumulative methane was predicted to decrease based on the Gompertz model. These patterns indicate imbalanced interactions between the substrate and inoculum microbes. The cumulative methane yield decreased with an increase in the S/I ratio from 0.5 to 2.0. However, at an S/I ratio of 0.5, the methane decreasing rate was comparatively lower than that observed at S/I ratios of 1.0, 1.5, and 2.0, respectively.

4. Conclusions

The successful conversion of municipal solid waste (MSW) and food waste (FW) into biogas was achieved, with no accumulation of volatile fatty acids (VFAs) and stable performance of the digesters. Co-digestion of MSW and FW provided dual advantages: (1) maintaining a balanced carbon-to-nitrogen (C/N) ratio within the optimized range of 20–25/1, and (2) ensuring digester stability, ultimately enhancing the rate of biogas production. An optimal substrate-to-inoculum (S/I) ratio of 0.5 was identified for the co-digestion process. S/I ratios of 1.5 to 2.0 exhibited an unbalanced proportion between the feedstock and inoculum microorganisms, leading to VFA accumulation, which was attributed to a reduction in the inoculum amount. Higher S/I ratios required more time for the complete degradation of the substrate. In this study, the highest methane yield was successfully achieved with an S/I ratio of 0.5 and a C/N ratio of 20:1, without any interruptions in the process. This study further suggests that the industrial application of co-digestion requires more knowledge of the selection of feedstocks and suitable mixing ratios. Due to the various properties of different wastes, lab or pilot-scale co-digestion experiments are necessary to determine the suitable mixing ratios.

Author Contributions

Conceptualization, R.M.A.; Methodology, S.J.; Validation, S.A.; Formal analysis, A.A.; Resources, N.N.; Writing—review & editing, Q.u.Z. and A.H. All authors have read and agreed to the published version of the manuscript.

Funding

The project is funding by the Researchers Supporting Project number (RSP2024R194), King Saud University, Riyadh, Saudi Arabia.

Institutional Review Board Statement

Not applicable.

Informed Consent Statement

Not applicable.

Data Availability Statement

The datasets analyzed during this study are included in this manuscript.

Acknowledgments

The authors sincerely acknowledge the Researchers Supporting Project King Saud University, Riyadh, Saudi Arabia for funding this project.

Conflicts of Interest

The authors declare no conflict of interest.

References

  1. Maheshwari, P.; Haider, M.B.; Yusuf, M.; Klemeš, J.J.; Bokhari, A.; Beg, M.; Al-Othman, A.; Kumar, R.; Jaiswal, A.K. A review on latest trends in cleaner biodiesel production: Role of feedstock, production methods, and catalysts. J. Clean. Prod. 2022, 355, 131588. [Google Scholar] [CrossRef]
  2. Rasheed, T.; Anwar, M.T.; Ahmad, N.; Sher, F.; Khan, S.U.D.; Ahmad, A.; Khan, R.; Wazeer, I. Valorisation and emerging perspective of biomass based waste-to-energy technologies and their socio-environmental impact: A review. J. Environ. Manag. 2021, 287, 112257. [Google Scholar] [CrossRef]
  3. Lewis, A.W.; Yuen, S.T.S.; Smith, A.J.R. Detection of gas leakage from landfills us-ing infrared thermography—applicability and limitations. Waste Manag. Res. 2003, 21, 436–447. [Google Scholar] [CrossRef] [PubMed]
  4. Jagaba, A.; Kutty, S.; Lawal, I.; Abubakar, S.; Hassan, I.; Zubairu, I.; Umaru, I.; Abdurrasheed, A.; Adam, A.; Ghaleb, A.; et al. Sequencing batch reactor technology for landfill leachate treatment: A state-of-the-art review. J. Environ. Manag. 2021, 282, 111946. [Google Scholar] [CrossRef]
  5. Krylova, N.I.; Khabiboulline, R.E.; Naumova, R.P.; Nagel, M.A. The influence of am-monium and methods for removal during the anaerobic treatment of poultry manure. J. Chem. Technol. Biotechnol. 1997, 70, 99–105. [Google Scholar] [CrossRef]
  6. Zhu, B.; Zhang, R.; Gikas, P.; Rapport, J.; Jenkins, B.; Li, X. Biogas production from municipal solid wastes using an integrated rotary drum and anaerobic-phased solids digester system. Bioresour. Technol. 2010, 101, 6374–6380. [Google Scholar] [CrossRef] [PubMed]
  7. Kalavrouziotis, I. K (Ed.). Wastewater and Biosolids Management; Iwa Publishing: London, UK, 2017; p. 16. [Google Scholar] [CrossRef]
  8. The, L.; In, N. California Integrated Waste Management Board 2007 Annual Report 2007 Annual Report Overview: California, USA. 2007; pp. 1–15. Available online: https://dpw.lacounty.gov/epd/tf/Attachments/Minutes_Attachments/Attachments_031507.pdf (accessed on 28 March 2024).
  9. Bernstein, L.; Bosch, P.; Canziani, O.; Chen, Z.; Christ, R.; Davidson, O.; Hare, W.; Huq, S.; Karoly, D.; Kattsov, V.; et al. Climate Change 2007: Summary for Policymakers. Hemisphere 2007, 335, 12–17. [Google Scholar] [CrossRef]
  10. Lebiocka, M.; Piotrowicz, A. Co-digestion of sewage sludge and organic fraction of mu-nicipal solid waste. A comparison between laboratory and technical scales. Environ. Prot. Eng. 2012, 38, 157–162. [Google Scholar] [CrossRef]
  11. Kushwaha, A.; Mishra, V.; Gupta, V.; Goswami, S.; Gupta, P.K.; Singh, L.K.; Gupt, C.B.; Rakshit, K.; Goswami, L. Anaerobic digestion as a sustainable biorefinery concept for waste to energy conversion. In Waste-to-Energy Approaches Towards Zero Waste; Elsevier: Amsterdam, The Netherlands, 2022; pp. 129–163. [Google Scholar]
  12. World Bank. What a waste: A global review of solid waste management: Waste Composition. In Urban Development Series Knowledge Paper; World Bank: Washington, DC, USA, 2012; pp. 16–21. [Google Scholar]
  13. Chen, X.; Pang, Y.; Zou, D.; Yuan, H.; Liu, Y.; Zhu, B.; Li, X. Optimizing Acidogenic Process for Achieving High Biomethane Yield from Anaerobic Co-Digestion of Food Waste and Rice Straw Using Response Surface Methodology. J. Biobased Mater. Bioenergy 2014, 8, 512–518. [Google Scholar] [CrossRef]
  14. Chufo, A.; Yuan, H.; Zou, D.; Pang, Y.; Li, X. Biomethane production and physicochemical characterization of anaerobically digested teff (Eragrostis tef) straw pretreated by sodium hydroxide. Bioresour. Technol. 2015, 181, 214–219. [Google Scholar] [CrossRef]
  15. Callaghan, F.; Wase, D.; Thayanithy, K.; Forster, C. Continuous co-digestion of cattle slurry with fruit and vegetable wastes and chicken manure. Biomass-Bioenergy 2002, 22, 71–77. [Google Scholar] [CrossRef]
  16. Li, Y.; Xu, H.; Yi, X.; Zhao, Y.; Jin, F.; Chen, L.; Hua, D. Study of two-phase anaerobic digestion of corn stover: Focusing on the conversion of volatile fatty acids and microbial characteris-tics in UASB reactor. Ind. Crops Prod. 2021, 160, 113097. [Google Scholar] [CrossRef]
  17. Kunatsa, T.; Xia, X. A review on anaerobic digestion with focus on the role of biomass co-digestion, modelling and optimisation on biogas production and enhancement. Bioresour. Technol. 2021, 344, 126311. [Google Scholar] [CrossRef] [PubMed]
  18. Stroot, P.G.; McMahon, K.D.; Mackie, R.I.; Raskin, L. Anaerobic codigestion of municipal solid waste and biosolids under various mixing conditions—I. digester performance. Water Res. 2001, 35, 1804–1816. [Google Scholar] [CrossRef] [PubMed]
  19. Sosnowski, P.; Wieczorek, A.; Ledakowicz, S. Anaerobic co-digestion of sewage sludge and organic fraction of municipal solid wastes. Adv. Environ. Res. 2003, 7, 609–616. [Google Scholar] [CrossRef]
  20. Mshandete, A.; Kivaisi, A.; Rubindamayugi, M.; Mattiasson, B. Anaerobic batch co-digestion of sisal pulp and fish wastes. Bioresour. Technol. 2004, 95, 19–24. [Google Scholar] [CrossRef]
  21. Hajji, A.; Rhachi, M. The influence of particle size on the performance of anaerobic digestion of municipal solid waste. Energy Procedia 2013, 36, 515–520. [Google Scholar] [CrossRef]
  22. Neves, L.; Oliveira, R.; Alves, M. Fate of LCFA in the co-digestion of cow manure, food waste and discontinuous addition of oil. Water Res. 2009, 43, 5142–5150. [Google Scholar] [CrossRef]
  23. Van Soest, P.J.; Robertson, J.B.; Lewis, B.A. Methods for Dietary Fiber, Neutral Detergent Fiber, and Nonstarch Polysaccharides in Relation to Animal Nutrition. J. Dairy Sci. 1991, 74, 3583–3597. [Google Scholar] [CrossRef]
  24. Lusk, P. Latest progress in anaerobic digestion. Biocycle 1999, 7, 40. [Google Scholar]
  25. Kuma, S.; Bharti, A.; Rich, R. Management of Organic Waste. Environ. Eng. 2012, 252, 83–90. [Google Scholar]
  26. Lopes, A.D.C.P.; Ebner, C.; Gerke, F.; Wehner, M.; Robra, S.; Hupfauf, S.; Bockreis, A. Residual municipal solid waste as co-substrate at wastewater treatment plants: An assessment of me-thane yield, dewatering potential and microbial diversity. Sci. Total Environ. 2022, 804, 149936. [Google Scholar] [CrossRef]
  27. Manzoni, S.; Jackson, R.B.; Trofymow, J.A.; Porporato, A. The global stoichiometry of litter nitrogen mineralization. Science 2008, 321, 684–686. [Google Scholar] [CrossRef] [PubMed]
  28. Liang, D.W.; Zhang, D.L.; Wang, M.X. Effects of the inoculum size, the volume of liq-uid medium and the size of flasks on the degradation of dibenzothiophene by Pseudomonas dela-fieldii. J. Environ. Sci. 2008, 20, 945–950. [Google Scholar]
  29. Wang, X.; Yang, G.; Feng, Y.; Ren, G.; Han, X. Optimizing feeding composition and carbon–nitrogen ratios for improved methane yield during anaerobic co-digestion of dairy, chicken manure and wheat straw. Bioresour. Technol. 2012, 120, 78–83. [Google Scholar] [CrossRef]
  30. Heo, N.H.; Park, S.C.; Kang, H. Effects of mixture ratio and hydraulic retention time on single-stage anaerobic co-digestion of food waste and waste activated sludge. J. Environ. Sci. Healthy Part A 2004, 39, 1739–1756. [Google Scholar] [CrossRef] [PubMed]
  31. Drake, H.L. Acetogenesis, Acetogenic Bacteria, and the Acetyl-CoA “Wood/Ljungdahl” Pathway: Past and Current Perspectives. In Acetogenesis. Chapman & Hall Microbiology Series; Drake, H.L., Ed.; Springer: Boston, MA, USA, 1994; pp. 3–60. [Google Scholar] [CrossRef]
  32. Al Afif, R.; Pfeifer, C. Enhancement of methane yield from cotton stalks by mechanical pre-treatment. Carbon Resour. Convers. 2021, 4, 164–168. [Google Scholar] [CrossRef]
  33. Oliva, A.; Papirio, S.; Esposito, G.; Lens, P.N. Pretreatment of lignocellulosic materials to enhance their methane potential. In Renewable Energy Technologies for Energy Efficient Sustainable Development; Springer: Cham, Switzerland, 2022; pp. 85–120. [Google Scholar]
  34. Li, Y.; Zhang, R.; Liu, X.; Chen, C.; Xiao, X.; Feng, L.; He, Y.; Liu, G. Evaluating Methane Production from Anaerobic Mono- and Co-digestion of Kitchen Waste, Corn Stover, and Chicken Manure. Energy Fuels 2013, 27, 2085–2091. [Google Scholar] [CrossRef]
  35. El-Mashad, H.M.; Zhang, R. Biogas production from co-digestion of dairy manure and food waste. Bioresour. Technol. 2010, 101, 4021–4028. [Google Scholar] [CrossRef] [PubMed]
  36. Haider, M.R.; Zeshan; Yousaf, S.; Malik, R.N.; Visvanathan, C. Effect of mixing ratio of food waste and rice husk co-digestion and substrate to inoculum ratio on biogas production. Bioresour. Technol. 2015, 190, 451–457. [Google Scholar] [CrossRef]
  37. Owamah, H.; Ikpeseni, S.; Alfa, M.; Oyebisi, S.; Gopikumar, S.; Samuel, O.D.; Ilabor, S. Influence of inoculum/substrate ratio on biogas yield and kinetics from the anaerobic co-digestion of food waste and maize husk. Environ. Nanotechnol. Monit. Manag. 2021, 16, 100558. [Google Scholar] [CrossRef]
  38. Raposo, F.; Fernández-Cegrí, V.; De la Rubia, M.; Borja, R.; Béline, F.; Cavinato, C.; Demirer, G.; Fernández, B.; Fernández-Polanco, M.; Frigon, J.; et al. Biochemical methane potential (BMP) of solid organic substrates: Evaluation of anaerobic biodegradability using data from an international interlaboratory study. J. Chem. Technol. Biotechnol. 2011, 86, 1088–1098. [Google Scholar] [CrossRef]
  39. López-Malo, A.; Alzamora, S.M.; Paris, M.J.; Lastra-Vargas, L.; Coronel, M.B.; Gómez, P.L.; Palou, E. Naturally occurring compounds–plant sources. In Antimicrobials in Food, 4th ed.; Davidson, P.M., Taylor, T.M., David, J.R.D., Eds.; CRC Press: Boca Raton, FL, USA, 2020; pp. 527–594. [Google Scholar] [CrossRef]
  40. Kafle, G.K.; Kim, S.H. Anaerobic treatment of apple waste with swine manure for biogas production: Batch and continuous operation. Appl. Energy 2013, 103, 61–72. [Google Scholar] [CrossRef]
  41. Gallert, C.; Henning, A.; Winter, J. Scale-up of anaerobic digestion of the biowaste fraction from domestic wastes. Water Res. 2003, 37, 1433–1441. [Google Scholar] [CrossRef] [PubMed]
  42. Nagao, N.; Tajima, N.; Kawai, M.; Niwa, C.; Kurosawa, N.; Matsuyama, T.; Yusoff, F.M.; Toda, T. Maximum organic loading rate for the single-stage wet anaerobic digestion of food waste. Bioresour. Technol. 2012, 118, 210–218. [Google Scholar] [CrossRef]
  43. Masih-Das, J.; Tao, W. Anaerobic co-digestion of food waste with liquid dairy manure or manure digestate: Co-substrate limitation and inhibition. J. Environ. Manag. 2018, 223, 917–924. [Google Scholar] [CrossRef]
  44. Brown, D.; Li, Y. Solid state anaerobic co-digestion of yard waste and food waste for biogas production. Bioresour. Technol. 2013, 127, 275–280. [Google Scholar] [CrossRef]
  45. Fierer, N.; Jackson, R.B. The diversity and biogeography of soil bacterial communities. Proc. Natl. Acad. Sci. USA 2006, 103, 626–631. [Google Scholar] [CrossRef]
  46. Allison, S.D. Cheaters, diffusion, and nutrients constrain decomposition by microbial en-zymes in spatially structured environments. Ecol. Lett. 2005, 8, 626–635. [Google Scholar] [CrossRef]
  47. Elbeshbishy, E.; Nakhla, G.; Hafez, H. Biochemical methane potential (BMP) of food waste and primary sludge: Influence of inoculum pre-incubation and inoculum source. Bioresour. Technol. 2012, 110, 18–25. [Google Scholar] [CrossRef]
  48. Sripitak, B. Biogas Production from Small Farm Cow Manure by High Solid Three-Stage Anaerobic Digester. Ph.D. Thesis, Prince of Songkla University, Songkhla, Thailand, 2022. [Google Scholar]
  49. Tanimu, M.I.; Ghazi TI, M.; Harun, R.M.; Idris, A. Effect of Carbon to Nitrogen Ratio of Food Waste on Biogas Methane Production in a Batch Mesophilic Anaerobic Digester. Int. J. Innov. Manag. Technol. 2014, 5, 116–119. [Google Scholar] [CrossRef]
  50. Meng, X.; Wang, Q.; Zhao, X.; Cai, Y.; Ma, X.; Fu, J.; Wang, P.; Liu, W.; Ren, L. A review of the technologies used for preserving anaerobic digestion inoculum. Renew. Sustain. Energy Re-Views 2023, 188, 113804. [Google Scholar] [CrossRef]
  51. Widyarani Victor, Y.; Sriwuryandari, L.; Priantoro, E.A.; Sembiring, T.; Sintawardani, N. Influence of pH on biogas production in a batch anaerobic process of tofu wastewater. In IOP Conference Series: Earth and Environmental Science; IOP Publishing: Bristol, UK, 2018; Volume 160, p. 012014. [Google Scholar]
  52. Cioabla, A.E.; Ionel, I.; Dumitrel, G.A.; Popescu, F. Comparative study on factors affecting anaerobic digestion of agricultural vegetal residues. Biotechnol. Biofuels 2012, 5, 1–9. [Google Scholar] [CrossRef] [PubMed]
  53. Fernández, B.; Porrier, P.; Chamy, R. Effect of inoculum-substrate ratio on the start-up of solid waste anaerobic digesters. Water Sci. Technol. 2001, 44, 103–108. [Google Scholar] [CrossRef] [PubMed]
  54. Wainaina, S.; Lukitawesa Kumar Awasthi, M.; Taherzadeh, M.J. Bioengineering of an-aerobic digestion for volatile fatty acids, hydrogen or methane production: A critical review. Bioen-Gineered 2019, 10, 437–458. [Google Scholar]
  55. Li, H.L.; Guo, X.L.; Cao, F.F.; Wang, Y. Process evolution of dry anaerobic co-digestion of cattle manure with kitchen waste. Chem. Biochem. Eng. Q. 2014, 28, 161–166. [Google Scholar]
  56. Forster-Carneiro, T.; Pérez, M.; Romero, L.I. Influence of total solid and inoculum contents on performance of anaerobic reactors treating food waste. Bioresour. Technol. 2008, 99, 6994–7002. [Google Scholar] [CrossRef]
  57. Harirchi, S.; Wainaina, S.; Sar, T.; Nojoumi, S.A.; Parchami, M.; Parchami, M.; Varjani, S.; Khanal, S.K.; Wong, J.; Awasthi, M.K.; et al. Microbiological insights into anaerobic digestion for biogas, hydrogen or volatile fatty acids (VFAs): A review. Bioengineered 2022, 13, 6521–6557. [Google Scholar] [CrossRef] [PubMed]
  58. Yenigün, O.; Demirel, B. Ammonia inhibition in anaerobic digestion: A review. Process. Biochem. 2013, 48, 901–911. [Google Scholar] [CrossRef]
  59. Guo, Y.; Xiao, F.; Yan, M.; Tang, S.; Duan, Z.; Sun, Y.; Li, Y. Effect of ammonia on an-aerobic digestion: Focusing on energy flow and electron transfer. Chem. Eng. J. 2023, 471, 144638. [Google Scholar] [CrossRef]
  60. Wei, L.; Zhao, W.; Feng, L.; Li, J.; Xia, X.; Yu, H.; Liu, Y. Anaerobic Digestion Process and Biogas Production. In Biogas Plants: Waste Management, Energy Production and Carbon Footprint Reduction; Wiley: New York, NY, USA, 2024; pp. 1–35. [Google Scholar]
  61. Galeano, M.B.; Sulonen, M.; Ul, Z.; Baeza, M.; Baeza, J.A.; Guisasola, A. Bioelectro-chemical ammonium recovery from wastewater: A review. Chem. Eng. J. 2023, 15, 144855. [Google Scholar] [CrossRef]
  62. Zhang, M.; Wang, X.; Yang, J.; Wang, D.; Liang, J.; Zhou, L. Nitrogen removal performance of high ammonium and high salt wastewater by adding carbon source from food waste fer-mentation with different acidogenic metabolic pathways. Chemosphere 2022, 292, 13351. [Google Scholar] [CrossRef] [PubMed]
  63. Alexis, P.-O.B.; Torres-Lozada, P., 2nd; Marmolejo-Rebellón Luis, F., 3rd; Or-donez, L.J.A. Effect of Substrate-Inoculum Ratio on the Biochemical Methane Potential of Municipal Biowastes. Ing. Investig. Y Tecnol. 2015, 16, 515–526. [Google Scholar]
  64. Rouches, E.; Escudié, R.; Latrille, E.; Carrère, H. Solid-state anaerobic digestion of wheat straw: Impact of S/I ratio and pilot-scale fungal pretreatment. Waste Manag. 2019, 85, 464–476. [Google Scholar] [CrossRef]
  65. Shen, J.; Zhu, J. Development of general Gompertz models and their simplified two-parameter forms based on specific microbial growth rate for microbial growth, bio-products and substrate consumption. Adv. Biotechnol. Microbiol. 2017, 4, 64–74. [Google Scholar]
Figure 1. The daily biogas production and methane contents.
Sustainability 16 03045 g001
Figure 2. The cumulative bio-methane (a) and biogas yield (b) for co-substrate mixtures at different C/N ratios.
Sustainability 16 03045 g002
Figure 3. The cumulative biogas (a) and bio-methane production (b) for co-substrate mixtures at different S/I ratios.
Sustainability 16 03045 g003
Figure 4. Total alkalinity.
Sustainability 16 03045 g004
Figure 5. Total ammonia.
Sustainability 16 03045 g005
Table 1. Characteristics of FW, MSW, and inoculum.
ParameterUnitFWMSWInoculum
Total solid (TS)%25.57 ± 0.896.31 ± 0.112.92 ± 1.2
Volatile solid (VS)%22.99 ± 0.588.97 ± 0.77.38 ± 1.0
C (Total)%53.56 ± 3.741.27 ± 0.127.21 ± 0.06
N (Total)%2.87 ± 0.30.1 ± 0.012.20 ± 0.07
H (Total)%7.45 ± 0.16.07 ± 0.34.10 ± 0.08
S (Total)%0.83 ± 0.50.01 ± 0.10.84 ± 0.02
C/N-18.7 ± 0.9412.7 ± 7.012.4 ± 0.06
Cellulose%15.01 ± 0.563.20 ± 12.510.15 ± 0.02
Hemi–Cellulose%20.12 ± 1.615.50 ± 14.712.50 ± 1.8
Lignin%2.01 ± 1.74.17 ± 0.3415.66 ± 0.7
Table 2. Composition of co-substrate mixtures used in experiment 1.
MixturesFood Waste (g)MSW (g)Mixtures RatioC/N Ratio
M140.31.822.39:120.9
M230.93.97.92:125.1
M3246.014.0:131.1
M420.56.92.97:135.2
M519.29.32.06:142.1
Table 3. Composition of different S/I ratios for experiment 2.
OLR
(gVS/L)
S/I
Ratio
Sludge Weight (g)Food Weight (g)MSW Weight
(g)
100.5257 ± 0.1922.55 ± 0.031.24 ± 0.03
101.0128 ± 0.1022.55 ± 0.031.24 ± 0.03
101.583 ± 0.0822.55 ± 0.031.24 ± 0.03
102.065 ± 0.7022.55 ± 0.031.24 ± 0.03
Table 4. The overall performance of the digestion process and stability.
ParametersUnitsM1M2M3M4M5
CBP b(mL)993093098020723463
SMY(L/Kg vs.)454.44432.81380.17343.02303.07
TS removed(%)8776797865
VS removed(%)8986848070
TMY a(mL)630616597587576
EMY b(L/Kg vs.)456422368354312
Alkalinity(g/L)5.6335.4234.6545.0234.965
Ammonia(g/L)1.250.920.921.020.67
COD(g/L)23.9227.0525.3135.3730.84
PH 7.37.17.57.27.2
Hemi-Cellulose(%)9.97.07.87.88.3
Cellulose(%)12.923.532.832.431.6
Lignin(%)1.65.47.512.417.4
LCH(%)26.637.145.453.857.7
CBP b = Cumulative biogas production; SMY = specific methane yield; TMY a = theoretical methane yield; EMY b = experimental methane yield, TS = Total solids; VS = volatile solids.
Table 5. Effect of four substrate-to-inoculum ratios on the digestion process and digester stability.
ParametersUnit0.51.01.52.0
SBY aL/kg VS656485289254
CMY bmL354326541234587
Biodegradability%67562620
TMY aL/kg VS634654643632
EMY cL/kg VS406320147118
Alkalinitymg/L4765441645335400
Ammonia-Nmg/L990 ± 0.08645 ± 0.04664 ± 0.021075 ± 0.10
CODmg/L14,540 ± 0.976680 ± 3.215995 ± 2.886678 ± 3.65
pH 7.47.47.47.3
a specific biogas yield; b cumulative methane production; c experimental methane yield.
Table 6. Kinetic parameters of methane yield estimated using a modified Gompertz model.
SubstrateBGP (mL g VS−1)Rm (mL g VS−1 d)λ (d)R2
M157455500.120.99
M252315450.230.99
M345475000.300.99
M442314900.300.99
M536583850.170.99
S/I(0.5)35432450.580.99
S/I(1.0)34321450.900.99
S/I(1.5)45231231.310.98
S/I(2.0)905552.480.99
BGP = Cumulative methane (mL), Rm = daily methane production (mL/day).
Disclaimer/Publisher’s Note: The statements, opinions and data contained in all publications are solely those of the individual author(s) and contributor(s) and not of MDPI and/or the editor(s). MDPI and/or the editor(s) disclaim responsibility for any injury to people or property resulting from any ideas, methods, instructions or products referred to in the content.

