Article

Phytoplankton Communities’ Response to Thermal Stratification and Changing Environmental Conditions in a Deep-Water Reservoir: Stochastic and Deterministic Processes

1
College of Water Resource and Environment Engineering, Nanyang Normal University, Nanyang 473061, China
2
Department of Hydrology and Water Resources Management, Kiel University, 240980 Kiel, Germany
3
Department of Botany and Plant Sciences, University of California, Riverside, CA 92521, USA
4
Landscape Protection and Ecological Restoration Research Center, China-Portugal Joint Laboratory of Cultural Heritage Conservation Science Supported by the Belt and Road Initiative, Gold Mantis School of Architecture, Soochow University, Suzhou 215123, China
5
Zhejiang Institute of Research and Innovation, University of Hong Kong, Lingan 311305, China
*
Authors to whom correspondence should be addressed.
Sustainability 2024, 16(7), 3058; https://doi.org/10.3390/su16073058
Submission received: 1 March 2024 / Revised: 2 April 2024 / Accepted: 3 April 2024 / Published: 6 April 2024

Abstract

:
Thermal stratification has become more extensive and prolonged because of global warming, and this change has had a significant impact on the distribution patterns of the phytoplankton communities. However, the response of phytoplankton community structures and assembly processes to thermal stratification is not fully understood. We predicted that the structure and assembly processes of phytoplankton communities would be affected by thermal stratification among water layers associated with environmental condition changes, reflecting certain patterns in temporal and spatial scales. Phytoplankton from Danjiangkou Reservoir were collected from October 2021 to July 2022 to verify this prediction. During the sampling period, Danjiangkou Reservoir remained thermally stratified with stability. The composition of the phytoplankton community in the surface layer significantly differed from that in both the thermocline and bottom layer. The phenomenon of thermal stratification affected the pattern of nitrogen and phosphorus distribution and, thus, the processes of the phytoplankton community structures. Deterministic processes had a greater influence on the assembly of the phytoplankton communities in the surface and bottom layers. In contrast, stochastic processes were more prevalent in the assembly of the thermocline phytoplankton community. The phytoplankton community within the thermocline layer exhibited a broader niche range than that in the surface and bottom layers, showing notable dissimilarity from that of the bottom layer. Canonical correspondence analysis (CCA) revealed that the vertical distributions of the phytoplankton communities were significantly correlated with NH4+-N, pH, and water temperature (WT). In summary, this study explained the distribution patterns of phytoplankton community structures and assembly processes in deep-water reservoirs during the stratification period. Additionally, the study explored the potential of using the distribution patterns of phytoplankton in stratified-state deep-water reservoirs under a subtropical–warm temperate climate as climate indicators in the context of global warming.

1. Introduction

Phytoplankton, as the key primary producer in freshwater ecosystems, play a vital role in the circulation of matter and nutrients and in energy transfer [1] and serve as an important ecological indicator. Different environmental conditions can cause phytoplankton community changes in lakes or reservoirs [2]. Their abundance and composition change with changes in nutrients, temperature, and light, and they are often used as indicator organisms to monitor water quality [3]. Different thermal stratification conditions will cause changes in the distribution patterns of phytoplankton community structures in water bodies, thus changing the water environment, which has important impacts on the structure and function of aquatic ecosystems [4]. Therefore, the study of the distribution characteristics of phytoplankton communities in different water layers will be helpful for gaining a comprehensive understanding of water environments and for making decisions for sustainable water environment development [5,6].
Environmental factors are often important drivers of phytoplankton community composition. Solar radiation absorbed by the upper layer of water bodies can result in temperature differences between the upper and lower layers. Warmer water is less dense than colder water. Thus, vertical profiles form based on the water temperature structure from the top to the bottom layer [7]. During the thermal stratification period, the temperatures of different water layers differ greatly. This causes the formation of a sudden change layer, known as a thermocline. Water temperature and density rapidly change within the thermocline, making it an essential interface between the phytoplankton and their aquatic environment. Greater hydrostatic stability in the thermocline could inhibit the mixing and exchange of substances between different layers of the water column and cause the vertical distribution of environmental differences [8,9]. Thermal stratification can directly or indirectly affect the phytoplankton community structures in different water layers. For example, an increase in solar irradiance exceeded the influence of wind and tidal mixing, leading to thermal stratification in the Marr Bank region in the northwestern North Sea. Consequently, phytoplankton were trapped in the nutrient-rich surface layer and received enough light to grow rapidly, resulting in spring algal blooms [10]. During the stratified mixing period of the northern Red Sea in winter, nutrients were transported from deep to the surface of sea, leading to phytoplankton blooms; a direct correlation existed between the bloom period and the intensity of the thermal stratification of the water column [11]. Some thermal stratification patterns in the Three Gorges Reservoir caused water exchange and algal transportation, which, in turn, may have caused algae blooming to occur in tributaries [12]. At the same time, phytoplankton community assembly processes were also affected by thermal stratification, with the importance of stochastic processes decreasing with water depth during periods of relative thermocline stability and with no clear regulation of stochastic processes in the vertical direction during periods of weaker thermocline intensity [13].
Based on existing studies, climate warming and short-term temperature extremes lead to increased thermal stratification in warmer seasons. This stratification, in turn, promotes the proliferation of small species and regulates their buoyancy, leading to an increased bloom risk. This study examines the impact of thermal stratification on the assembly of phytoplankton communities. The goal is to provide basic data for the sustainable development of aquatic ecology and to inform decision making for the management of aquatic ecosystems. We tested the hypothesis that thermal stratification would have long-term effects on phytoplankton community assembly and that the distribution pattern of phytoplankton serves as a precursor of the effects of temperature extremes in Danjiangkou Reservoir. We predicted that phytoplankton community structures would be affected by thermal stratification among water layers associating with environmental condition changes. Secondly, we predicted that the phytoplankton community assembly processes and ranges of niche breadth, which is the sum of the various resources utilized by a species, among the different water layers of Danjiangkou Reservoir would be affected by thermal stratification conditions, reflecting certain patterns in temporal and spatial scales. To this end, we investigated the structure of phytoplankton communities collected from three different water layers at five ecological sites in Danjiangkou Reservoir over four seasons from 2021 to 2022. The results of this study provide a scientific basis for supporting policy decision making and sustainable ecosystem management to ensure the quality and safety of the water of the South-to-North Water Diversion scheme’s operation to respond to the challenge of global warming.

2. Materials and Methods

2.1. Study Area

Danjiangkou Reservoir is in the central region of China, with a water area of 9.5 × 10⁴ km2 and a total reservoir capacity of about 174.5 × 10⁸ m3, serving as a vital resource for water supply, flood control, power generation, and irrigation. It is a deep-water reservoir in a subtropical–warm temperate climate transition zone and is characterized by seasonal stratification [14,15,16].

2.2. Sample Collection and Determination

According to the morphology of the reservoir studied, five sampling points were set up: S1—the upstream inlet; S2—the dock bay; S3—the diversion area of the South-to-North Water Diversion Project; S4—the junction of Henan and Hubei provinces; and S5—the center of the reservoir. Three sampling depths were set up at each sampling point: the surface layer (0.5 m below the water surface; in this study, the thermocline is defined as the layer where water temperature decreases with depth at the maximum rate of decrease, or temperature gradient), the true light layer (with a transparency of 2.7 times) [17], and the bottom layer (0.5 m from the bottom sediment). Samples were collected during 2021–2022 in autumn (October), winter (March), spring (May), and summer (July) (Figure 1) (Supplementary Table S1).
Environmental vertical water column data were measured using a portable multi-parameter water quality meter (Hach, Loveland, CO, USA). Water samples of different water layers were collected using a Plexiglas water sampler on sunny AM and stored in dark conditions at 4 °C for further indicator determination. The methods used for the testing of water quality were based on established standards [18].

2.3. Data Processing

2.3.1. Relative Water Column Stability (RWCS) Calculation

As a dimensionless parameter used to reflect the strength and hydrodynamic force of thermal stratification, RWCS is calculated as follows [19,20]:
R W C S / H = ( D s D h ) / ( D 4 D 5 ) H
where RWCS/H is the thermal stratification stability index (m−1); Dh is the density of the surface layer (kg/m3); DS is the density of the bottom layer (kg/m3); D4 is the density of the water at 4 °C (kg/m3); D5 is the density of the water at 5 °C (kg/m3); and H is the depth of the water (m). The lower the RWCS/H value, the lower the thermal stratification stability.
Due to the low turbidity of Danjiangkou Reservoir, the water density was derived from the water temperature using the following formula [20]:
ρ T = [ 1 ( T + 288.9414 ) · ( T 3.9863 ) 2 508,929.2 × ( T + 68.12936 ) ] × 1000
where ρT is the density of the water (kg/m3), and T is the temperature of the water (°C).

2.3.2. Densities of Phytoplankton

A 1 L quantitative sample of phytoplankton was collected by using a plexiglass water collector in the different water layers [21]. Then, 30 mL acid Lugol’s 10% solution was added to the phytoplankton samples for fixation. Subsequently, a siphon was used to remove the sample supernatant, retaining 50 mL of concentrated samples.
During counting, the concentrated solution was shaken, and 0.1 mL sample was immediately taken into the counting box for whole slide counting. The identification of phytoplankton, species names, genus names, and discoverers was carried out according to available references. At least 2 slides per sample were counted, and the average value was taken as the result. According to the concentration ratio of cells, the number of cells in each liter of water sample (cells/L) was calculated as the phytoplankton density [22].
The phytoplankton density was calculated using the following formula:
N = C s F s × P n F n × V V 0
where N is the number of plankton in 1 L of water (cells/L), Cs is the Calculate box area (mm2), Fs is the field of view area (mm2), Fn is the number of fields per slice that was counted, V is 1 L of concentrated water (mL), V0 is the counting box volume, and Pn is the number of phytoplankton counted.

2.3.3. Dominant Species and Niche Breadth of Phytoplankton

The McNaughton dominance index can represent the dominance of phytoplankton; it can be expressed as follows [23]:
y = ( n i / N )   f i
where fi denotes the frequency of occurrence of the ith species at each sample point, ni denotes the total number of individuals of the ith species, and N denotes the number of all species. A species is defined as dominant when y ≥ 0.02.
Niche breadth is the sum of the various resources utilized by a species, and the size of its value can reflect the ecological adaptability of a species. The larger the value, the wider the range of a species, the stronger the ability to utilize various resources, and the stronger the ability of interspecific competition [24]. The niche breadth can be used to explore the relative effects of stochastic and deterministic processes on phytoplankton communities:
B j = 1 i = 1 N P i j 2
where Bj is the niche breadth, Pij is the proportion of phytoplankton j in sampling point i, and N is the total number of sampling points [25,26].

2.3.4. Phytoplankton Community Assembly

Phytoplankton community assembly statistical analyses were performed in R (version 4.0.2) (University of Auckland, New Zealand) using the NST package. Deterministic processes are derived from ecological niche-based theories, which assume that community structure is controlled by factors such as species characteristics, species interactions, and environmental conditions [27,28,29]. Stochastic processes are derived from neutral-based theories, which assume that community structure is controlled by factors such as dispersal, the random formation and extinction of species, and ecological drift [30]. The normalized stochasticity ratio (NST) was used to clarify the relative importance of deterministic and stochastic processes in the assembly of phytoplankton communities. The value of the NST ranges from 0 to 1, but in the actual application processes, there may be cases where the value is more than 1, so the modified stochasticity ratio (MST) method is used to solve this problem, and if the value of MST is less than 0.5, it indicates that the deterministic processes dominate; if the value of MST is more than 0.5, it indicates that the stochastic processes dominate [31].

2.4. Data Analysis and Statistics

Statistical analyses were performed in R (version 4.0.2) (University of Auckland, New Zealand) using the vegan package, ggplot2 package, and pheatmap package. The Shannon–Wiener diversity index, Margalef richness index, and Pielou evenness were used to represent the alpha diversity of the phytoplankton communities. The correlation between temperature and thermal stratification was analyzed by linear regression [32]. Principal component analysis (PCA) was used to analyze the stratified distribution characteristics and seasonal distribution characteristics based on environmental factors [33]. Non-metric multidimensional scaling (NMDS) analysis of phytoplankton community abundance was performed based on Bray–Curtis index dissimilarity and used to represent beta diversity. The Bray–Curtis NMDS model is a nonlinear approach that better represents the nonlinear structure of ecological data [34]. It utilizes points in a multidimensional space to represent species information and the distance between points to reflect the degree of difference between samples [35]. This allows for the visualization of the sequential relationship between samples and the identification of gradient information on sources of variation in the index sample, such as environmental or ecological factors. A permutational multivariate analysis of variance (PERMANOVA) was performed to evaluate the spatial and temporal patterns of phytoplankton distribution [36]. Phytoplankton community abundance was subjected to canonical correspondence analysis (CCA) with environmental factors [37], the Mantel test was applied to examine the correlation between species abundance and physicochemical factors [38], and Spearman correlation analysis was performed to determine the relationship between the abundance of dominant phytoplankton species and physiochemical factors in different water layers [39].

3. Results

3.1. Characterization of Water Temperature Stratification and Environmental Factors

3.1.1. Vertical Variation in Water Temperature and the Genesis of Thermal Stratification

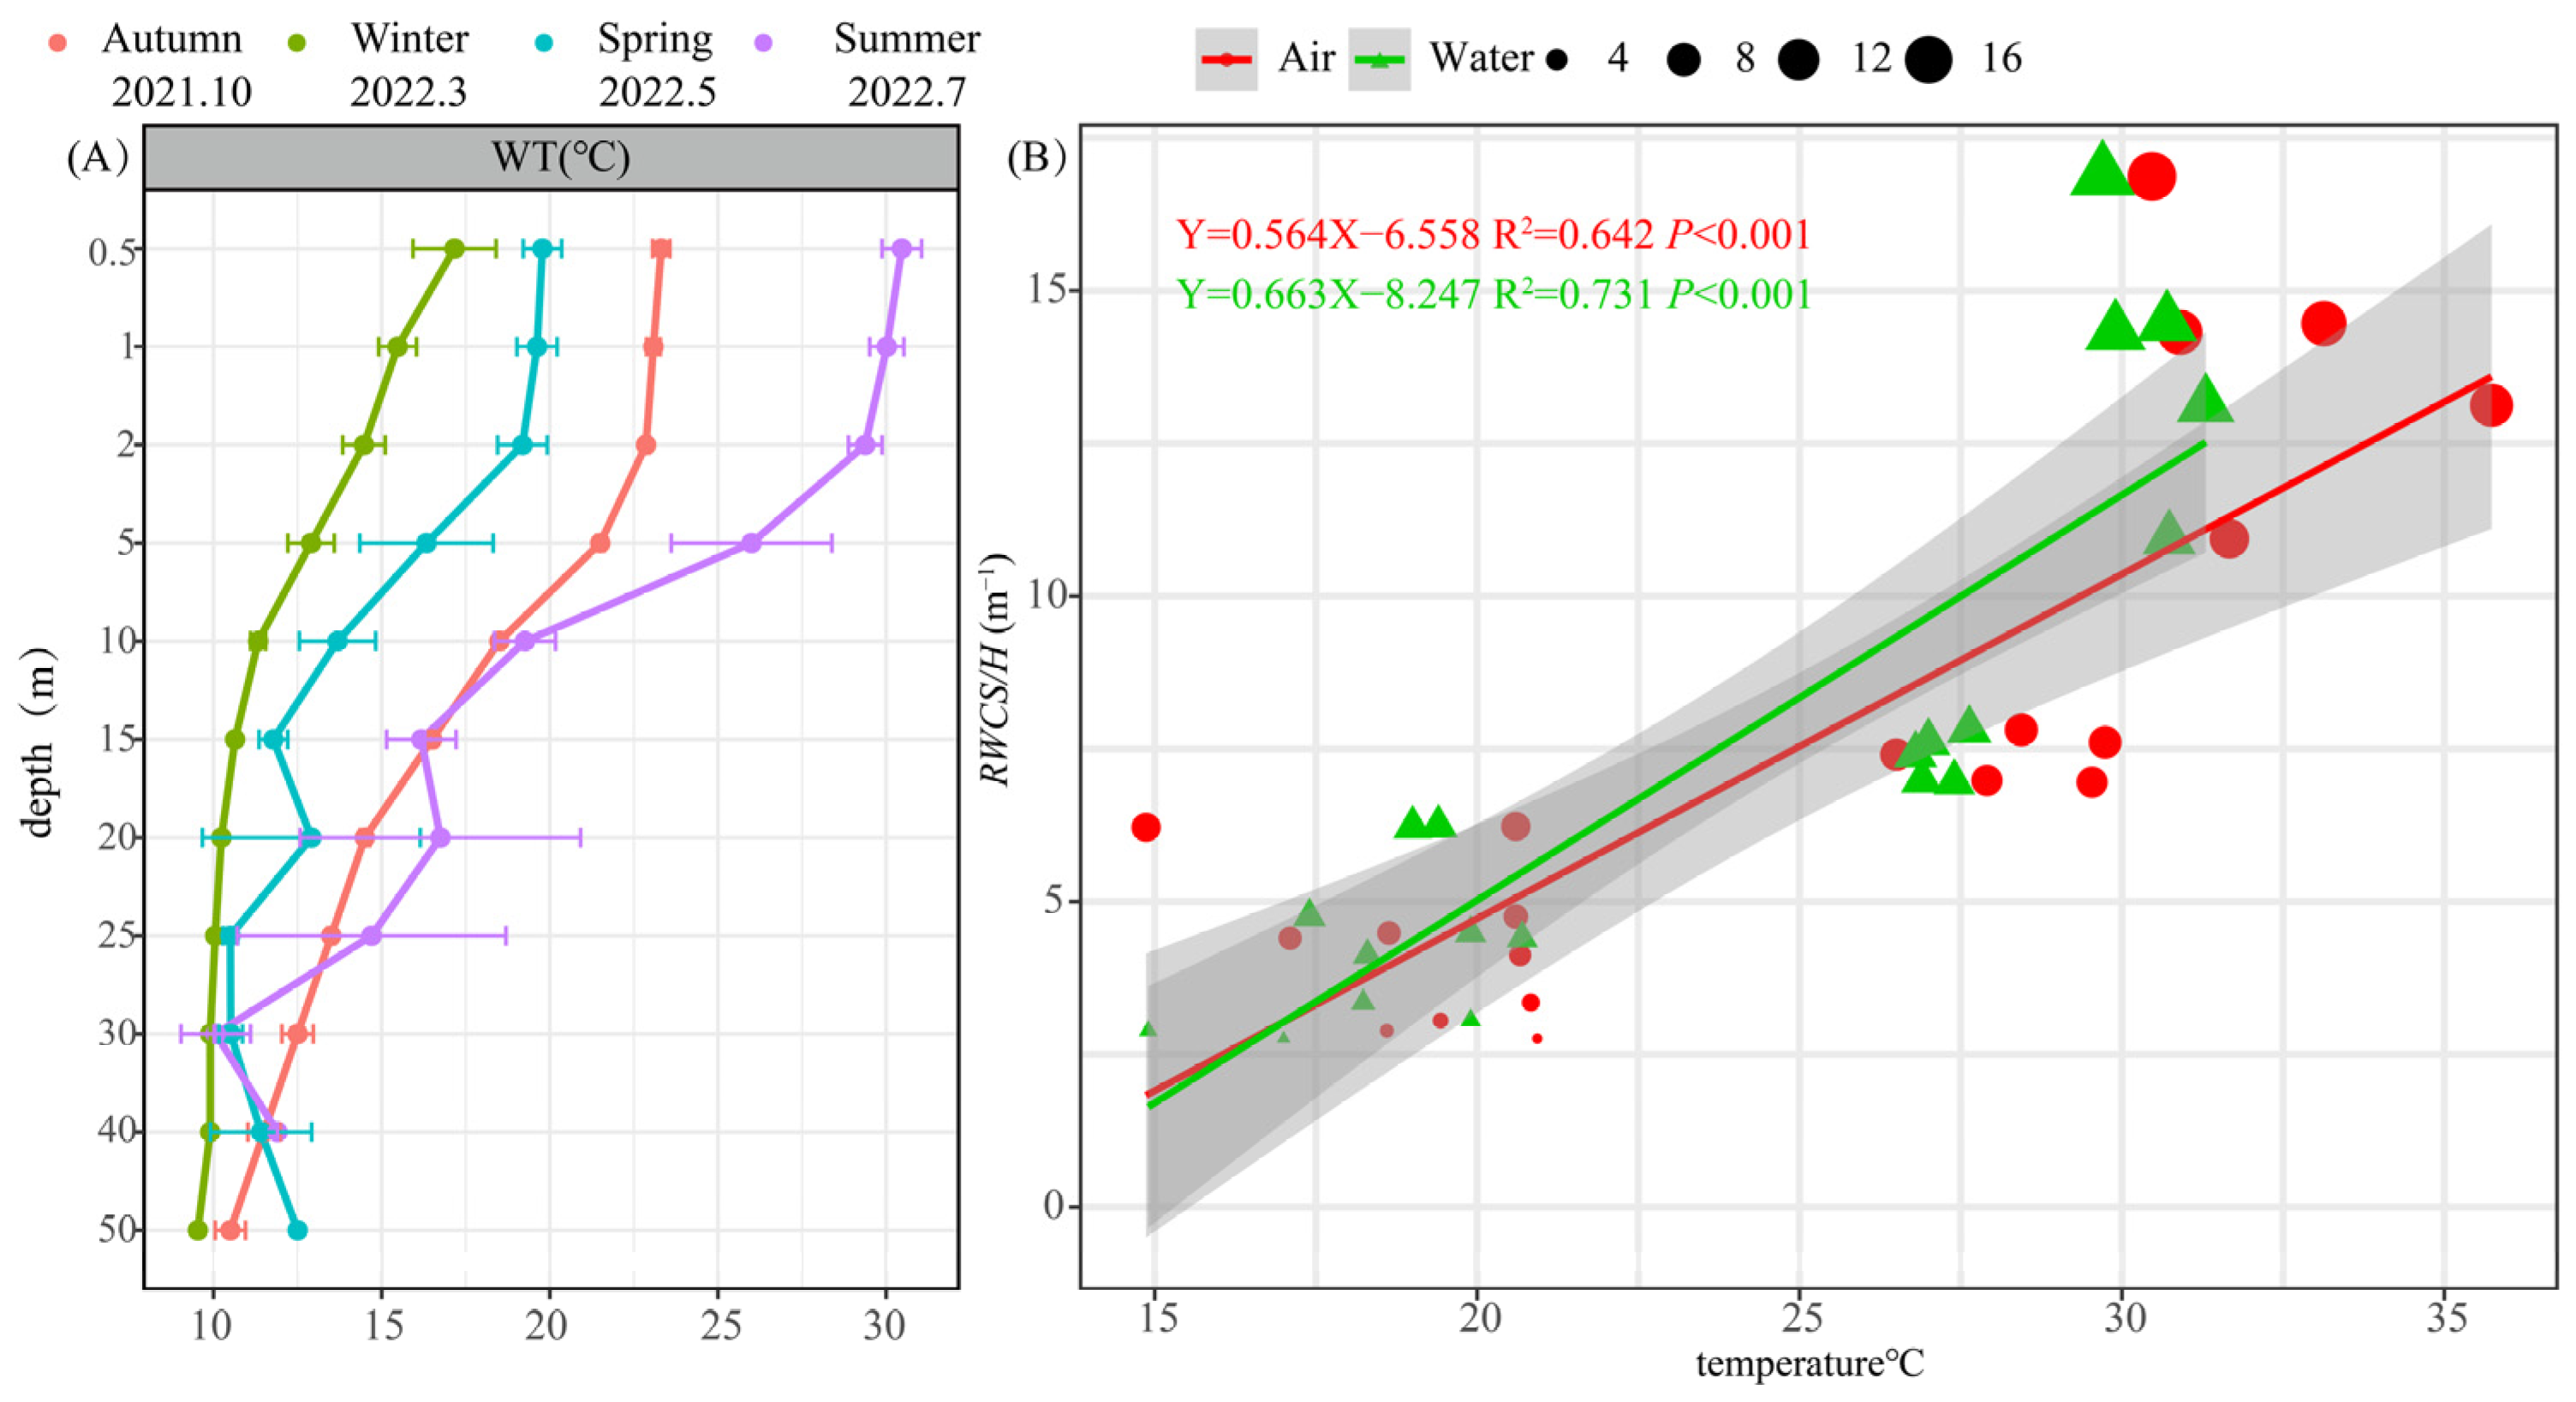
The water temperature (WT) during the study period ranged from 9.5 to 31.3 °C, with an average value of 18.2 °C. There was a clear thermal stratification phenomenon (Figure 2A), and the thermocline was distributed between 2 and 15 m. The average thickness of the thermocline was about 10 m. The RWCS/H value was adopted to reflect the thermal stratification stability level of the water. The results showed that the RWCS/H was greater than 2 m−1, indicating that the water was in a period of stable stratification [40]. The average value of RWCS/H was in summer (13.94), followed by those in autumn (7.35) and spring (4.87), with the minimum value occurring in winter (3.57). Correlation analysis revealed that RWCS/H was significantly positively correlated with reservoir air temperature (R2 = 0.642, p < 0.001) and surface layer water temperature (R2 = 0.731, p < 0.001) (Figure 2B), indicating that air temperature-induced changes in surface layer water temperature influence the stability of thermal stratification.

3.1.2. Changes in Environmental Characteristics during Thermal Stratification Periods

The monitoring results of physicochemical factors in the water showed that both the N and P concentrations during the stabilized thermal stratification were in the following order: bottom layer > thermocline > surface layer (Table 1). The results of the PCA sorting of environment factors in Table 1 showed that there were distinct aggregation phenomena and marked differences among the sampling points in the same season, and there were also differences in aggregation among the sampling points at different depths (Supplementary Figure S1). The temporal variability of environmental factors was greater than the spatial variability, and the seasonal variation in environmental factors was more apparent. Spatially, the aggregation of physicochemical factors in the bottom layer was evident, with small seasonal differences. Additionally, the physicochemical factors of the thermocline and the bottom layer were relatively similar, whereas differences in physicochemical factors were recorded between the surface layer and thermocline and between the surface layer and bottom layer. Temporally, environmental factors exhibited greater similarity in autumn and winter and less similarity in spring and summer.

3.2. Characteristics of Phytoplankton Community Structures during Thermal Stratification

3.2.1. Phytoplankton Species Composition

From October 2021 to July 2022, a total of 62 genera and 95 species of phytoplankton from 8 phyla (including variants) were identified in Danjiangkou Reservoir. Among them, there were 18 genera and 32 species of Chlorophyta (33.68%), 20 genera and 30 species of Bacillariophyta (31.58%), 12 genera and 16 species of Cyanobacteria (16.84%), 4 genera and 6 species of Euglenophyta (6.31%), 4 genera and 5 species of Dinophyta (5.26%), 2 genera and 4 species of Cryptophyta (4.24%), and 2 genera and 2 species of Ochrophyta (2.11%). A total of 39 genera and 58 species of phytoplankton in 7 phyla were identified in the surface layer, with the highest number of species in the phylum Chlorophyta, totaling 21 species (36%); a total of 51 genera and 65 species of phytoplankton in 7 phyla were identified in the thermocline, with the highest number of species in the phylum Bacillariophyta, totaling 18 species (34%); and a total of 49 genera and 70 species of phytoplankton in 7 phyla were identified in the bottom layer, with the highest number of species in the phylum Bacillariophyta, totaling 27 species (39%).
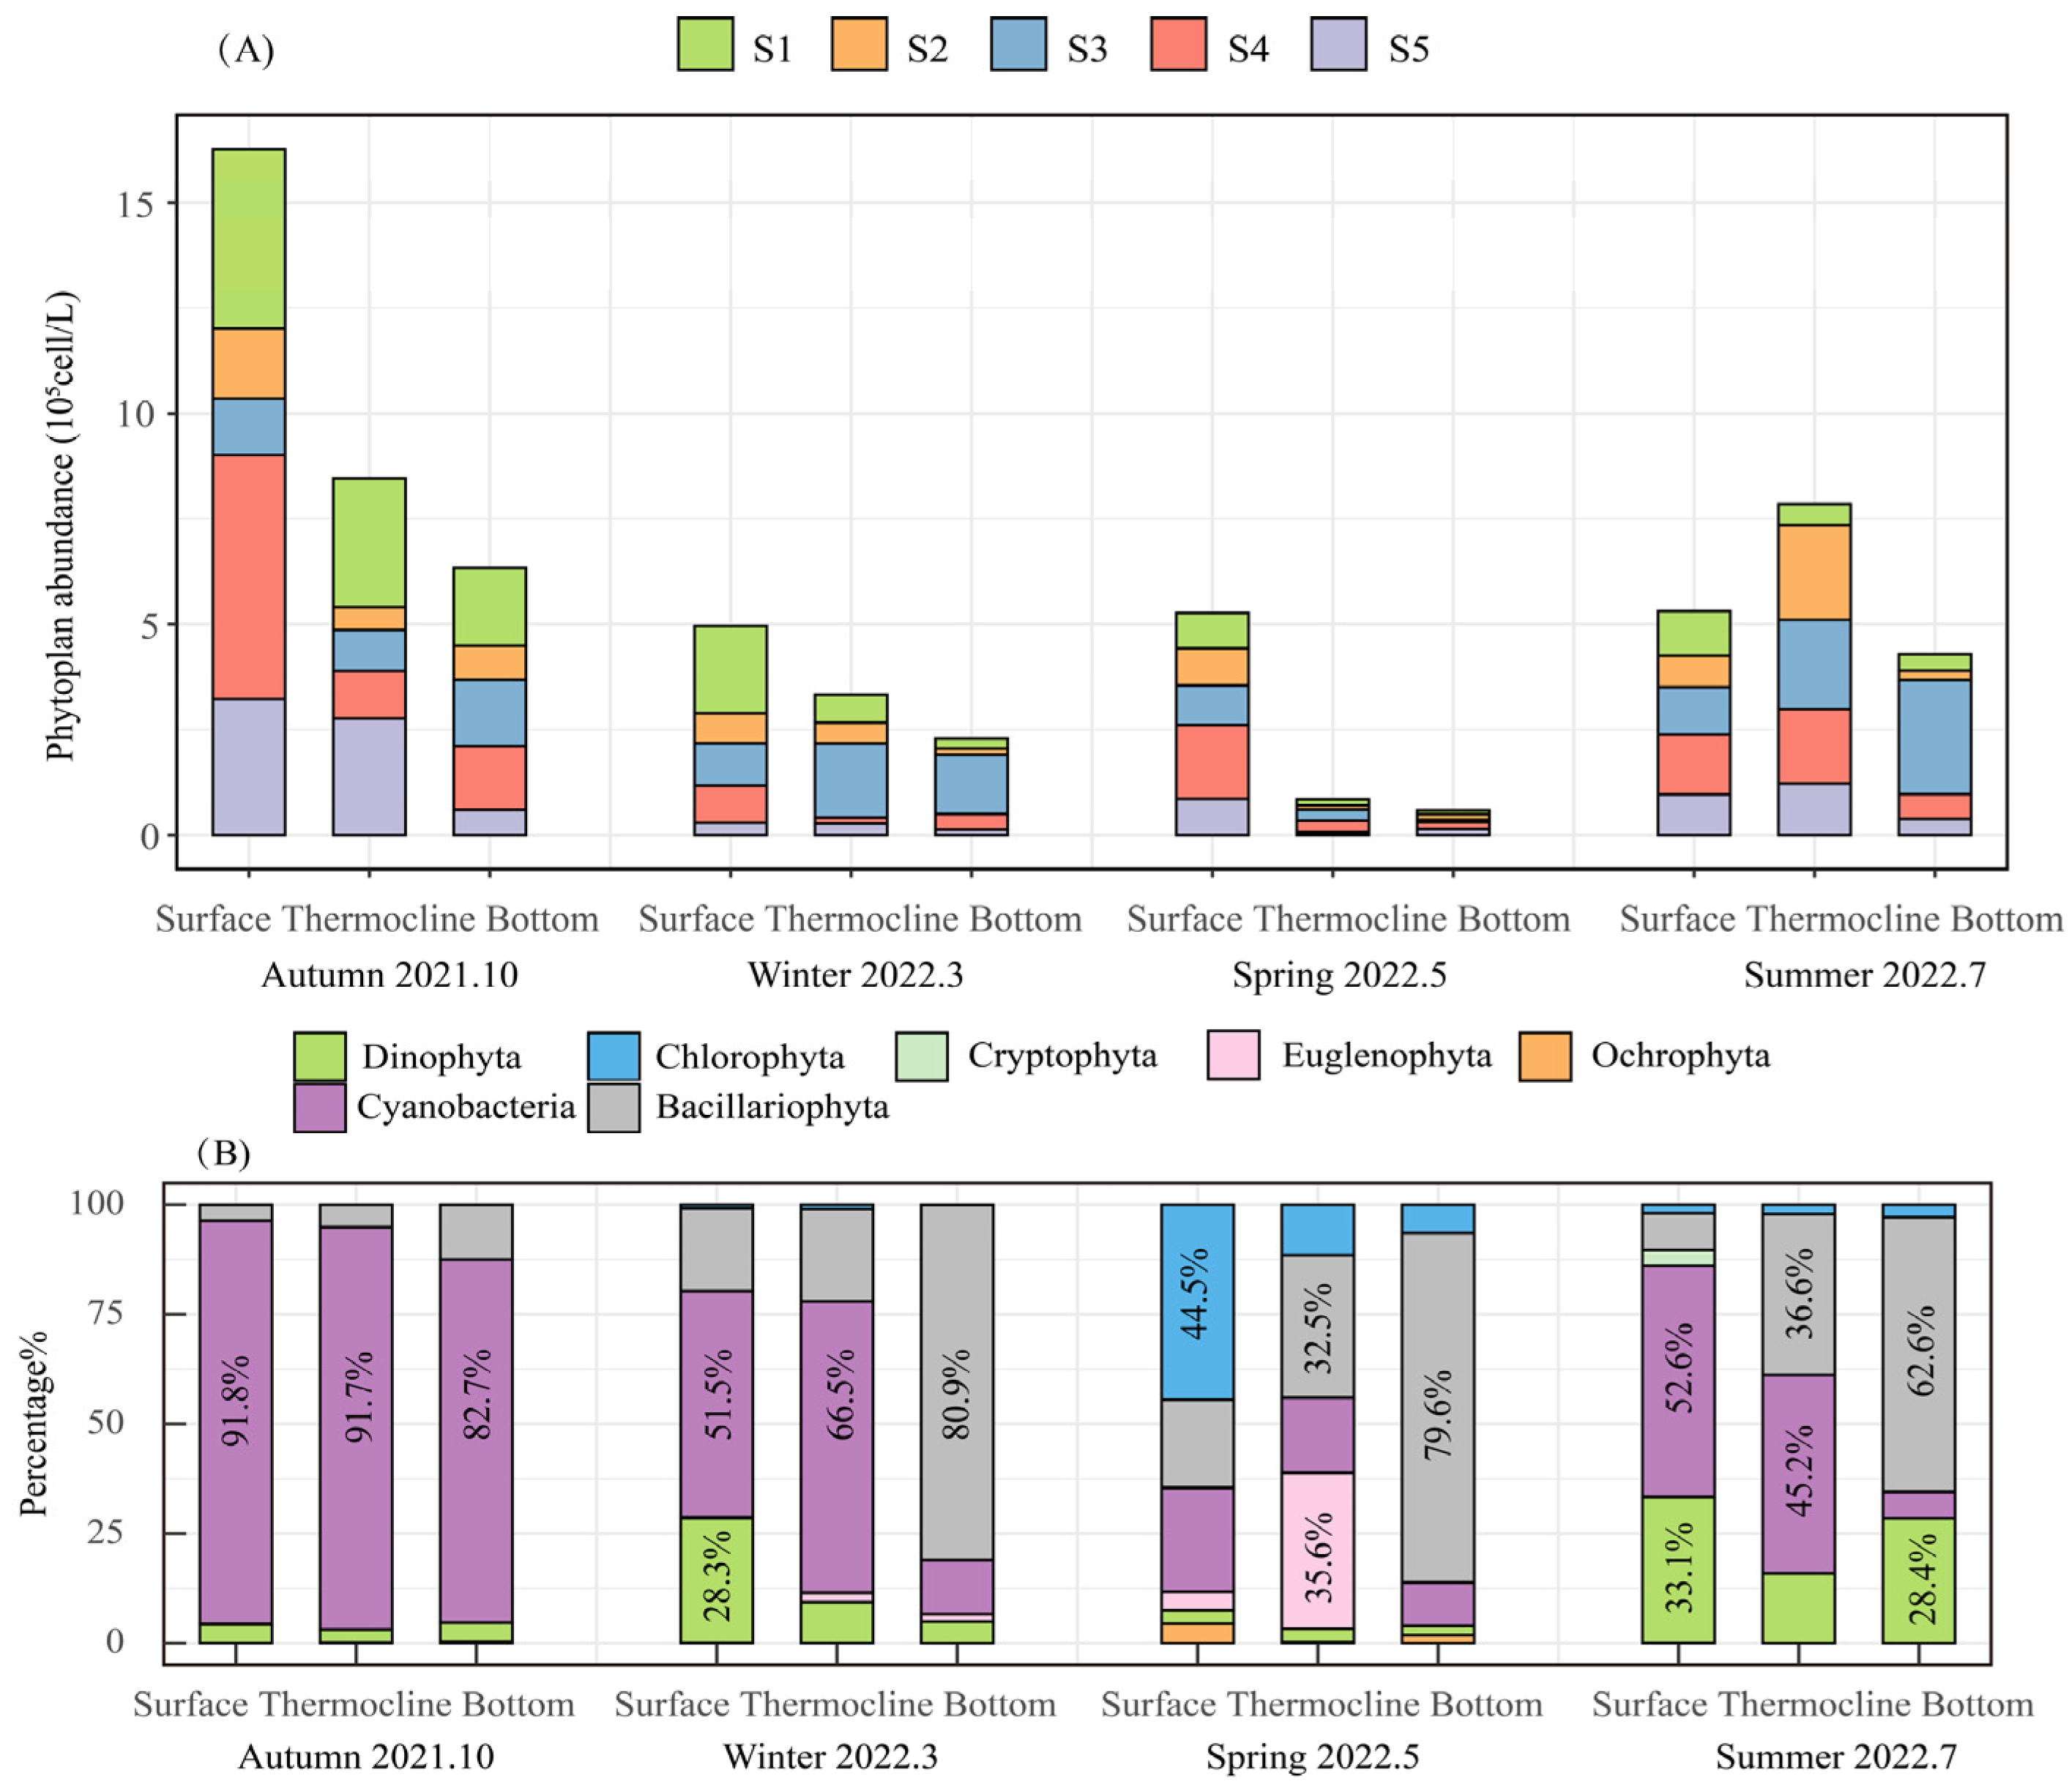
The average densities of phytoplankton in the surface layer, thermocline, and bottom layer were 7.95 × 10⁵ cells/L, 4.99 × 10⁵ cells/L, and 3.11 × 10⁵ cells/L, respectively. Except in summer, the vertical order of phytoplankton density was as follows: surface layer > thermocline > bottom layer. The maximum value of phytoplankton density among sampling points was 3.22 × 10⁵ cells/L in the surface layer of sampling point S4 in autumn, but the minimum value was 0.06 × 10⁵ cells/L in the bottom layer of sampling point S5 in spring. The difference in phytoplankton density between the thermocline and the bottom layer of sample sites was relatively small (Figure 3A). The main phytoplankton groups in the surface layer and thermocline were dominated by Cyanobacteria, except in spring. In spring, Chlorophyta were the main group of phytoplankton in the surface layer, and Euglenophyta were the main group of thermocline phytoplankton. The main phytoplankton groups at the bottom layer were dominated by Bacillariophyta except in autumn. In autumn, the main group of phytoplankton in the bottom surface layer is dominated by Cyanobacteria. In contrast to the study on the vertical distribution of phytoplankton communities, this research found that Dinophyta, which make up 33% of phytoplankton abundance in the bottom layer, were present in the summer substratum, where stratification is most prominent.

3.2.2. Dominant Phytoplankton Species Composition

The number of dominant phytoplankton species in Danjiangkou Reservoir and the degree of dominance varied with different depths. A total of 7 phyla and 33 dominant species were counted during the study period (Supplementary Table S2), among which 11 dominant species belonged to Chlorophyta, 10 dominant species belonged to Bacillariophyta, 5 dominant species belonged to Cyanobacteria, 2 dominant species each belonged to Dinophyta and Cryptophyte, and 1 dominant species each belonged to Euglenophyta and Ochrophyta. The Bacillariophyta was the most dominant species in different water layers, and the dominance degree of Cyclotella sp. and Fragilaria sp. showed a gradual upward trend with decreasing depth. The number of dominant species decreased with decreasing sampling depth; 25 dominant species were counted in the surface layer, and Peridinium sp. had the highest degree of dominance in the surface layer (0.491); 22 dominant species were counted in the thermocline, and C. meneghiniana had the highest degree of dominance in the thermocline (0.778); 19 dominant species were counted in the bottom layer, and Cyclotella sp. had the highest degree of dominance in the bottom layer (0.980) and was the dominant species with the highest degree of dominance.

3.2.3. Changes in Phytoplankton Alpha Diversity Index

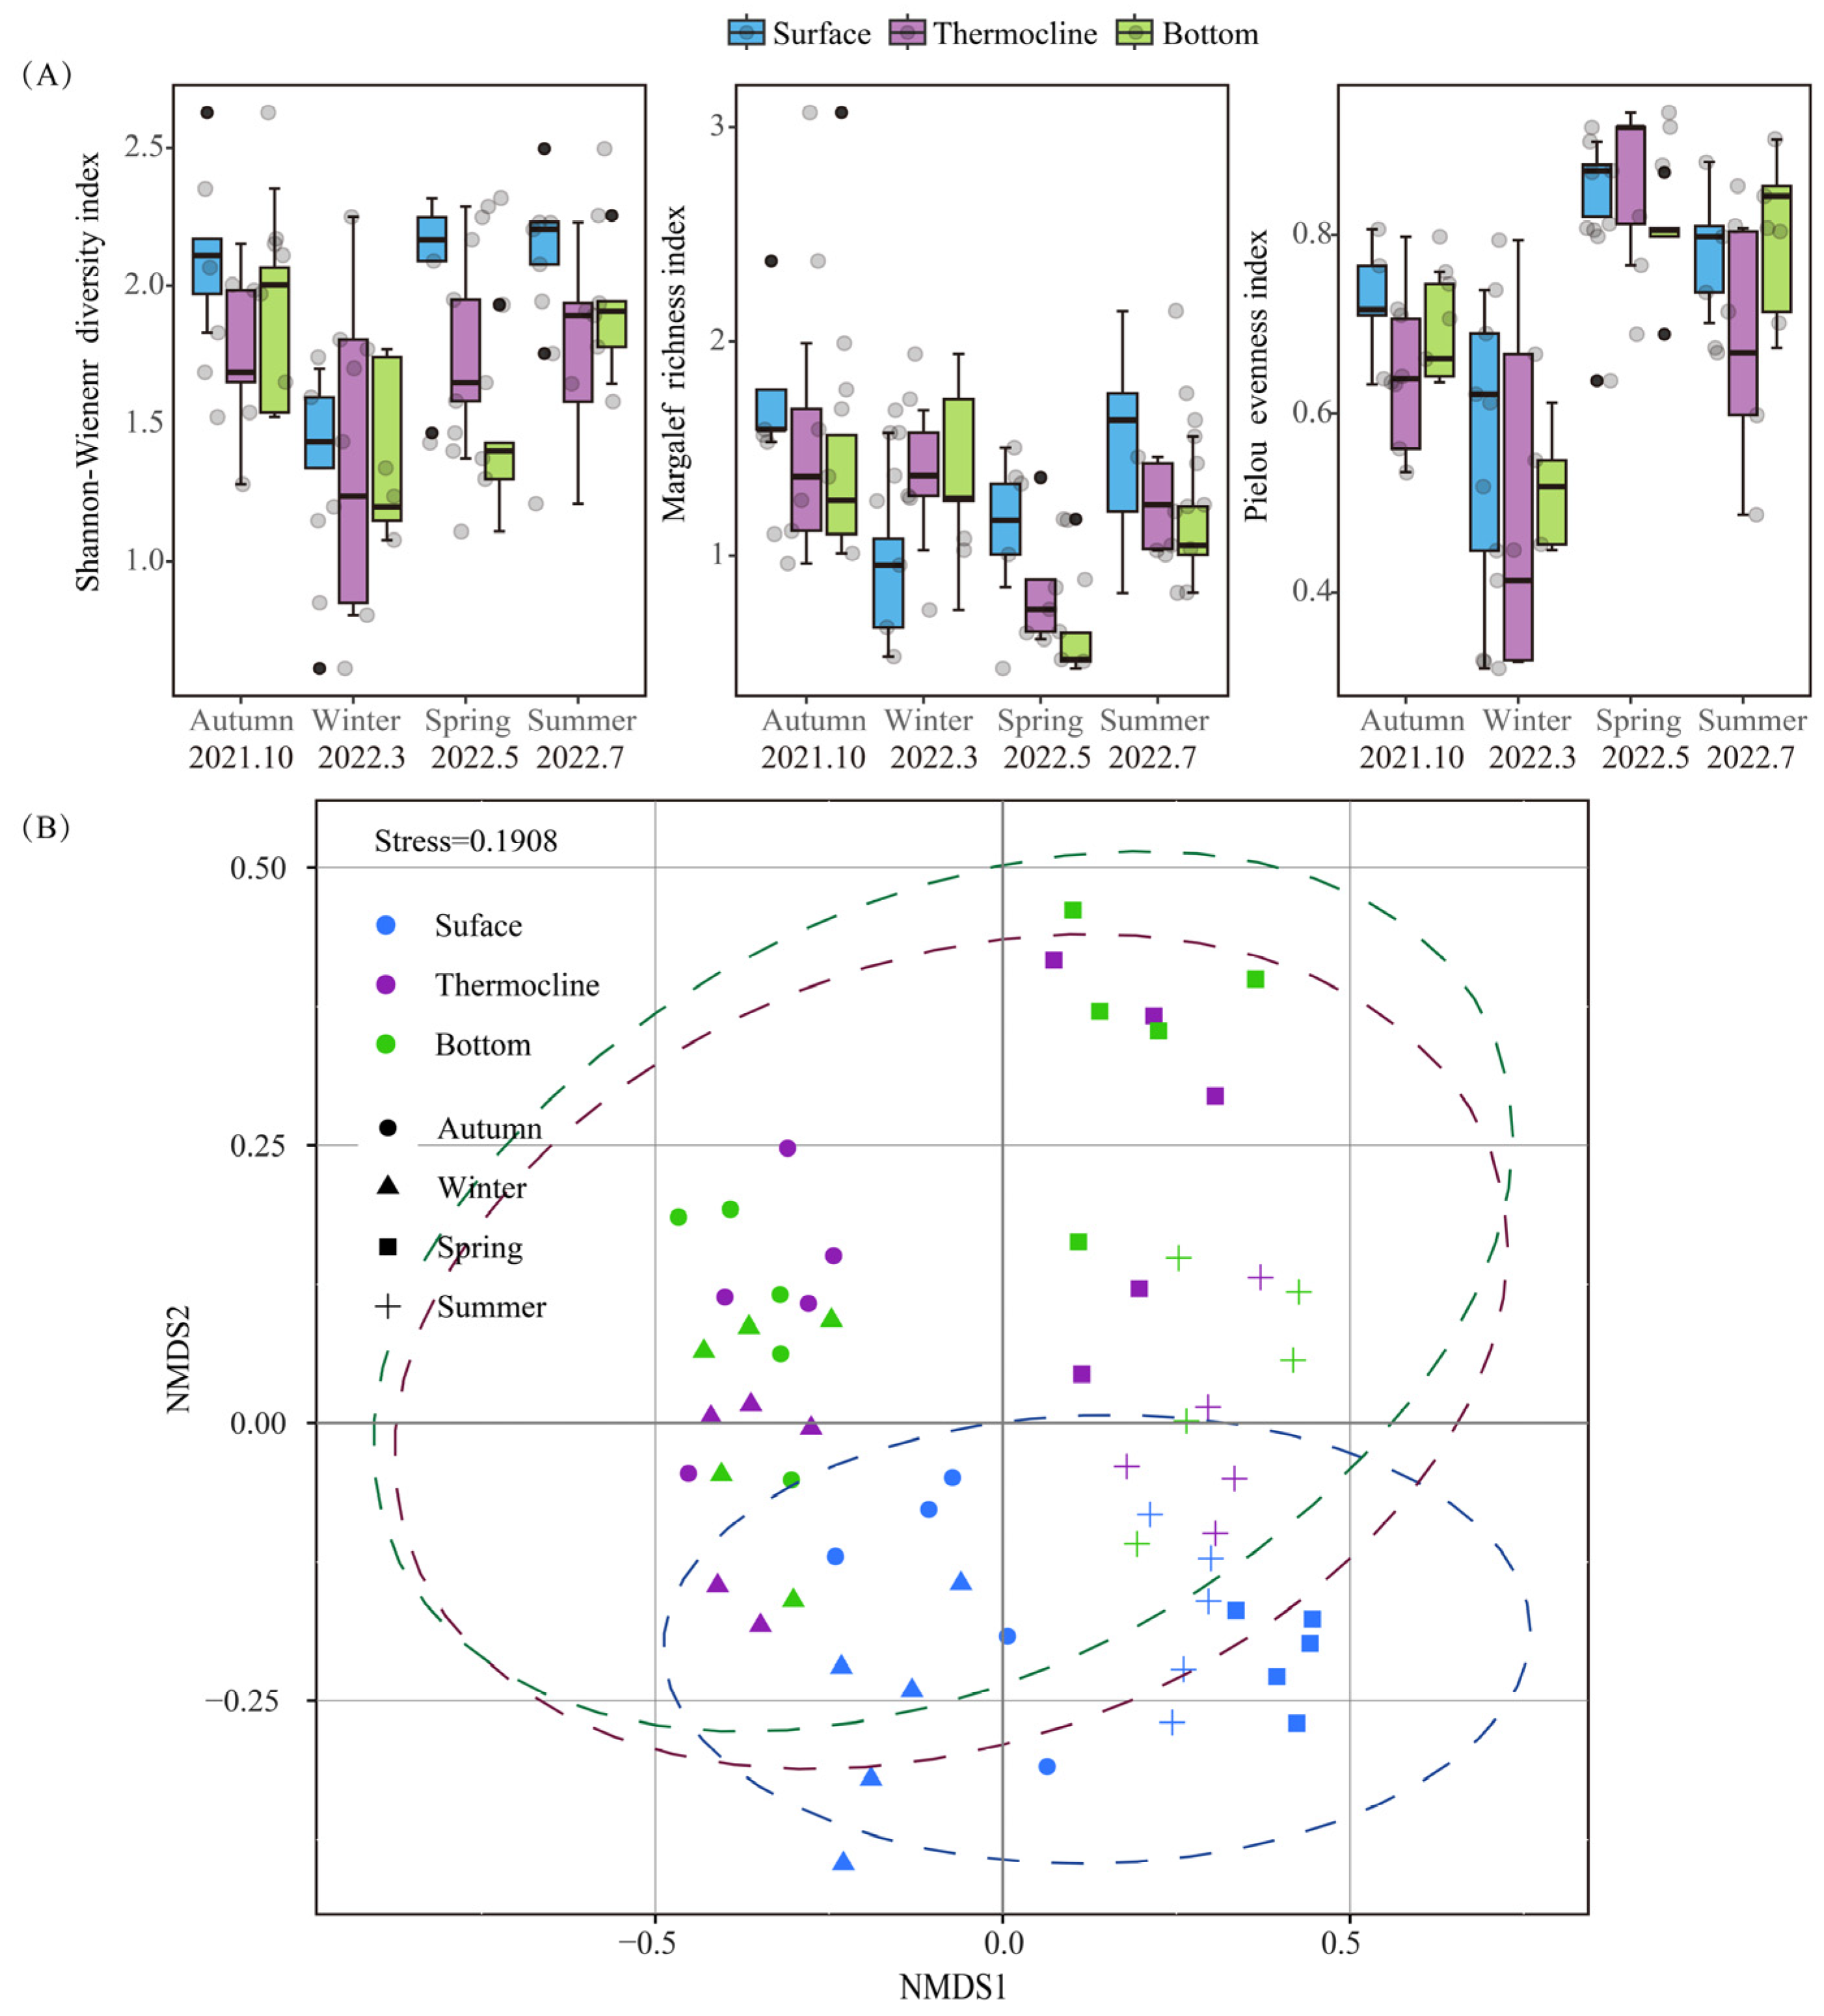
During the study period, the Shannon–Wiener diversity index of phytoplankton in Danjiangkou Reservoir varied between 0.61 and 2.62, with an average value of 1.75. The spatial trend of the Shannon–Wiener diversity index was surface layer > thermocline > bottom layer, and the temporal trend was summer > autumn > spring > winter. The Margalef richness index varied from 0.47 to 3.07, with a mean value of 1.25. Spatially, the trend of the Margalef richness index was consistent with that of the Shannon–Wiener diversity index; both indices decreased with increasing depth. Temporally, the Margalef richness index was highest in autumn, followed by summer, winter, and spring. The Pielou evenness index varied from 0.31 to 0.94, with a mean value of 0.68. The spatial trend of the Pielou evenness index was surface layer > bottom layer > thermocline, and the temporal trend was spring > summer > autumn > winter (Figure 4A).

3.2.4. Vertical Distribution Pattern of Phytoplankton Communities and the Assembly Processes

The results of our NMDS analysis of phytoplankton communities at three depths in Danjiangkou Reservoir based on Bray–Curtis dissimilarity showed that there was a significant difference in the structural composition of phytoplankton communities at different depths and in different seasons (Figure 4B). The greatest difference in phytoplankton community composition was between the surface layer and the thermocline and bottom layer, whereas the community structures in the thermocline and bottom layer shared a greater similarity. Temporally, phytoplankton communities at three depths showed similar community compositions in spring and winter and in summer and autumn. The NMDS axis II showed clear distinctions between the autumn/winter and spring/summer categories of phytoplankton communities at each depth. The results of our PERMANOVA (Supplementary Table S3) also showed that there were significant differences in phytoplankton community composition in different layers and seasons in the reservoir. Spatially, there were significant differences between phytoplankton communities in different layers of the reservoir (p < 0.05), except for the small differences between the thermocline and bottom layer phytoplankton communities. Temporally, significant differences (p < 0.05) were found between phytoplankton communities in different water layers in all seasons, except for small differences between the autumn and winter thermocline communities and between the winter thermocline and bottom layer communities.
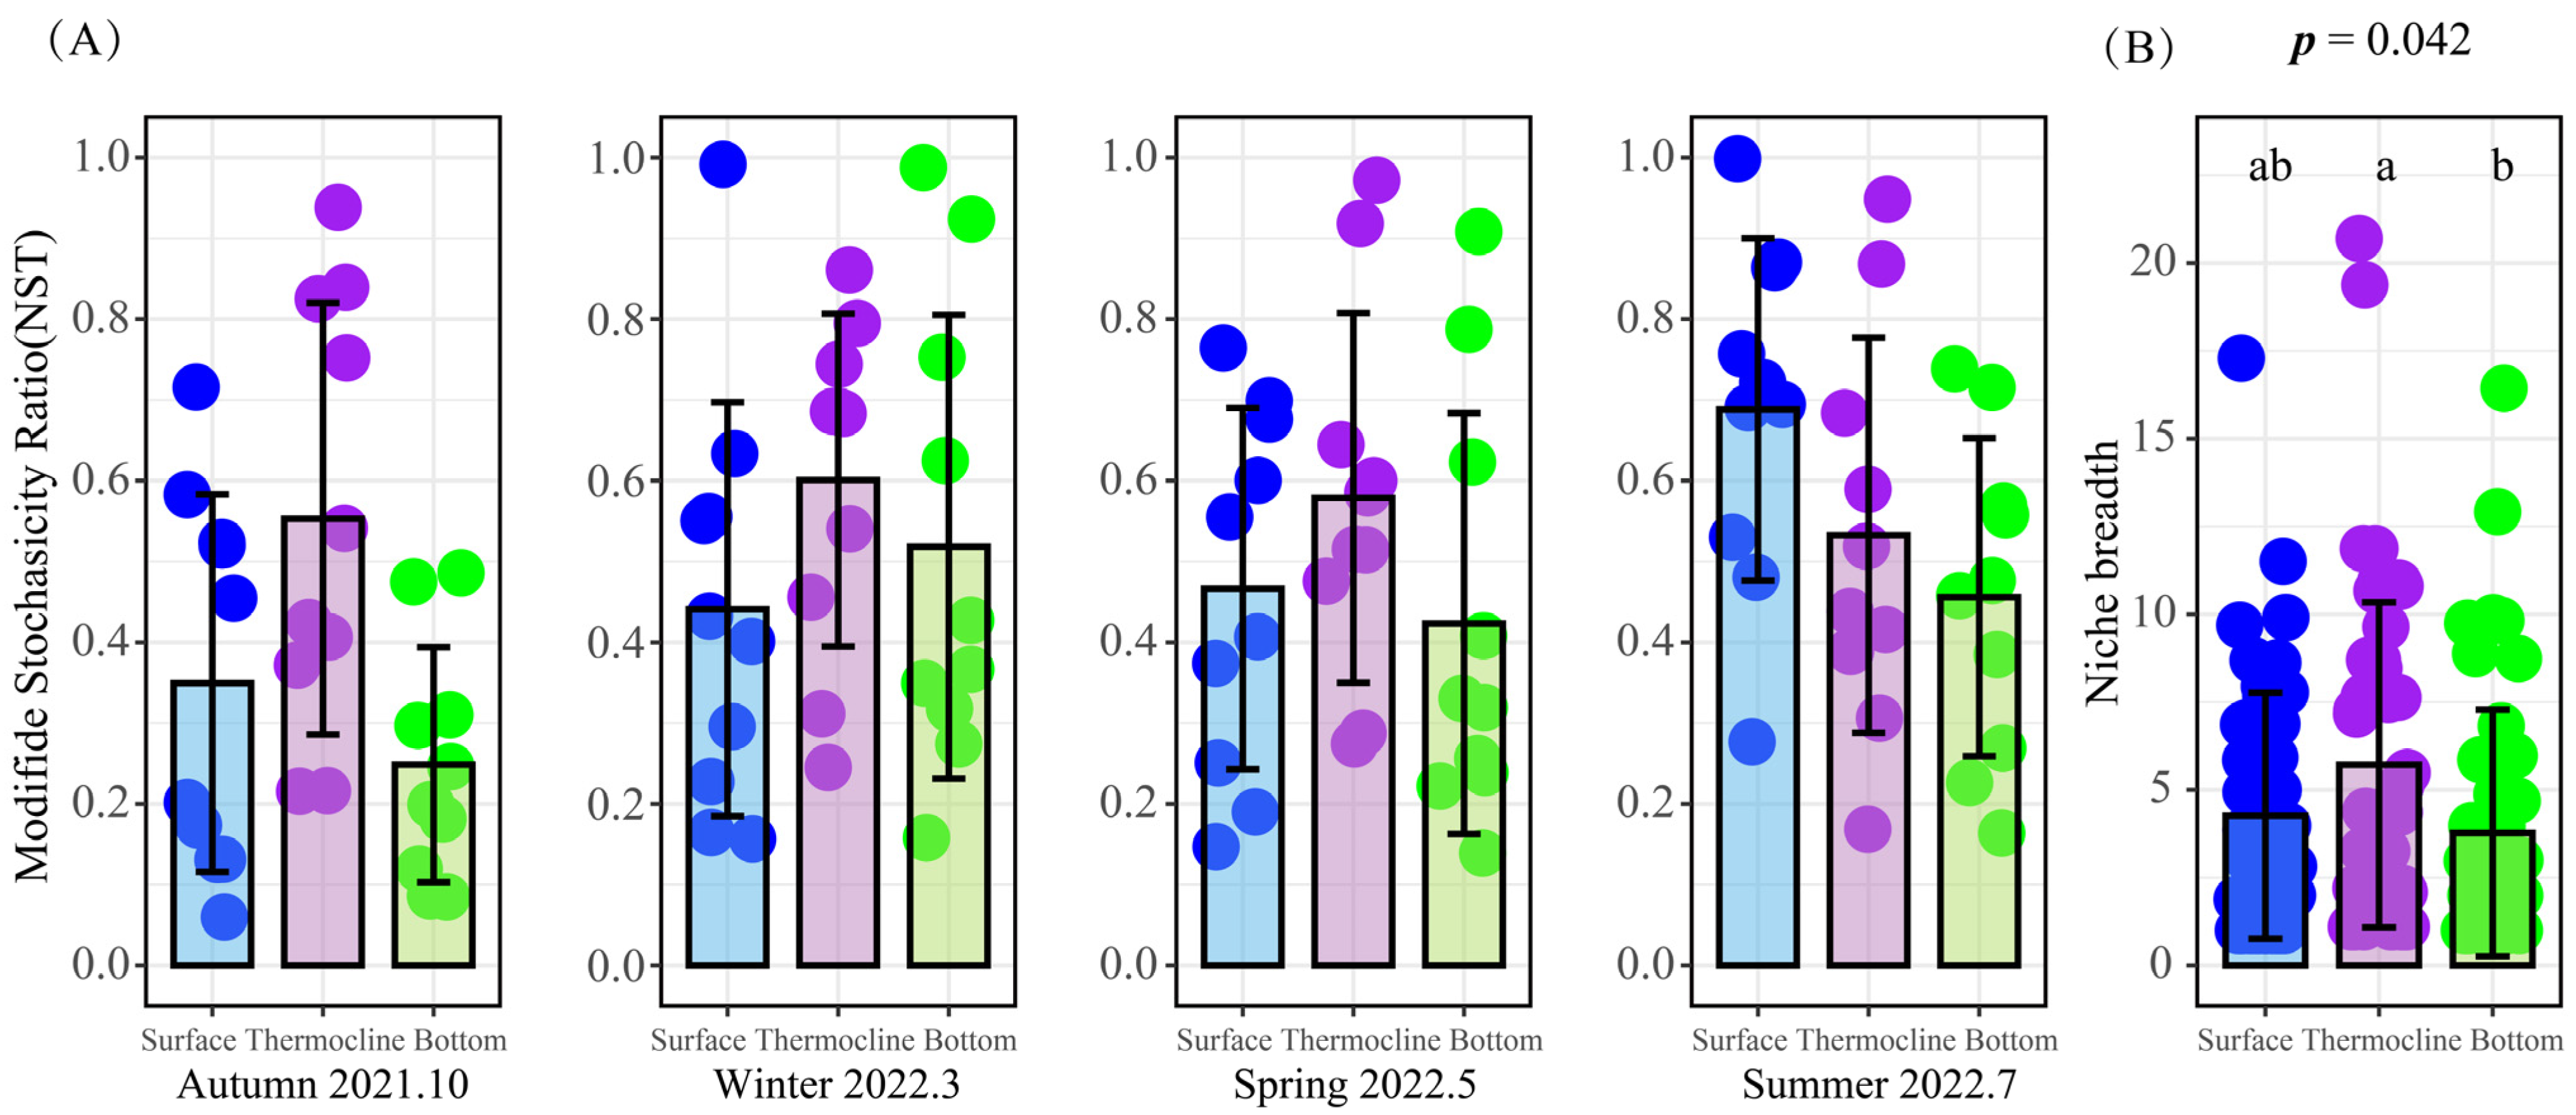
Deterministic and stochastic processes were fundamental to microbial community assembly. The MST results clarified the relative importance of deterministic and stochastic processes in the assembly of phytoplankton communities at different reservoir depths (Figure 5A) and showed that most of the MST values for the surface and bottom layer phytoplankton communities were below the threshold line of 0.5, except for those of the summer surface layer and winter bottom layer. These results indicated that deterministic processes were more important in the surface and bottom layer phytoplankton communities. The MST values for the thermocline phytoplankton community were consistently above the threshold line of 0.5, which indicated that stochastic processes could influence community assembly in this layer. The niche breadth values of phytoplankton communities at three depths were also calculated (Figure 5B). The highest niche breadth was that of the thermocline phytoplankton community (p = 0.042), which was significantly different from that of the bottom layer community.

3.3. Response of Phytoplankton to Environmental Factors during Thermal Stratification

3.3.1. Phytoplankton Community Structure in Relation to Environmental Factors

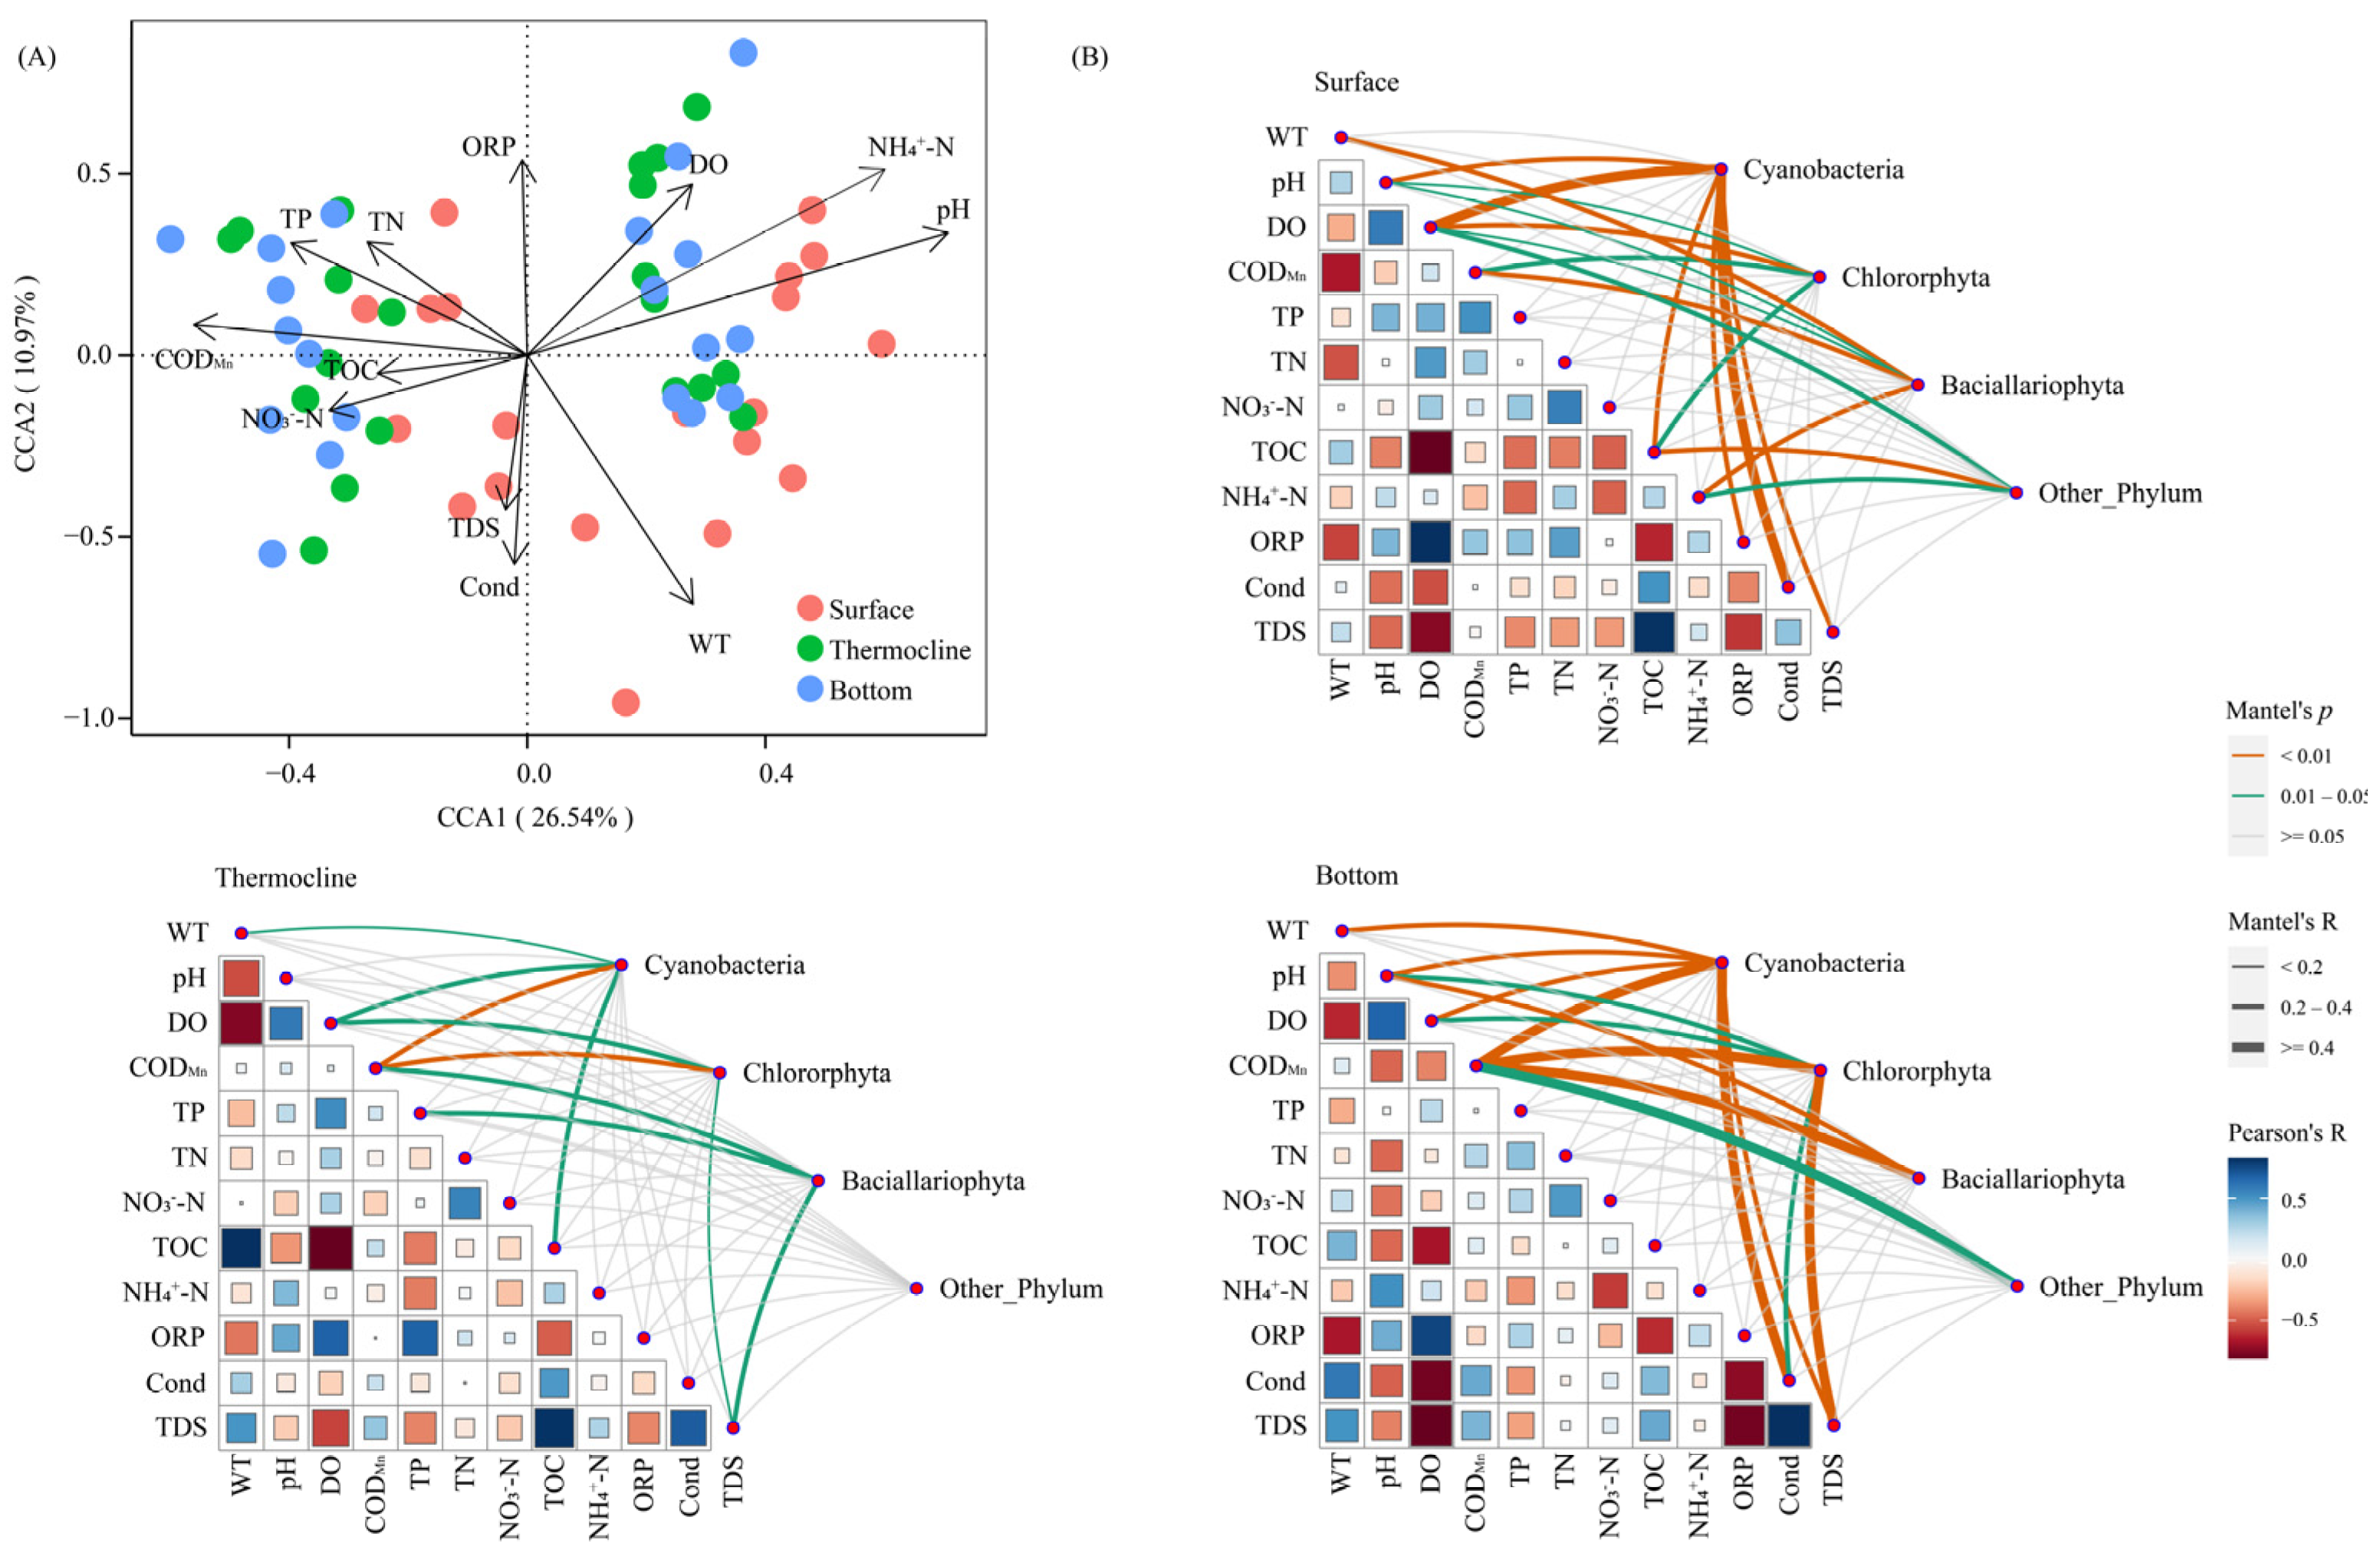
To clarify the environmental drivers of phytoplankton community during thermal stratification, phytoplankton community abundance was subjected to CCA with environmental factors (Figure 6A). The CCA1 axis accounted for 26.54% of the total community distribution, and the CCA2 axis accounted for 10.97%. The results showed that NH4+-N (R2 = 0.49, p = 0.001), pH (R2 = 0.49, p = 0.001), WT (R2 = 0.45, p = 0.001), conductivity (Cond) (R2 = 0.27, p = 0.001), chemical oxygen demand (CODMn) (R2 = 0.26, p = 0.003), dissolved oxygen (DO) (R2 = 0.23, p = 0.022), redox potential (ORP) (R2 = 0.23, p = 0.001), total phosphorus (TP) (R2 = 0.21, p = 0.001), and total nitrogen (TN) (R2 = 0.13, p = 0.013) were highly correlated with the vertical distribution of phytoplankton communities.
The results of the Mantel test revealed the correlations between species abundance and physicochemical factors for different phyla of phytoplankton communities in different water layers (Figure 6B). In the surface layer, Cyanobacteria abundance was significantly correlated with pH, DO, total organic carbon (TOC), ORP, Cond, and total dissolved solids (TDS) (p < 0.01); Chlorophyta abundance was significantly correlated with DO, CODMn, and TOC (p < 0.01) and highly correlated with pH (p < 0.05); Bacillariophyta abundance was significantly correlated with WT and NH4+-N (p < 0.01) and highly correlated with pH and DO (p < 0.05); and the phytoplankton abundance of the remaining phyla in the surface layer was significantly correlated with TOC (p < 0.01) and highly correlated with NH4+-N and DO (p < 0.05). In the thermocline, the abundance of Cyanobacteria phyla was significantly correlated with CODMn (p < 0.01) and highly correlated with WT, DO, and TOC (p < 0.05); Chlorophyta abundance was significantly correlated with DO, CODMn, and TDS (p < 0.01); and Bacillariophyta abundance was significantly correlated with CODMn, TP, and TDS (p < 0.01). In the bottom layer, Cyanobacteria abundance was significantly correlated with WT, pH, DO, CODMn, Cond, and TDS (p < 0.01) and highly correlated with pH and DO (p < 0.05); Chlorophyta abundance was significantly correlated with CODMn and TDS (p < 0.01); Bacillariophyta abundance was highly correlated with pH and CODMn (p < 0.05); and the phytoplankton abundance of the remaining phyla in the bottom layer was highly correlated with CODMn (p < 0.05).

3.3.2. Relationships between Dominant Phytoplankton Species to Environmental Conditions

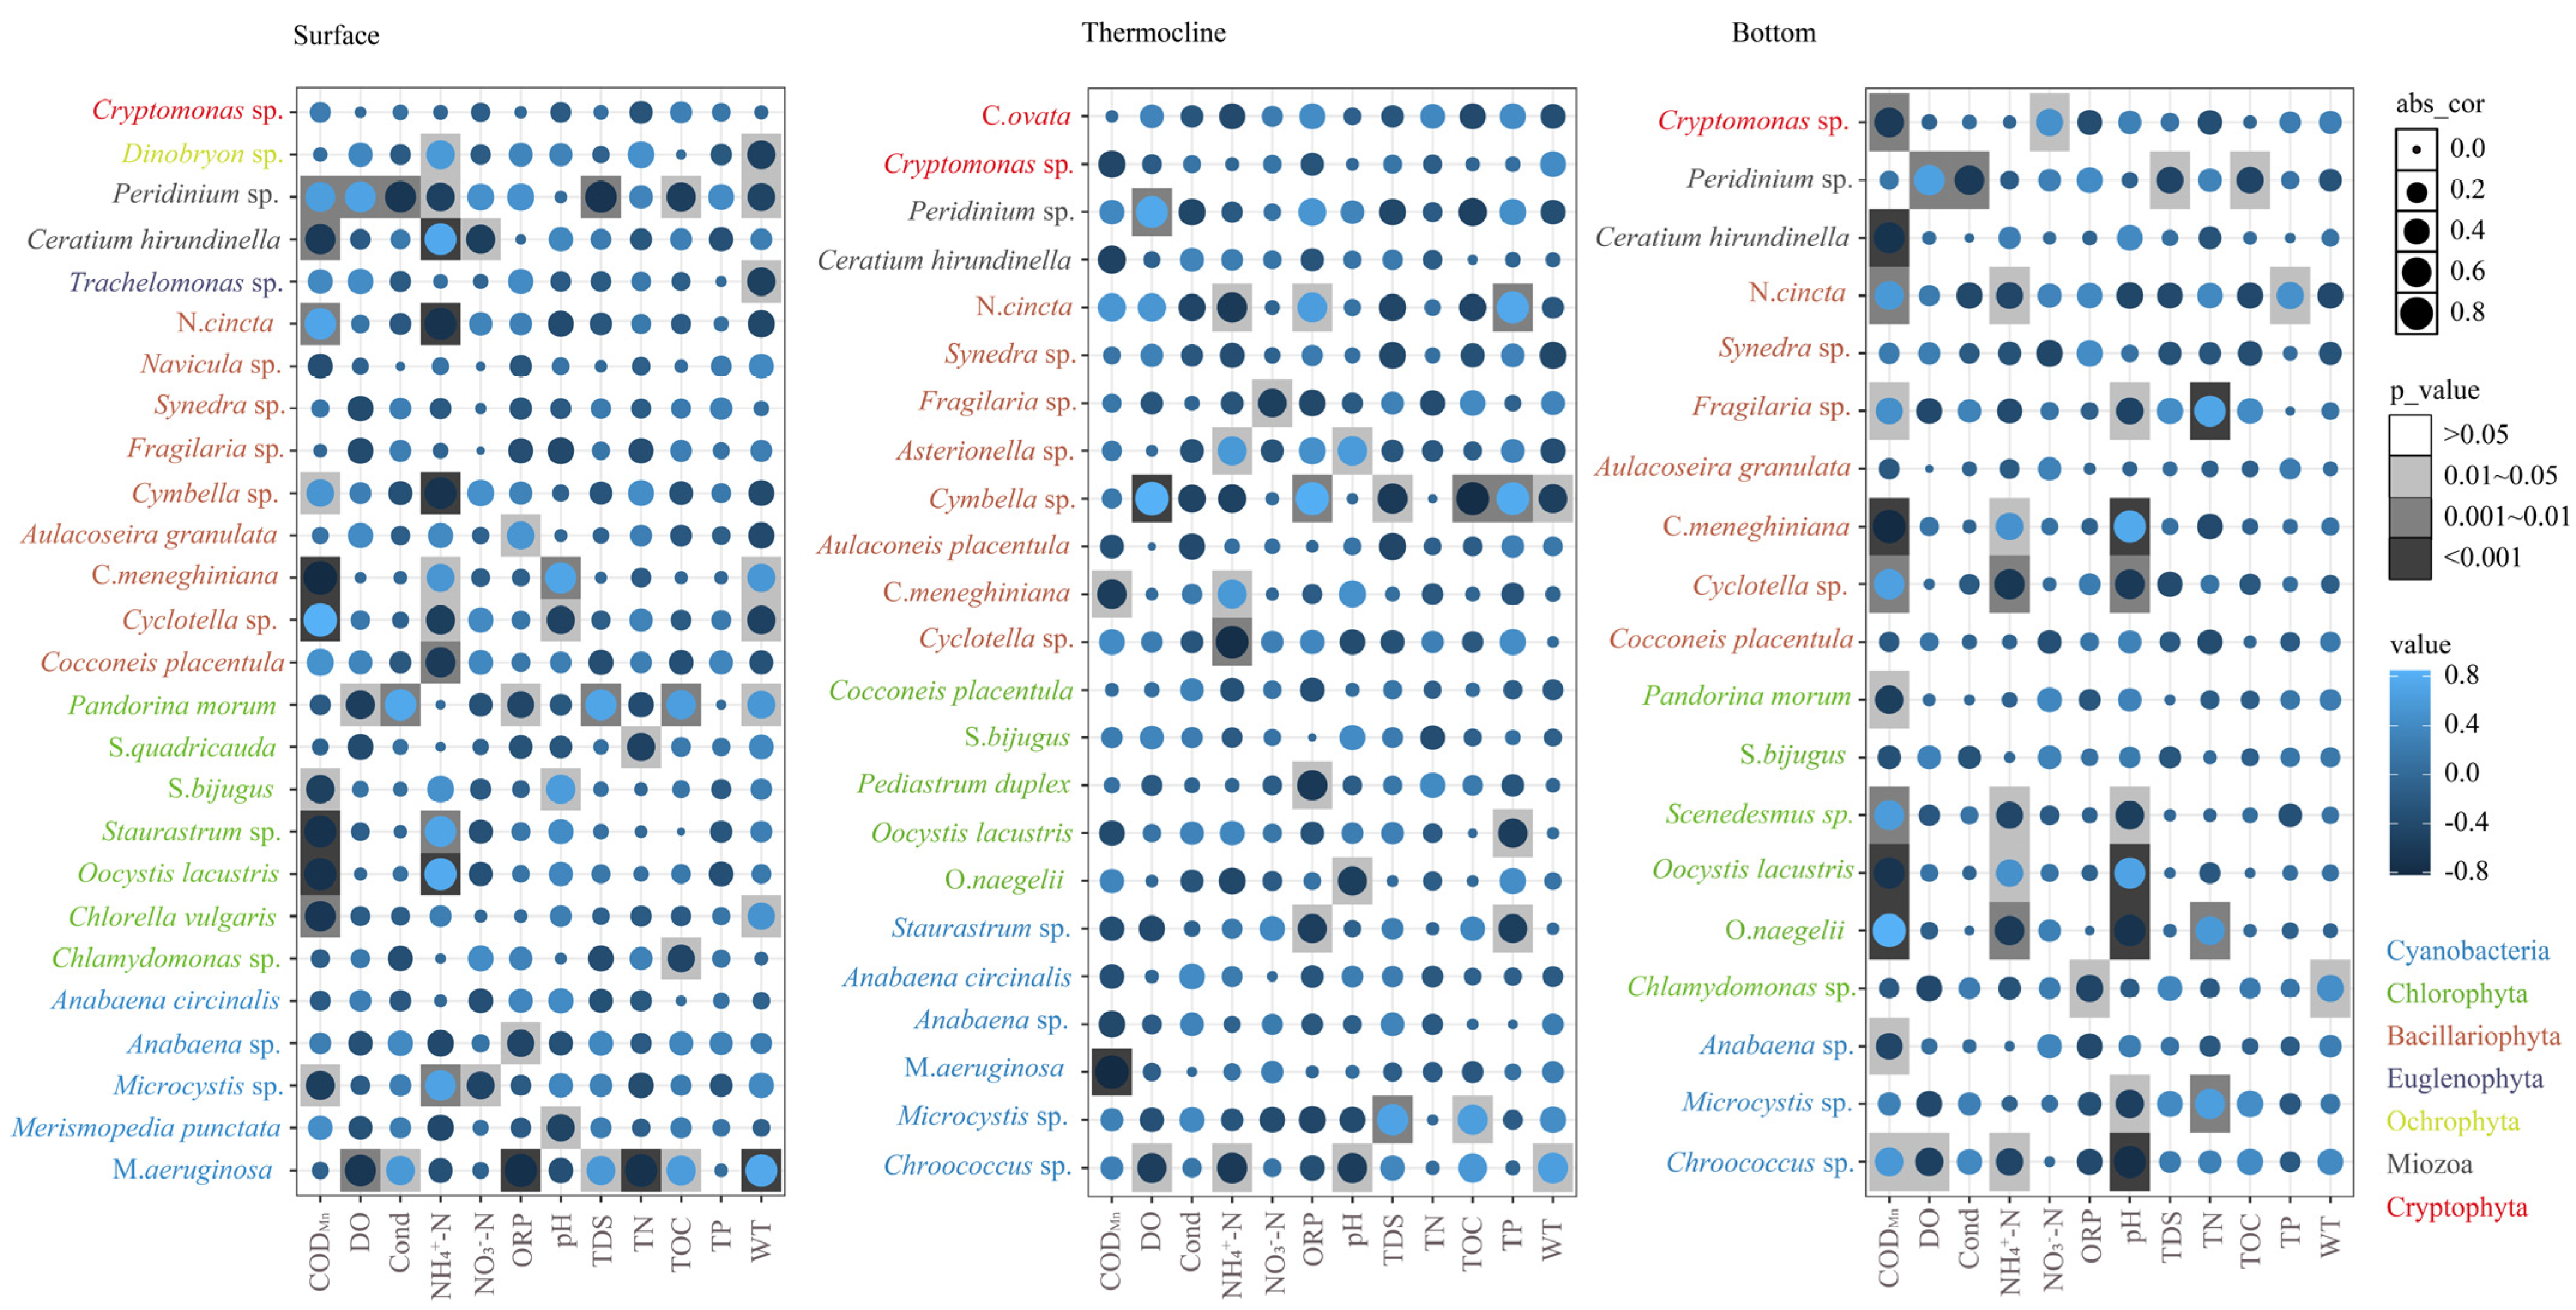
The results of our Spearman correlation analysis (Figure 7) between the abundance of dominant phytoplankton species and environmental parameters showed that the parameter that had the most correlations with the abundance of dominant species in the surface layer was CODMn, as Chlorella vulgaris (p < 0.01), Oocystis lacustris (p < 0.001), Staurastrum sp. (p < 0.001), C. meneghiniana (p < 0.001), Ceratium hirundinella (p < 0.01), Microcystis sp. (p < 0.05), and S. bijugus (p < 0.05) are positively significantly correlated with CODMn, while Cyclotella sp. (p < 0.001), Peridinium sp. (p < 0.01), N. cincta (p < 0.01), and Cymbella sp. (p < 0.05) are negatively significantly correlated with CODMn. Meanwhile, the environmental factor that triggered the most correlations with the abundance of dominant species in the thermocline was NH4+-N, as Cyclotella sp. (p < 0.01), Chroococcus sp. (p < 0.05), and N. cincta (p < 0.05) are positively significantly correlated with NH4+-N, while C. meneghiniana (p < 0.05) and Asterionella sp. (p < 0.05) are negatively significantly correlated with NH4+-N. In contrast, the environmental factor that triggered the most correlations with the bottom layer abundance of dominant species was CODMn, as C. meneghiniana (p < 0.001), Ceratium hirundinella (p < 0.001), Cryptomonas sp. (p < 0.01), Oocystis lacustris (p < 0.01), Anabaena sp. (p < 0.05), and Pandorina morum (p < 0.05) are positively significantly correlated with CODMn, while O. naegelii (p < 0.001), Scenedesmus sp. (p < 0.01), Cyclotella sp. (p < 0.01), Fragilaria sp. (p < 0.05), and Chroococcus sp. (p < 0.05) are negatively significantly correlated with CODMn.

4. Discussion

The results of the study indicate that the assembly process of phytoplankton communities under the influence of thermally stratified environments exhibits similar patterns over the four seasons. The assembly changes of the surface and bottom layer phytoplankton communities were influenced more by deterministic processes, while stochastic processes were more prevalent in the assembly of the thermocline phytoplankton community. This finding confirms our prediction that phytoplankton community structure would be affected by thermal stratification among water layers associating with environmental condition changes. The variation in environmental factors and phytoplankton community diversity indices showed certain seasonal succession and reflected regional distribution patterns.

4.1. The Characterization of Phytoplankton Assembly Patterns during Thermal Stratification

During the study period, the number of phytoplankton species in Danjiangkou Reservoir showed a gradual increasing trend from the bottom layer to the surface layer; the magnitude of the increase was not significant and exhibited greater homogeneity. The dominant phytoplankton phyla were relatively stable, mainly consisting of Cyanobacteria, Bacillariophyta, and Chlorophyta. In terms of abundance, Cyanobacteria were the dominant taxa. In the case of high thermal stability, the biomass of Dinophyta, which need a higher-temperature growth environment, increased significantly [41]. Compared to the 2017–2019 results, the vertical distribution of phytoplankton communities showed a decrease in species numbers. However, the number of dominant phylum species, the abundance of phytoplankton species across strata, and the diversity index remained similar [14]. Meanwhile, similar to the results of Lake Erie [42] and Qiandao Lake [13], the phytoplankton community structure in the surface layer of the water mainly consisted of Cyanobacteria, including high-buoyancy algae, whereas the phytoplankton community structure in the bottom layer mainly consisted of Bacillariophyta affected by the submergence effect. Comparison with the results of several recent studies revealed no clear pattern of seasonal changes in phytoplankton abundance in Danjiangkou Reservoir. It was highest during the winter of 2007–2008 [43], in the summer of 2009–2010 [44], and in the spring of 2014–2015 [45]. In 2019, it was higher during the summer and autumn and lowest during the spring [46]. This may be due to differences in location, amount, frequency and timing of sampling, and water-level changes between studies. Except in summer, the vertical order of phytoplankton density was as follows: surface layer > thermocline > bottom layer. Summer light is stronger, and strong light produces a photoinhibitory effect on phytoplankton, so the maximum phytoplankton abundance in summer is not in the surface layer; rather, it is in the thermocline.
Overall, the Shannon–Wiener diversity index and Margalef richness index showed a gradually decreasing trend with increasing depth, indicating that the ecological structure of the phytoplankton community moving toward the bottom layer was gradually simplified and that the productivity and stability of the ecosystem gradually decreased. From Figure 4A, it can be seen that when the degree of thermal stratification was higher, the Shannon–Wiener diversity index was higher. When the number of phytoplankton species increased, the community stabilized, and its self-regulating ability increased, which helped to maintain the ecological balance [47,48,49]. The diversity indices in the horizontal direction were higher than those in the vertical direction, indicating that the structure of phytoplankton communities in the reservoir was more uniformly distributed horizontally and that the complexity of the communities was relatively high.
The phytoplankton community in the thermocline layer had a higher niche breadth compared to the surface and bottom layers, and it has been shown that deterministic processes tend to have a significantly effect on habitats with higher niche breadth values [50]. Deterministic processes involve biotic and abiotic factors, interspecific interactions (e.g., competition, predation, symbiosis, and trade-offs) and environmental filtration (e.g., salinity, pH, temperature), which, together, shape community composition [51]. Phytoplankton community assembly processes can be inhibited by environmental stressors such as alkalization, acidification, and eutrophication [52]. Under thermal stratification perturbations, phytoplankton communities were more influenced by deterministic processes, which alter community assembly processes by affecting the balance between deterministic and stochastic processes.
Stochastic processes were more likely to occur under the condition of heavy rainfall, as this increased river connectivity, which, in turn, increased phytoplankton mobilization and the flushing of microorganisms from surrounding environmental systems (e.g., soils, sediments, and watersheds) into rivers [53,54,55]. In summer, species dispersal in the surface layer phytoplankton community was much higher than in other seasons, which was similar to the results regarding the assembly process of bacterioplankton communities in the Jinjiang River [56] and the assembly of phytoplankton communities in the summer surface layer of the Yarlung Tsangpo River [57].

4.2. Relationships between Phytoplankton Community Structures and Environmental Factors with Thermal Stratification Conditions

The presence of a stabilizing thermocline limited the spread of the phytoplankton community and led to differences in phytoplankton community assembly processes in different water layers [14]. Deterministic processes were strongly influenced by environmental stresses, which varied with depth and the characteristics of specific habitats, leading to the dominance of deterministic processes in the assembly of phytoplankton communities in the bottom layer waters. In the surface layer, where air exchange is frequent, phytoplankton can consume inorganic ions such as NH4+ and NO3 in the water through photosynthesis [58]. However, the thermocline blocks the deposition of N and P compounds in the bottom layer, resulting in a stronger correlation between environmental factors and the abundance of surface and bottom layer phytoplankton communities. Additionally, as the thermocline limited the vertical mixing of nutrients and organic matter, it prevented light from penetrating to deeper layers; thus, the photosynthetically active radiation intensity decreased rapidly with an increase in depth, thereby controlling photosynthesis and phytoplankton growth. Meanwhile, the thermocline exhibited the minimum value of Cond among the water layers during the study period, and the content of different types of anions and cations in the water was low [59], resulting in lower nutrient availability for phytoplankton and a weaker correlation with environmental factors [60]. The thermocline phytoplankton community occupied a broader ecological niche, which suggested that the dominant species and habitats of the thermocline phytoplankton community were more stable and ecologically adaptive, as well as being less affected by environmental changes [38,46,50]. Therefore, the thermocline phytoplankton assembly processes were highly influenced by stochasticity.
WT was the primary environmental factor affecting phytoplankton growth and reproduction, as this factor has the greatest effect on growth rates [14]. The WT changes markedly from season to season, with higher WT in summer and autumn, making the water environment more suitable for the growth of Cyanobacteria at an optimal temperature (25–35 °C) [47]. At greater depths, where the WT was lower, Bacillariophyta adapted to low temperatures to grow in large numbers. The WT can directly affect phytoplankton growth by influencing the activity and rate of phytoplankton life processes, and it indirectly promotes or inhibits phytoplankton growth by controlling the rate of decomposition of different types of nutrients in the water column and other physicochemical processes [61]. In particular, phytoplankton growth rate has been shown to more than double for every 10 °C increase in WT [62], which explains the positive correlation (p < 0.05) between dominant phytoplankton species such as Microcystis aeruginosa, Chlorella vulgaris, Pandorina morum, and C. meneghiniana and WT and the negative correlation (p < 0.05) between Cyclotella sp., Trachelomonas sp., Dinobryon sp., and Peridinium sp. and WT in the surface layer in the present study.
In addition, changes in temperature often lead to changes in other environmental factors, such as DO, pH, N, and organic substances. For example, in this study, DO was simultaneously correlated with the abundance of Chlorophyta and Cyanobacteria at different depths, including the abundance of some dominant species, such as P. morum, which showed a significant positive correlation (p < 0.05) with the DO concentration. Compared with the results of other studies on the effects of thermal stratification on DO distribution [13,63], anaerobic phenomena did not occur in large areas of the bottom layer, and they only appeared in a few sample sites in autumn 2021.
The results of our CCA showed that pH was the main environmental driver of the vertical distribution of phytoplankton communities in Danjiangkou Reservoir, similar to the results of a study on the effects of environmental factors on phytoplankton in Danjiangkou Reservoir from 2014 to 2015 [45], which found that pH was the main influencing factor of phytoplankton biomass in the reservoir. Notably, pH affects phytoplankton growth in two main ways: (1) it affects the distribution of different forms of inorganic carbon and the carbonate balance, which, in turn, affects the carbon required for phytoplankton growth [64], and (2) it alters the acidity or alkalinity of the environment, and phytoplankton cells were only able to grow and reproduce normally within an appropriate pH range [60]. Additionally, changes in pH may trigger changes in DO. Water has oxidizing–reducing properties, and the process is O2 (gas) + 4H+ + 4e ⇆ 2H2O (liquid) [65]. Thus, when the pH decreases, which could promote the redox reaction of water in the positive and negative direction, H+ reacts with O2 to produce H2O, which reduces DO. Therefore, changes in pH could directly or indirectly affect the vertical distribution of phytoplankton communities [66].
The stabilized thermal stratification phenomenon significantly affected the vertical distribution pattern of N and P concentrations in Danjiangkou Reservoir, showing a pattern of bottom layer > thermocline > surface layer, which aligned with the results for Fuxian Lake [67]. Notably, N and P are the basic nutrients required for phytoplankton life in freshwater systems, and excess amounts of these nutrients can lead to eutrophication and algae blooms [68]. According to the results of our correlation analysis, the most important driving factors affecting the abundance of dominant phytoplankton species were NH4+-N and CODMn. The absorption rate of NH4+-N by phytoplankton was greater than that of NO-N. When phytoplankton absorb and utilize NO-N, they need to consume energy to use NO3 reductase and NO2 reductase to reduce NO-N to NH4+-N, synthesize amino acids under the action of glutamyl ammonia synthetase, and, finally, synthesize cells through photosynthesis [69]. Additionally, phytoplankton could produce a large amount of organic matter through photosynthesis, which increases the CODMn [70]. Therefore, a series of interactions contributed to the significant correlation between dominant phytoplankton species abundance and NH4+-N and CODMn.
Compared to the findings of other studies on thermally stratified mixing periods in deep-water lakes [4,71,72,73,74], when the temperature decreased during the mixing period, the water column was in a state of complete mixing and the phytoplankton abundance was more evenly distributed vertically, but the low temperature and vertically mixing cold water currents resulted in a sharp decrease in phytoplankton abundance. Additionally, the reduction in thermal stratification stability resulted in the release of a large amount of nutrient salts from the sediments, the vertical distribution of nutrient was more uniform, and a greater amount of nutrients were available to the phytoplankton community in each water layer. However, due to the low temperature and light intensity in the mixing water, the dominant phytoplankton species (genera) were mostly suitable for low-temperature and low-light conditions and dependent on nutrients. The phytoplankton assembly processes during the mixing period of thermal stratification showed a tendency for stochastic processes to gradually dominate with water depth, which implied that the pattern of phytoplankton community assembly processes was changed by the emergence of thermal stratification.

5. Conclusions

A total of 95 species of phytoplankton among 8 phyla and 62 genera were detected during the period studying thermal stratification in Danjiangkou Reservoir. Overall, phytoplankton community density and diversity decreased with increasing depth, and the composition of phytoplankton communities in the surface layer differed greatly from those in the thermocline and bottom layer. Deterministic processes played a more important role in the assembly processes of phytoplankton communities in the surface and bottom layers, and stochastic processes dominated the assembly of phytoplankton communities in the thermocline. The emergence of Dinophyta in the bottom layer phytoplankton community of this deep-water reservoir, which is in a subtropical–warm temperate climate transition zone, may be an ecological warning of a trend of local temperature increase. To support sustainable ecosystem management and enhance aquatic biodiversity conservation, future research should focus on the dynamic succession of phytoplankton community structure associated with multiple anthropogenic stressors, such as extreme heat events, non-point source pollution, and eutrophication, and understand their implications for responses to global warming and land use change. Solving these problems will contribute to the rational and sustainable ecosystem management of water resources and help establish an effective response to the global water crisis.

Supplementary Materials

The following supporting information can be downloaded at: https://www.mdpi.com/article/10.3390/su16073058/s1. Figure S1. Principal component analysis (PCA) of water environmental factors (A) Spatial variation (B) Season variation. Table S1. Depth and transparency (Secchi depth [SD]) at sampling sites. Table S2. Dominant species and dominance degree of phytoplankton. Table S3. Permutational multivariate analysis of variance among phytoplankton communities at different depths.

Author Contributions

Conceptualization, Y.L. (Yixuan Li) and Y.L. (Yuying Li); data curation, H.W. and Y.L. (Yixuan Li); formal analysis, Y.L. (Yuying Li); funding acquisition, Y.L. (Yuying Li); investigation, H.W. and W.W.; methodology, H.W., Y.L. (Yixuan Li) and H.L.; project administration, Y.L. (Yuying Li); resources, Y.L. (Yixuan Li) and Y.L. (Yuying Li); software, H.W. and P.Z.; supervision, Y.L. (Yuying Li), H.L. and N.F.; validation, H.W., Y.L. (Yixuan Li) and H.L.; visualization, H.W. and Y.L. (Yixuan Li); writing—original draft, H.W., Y.L. (Yixuan Li), N.F. and Y.Z.; writing—review and editing, H.W., Y.L. (Yuying Li), N.F., B.-L.L. and Y.Z. All authors have read and agreed to the published version of the manuscript.

Funding

This study was funded by the National Natural Science Foundation of China (No. 51879130), the Higher Discipline Innovation Henan Province Key Research and Development and Promotion of Special Science and Technology Research (No. 232102320252), Major Science and Technology Projects of Henan Province (No. 221100320200), and Subject Innovation and Intelligence Introduction Base of Higher Education institutions for Ecological Security in the Water source Area of the middle route of South-to-North Water Diversion (D23015).

Institutional Review Board Statement

Not applicable.

Informed Consent Statement

All authors agreed with the content and gave explicit consent to submit.

Data Availability Statement

Data are contained within the article and Supplementary Materials.

Acknowledgments

Thanks to Beata Messyasz and Ryszard Jan Gołdyn of Adam Mickiewicz University and Shinichi Nakano of Kyoto University for their valuable comments on the research.

Conflicts of Interest

The authors declare no conflicts of interest.

References

  1. Beaver, J.R.; Kirsch, J.E.; Tausz, C.E.; Samples, E.E.; Renicker, T.R.; Scotese, K.C.; McMaster, H.A.; Blasius-Wert, B.J.; Zimba, P.V.; Casamatta, D.A. Long-term trends in seasonal plankton dynamics in Lake Mead (Nevada-Arizona, USA) and implications for climate change. Hydrobiologia 2018, 822, 85–109. [Google Scholar] [CrossRef]
  2. Guo, F.; Jiang, G.; Zhao, H.; Polk, J.; Liu, S. Physicochemical parameters and phytoplankton as indicators of the aquatic environment in karstic springs of South China. Sci. Total Environ. 2019, 659, 74–83. [Google Scholar] [CrossRef] [PubMed]
  3. Tokatlı, C.; Varol, M.; Uğurluoğlu, A. Ecological risk assessment, source identification and spatial distribution of organic contaminants in terms of mucilage threat in streams of Çanakkale Strait Basin (Türkiye). Chemosphere 2024, 353, 141546. [Google Scholar] [CrossRef] [PubMed]
  4. Lu, Y.; Tuo, Y.; Zhang, L.; Hu, X.; Huang, B.; Chen, M.; Li, Z. Vertical distribution rules and factors influencing phytoplankton in front of a drinking water reservoir outlet. Sci. Total Environ. 2023, 902, 166512. [Google Scholar] [CrossRef] [PubMed]
  5. Wang, L.; Liu, J.; Bao, Z.; Ma, X.; Shen, H.; Xie, P.; Chen, J. Thermocline stratification favors phytoplankton spatial overlap and species diversity in a subtropical deep reservoir. Sci. Total Environ. 2024, 913, 169712. [Google Scholar] [CrossRef] [PubMed]
  6. Jung, E.; Joo, G.; Kim, H.G.; Kim, D.; Kim, H. Effects of Seasonal and Diel Variations in Thermal Stratification on Phytoplankton in a Regulated River. Sustainability 2023, 15, 16330. [Google Scholar] [CrossRef]
  7. Zhang, Z.; Meng, J.; Chen, Z.; Zhou, S.; Zhang, T.; Chen, Z.; Liu, Y.; Cui, J. Response of dissolved organic matter to thermal stratification and environmental indication: The case of Gangnan Reservoir. Sci. Total Environ. 2023, 868, 161615. [Google Scholar] [CrossRef] [PubMed]
  8. Ryabov, A.B.; Rudolf, L.; Blasius, B. Vertical distribution and composition of phytoplankton under the influence of an upper mixed layer. J. Theor. Biol. 2010, 263, 120–133. [Google Scholar] [CrossRef] [PubMed]
  9. Becker, V.; Caputo, L.; Ordóñez, J.; Marcé, R.; Armengol, J.; Crossetti, L.O.; Huszar, V.L.M. Driving factors of the phytoplankton functional groups in a deep Mediterranean reservoir. Water Res. 2010, 44, 3345–3354. [Google Scholar] [CrossRef]
  10. Sharples, J.; Ross, O.N.; Scott, B.E.; Greenstreet, S.P.R.; Fraser, H. Inter-annual variability in the timing of stratification and the spring bloom in the North-western North Sea. Cont. Shelf Res. 2006, 26, 733–751. [Google Scholar] [CrossRef]
  11. Gittings, J.A.; Raitsos, D.E.; Krokos, G.; Hoteit, I. Impacts of warming on phytoplankton abundance and phenology in a typical tropical marine ecosystem. Sci. Rep. 2018, 8, 2240. [Google Scholar] [CrossRef]
  12. Li, P.; Yao, Y.; Lian, J.; Ma, C. Effect of thermal stratified flow on algal blooms in a tributary bay of the Three Gorges reservoir. J. Hydrol. 2021, 601, 126648. [Google Scholar] [CrossRef]
  13. Wang, J.; Huo, D.; Guo, C.; Zhu, G.; Gong, Z.; Fan, Y.; Wang, J. Vertical Distribution Characteristics and Influencing Factors of Phytoplankton Community Structure in Qiandao Lake. Environ. Sci. 2022, 43, 3575–3586. [Google Scholar]
  14. Cui, Z.; Gao, W.; Li, Y.; Wang, W.; Wang, H.; Liu, H.; Fan, P.; Fohrer, N.; Wu, N. Dissolved oxygen and water temperature drive vertical spatiotemporal variation of phytoplankton community: Evidence from the largest diversion water source area. Int. J. Environ. Res. Public Health 2023, 20, 4307. [Google Scholar] [CrossRef]
  15. Zhang, C.; Nong, X.; Behzadian, K.; Campos, L.C.; Chen, L.; Shao, D. A new framework for water quality forecasting coupling causal inference, time-frequency analysis and uncertainty quantification. J. Environ. Manag. 2024, 350, 119613. [Google Scholar] [CrossRef]
  16. Lin, L.; Pan, X.; Zhang, S.; Li, D.; Zhai, W.; Wang, Z.; Tao, J.; Mi, C.; Li, Q.; Crittenden, J.C. Distribution and source of microplastics in China’s second largest reservoir—Danjiangkou Reservoir. J. Environ. Sci. 2021, 102, 74–84. [Google Scholar] [CrossRef]
  17. Gao, X.; Chen, H.; Gu, B.; Jeppesen, E.; Xue, Y.; Yang, J. Particulate organic matter as causative factor to eutrophication of subtropical deep freshwater: Role of typhoon (tropical cyclone) in the nutrient cycling. Water Res. 2021, 188, 116470. [Google Scholar] [CrossRef] [PubMed]
  18. Jargal, N.; An, K.G. Seasonal and interannual responses of blue-green algal taxa and chlorophyll to a monsoon climate, flow regimes, and N:P ratios in a temperate drinking-water reservoir. Sci. Total Environ. 2023, 896, 165306. [Google Scholar] [CrossRef]
  19. Cui, G.; Li, X.; Li, S.; Ding, S.; Li, Q.; Yang, M.; Lv, H.; Wang, Y. Varying water column stability controls the denitrification process in a subtropical reservoir, Southwest China. J. Environ. Sci. 2022, 111, 208–219. [Google Scholar] [CrossRef]
  20. Shi, J.; Wang, L.; Yang, Y.; Huang, T. A case study of thermal and chemical stratification in a drinking water reservoir. Sci. Total Environ. 2022, 848, 157787. [Google Scholar] [CrossRef]
  21. SL733-2016; Technical Code of Phytoplankton Monitoring in Inland Waters. Ministry of Water Resources of the People’s Republic of China: Beijing, China, 2016.
  22. Wei, Y.; Hu, H. The Freshwater Algae of China Systematics, Taxonomy and Ecology; Science Press: Beijing, China, 2006. [Google Scholar]
  23. Liu, Q.; Zhang, H.; Zhang, Y.; Li, D.; Gao, Y.; Li, H.; Duan, L.; Zhang, X.; Liu, F.; Xu, J.; et al. Heterogeneous bacterial communities affected by phytoplankton community turnover and microcystins in plateau lakes of Southwestern China. Sci. Total Environ. 2023, 903, 166303. [Google Scholar] [CrossRef] [PubMed]
  24. Levins, R. Evolution in Changing Environments: Some Theoretical Explorations; Princeton University Press: Princeton, NJ, USA, 1968. [Google Scholar]
  25. Zhang, J.; Zhang, B.; Liu, Y.; Guo, Y.; Shi, P.; Wei, G. Distinct large-scale biogeographic patterns of fungal communities in bulk soil and soybean rhizosphere in China. Sci. Total Environ. 2018, 644, 791–800. [Google Scholar] [CrossRef] [PubMed]
  26. Pandit, S.N.; Kolasa, J.; Cottenie, K. Contrasts between habitat generalists and specialists: An empirical extension to the basic metacommunity framework. Ecology 2009, 90, 2253–2262. [Google Scholar] [CrossRef] [PubMed]
  27. Isabwe, A.; Yang, J.R.; Wang, Y.; Liu, L.; Chen, H.; Yang, J. Community assembly processes underlying phytoplankton and bacterioplankton across a hydrologic change in a human-impacted river. Sci. Total Environ. 2018, 630, 658–667. [Google Scholar] [CrossRef] [PubMed]
  28. Skouroliakou, D.I.; Breton, E.; Irion, S.; Artigas, L.F.; Christaki, U. Stochastic and Deterministic Processes Regulate Phytoplankton Assemblages in a Temperate Coastal Ecosystem. Microbiol. Spectr. 2022, 10, e242722. [Google Scholar] [CrossRef] [PubMed]
  29. Istvánovics, V.; Honti, M. Stochastic simulation of phytoplankton biomass using eighteen years of daily data—Predictability of phytoplankton growth in a large, shallow lake. Sci. Total Environ. 2021, 764, 143636. [Google Scholar] [CrossRef] [PubMed]
  30. Hubbell, S.P. The Unified Neutral Theory of Biodiversity and Biogeography; Princeton University Press: Princeton, NJ, USA, 2001. [Google Scholar]
  31. Ning, D.; Deng, Y.; Tiedje, J.M.; Zhou, J. A general framework for quantitatively assessing ecological stochasticity. Proc. Natl. Acad. Sci. USA 2019, 116, 16892–16898. [Google Scholar] [CrossRef] [PubMed]
  32. Qin, M.; Fan, P.; Li, Y.; Wang, H.; Wang, W.; Liu, H.; Messyasz, B.; Goldyn, R.; Li, B. Assessing the Ecosystem Health of Large Drinking-Water Reservoirs Based on the Phytoplankton Index of Biotic Integrity (P-IBI): A Case Study of Danjiangkou Reservoir. Sustainability 2023, 15, 5282. [Google Scholar] [CrossRef]
  33. Liu, Y.; Liu, F.; Lin, Z.; Zheng, N.; Chen, Y. Identification of water pollution sources and analysis of pollution trigger conditions in Jiuqu River, Luxian County, China. Environ. Sci. Pollut. Res. 2024, 31, 19815–19830. [Google Scholar] [CrossRef]
  34. Borcard, D.; Gillet, F.; Legendre, P. Numerical Ecology with R, 2nd ed.; Higher Education Press: Beijing, China, 2020. [Google Scholar]
  35. Ji, F.; Han, D.; Yan, L.; Yan, S.; Zha, J.; Shen, J. Assessment of benthic invertebrate diversity and river ecological status along an urbanized gradient using environmental DNA metabarcoding and a traditional survey method. Sci. Total Environ. 2022, 806, 150587. [Google Scholar] [CrossRef]
  36. Basu, S.; Gogoi, P.; Bhattacharyya, S.; Lohith, K.K.; Das, S.K.; Das, B.K. Variability in the zooplankton assemblages in relation to environmental variables in the tidal creeks of Sundarbans estuarine system, India. Environ. Sci. Pollut. Res. 2022, 29, 45981–46002. [Google Scholar] [CrossRef] [PubMed]
  37. Yongo, E.; Mutethya, E.; Jin, F.; Zhang, P.; Lek, S.; Mo, L.; Li, J.; Guo, Z. Spatio-temporal variation in water quality and phytoplankton community structure in Changwang, Meishe, and Wuyuan Rivers in Hainan Island, China. Environ. Monit. Assess. 2023, 195, 905. [Google Scholar] [CrossRef] [PubMed]
  38. Zhang, H.; Yang, Y.; Liu, X.; Huang, T.; Ma, B.; Li, N.; Yang, W.; Li, H.; Zhao, K. Novel insights in seasonal dynamics and co-existence patterns of phytoplankton and micro-eukaryotes in drinking water reservoir, Northwest China: DNA data and ecological model. Sci. Total Environ. 2023, 857, 159160. [Google Scholar] [CrossRef] [PubMed]
  39. Guo, Q.; Meng, Q.; Wang, L.; Yu, J.; Chen, X.; Liu, D.; Li, D.; Wang, C.; Liang, F.; Ma, W.; et al. Identification of odor-causing compounds in six species of odor-producing microalgae separated from drinking water source with distinct fishy odor: Insight into microalgae growth and odor characteristics. Chemosphere 2024, 350, 141043. [Google Scholar] [CrossRef] [PubMed]
  40. Wen, C.; Li, K.; Huang, T.; Wang, S.; Tang, Y.; Wen, G.; Zhang, H.; Li, X.; Cai, X. Extending improvements of eutrophication and water quality via induced natural mixing after artificial mixing in a stratified reservoir. J. Environ. Manag. 2022, 322, 116048. [Google Scholar] [CrossRef] [PubMed]
  41. Paerl, H.W.; Gardner, W.S.; Havens, K.E.; Joyner, A.R.; McCarthy, M.J.; Newell, S.E.; Qin, B.; Scott, J.T. Mitigating cyanobacterial harmful algal blooms in aquatic ecosystems impacted by climate change and anthropogenic nutrients. Harmful Algae 2016, 54, 213–222. [Google Scholar] [CrossRef] [PubMed]
  42. Bramburger, A.J.; Reavie, E.D. A comparison of phytoplankton communities of the deep chlorophyll layers and epilimnia of the Laurentian Great Lakes. J. Great Lakes Res. 2016, 42, 1016–1025. [Google Scholar] [CrossRef]
  43. Sheng, H.; Xu, Y.; Wang, L.; Zhang, M.; Kong, L.; Cai, Q. Spatial and Temporal Variations of Phytoplankton in Danjiangkou Reservoir and its Affecting Factors. Plant Sci. J. 2011, 29, 683–690. [Google Scholar]
  44. Tan, X.; Xia, X.; Cheng, X.; Zhang, Q. Temporal and Spatial Pattern of Phytoplankton Community and Its Biodiversity Indices in the Danjiangkou Reservoir. Chin. J. Environ. Sci. 2011, 32, 2875–2882. [Google Scholar]
  45. Wang, Y.; Chen, L.; Niu, Y.; Yu, H.; Luo, M. Spatio-temporal variation in phytoplankton community and its influencing factors in Danjiangkou Reservoir. J. Lake Sci. 2016, 28, 1057–1065. [Google Scholar]
  46. Mantang, X.; Puze, W.; Shaowen, Y.E.; Gongliang, Y.U.; Jing, Y.; Jiashou, L.; Tanglin, Z. Spatio-temporal characteristics of the phytoplankton community and assessment of fish productivity in the Danjiangkou Reservoir, the wa-ter source for the South-to-North Water Diversion Project, China. J. Fish. Sci. China 2021, 28, 715–727. [Google Scholar]
  47. Wu, N.; Guo, K.; Suren, A.M.; Riis, T. Lake morphological characteristics and climatic factors affect long-term trends of phytoplankton community in the Rotorua Te Arawa lakes, New Zealand during 23 years observation. Water Res. 2023, 229, 119469. [Google Scholar] [CrossRef] [PubMed]
  48. Ding, Y.; Pan, B.; Zhao, G.; Sun, C.; Han, X.; Li, M. Geo-climatic factors weaken the effectiveness of phytoplankton diversity as a water quality indicator in a large sediment-laden river. Sci. Total Environ. 2021, 792, 148346. [Google Scholar] [CrossRef] [PubMed]
  49. Zuo, J.; Xiao, P.; Heino, J.; Tan, F.; Soininen, J.; Chen, H.; Yang, J. Eutrophication increases the similarity of cyanobacterial community features in lakes and reservoirs. Water Res. 2023, 250, 120977. [Google Scholar] [CrossRef] [PubMed]
  50. Mo, Y.; Peng, F.; Gao, X.; Xiao, P.; Logares, R.; Jeppesen, E.; Ren, K.; Xue, Y.; Yang, J. Low shifts in salinity determined assembly processes and network stability of microeukaryotic plankton communities in a subtropical urban reservoir. Microbiome 2021, 9, 128. [Google Scholar] [CrossRef]
  51. He, L.; Sun, X.; Li, S.; Zhou, W.; Yu, J.; Zhao, G.; Chen, Z.; Bai, X.; Zhang, J. Depth effects on bacterial community altitudinal patterns and assembly processes in the warm-temperate montane forests of China. Sci. Total Environ. 2024, 914, 169905. [Google Scholar] [CrossRef] [PubMed]
  52. Jiao, C.; Zhao, D.; Zhou, T.; Wu, Q.L.; Zeng, J. Habitat-specific regulation of bacterial community dynamics during phytoplankton bloom succession in a subtropical eutrophic lake. Water Res. 2023, 242, 120252. [Google Scholar] [CrossRef] [PubMed]
  53. Liu, Y.; Guo, W.; Wei, C.; Huang, H.; Nan, F.; Liu, X.; Liu, Q.; Lv, J.; Feng, J.; Xie, S. Rainfall-induced changes in aquatic microbial communities and stability of dissolved organic matter: Insight from a Fen river analysis. Environ. Res. 2024, 246, 118107. [Google Scholar] [CrossRef] [PubMed]
  54. Vikram, S.; Ramond, J.B.; Ortiz, M.; Maggs-Kölling, G.; Pelser, K.; Cowan, D.A. Soil fungal diversity and assembly along a xeric stress gradient in the central Namib Desert. Fungal Biol. 2023, 127, 997–1003. [Google Scholar] [CrossRef]
  55. Su, W.; Han, Q.; Yang, J.; Yu, Q.; Wang, S.; Wang, X.; Qu, J.; Li, H. Heavy rainfall accelerates the temporal turnover but decreases the deterministic processes of buried gravesoil bacterial communities. Sci. Total Environ. 2022, 836, 155732. [Google Scholar] [CrossRef]
  56. Wu, B.; Wang, P.; Ding, M.; Huang, G.; Zhang, H.; Yan, C.; Nie, M. Effects of anthropogenic intensity on bacterioplankton community structure in Jinjiang River. Acta Sci. Circumstantiae 2022, 42, 459–473. [Google Scholar]
  57. Yang, S.; Yang, Q.; Li, X.; Chao, X.; Liu, H.; Wei, L.; Ba, S. Deterministic processes dominate the geographic distribution pattern and community assembly of phytoplankton in typical plateau rivers. Biodivers. Sci. 2023, 31, 23092. [Google Scholar] [CrossRef]
  58. Muhid, P.; Davis, T.W.; Bunn, S.E.; Burford, M.A. Effects of inorganic nutrients in recycled water on freshwater phytoplankton biomass and composition. Water Res. 2013, 47, 384–394. [Google Scholar] [CrossRef] [PubMed]
  59. Yin, T.; Cui, Z.; Fan, P.; Lan, P.; Wang, X.; Wu, D.; Liu, H.; Chen, Z.; Li, Y.; Li, B. Spatial-temporal characteristics of inorganic anions in the Middle Route of South-North Water Diversion project in Henan province (China). Phys. Chem. Earth Parts A/B/C 2023, 132, 103450. [Google Scholar] [CrossRef]
  60. Vascotto, I.; Bernardi, A.F.; Bastianini, M.; Mozetič, P.; Finotto, S.; Francé, J. Exploring the mesoscale connectivity of phytoplankton periodic assemblages’ succession in northern Adriatic pelagic habitats. Sci. Total Environ. 2024, 913, 169814. [Google Scholar] [CrossRef] [PubMed]
  61. Noskov, Y.A.; Manasypov, R.M.; Ermolaeva, N.I.; Antonets, D.V.; Shirokova, L.S.; Pokrovsky, O.S. Environmental factors controlling seasonal and spatial variability of zooplankton in thermokarst lakes along a permafrost gradient of Western Siberia. Sci. Total Environ. 2024, 922, 171284. [Google Scholar] [CrossRef] [PubMed]
  62. Fang, L.; Liu, D.; Yang, Z.; Tian, Z. Effects of water temperature on the phytoplankton community structure. Environ. Sci. Technol. 2014, 37, 45–50. [Google Scholar]
  63. Yu, Y.; Liu, D.; Yang, Z.; Zhang, J.; Xu, Y.; Liu, J.; Yan, G. Vertical Stratification Characteristics of Dissolved Oxygen and Phytoplankton in Thousand-Island Lake and Their Influencing Factors. Environ. Sci. 2017, 38, 1393–1402. [Google Scholar]
  64. Koblížek, M.; Ferrera, I.; Kolářová, E.; Duhamel, S.; Popendorf, K.J.; Gasol, J.M.; Van Mooy, B. Growth and mortality of aerobic anoxygenic phototrophs in the North Pacific Subtropical Gyre. Appl. Environ. Microb. 2024, e3224. [Google Scholar] [CrossRef] [PubMed]
  65. Mohanty, T.R.; Tiwari, N.K.; Das, B.K.; Swain, H.S.; Jhonson, C.; Banerjee, T. Riverine connectivity influences the phytoplankton ecology in the open floodplain wetland of the lower river Ganga. Environ. Monit. Assess. 2023, 195, 1403. [Google Scholar] [CrossRef] [PubMed]
  66. Reinl, K.L.; Harris, T.D.; Elfferich, I.; Coker, A.; Zhan, Q.; De Senerpont, D.L.; Morales-Williams, A.M.; Bhattacharya, R.; Grossart, H.P.; North, R.L.; et al. The role of organic nutrients in structuring freshwater phytoplankton communities in a rapidly changing world. Water Res. 2022, 219, 118573. [Google Scholar] [CrossRef] [PubMed]
  67. Duan, Y.; Chen, X.; Huang, Y.; Zhang, Y.; Wang, P.; Duan, X.; Qin, X.; Zou, Y.; Deng, Z.; Zhao, Q. Potential risk of eutrophication in the deepest lake of Southwest China: Insights from phosphorus enrichment in bottom water. J. Contam. Hydrol. 2023, 253, 104127. [Google Scholar] [CrossRef] [PubMed]
  68. Schleyer, G.; Vardi, A. Algal blooms. Curr. Biol. 2020, 30, R1116–R1118. [Google Scholar] [CrossRef] [PubMed]
  69. Herndon, J.; Cochlan, W.P. Nitrogen utilization by the raphidophyte Heterosigma akashiwo: Growth and uptake kinetics in laboratory cultures. Harmful Algae 2007, 6, 260–270. [Google Scholar] [CrossRef]
  70. Nguyen, A.T.; Dao, T.S.; Strady, E.; Nguyen, T.; Aimé, J.; Gratiot, N.; Némery, J. Phytoplankton characterization in a tropical tidal river impacted by a megacity: The case of the Saigon River (Southern Vietnam). Environ. Sci. Pollut. Res. 2022, 29, 4076–4092. [Google Scholar] [CrossRef] [PubMed]
  71. Barrett, P.M.; Hull, E.A.; King, C.E.; Burkart, K.; Ott, K.A.; Ryan, J.N.; Gawel, J.E.; Neumann, R.B. Increased exposure of plankton to arsenic in contaminated weakly-stratified lakes. Sci. Total Environ. 2018, 625, 1606–1614. [Google Scholar] [CrossRef] [PubMed]
  72. Salmaso, N.; Albanese, D.; Capelli, C.; Boscaini, A.; Pindo, M.; Donati, C. Diversity and Cyclical Seasonal Transitions in the Bacterial Community in a Large and Deep Perialpine Lake. Microb. Ecol. 2018, 76, 125–143. [Google Scholar] [CrossRef] [PubMed]
  73. Schweitzer-Natan, O.; Ofek-Lalzar, M.; Sher, D.; Sukenik, A. Particle-Associated Microbial Community in a Subtropical Lake During Thermal Mixing and Phytoplankton Succession. Front. Microbiol. 2019, 10, 2142. [Google Scholar] [CrossRef]
  74. Varol, M. Phytoplankton functional groups in a monomictic reservoir: Seasonal succession, ecological preferences, and relationships with environmental variables. Environ. Sci. Pollut. Res. 2019, 26, 20439–20453. [Google Scholar] [CrossRef]
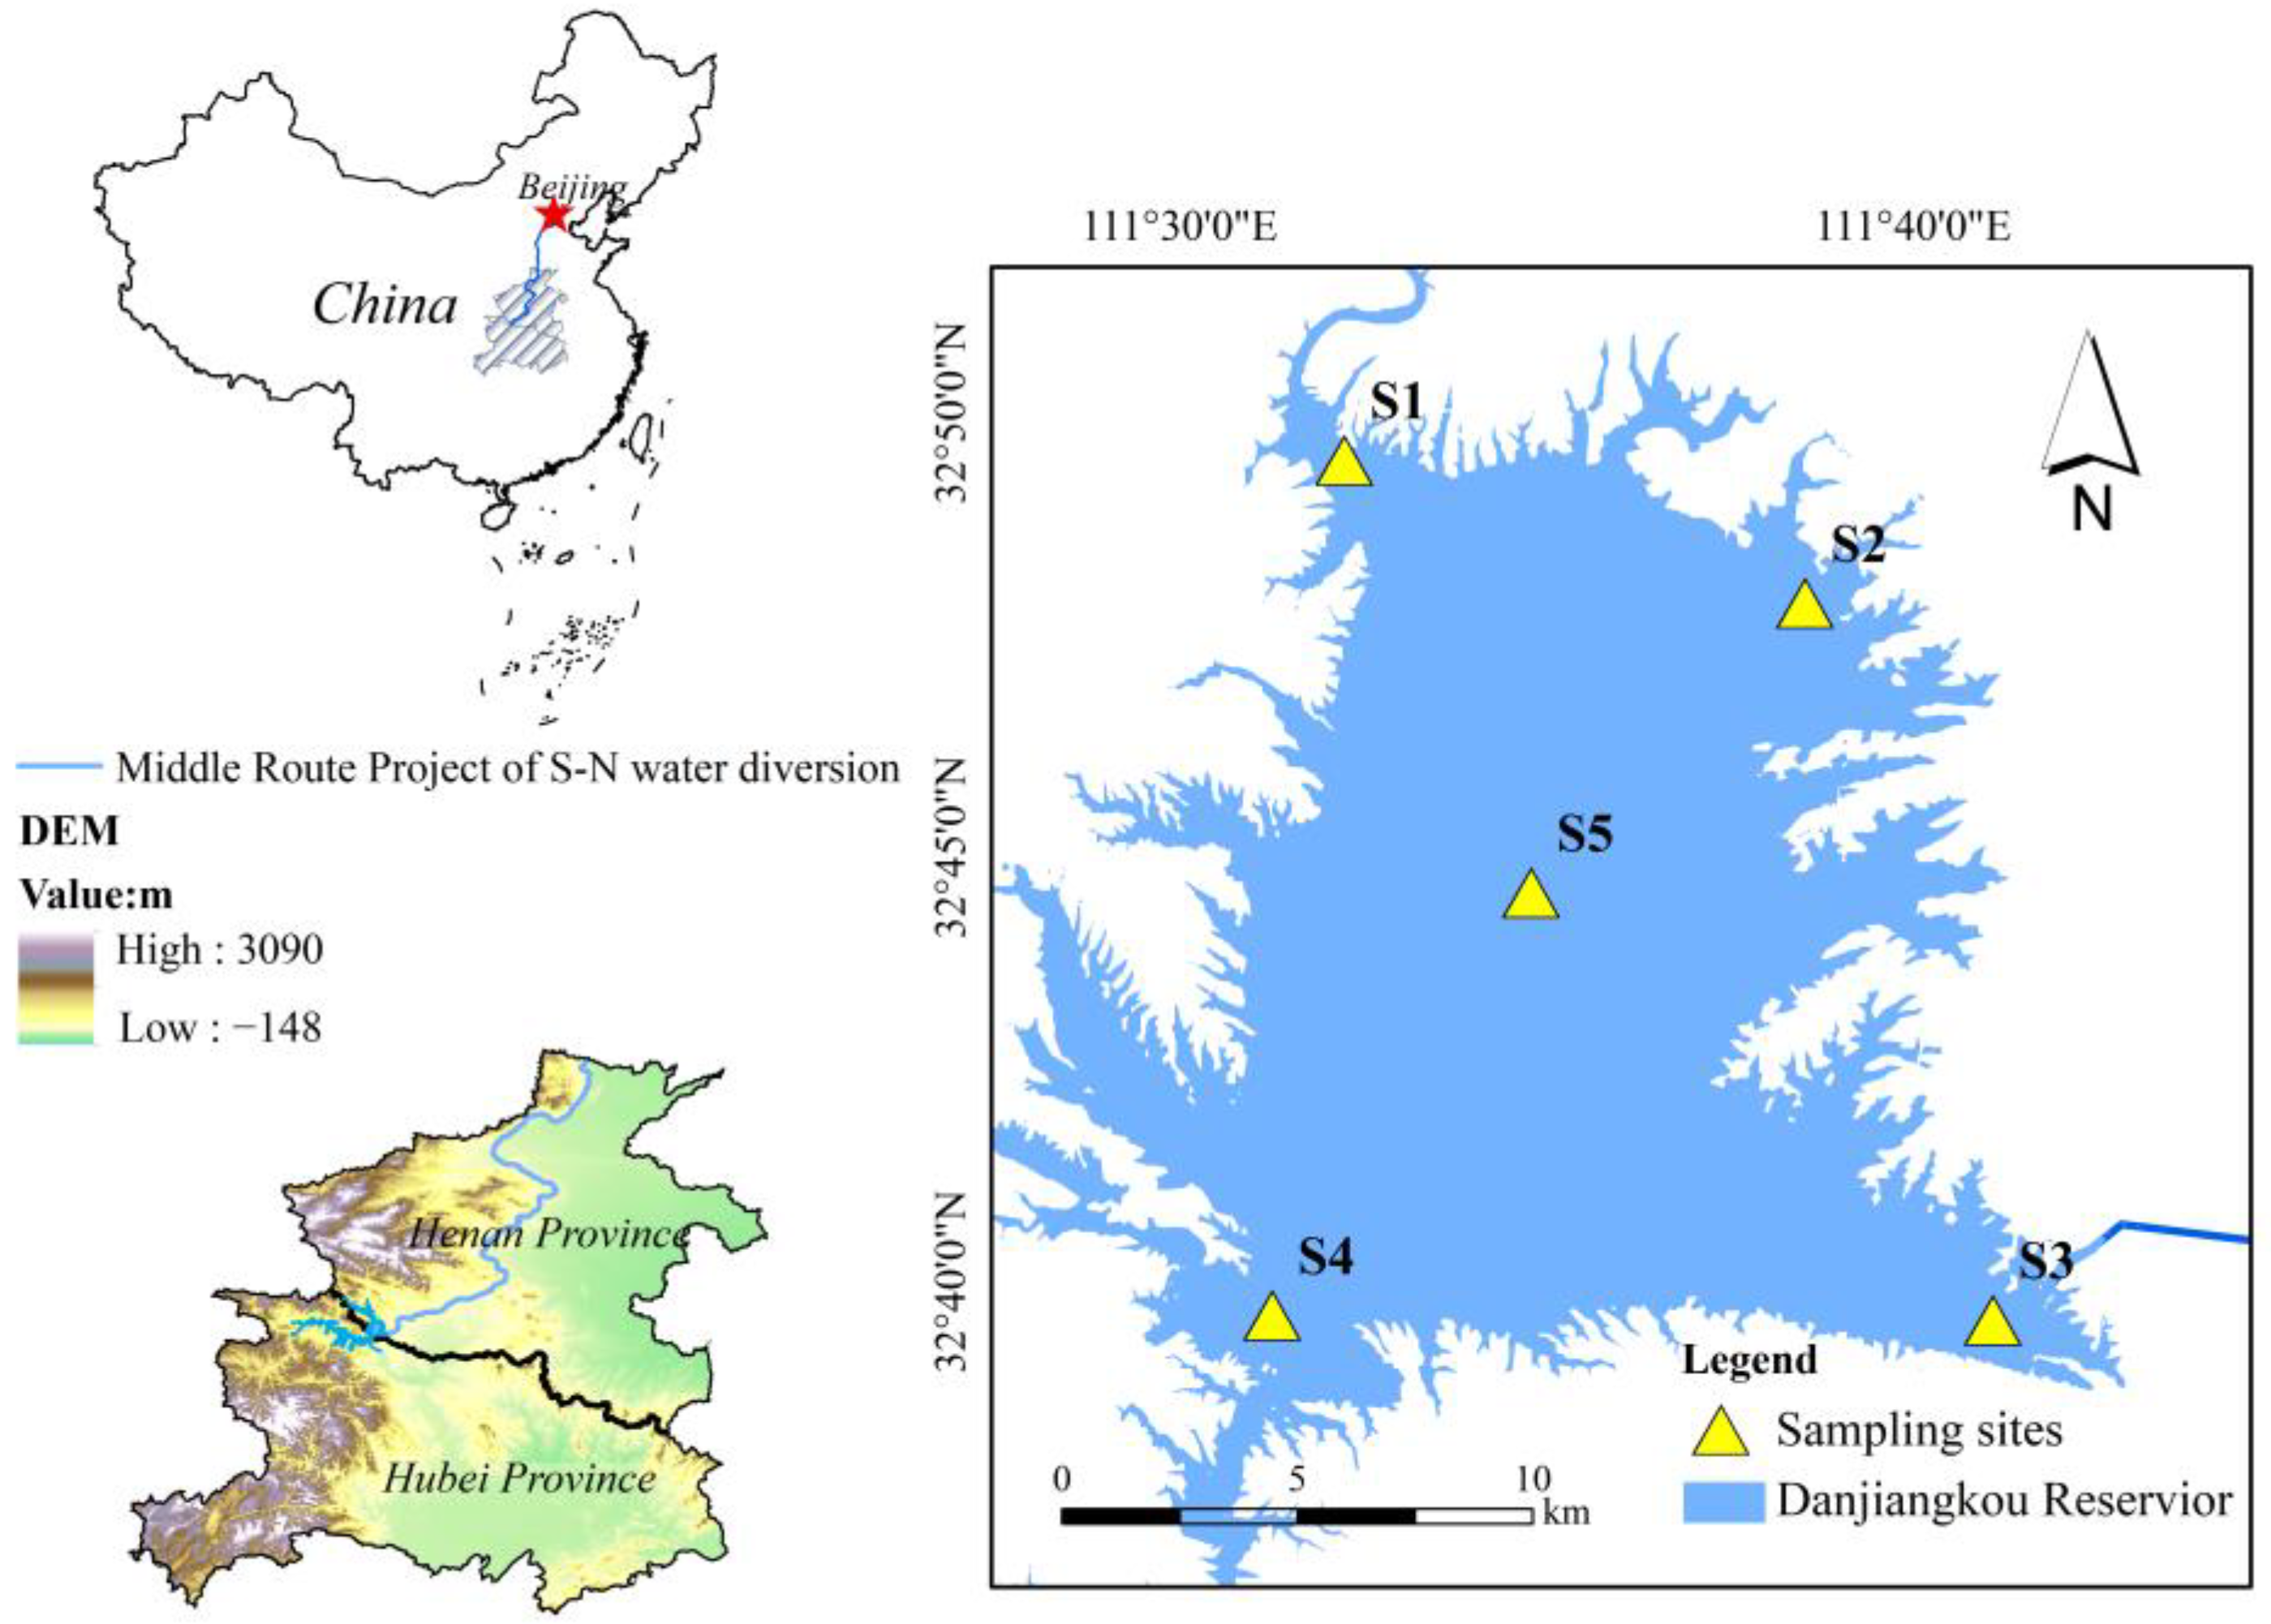
Figure 1. Sketch map of the sampling points in Danjiangkou Reservoir.
Sustainability 16 03058 g001
Figure 2. Vertical water temperature variation (A) and linear regression analysis of RWCS/H with air temperature and water temperature (B).
Sustainability 16 03058 g002
Figure 3. Spatiotemporal distribution of phytoplankton abundance (A) and species proportion (B).
Sustainability 16 03058 g003
Figure 4. Phytoplankton alpha diversity index (A) and Bate diversity index (B). In (A), the upper limit of the box represents the upper quartile, the lower limit represents the lower quartile, the dots represent the outlier, and the whiskers represents the standard deviation of this set of data; in (B), the dashed line is the 95% confidence ellipse.
Sustainability 16 03058 g004
Figure 5. Spatiotemporal distribution of MST (A) and niche breadth (B). Different lowercase letters represented significant differences at p < 0.05. The columns represent the mean, the whiskers represent the standard deviation, the dots in (A) represent the value upon comparison of the different sampling points, and the dots in (B) represent the niche breadth.
Sustainability 16 03058 g005
Figure 6. CCA of phytoplankton communities and environmental factors (A) and Mantel correlation analysis between phylum level of abundance and environmental factors (B).
Sustainability 16 03058 g006
Figure 7. Heatmap of correlation between dominant phytoplankton species abundance and environmental parameters. The size of the circular dot is used to show the magnitude of the correlation coefficient, the color is used to show the positive and negative correlation coefficient, and the square color block is used to show the p value of the correlation test.
Sustainability 16 03058 g007
Table 1. Variation in vertical environment factor parameters in Danjiangkou Reservoir.
ParametersSurface LayerThermoclineBottom Layer
WT (°C)22.68 ± 5.1815.58 ± 4.9213.82 ± 5.20
pH8.47 ± 0.418.23 ± 0.448.29 ± 0.52
Cond (μS/cm) 349.53 ± 21.69 284.63 ± 52.48 301.7 ± 29.49
TDS (mg/L) 187.75 ± 18.51 193.34 ± 18.58 193.08 ± 16.11
ORP (mV)146.49 ± 95.5299.37 ± 116.11176.19 ± 81.11
DO (mg/L) 9.97 ± 1.63 7.14 ± 2.19 5.25 ± 3.55
CODMn (mg/L)2.34 ± 0.782.50 ± 1.042.45 ± 1.16
TOC (mg/L)0.54 ± 0.250.56 ± 0.340.83 ± 1.43
TP (mg/L)0.022 ± 0.010.024 ± 0.010.030 ± 0.01
TN (mg/L)1.64 ± 0.591.66 ± 0.541.86 ± 0.47
NO3-N (mg/L)0.922 ± 0.390.991 ± 0.451.141 ± 0.45
NH4+-N (mg/L)0.174 ± 0.130.204 ± 0.140.219 ± 0.12
Note: Values are arithmetic means ± standard deviations.
Disclaimer/Publisher’s Note: The statements, opinions and data contained in all publications are solely those of the individual author(s) and contributor(s) and not of MDPI and/or the editor(s). MDPI and/or the editor(s) disclaim responsibility for any injury to people or property resulting from any ideas, methods, instructions or products referred to in the content.