Article

Land Cover Patterns of Urban Lots and Their Contribution to Ecological Functions

by
Marise Barreiros Horta
1,2,*,
Sònia Maria Carvalho-Ribeiro
2,
Jean François Mas
3,
Francisco Medeiros Martins
4,
Fernando de Moura Resende
1,
Fernando Figueiredo Goulart
1 and
Geraldo Wilson Fernandes
1
1
Departamento de Genética, Ecologia & Evolução, Instituto de Ciências Biológicas, Universidade Federal de Minas Gerais, Belo Horizonte 31270-901, MG, Brazil
2
Programa de Pós-Graduação em Análise e Modelagem de Sistemas Ambientais, Instituto de Geociências, Universidade Federal de Minas Gerais, Belo Horizonte 31270-901, MG, Brazil
3
Centro de Investigaciones en Geografia Ambiental, Universidad Nacional Autónoma de México, Morelia 58190, Mexico
4
Faculdade de Ciências Biológicas e da Saúde, Universidade Federal dos Vales do Jequitinhonha e Mucuri, Diamantina 39100-000, MG, Brazil
*
Author to whom correspondence should be addressed.
Sustainability 2024, 16(7), 3063; https://doi.org/10.3390/su16073063
Submission received: 14 January 2024 / Revised: 15 March 2024 / Accepted: 19 March 2024 / Published: 7 April 2024
(This article belongs to the Special Issue Urban Green Areas: Benefits, Design and Management Strategies)

Abstract

:
The green infrastructure of urban lots performs socio-ecological functions and provides several ecosystem services (ESs) in urban environments. By assessing the land cover patterns of such sites, one can deduce ecological functions and potential ESs. We represented the various land cover combinations of lots by mapping and classifying the vegetation quality of 2828 lots in the city of Belo Horizonte, Southeast Brazil. We performed cluster analysis of land cover with weighting according to ecological functions, potential for ES provision, and performance. Most lots (1024, 36.21%) were in the moderate vegetation quality class (trees/native vegetation between 25% and 50% or >50% herbaceous-shrubby vegetation), which included the largest plot of 383,300 m2 and a median plot size of 403 m2. A total of 244 (8.63%) lots were in the highest vegetation quality class (trees/native vegetation between >50% and 100%). The lots included diverse vegetation cover combinations of up to ten land cover types, with two dominant types: herbaceous-shrubby vegetation and tree clumps. Among the four land cover patterns obtained, those covered by tree clusters (1193 lots; 42.18%) had the highest ecological performance and the greatest potential for regulating and supporting ESs. This cluster had the highest average land cover of tree clumps (49%) and the highest averages for native vegetation formations (2–6%). Our study showed a variety of land cover patterns and an expressive percentage of lots with capabilities to provide ecological functions and ESs, which can support urban sustainability policies that have yet to be addressed.

1. Introduction

Urban landscapes are usually concentrated in constructed and impermeable areas, with most lacking green infrastructure [1,2,3,4]. These green spots are composed of strategically planned networks of natural and semi-natural areas designed and managed to provide a wide range of ecosystem services, including biodiversity enhancement [5,6]. Urban landscapes are marked by dominant human action, being characterized by environmental degradation through pollution, construction, and establishment of concrete infrastructure, as well as by the constant creation of new land cover [7,8,9]. The land cover of cities includes a complexity of components such as built-up areas, streets and access roads, bare soil, water, grassy fields, forest remnant areas, isolated trees, and unoccupied spaces, among others [10,11]. The constant dynamics of land use change directly affect ecological systems and biodiversity through habitat fragmentation and loss, which results in the isolation of species and changes in community composition and resilience, and, hence, the loss of ecosystem services [12,13,14,15,16]. The greater the extent of city sprawl and the higher the urbanization level, the greater the landscape fragmentation and environmental degradation, with a growing replacement of ecological functions by human functions, thus reducing the capacity of ecological systems to contribute to human well-being and quality of life [17,18,19,20]. The reversal of this scenario to a more sustainable one is consequently among the greatest challenges to overcome in the future [21,22,23,24,25,26].
In larger cities, many ecosystem services are generated on a small scale, often being defined by vegetation patches or even individual trees [27]. Among the various types of urban land cover, vegetation is the largest provider of urban ecosystem services [28]. It plays a main role in urban areas by regulating microclimate, water supply, air filtration, noise, rainwater drainage, and sewage treatment. It also has cultural and aesthetic value, providing scenic beauty and a sense of identity, as well as areas for economic, commercial, and residential activities [29]. Vegetation influences the climate of cities, with positive impacts on wind, temperature, humidity, and precipitation regimes [30]. Although carbon dioxide emissions are largely attributed to urban environments, a city’s green areas capture and store carbon, minimizing some of the negative effects of greenhouse emissions [31,32]. The urban vegetation itself includes a set of spontaneous, cultivated, introduced and native plant species that are part of urban woods, parks, street trees, protected green areas, backyards, gardens, and other green spaces [33,34]. The degree to which vegetation contributes to the provision of ecosystem services varies according to the characteristics of its components in terms of physiognomy, life forms, and structure, e.g., [4,28,35].
The evaluation of ecosystem services relies largely on land cover- and use-based assessments that are suitable for large scale studies, or to areas where the principal service relates directly to land use. Land cover and its patterns are key elements in ecological studies because they can translate the impacts of human actions on natural ecosystems while allowing for an assessment of the ecological functions and potential ecosystem services of the remaining environments [36,37,38,39,40,41]. One of the major problems in improving the provision of ecosystem services in urban landscapes relates to the scarcity of available areas, with conflicts being prominent over such remaining sites [42]. Under these conditions, vacant lots stand out as potential places for the enhancement of ecosystem services and green infrastructure [43,44]. Vacant lots have different origins and may have been created as permanent zones in areas where buildings are prohibited or may be the result of destruction and abandonment due to migration, demographic changes, deindustrialization, urban sprawl, or people’s preferences for new types of residential choices [4,45]. These spaces include either land that has remained vacant during the city sprawl around them or land that was previously occupied and was abandoned at a certain point in time [46]. Vacant lots can also result from a response to differences and inequalities in access to urban land, the impact of a deregulated market, and real estate speculation, as is the case in many developing countries [47].
Regardless of their origin, vacant lots are mostly recognized as a social, economic, environmental, and aesthetic problem, having become symbols of decay, degradation, and neglect [48,49]. They are, however, key elements for the implementation of socio-environmental and economic development strategies, offering opportunities for transformations that favor urban sustainability [50,51,52,53]. These underutilized spaces can offer perspectives for transformations of urban land use that contribute to community development and the provision of ecosystem services to form a social and ecological infrastructure in cities [43,53]. In addition, they may represent a key element in reaching sustainability, see [54,55], while policies are not built and implemented at satisfactory levels in urban environments in terms of just land tenure, social development, and environmental conservation.
In many places around the world, vacant lots have been mapped and characterized according to their ecosystem services and have served many activities, functioning as places for education and research, community gardens, vegetable farming, recreation, rest, accessibility, biodiversity restoration, wildlife resources, and conservation, among others [50,56,57]. These areas, therefore, play a multifunctional role in aggregating several ecosystem services, including provisioning (e.g., food production), regulating (e.g., carbon storage, air pollution removal, local temperature regulation, runoff mitigation), supporting (e.g., habitat provision for biodiversity, pollination), and cultural (e.g., recreation) services [58]. Thus, characterizing urban vacant lots in terms of land cover patterns is important in order to achieve a better understanding the processes of vacancy in cities and to contribute to the design of alternative uses of these sites [53]. This approach can temporarily and partially aid parties in reaching the Sustainable Development Goals (SDGs), especially number 11 (Sustainable Cities and Communities), which aim at developing inclusive, safe, resilient, and sustainable cities [59].
In this context, the main goal of the present study was to characterize the land cover patterns of vacant lots associated with different ecosystem services occurring in the urban landscape of a large city in Southeast Brazil. Investigating the potential of vacant lots for provisioning ecological functions and related regulatory and habitat services overcomes the fact that, in urban areas, such lots are often mostly valued for cultural services, such as recreation and physical activities. We assumed that the land cover of these lots, and its vegetation component, mainly performed regulatory (water infiltration and storage, microclimate regulation, air purification and filtration, carbon sequestration and storage, soil conservation) and habitat (habitat provisioning, biodiversity conservation) functions. Other functions are either rarer in the urban landscape or require quantification and are not directly extracted from land cover [27]. A novel highlight of the present study is that it details the vegetation cover of vacant lots. Most studies usually make use of vegetation and greenness indices (NDVI—Normalized Difference Vegetation Index, e.g., [53,58,60]). Hence, land cover has been characterized through variation in vegetation quality. This concept has been most frequently included in evaluations of the environmental sensitivity of critical areas for the definition of degradation and desertification levels, whereby vegetation quality indexes are developed and assessed along with soil conditions and climate [61,62]. The present study uses a combination of different methodologies to characterize vacant lots according to their vegetation quality based on land cover rating, land cover patterns, ecological functions, and potential for provisioning ecosystem services, which can contribute to the formulation of actions and public policies aimed at urban sustainability.

2. Materials and Methods
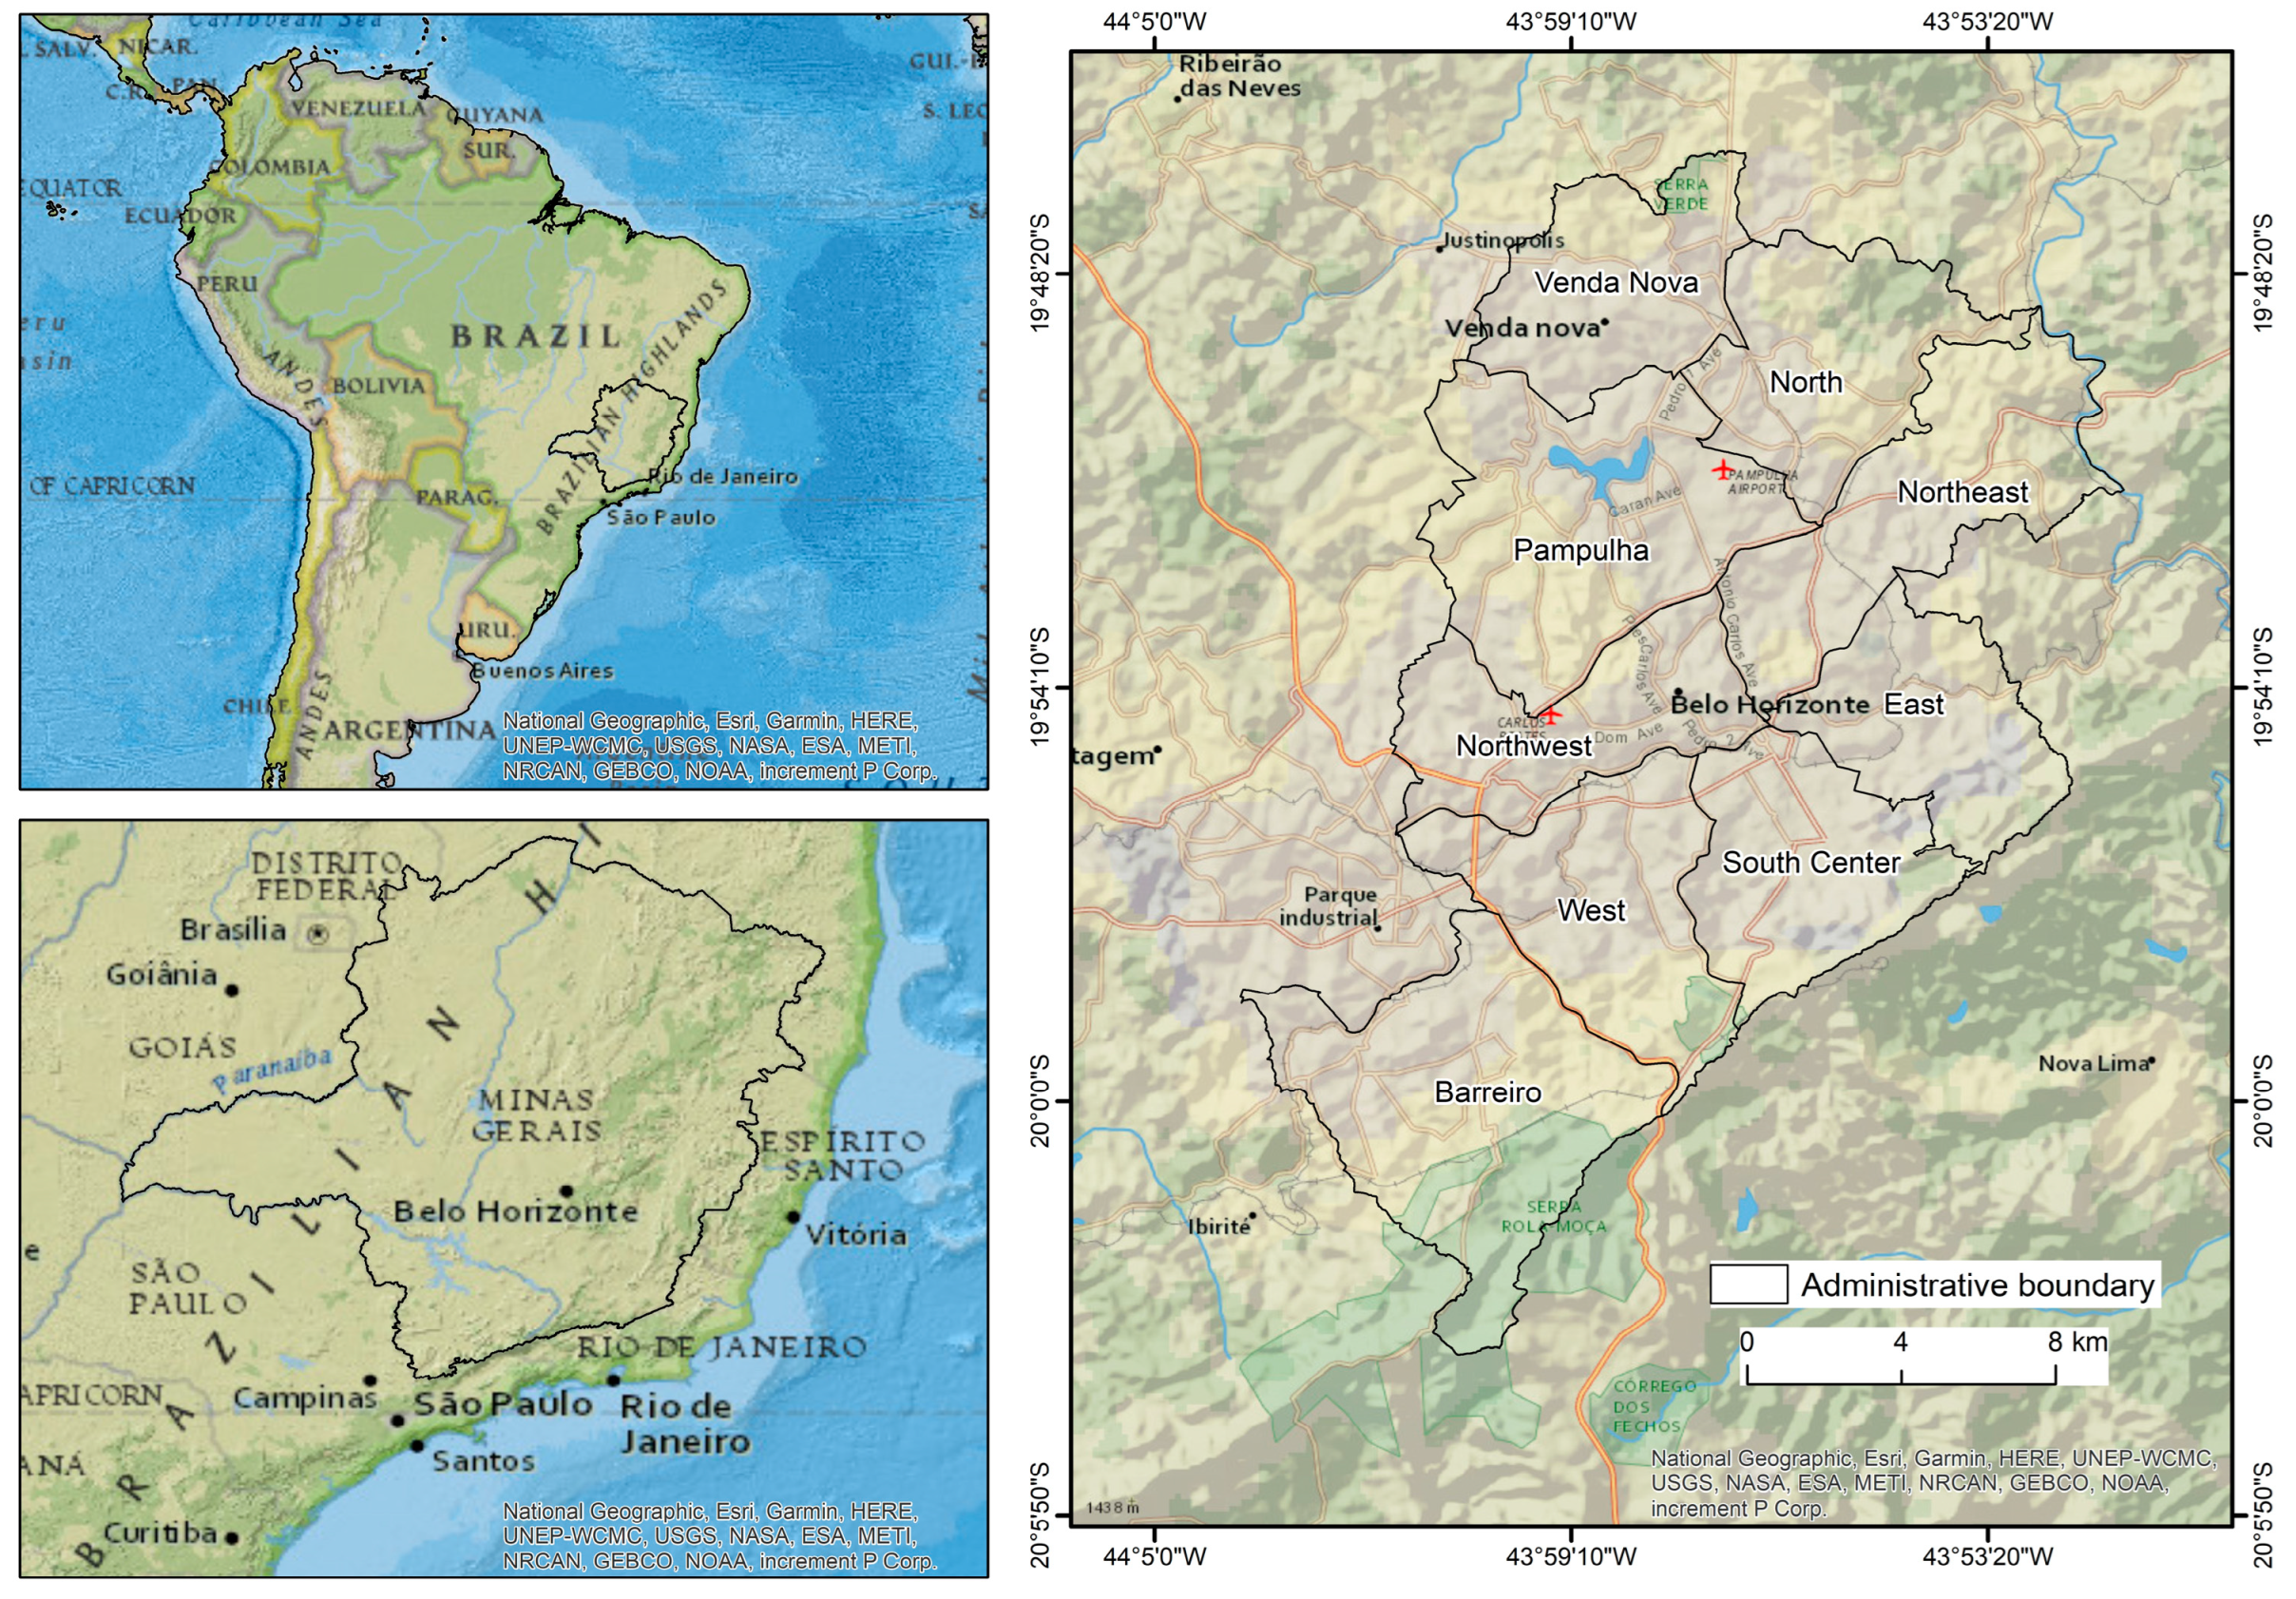
2.1. Study Area

The study was conducted in the city of Belo Horizonte, capital of the state of Minas Gerais, in Southeast Brazil. This municipality has an average elevation of 900 m and a climate classified as tropical savanna (aw), with average temperatures ranging between 15 °C and 28 °C. It is located at the transition between the Atlantic Forest and Cerrado (savanna) [63,64]. It encompasses ca. 33,100 hectares and has a population of ca. 2.6 million. The city is divided into the following nine administrative zones, delimited from its location and occupation history: Barreiro, East, North, Northeast, Northwest, Pampulha, South Center, West and Venda Nova (Figure 1).

2.2. Urban Lot Dataset and Sampling Design

The official database of urban vacant lots in Belo Horizonte was primarily designed in 2008 for control over the incidence of taxes in built-up areas of the city. The dataset used in this study consists of an official municipal map with associated information about the vacant lots of city, including information on land ownership (public or private) provided by Belo Horizonte city hall (Prodabel/PBH). A representative sample was selected from the total of 26,906 vacant lots to obtain a 95% confidence level of the entire population of lots in the city and for each administrative unit. The equation used was n = N.Z2 * p * (1 − p)/Z2 * p * (1 − p) + e2 * (N − 1), where n is the calculated sample; N is the population; Z is the normal variable; p is the actual probability of the event; and e is the sampling error [65]. A total of 2828 vacant lots (11% of all lots) were randomly selected, with the estimated samples for the 9 administrative units being: Barreiro: 311 sampled lots, 11% of the total lots of the administrative unit; East: 207, 7%; North: 277, 10%; Northeast: 349, 12%; Northwest: 208, 7%; Pampulha: 407, 15%; South Center: 355, 13%; West: 346, 12%; and Venda Nova: 368, 13%.
City zoning regarding the occupation of areas and the allowed population density was used to determine the expected soil permeability rates for the sampled lots. The various regions of the city were zoned according to the expected population occupation given the characteristics of the areas: presence of physical and topographical adversities, lack of infrastructure for water supply or sewage, and degrees of saturation of the road systems [66,67,68]. The definitions of these zones determined standards related to the rate of permeability of the soil, which must be met for the construction of buildings. The expected soil permeability rate available for the six zones represented by the sampled lots was between 10% and 20%, according to municipal rules for the areas where the lots are located (ZA = dense zone; ZAR1/2 = restricted densification zone; ZAP = preferential density zone; ZHIP = hyper-central zone; ZCBH = central zone of Belo Horizonte; ZCBA = central area of Barreiro) [69].

2.3. Land Cover Mapping

Land cover mapping was performed using a high-resolution satellite image taken by GeoEye (24 September 2016, 41 cm resolution, provided by Prodabel/PBH) and a digitized map of the boundaries of the 2828 sampled urban lots. Each individual lot was interpreted in detail utilizing QGIS 2.18.11 and ArcView GIS software, ArcMap 10.3 (ESRI, Redlands, CA, USA). Ten land cover components were identified for the lots, namely: agriculture, bare soil, forest in an advanced–intermediate stage of regeneration, forest in the initial stage of regeneration, herbaceous-shrubby vegetation, impermeable surface (asphalt, cement, construction), pasture, savanna (Cerrado), tree clumps or tree groupings, and water. Considering the occurrence of lots with use in the database and sampling, for the used lots, land use mapping was carried out using the same methodology and materials adopted for the vacant lots (for types and definitions see Table S1 in Supplementary Material). The elucidation of land use for these lots allowed for a concise examination of the dynamics of their use in recent years by comparing data from 2017 with a database provided for 2008, the year that the registration of vacant lots in the city began.
Differentiation of the types of successional stages of forests, and of these in relation to tree clumps, was carried out by observing the presence of remnants of forest formations in the surroundings, attesting to the continuity with the vegetation of the lot. The interpretation of the various land cover classes and land use was based on the literature on national, regional, and local phytogeography. This was performed by a single person to avoid the propagation of errors [70,71]. A visual interpretation of key elements in the high-resolution satellite image (e.g., texture, pattern, shape, size, height/elevation, and location/association) was carried out for the purpose of mapping land cover and land use, the latter only for cases of used lots that were found in the database [71]. Vegetation studies of forest remnants in Belo Horizonte were also used, covering sampling of georeferenced lots in the field, including information on the maximum, average, and minimum diameters and heights of the trees, which allowed the successional forest stage of remnants to be determined [72,73]. Forest succession stages were defined according to the Resolution of the National Environment Council (Resolução Conama 392/2007), which defines the primary and secondary vegetation of the Atlantic Forest in the state of Minas Gerais [74]. According to this law, a forest in the advanced stage of regeneration possesses an upper canopy with trees above 12 m and an average trunk diameter of 18 cm. A forest in the intermediate stage of regeneration possesses an upper strata between 5 and 12 m and mean trunk diameters between 10 and 20 cm. A forest in the early stage of regeneration possesses an upper canopy with trees up to 5 m and average diameters up to 10 cm. Given the difficulty of separation and the occurrence of situations where the two forest physiognomies (advanced and intermediate) were merged, a forest in an advanced stage of regeneration made up a single class, along with that in the intermediate stage. The vegetation of the Cerrado was mainly composed of a grassland matrix, with shrubs and grasses (Campo Sujo), or denser vegetation, with some trees and treelets on the aforementioned grassland matrix (Campo Cerrado) (see [75,76,77]).
Aiming to represent each lot as a mapping unit, vegetation quality classes were created based on the vegetation composition and land cover of each lot: low, moderate, high, and very high. Absence of vegetation was included in the categories “no vegetation permeable” (with bare soil present) or “no vegetation impermeable” (with total presence of impermeable surfaces such as asphalt, cement, and construction). Percentages of occurrence of each land cover type were obtained by visual estimation. Vegetation quality is usually verified through land cover, and may include various quantifiable factors such as the role of vegetation in soil erosion protection and in drought resistance, as well as plant cover, among others (Hadeel et al., 2010). The classification of vegetation quality in the present study was conducted according to the characteristics of the components that had higher percentages of occurrence, namely, the structural complexity related to size, ranging from herbaceous and low shrub vegetation to arboreal vegetation with mature trees, and whether the lot was a remnant of native vegetation, as in the case of forests and savannas (Table 1).
Low vegetation quality was considered for lots with up to 50% of elementary vegetation, such as herbaceous-shrubby vegetation, pasture, agriculture, or for those with a low occurrence of arboreal vegetation (up to 25%), including native remnants. Lots classified as belonging to the moderate vegetation quality class presented structurally complex vegetation composed of forests in the advanced-intermediate stages of regeneration, forests in the initial stage of regeneration, tree clumps, and savanna, in percentages between 25% and 50%. Also represented in this class were lots with herbaceous-shrubby vegetation, pasture, and agriculture with percentages between 50% and 100%. Lots included in the high vegetation quality class possessed in their composition only arboreal vegetation, native forest, or savanna cover occurring in percentages between 50% and 75%. The class of very high vegetation quality also gathered exclusively trees and natural forest and savanna vegetation (forests in the advanced-intermediate stages, forests in the initial stage, tree clumps, savanna) with cover between 75% and 100%. Lots with no vegetation, but which were composed of permeable components (e.g., bare soil), were classified as no vegetation permeable, while lots fully occupied by impermeable surfaces were classified as no vegetation impermeable. Elucidation of the different components of the lots also made it possible to quantify their percentages of permeability and place them into percentage classes (0–25%, >25–50%, >50–75%, >75–100%).

2.4. Land Cover Clusters and Ecological Performance

We used cluster analysis to extract general and more homogeneous information representing the complexity of the land cover combinations of the surveyed lots. Cluster analysis is a statistical method for identifying groups in raw data in order to help users find structure [78]. Through clustering of the data by machine learning processes, input data are partitioned into subsets so that each one shares common traits, as they are divided into reasonably homogeneous groups or clusters [79,80]. We used this method because the vegetation quality classes, which mainly portray the dominant land cover, among others, that can occur in a single plot, could not be directly translated into ecological functions. The ecological functions, on the other hand, could be derived from each land cover type through cluster analysis. To proceed with the mapping of ecological functions, we first selected the most appropriate ecological functions for interpretation only through land cover—as assumed for this research—and consulted a group of ten experts to obtain their assessments of the importance of each land cover type for each function. The chosen ecological functions obtained from the literature comprised those most easily observed in urban environments and those more easily interpreted through land cover, including regulating functions and habitat functions [81,82,83]. These ecological functions can be translated as potential regulating services (water infiltration and storage, microclimate regulation, air purification and filtration, carbon sequestration and storage, soil conservation) and supporting ecosystem services (habitat provisioning, biodiversity conservation).
To obtain an expert opinion for mapping ecological functions, we built a matrix adapted from Burkhard et al. (2009) [84] containing the seven ecological functions investigated on the x axis and the ten land cover types on the y axis, the latter comprising agriculture, bare soil, forest in the advanced-intermediate stages of regeneration, forest in the initial stage of regeneration, herbaceous-shrubby vegetation, impermeable surfaces, pasture, savanna, tree clumps, and water. The consulted experts consisted of ten professionals in the fields of botany, vegetation cover mapping, and environmental sciences from both the private and public sectors. They were consulted via email and were asked to provide weights from 0 to 4 for each given land cover type according to its importance or contribution to each of the ecological functions, namely: 0 = no importance or contribution to the ecological function considered; 1 = low importance or contribution to the ecological function considered; 2 = moderate importance or contribution to the ecological function considered; 3 = high importance or contribution to the ecological function considered; and 4 = very high importance or contribution to the ecological function considered. The final weighted matrix of the ecological functions of each land cover type was obtained by calculating their average (Table S2 in Supplementary Material).
Cluster analysis was performed using IBM SPPS Statistics and the input data referring to the percentages of each land cover type for each lot—with a maximum total of 100%—obtained from the interpretation of key features from the high-resolution satellite image GeoEye 2016. The 2828 lots were included in the analysis, and the land cover types not found in any of the lots were given zero values. The program R and the specific NbClust package were used to determine the relevant number of clusters in the dataset, thus avoiding an arbitrary choice of clusters that did not reflect the ideal homogeneity for interpretation [85,86]. With the definition of the optimal number of clusters being four, the results of the processing phase were worked according to the resulting average percentage of land cover per cluster, and a matrix of the average percentage of each land cover per cluster was generated. It is worth noting that, in cluster analysis, each observation or sample belongs to the group closest to its average, in this case the average percentage of land cover in the lot. The resulting cluster matrix with the average percentages was then used to calculate the ecological function value of each cluster, which corresponded to the weighted sum of the weights provided by the experts to each land cover type (Table S2 in Supplementary Material) multiplied by the land cover percentage for that specific cluster and divided by the total percentage, around 100% (99–102%), as follows:
EF1….7 C1…4 = Ʃ (LC% 1…10/LCT% × EF1…7 W1…10)
  • EF1…7—ecological function from 1 to 7;
  • C1…4—cluster from 1 to 4;
  • Ʃ—sum;
  • LC%—land cover percentage for each land cover type in each of the clusters;
  • LCT%—land cover total percentage or sum of all percentages for each land cover type;
  • EF1…7 W1….10—ecological function from 1 to 7, weight of each ecological function for the 10 land cover types.
The ecological performance evaluated herein was adapted from Lovell et al. (2010) [82], which used a measure of landscape performance based on the sum of the values of the various ecological functions. Similarly, the ecological performance for each cluster in the present study was defined and calculated as the total sum of the results of each ecological function. According to the characteristics of the data, the maximum value that could be obtained for the ecological performance of each cluster was 28, considering that 7 ecological functions were analyzed, each with a maximum weight of 4. Thus, for the evaluation of ecological performance, low-performance results are those ranging from >0 to 7, moderate from >7 to 14, high from >14 to 21, and very high from >21 to 28. The calculations made to obtain the full values of ecological performance were as follows:
EP1….7 C1…4 = Ʃ EF1….7
  • EP1….7—ecological performance for ecological functions 1 to 7;
  • C1…4—cluster from 1 to 4;
  • Ʃ—sum;
  • EF1….7—ecological function from 1 to 7.

3. Results

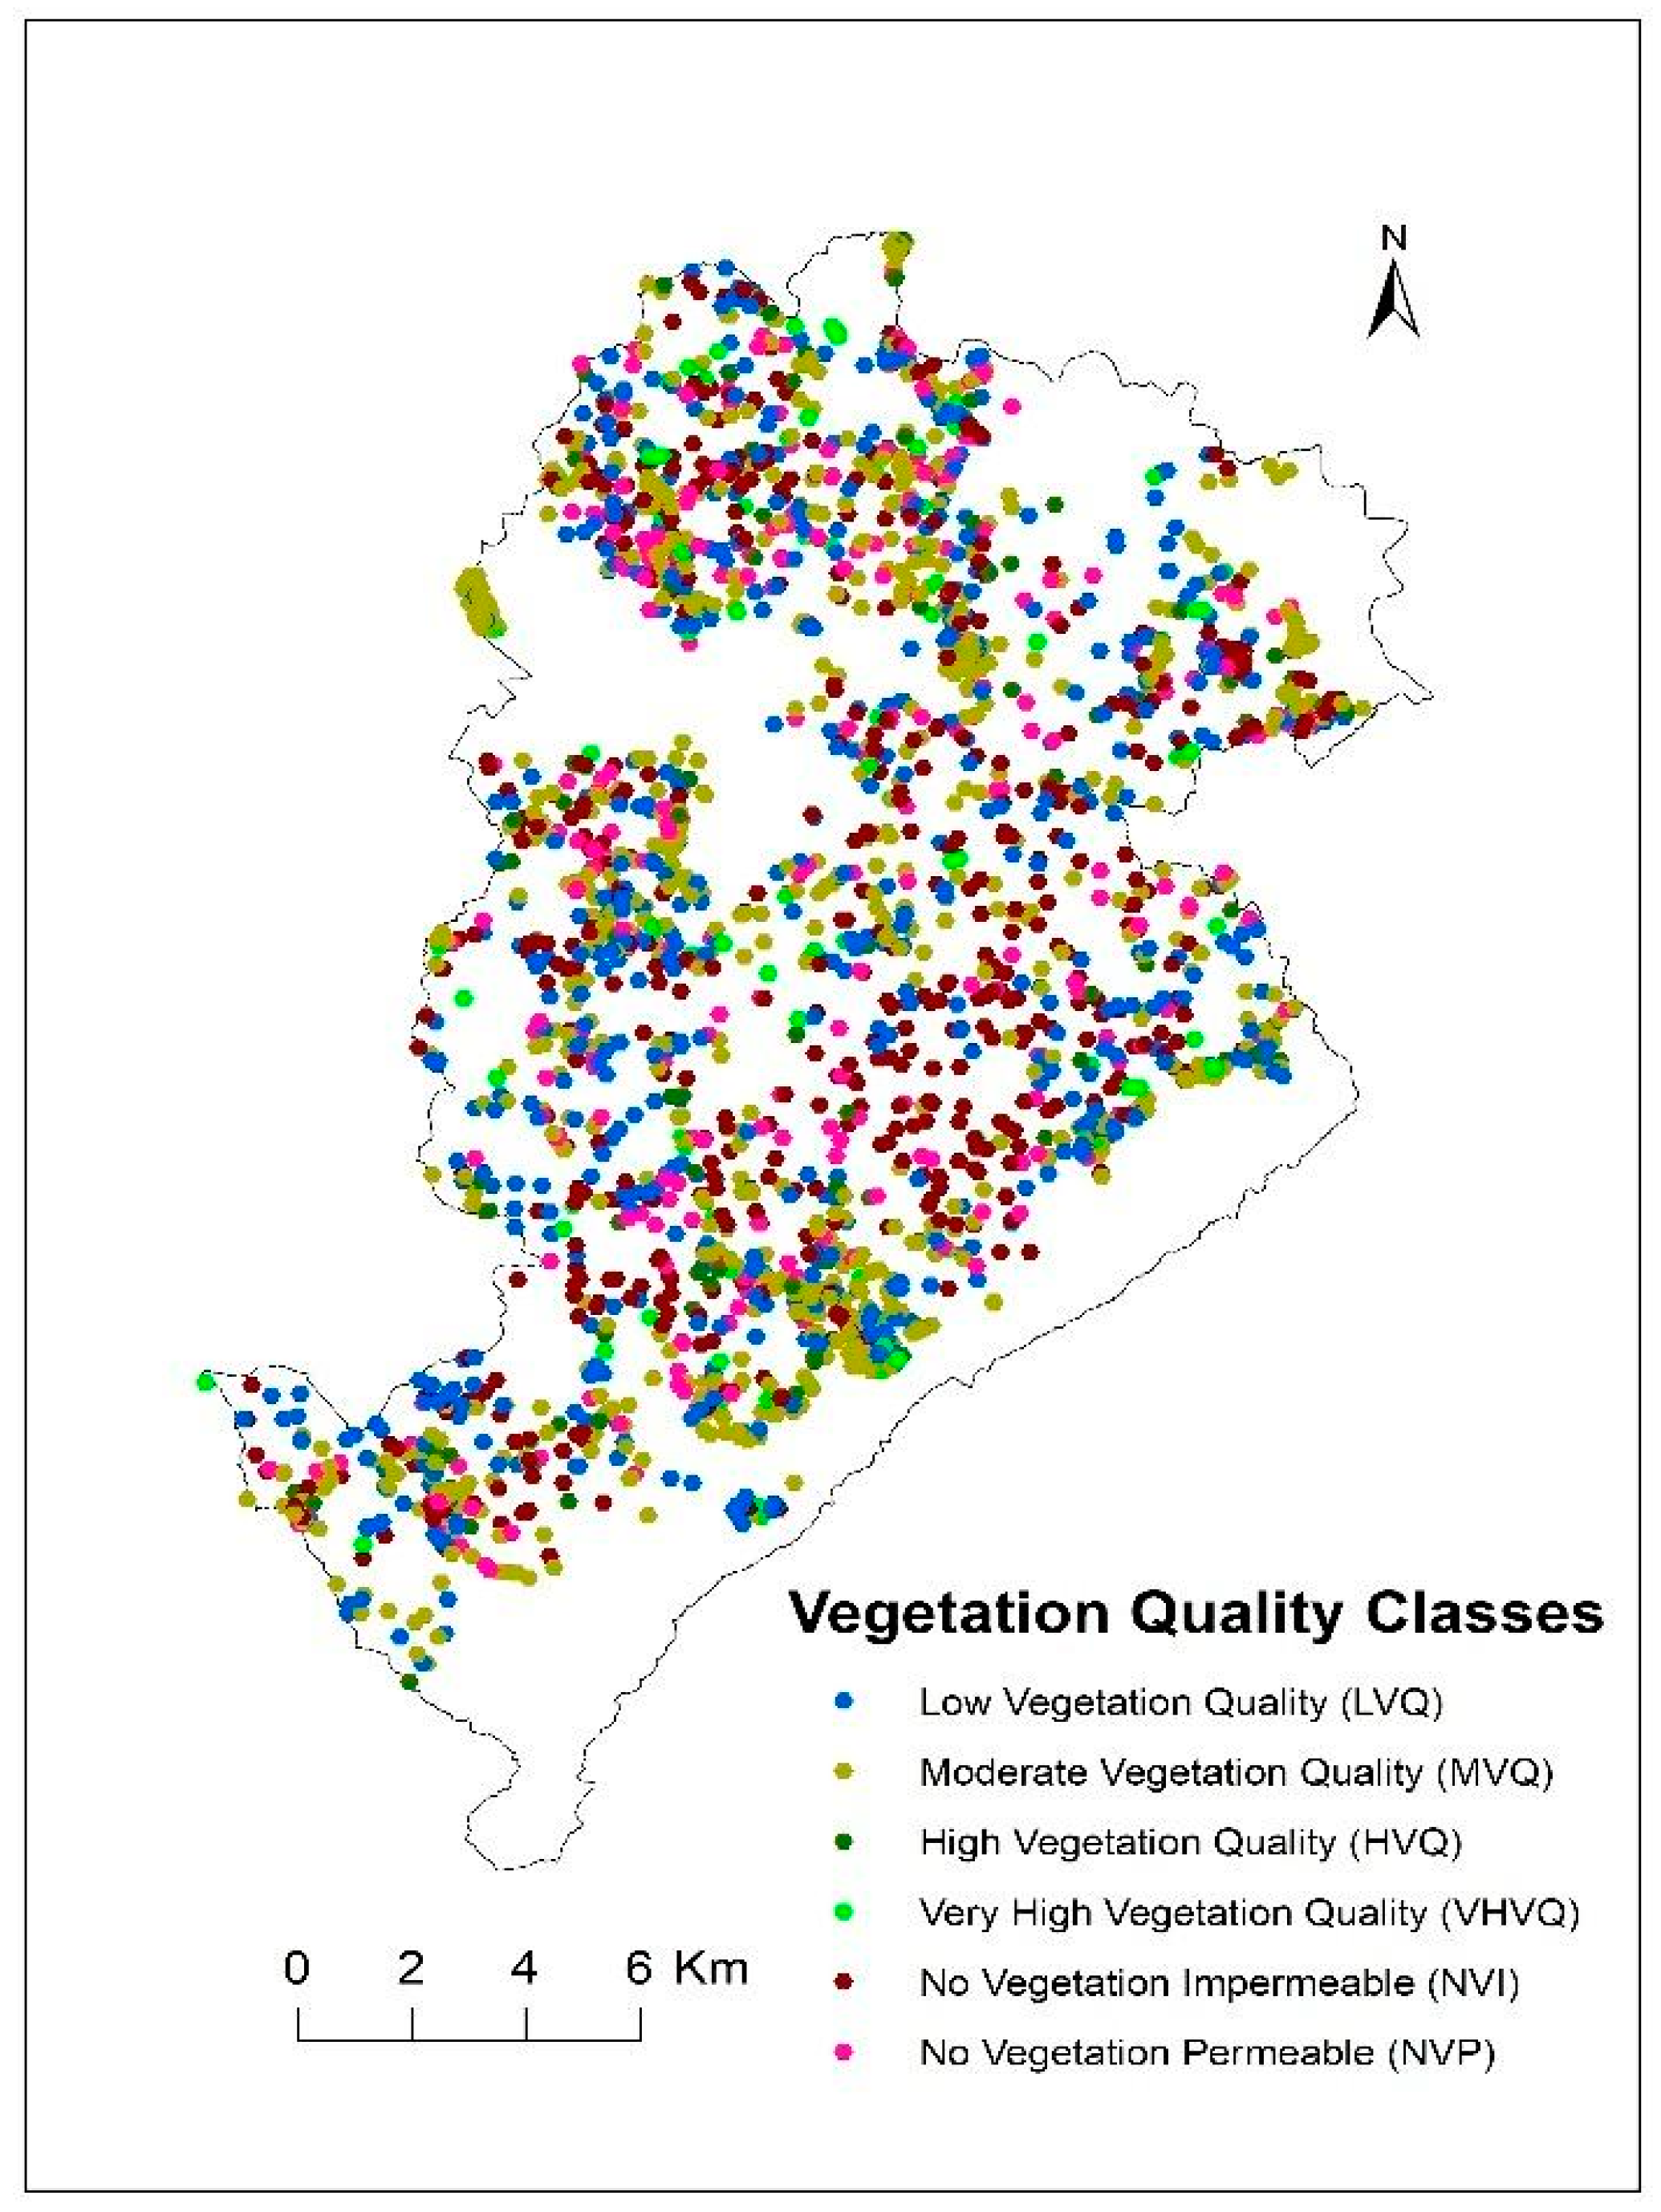
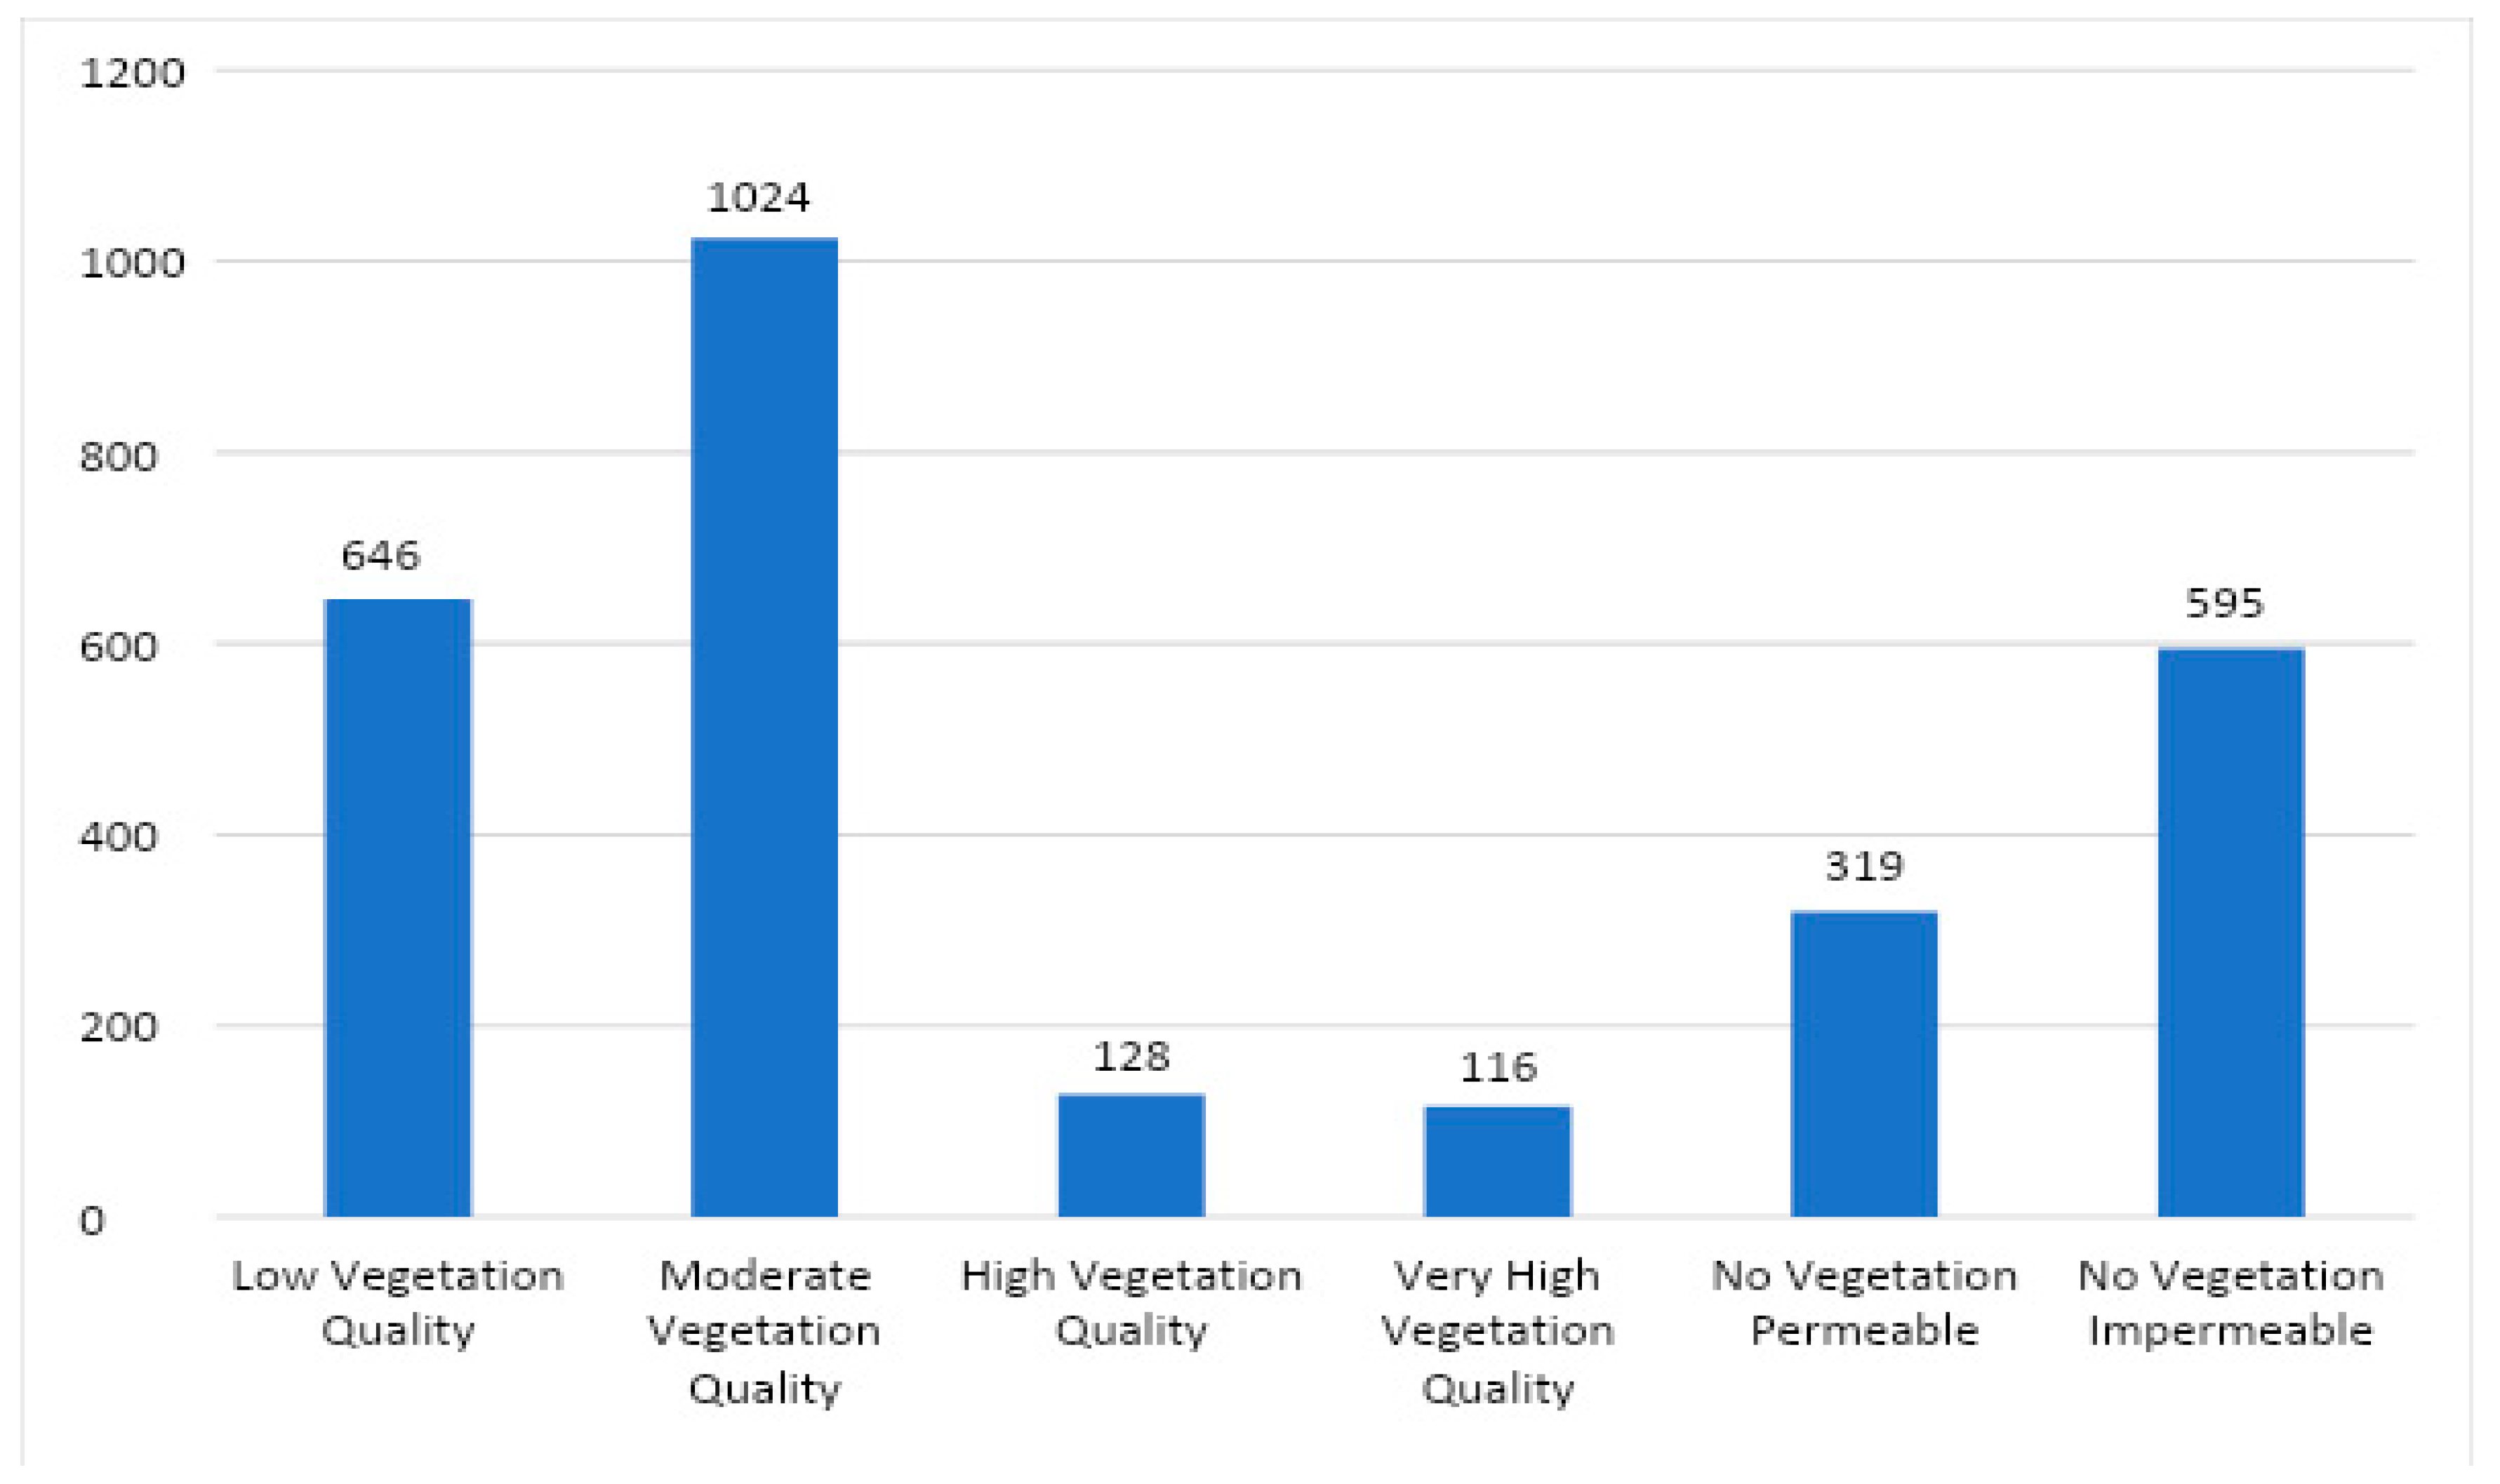
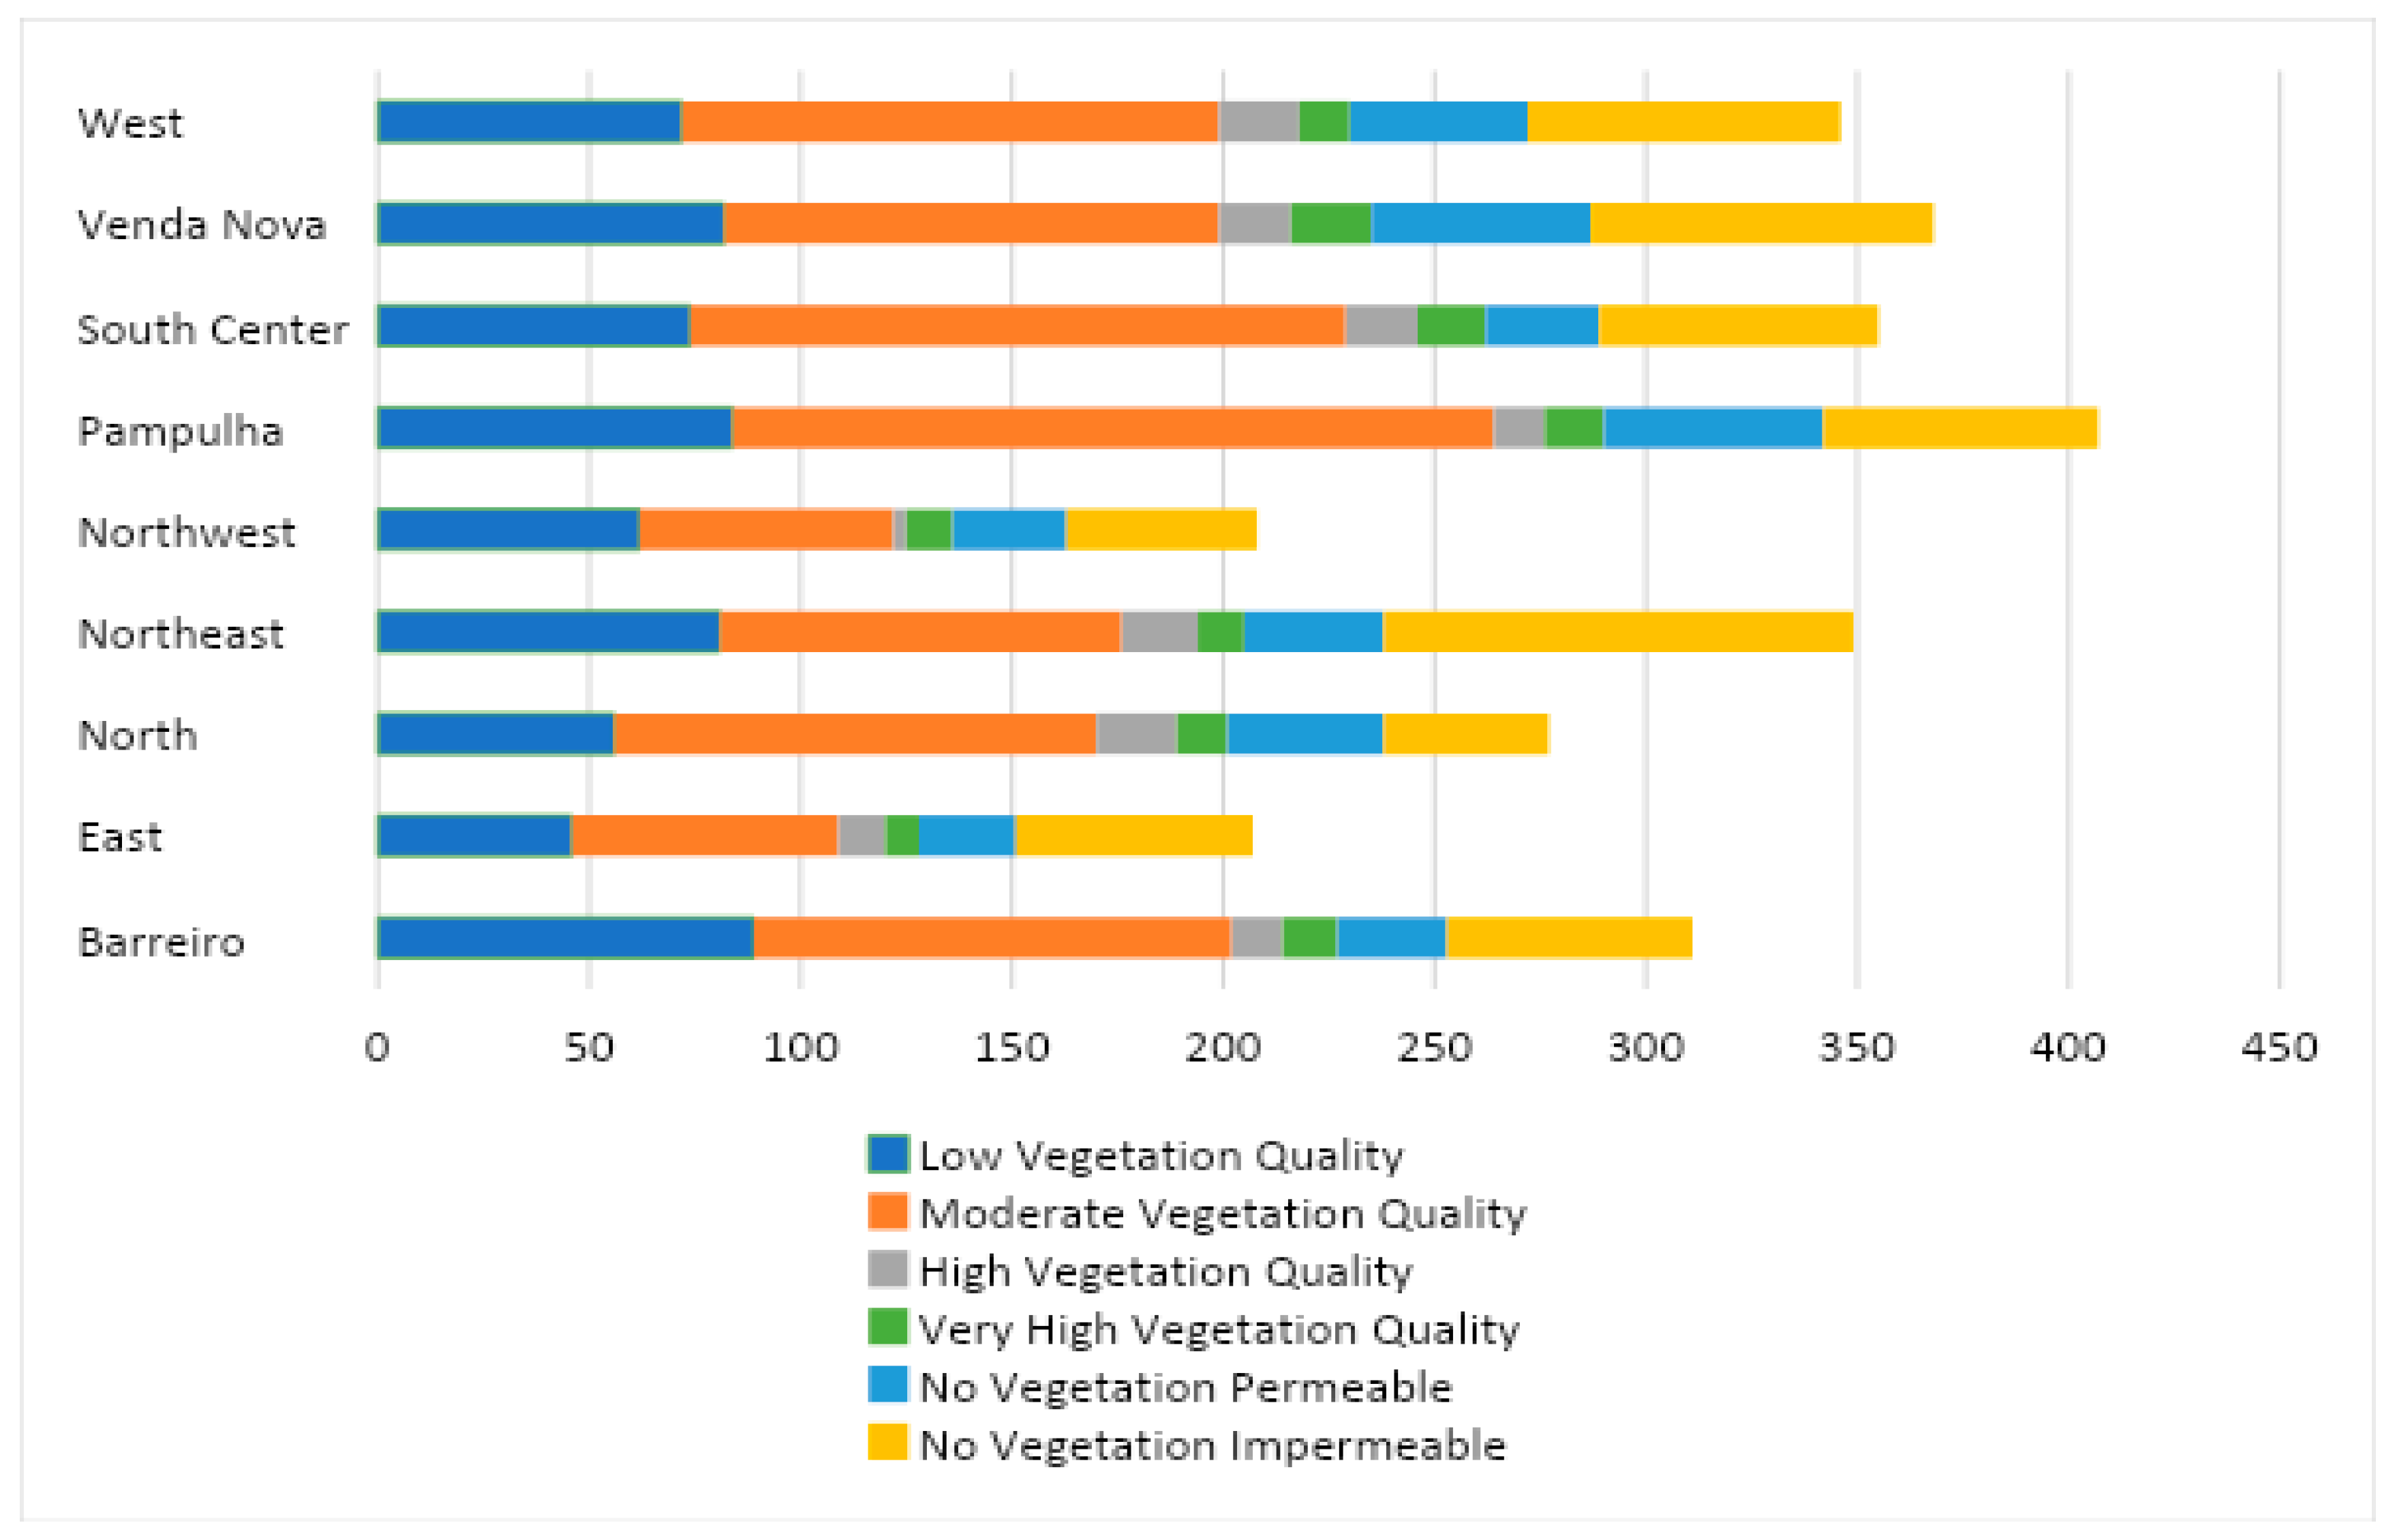
3.1. Land Cover Mapping

The 2828 lots sampled in the city of Belo Horizonte, Brazil, covered an area of 4771,235 m2 or 477.12 ha. The spatial distribution and vegetation quality classes of the lots are presented in Figure 2. The moderate vegetation quality (MVQ) class aggregated the largest number of vacant lots, with 1024 or 36.21% of the sampled lots (Figure 3). This class, along with the low vegetation quality (LVQ—646 lots or 22.84%) and no vegetation permeable (NVP—319 lots or 11.28%) classes, comprised 1989 lots or 70.33% of the sampled lots. The highest vegetation quality classes, high vegetation quality (HVQ) and very high vegetation quality (VHVQ), comprised only 128 lots, or 4.53%, and 116 lots, or 4.10%, respectively. The no vegetation permeable (NVP) class, composed entirely of bare soil, and the no vegetation impermeable (NVI) class, composed thoroughly of impermeable surfaces, together comprised 595 lots, or 21.04% of the sampled lots.
The distribution of vegetation quality among the nine administrative units of the city showed a clear repetition of the pattern, with a predominance of lots in the moderate vegetation quality class (Figure 4). The Northeast regional unit was the only one that presented slightly more lots in the no vegetation impermeable class (NVI—111 lots) in relation to moderate vegetation quality (MVQ—95 lots). The administrative units with the greatest numbers of lots in the highest vegetation quality class were North, with 19 (HVQ—19); West (HVQ—19); and Venda Nova (VHVQ—19). The administrative units with the greatest numbers of lots in the very high vegetation quality (VHVQ) and high vegetation quality (HVQ) classes together (total 244 lots) were Venda Nova (36 lots); South Center (33 lots); West (31 lots); and North (31 lots).
The areas occupied by the different vegetation quality classes varied in size. The low vegetation quality (1,814,977 m2/181.50 ha) and moderate vegetation quality (1,708,776 m2/170.88 ha) classes comprised 3,523,800 m2/352.38 ha, or 74% of the total area of the sampled lots. The other classes had the following areas: high vegetation quality: 516,609 m2/51.66 ha; no vegetation impermeable: 416,911 m2/41.69 ha; no vegetation permeable: 232,952 m2/23.29 ha; and very high vegetation quality: 81,009 m2/8.10 ha. Most of the lots were in the smallest class size (lots ranging from 36 to 1000 m2), which was a general pattern for the various vegetation quality classes (Figure 5). The average lot size for this class was 402 m2, while that for all sampled lots was 1687 m2. The largest lot, encompassing 383,375 m2 (38.33 ha), was of the moderate vegetation quality class and was located in the Barreiro administrative unit (Table S3 in Supplementary Material). The second-largest lot (266,634 m2/24.66 ha) was of the high vegetation quality class and was located in the North administrative unit. The next largest lots (the only other lots greater than 10 ha) were of the moderate (158,748 m2/15.87 ha) and high vegetation quality (100,753 m2/10.07 ha) classes, both located in the Northeast administrative area. The median size of all lots sampled in the city was 403 m2.
The dataset included 1370 used lots, or 48.44% of all lots (3061,253 m2/306.12 ha), and 1458 unused lots, or 51.55% (1319,797 m2/131.98 ha). Most lots were in densification-prone areas (ZAP: used, 629; unused, 817) or occupancy-restricted regions (ZAR1/2: used, 552; unused, 573), both with expected soil permeability values between 10% and 20%. Most unused lots were of the moderate vegetation quality class (857 lots or 58.77%), while most used lots were of the no vegetation impermeable class (595 or 43.43%) (Figure 6 and Figure 7). More unused than used lots belonged to the very high vegetation quality class, with 110 lots, or 7.54%, and 6 lots, or 0.44, respectively. There was also a higher occurrence of unused than used lots in the high vegetation quality class, with 94, or 6.45%, and 34, or 2.48%, respectively. The low vegetation quality class had 459, or 33.50%, used lots, and had the third most unused lots, with 187, or 12.83%. The no vegetation permeable class had 210, or 14.40%, unused lots and 109, or 7.96%, used lots.
As expected, high permeability was a common characteristic of unused lots, while most used lots (886 or 64.67%) were of the lower permeability class of 0–25% (Figure 6). It is worth remembering that, of the total number of lots in this class of lower permeability, 595 (43.43%) were totally impermeable and occupied by impervious surfaces such as construction, asphalt, and cement. Fully impermeable lots were concentrated mainly in zones suitable for densification (ZAP-314 lots, or 23% of the used lots) and regions with occupancy restrictions (ZAR1/2-220 lots, or 16% of the used lots). The expected degree of permeability for these regions and the others covered in the sampling process was 10% to 20%. The highest degrees of permeability for used lots, between >75% and 95%, occurred in a smaller number of lots (115 or 8.47%). Of all the lots, 93.60% were private and 6.40% were public. Most used and unused lots, therefore, belonged to private owners, comprising 1257 (91.75%) and 1390 (95.34%), respectively. The distribution patterns of lots among vegetation quality classes were the same for public and private unused lots, with a higher concentration in the moderate vegetation quality class (public: 36 lots; private: 821 lots) (Table S4 in Supplementary Material). For used lots, two classes of vegetation quality divided the first positions in terms of the number of lots represented: no vegetation impermeable (public: 36 lots; private: 559 lots) and low vegetation quality (public: 55 lots; private: 404 lots). The vast majority of used (1020 or 74.45%) and unused (1320 or 90.53%) lots were concentrated in the smaller size class (0–1000 m2), with low representation in the others (Figure 6).
The land cover of the unused lots (1458) in terms of the delineation of vegetation quality classes was diverse, comprising 39 combinations of nine land cover types: agriculture; bare soil; forest in the advanced-intermediate stage of regeneration; forest in the initial stage of regeneration; herbaceous-shrubby vegetation; pasture; savanna; tree clumps; and water (Table 2). The land cover of the used lots (1370) encompassed ten types (the same as unused lots plus impermeable surfaces) distributed in 38 combinations (Table 3).
There were nine types of land use for used lots: commercial industrial (5 lots); commercial institutional (55); commercial parking (65); commercial sheds (162); commercial sheds parking (106), housing building (254), housing courtyard (39), housing house (675), and pavement asphalt (9).

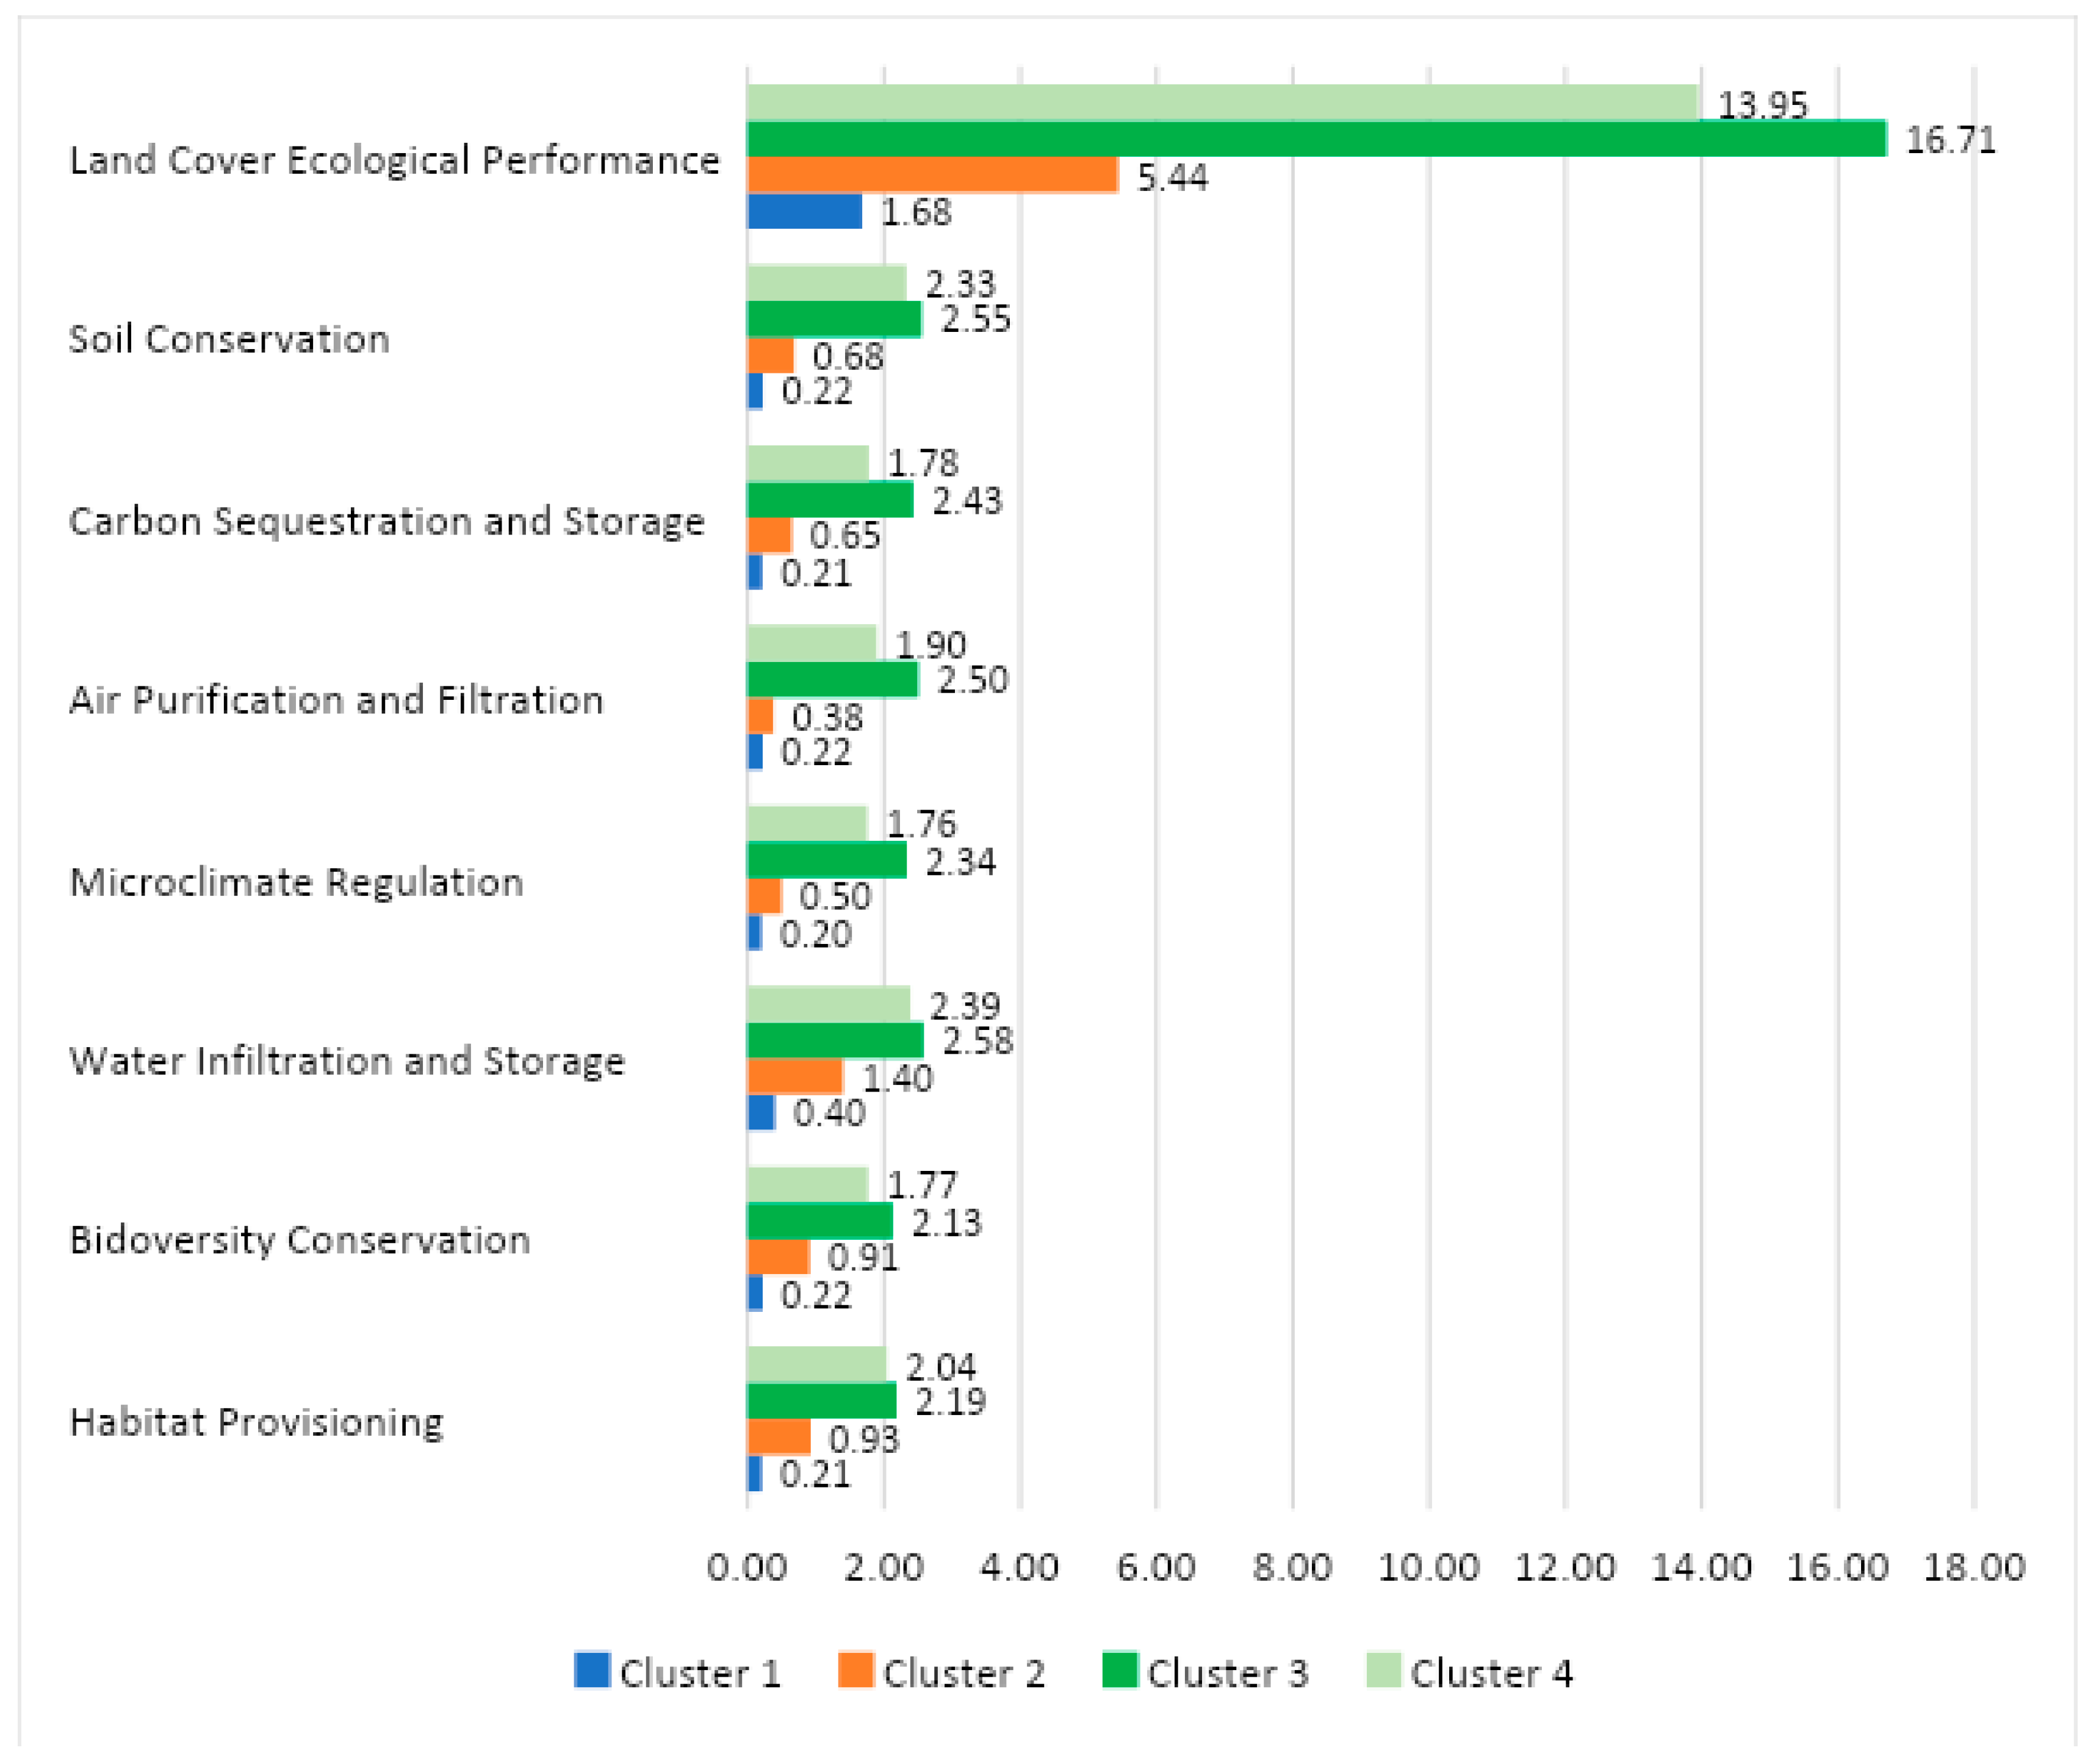
3.2. Land Cover Clusters and Ecological Performance

Four land cover types stood out as important components of the investigated sample of lots, which were present in all four clusters: bare soil, herbaceous-shrubby vegetation, tree clumps, and built-up areas (Table 4). Native forest only appeared in Cluster 3 (6% forest in advanced-intermediate stage, 6% forest in initial stage) and Cluster 4 (1% forest in advanced-intermediate stage, 1% forest in initial stage). Savanna and pasture were represented in Cluster 3, with 2% and 1% coverage, respectively. Of the ten land cover types of the sampled lots, agriculture and water were not represented in the clusters because they had average coverage of below 0. The four optimal clusters representing the land cover complexity of the sampled lots in Belo Horizonte can be summarized as follows. Cluster 1 is characterized by the predominance of impermeable surfaces or built-up areas, with an average coverage of 89%. This cluster has the lowest number of lots in the sample, with 280 lots, or 9.90%. Cluster 2 encompasses 477 lots, or 16.87%, and is marked by the dominance of bare soil, with an average coverage of 86%. Clusters 3 and 4 are predominantly occupied by tree clumps (49%) and herbaceous-shrubby vegetation (84%), respectively. Cluster 3 holds the largest number of lots, with 1193 or 42.18%, followed by Cluster 4, with 878 lots or 31.05% (for descriptive statistics, see Table S5 in Supplementary Material).
The overall ecological performance differed among the four land cover clusters. The cluster of trees (Cluster 3) with the highest average land cover of tree clumps and native vegetation had the highest achievement of 16.71, which can be classified as high performance within the sampling parameters (Figure 8). This cluster stood out with the highest values for all ecological regulation functions and habitat functions. Cluster 4, with the highest average land cover of herbaceous-shrubby vegetation, stood out in the sequence, with a moderate ecological performance of 13.95. Next, Cluster 2 stood out with the highest average land cover of bare soil and a low ecological performance of 5.44. Cluster 1, with predominance of built-up areas, had the lowest ecological importance of 1.68.

4. Discussion

The sampled vacant lots of the city of Belo Horizonte proved to have diverse land cover, which was reflected in the presence of various classes of vegetation quality. Despite this, there was a prevalence of lots under moderate conditions of vegetation quality, composed mainly of herbaceous-shrubby vegetation (between 50% and 100% of the lot), where trees or forest, when present, were in a smaller proportion (maximum of 50% of the lot). The largest lot in the sample (38.33 ha) was also a representative of this class of moderate vegetation quality. The predominance of these conditions in the sampled lots may reflect the norms of management of the lots, as indicated by legislation that foresees the maintenance of low vegetation in an herbaceous-shrubby phase without the removal of stumps or roots [87]. Lots with moderate vegetation quality, together with those of low vegetation quality—predominantly composed of herbaceous-shrubby elements (>0% to 50%) and trees or forest, when present, represented to a lesser extent (>0% to 25%)—and lots without vegetation but with permeable areas, composed of bare soil, made up most of the sampled lots at 70%. This result corroborates that, in general, urban areas comprise a considerable portion of land containing herbaceous-shrubby and spontaneous vegetation, whether they are vacant lots, derelict land, buildings, brownfields, land currently in use, or land in and around urban areas [88].
Herbaceous-shrubby vegetation comprises mainly grasses, shrubs, managed lawns, and spontaneous urban vegetation. Although, at first glance, sites with these characteristics may be considered as devoid of economic and ecological value, recent research has suggested that these environments provide several ecological functions and ecosystem services, e.g., [58,88]. In the present study, the cluster of herbaceous-shrubby vegetation (Cluster 4 was composed of 84% of this vegetation type, also containing trees and native vegetation to a lesser extent) was second in terms of ecological performance. This high performance represents a measure of the ability of the lots of this cluster to fulfill some ecological functions of regulation and habitat provisioning, as well as biodiversity conservation, through the sum of the ecological functions performed by each land cover grouping. Robinson and Lundholm (2012) [88] reported a high level of diversity of invertebrates and plants, many non-native, in spontaneous herbaceous-shrubby vegetation in urban environments. They also reported the provision of regulating climate services by lawn habitats, particularly biomass production, which was superior to that found for spontaneous urban vegetation.
Despite having lower ecological performance, the cluster composed mainly of bare soil (86%; Cluster 2) can contribute to some regulation and habitat ecological functions. Soil is a component of urban ecosystems that underpins some ecological processes, including biogeochemical cycles and the life cycles of some organisms [89,90]. Among the ecosystem services provided by soils are support for plant growth, sinks for pollutants, substrates to build structures, habitats for microorganisms, physical support for human activities, nutrient storage, and water infiltration and storage [91,92]. Among these, water infiltration and storage are important ecosystem services for consideration, particularly in situations with a high percentage of totally impermeable lots.
Although bare soil is certainly not desirable, it has a role in carbon sequestration and storage, and consequently in the mitigation of the effects of gas emissions and climate change [91], albeit much smaller than that provided by vegetation covering the soil. In general, degradation by human activities reduces the mitigation capacity of soil [89]. In Belo Horizonte, and perhaps many other Brazilian cities, the administration has long forced owners to keep their lots “clean” of grasses and shrubs, with fines being levied to punish those that do not regularly remove small plants. In many cases, the owners end the cleaning processes with fires, a practice punishable by fines (framed in the legislation as an environmental crime) which ends up representing another stressor in favor of climate change and global warming. This misleading policy regarding biodiversity and climate change initiatives not only harms the potential for ecosystem services provision in the urban ecosystem, but also increases gas emissions and health impairment of the inhabitants.
The official dataset of vacant lots in the city of Belo Horizonte, which is used in studies that follow the dynamics of construction and occupation of the lots, is not regularly updated (usually dependent on inspection). This situation was echoed in the present study by 48% of sampled lots being built or used lots, covering an area of 306.12 ha, in contrast to 51% of unused lots, with a total area of 131.98 ha. Comparing these two groups of lots reveals a difference in the quality of vegetation, which is absent under impermeable conditions and/or mostly of low quality in used lots, as well as the higher permeability of moderate vegetation quality in unused lots. The absence or low quality of vegetation prevalent in used lots is also reflected in the poor ecological performance found for Cluster 1, where lots with a dominance of built-up areas (89%) are grouped. The two groups are similar in that most of their lots belong to private owners and are in the size class of 1000 m2 or less. Some deductions of greater interest related to the dynamics of occupation of these lots, made possible by the characteristics of the dataset, can be translated, such as the situation of impermeability found for many lots and the types of use that have been given to these locations.
Thus, one of the findings here references the dynamics of vacant lot occupation in the city, which has favored the maximum utilization of lots for the establishment of construction without leaving any permeability percentage for many lots (43% of used lots) in zones where the expected permeability ranges from 10% to 20% [69]. The uses granted to these places are highlighted by housing (around 67%), given the rising demand for new homes, especially houses (49%) and buildings (18%), and secondly for commercial use, expressed by the presence of sheds, sheds/parking, and parking (about 24%). The predominance of house construction may reflect city occupation zoning rules, which indicate greater densification and verticalization of buildings (not houses) for the central and hyper-center regions of the city, which were less represented in the sampled lots in relation to areas of lower density [68]. The present study also pointed to a greater use of lots in the South Center region, which encompasses the central and hyper-center areas, for the construction of buildings (not houses), which agrees with the established densification zoning rules.
The 9 land cover components of the unused lots were mixed to form 39 vegetation and land cover combinations, once again demonstrating the diverse nature of the vegetation types and ground cover that make up Belo Horizonte’s vacant lots. Similarly, the used lots featured ten land cover types (same as used lots with the addition of impermeable surfaces) arranged into 38 different combinations. This is consistent with the fact that urban areas are commonly characterized by a variety of small-scale, man-made habitat mosaics, while under natural conditions, heterogeneity is more controlled by factors such as topography and geology and the interactions with past and present land use [93]. Three land cover types stood out in the mosaic of the studied area—herbaceous-shrubby vegetation, tree clumps, and bare soil. These comprised the dominant combinations in most of the unused lots and in most of the predominant moderate vegetation quality lots. The same was true for used lots, especially for the high number of lots composed of herbaceous-shrubby vegetation and tree clumps, although they belonged to the low vegetation quality class, with the percentages of these vegetation types reaching at most 50% and 25%, respectively.
Lots with high vegetation quality and composition percentages for trees, forest, or savanna of above 50% and 75% (high and very high vegetation quality, respectively) encompassed about 9% of all lots (204 unused lots, 40 used lots) and occupied 21.36 ha. The Venda Nova, South Center, North, and West administrative units contained a greater number of lots with higher vegetation quality, while Barreiro had higher-quality lots formed of pure stands of forest, savanna, and tree clumps. Except for the South Center administrative unit, these were more peripheral administrative regions, which have rural pasts with a predominance of farming and agricultural activities, and which were receiving inhabitants as the central regions of Belo Horizonte developed. In several of these, building construction only began in 1990s or later, yet there is still a predominance of houses and low buildings in the landscape [94]. These lots of higher vegetation quality, predominantly comprising trees, forests, and savannas, can provide a range of differentiated ecosystem services. This is especially true considering that their complex structures can provide a wide variety of habitats, including nest sites and refugia, as well as native plants as food for many animal species, especially insects and birds [88].
Lots with higher average coverage of tree clumps (49%), along with native forest and savanna (2% to 6%), were grouped into Cluster 3, which also had the largest number of lots (ca. 42%) and higher ecological performance than the other clusters. These lots, therefore, have the greatest potential for the provision of regulation and supporting services, as evaluated in the present work via expert opinion on related ecological functions. Among regulating ecosystem services, urban forests and trees are recognized for improving air quality by removing gaseous and particulate pollutants, with a positive impact on human health and reduced mortality [95]. Urban trees are recognized as contributors to air purification and filtration and temperature regulation in cities [28]. They also support nesting sites, providing food for pollinators habitats for many species [96].
Kim et al. (2015) [35] found some important ecosystem services provided by urban forests and trees situated within vacant land, such as air pollution removal, carbon sequestration and storage, and energy saving. The authors quantified the amount of carbon and air pollutants removed by trees and found relatively high values, especially when compared to other land uses in the target city of their research. McPhearson et al. (2013) [58] also found multiple provisioning of local and municipal-scale ecosystem services by fine vegetation, coarse vegetation, and bare soil spread over urban vacant lots, highlighting storm water mitigation, air pollution removal, carbon sequestration and storage, food production, recreation space, and biodiversity habitats. In general, vegetation is the largest provider of ecosystem services in urban landscapes, either through natural remnants of forests and native vegetation or through agricultural landscapes, vegetable gardens, other gardens, backyard orchards, sidewalk-planted trees, and spontaneous urban vegetation [29]. Although lakes and water bodies also provide urban ecosystem services, especially microclimate regulation [28], they had low representation in the lots evaluated in the present study.
The whole set of findings found in these studies favors a fresh look at the vacant lots of the investigated urban landscape, which can be used for the benefit of people. They are useful both to the municipality and to local inhabitants by improving people’s well-being and health through the benefits of ecosystem services. These aspects emerged in the studies through documentation of the importance of the land cover patterns of vacant lots for the provisioning of ecological functions within the context of the urban landscape, offering opportunities for the insertion of various actions and the potential to host discussions related to urban planning. In Belo Horizonte, the vacant lots and their public value has remained invisible to urban communities because of inactivity or pressure for actions of little ecological value, such as clearing lots. One exception is a temporary intervention, which included the use of some vacant lots in the city, with the permission of the owners, for leisure activities, rest, meetings, and small businesses (i.e., opening of a beauty salon) [97]. In this sense, the characterization and investigation of land cover patterns and detailed mapping of the vegetation of these lots undertaken in the present study adds to the existing research on the subject, while simultaneously enabling visibility and providing insights and support for urban sustainability actions and policies.
The results of the present study allow us to infer that the temporary occurrence of vacant lots itself has important ecological, welfare, and quality-of-life consequences. This becomes even more crucial when examining the dynamics of use of vacant lots, which denotes overuse of many of them without preserving small permeable portions, thereby losing several benefits of interest to the city and its inhabitants. This situation is directly opposite to that preconceived by the urban green and blue spaces or natural and semi-natural areas within urban areas of the United Nations Sustainable Development Goals [98,99]. Practices associated with misleading policies in Belo Horizonte represent a strong mechanism that jeopardizes sustainability in the city. Hence, the sustainable use initiative for the urban environment of the city needs urgent re-evaluation. On the other hand, these benefits will obviously need to be balanced with socioeconomic issues and the need for housing in Belo Horizonte, indicating that actions aimed at socioecological uses of vacant lots will be better addressed within the scope of participatory approaches. Furthermore, a willingness-to-pay (WTP) approach could be adopted to quantify the economic value of these services to urban residents. The present study paves the way for continued research aimed at elucidating and measuring the ecosystem services available in cities, coupled with the use of participatory and economic approaches to better understand the socioeconomic context in the various zones of the city. It should also lead decision makers and lawmakers to better include and plan the contributions of cities to mitigate the effects of climate change and promote biodiversity conservation in the near future.

5. Conclusions

Characterization of a representative portion of the vacant lots of Belo Horizonte indicated diverse land cover and a large percentage of lots with the capability to provide ecological functions. These functions can be translated into various ecological processes and potential ecosystem services, especially those of regulation and support. The greatest potential lies with the lots that host arboreal elements and native vegetation of forests and savannas, such as in clusters of trees, which can be found in almost half of the investigated lots. Herbaceous-shrubby vegetation was present in a large percentage of the lots, and presents moderate potential for ecological functions and the provision of regulating and supporting ecosystem services. All the land cover diversity and the predominance of moderate vegetation quality in the investigated lots leads to the interpretation that the temporary occurrence of vacant lots has a positive influence on the environmental quality of the city.
The study also showed that land use regulation has not restrained the excessive use of lots, indicating a trend towards the valorization of concrete and impermeable structures, to the detriment of the adoption of ecological solutions that are minimally based on permeability and without respect to the standards required in the areas where these lots occur of at least 10% to 20%. Both the invisibility of vacant lots as a public value, neglecting their potential for improving quality of life in the city, and the full use of lots without leaving permeable fractions denotes the need for vacant lots as well as urban vegetation and its benefits to be better considered in the city planning.
Moreover, while land cover patterns and vegetation quality classes offer a useful initial step for planners, they do not equate to a comprehensive assessment of ecosystem services or a robust socio-ecological land use plan for the vacant lots. In this sense, our recommendations for future research, actions, and public policies include:
-
The creation and application of governance instruments for the use of vacant lots;
-
The promotion of diagnoses of the neighborhoods of the lots in terms of the equipment and green areas that exist around them and their socioeconomic aspects;
-
Attention to residents and their demands, as well as the owners of the lots;
-
Understanding of the public perception of the environment and the economic value of ecosystem services for urban residents through a willingness-to-pay (WTP) approach;
-
The adoption of actions that are guided by the concept of multifunctionality aiming to cover the multiple socio-ecological functions arising from the lots, including scientific research, such as that related to ecosystem services;
-
The quantification of the extent and value of the full range of ecosystem services provided by these lots, including regulatory and habitat services.
Urban vegetation and its benefits will be better considered with the development of public policies aimed at the creation and application of governance instruments for land use that are guided by the multifunctionality covered by the lots’ multiple socio-ecological functions.

Supplementary Materials

The following supporting information can be downloaded at: https://www.mdpi.com/article/10.3390/su16073063/s1, Table S1: Land cover and use types definitions. Table S2: Average weight given by experts for the ecological functions of the various land cover that comprised: A (habitat provisioning); B (biodiversity conservation); C (water infiltration and storage); D (microclimate regulation); E (air purification and filtration); F (carbon sequestration and storage); G (soil conservation). Values ranged from 0 to 4 meaning: 0 (no importance or contribution to the ecological function considered); 1 (low importance or contribution to the ecological function considered); 2 (medium importance or contribution to the ecological function considered); 3 (high importance or contribution to the ecological function considered); 4 (very high importance or contribution to the ecological function considered). Table S3: Minimum, median, and maximum lots size by each class of vegetation quality and administrative unit (N = 2828). Table S4: Distribution of vegetation quality classes between used and unused, public and private lots. Table S5: Descriptive statistics of the land cover clusters.

Author Contributions

Conceptualization, M.B.H.; Methodology, M.B.H., S.M.C.-R., J.F.M. and F.M.M.; Software, J.F.M.; Formal analysis, S.M.C.-R.; Data curation, F.M.M.; Writing—original draft, M.B.H.; Writing—review & editing, F.d.M.R., F.F.G. and G.W.F.; Supervision, S.M.C.-R. and G.W.F. All authors have read and agreed to the published version of the manuscript.

Funding

This research received no external funding.

Data Availability Statement

Data are contained within the article and Supplementary Materials.

Acknowledgments

The authors thank PBH (Belo Horizonte Municipal Administration) (Belo Horizonte Informatics and Information Municipal Company) and Felipe Antônio Carneiro Rodrigues for providing the spatial dataset for the municipality of Belo Horizonte. The authors would also like to thank the following professionals in the fields of botany, vegetation cover mapping, and environmental sciences who were willing to participate in the research with their expert knowledge: Erika Ferreira da Silva, Inês Ribeiro de Andrade, Jean François Mas, João Monnerat Lanna, Laís Ferreira Jales, Laura M. G. Salles Bachi, Luciana Eler França, Mariana Terrôla Martins Ferreira, Natália Costa Soares, and Tereza Cristina Souza Sposito. Marise Barreiros Horta received a scholarship from CAPES (Brazilian Federal Agency for Support and Evaluation of Graduate Education).

Conflicts of Interest

The authors declare no conflict of interest.

References

  1. Carvalho-Ribeiro, S.M.; Boscolo, D.; Ciochetti, G.; Firmino, A.; Guiomar, N. Ecologia da Paisagem no Contexto Luso-Brasileiro; Volume II, Editora Appris. Ltda.: Curitiba, Brazil, 2021; 465p. [Google Scholar]
  2. Grimm, N.B.; Faeth, S.H.; Golubiewski, N.E.; Redman, C.L.; Wu, J.; Bai, X.; Briggs, J.M. Global Change and the Ecology of Cities. Science 2008, 319, 756–760. [Google Scholar] [CrossRef] [PubMed]
  3. Horta, M.B.; Cabral, M.I.; Teixeira, C.P.; Pinto, J.L.C.; Fernandes, G.W.; Nobrega, R.A.A.; Carvalho-Ribeiro, S.M. Paisagem Urbana. In Ecologia da Paisagem no Contexto Luso-Brasileiro; v.2.; Carvalho-Ribeiro, S.M., Boscolo, D., Ciochetti, G., Firmino, A., Guiomas, N., Eds.; Editora Appris. Ltda.: Curitiba, Brazil, 2021. [Google Scholar]
  4. Kim, G.; Miller, P.A.; Nowak, D.J. Urban vacant land typology: A tool for managing urban vacant land. Sustain. Cities Soc. 2018, 36, 144–156. [Google Scholar] [CrossRef]
  5. Evans, D.L.; Falagán, N.; Hardman, C.A.; Kourmpetli, S.; Liu, L.; Mead, B.R.; Davies, J.A.C. Eco-system service delivery by urban agriculture and green infrastructure–a systematic review. Ecosyst. Serv. 2022, 54, 101405. [Google Scholar] [CrossRef]
  6. Tzoulas, K.; Korpela, K.; Venn, S.; Yli-Pelkonen, V.; Kaźmierczak, A.; Niemela, J.; James, P. Pro-moting ecosystem and human health in urban areas using Green Infrastructure: A literature review. Landsc. Urban Plan. 2007, 81, 167–178. [Google Scholar] [CrossRef]
  7. Grimm, N.B.; Grove, J.M.; Pickett, S.T.A.; Redman, C.L. Integrated approaches to long-term studies of urban ecological systems: Urban ecological systems present multiple challenges to ecol-ogists—Pervasive human impact and extreme heterogeneity of cities, and the need to integrate social and ecological ap-proaches, concepts, and theory. Bioscience 2000, 50, 571–584. [Google Scholar] [CrossRef]
  8. Haase, A.; Bernt, M.; Großmann, K.; Mykhnenko, V.; Rink, D. Varieties of shrinkage in European cities. Eur. Urban Reg. Stud. 2016, 23, 86–102. [Google Scholar] [CrossRef]
  9. Szlavecz, K.; Warren, P.; Pickett, S. Biodiversity on the urban landscape. In Human Population: Its Influence on Biological Diversity; Cincotta, R.P., Gorenflo, L.J., Eds.; Springer: Berlin/Heidelberg, Germany, 2011; Chapter 6; pp. 75–101. [Google Scholar]
  10. Forman, R.T. Urban Ecology: Science of Cities; Cambridge University Press: New York, NY, USA, 2014. [Google Scholar]
  11. Lu, D.; Weng, Q. Spectral Mixture Analysis of the Urban Landscape in Indianapolis with Landsat ETM+ Imagery. Photogramm. Eng. Remote Sens. 2004, 70, 1053–1062. [Google Scholar] [CrossRef]
  12. Bierwagen, B.G. Connectivity in urbanizing landscapes: The importance of habitat configuration, urban area size, and dispersal. Urban Ecosyst. 2007, 10, 29–42. [Google Scholar] [CrossRef]
  13. Breuste, J.; Haase, D.; Elmqvist, T. Urban Landscapes and Ecosystem Services. In Ecosystem Services in Agricultural and Urban Landscapes; Wratten, S., Sandhu, H., Cullen, R., Costanza, R., Eds.; Wiley-Blackwell: Oxford, UK, 2013; Chapter 6; pp. 83–104. [Google Scholar]
  14. Costanza, R.; d’Arge, R.; de Groot, R.; Farber, S.; Grasso, M.; Hannon, B.; Limburg, K.; Naeem, S.; O’Neill, R.V.; Paruelo, J.; et al. The value of the world’s ecosystem services and natural capital. Nature 1997, 387, 253–260. [Google Scholar] [CrossRef]
  15. Elmqvist, T.; Fragkias, M.; Goodness, J.; Güneralp, B.; Marcotullio, P.J.; McDonald, R.I.; Parnell, S.; Schewenius, M.; Sendstad, M.; Seto, K.C.; et al. Urbanization, Biodiversity and Eco-System Services: Challenges and Opportunities: A Global Assessment; Springer: Cham, The Netherlands, 2013. [Google Scholar]
  16. MEA. Ecosystems and Human Well-Being: Biodiversity Synthesis; World Resources Institute: Washington, DC, USA, 2005. [Google Scholar]
  17. Alberti, M.; Marzluff, J.M. Ecological resilience in urban ecosystems: Linking urban patterns to human and ecological functions. Urban Ecosyst. 2004, 7, 241–265. [Google Scholar] [CrossRef]
  18. Casetta, E.; da Silva, J.M.; Vecchi, D. From Assessing to Conserving Biodiversity: Conceptual and Practical Challenges; Springer: Berlin/Heidelberg, Germany, 2019; 452p. [Google Scholar]
  19. Dussault, A.C. Functional Biodiversity and the Concept of Ecological Function. Chapter 14. In From Assessing to Conserving Biodiversity: Conceptual and Practical Challenges; Casetta, E., da Silva, J.M., Vecchi, D., Eds.; Springer: Berlin/Heidelberg, Germany, 2019; pp. 297–316. [Google Scholar]
  20. McDonald, R. Ecosystem service demand and supply along the urban-to-rural gradient. J. Conserv. Plan. 2009, 5, 1–14. [Google Scholar]
  21. Banerjee, O.; Crossman, N.; de Groot, R. Ecological processes, functions and ecosystem services: Inextricable linkages between wetlands and agricultural systems. In Ecosystem Services in Agricultural and Urban Landscapes; Wratten, S.D., Sandhu, H., Cul-len, R., Costanza, R., Eds.; Wiley–Blackwell: Hoboken, NJ, USA, 2013; pp. 16–27. [Google Scholar] [CrossRef]
  22. Bolliger, J.; Bättig, M.; Gallati, J.; Kläy, A.; Stauffacher, M.; Kienast, F. Landscape multifunctionality: A powerful concept to identify effects of environmental change. Reg. Environ. Chang. 2011, 11, 203–206. [Google Scholar] [CrossRef]
  23. Daily, G.C.; Polasky, S.; Goldstein, J.; Kareiva, P.M.; Mooney, H.A.; Pejchar, L.; Ricketts, T.H.; Salzman, J.; Shallenberger, R. Ecosystem services in decision making: Time to deliver. Front. Ecol. Environ. 2009, 7, 21–28. [Google Scholar] [CrossRef]
  24. De Groot, R.S.; Alkemade, R.; Braat, L.; Hein, L.; Willemen, L. Challenges in integrating the concept of ecosystem services and values in landscape planning, management and decision making. Ecol. Complex. 2010, 7, 260–272. [Google Scholar] [CrossRef]
  25. Intergovernmental Science-Policy Platform on Biodiversity and Ecosystem Services (IPBES). The Global Assessment Report on Biodiversity and Ecosystem Services. 2019. Available online: https://ipbes.net/system/tdf/ipbes_global_assessment_report_summary_for_policymakers.pdf?file=1andtype=nodeandid=35329 (accessed on 1 January 2022).
  26. Oikonomou, V.; Dimitrakopoulos, P.G.; Troumbis, A.Y. Incorporating Ecosystem Function Concept in Environmental Planning and Decision Making by Means of Multi-Criteria Evaluation: The Case-Study of Kalloni, Lesbos, Greece. Environ. Manag. 2011, 47, 77–92. [Google Scholar] [CrossRef] [PubMed]
  27. Fitter, A.; Elmqvist, T.; Haines-Young, R.; Potschin, M.; Rinaldo, A.; Sëtalä, H.; Stoll-Kleemann, S.; Zobel, M.; Murlis, J. An assessment of ecosystem services and biodiversity in Europe. Chapter 1. In Issues in Envi-ronmental Science and Technology: Ecosystem Services; Hester, R.E., Harrison, R.M., Eds.; RSC Publishing: Washington, DC, USA, 2010; pp. 1–28. [Google Scholar]
  28. Bolund, P.; Hunhammar, S. Ecosystem services in urban areas. Ecol. Econ. 1999, 29, 293–301. [Google Scholar] [CrossRef]
  29. Breuste, J.; Schnellinger, J.; Qureshi, S.; Faggi, A. Urban Ecosystem services on the local level: Urban green spaces as providers. Ekologia 2013, 32, 290–304. [Google Scholar] [CrossRef]
  30. Avissar, R. Potential effects of vegetation on the urban thermal environment. Atmos. Environ. 1996, 30, 437–448. [Google Scholar] [CrossRef]
  31. Strohbach, M.W.; Haase, D. Above-ground carbon storage by urban trees in Leipzig, Germany: Analysis of patterns in a European city. Landsc. Urban Plan. 2012, 104, 95–104. [Google Scholar] [CrossRef]
  32. Suchenwirth, L.; Stümer, W.; Schmidt, T.; Förster, M.; Kleinschmit, B. Large-Scale Mapping of Carbon Stocks in Riparian Forests with Self-Organizing Maps and the k-Nearest-Neighbor Algorithm. Forests 2014, 5, 1635–1652. [Google Scholar] [CrossRef]
  33. Endsley, K. Remote Sensing of Socio-Ecological Dynamics in Urban Neighborhoods; Elsevier: Amsterdam, The Netherlands, 2018; Volume 9, pp. 90–105. [Google Scholar]
  34. Sukopp, H.; Werner, P. Urban environments and vegetation. In Man’s Impact on Vegetation; Holzner, W., Werger, M.J.A., Ikusima, I., Eds.; Springer: Cham, The Netherlands, 1983; pp. 247–260. [Google Scholar]
  35. Kim, G.; Miller, P.A.; Nowak, D.J. Assessing urban vacant land ecosystem services: Urban vacant land as green infrastructure in the City of Roanoke, Virginia. Urban For. Urban Green. 2015, 14, 519–526. [Google Scholar] [CrossRef]
  36. Crabbé, P.; Holland, A.; Ryszkowski, L.; Westra, L. Implementing Ecological lntegrity: Restoring Regional and Global Environmental and Human Health; Springer: Berlin/Heidelberg, Germany, 2000; 490p. [Google Scholar]
  37. Daily, G.C. Nature’s Services: Societal Dependence on Natural Ecosystems; Island Press: Washington, DC, USA, 1997. [Google Scholar]
  38. De Groot, R.; van der Perk, J.; Chiesura, A.; Marguliew, S. Ecological functions and socioeconomic values of critical natural capital as a measure for ecological integrity and environmental health. In Implementing Ecological lntegrity: Restoring Regional and Global Environmental and Human Health; Crabbé, P., Holland, A., Ryszkowski, L., Westra, L., Eds.; Springer: Berlin/Heidelberg, Germany, 2000; Chapter 12; pp. 191–214. [Google Scholar]
  39. Jacobs, S.; Burkhard, B.; Van Daele, T.; Staes, J.; Schneiders, A. ‘The Matrix Reloaded’: A review of expert knowledge use for mapping ecosystem services. Ecol. Model. 2015, 295, 21–30. [Google Scholar] [CrossRef]
  40. Maes, J.; Egoh, B.; Willemen, L.; Liquete, C.; Vihervaara, P.; Schägner, J.P.; Grizzetti, B.; Drakou, E.G.; La Notte, A.; Zulian, G.; et al. Mapping ecosystem services for policy support and decision making in the European Union. Ecosyst. Serv. 2012, 1, 31–39. [Google Scholar] [CrossRef]
  41. Nunes, C.A.; Berenguer, E.; França, F.; Ferreira, J.; Lees, A.C.; Louzada, J.; Sayer, E.J.; Solar, R.; Smith, C.C.; Aragão, L.E.O.C.; et al. Linking land-use and land-cover transitions to their ecological impact in the Amazon. Proc. Natl. Acad. Sci. USA 2022, 119, e2202310119. [Google Scholar] [CrossRef] [PubMed]
  42. Muratet, A.; Porcher, E.; Devictor, V.; Arnal, G.; Moret, J.; Wright, S.; Machon, N. Evaluation of floristic diversity in urban areas as a basis for habitat management. Appl. Veg. Sci. 2008, 11, 451–460. [Google Scholar] [CrossRef]
  43. Horta, M.B.; Cabral, M.I.; Pires, I.; Bachi, L.S.; Luz, A.; Fernandes, G.W.; Drumond, M.A.; Caravalho-Ribeiro, S. Assessing urban ecosystem services: Different methodological approaches applied in Brazil, Germany, and Portugal. Chapter 8. In Handbook of Research on Methods and Tools for Assessing Cultural Landscape Adaptation; Rosa, I.S., Lopes, J.C., Ribeiro, R., Mendes, A., Eds.; Engineering Science Reference; IGI Global: Hershey, PA, USA, 2018; pp. 183–220. [Google Scholar]
  44. Shuster, W.; Barkasi, A.; Clark, P.; Dadio, S.; Drohan, P.; Furio, B.; Gerber, T.; Houser, T.; Kelty, A.; Losco, R.; et al. Moving beyond the Udorthent—A Proposed Protocol for Assessing Urban Soils to Service Data Needs for Contemporary Urban Ecosystem Management. Soil Horiz. 2011, 52, 1–8. [Google Scholar] [CrossRef]
  45. Smith, M.L. Urban empty spaces. Contentious places for consensus-building. Archaeol. Dialog 2008, 15, 216–231. [Google Scholar] [CrossRef]
  46. Nefs, M. Unused urban space: Conservation or transformation? Polemics about the future of urban wastelands and abandoned buildings. City Time 2006, 2, 47–58. Available online: http://www.ct.ceci-br.org (accessed on 1 January 2022).
  47. Larangeira, A. Vacant Land in Latin America: Challenges and Opportunities; Working Paper; Lincoln Institute of Land Policy: Cambridge, MA, USA, 2003. [Google Scholar]
  48. Kim, G. The Public Value of Urban Vacant Land: Social Responses and Ecological Value. Sustainability 2016, 8, 486. [Google Scholar] [CrossRef]
  49. Spirn, A.W.; Cameron, M.; Pollio, M.; Smith, W.G. Vacant land: A resource for reshaping urban neighborhoods. In The West Philadelphia Landscape Plan; Department of Landscape Architecture and Regional Planning, University of Pennsylvania: Philadelphia, PA, USA, 1991. [Google Scholar]
  50. Anderson, E.C.; Minor, E.S. Vacant lots: An underexplored resource for ecological and social benefits in cities. Urban For. Urban Green. 2017, 21, 146–152. [Google Scholar] [CrossRef]
  51. Bernt, M. The Limits of Shrinkage: Conceptual Pitfalls and Alternatives in the Discussion of Urban Population Loss. Int. J. Urban Reg. Res. 2016, 40, 441–450. [Google Scholar] [CrossRef]
  52. Bowman, A.O.; Pagano, M.A. Terra Incognita: Vacant Land and Urban Strategies; Georgetown University Press: Washington, DC, USA, 2004. [Google Scholar]
  53. Kremer, P.; Hamstead, Z.A.; McPhearson, T. A social–ecological assessment of vacant lots in New York City. Landsc. Urban Plan. 2013, 120, 218–233. [Google Scholar] [CrossRef]
  54. Maes, M.J.; Jones, K.E.; Toledano, M.B.; Milligan, B. Mapping synergies and trade-offs between urban ecosystems and the sustainable development goals. Environ. Sci. Policy 2019, 93, 181–188. [Google Scholar] [CrossRef]
  55. Oliveira, J.A.; Bellezoni, R.A.; Shih, W.Y.; Bayulken, B. Innovations in Urban Green and Blue Infra-structure: Tackling local and global challenges in cities. J. Clean. Prod. 2022, 362, 132355. [Google Scholar] [CrossRef]
  56. Felson, A.; Pollak, L. Experimentos urbanos ecológicos em espaços públicos. Capítulo 7. In Urbanismo Ecológico São Paulo; Mostafavi, M., Doherty, G., Canedo, J., Eds.; Gustavo Gili (GG): Barcelona, Spain, 2014; pp. 356–363. [Google Scholar]
  57. Hara, Y.; Murakami, A.; Tsuchiya, K.; Palijon, A.M.; Yokohari, M. A quantitative assessment of vegetable farming on vacant lots in an urban fringe area in Metro Manila: Can it sustain long-term local vegetable demand? Appl. Geogr. 2013, 41, 195–206. [Google Scholar] [CrossRef]
  58. McPhearson, T.; Kremer, P.; Hamstead, Z.A. Mapping ecosystem services in New York City: Applying a social–ecological approach in urban vacant land. Ecosyst. Serv. 2013, 5, 11–26. [Google Scholar] [CrossRef]
  59. Ramirez-Rubio, O.; Gonzalo, C.D.; Fanjul, M.G.; Muller, N.; Pajin, L.; Plasencia, A.; Rojas-Rueda, D.; Meelan, T.; Nieu-wenhuijsen, M.J. Urban health: An example of a “health in all policies” ap-proach in the context of SDGs implementation. Glob. Health 2019, 15, 1–21. [Google Scholar] [CrossRef] [PubMed]
  60. Pearsall, H.; Christman, Z. Tree-lined lanes or vacant lots? Evaluating non-stationarity between urban greenness and socio-economic conditions in Philadelphia, Pennsylvania, USA at multiple scales. Appl. Geogr. 2012, 35, 257–264. [Google Scholar] [CrossRef]
  61. Basso, F.; Bove, E.; Dumontet, S.; Ferrara, A.; Pisante, M.; Quaranta, G.; Taberner, M. Evaluating environmental sensitivity at the basin scale through the use of geographic information systems and remotely sensed data: An example covering the Agri basin (Southern Italy). CATENA 2000, 40, 19–35. [Google Scholar] [CrossRef]
  62. Hadeel, A.S.; Jabbar, M.T.; Chen, X. Application of remote sensing and GIS in the study of environmental sensitivity to desertification: A case study in Basrah Province, southern part of Iraq. Appl. Geomat. 2010, 2, 101–112. [Google Scholar] [CrossRef]
  63. Grandi, T.S.M.; Carvalho, R.C.F.; del Vigna, E.A.G.; Rennó, R.L. Levantamento florístico da margem da Lagoa da Pampulha, Belo Horizonte, Minas Gerais. In Anais do Seminário da Bacia Hidrográfica da Pampulha; SEGRAC: Belo Horizonte, Brazil, 1992; pp. 15–29. [Google Scholar]
  64. Instituto Brasileiro de Geografia e Estatística (IBGE). Mapas Interativos. Mapa de Biomas. 2005. Available online: http://mapas.ibge.gov.br/biomas2/viewer.htm (accessed on 1 January 2022).
  65. Cochran, W.G. Sampling Techniques; John Wiley and Sons: New York, NY, USA, 1977. [Google Scholar]
  66. Belo Horizonte, Lei Municipal nº 8327, de 07 de Fevereiro de 2002. Dispõe Sobre Plantio, Extração, Poda, Substituição de Árvores e dá Outras Providências. 2002. Available online: https://cm-belo-horizonte.jusbrasil.com.br/legislacao/236821/lei-8327-02 (accessed on 1 January 2022).
  67. Belo Horizonte, 2009. Lei Municipal nº 9725, de 15 de Julho de 2009. Institui o Código de Edificações do Município de Belo Horizonte e dá Outras Providências. Available online: https://www.cmbh.mg.gov.br/atividade-legislativa/pesquisar-legislacao/lei/9725/2009 (accessed on 1 January 2022).
  68. Belo Horizonte, 2010. Lei Municipal nº 9959, de 20 de Julho de 2010. Altera a Lei n° 7.165, de 27 de Agosto de 1996, a Lei n° 7.166, de 27 de Agosto de 1996, Estabelece Normas e Condições Para a Urbanização e a Regularização Fundiária da Zona de Especial Interesse Social-ZEIS, dispõe sobre Parcelamento, Ocupação e Uso do solo nas Áreas de Especial Interesse Social-AEIS, e dá Outras Providências. Available online: https://www.cmbh.mg.gov.br/atividade-legislativa/pesquisar-legislacao/lei/9959/2010 (accessed on 1 January 2022).
  69. De Marco, J.C. Requisitos de desenvolvimento sustentável na legislação urbanística de Belo Horizonte: O caso da taxa de permeabilidade. In Monografia–Especialização; Universidade Federal de Minas Gerais, UFMG: Belo Horizonte, Brazil, 2013; 225p. [Google Scholar]
  70. Perera, A.H.; Drew, C.A.; Johnson, C.J. Expert Knowledge and Its Application in Landscape Ecology; Springer: New York, NY, USA, 2012. [Google Scholar]
  71. Tempfli, K.; Kerle, N.; Huurneman, G.C.; Janssen, L.L.F. Principles of Remote Sensing; ITC: En-schede, The Netherlands, 2009; p. 591. [Google Scholar]
  72. Felix, D.F. Composição Florística do Museu de História Natural e Jardim Botânico da Universidade Federal de Minas Gerais, Belo Horizonte, Minas Gerais; Dissertação de Mestrado; ICB: Belo Horizonte, Brazil; UFMG: Belo Horizonte, Brazil, 2009; p. 111. [Google Scholar]
  73. Miranda, P.L.S. Estrutura e Diversidade Do Estrato Arbóreo De Fragmentos Florestais Secundários Urbanos De Belo Horizonte Com Diferentes Tamanhos e Históricos De Impacto; Departamento de Botânica, ICB: Belo Horizonte, Brazil; UFMG, Dissertação de Mestrado: Belo Horizonte, Brazil, 2014; p. 83. [Google Scholar]
  74. Brasil, 2007. Ministério do Meio Ambiente (MMA). Conselho Nacional do Meio Ambiente (CONAMA). Resolução CONAMA Nº 393, de 25 de Junho de 2007. Definição de Vegetação Primária e Secundária de Regeneração de Mata Atlântica no Estado de Minas Gerais. Available online: https://www.siam.mg.gov.br/sla/download.pdf?idNorma=6991 (accessed on 1 January 2022).
  75. Fernandes, G.W.; Pedroni, F.; Sanchez, M.; Scariot, A.; Aguiar, L.M.S.; Ferreira, G.; Machado, R.; Ferreira, M.E.; Diniz, S.; Pinheiro, R.; et al. Cerrado: Em Busca de Soluções Sustentáveis; v.1.; Editora Vozes: Rio de Janeiro, Brazil, 2018; 211p. [Google Scholar]
  76. Oliveira-Filho, A.T.; Ratter, J.A. Vegetation Physiognomies and Woody Flora of the Cerrado Biome. In The Cerrados of Brazil: Ecology and Natural History of a Neotropi-Cal Savanna; Oliveira, P.S., Marquis, R.J., Eds.; Columbia University Press: New York, NY, USA, 2002; pp. 91–120. [Google Scholar]
  77. Rizzini, C.T. Tratado de Fitogeografia do Brasil: Aspectos Sociológicos e Florísticos: Hucitec Ltda; Editora da Universidade de São Paulo: São Paulo, Brazil, 1979; v.2; 374p. [Google Scholar]
  78. van Tongeren, O.F.R. Cluster Analysis. In Data Analysis in Community and Landscape Ecology; Jongman, R.H.G., ter Braak, C.J.F., van Tongeren, O.F.R., Eds.; Cambridge University Press: New York, NY, USA, 1995; Chapter 6; pp. 174–212. [Google Scholar]
  79. Gjorgjioski, V.; Dzeroski, S.; White, M. Clustering Analysis of Vegetation Data; Technical Report 10065; Jožef Stefan Institute: Ljubljana, Slovenia, 2008. [Google Scholar]
  80. Scott, A.J.; Knott, M. A Cluster Analysis Method for Grouping Means in the Analysis of Variance. Biometrics 1974, 30, 507. [Google Scholar] [CrossRef]
  81. De Groot, R.S.; Wilson, M.A.; Boumans, R.M.J. A typology for the classification, description and valuation of ecosystem functions, goods and services. Ecol. Econ. 2002, 41, 393–408. [Google Scholar] [CrossRef]
  82. Lovell, S.T.; DeSantis, S.; Nathan, C.A.; Olson, M.B.; Méndez, V.E.; Kominami, H.C.; Erickson, D.L.; Morris, K.S.; Morris, W.B. Integrating agroecology and landscape multifunctionality in Vermont: An evolving framework to evaluate the design of agroecosystems. Agric. Syst. 2010, 103, 327–341. [Google Scholar] [CrossRef]
  83. Lovell, S.T.; Taylor, J.R. Supplying urban ecosystem services through multifunctional green infrastructure in the United States. Landsc. Ecol. 2013, 28, 1447–1463. [Google Scholar] [CrossRef]
  84. Burkhard, B.; Kroll, F.; Müller, F.; Windhorst, W. Landscapes’ capacities to provide ecosystem services—A concept for land-cover based assessments. Landsc. Online 2009, 15, 1–22. [Google Scholar] [CrossRef]
  85. Charrad, M.; Ghazzali, N.; Boiteux, V.; Niknafs, A. NbClust: An R Package for Determining the Relevant Number of Clusters in a Data Set. J. Stat. Softw. 2014, 61, 1–36. [Google Scholar] [CrossRef]
  86. R Core Team. R: A Language and Environment for Statistical Computing; R Foundation for Statistical Computing: Vienna, Austria, 2023; Available online: https://www.R-project.org/ (accessed on 1 January 2022).
  87. Belo Horizonte, 2012. Lei Municipal nº 10.534, de 10 de Setembro de 2012. Dispõe sobre a Limpeza Urbana, Seus Serviços e o Manejo de Resíduos Sólidos Urbanos no Município, e dá Outras Providências. Available online: https://www.cmbh.mg.gov.br/atividade-legislativa/pesquisar-legislacao/lei/10534/2012 (accessed on 1 January 2022).
  88. Robinson, S.L.; Lundholm, J.T. Ecosystem services provided by urban spontaneous vegetation. Urban Ecosyst. 2012, 15, 545–557. [Google Scholar] [CrossRef]
  89. Effland, W.R.; Pouyat, R.V. The genesis, classification, and mapping of soils in urban areas. Urban Ecosyst. 1997, 1, 217–228. [Google Scholar] [CrossRef]
  90. Pickett, S.T.A.; Cadenasso, M.L.; Grove, J.M.; Nilon, C.H.; Pouyat, R.V.; Zipperer, W.C.; Costanza, R. Urban Ecological Systems: Linking Terrestrial Ecological, Physical, and Socioeconomic Components of Metropolitan Areas. Annu. Rev. Ecol. Syst. 2001, 32, 127–157. [Google Scholar] [CrossRef]
  91. Lal, R. Soil carbon sequestration to mitigate climate change. Geoderma 2004, 123, 1–22. [Google Scholar] [CrossRef]
  92. Morel, J.L.; Chenu, C.; Lorenz, K. Ecosystem services provided by soils of urban, industrial, traffic, mining, and military areas (SUITMAs). J. Soils Sediments 2015, 15, 1659–1666. [Google Scholar] [CrossRef]
  93. Gilbert, O. The Ecology of Urban Habitats; Chapman and Hall: London, UK; New York, NY, USA, 1989. [Google Scholar]
  94. Arreguy, C.A.C.; Ribeiro, R.R. Histórias de bairros de Belo Horizonte: Regionais Barreiro, Centro-Sul, Leste, Nordeste, Noroeste, Oeste, Pampulha, Venda Nova Belo Horizonte, Minas Gerais: APCBH.; ACAP-BH. 2008. Available online: https://crb6.org.br/materias/colecao-historias-de-bairros-de-belo-horizonte/ (accessed on 1 January 2023).
  95. Manes, F.; Salvatori, E. Ecosystem Services of urban trees: The case of Rome. Agrochimica 2014, 58, 222–233. [Google Scholar] [CrossRef]
  96. Roshnath, R.; Sinu, P.A. Nesting tree characteristics of heronry birds of urban ecosystems in peninsular India: Implications for habitat management. Curr. Zool. 2017, 63, 599–605. [Google Scholar] [CrossRef] [PubMed]
  97. Ganz, L. Lotes Vagos: Ação Coletiva De Ocupação Urbana Experimental; ARS (São Paulo) USP: São Paulo, Brazil, 2008; p. 6. [Google Scholar] [CrossRef]
  98. Sunita; Kumar, D.; Shahnawaz; Shekhar, S. Evaluating urban green and blue spaces with space-based multi-sensor datasets for sustainable development. Comput. Urban Sci. 2023, 3, 1–25. [Google Scholar] [CrossRef]
  99. White, M.P.; Elliott, L.R.; Grellier, J.; Economou, T.; Bell, S.; Bratman, G.N.; Cirach, M.; Gascon, M.; Lima, M.L.; Lõhmus, M.; et al. Associations between green/blue spaces and mental health across 18 countries. Sci. Rep. 2021, 11, 1–12. [Google Scholar] [CrossRef]
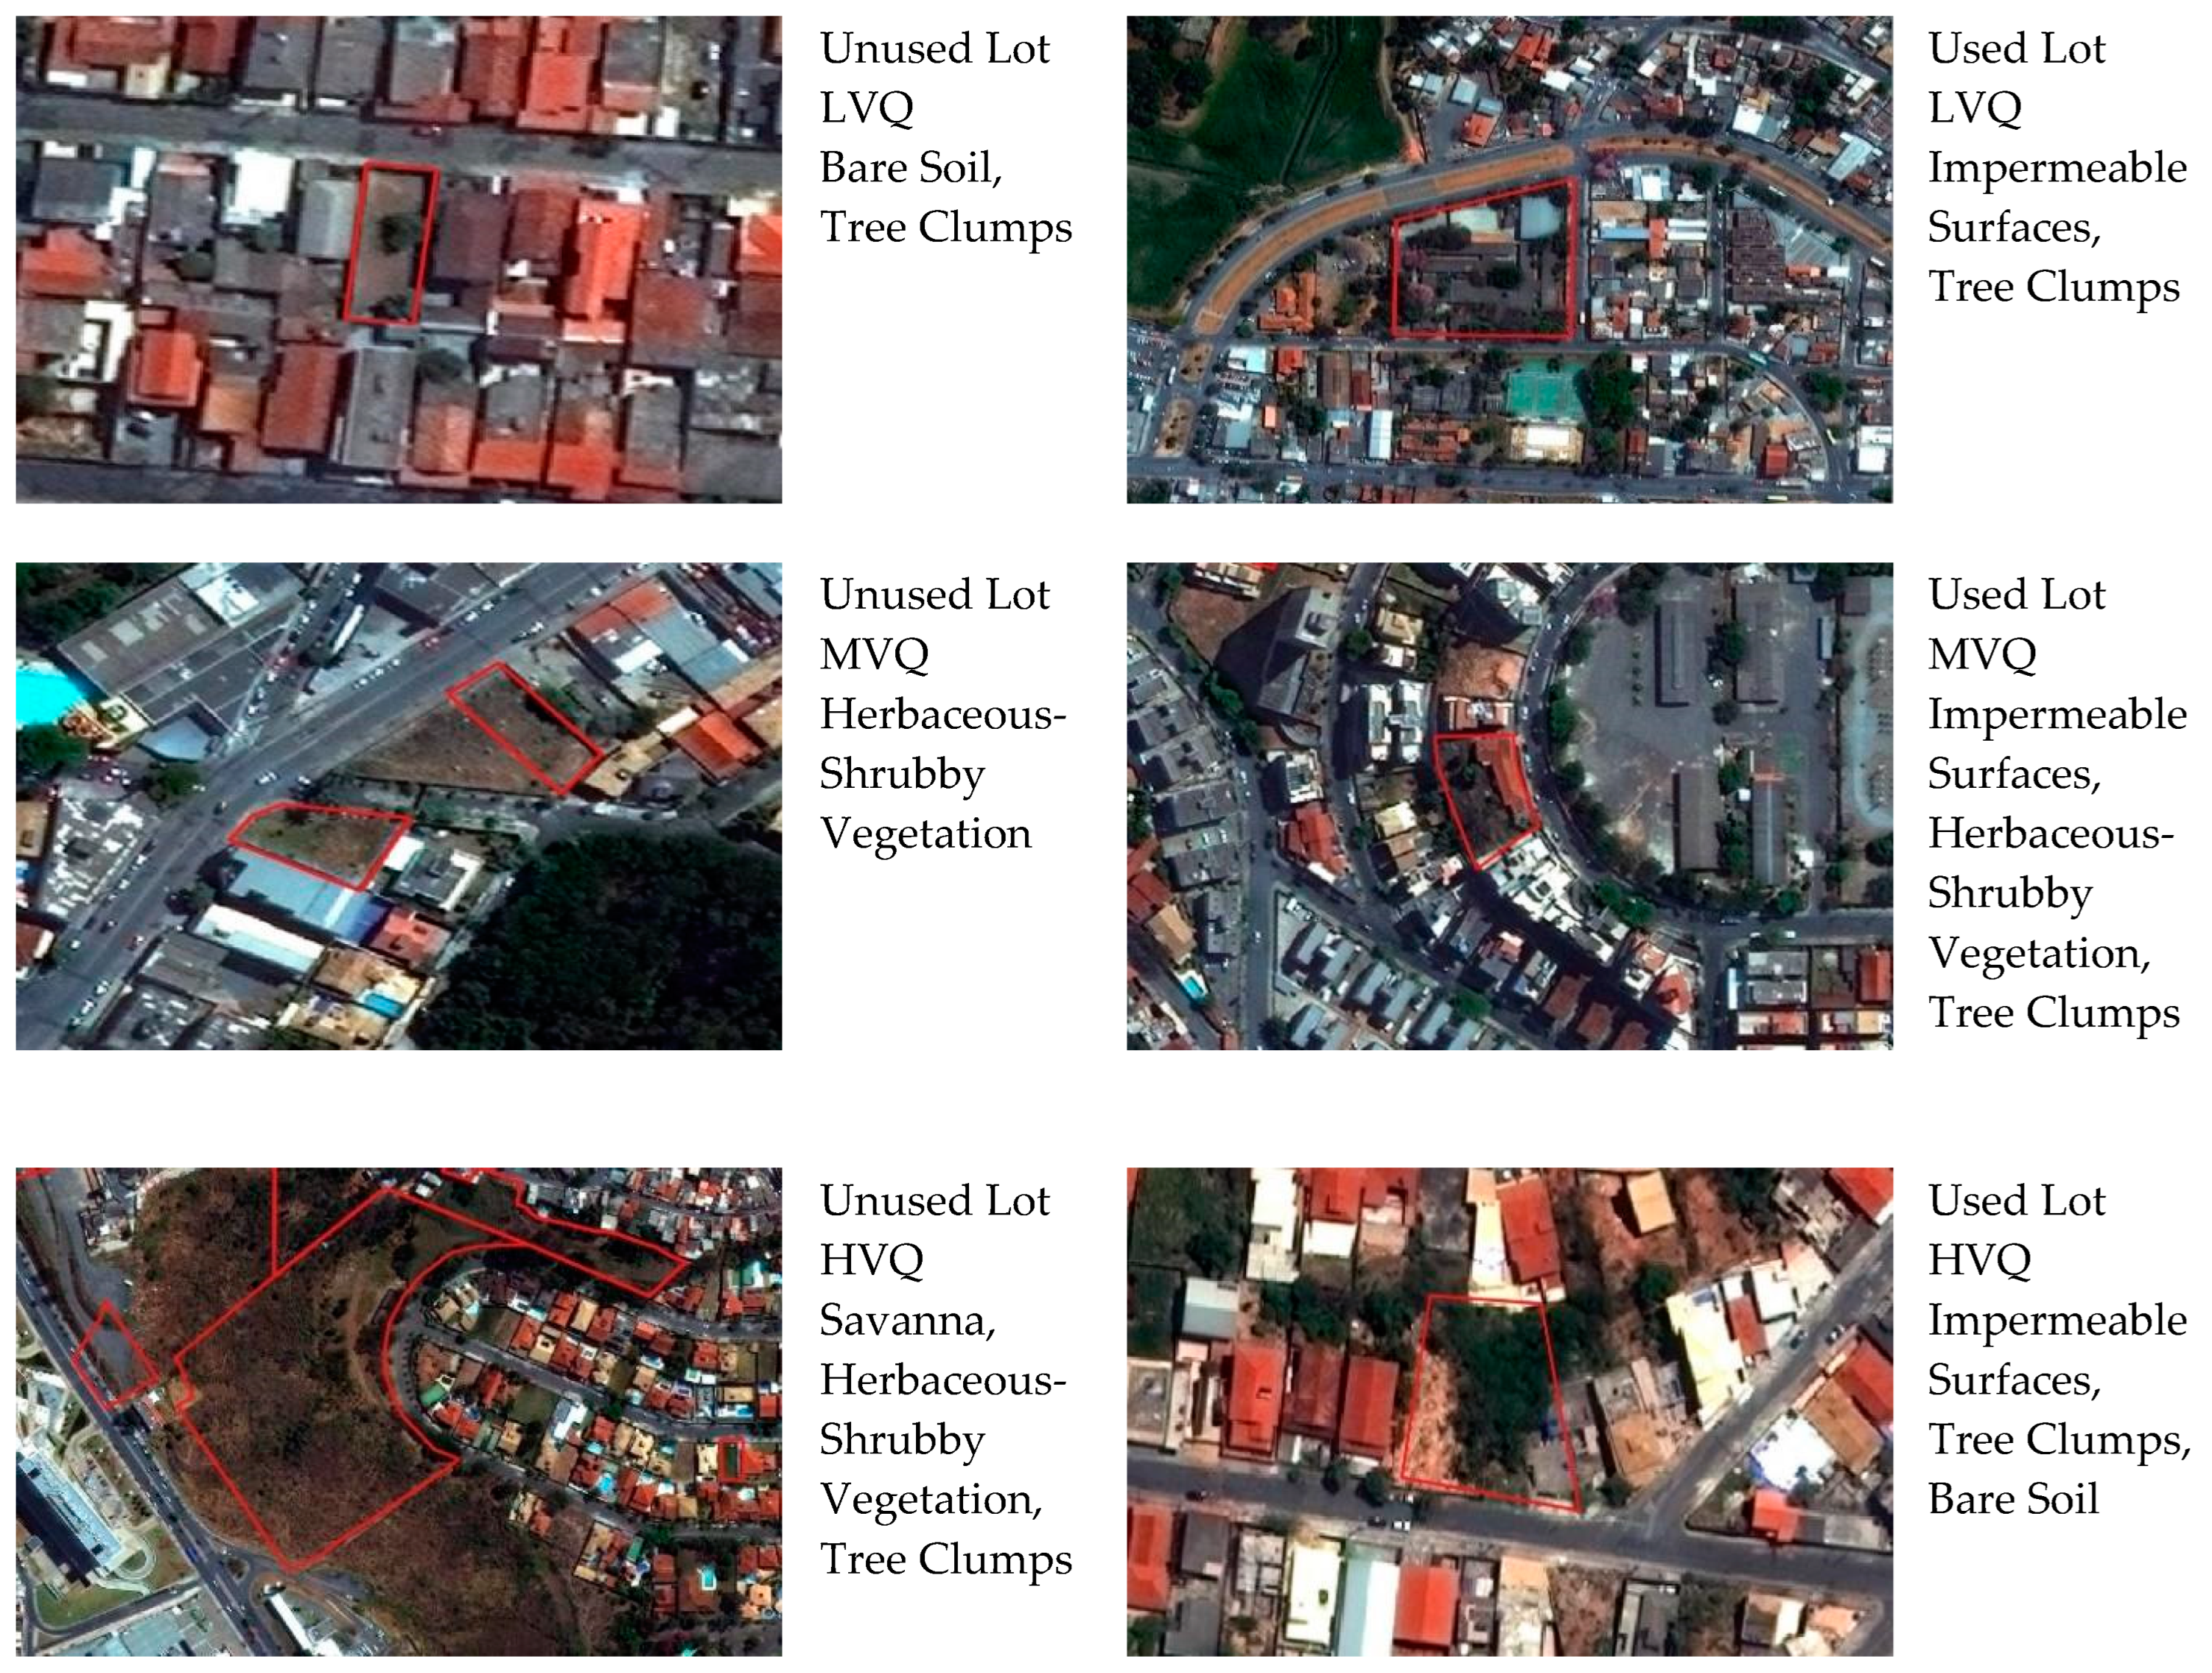
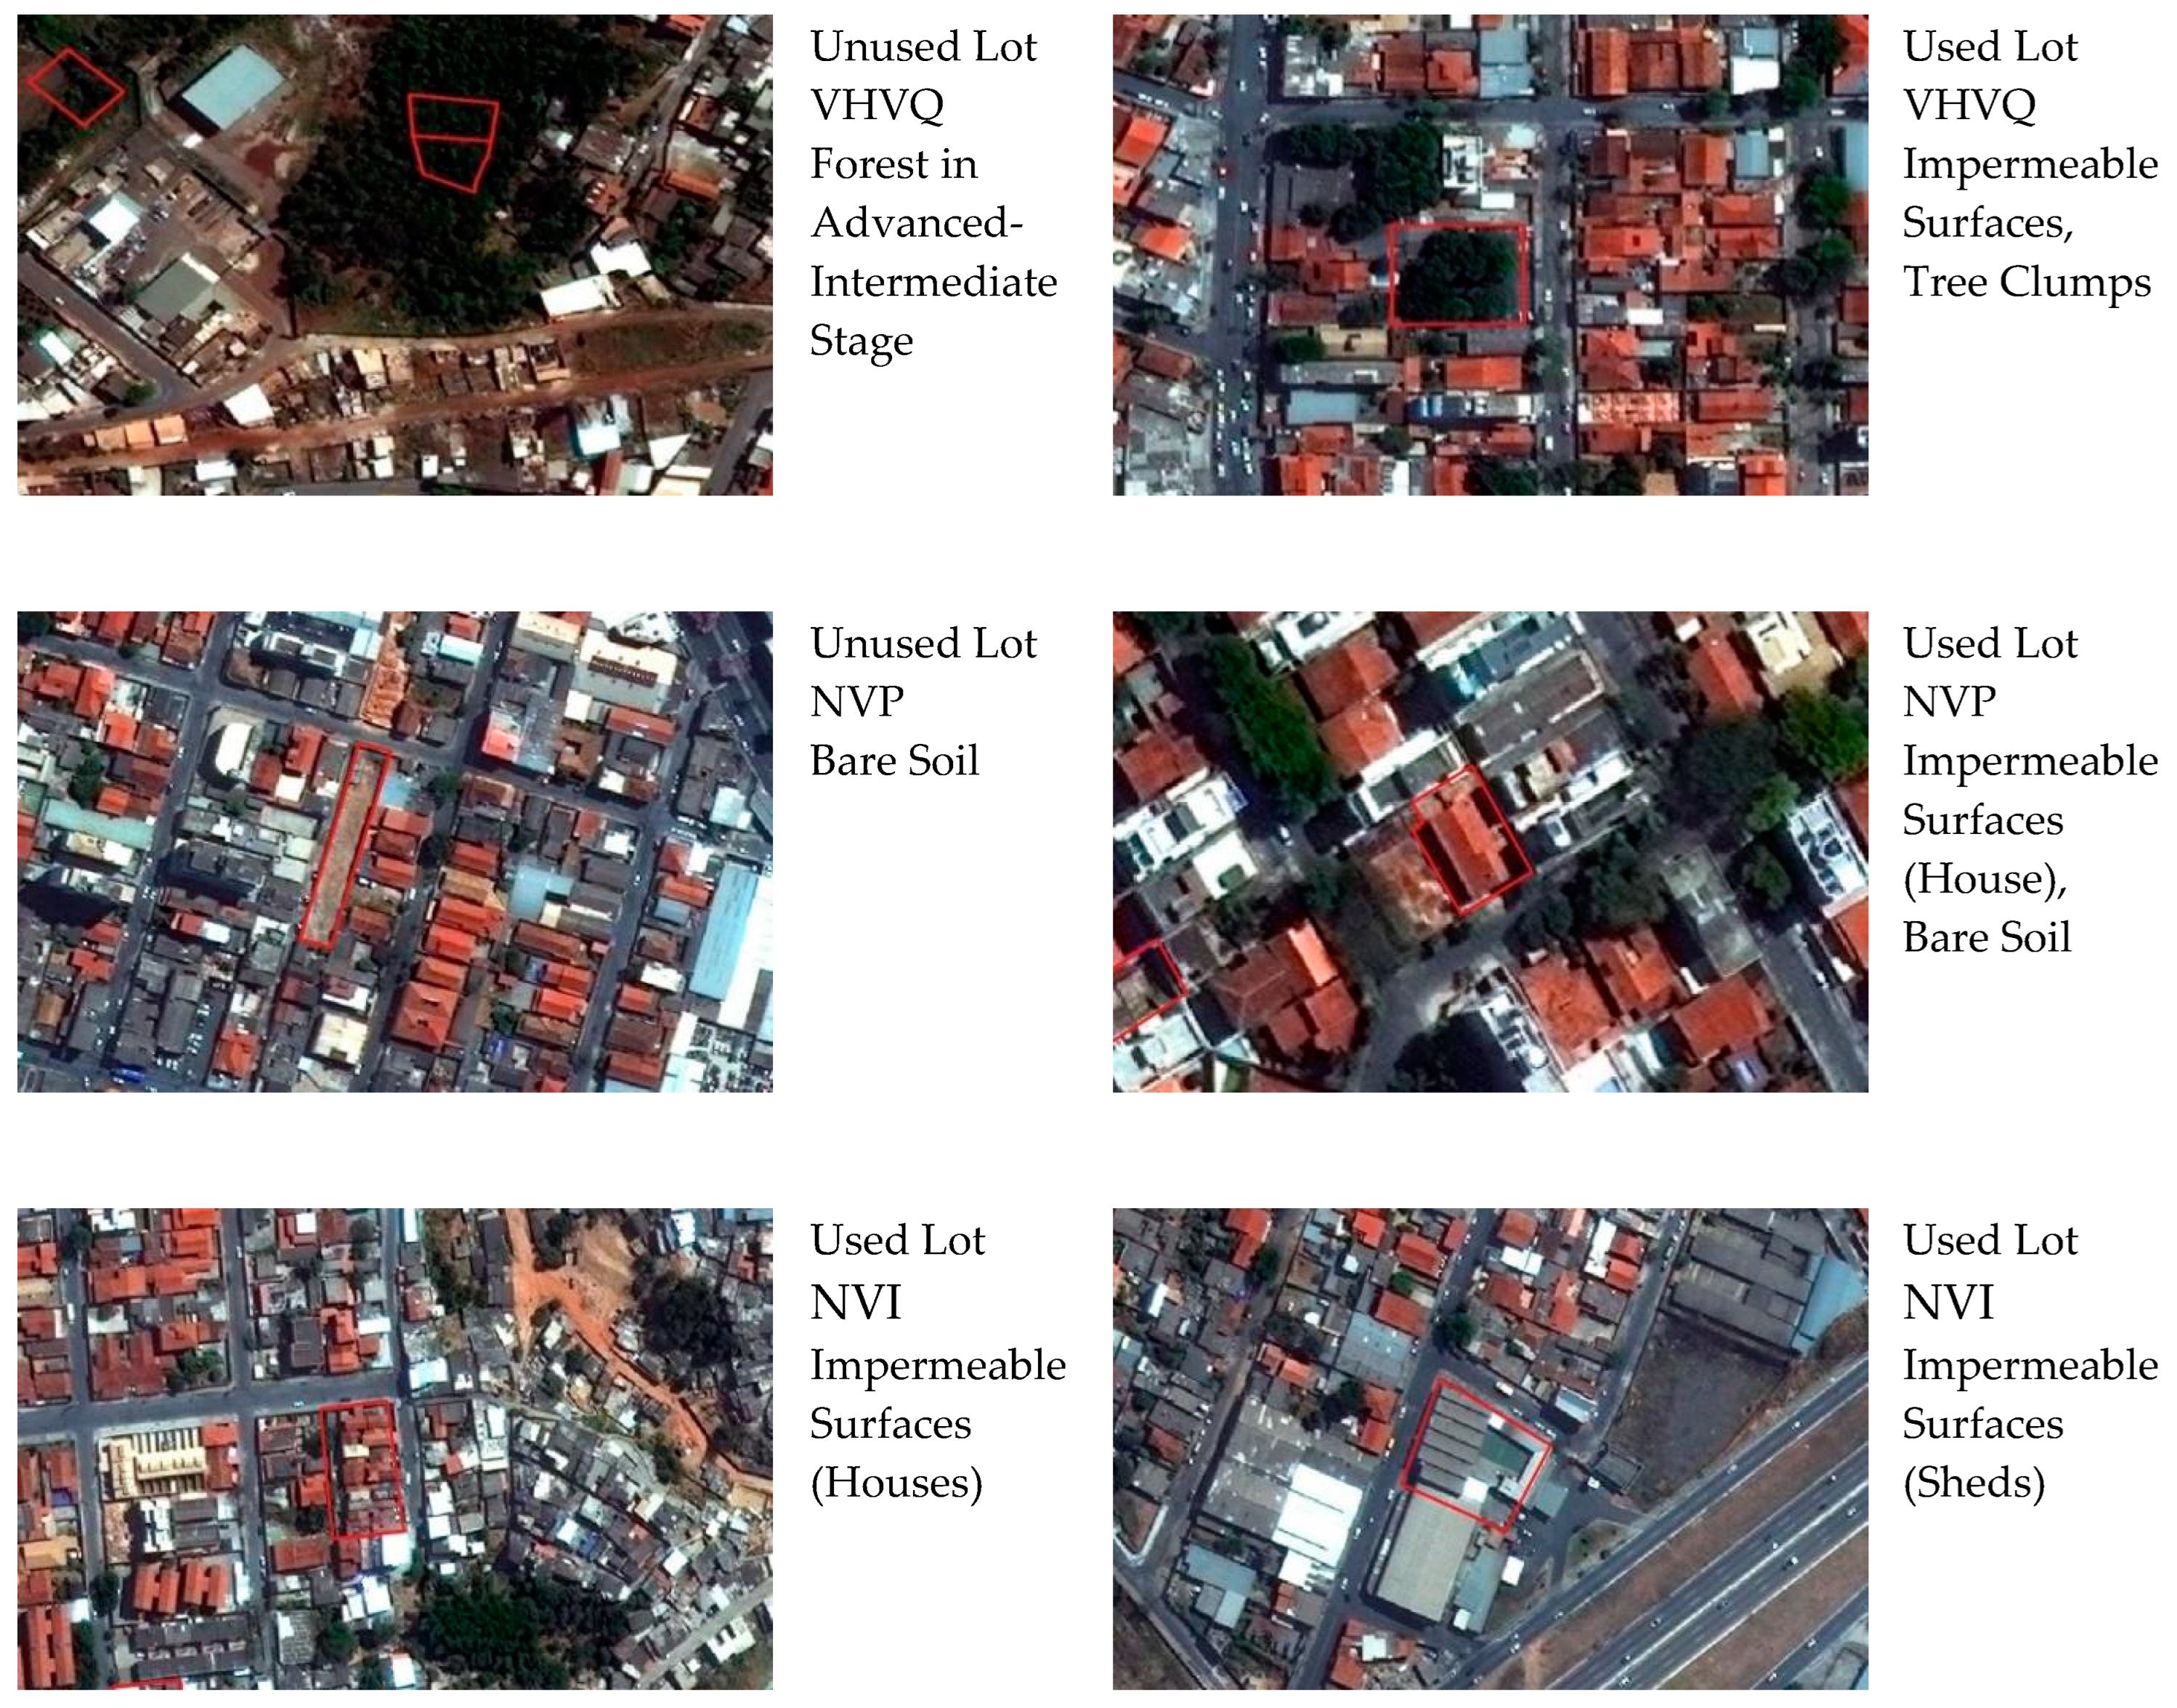
Figure 1. Study area comprising the city of Belo Horizonte and its nine administrative units (South America).
Sustainability 16 03063 g001
Figure 2. Land cover map for vacant lots sampled in the city of Belo Horizonte, Brazil.
Sustainability 16 03063 g002
Figure 3. Total population of sampled vacant lots in the city of Belo Horizonte, organized according to their distributions among vegetation quality classes (LVQ—low vegetation quality; MVQ—moderate vegetation quality; HVQ—high vegetation quality; VHVQ—very high vegetation quality; NVP—no vegetation permeable; NVI—no vegetation impermeable) (N = 2828).
Sustainability 16 03063 g003
Figure 4. Distribution of vegetation quality classes within and among administrative units of the city of Belo Horizonte, Brazil (N = 2828).
Sustainability 16 03063 g004
Figure 5. Distribution of lots among size classes for each vegetation quality class (N = 2828).
Sustainability 16 03063 g005
Figure 6. Sampled used and unused lots according to: (a) number of lots per vegetation quality class; (b) number of lots per permeability class; (c) number of lots per land ownership type (private/public); (d) number of lots per size class (used: N = 1370; unused: N = 1458).
Sustainability 16 03063 g006
Figure 7. Types of urban lots, land cover composition, and vegetation quality classes (N = 2828) (LVQ—low vegetation quality; MVQ—moderate vegetation quality; HVQ—high vegetation quality; VHVQ—very high vegetation quality; NVP—no vegetation permeable; NVI—no vegetation impermeable).
Sustainability 16 03063 g007aSustainability 16 03063 g007b
Figure 8. Land cover clusters, ecological functions, and overall ecological performance (N = 2828).
Sustainability 16 03063 g008
Table 1. Vegetation quality classes and expected land cover percentages for sampled vacant lots in the city of Belo Horizonte, Brazil.
Vegetation Quality ClassesAcronymComponentsPercentage
Very High Vegetation QualityVHVQForest in Advanced–Intermediate Stage of Regeneration>75–100%
Very High Vegetation Quality
VHVQ
VHVQ
Forest in Initial Stage of Regeneration
Savanna; Tree Clumps
>75–100%
>75–100%
High Vegetation QualityHVQForest in Advanced-Intermediate Stage of Regeneration>50–75%
High Vegetation QualityHVQForest in Initial Stage of Regeneration>50–75%
High Vegetation QualityHVQSavanna; Tree Clumps>50–75%
Moderate Vegetation QualityMVQForest in Advanced-Intermediate Stage of Regeneration>25–50%
Moderate Vegetation QualityMVQForest in Initial Stage of Regeneration>25–50%
Moderate Vegetation Quality
MVQ
MVQ
Savanna; Tree Clumps
Herbaceous-Shrubby Vegetation; Pasture; Agriculture
>25–50%
>50–100%
Low Vegetation QualityLVQForest in Advanced-Intermediate Stage of Regeneration>0–25%
Low Vegetation Quality
LVQ
LVQ
LVQ
Forest in Initial Stage of Regeneration
Savanna; Tree Clumps
Herbaceous-Shrubby Vegetation; Pasture; Agriculture
>0–25%
>0–25%
>0–50%
No Vegetation PermeableNVPBare Soil100%
No Vegetation PermeableNVPWater100%
No Vegetation ImpermeableNVIAsphalt, Cement, Construction100%
Table 2. Land cover combinations and their distribution among vegetation quality classes for unused lots (N = 1458).
Land CoverLVQMVQHVQVHVQNVPTotal
1—Bare Soil----210210
2—Forest in Advanced-Intermediate Stage/Tree Clumps/Herbaceous Shrubby Vegetation-1---1
3—Forest in Advanced-Intermediate Stage/Savanna/Bare Soil---1-1
4—Forest in Advanced-Intermediate Stage/Savanna/Herbaceous Shrubby Vegetation/Bare Soil-1---1
5—Forest in Advanced-Intermediate Stage---10-10
6—Forest in Advanced-Intermediate Stage/Bare Soil--2--2
7—Forest in Advanced-Intermediate Stage/Initial Stage-111-3
8—Forest in Advanced-Intermediate Stage/Initial Stage/Herbaceous Shrubby Vegetation-21--3
9—Forest in Advanced-Intermediate Stage/Initial Stage/Herbaceous-Shrubby Vegetation/Bare Soil-1---1
10—Forest in Advanced-Intermediate Stage/Herbaceous Shrubby Vegetation-354-12
11—Forest in Advanced-Intermediate Stage/Herbaceous-Shrubby Vegetation/Bare Soil-4---4
12—Forest in Advanced-Intermediate Stage/Pasture--1--1
13—Forest in Advanced-Intermediate Stage/Savanna--2 -2
14—Forest in Initial Stage---5-5
15—Forest in Initial Stage/Bare Soil-113-5
16—Forest in Initial Stage/Herbaceous Shrubby Vegetation/Tree Clumps-1- -1
17—Forest in Initial Stage/Herbaceous Shrubby Vegetation11262-21
18—Forest in Initial Stage/Herbaceous-Shrubby Vegetation/Bare Soil11132-17
19—Forest in Initial Stage/Herbaceous-Shrubby Vegetation/Pasture/Bare Soil--1--1
20—Forest in Initial Stage/Savanna/Bare Soil--1--1
21—Forest in Initial Stage/Savanna/Herbaceous Shrubby Vegetation/Bare Soil1----1
22—Forest in Initial Stage/Tree Clumps/Herbaceous-Shrubby Vegetation/Bare Soil-1---1
23—Forest in Initial Stage/Tree Clumps/Herbaceous-Shrubby Vegetation-1---1
24—Forest in Initial Stage/Tree Clumps/Herbaceous-Shrubby Vegetation/Bare Soil-1---1
25—Forest in Initial Stage/Tree Clumps/Herbaceous-Shrubby Vegetation/Water/Bare Soil11---2
26—Herbaceous-Shrubby Vegetation-298---298
27—Herbaceous-Shrubby Vegetation/Bare Soil75216-1-292
28—Herbaceous-Shrubby Vegetation/Tree Clumps-1683024-222
29—Herbaceous-Shrubby Vegetation/Tree Clumps/Agriculture/Bare Soil-1---1
30—Herbaceous-Shrubby Vegetation/Tree Clumps/Bare Soil4588122-147
31—Herbaceous-Shrubby Vegetation/Water-1---1
32—Pasture-1-1-2
33—Savanna---1-1
34—Savanna/Herbaceous-Shrubby Vegetation- 1--1
35—Savanna/Herbaceous-Shrubby Vegetation/Bare Soil-11--2
36—Savanna/Tree Clumps/Herbaceous-Shrubby Vegetation/Bare Soil--1--1
37—Tree Clumps---30-30
38—Tree Clumps/Agriculture/Water/Bare Soil-1---1
39—Tree Clumps/Bare Soil63402523-151
Total187857941102101458
Table 3. Land cover combinations and their distribution among vegetation quality classes for used lots (N = 1370).
Land CoverLVQMVQHVQVHVQNVPNVITotal
1—Impermeable Surfaces-----595595
2—Impermeable Surfaces/Bare Soil----104-104
3—Impermeable Surfaces/Forest in Advanced-Intermediate Stage-1----1
4—Impermeable Surfaces/Forest in Advanced-Intermediate Stage/Bare Soil1-----1
5—Impermeable Surfaces/Forest in Advanced-Intermediate Stage/Forest in Initial Stage--1---1
6—Impermeable Surfaces/Forest in Advanced-Intermediate Stage/Forest in Initial Stage/Herbaceous-Shrubby Vegetation/Bare Soil1-----1
7—Impermeable Surfaces/Forest in Advanced-Intermediate Stage/Forest in Initial Stage/Savanna/Tree Clumps/Herbaceous-Shrubby Vegetation1-----1
8—Impermeable Surfaces/Forest in Advanced-Intermediate Stage/Forest in Initial Stage/Tree Clumps/Herbaceous-Shrubby Vegetation/Bare Soil-1----1
9—Impermeable Surfaces/Forest in Advanced-Intermediate Stage/Herbaceous-Shrubby Vegetation121---4
10—Impermeable Surfaces/Forest in Advanced-Intermediate Stage/Herbaceous-Shrubby Vegetation/Bare Soil11----2
11—Impermeable Surfaces/Forest in Advanced-Intermediate Stage/Tree Clumps1-----1
12—Impermeable Surfaces/Forest in Advanced-Intermediate Stage/Tree Clumps/Herbaceous-Shrubby Vegetation-1----1
13—Impermeable Surfaces/Forest in Advanced-Intermediate Stage/Tree Clumps/Herbaceous-Shrubby Vegetation/Bare Soil-1----1
14—Impermeable Surfaces/Forest in Advanced-Intermediate Stage/Tree Clumps/Herbaceous-Shrubby Vegetation/Pasture-1----1
15—Impermeable Surfaces/Forest in Initial Stage--11--2
16—Impermeable Surfaces/Forest in Initial Stage/Bare Soil2-----2
17—Impermeable Surfaces/Forest in Initial Stage/Herbaceous-Shrubby Vegetation-2----2
18—Impermeable Surfaces/Forest in Initial Stage/Herbaceous-Shrubby Vegetation/Bare Soil11----2
19—Impermeable Surfaces/Forest in Initial Stage/Pasture/Bare Soil-1----1
20—Impermeable Surfaces/Forest in Initial Stage/Savanna-1----1
21—Impermeable Surfaces/Forest in Initial Stage/Tree Clumps-1----1
22—Impermeable Surfaces/Forest in Initial Stage/Tree Clumps/Herbaceous-Shrubby Vegetation1-----1
23—Impermeable Surfaces/Forest in Initial Stage/Tree Clumps/Herbaceous-Shrubby Vegetation/Water1-----1
24—Impermeable Surfaces/Herbaceous-Shrubby Vegetation10131--1-133
25—Impermeable Surfaces/Herbaceous-Shrubby Vegetation/Bare Soil4512----57
26—Impermeable Surfaces/Herbaceous-Shrubby Vegetation/Water3-----3
27—Impermeable Surfaces/Pasture/Bare Soil-1----1
28—Impermeable Surfaces/Savanna/Bare Soil-1 ---1
29—Impermeable Surfaces/Savanna/Tree Clumps/Herbaceous-Shrubby Vegetation-1----1
30—Impermeable Surfaces/Tree Clumps13444104--192
31—Impermeable Surfaces/Tree Clumps/Bare Soil441410-1-69
32—Impermeable Surfaces/Tree Clumps/Bare Soil/Water1-----1
33—Impermeable Surfaces/Tree Clumps/Herbaceous-Shrubby Vegetation722510---107
34—Impermeable Surfaces/Tree Clumps/Herbaceous-Shrubby Vegetation/Bare Soil37181---56
35—Impermeable Surfaces/Tree Clumps/Herbaceous-Shrubby Vegetation/Bare Soil/Water-1----1
36—Impermeable Surfaces/Tree Clumps/Herbaceous-Shrubby Vegetation/Water73-1--11
37—Impermeable Surfaces/Tree Clumps/Water42----6
38—Impermeable Surfaces/Water----3-3
Total4591673461095951370
Table 4. Characteristics of land cover clusters of sampled lots in Belo Horizonte, Brazil (N = 2828).
Cluster
Number
Main
Component
DefinitionNumber of Lots
1Cluster of built-up areasAverage land cover: 89% built-up areas, 4% tree clumps, 4% herbaceous-shrubby vegetation, and 2% bare soil280
2Cluster of
bare soil
Average land cover: 86% bare soil, 5% herbaceous-shrubby vegetation, 5% built-up areas, and 4% tree clumps477
3Cluster of treesAverage land cover: 49% tree clumps, 15% herbaceous-shrubby vegetation, 12% bare soil, 8% built-up areas, 6% forest in advanced-intermediate stage of regeneration, 6% forest in initial stage of regeneration, 2% savanna, and 1% pasture1193
4Cluster of
herbaceous-shrubby vegetation
Average land cover: 84% herbaceous-shrubby vegetation, 8% bare soil, 5% tree clumps, 3% built-up areas, 1% forest in advanced-intermediate stage of regeneration, and 1% forest in initial stage of regeneration878
Disclaimer/Publisher’s Note: The statements, opinions and data contained in all publications are solely those of the individual author(s) and contributor(s) and not of MDPI and/or the editor(s). MDPI and/or the editor(s) disclaim responsibility for any injury to people or property resulting from any ideas, methods, instructions or products referred to in the content.

