Article

Developing an Urban Environment Examination System by Incorporating Construction, Economic, Environmental, Cultural and Development Dimensions

1
School of Art, Southeast University, Nanjing 210096, China
2
School of Architecture and Urban Planning, Qingdao University of Technology, Qingdao 266033, China
3
Institute for Smart City of Chongqing University in Liyang, Chongqing University, Liyang 213300, China
4
Centre for Climate-Resilient and Low-Carbon Cities, School of Architecture and Urban Planning, Key Laboratory of New Technology for Construction of Cities in Mountain Area, Ministry of Education, Chongqing University, Chongqing 400045, China
5
School of Architecture, South China University of Technology, Guangzhou 510640, China
6
State Key Laboratory of Subtropical Building and Urban Science, South China University of Technology, Guangzhou 510641, China
*
Author to whom correspondence should be addressed.
Sustainability 2024, 16(7), 3065; https://doi.org/10.3390/su16073065
Submission received: 30 December 2023 / Revised: 30 March 2024 / Accepted: 2 April 2024 / Published: 7 April 2024

Abstract

:
The sustainable development goals (SDGs) suggest sustainable cities and communities (Goal 11) as inclusive, safe, resilient, and sustainable human settlements. However, existing efforts in urban sustainability have mainly focused on ecological and environmental sustainability, with little attention paid to development, economic, and cultural sustainability. Moreover, a lack of adaptability is a barrier to cross-nation or cross-region implementation of many urban sustainability frameworks due to diverse urban contexts. Furthermore, most studies have developed sustainability frameworks and guides only for one-time assessments and the progress of urban sustainability has been neglected. Improving urban sustainability by considering multiple dimensions and local adaptability through dynamic assessment remains a question. Therefore, this study aims to develop an urban environment examination system (UEES) framework that includes construction, economy and industry, environment and resource, municipal and cultural facilities, and development potential dimensions. The UEES framework consists of 31 indicators associated with critical information (i.e., reported by the statistical yearbooks) from different levels of government in China. An annual update of statistical data ensures the availability of dynamic data, allowing urban managers and decision makers to regularly track urban sustainability. Furthermore, the UEES framework was applied to Qingdao, an urbanizing city in China, to examine the feasibility of the UEES framework. The results indicate that well-urbanized districts could perform better in terms of overall sustainability (e.g., Shinan, Shibei, Laoshan, Chengyang), while districts in suburban and outer suburban areas had lower urban sustainability levels. However, well-urbanized districts could not perform better in all dimensions than suburban and outer suburban districts. Moreover, the transition from less-urbanized to well-urbanized districts could lead to environmental deterioration and economy deceleration (if industries are not well upgraded), but culture and development sustainability can be improved. Overall, this study provides a methodological framework that prioritizes comprehensiveness and local adaptability to perform regular urban environment examinations for urban sustainability in China and provides a reference for urban sustainability improvement by identifying aspects with low scores in Qingdao, China.

1. Introduction

Cities face severe challenges, such as environmental pollution, heat islands, urban flooding, and greenhouse gas (GHG) emissions, due to urbanization, population increase, and climate change [1,2]. These challenges threaten economic growth, environmental quality, and human wellbeing. However, these challenges will aggregate in the future. Authentic data indicate that the proportion of the global population residing in urban areas is approximately 56.2% in 2021, and this figure will increase to 68.4% by 2050 [3,4]. The population increase implies urban densification and sprawl, and thereby the intensification of heat islands [5], which may synergize with climate-induced heat waves, causing more frequent, intense, and severe hazards and threats to cities and communities [6]. To ensure sustainable development, the United Nations released the sustainable development goals (SDGs) in 2015 to chart a bright and achievable sustainable future.
Cities are the main field of SDG implementation as they are the main settlements of human beings. The goal of sustainable cities and communities (Goal 11) requires the development of inclusive, safe, resilient, and sustainable settlements. This goal is interlinked with many other goals such as good health and well-being (Goal 3), clean water and sanitation (Goal 6), affordable and clean energy (Goal 7), decent work and economic growth (Goal 8), responsible consumption and production (Goal 12), and climate action (Goal 13) [7]. However, numerous pieces of evidence suggest that the implementation of these goals is challenging [8]. To some extent, this suggests that the SDG framework at an international scale presents a low implementation capacity, or at least it is essential to localize the SDGs for higher adaptability and better implementation. Accordingly, one of the major missions of SDG implementation is to overcome the barriers preventing the transformation from a series of goals and targets to actual actions by different stakeholders from various fields, at different levels, and within diverse urban contexts.
Along with urbanization, the concept of urban sustainability has evolved, becoming increasingly comprehensive to coordinate more than one dimension [9]. For instance, Goal 11 specifies the requirements for construction, culture, development, economic, and environmental sustainability, with targets for housing, transport systems, urbanization patterns, cultural and natural heritage, natural disaster mitigation and adaptation, and green and public spaces [10]. Nevertheless, all targets and associated dimensions relevant to Goal 11 are contextualized in the urban environment, and a collection of structural and non-structural conditions that exist within a city are fundamental spaces for conducting a series of activities and modifications for sustainability [11]. Structural environments consist of artificial spaces, such as buildings, infrastructure, and public spaces, while natural environments consist of parks, rivers, and green spaces. Non-structural environments are relevant to interactions and dynamics between people and communities within a city [12,13,14].
Actions towards sustainability in the early stages were mainly relevant to urbanization, with the construction of modern buildings, transportation, and water drainage and supply systems proposed for better quality of life. However, this process modified urban natural elements and negatively affected the surrounding geography, (micro)climate, and water sources [15,16]. Furthermore, continuous urbanization has led cities to expand beyond their environmental carrying capacity, resulting in unbearable ecological issues (e.g., global climate change [17], air pollution, water pollution, and urban warming [18,19,20]), which subsequently affect human health [21,22,23,24]. Therefore, to address different challenges in construction, environmental, economic, cultural, and developmental aspects and to support SDG implementation, there is an urgent need to develop a holistic and implementable urban sustainability assessment system.
Beyond a purely novel assessment system development, the system is expected to examine and monitor the progress of urban sustainability annually so that urban managers and decision makers can opportunely capture the status, strength, drawbacks, and future directions of the sustainability initiative. There have been many failed cases, especially in cities with high urbanization rates, owing to the lack of timely assessments, supervision, and corrections However, dynamic monitoring is often limited by the availability of data that are relevant to urban sustainability. This challenge is more prominent when pursuing multiple sustainability goals in construction, environmental, economic, cultural, and developmental dimensions. Ready-to-update datasets can overcome this problem. Otherwise, extensive efforts should be made to collect, calculate, or simulate the data required for assessment.
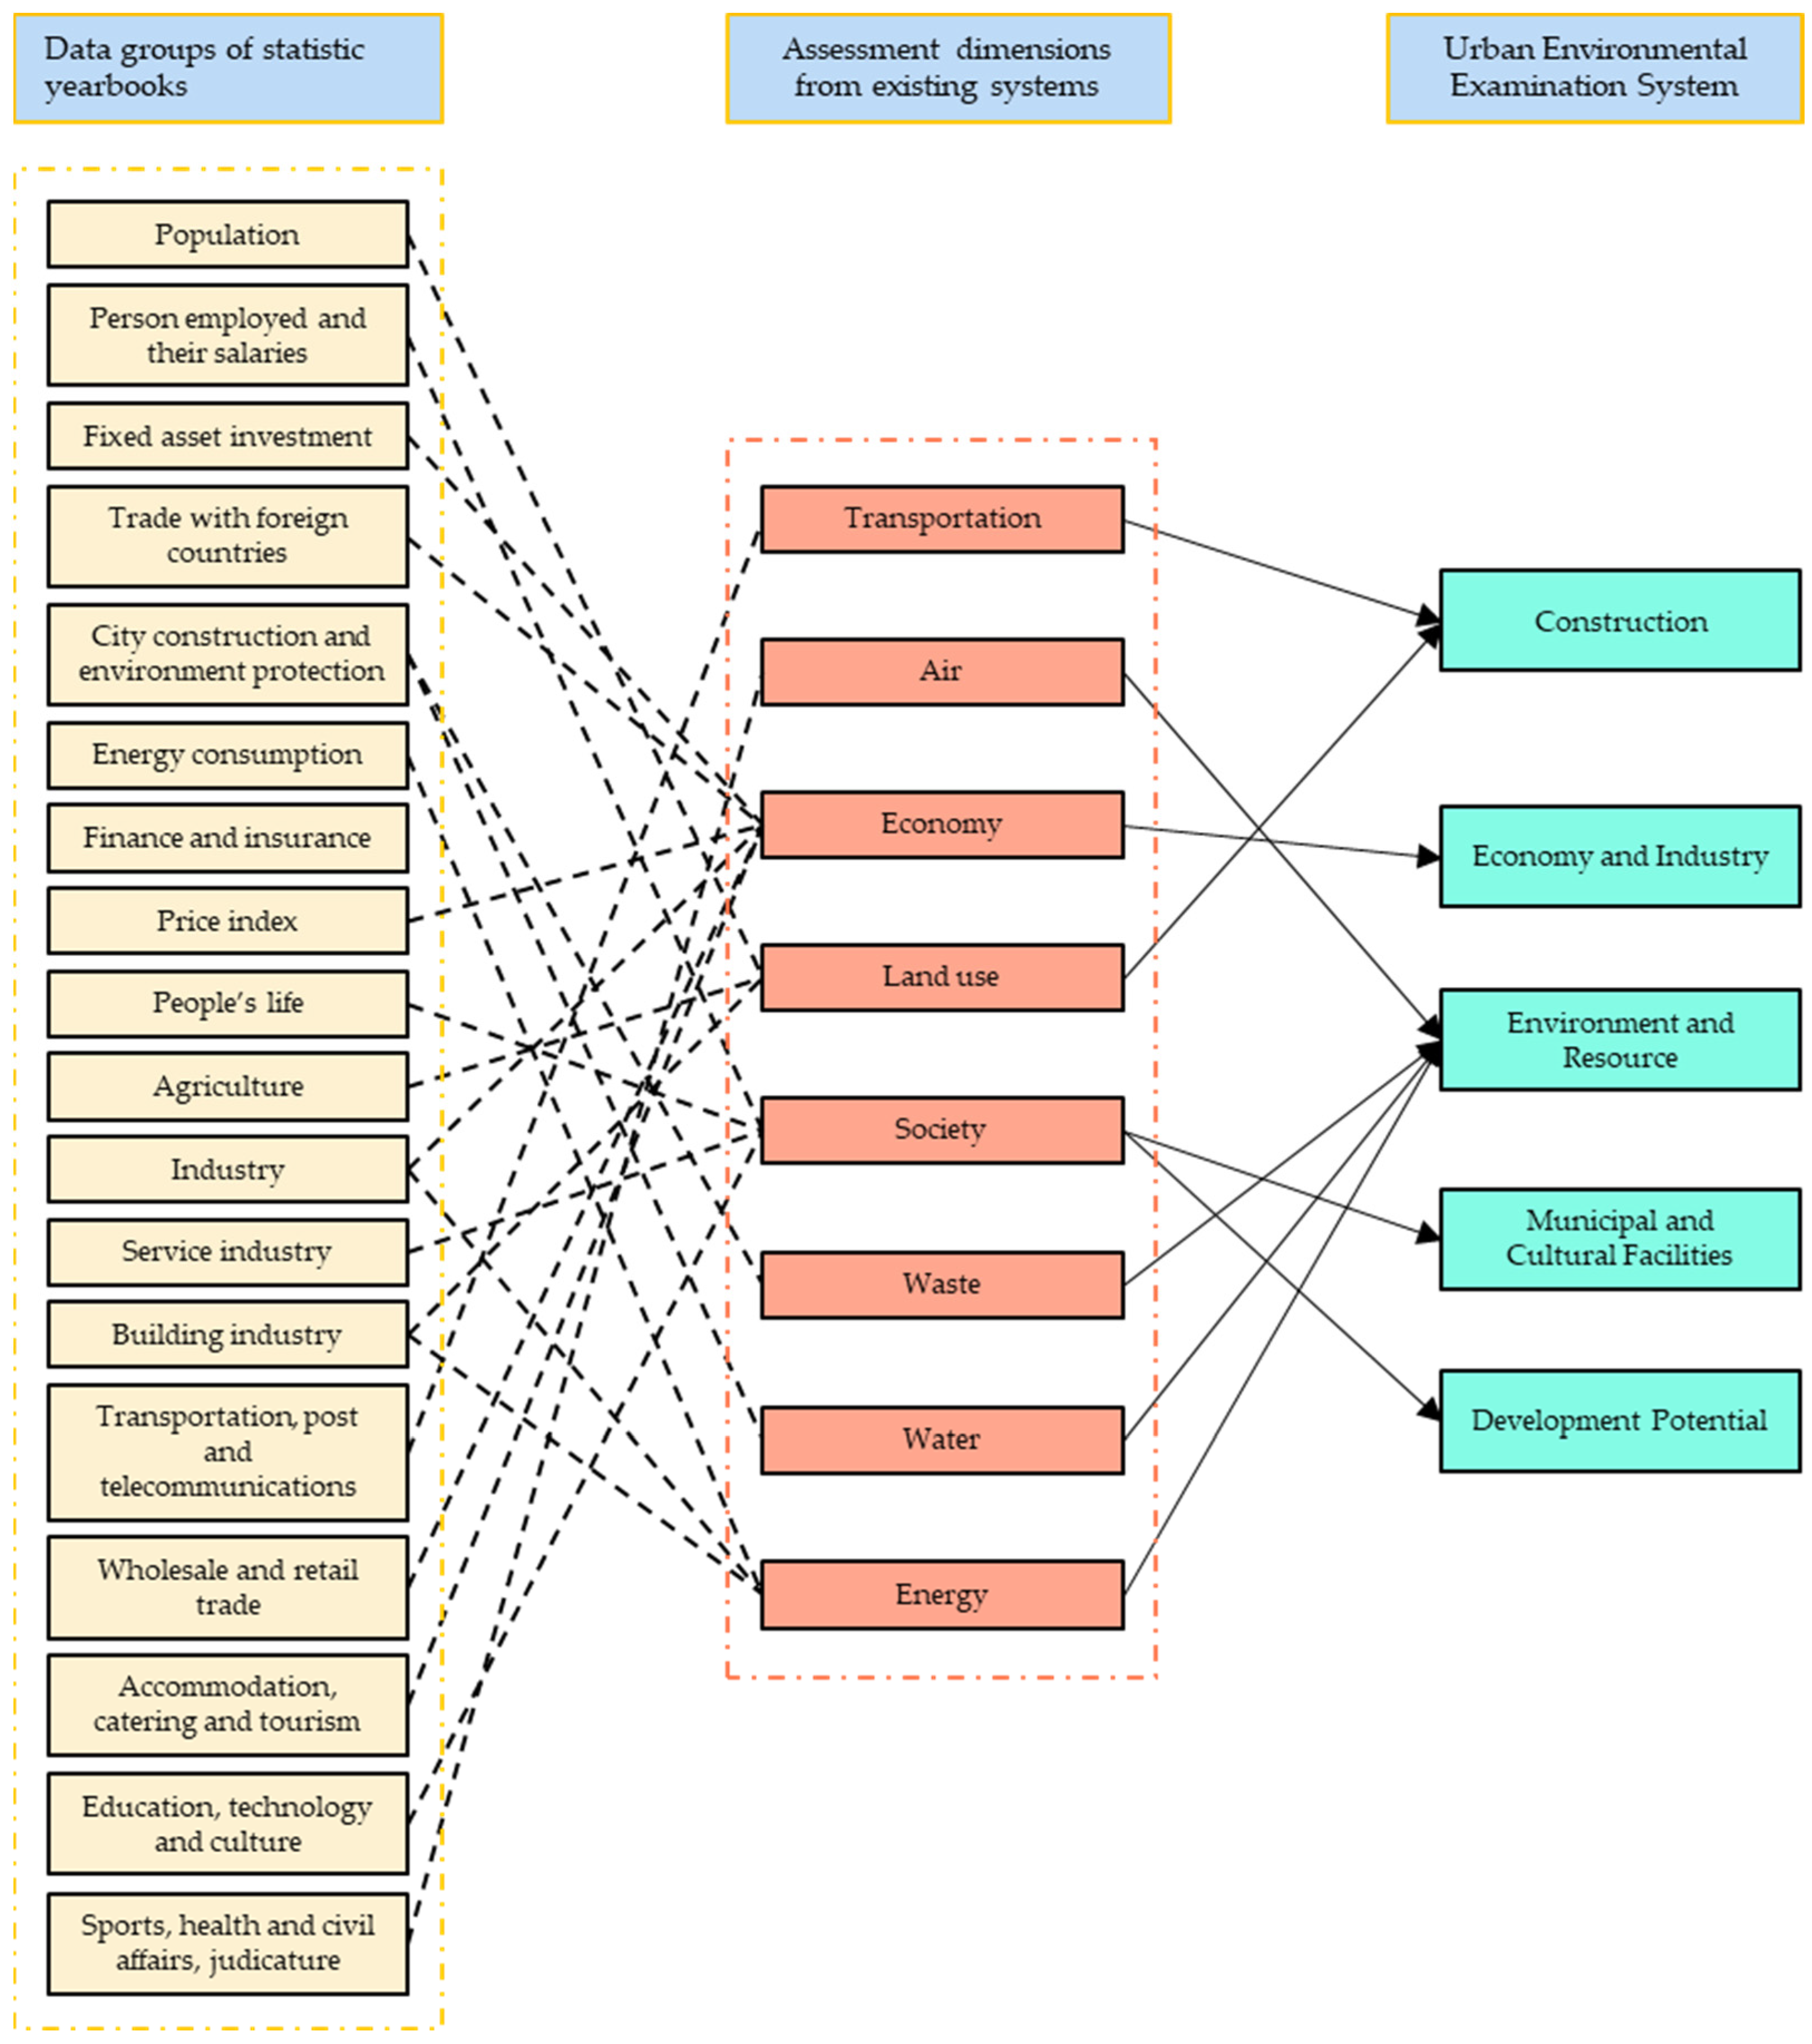
To address these research gaps, this study aimed to develop a holistic urban environment examination system (UEES) to comprehensively promote urban sustainability. To overcome the challenges of data unavailability, this study links the UEES framework to the critical concerns of different levels of government where relevant data are annually and seasonally reported and updated by the statistical yearbooks. Overall, this study provides urban managers and decision makers with a sound understanding of urban environment examinations, particularly considering the multiple dimensions of sustainability and the local adaptability of the assessment system. Meanwhile, the availability of dynamic data enables city administrators to make timely decisions regarding modifications and refinements for sustainable development. The UEES framework development was tailored to a Chinese context, as China is a typical developing country with more challenges than many other countries in terms of urbanization, population, and development [25]. Many megacities (e.g., Beijing, Shanghai, Shenzhen, Guangzhou, and Chongqing) and urban agglomerations (e.g., Beijing–Tianjin–Hebei, the Yangtze Delta Region, and the Pearl Delta Region) [26,27,28]. Nevertheless, the achievement of a high urbanization rate associated with unsustainable planning, design, construction, and operation patterns has resulted in many long-lasting, unexpected, and negative impacts on cities and their surroundings [
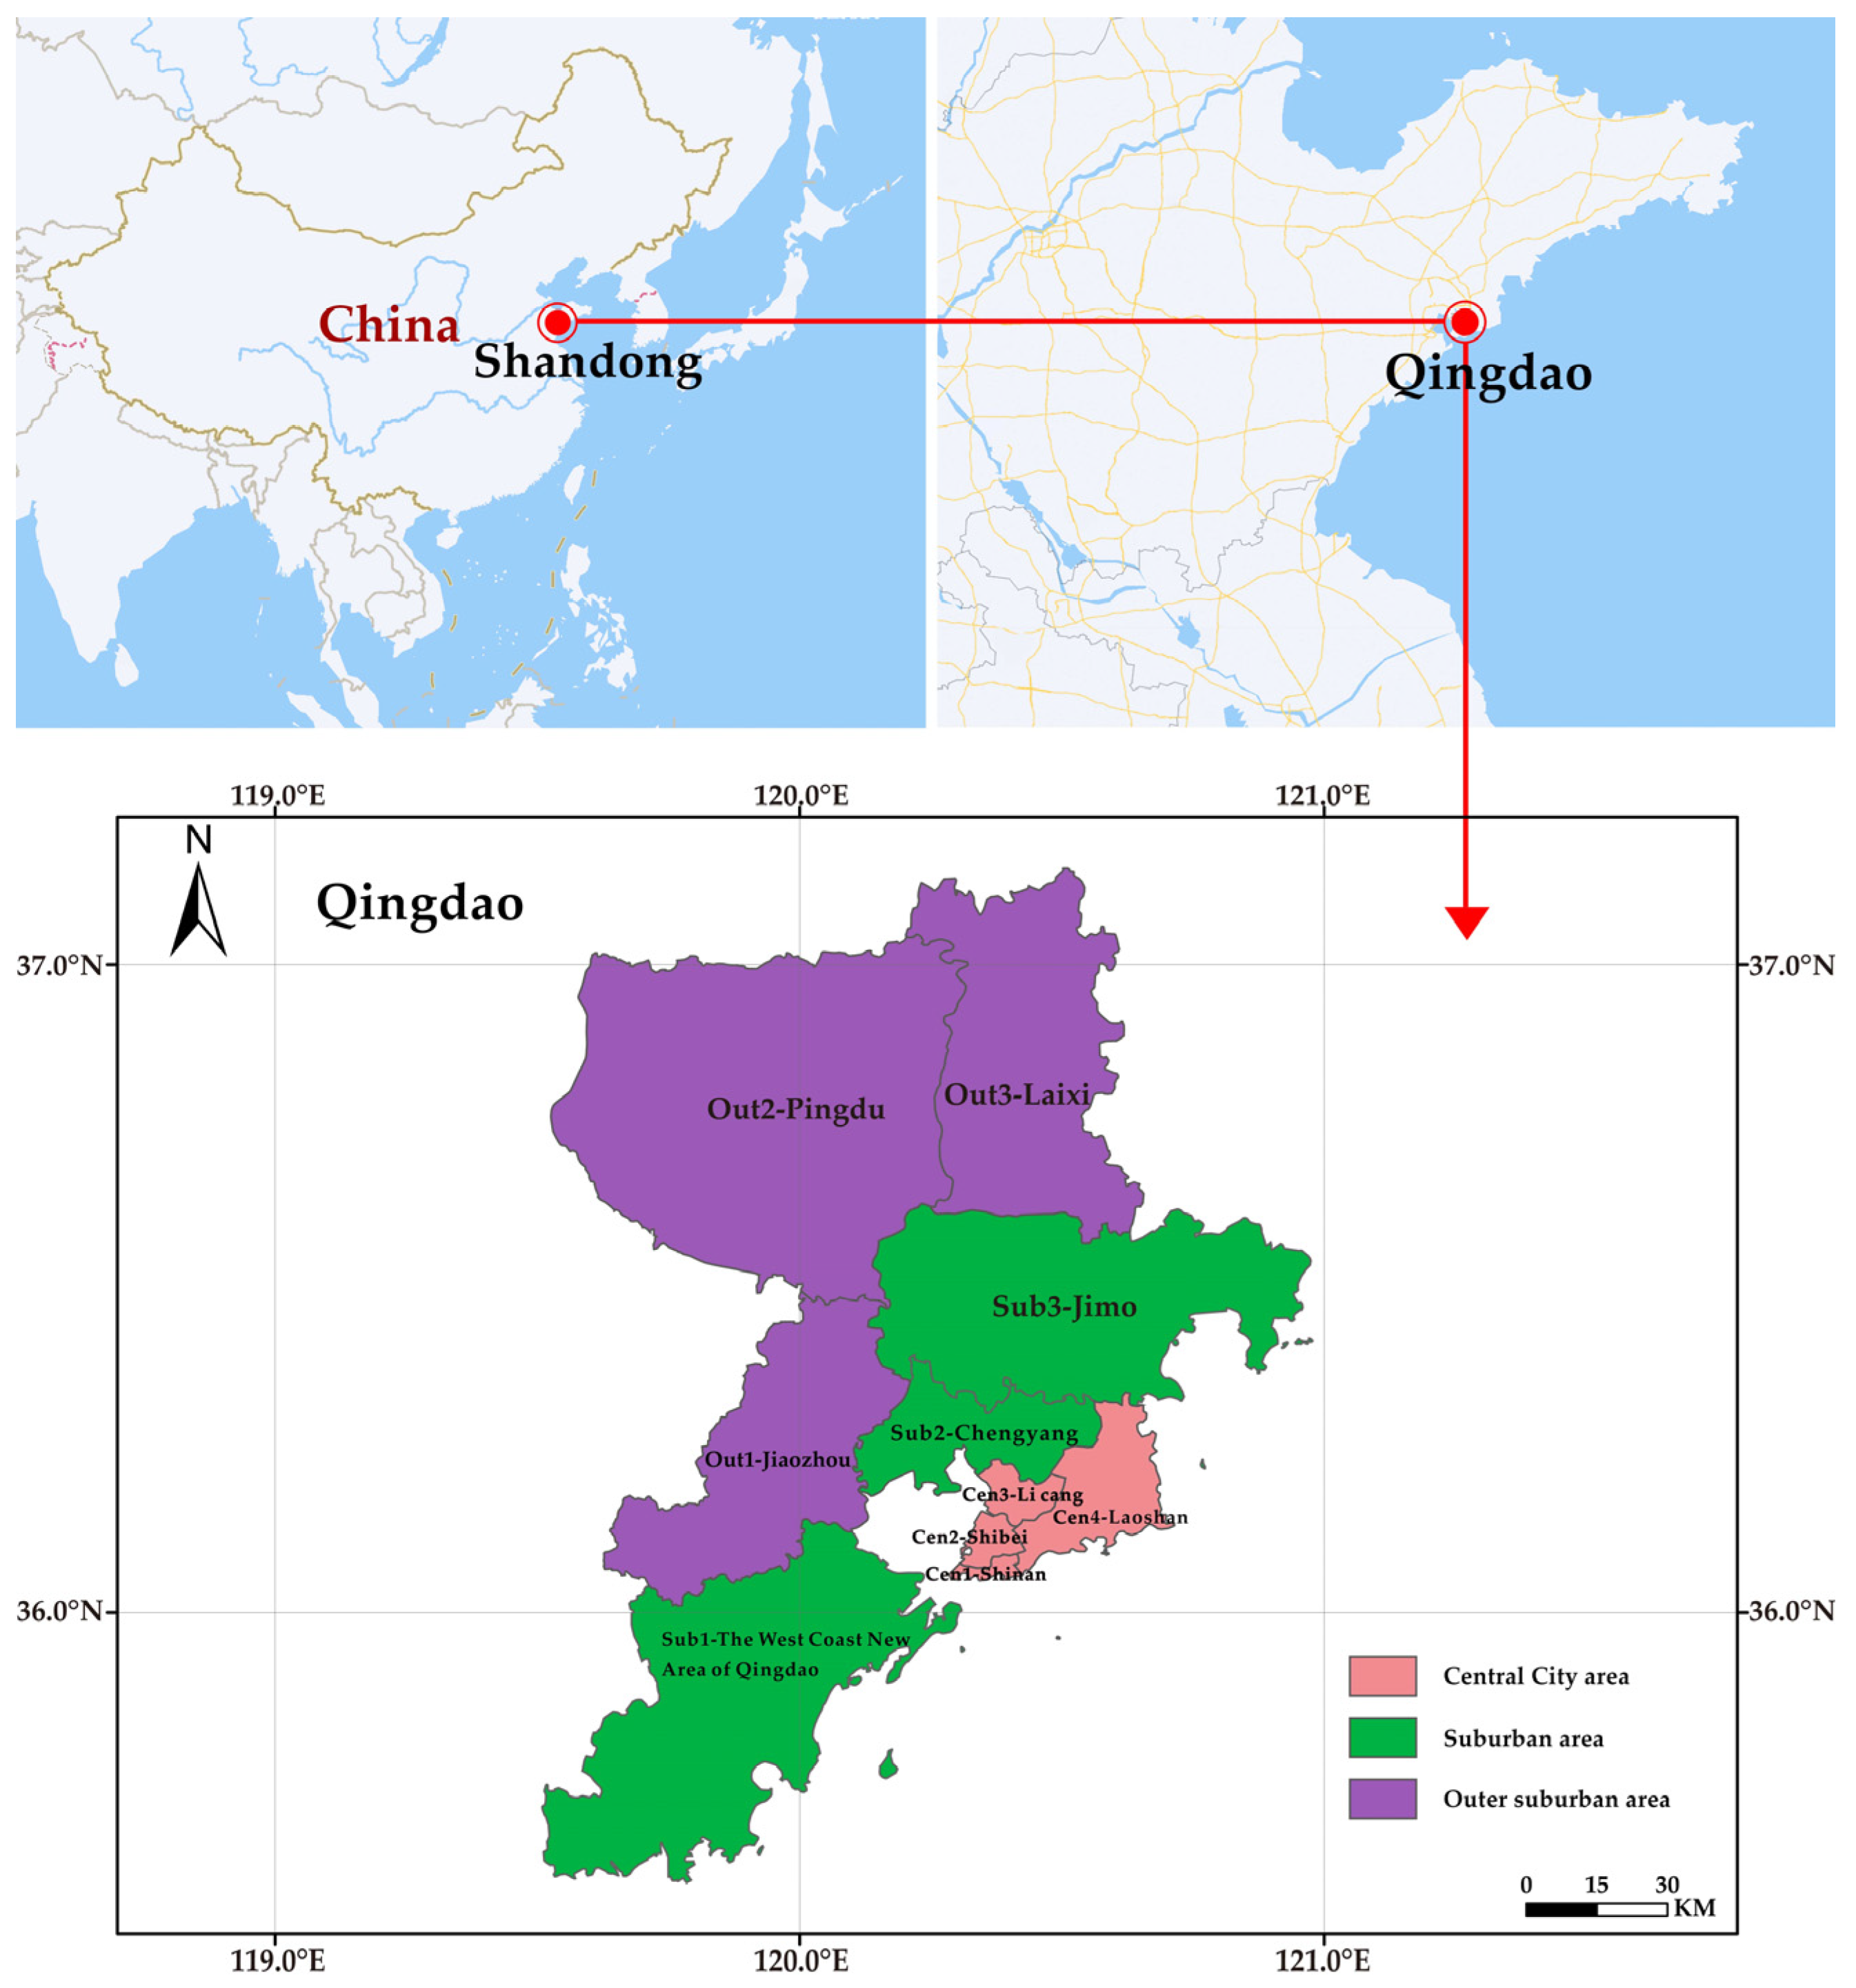
29]. Therefore, to ensure the sustainable development of Chinese cities, it is necessary to upgrade and refine urban development models to cope with unexpected consequences. There is a great need for an assessment system, such as the UEES framework, for timely monitoring of urban sustainable development. Using Qingdao City as an example, this study also demonstrates the application of the UEES framework and identifies challenges in the urban sustainability of Qingdao, China.

2. An Overview of Urban Sustainability Assessment Tools and Frameworks

This section presents an overview of China’s efforts towards environmental, ecological, economic, and cultural sustainability, after which the existing urban sustainability guides and standards are analyzed.

2.1. An Overview of Efforts for Urban Sustainability in China

Since the 1990s, China has been focusing on urban ecological and environmental sustainability. Governments and industries have developed a series of sustainability initiatives tailored to specific urban contexts and development patterns. There are concepts and sustainability frameworks of “ecological cities”, “low-carbon cities”, and “organic cities”. Central and national governments have enacted various regulations and well-specified procedures relevant to sustainable development [30]. For instance, the MOHURD launched an urban physical environment examination to identify and rectify the shortcomings and vulnerabilities in urban planning, design, construction, and operation. This initiative strengthened the capacity to mitigate urban environmental problems and associated threats to comfort, health, safety, and well-being, thereby enhancing evidence-based decision making and allocating resources effectively [31]. In 2023, the central government issued a notice calling for all cities across the country to examine the urban physical environment.
Subsequently, visions of holistic urban sustainability were highlighted, where the key contents of relevant sustainable development plans encompassing the reduction of energy and resource consumption, preservation of ecological environment, and attainment of sustainable development were delineated. For instance, the work “Opinions on Promoting Green Development in Urban and Rural Construction” presented a series of emerging requirements such as enhancing urban functions, expanding public activity spaces, creating art parks, improving facilities for culture and tourism, and promoting new urban styles [32]. Cultural facilities and services, while modernizing cities, are becoming increasingly important in maintaining cultural and heritage preservation. In 2022, the “14th Five-Year Plan for Cultural Development” was released, with requirements for maximizing public cultural resources, building various public cultural facilities at all levels, and encouraging free access to public cultural venues (e.g., libraries, cultural centers, art galleries, and museums). Overall, different levels of government expect to make it easier for public cultural services to operate professionally and to increase the availability and accessibility of these facilities and services [33].

2.2. Assessment Standards and Guides for Urban Sustainability

Urban sustainability assessment is regarded as a method of process control [34], and suitable and tangible assessment standards and guidelines are needed [35,36,37]. Initially, the assessment system focused on assessing the sustainability of a single building. Nevertheless, cities are more complex than buildings, and buildings constitute only one aspect of an urban physical environment. Accordingly, many tools for community-, neighborhood-, and city-scale sustainability assessments were developed. Many studies have examined and proposed recommendations to refine and improve existing tools because existing systems and tools contain constraints and shortcomings. For instance, Sharifi and Murayama [38] reviewed existing urban sustainability assessment systems, such as LEED Neighborhood Development and the BREEAM Community, concluding that existing systems inadequately considered social, economic, cultural, artistic, and institutional dimensions with ambiguous weighting, scoring, and rating methods.
In 2014, the European Union enacted a standard for sustainable cities and communities (ISO 37120) with 19 sectors [39]. While this standard was expected to be standardized, consistent, and comparable, and fit any city, municipality, or local government to monitor sustainability performance, its scope was defined as city services and the quality of life. This standard focuses more on urban operations than on planning and construction of the physical environment. However, these indicators are not intuitive for cities and communities under construction and development. For instance, the ISO 37120 standard does not consider the number of kindergartens, which is an indicator of the extent to which existing facilities and infrastructure can meet educational demands, but focuses on the population/student percentage. Overall, generic international sustainability evaluation systems often lack adaptability and applicability to specific nations and regions, leading to biased and inaccurate results and improper decisions [40]. In the assessment implementation, a one-time assessment provides only a snapshot of the performance. However, many urban managers do not assess a specific city more than once because the precise measurement and collection of numerous indicators is costly, resource-intensive, and time-consuming [30]. It is impossible to reuse the data obtained from individual measurements, and each assessment must update the data promptly.

3. Data and Methods

This section develops the UEES framework by integrating the construction, cultural, economic, environmental, and development dimensions and then determines the indicators and their weights in the system.

3.1. Identification of Assessment System Dimensions and Indicators

Sustainability refers to a development model that describes, measures, monitors, and evaluates the co-existing status of humans and the Earth [41]. However, sustainability is difficult to measure because it includes more than one dimension, and the metrics continue to evolve with a series of drivers [42,43]. Generally, an assessment system for urban sustainability covers environmental, social, and economic dimensions [44]. Environmental sustainability emphasizes the protection and strengthening of the self-restoration capacity of the environment, ensuring the sustainable utilization of natural resources and the health of ecosystems [45,46]. In comparison, social sustainability involves the creation of structural and non-structural spaces for well-being, requiring the achievement of social fairness, justice, and inclusiveness [47,48]. The sustainability assessment dimensions of cities include four key dimensions: buildings and facilities, natural environment, people’s satisfaction, and transportation systems [49]. According to the circular structure perspective, environmental dimensions play a fundamental role in driving social sustainability [50]. Economic sustainability emphasizes that economic development must consider long-term economic growth without negative impacts on environmental quality and social welfare [51,52].
Nevertheless, apart from the environmental, social, and economic dimensions, there are other dimensions of urban sustainability according to changes in challenges, threats, and needs. For instance, construction sustainability is associated with urban structure design, construction, operation, and maintenance to meet urban (re)development, environmental responsibility, and resource-efficient requirements [53,54]. Moreover, China has a long history, therefore, urban sustainability extends beyond inclusive, safe, resilient, and sustainable requirements. In particular, cultural sustainability is increasingly important in an era when modernizing activities have determined values and attitudes to retain, enhance, and develop traditional cultural beliefs, practices, and heritage [55,56]. In China, when pursuing high urbanization rates and economic growth, cultural sustainability is an emergency and timely call and practice for the recognition and respect of traditional culture and traditional ideological value systems. Development potential refers to the education of the younger generation, care and protection of the elderly, the promotion of science and technology for future dynamics and vitality, and the all-round development of human beings, where people, talent, and technologies are the three key components of the future development of cities [57,58].
The assessment system for urban physical environment examination classifies structural and non-structural environments into eight dimensions: ecological livability, urban characteristics, transportation, life comfort, diversity and inclusion, safety and resilience, innovative vitality, and people’s satisfaction. Linking the solution to data unavailability in the implementation of urban physical environment examination systems [49], this study begins with key focuses (18 categories reported in the statistics yearbooks, yellow column on the left side of Figure 1) of national, regional, and local governments to track urban sustainability progress while respecting multiple sustainability dimensions. Most indicators in these 18 categories can be attributed to the eight aspects of existing assessment systems [30]. For example, indicators of urban construction and environmental protection can be grouped into land use, waste, and water. The building industry can be categorized into land use and energy aspects. These eight aspects can be further categorized into five dimensions. For example, transport and land use can be grouped into construction dimensions, while air, waste, and energy can be categorized into environmental dimensions. Overall, this study summarizes five dimensions (D1–D5): construction (D1), economy and industry (D2), environment and resource (D3), municipal and cultural facilities (D4), and development potential (D5) (Figure 1).
The number of indicators in the statistical yearbooks concerned by governments at different levels exhibited slight variations, averaging 180. Typically, the number of indicators of concern by municipal governments is higher than that of district governments. Nevertheless, the indicators considered in the UEES framework should be effectively identified, and the selection of indicators must adhere to the following principles: (1) it concerns the urban environment; (2) it involves the presence of clear dimensional attributes to facilitate the integration of indicators into assessment dimensions; and (3) the chosen indicators should ensure subsequent comparisons and discussions. Table 1 presents the indicator system of the UEES by restructuring the indicators reported in the statistical yearbooks into five dimensions.
For instance, the construction (D1) dimension consists of six indicators: the development intensity of built-up areas (C1), population density of built-up areas (C2), density of the road network (C3), retrofitted areas of old residential communities per 10,000 people (C4), the ratio of the increasing areas of new residential buildings to the increasing population (C5), and the fire station coverage rate (C6). Within the development potential (D5) dimension, there are seven indicators: the gender ratio of the population (C25), degree of aging (C26), proportion of the population with tertiary education (C27), elementary school students as a percentage of the resident population (C28), share of fiscal expenditure on science and technology (C29), number of high-tech enterprises per 10,000 people (C30), and cultural building areas per 10,000 people (C31).

3.2. Indicator Weight and Calculation Methods

Multiple methods have been developed to determine the indicator weights in urban sustainability assessment systems. There are two key weighting methods: subjective and objective. Subjective methods assign weights based on researchers’ subjective assessments, and these methods consist of an analytic hierarchy process, a fuzzy comprehensive evaluation, and expert scoring methods [59]. Objective methods employ statistical approaches, such as principal component analysis, factor analysis, coordinated evaluation method, and the entropy weight method, to process the data [60].
The UEES framework developed in this study includes a wide range of indicators with complex interconnections, rendering subjective weighting methods susceptible to bias. In comparison, principal component analysis and factor analysis are not appropriate because of the lack of direct data for some indicators [61]. The entropy weight method is an objective method for determining weights [62]. It calculates the weights based on the amount of information included in the indicators, thereby excluding any influences caused by humans. After standardizing the indicator data, the indicator matrix designated as Z was used to compute the entropy weight for each indication. The process is accomplished by employing the following equations, with the detailed steps and mathematical expressions outlined in Equations (1)–(4).
p i j = z i j i = 1 n z i j
e j = 1 ln n i = 1 n p i j ln p i j , j = 1,2 , , m
d j = 1 e j
W j = d j j = 1 m d j j = 1,2 , , m
where z i j represents the indicator matrix; p i j denotes the probability matrix; and e j denotes the information entropy, and a higher value of e j indicates a larger information entropy for the jth indicator. d j represents the information utility value; a larger value of d j signifies a higher amount of information. W j represents the entropy weight; n is the number of evaluation objects; and m represents the number of indicators.
After determining the entropy weight of each indicator, a linear weighting method was used to calculate the total assessment score. Assuming that r i is the comprehensive evaluation score of the ith assessment object, the calculation formula is presented in Equation (5).
r i = j = 1 m W j z i j

4. Case Study Area

Qingdao was selected as an example to demonstrate the application of UEES framework for urban sustainability assessment (Figure 2). Qingdao is the only port city among the new first-tier cities, and has unique geographical advantages and an economic development status. Qingdao has emerged as a megacity with a population of more than 10 million people. Nevertheless, compared with many other highly urbanized cities, such as Beijing, Shanghai, Guangzhou, and Shenzhen, Qingdao is still urbanizing. Compared with many other second- and third-tier cities, Qingdao is well-developed and is under industrial transformation for economic vitality and sustainable development. Examining the urban sustainability of Qingdao is far more critical than that of many other cities in terms of avoiding improper decisions during the transition.
Qingdao consists of ten districts: Shinan (Cen1), Shibei (Cen2), Licang (Cen3), Laoshan (Cen4), West Coast New Area (Sub1), Chengyang (Sub2), Jimo (Sub3), Jiaozhou (Out1), Pingdu (Out2), and Laixi (Out3) (Figure 2). These ten districts are further divided into three main areas: central urban areas (Cen1, Cen2, Cen3, and Cen4), suburban areas (Sub1, Sub2, and Sub3), and outer suburbs (Out1, Out2, and Out3). These areas have unique functions and patterns of development. For instance, Cen1, Cen2, Cen3, and Cen4 have dense populations, and the industry is mainly composed of service industries such as finance, tourism, culture, and art. These four districts are well-developed with sound facilities. Sub1, Sub2, and Sub3 are suburban areas concentrated in secondary and tertiary industries such as industry and finance, whereas different types of facilities are not as complete as those in the central city area. Out1, Out2, and Out3 are outer suburbs that rely on secondary and primary industries, with more factories and smaller population density than the other two areas. The prioritization of these areas for assessment and examination can help pinpoint barriers and shortcomings to the sustainability improvement of these regions, thereby providing effective suggestions for refinement and modification. Table 2 summarizes key information of Qingdao and its districts.

5. Results and Discussion

This section presents the calculated results in terms of indicator weights and urban sustainability scores for the entire city and its districts. The scores of the five dimensions and specific indicators of the entire city and ten districts were also analyzed to identify the strengths and shortcomings of the different dimensions.

5.1. Weights of Different Dimensions and Indicators

A sustainability assessment was conducted for the entire city of Qingdao and its ten districts based on the 5 dimensions and 31 indicators in the UEES framework. The weights for each indicator and the evaluation dimension were calculated using Equations (1)–(4). As shown in Table 3, construction (D1) had a weight of 0.2125, which was slightly lower than that of the economy and industry (D2, 0.2153). Environment and resource (D3) had a weight of 0.1978. Municipal and cultural facilities (D4) and development potential (D5) had similar weights of approximately 0.1876 and 0.1877, respectively. This result indicates that all five dimensions are well-respected in the UEES framework, without an abnormal emphasis on a specific dimension. Furthermore, the weights of each indicator were relatively even, without abnormal values. The highest weight was found in retrofitted areas of old residential communities per 10,000 people (C4, 0.0544) and in the ratio of the increasing areas of new residential buildings to the increasing population (C5, 0.0541). The minimal weight was found for the population density of built-up areas (C3), with a value of 0.0119.

5.2. Overall Urban Sustainability Scores of the Entire City and Ten Districts

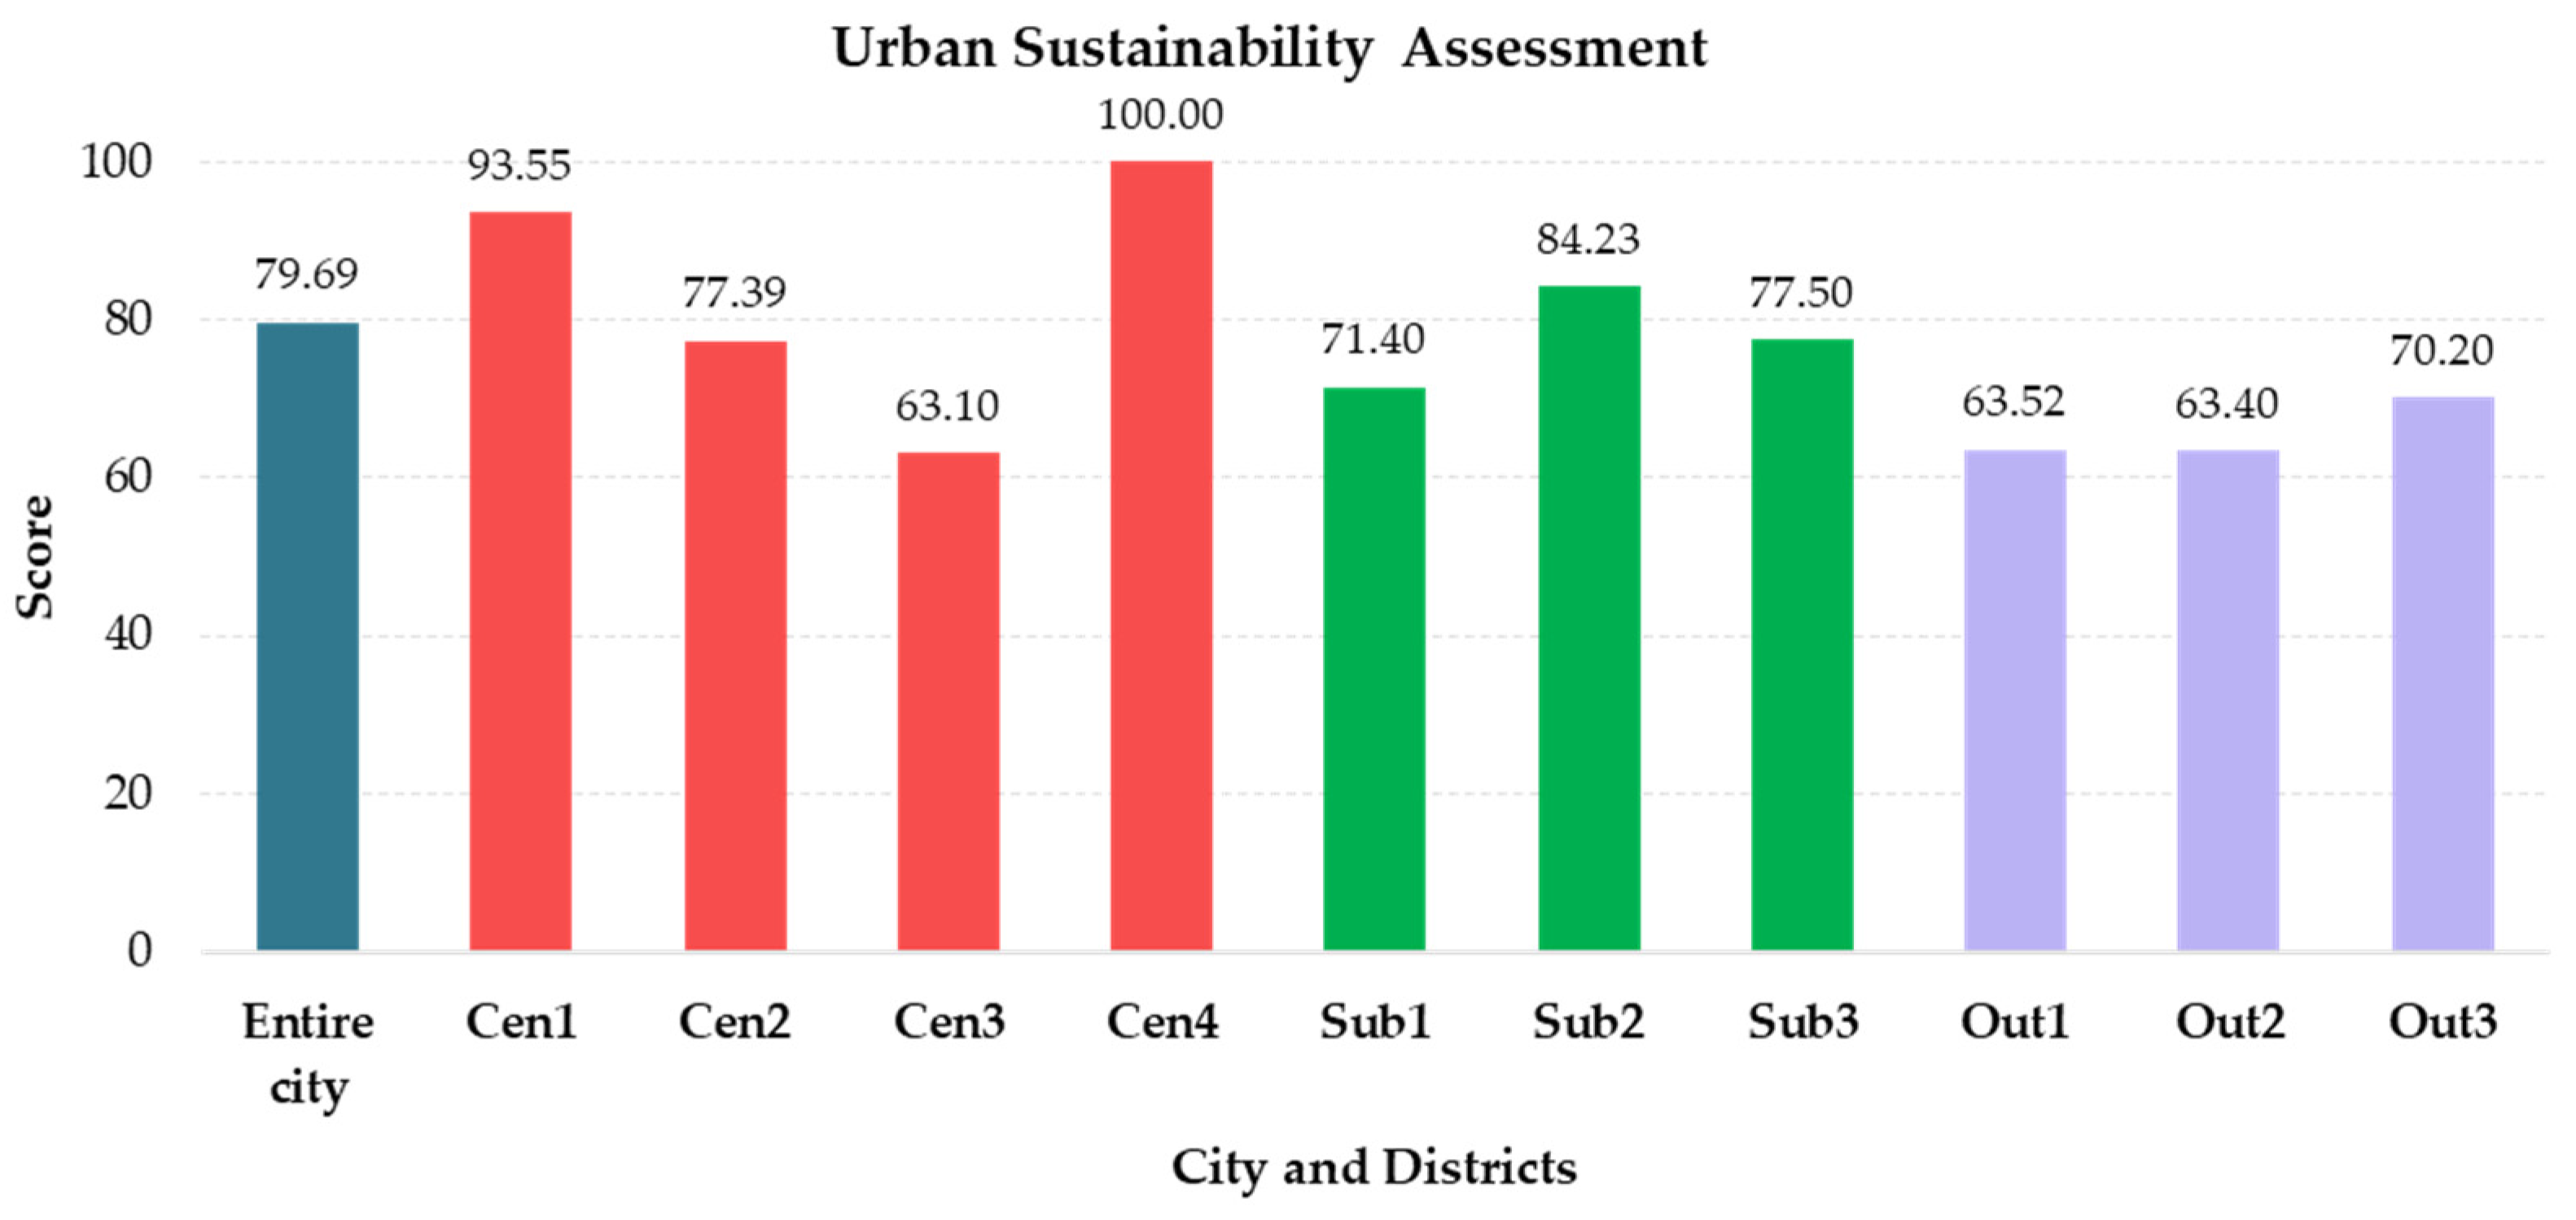
Figure 3 depicts the urban sustainability scores for the entire city of Qingdao and its ten districts. Overall, the sustainability score of Qingdao was 79.69—far from 100 but higher than 60. This suggests that the urban sustainability of Qingdao was good overall good, but there was space for action towards an outstanding level. The scores of the three districts were higher than those of the entire city. The three districts were Shinan (Cen1, 93.55), Laoshan (Cen4, 100.00), and Chengyang (Sub2, 84.23). Note that Laoshan (Cen4) has a score of 100.00, because we adopted a percentage-based calculation method to assess urban sustainability. However, only Shinan (Cen1) and Laoshan (Cen4) demonstrated superior sustainability in the central cities. The score for Licang (Cen3) was only 63.10, which was the lowest among all the districts. There is a need to further understand why Licang (Cen3) performed the worst in terms of urban sustainability. Furthermore, Chengyang (Sub2) in the suburban area had a higher score than the entire city, and its score was higher than those in the West Coast New Area (Sub1, 71.40) and Jimo (Sub3, 77.50). Out3 performs the best in the outer suburban area, with a score of 70.20, whereas the scores for Jiaozhou (Out1) and Pingdu (Out2) are 63.52 and 63.40, respectively. A good sign of the analysis is that the urban sustainability scores of all districts exceeded 60, indicating a good sustainability level.

5.3. Urban Sustainability Scores of the Entire City and Ten Districts in Construction Dimension (D1)

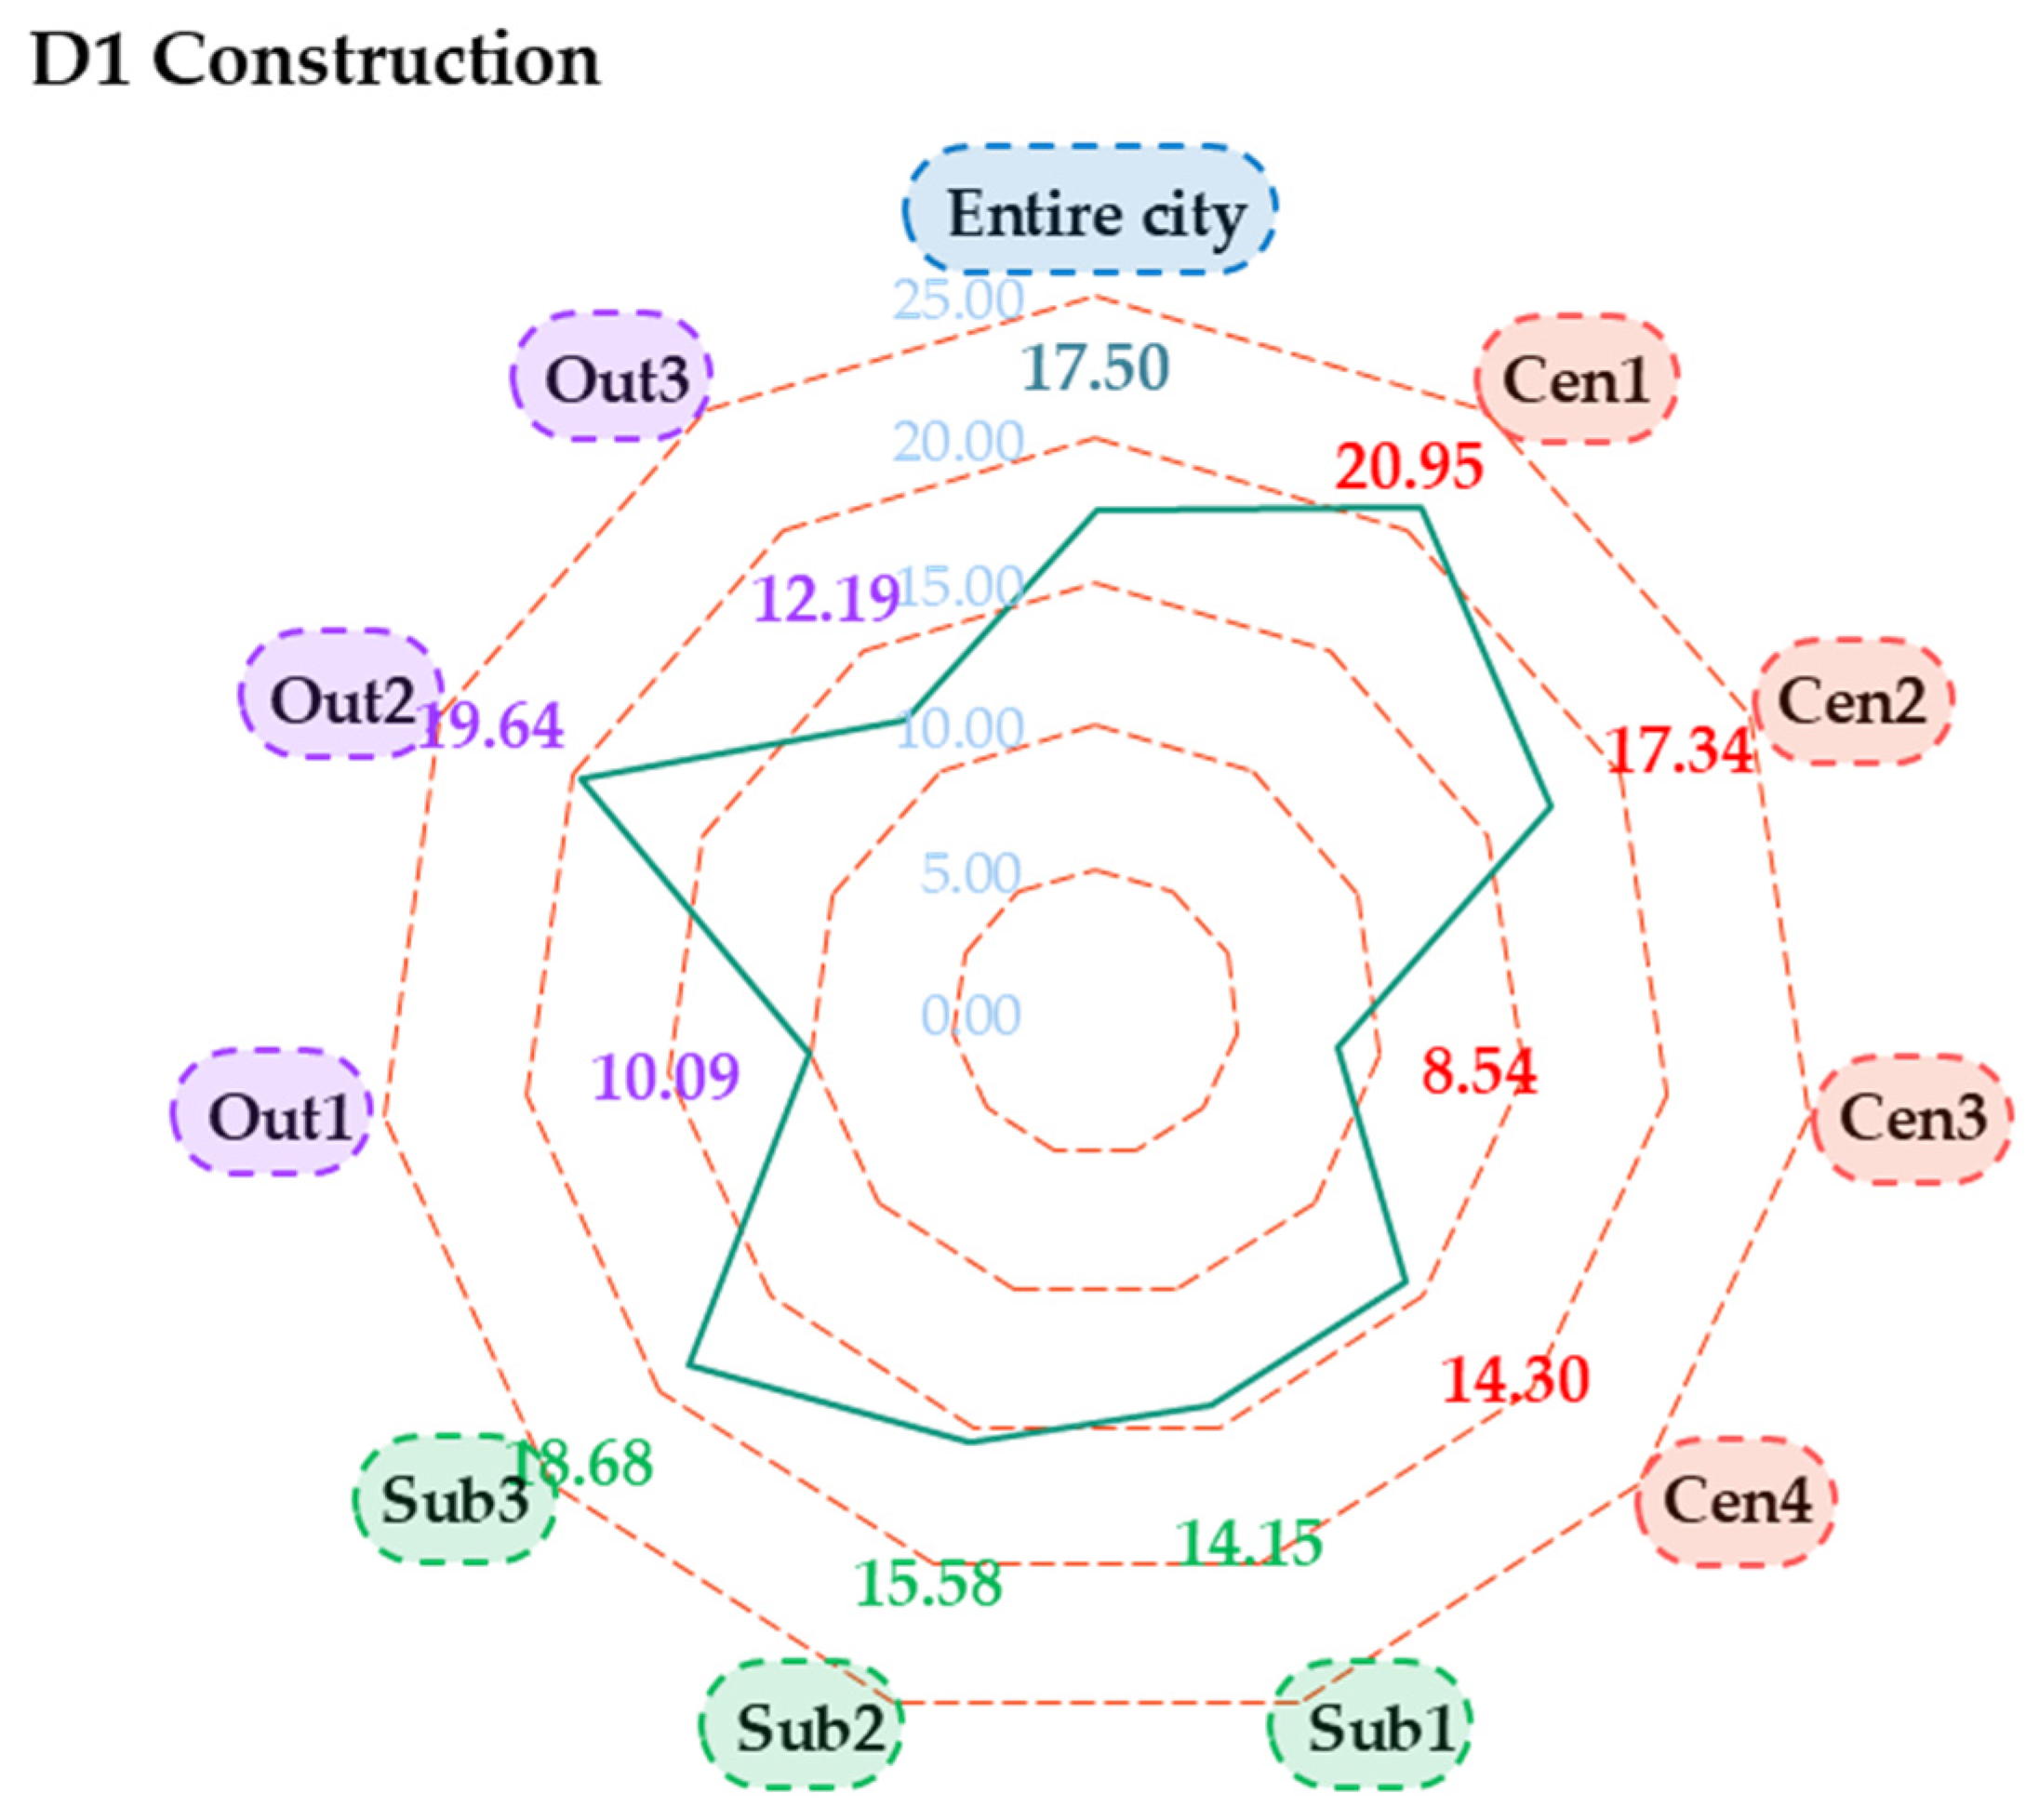
Figure 4 shows the urban sustainability scores of the entire city of Qingdao and its ten districts with respect to construction (D1). Overall, the city score was 17.50. Three districts performed better than the entire city, with higher score of 20.95 (Shinan, Cen1), 18.68 (Jimo, Sub3), and 19.64 (Pingdu, Out2). These three districts belong to the central city, suburban area, and outer suburban area. Cen3 and Out1 had the lowest sustainability values in the construction dimension of approximately 8.54 and 10.09, respectively. This result suggests that Licang (Cen3) and Jiaozhou (Out1) must take effective action to improve construction sustainability. The scores of other districts, such as Laoshan (Cen4), the West Coast New Area (Sub1), Chengyang (Sub2), and Laixi (Out3), ranged between 12 and 16.
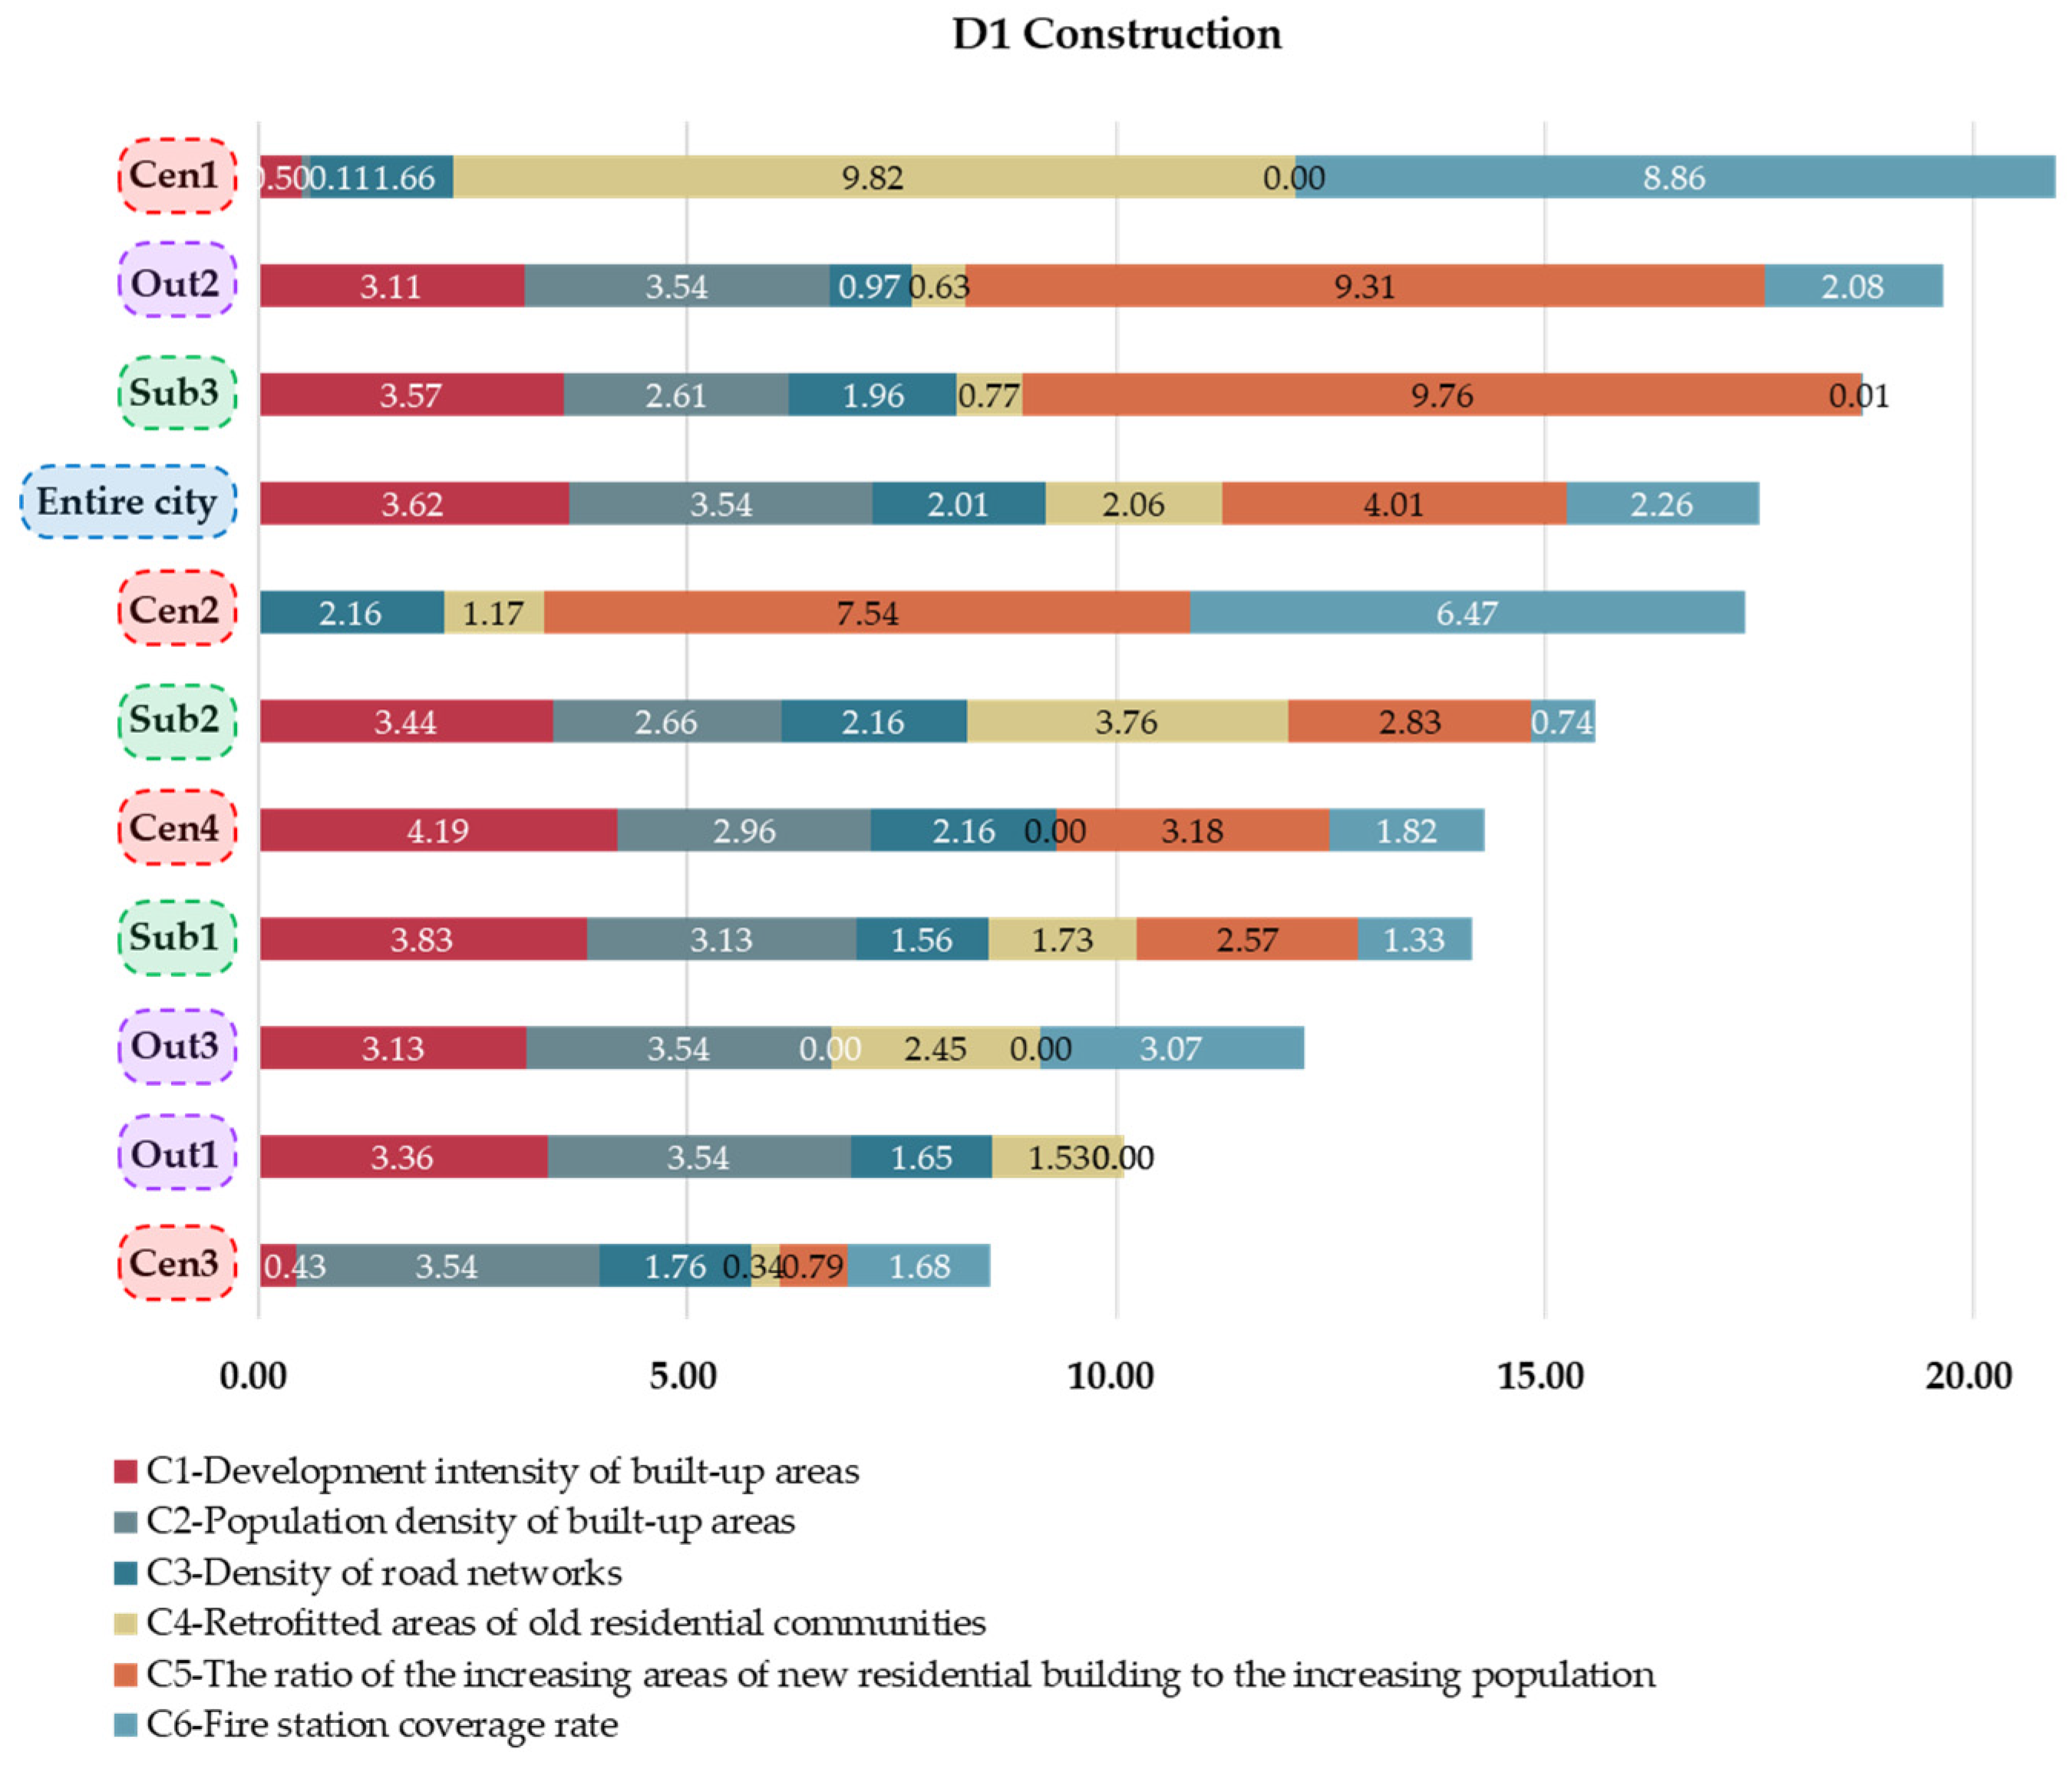
Figure 5 presents the sustainability scores of different indicators in the construction dimension (D1). The results indicate that in the entire city, the scores of all six indicators were good, ranging between 2.01 and 4.01. The lowest value (2.01) was found for the C3—density of road networks, suggesting that Qingdao should improve its road network to improve its construction sustainability. However, the indicators of the C4—retrofitted areas of old residential communities and the C6—fire station coverage rate also had low scores of approximately 2.06 and 2.26, respectively. For all ten districts, central districts (e.g., Cen1, Cen2, and Cen3) generally received lower scores (<0.5) in the C1—development intensity of built-up areas than all other districts (>3.0). In comparison, Cen1 and Cen2 performed the best in the C6—fire station coverage rate (>6.0) compared with all other districts (<3.0).
For Shinan (Cen1) which had the best construction sustainability, it performed the best in C4—retrofitted areas of old residential communities and C6—fire station coverage rate, about 9.82 and 8.86 in scores, respectively. However, Shinan (Cen1) had the potential to improve its construction sustainability in many other aspects, such as C1, C2, C3, and C5, with scores ranging from 0 to 1.66. The success formulas for Pingdu (Out2) and Jimo (Sub3), which performed better than the entire city in terms of construction sustainability, were generally the same. They performed well in the C1—development intensity of built-up areas, C2—population density of built-up areas, and C5—the ratio of the increasing areas of new residential buildings to the increasing population, with score pairs of 3.11 and 3.57, 3.54 and 2.61, and 9.31 and 9.76, respectively. The indicator of the C6—fire station coverage rate in Pingdu (Out2) was somewhat good, with a score of 2.08, and the indicator of C3—density of road networks in Jimo (Sub3) is somewhat good, with a score of 1.96. However, there is still great potential to improve the construction in C6 and C3 for both Pingdu and Jimo. In addition, the scores of the C4—retrofitted areas of the old residential communities in Pingdu and Jimo were 0.63 and 0.77, showing significant potential for improvement.
For remaining districts, Cen2 (Shibei) presented good performance in C5—the ratio of the increasing areas of new residential building to the increasing population, and C6—fire station coverage rate, with scores of 7.54 and 6.47, respectively. However, the C1—development intensity of built-up areas and C2—population density of built-up areas gained scores of zero, suggesting the urgency of improving sustainability in these two aspects. In Chengyang (Sub2), the C1—development intensity of built-up areas and C4—retrofitted areas of old residential communities gained scores of 3.44 and 3.76, respectively. The scores for C2, C3, and C5 were 2.66, 2.16, and 2.83, respectively, indicating their potential to improve construction sustainability. However, the C6—fire station coverage rate score was low, indicating significant potential for improvement. In C1 and C2, the districts of Laoshan (Cen4), West Coast New Area (Sub1), Jiaozhou (Out1), and Laixi (Out3) showed a similar pattern to Sub2, with roughly higher scores compared to other indicators. For instance, the C4—retrofitted areas of old residential communities in Laoshan (Cen4), C3—density of road networks in Laixi (Out3), C5—the ratio of the increasing areas of new residential buildings to the increasing population in Laixi (Out3), C5—the ratio of the increasing areas of new residential buildings to the increasing population in Jiaozhou (Out1), and C6—fire station coverage rate in Jiaozhou (Out1) were zero, showing the greatest potential for improvement. In addition, Licang (Cen3) showed poor performance in the C1—development intensity of built-up areas and C4—retrofitted areas of old residential communities.

5.4. Urban Sustainability Scores of the Entire City and Ten Districts in the Economy and Industry Dimension (D2)

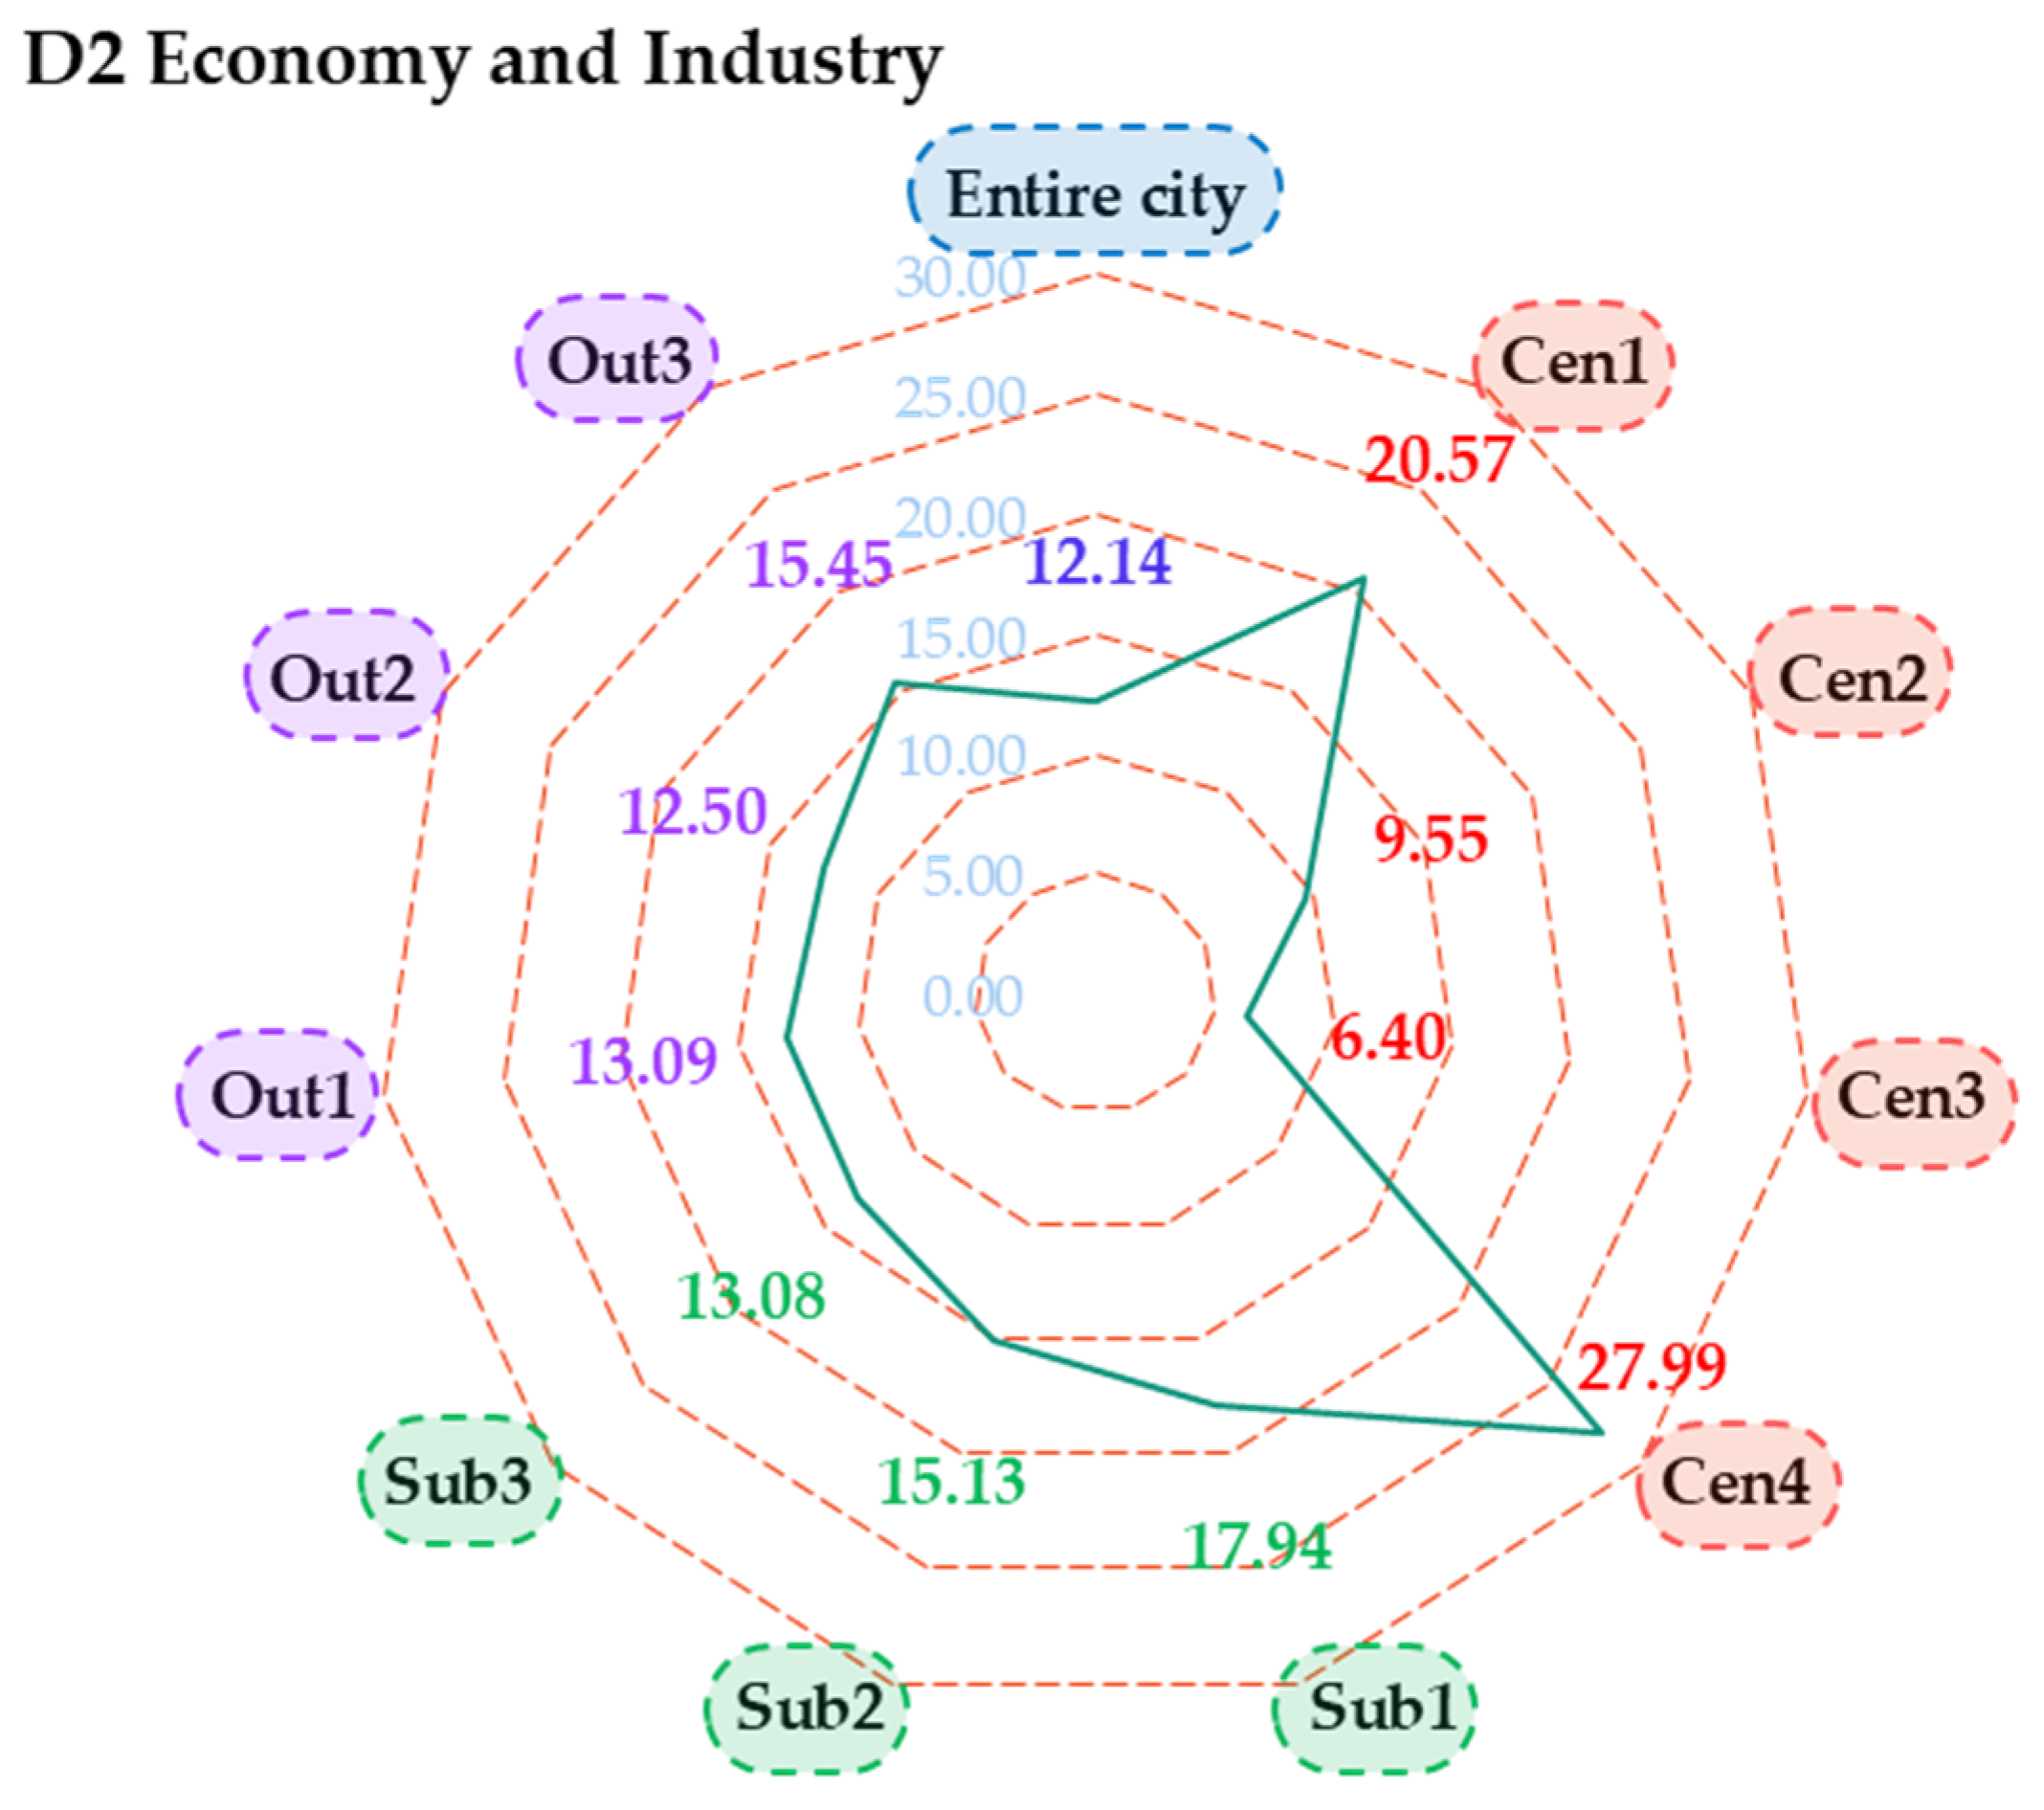
Figure 6 presents the urban sustainability scores of the entire city of Qingdao and its ten districts with respect to the economy and industry dimension (D2). Overall, the sustainability score of the economy and industry for the entire city of Qingdao was 12.14, far lower than the construction sustainability score of 17.50, suggesting the potential and need to further improve economy sustainability. Among ten districts, eight districts including Shinan (Cen1), Laoshan (Cen4), West Coast New Area (Sub1), Chengyang (Sub2), Jimo (Sub3), Jiaozhou (Out1), Pingdu (Out2), and Laixi (Out3) had higher scores than the entire city. Typically, Shinan (Cen1) and Laoshan (Cen4) were the most prominent drivers to the economy sustainability in Qingdao, with the scores of 20.57 and 27.99, respectively. Only Shibei (Cen2) and Licang (Cen3) had lower scores, about 9.55 and 6.40, suggesting the need to improve economy sustainability whilst they are in the central city areas.
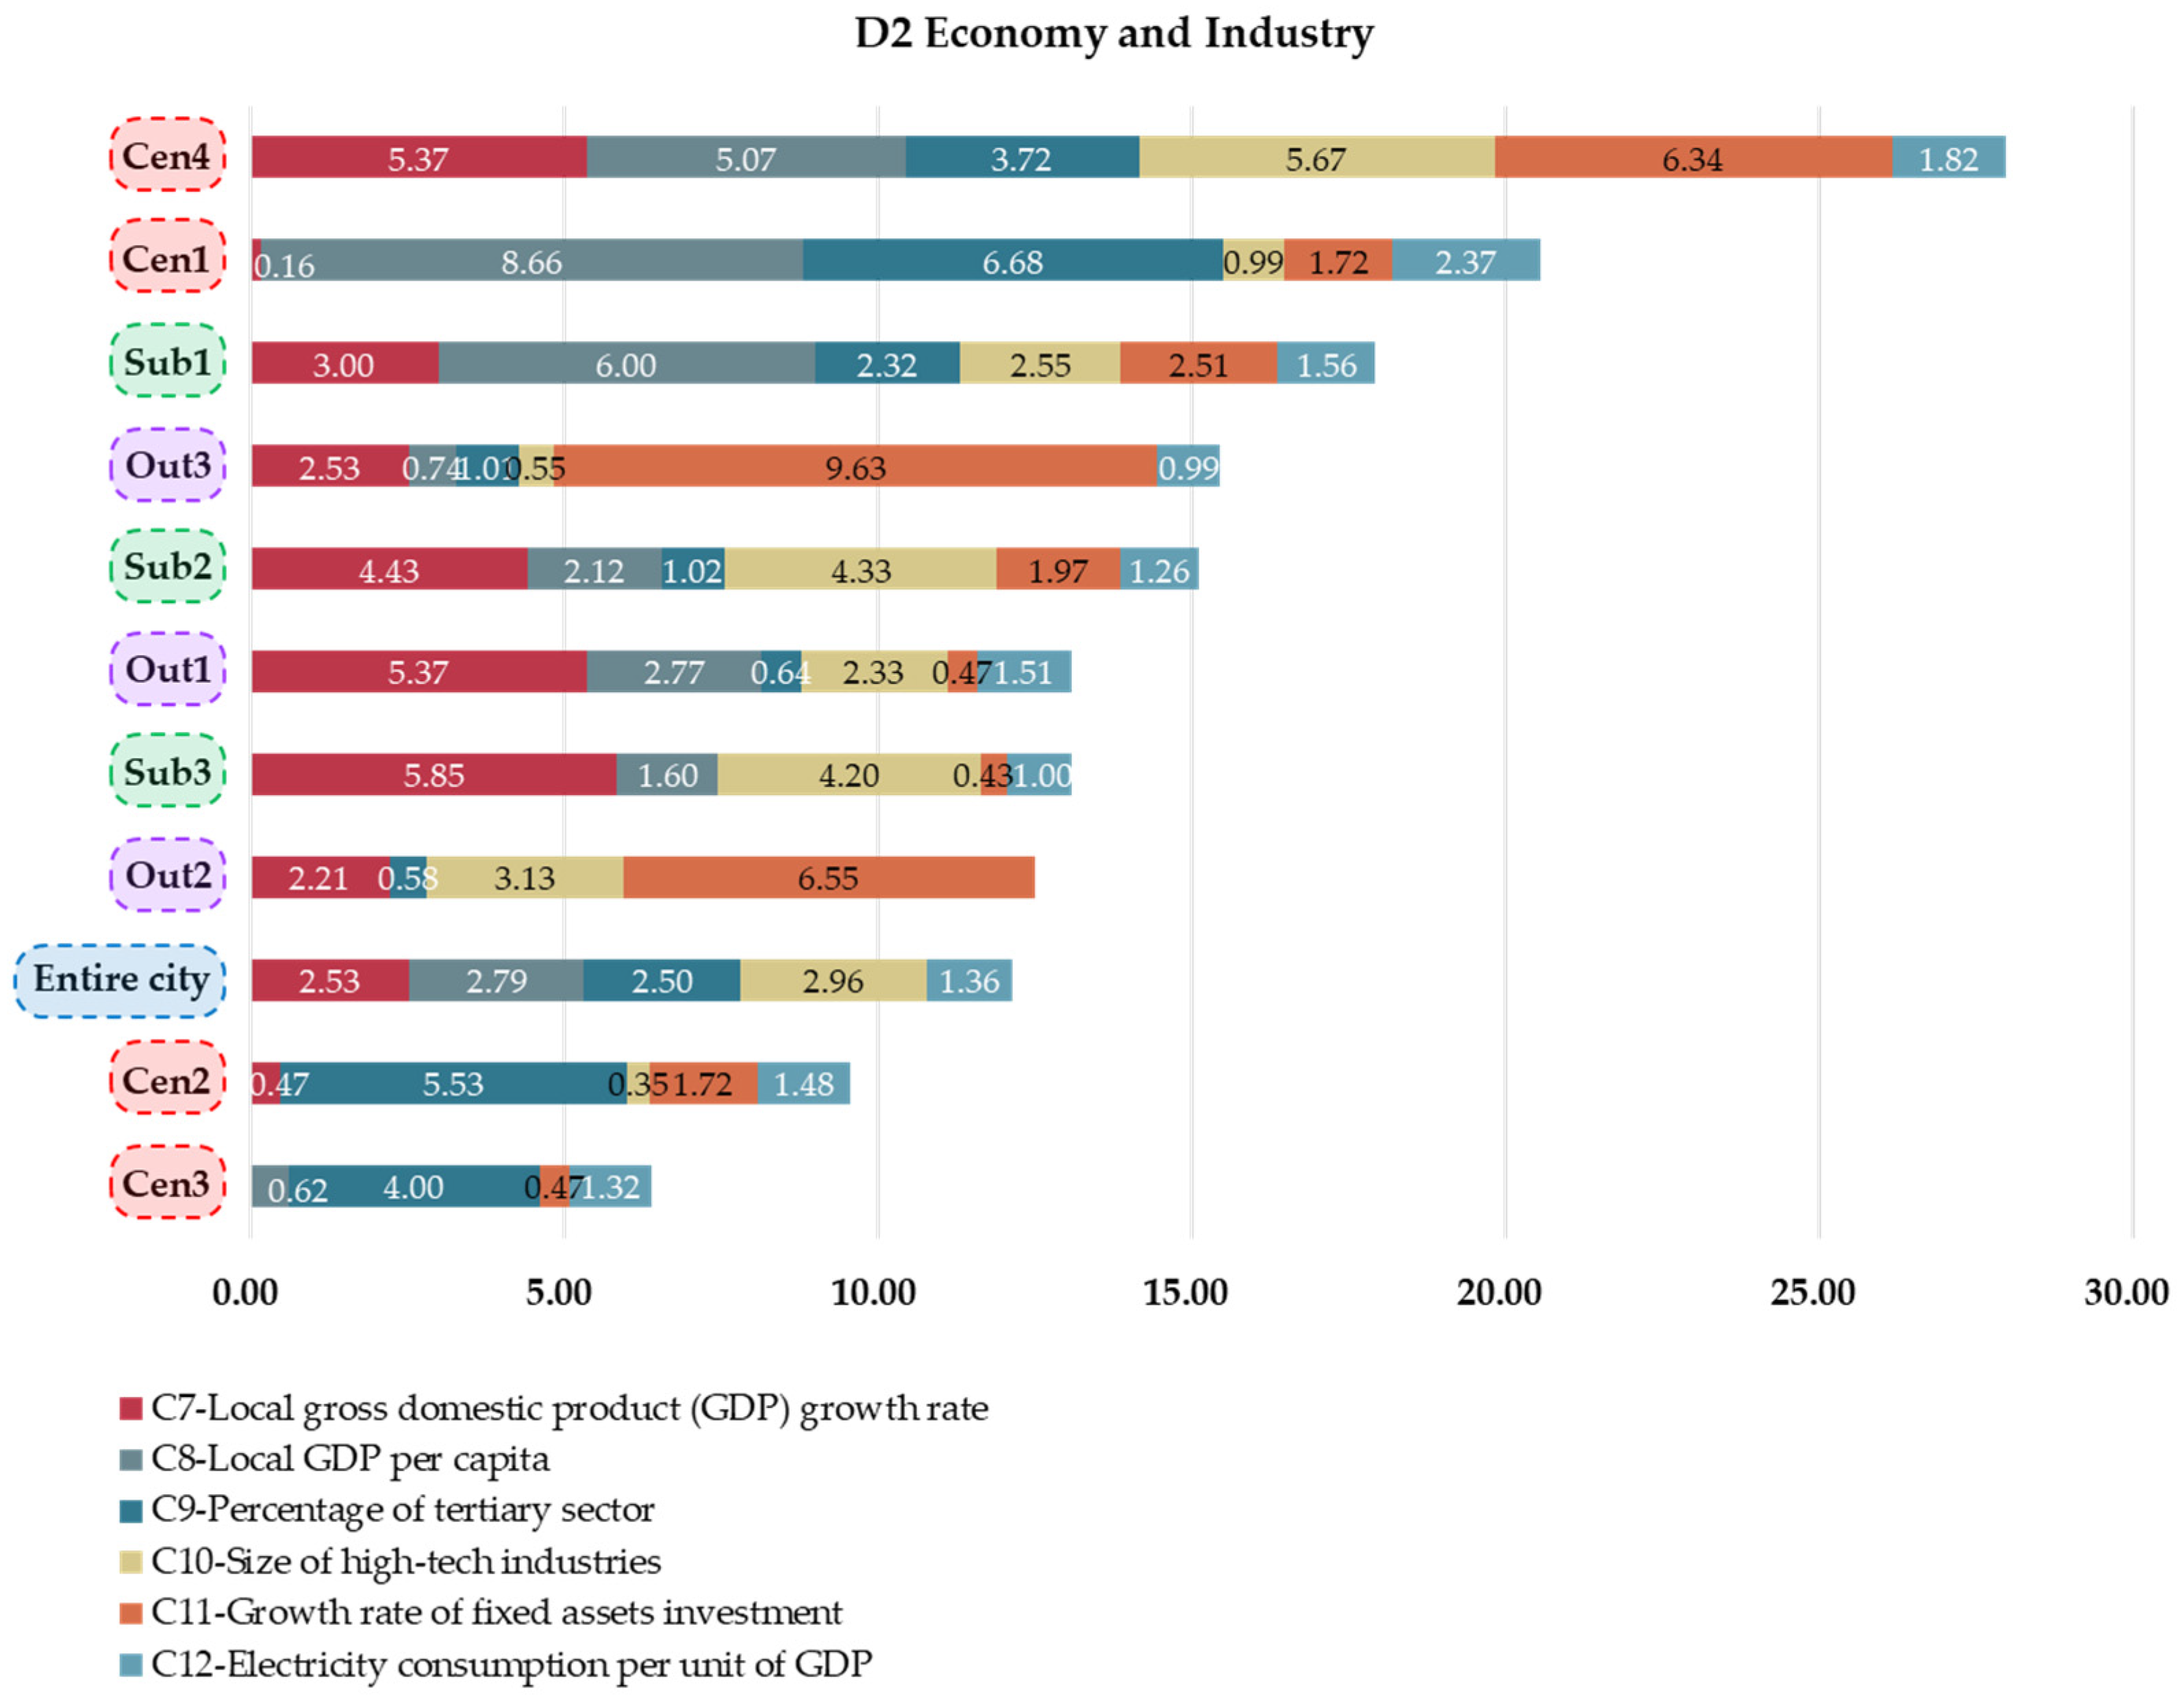
Figure 7 shows the sustainability scores for different indicators in D2. For the entire city of Qingdao, the indicator of C10—size of high-tech industries received the highest score of 2.96, followed by the indicator of C8—local GDP per capita (2.79), C7—local gross domestic product (GDP) growth rate (2.53), and C9—percentage of tertiary sector (2.50). The score of C12—electricity consumption per unit of GDP was 1.36, and that of the C11—growth rate of fixed asset investment was zero. This result indicates that Qingdao has entered a well-developed stage and its energy consumption for economic development should be improved in the future.
For all ten districts, the C7—local gross domestic product (GDP) growth rates in Shinan (Cen1), Shibei (Cen2), and Licang (Cen3) were low (less than 0.5), demonstrating that economic growth made limited contributions to their economic sustainability. In comparison, for all the other seven districts, the scores of C7 ranged between 2.21 and 5.85, suggesting promising economic growth and promoting economic sustainability. Furthermore, the C9—percentage of the tertiary sector (6.68, 5.53 and 4.00 in value, respectively,) was an important driver of the economic sustainability of Shinan (Cen1), Shibei (Cen2), and Licang (Cen3). In comparison, C9 scores in the other districts, except for Laoshan (Cen4) and the West Coast New Area (Sub1), were generally low. In addition, the C8—local GDP per capita, 8.66 in value, was the most important driver of Shinan’s economic sustainability (Cen1).
In Laoshao (Cen4), economic sustainability was the best, with six indicators performing well. The C11—growth rate of fixed asset investment received a score of 6.34, followed by the C10—size of high-tech industries (5.67), and the C7—local gross domestic product (GDP) growth rate (5.37). These results verify that Laoshao’s economy is continuing to grow. However, the C8—local GDP per capita and C9—percentage of the tertiary sector gained 5.07 and 3.72, respectively. The C12—electricity consumption per unit of GDP received a score of 1.82, far less than that of the other indicators. These results indicate that Laoshao should reduce the environmental impacts of economic growth. In Shinan (Cen1), C8—local GDP per capita and C9—percentage of the tertiary sector gained the highest scores of 8.66 and 6.68. However, indicators C10, C11, and C12 received lower scores (0.99, 1.72, and 2.37, respectively). The results indicate that Shinan (Cen1) has upgraded its economic growth towards a low-impact industry, but efforts are needed to improve economic sustainability.
Laixi (Out3), an outer suburban district, benefited significantly from the C11—growth rate of fixed asset investment, with a score of 9.63, showing that Laixi is rapidly developing with construction and facilities. Furthermore, following the orders Sub1, Out3, Sub2, Out1, and Sub3, the contribution of the C7—local gross domestic product (GDP) growth rate to economic sustainability increased gradually, despite some fluctuations. Meanwhile, the contribution of C8—local GDP per capita and C9—percentage of the tertiary sector in these five districts reduced gradually, showing increasing environmental impacts. The contribution of the C11—growth rate of fixed asset investment and C12—electricity consumption per unit of GDP in all five districts, except for Laixi (Out3), remained low, suggesting a high impact on environmental quality. Similar to Laixi (Out3), Pingdu (Out2), another outer suburban district, also relied heavily on the C11—growth rate of fixed asset investment, with a score of 6.55, showing that it is also under development. In addition, for Shibei (Cen2) and Licang (Cen3), all indicators except C9 were low, indicating an urgent need to improve their economic sustainability.

5.5. Urban Sustainability Scores of the Entire City and Ten Districts in the Environment and Resource Dimension (D3)

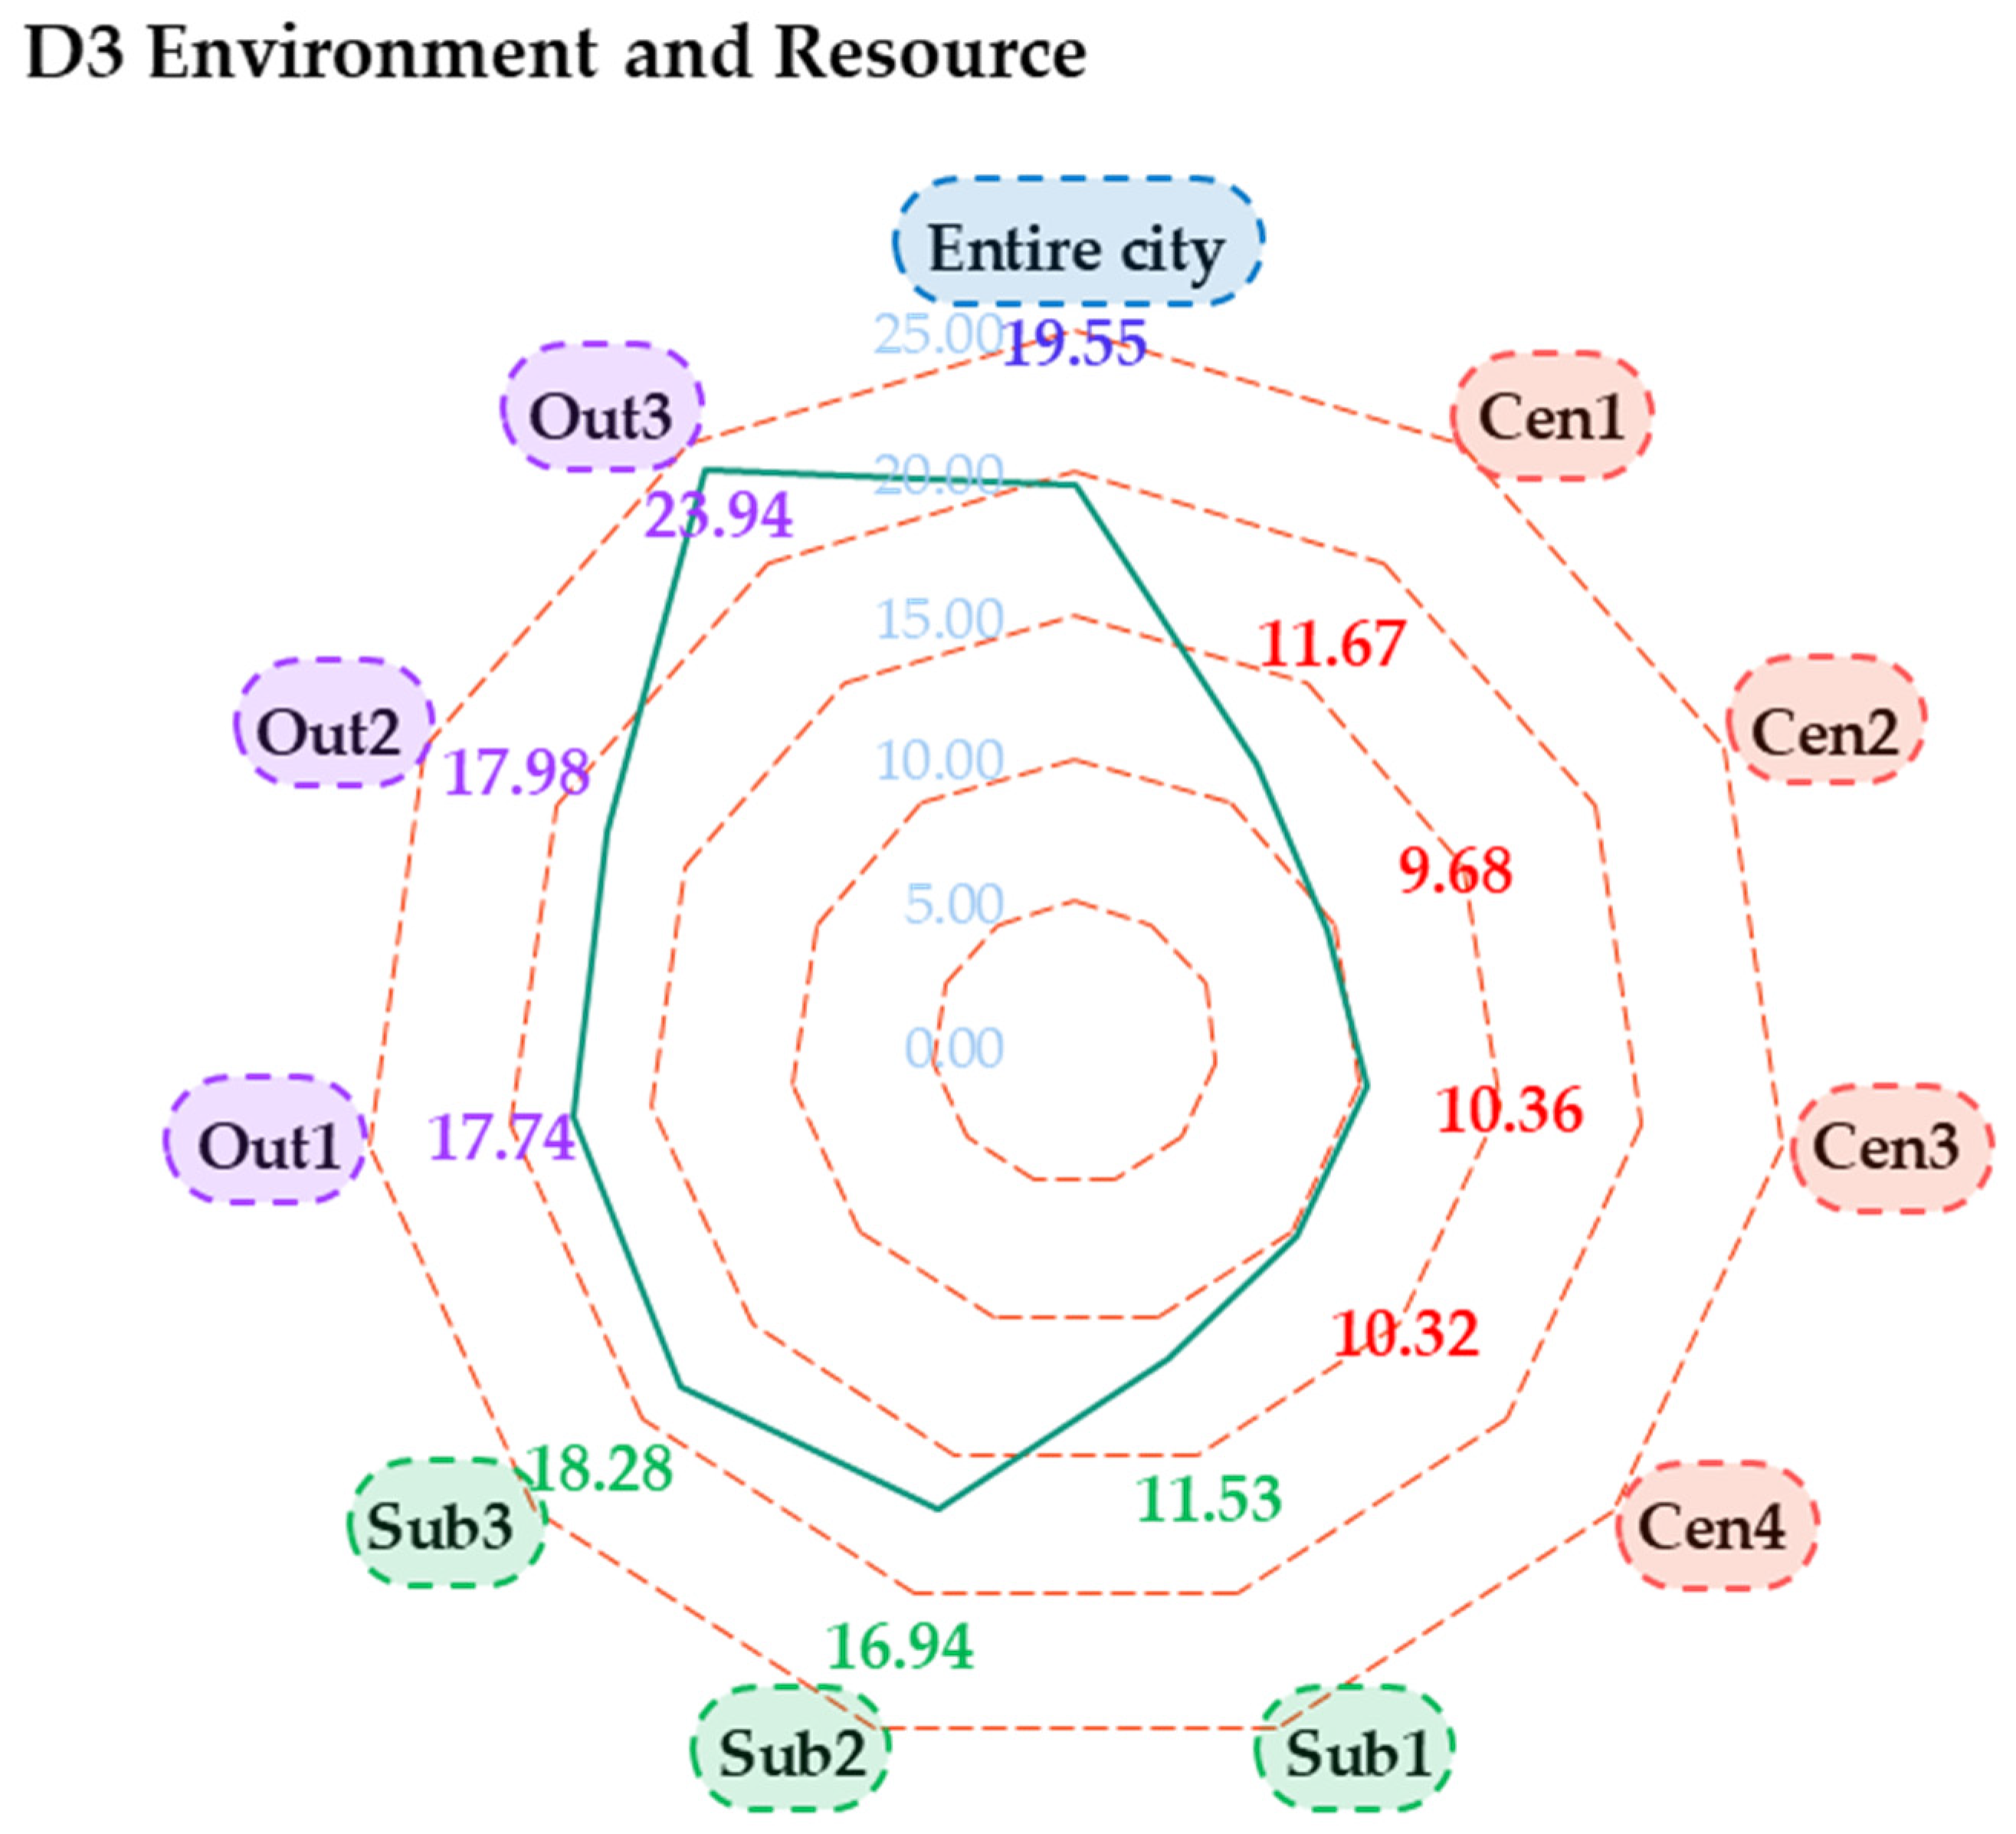
Figure 8 analyzes the urban sustainability scores of the entire city of Qingdao and its ten districts with respect to the environment and resource dimension (D3). The entire city of Qingdao received a score of 19.55, and only one district, Laixi (Out3), received a higher score (23.94) than the entire city. For all other districts, the scores were lower, and the central city districts of Shinan (Cen1), Shibei (Cen2), Licang (Cen3), and Laoshan (Cen4) received lower scores of 11.67, 9.68, 10.36, and 10.32, respectively, compared to the suburban and outer suburban districts of the West Coast New Area (Sub1), Chengyang (Sub2), Jimo (Sub3), Jiaozhou (Out1), and Pingdu (Out2), approximately 11.53, 16.94, 18.28, 17.74, and 17.98, respectively. Overall, urbanized districts face more severe environmental challenges.
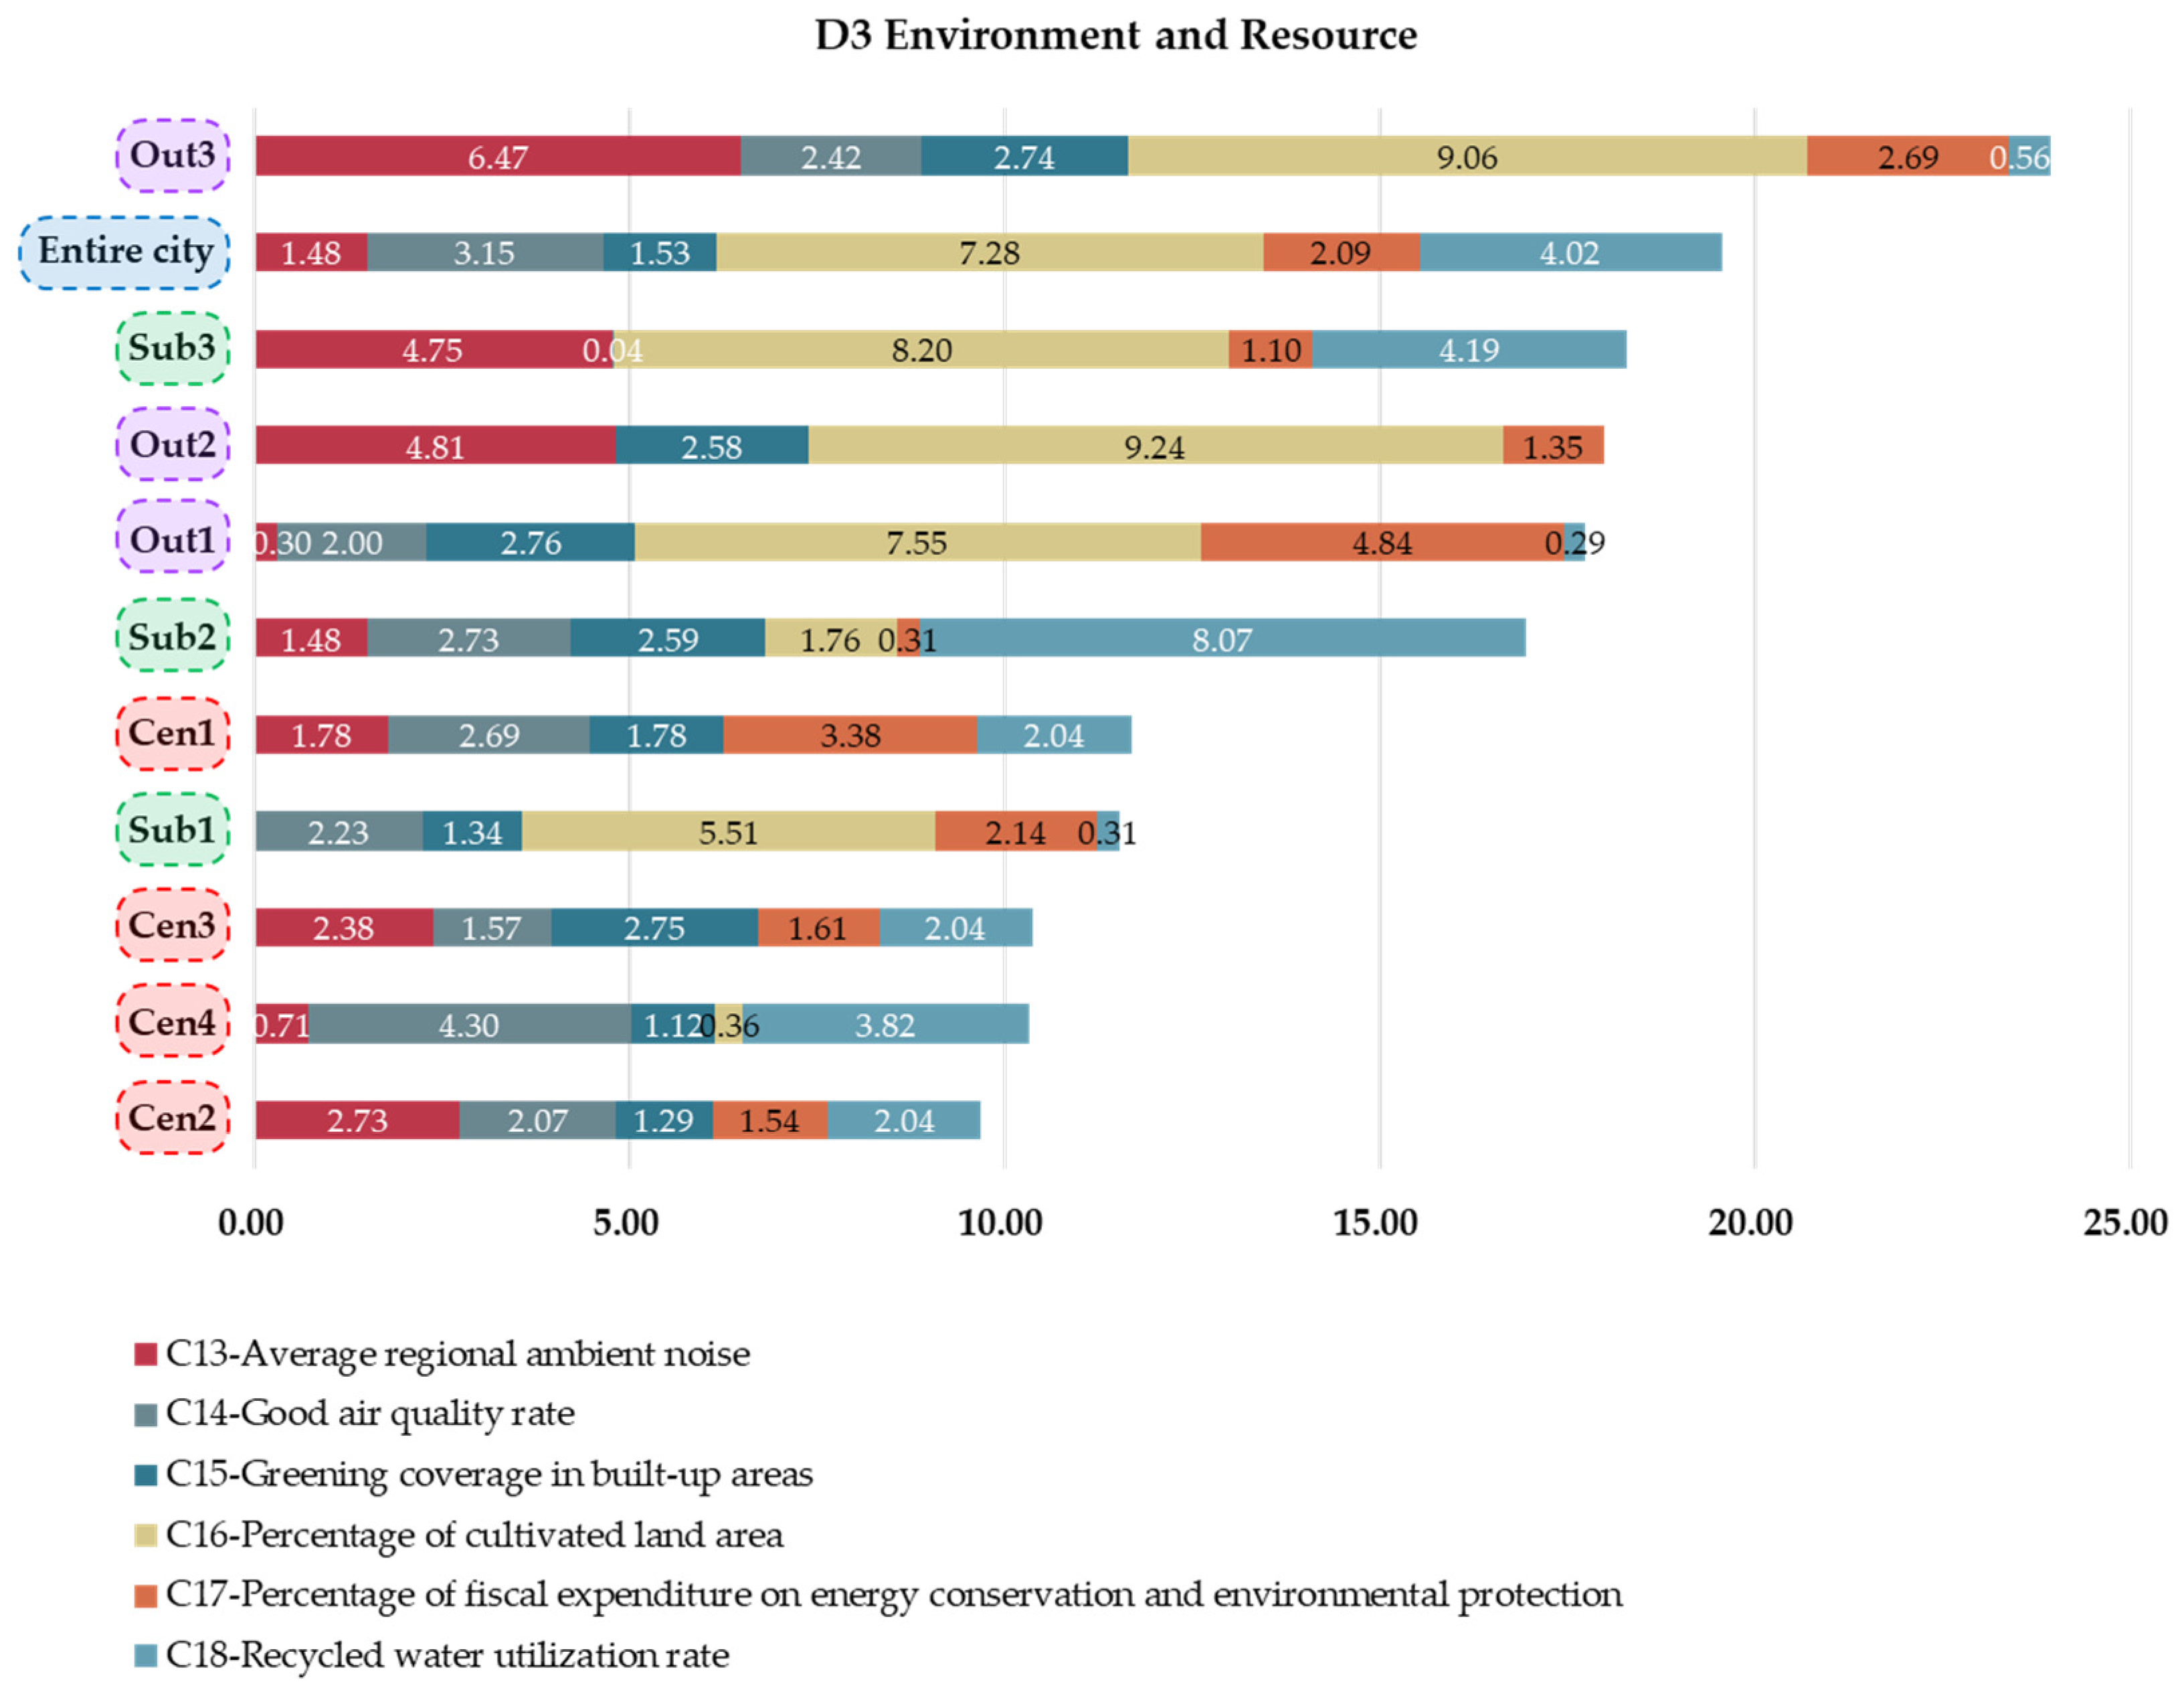
Figure 9 shows the sustainability scores of the different indicators in D3. For the entire city of Qingdao, different indicators showed different levels of environmental sustainability. The indicator of C16—percentage of cultivated land area contributed the most to environmental sustainability, with a score of 7.28. The C18—recycled water utilization rate also played an important role in improving environmental sustainability. Following this, the C14—good air quality rate gained a score of 3.15, also indicating a sufficient contribution. For the remaining three indicators, C13—average regional ambient noise, C15—greening coverage in built-up areas, and C17—percentage of fiscal expenditure on energy conservation and environmental protection, their contributions were weak (approximately 1.48, 1.53, and 2.09, respectively). Overall, environmental sustainability, which is dependent on cultivated land area, suggests that urbanization in Qingdao has a prominent impact on the environment.
Among the districts, Jimo (Sub3), Pingdu (Out2), and Laixi (Out3) received higher scores in the C13—average regional ambient noise than all other districts. This is relevant to the fact that Sub3, Out2, and Out3 are in outer suburban areas with fewer noise sources, whereas districts in the central city and suburban areas may face the challenge of traffic noise. However, the C14—good air quality rate did not contribute to the environmental sustainability of Jim (Sub3) and Pingdu (Out2), which might be relevant to local industrial air pollution. However, other districts were weakly affected by air pollution. The reliance on the C16—percentage of cultivated land area Jimo (Sub3), Jiaozhou (Out1), Pingdu (Out2), and Laixi (Out3) in environmental sustainability also verifies the lower urbanization level in these districts. Urbanization has failed to ensure environmental quality.
Laixi (Out3), the best district in environmental sustainability, depends mainly on two indicators: C13—average regional ambient noise (6.47) and C16—percentage of cultivated land area (9.06). In comparison, other indicators showed low scores, with 2.74 in C15—greening coverage in built-up areas, 2.69 in C17—percentage of fiscal expenditure on energy conservation and environmental protection, and 2.42 in C14—good air quality rate. However, the C18—recycled water utilization rate score was only 0.56, indicating the need to improve water sustainability. In the outer suburban areas, Jiaozhou (Out1) and Pingdu (Out2) also received low scores in the C18—recycled water utilization rate of approximately 0.29 and zero in value, demonstrating that the outer suburban areas should improve the recycled water infrastructure. In comparison, Jimo (Sub3) benefited significantly from C18, which may be relevant for the growth of local industries. In the central city and suburban areas, only the West Coast New Area (Sub1) received a low score (0.31) in C18. In Chengyang (Sub2), environmental sustainability had advantages over C18, with a score of 8.07. In Laoshan (Cen4), environmental sustainability was mainly supported by the C14—good air quality rate (4.30) and C18 (3.82). However, in the remaining cases, the contributions of the C14—good air quality rate, C15—greening coverage in built-up areas, and C17—percentage of fiscal expenditure on energy conservation and environmental protection were not prominent. Overall, urbanization in Qingdao has caused environmental deterioration, however, the relevant infrastructure for environmental sustainability has not been well developed.

5.6. Urban Sustainability Scores of the Entire City and Ten Districts in Municipal and Cultural Facilities Dimension (D4)

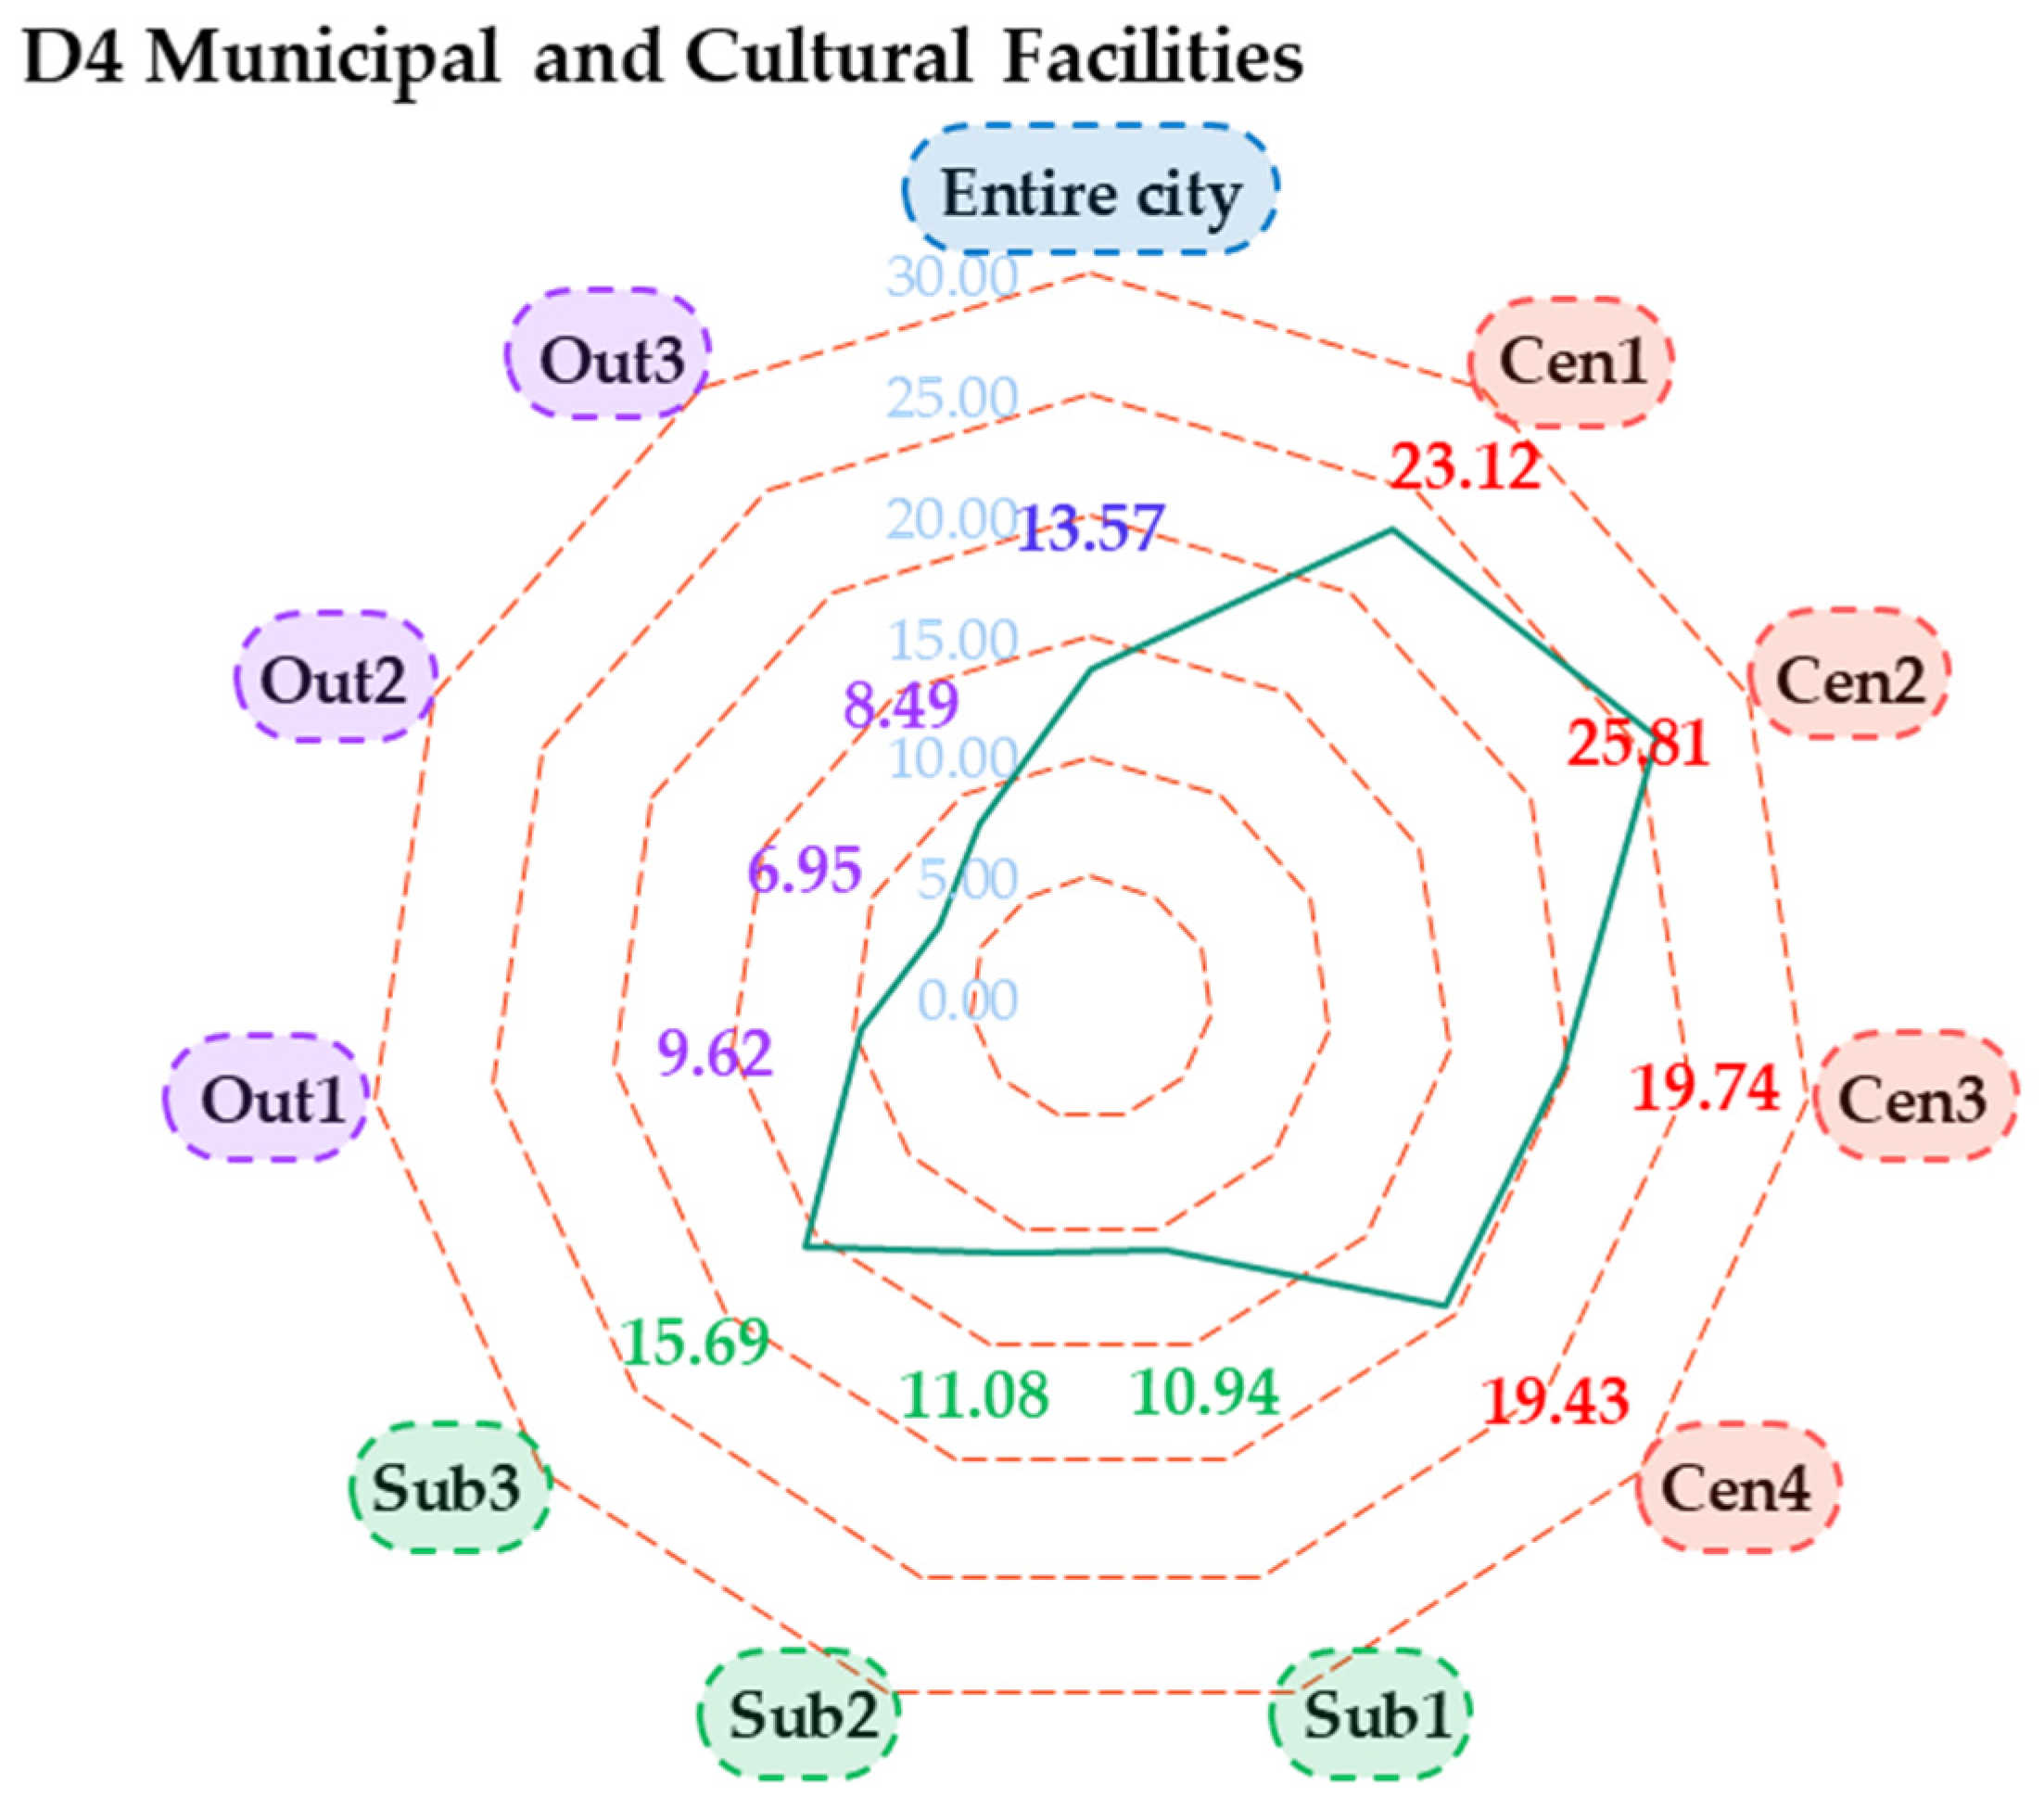
Figure 10 analyzes the urban sustainability scores of the entire city of Qingdao and its ten districts with respect to the municipal and cultural facilities dimension (D4). Overall, the entire city of Qingdao received a score of 13.57, and five of the ten districts had higher scores than the entire city. In general, the four districts in the central city area had the highest scores, about 23.12 (Cen1, Shinan), 25.81 (Cen2, Shibei), 19.74 (Cen3, Licang), and 19.43 (Cen4, Laoshan). In comparison, the three districts in the outer suburban areas had lower scores than the entire city. In Jiaozhou, Pingdu, and Laixi, the scores were 9.62 (Out1), 6.95 (Out2), and 8.49 (Out3), respectively. Suburban areas consisting of the West Coast New Area (Sub1), Chengyang (Sub2), and Jimo (Sub3) had good scores of approximately 10.94, 11.08, and 15.69, respectively. Typically, suburban areas underwent urbanization, which can lead to the conclusion that municipal and cultural sustainability cannot be well-addressed during rapid urbanization. For the central city area, the districts are well-urbanized, so that a series of municipal and cultural facilities and services can be provided. However, the results suggest that Shinan (Cen1) and Shibei (Cen2) had better municipal and cultural infrastructures than Licang (Cen3) and Laoshan (Cen4). In comparison, municipal and cultural infrastructure and associated cultural sustainability were not highlighted for low urbanization rates in Jiaozhou (Out1), Pingdu (Out2), and Laixi (Out3).
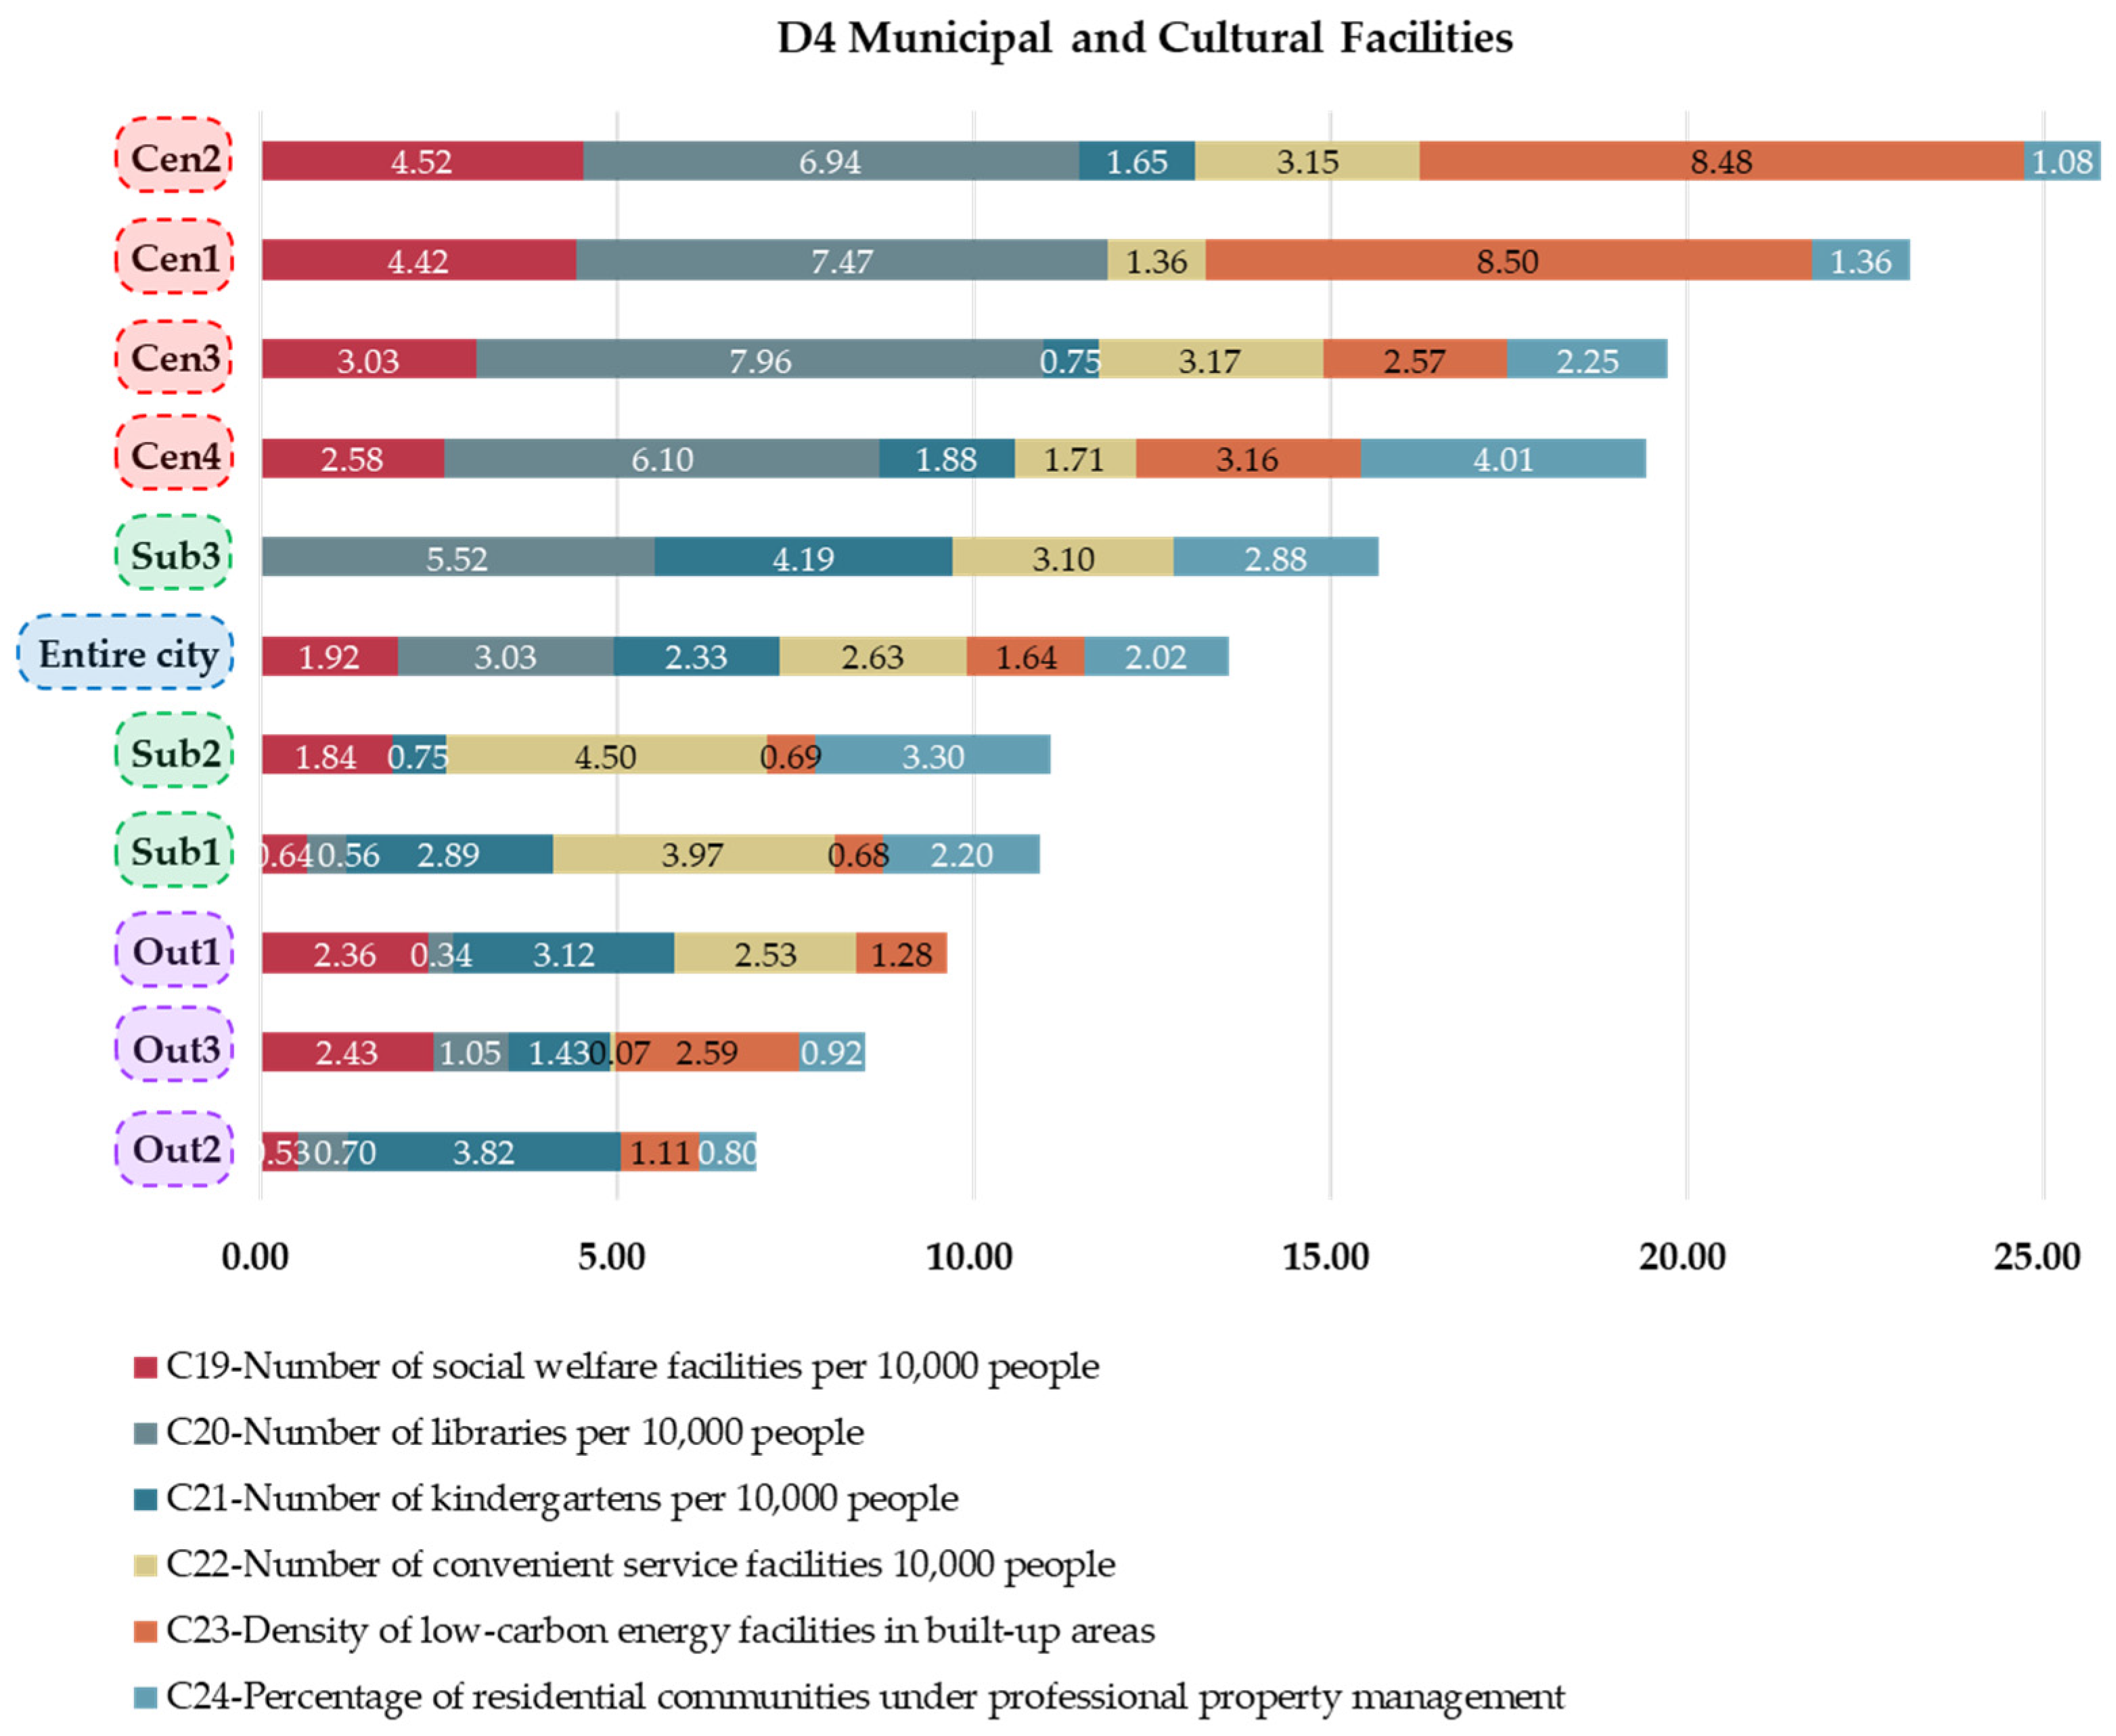
Figure 11 presents the sustainability scores of the different indicators for D4. For the entire city, all indicators gained roughly similar scores, ranging from 1.64 and 3.03. The C20—number of libraries per 10,000 people received a score of 3.03, and the C21—number of kindergartens per 10,000 people received a score of 1.64. Overall, the central city area, consisting of Cen1, Cen2, Cen3, and Cen4, received the highest score for C19—number of social welfare facilities per 10,000 people, with values of 4.42, 4.52, 3.03, and 2.58, respectively. Meanwhile, the scores gained by C20—number of libraries per 10,000 people in these four districts were also the largest, at approximately 7.47, 6.94, 7.96, and 6.10, respectively. The scores of C19 of the districts in the suburban area were low, with the values of 0.64 (Sub1, West Coast New Area), 1.84 (Sub2, Chengyang) and zero (Sub3, Jimo). The scores of the C19 of the districts in the outer suburban area were not high, about 2.43, 0.53 and 2.36 for Out1 (Jiaozuo), Out2 (Pingdu), and Out3 (Laixi), respectively. Overall, C19 and C20 were the main indicators contributing to the differences in municipal and cultural suitability among the ten districts.
An analysis of the municipal and cultural sustainability in each district suggested that the municipal and cultural sustainability of Shinan (Cen1) and Shibei (Cen2) was the best, with almost all indicators receiving high scores, except for the C24—percentage of residential communities under professional property management. Actions are required for professional property management to ensure cultural sustainability. The C24 values in Licang (Cen3) and Laoshan (Cen4) were good, but not high, with scores of approximately 2.25 and 4.01, respectively. Moreover, the indicator of C23—density of low-carbon energy facilities in built-up areas in both Licang (Cen3) and Laoshan (Cen4) received good scores of approximately 2.57 and 3.16 in value, respectively. However, the indicators C21—number of kindergartens per 10,000 people and C22—number of convenient service facilities per 10,000 people did not perform well, with low scores.
Furthermore, in Jiaozhou (Out1), Pingdu (Out2), and Laixi (Out3), the indicators C21 and C22 performed well with good scores. However, the other indicators received low scores, limiting the municipal and cultural sustainability of the three districts. In the suburban area, apart from the C24—percentage of residential communities under professional property management and the C22—number of convenient service facilities 10,000 people, all other indicators in the West Coast New Area (Sub1) and Chengyang (Sub2) received low scores. In Jimo (Sub3), all the other indicators performed well, except for C19 and C23.

5.7. Urban Sustainability Scores of the Entire City and Ten Districts in Development Potential Dimension (D5)

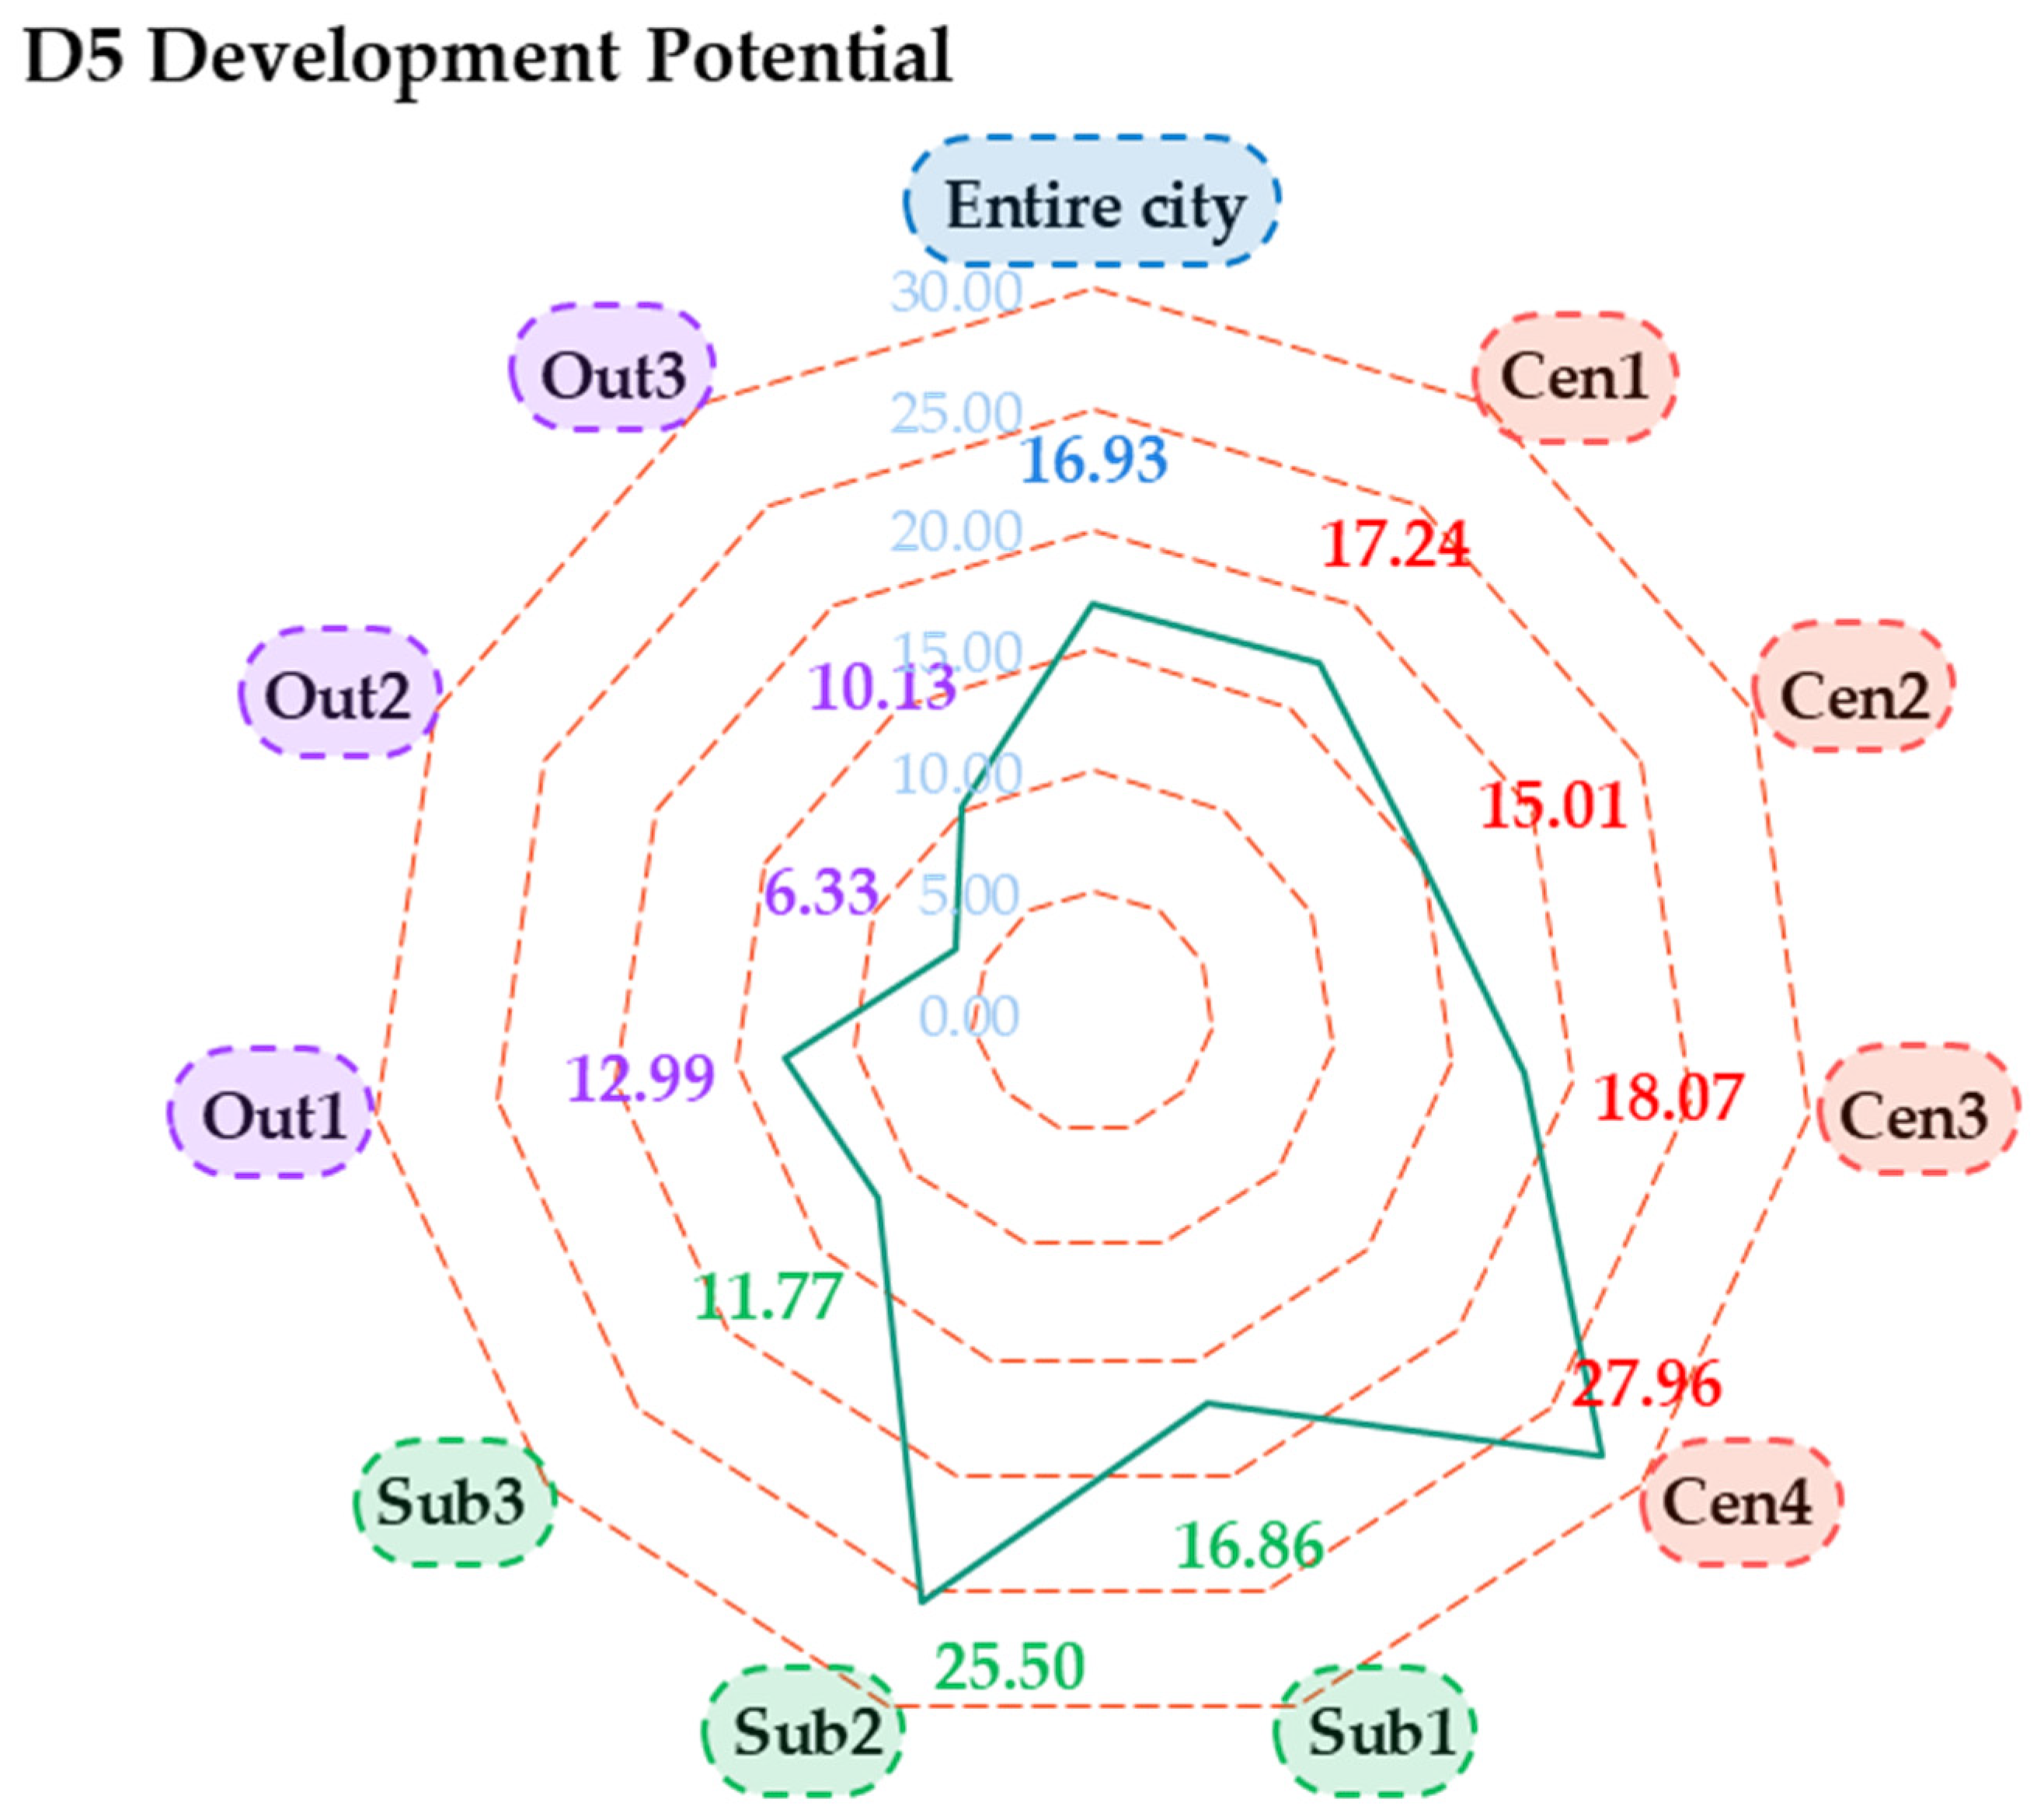
Figure 12 analyzes the urban sustainability scores of the entire city of Qingdao and its ten districts with respect to the development potential dimension (D5). The entire city of Qingdao received a score of 16.93 in D5, and four districts received higher scores than the entire city. They were Shinan (Cen1), Licang (Cen3), Laoshan (Cen4), and Chengyang (Sub2), and values were 17.24, 18.07, 27.96, and 25.50, respectively. In comparison, the development potential levels of Jimo (Sub3), Jiaozhou (Out1), Pingdu (Out2), and Laixi (Out3) were generally low, with values of 11.77, 12.99, 6.33, and 10.13, respectively. These results may indicate that well-urbanized districts had good development potential. However, the score for Shibei (Cen2) was only 15.01, whereas that for the West Coast New Area (Sub1) was 16.86.
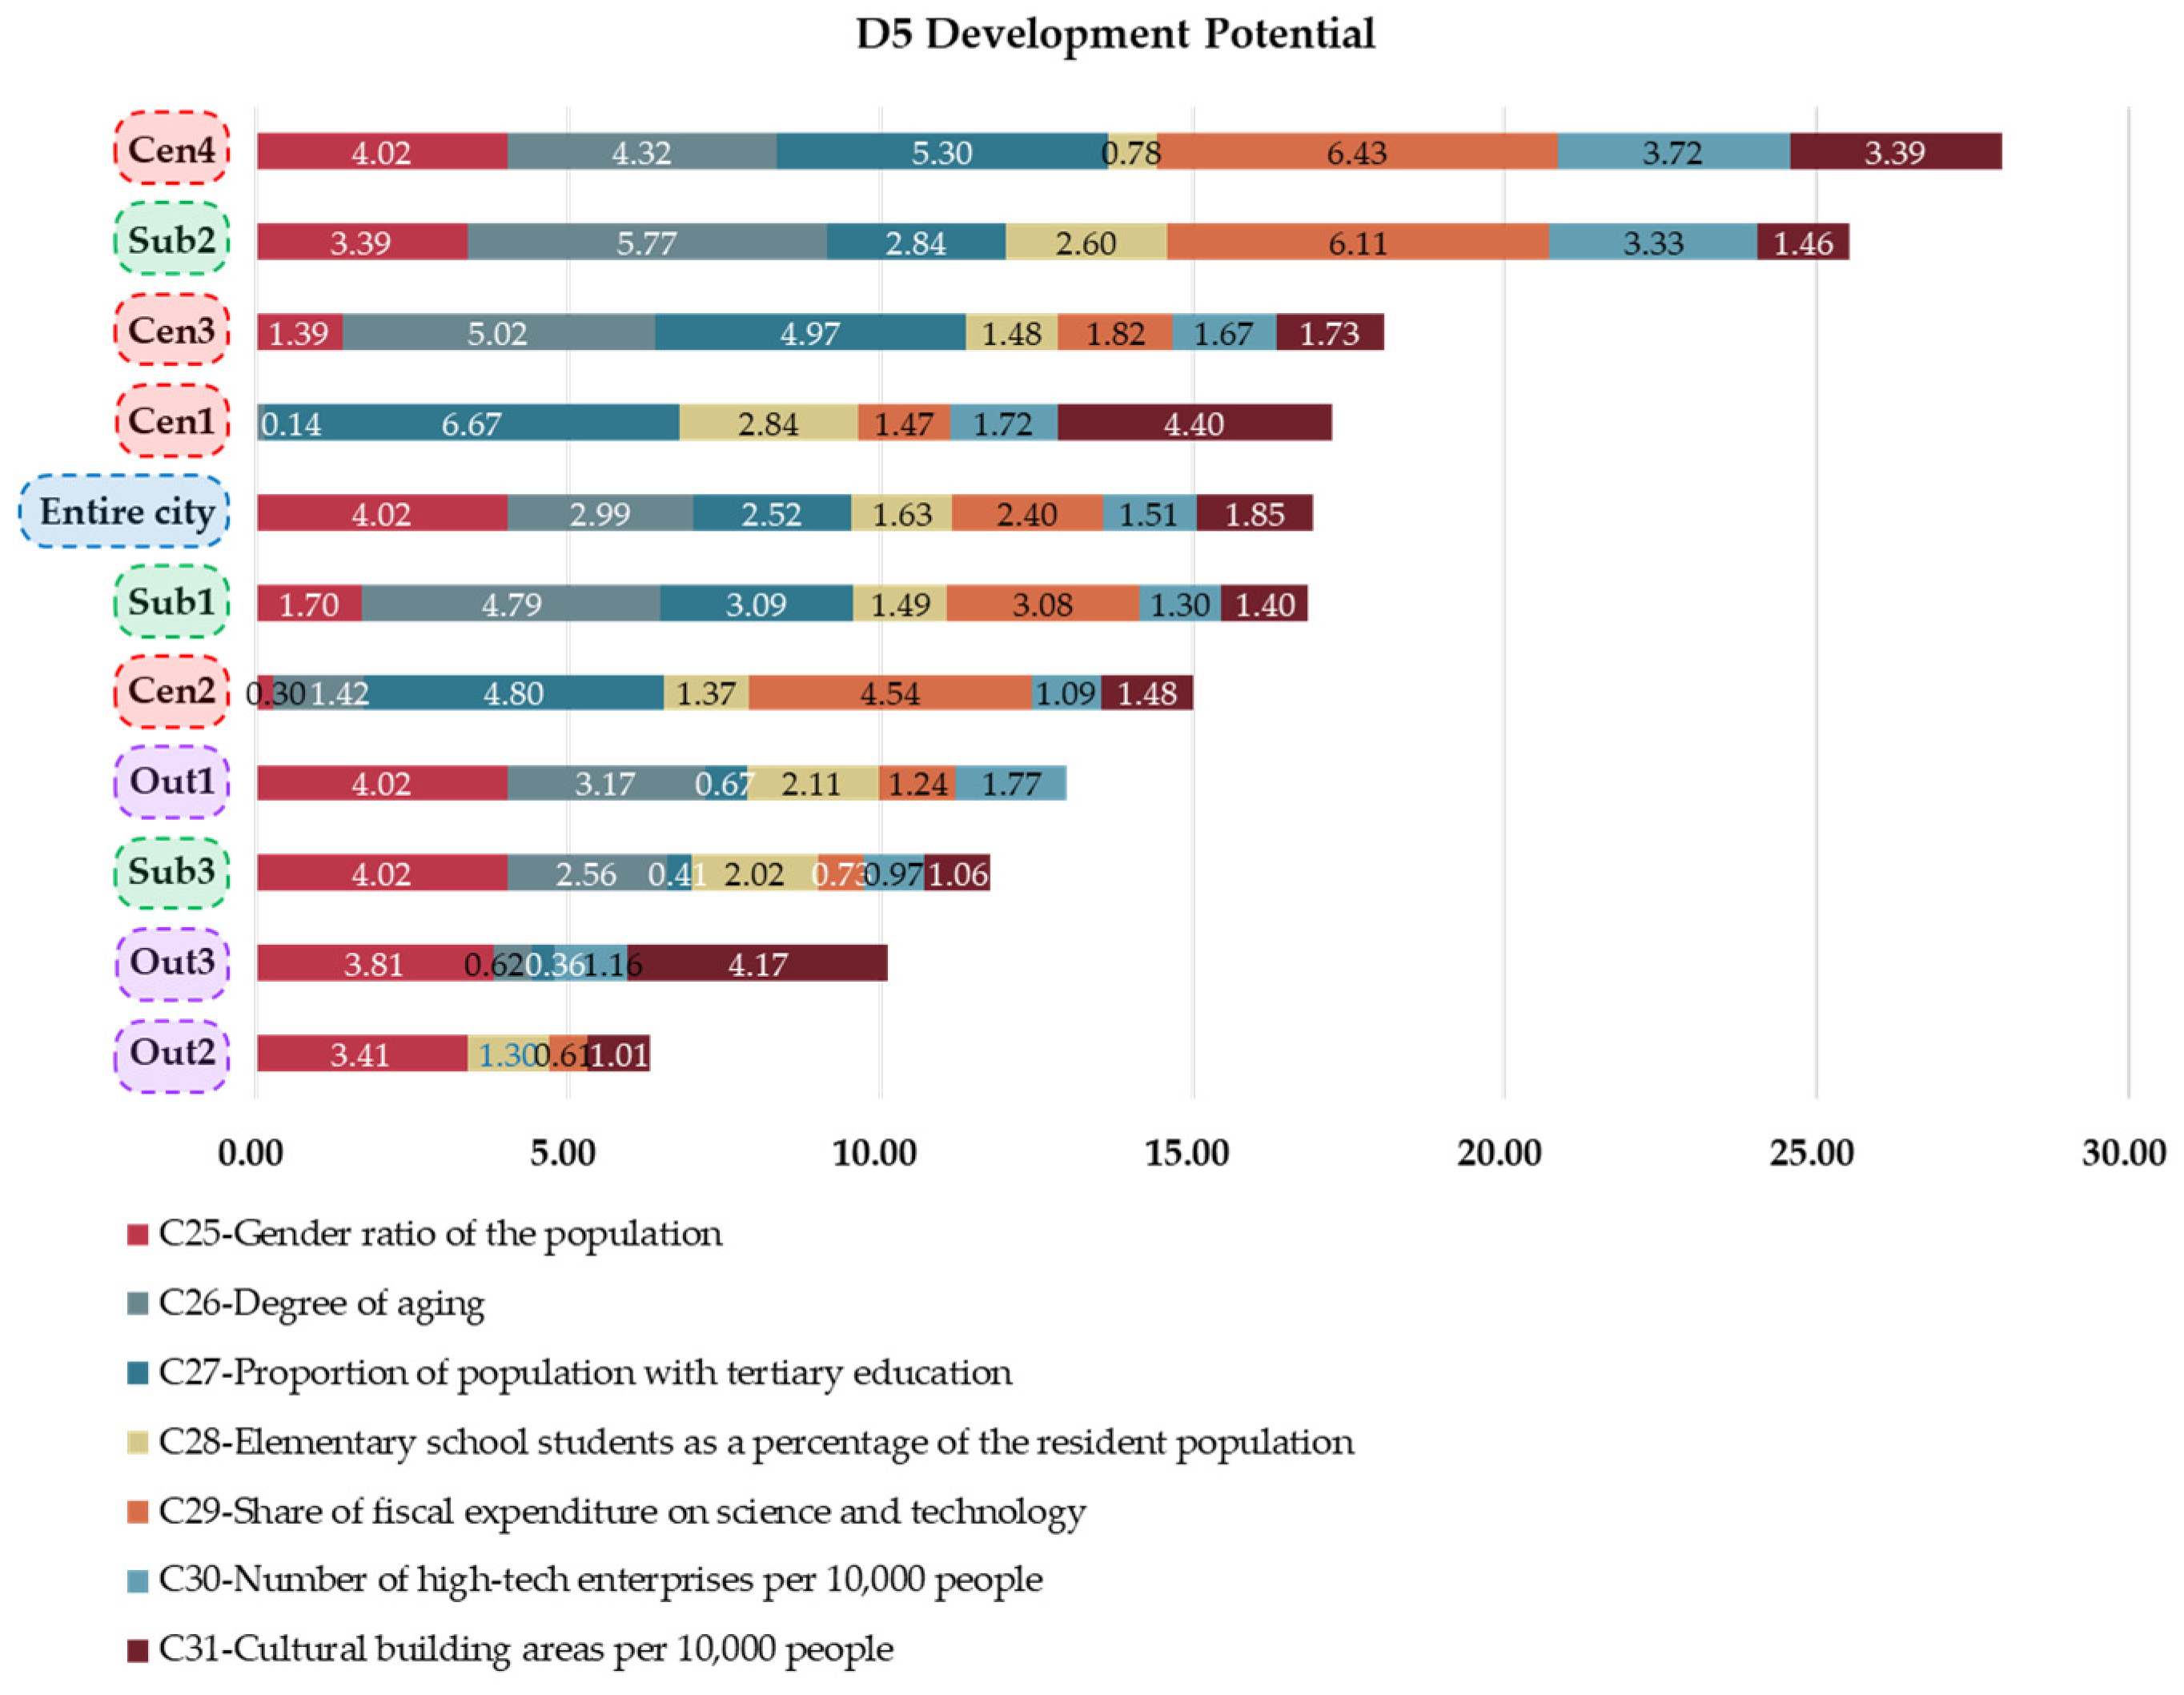
Figure 13 presents the sustainability scores of the different indicators in the dimension D5. Overall, seven indicators in the entire city of Qingdao received even scores ranging from 1.63 and 4.02. The indicator of C28—elementary school students as a percentage of the resident population received the lowest value of 1.63. In comparison, the indicator of the C25—gender ratio of the population had the highest value of 4.02. Other indicators, such as C26—degree of aging, C27—proportion of population with tertiary education, and C29—share of fiscal expenditure on science and technology, gained scores higher than 2.0. However, indicators of C30—number of high-tech enterprises per 10,000 people and C31—cultural building areas per 10,000 people gained scores lower than 2.0.
For specific districts, the results indicate that Shinan (Cen1), Shibei (Cen2), and Licang (Cen3) did not benefit much from the C25—gender ratio of the population, with low scores of 0, 0.30, and 1.39, respectively. In comparison, all other districts gained strength from C25 for development potential. Regarding the C27—proportion of population with tertiary education, the districts of Jimo (Sub3), Jiaozhou (Out1), Pingdu (Out2), and Laixi (Out3) received low scores of 0.41, 0.67, 0, and 0.36, respectively. In comparison, all other districts benefited from C27, especially Shinan (Cen1), Shibei (Cen2), Licang (Cen3), and Laoshan (Cen4), at approximately 6.67, 4.80, 4.97, and 5.30, respectively. Likewise, the indicator of C29—share of fiscal expenditure on science and technology received low scores of 0.73 in Jimo (Sub3), 1.24 Jiaozhou (Out1), 0.61 in Pingdu (Out2) and 0 in Laixi (Out3). However, C29 was higher in the other districts.
For Laoshan (Cen4), a district with a better developmental potential level than all others, its seven indicators received good scores, except for C28—elementary school students as a percentage of the resident population. For Chengyang (Sub2), another district with good development potential, its seven indicators received good scores, except for C31—cultural building areas per 10,000 people. In all other districts, the scores gained by C28—elementary school students as a percentage of the resident population, C29—share of fiscal expenditure on science and technology, C30—number of high-tech enterprises per 10,000 people, and C31—cultural building areas per 10,000 people were generally low, limiting the future development of these districts.

5.8. Strength and Shortcomings of Urban Sustainability

In this study, a UEES framework was developed for an urban sustainability assessment. The examination system was applied to Qingdao, China, and the original findings were obtained, which could provide a reference for understanding the progress and challenges relevant to urban sustainability in this city. Overall, the results suggest that well-urbanized districts performed better in overall sustainability (e.g., Shinan, Shibei, Laoshan, Chengyang), while districts in suburban and outer suburban areas had lower urban sustainability levels. Nevertheless, districts in the central city area did not always perform better in all dimensions than those in the suburban and outer suburban areas. Districts in suburban and outer suburban areas still performed better in some respects.
For D1, Shinan (Cen1) was the only district in the central city area that performed better than the entire city, whereas Jimo (Sub3) and Pingdu (Out2) in suburban and outer suburban areas, respectively, could also perform better than the entire city. However, all other districts performed worse in terms of construction sustainability than the entire city. For D2, Shibei (Cen2) and Licang (Cen3) performed worse than the entire city, but all other districts, regardless of area difference, performed better than the entire city in terms of economic sustainability. For D3, districts in suburban and outer suburban areas received higher scores than those in the central city area. This suggests that urbanization has led to environmental deterioration, especially in built-up areas. For D4, districts in suburban areas that are under rapid urbanization performed the worst in terms of cultural sustainability. Highly urbanized districts in the central city area perform the best in terms of cultural sustainability. This means that well-urbanized districts have advantages in terms of cultural facilities and services, while cultural infrastructure is generally neglected in developing areas. For D5, well-urbanized districts gained strength, whereas less-urbanized districts in outer suburban areas had the worst development potential. Overall, the transition from less-urbanized to well-urbanized districts may lead to environmental deterioration and economic growth deceleration (if industries are not well upgraded), but cultural sustainability and development potential can be improved.
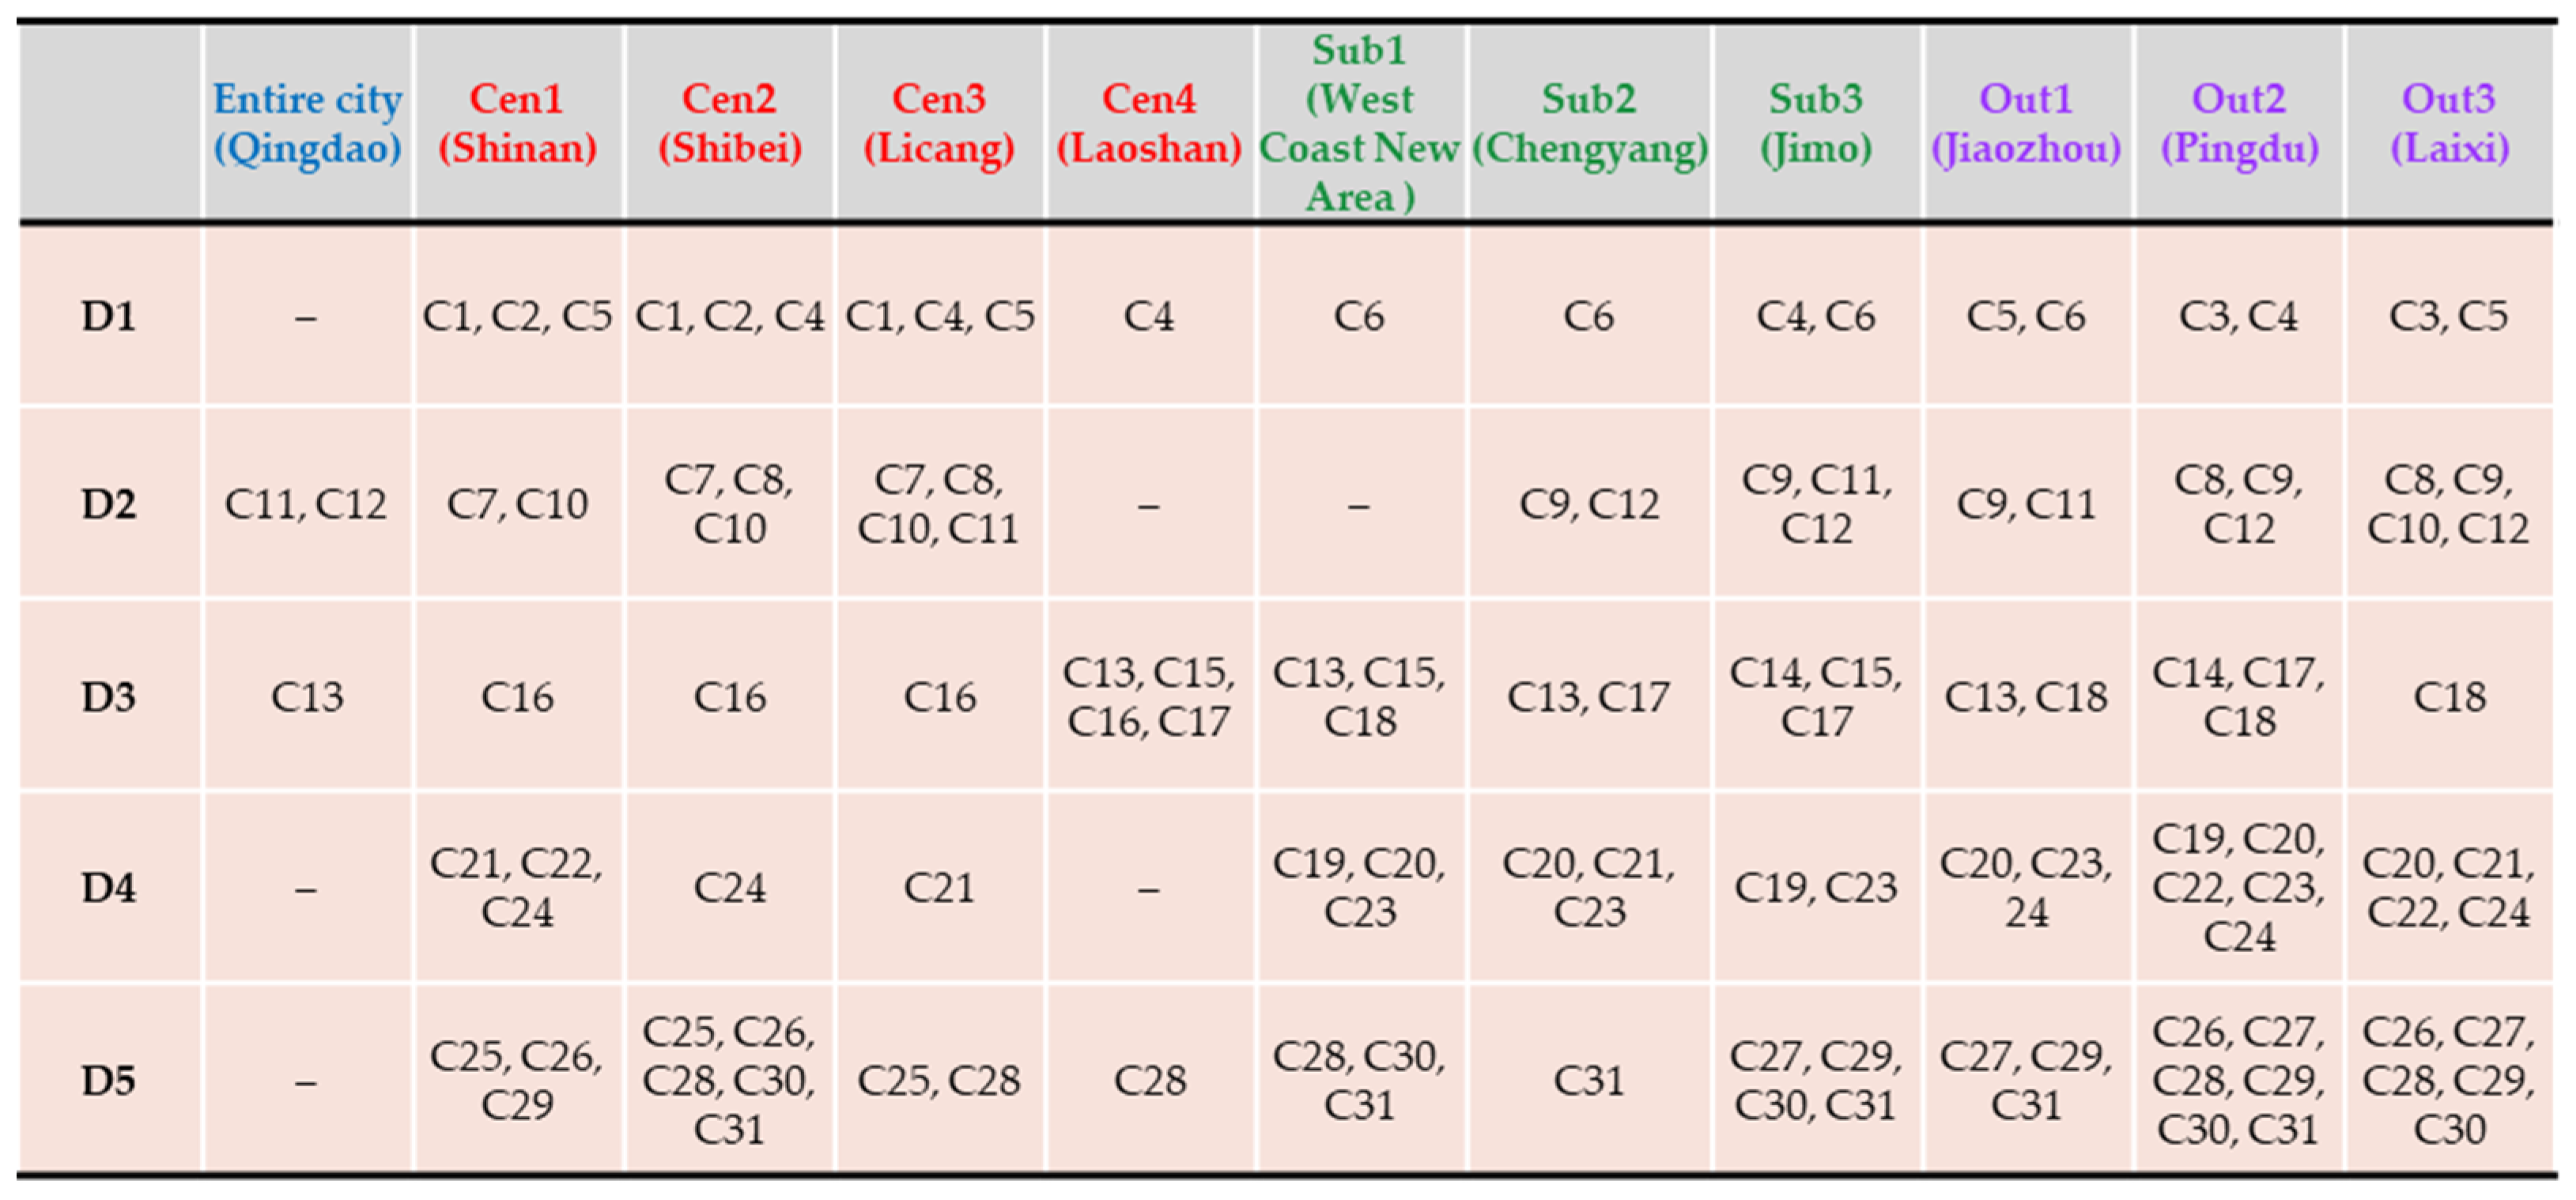
The analysis also showed that the achievement of sustainability in specific dimensions had some convergence (Figure 14). For D1, the C6—fire station coverage rate was an important driver of Shinan (Cen1) and Shibei (Cen2) in the central city area, while the C1—development intensity of built-up areas and/or the C2—population density of built-up areas were important drivers of the construction sustainability of districts in suburban and outer suburban areas. For D2, the C9—percentage of the tertiary sector was an important driver of the economic sustainability of districts in the central city area, while the C7—local gross domestic product (GDP) growth rate and C10—size of high-tech industries were important drivers of the economic sustainability of districts in suburban and outer suburban areas. In addition, the C11—growth rate of fixed asset investment was also important for Shibei (Cen2), Laoshan (Cen4), Pingdu (Out2), and Laixi (Out3).
For D3, C13—average regional ambient noise and/or C14—good air quality rate were drivers of environmental sustainability in the central city area, and C13—average regional ambient noise was also an important driver for outer suburban areas. Moreover, the C14—good air quality rate and/or C16—percentage of cultivated land area were the drivers of the environmental sustainability of suburban and outer suburban areas. For D4, the C20—number of libraries per 10,000 people and/or C23—density of low-carbon energy facilities in built-up areas were important drivers of cultural sustainability in the central city area. Moreover, the C21—number of kindergartens per 10,000 people and/or C22—number of convenient service facilities per 10,000 people were important drivers of cultural sustainability in suburban and outer suburban areas. For D5, the C27—proportion of the population with tertiary education and/or C29—share of fiscal expenditure on science and technology were drivers of the development potential of the central city area, and the C25—gender ratio of the population and/or C26—degree of aging were drivers of suburban and outer suburban areas.
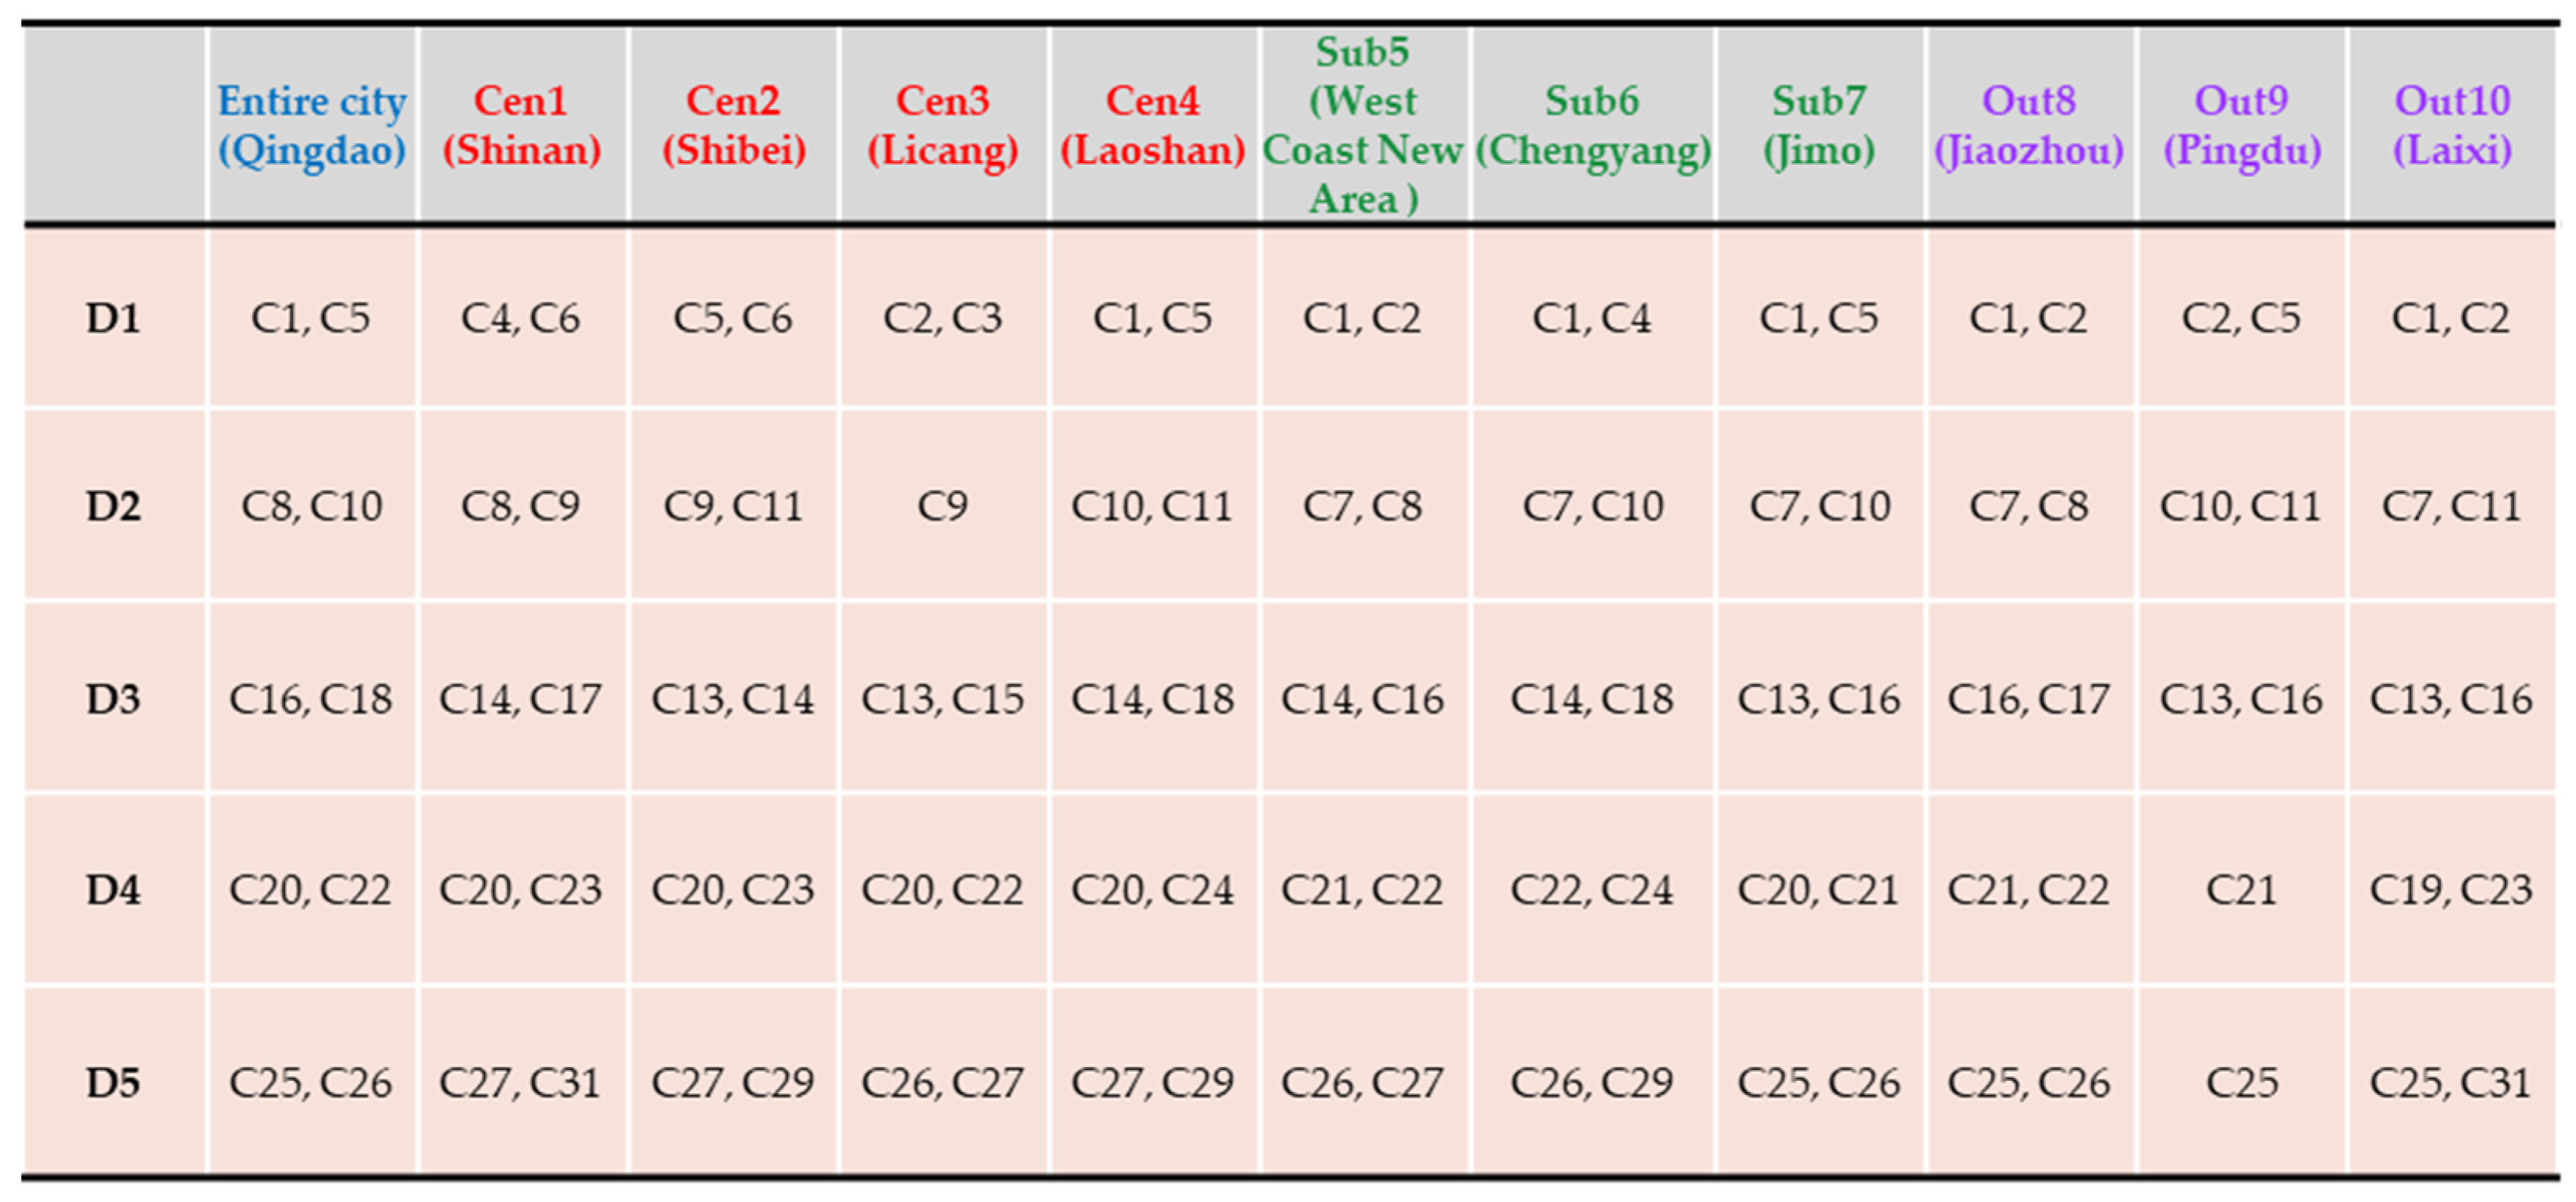
Figure 15 presents indicators with low sustainability scores. For D1, C1—development intensity of built-up areas, C2—population density of built-up areas, C4—retrofitted areas of old residential communities, and/or C5—the ratio of the increasing areas of new residential buildings to the increasing population constrained the construction sustainability of the central city area. In comparison, the C6—fire station coverage rate limited the construction sustainability of districts in suburban areas. C4—retrofitted areas of old residential communities and/or C6—fire station coverage rates were barriers to the outer suburban areas. For D2, the C7—local gross domestic product (GDP) growth rate, C8—local GDP per capita, and/or C10—size of high-tech industries were barriers to the economic sustainability of the central city area. C9—percentage of tertiary sector, C11—growth rate of fixed assets investment, and/or C12—electricity consumption per unit of GDP were the main barriers to economic sustainability in suburban and outer suburban areas.
For D3, C16—percentage of cultivated land area was the main barrier to environmental sustainability of districts in the central city area, while the main barriers of the suburban area were C13—average regional ambient noise, C15—greening coverage in built-up areas, and/or C17—percentage of fiscal expenditure on energy conservation and environmental protection. Moreover, the C18—recycled water utilization rate was a key challenge for districts in the outer suburban areas. For D4, the C24—percentage of residential communities under professional property management and/or C21—number of kindergartens in built-up areas were barriers to the cultural sustainability of districts in the central city area. C20—number of libraries per 10,000 people, C21—number of kindergartens per 10,000 people and/or C23—density of low-carbon energy facilities in built-up areas were barriers to the districts in suburban areas. Furthermore, the C20—number of libraries per 10,000 people, C23—density of low-carbon energy facilities in built-up areas and/or C24—percentage of residential communities under professional property management were barriers to the cultural sustainability of districts in outer suburban areas. For D5, the C25—gender ratio of the population and C28—elementary school students as a percentage of the resident population were barriers to the central city area. C28—elementary school students as a percentage of the resident population and/or C31—cultural building areas per 10,000 people were the main barriers to development potential in suburban areas. The C27—proportion of the population with tertiary education, C29—share of fiscal expenditure on science and technology, and/or C31—cultural building areas per 10,000 people were key barriers to the development potential of districts in outer suburban areas.
To date, this research has carried out a comprehensive urban sustainability assessment for Qingdao and its ten districts. It identified the strengths and weaknesses of each district’s sustainable development, and provides recommendations for future development. This case study demonstrated the feasibility and effectiveness of the evaluation system. It is essential to emphasize that the successful implementation of this assessment system relies on data from the statistical yearbook. Thanks to the annual publication of statistical yearbooks, it is possible to evaluate a city’s sustainable development by updating the input data while keeping the research framework unchanged. Consequently, this research is replicative and presents a significant advantage over the existing evaluation systems.

6. Conclusions

The effective improvement of urban sustainability is a critical issue for urban planners, designers, and managers. This study developed a tangible and implementable UEES framework with respect to comprehensiveness, progress in local adaptability, and urban sustainability examination. The UEES framework consisted of 5 dimensions and 31 indicators, where the 5 dimensions of construction, economy and industry, environment and resource, municipal and cultural facilities, and development potential could ensure sustainability assessment in multiple dimensions. The interconnection with the statistical yearbook ensured the availability of the assessment data. Furthermore, the UEES framework was applied to Qingdao to demonstrate the applicability of this system, through which a series of original findings were obtained. These findings could help local planners, designers, and managers devise solutions for improving Qingdao’s urban sustainability. Overall, this study provides a methodological framework for urban environment examination for urban sustainability in China and provides a reference for people to understand urban sustainability as well as associated drivers and barriers in Qingdao, China. It should be noted that the development of the UEES framework and its application in Qingdao is to measure the extent to which urban construction and operation in 5 dimensions can promote environmental, social, economic, and cultural sustainability, whereas the UEES framework cannot directly measure the performance or changes in environmental, social, economic, and cultural sustainability. However, future studies should be conducted to assess the actual performance of environmental, social, economic, and cultural sustainability, and the drivers and barriers to their performance should be revealed to determine the solutions to associated challenges and generate lessons and experiences for other cities [63].

Author Contributions

S.R. contributed to the conceptualization, investigation, original draft preparation, and visualization; Y.L. contributed to project management, fundraising, review, and supervision; Z.P. contributed to data curation, validation, and formal analysis; and M.Y. contributed to data curation, validation, and formal analysis. X.L. participated in the revision and editing work. All authors have read and agreed to the published version of the manuscript.

Funding

This paper is supported by the Major Project of the National Social Science Fund (NSSF) of China “Theoretical and Practical Innovations for Evaluation Systems of Art Theory” (Project No. 21ZD11).

Institutional Review Board Statement

Not applicable.

Informed Consent Statement

Not applicable.

Data Availability Statement

The corresponding author was contacted for inquiries regarding the dataset used in this study.

Conflicts of Interest

The authors declare no conflicts of interest.

References

  1. He, B.J.; Wang, W.; Sharifi, A.; Liu, X. Progress, knowledge gap and future directions of urban heat mitigation and adaptation research through a bibliometric review of history and evolution. Energy Build. 2023, 287, 112976. [Google Scholar] [CrossRef]
  2. He, B.J. Cause-related injustice, process-related injustice, effect-related injustice and regional heat action planning priorities: An empirical study in Yangtze River Delta and Chengdu-Chongqing urban agglomerations. Landsc. Urban Plan. 2023, 237, 104800. [Google Scholar] [CrossRef]
  3. Gu, C. Urbanization: Processes and driving forces. Sci. China Earth Sci. 2019, 62, 1351–1360. [Google Scholar] [CrossRef]
  4. UN-Habitat Core Team. Envisaging the Future of Cities. UN-Habitat: Nairobi, Kenya, 2022. Available online: https://unhabitat.org/sites/default/files/2022/06/wcr_2022.pdf (accessed on 1 June 2022).
  5. Li, K.; Liu, X.; Zhang, H.; Ma, J.; He, B.J. Evaluating and improving the adaptability of commonly used indices for predicting outdoor thermal sensation in hot and humid residential areas of China. Dev. Built Environ. 2023, 16, 100278. [Google Scholar] [CrossRef]
  6. He, B.J.; Wang, J.; Liu, H.; Ulpiani, G. Localized synergies between heat waves and urban heat islands: Implications on human thermal comfort and urban heat management. Environ. Res. 2021, 193, 110584. [Google Scholar] [CrossRef] [PubMed]
  7. Dawes, J.H.P. SDG interlinkage networks: Analysis, robustness, sensitivities, and hierarchies. World Dev. 2022, 149, 105693. [Google Scholar] [CrossRef]
  8. Jha, A.; Kickbusch, I.; Taylor, P.; Abbasi, K. Accelerating achievement of the sustainable development goals. BMJ 2016, 352, i409. [Google Scholar] [CrossRef] [PubMed]
  9. Gou, Z.; Xie, X. Evolving green building: Triple bottom line or regenerative design? J. Clean. Prod. 2017, 153, 600–607. [Google Scholar] [CrossRef]
  10. Merino-Saum, A.; Halla, P.; Superti, V.; Boesch, A.; Binder, C.R. Indicators for urban sustainability: Key lessons from a systematic analysis of 67 measurement initiatives. Ecol. Indic. 2020, 119, 106879. [Google Scholar] [CrossRef]
  11. Breuste, J.; Niemelä, J.; Snep, R. Cities and the Environment: New Approaches for Eco-Socioeconomic Development; Springer: Cham, Switzerland, 2018. [Google Scholar]
  12. Nielsen, A.B.; Nielsen, S.N. Urban Ecology: Patterns, Processes, and Applications; Oxford University Press: Oxford, UK, 2017. [Google Scholar]
  13. Flanagan, W. Urban Sociology Images and Structure; Rawat Booksellers: Jaipur, India, 2011. [Google Scholar]
  14. Turley, A. Urban Culture: Exploring Cities and Cultures; Routledge: Boca Raton, FL, USA, 2015. [Google Scholar]
  15. Adams, R.M. The origin of cities. Sci. Am. 1960, 203, 153–172. [Google Scholar] [CrossRef]
  16. Fuller, M.; Ryan, M. An Analysis of Jane Jacobs’s the Death and Life of Great American Cities; Macat Library: Boca Raton, FL, USA, 2017. [Google Scholar]
  17. Prasad, D.; Kuru, A.; Oldfield, P.; Ding, L.; Dave, M.; Noller, C.; He, B. Delivering on the Climate Emergency: Towards a Net Zero Carbon Built Environment; Springer Nature: Berlin/Heidelberg, Germany, 2023. [Google Scholar]
  18. Malamis, S.; Katsou, E.; Inglezakis, V.J.; Kershaw, S.; Venetis, D.; Folini, S. Urban environment. In Environment and Development; Elsevier: Amsterdam, The Netherlands, 2016; pp. 287–362. [Google Scholar]
  19. Singh, N.; Poonia, T.; Siwal, S.S.; Srivastav, A.L.; Sharma, H.K.; Mittal, S.K. Challenges of water contamination in urban areas. In Current Directions in Water Scarcity Research; Elsevier: Amsterdam, The Netherlands, 2022; Volume 6, pp. 173–202. [Google Scholar]
  20. Luo, P.; Mu, Y.; Wang, S.; Zhu, W.; Mishra, B.K.; Huo, A.; Zhou, M.; Lyu, J.; Hu, M.; Duan, W.; et al. Exploring sustainable solutions for the water environment in Chinese and Southeast Asian cities. Ambio 2021, 51, 1199–1218. [Google Scholar] [CrossRef] [PubMed]
  21. Muhammad, A.B.A.T.; Md, F.K.; Wan, R.W.M.; Rozita, H.; Mohd, T.L.; Ahmad, H.H.; Sufian, A.R.; Mazrura, S. Risk of concentrations of major air pollutants on the prevalence of cardiovascular and respiratory diseases in urbanized area of Kuala Lumpur, Malaysia. Ecotoxicol. Environ. Saf. 2019, 171, 290–300. [Google Scholar]
  22. Uttpal, A.; Bhaskar, R.; Vipin, K.S.; Amit, K.S.; Kavindra, K.K.; Pooja, T.; Pradeep, K.; Vijay, T.; Jesus, S. Potential environmental and human health risks caused by antibiotic-resistant bacteria (ARB), antibiotic resistance genes (ARGs) and emerging contaminants (ECs) from municipal solid waste (MSW) landfill. Antibiotics 2021, 10, 374. [Google Scholar] [CrossRef]
  23. Haidar, N.; Mohammad, H.T.; Kowsar, P.; Maryam, K.; Towhid, B. I am sick and tired of this congestion: Perceptions of Sanandaj inhabitants on the family mental health impacts of urban traffic jam. J. Transp. Health 2019, 14, 100587. [Google Scholar]
  24. Shen, L.Y.; Ochoa, J.J.; Shah, M.N.; Zhang, X. The application of urban sustainability indicators–A comparison between various practices. Habitat Int. 2011, 35, 17–29. [Google Scholar] [CrossRef]
  25. Yu, B. Ecological effects of new-type urbanization in China. Renew. Sustain. Energy Rev. 2021, 135, 110239. [Google Scholar] [CrossRef]
  26. Xiao, R.; Huang, X.; Yu, W.; Lin, M.; Zhang, Z. Interaction relationship between built-up land expansion and demographic-social-economic urbanization in Shanghai-Hangzhou Bay metropolitan region of Eastern China. Photogram. Eng. Remote Sens. 2019, 85, 231–240. [Google Scholar] [CrossRef]
  27. Qian, J.; Peng, Y.; Luo, C.; Wu, C.; Du, Q. Urban land expansion and sustainable land use policy in Shenzhen: A case study of China’s rapid urbanization. Sustainability 2015, 8, 16. [Google Scholar] [CrossRef]
  28. National Bureau of Statistics of the People’s Republic of China. China Statistical Yearbook 2022; China Statistics Press: Beijing, China, 2023. [Google Scholar]
  29. Wang, Z.H. Compound environmental impact of urban mitigation strategies: Co-benefits, trade-offs, and unintended consequence. Sustain. Cities Soc. 2021, 75, 103284. [Google Scholar] [CrossRef]
  30. Zhou, N.; He, G.; Williams, C. China’s Development of Low-Carbon Eco-Cities and Associated Indicator Systems (No. LBNL-5873E); Lawrence Berkeley National Lab: Berkeley, CA, USA, 2012. [Google Scholar]
  31. China Urban Research Association. Report on Low-Carbon Eco-City Development of China; China Construction Industry Press: Beijing, China, 2019. [Google Scholar]
  32. General Office of the Central Committee of the Communist Party of China; The General Office of the State Council. Opinions on Promoting Green Development in Urban and Rural Construction. Small Town Constr. 2021, 39, 116–118. [Google Scholar]
  33. Li, G. An Interpretation of the 14th Five-Year Plan for the Development of Public Cultural Service System. Libr. Trib. 2021, 41, 1–6. [Google Scholar]
  34. Kaur, H.; Garg, P. Urban sustainability assessment tools: A review. J. Clean. Prod. 2019, 210, 146–158. [Google Scholar] [CrossRef]
  35. Hiremath, R.B.; Balachandra, P.; Kumar, B.; Bansode, S.S.; Murali, J. Indicator-based urban sustainability—A review. Energy Sustain. Dev. 2013, 17, 555–563. [Google Scholar] [CrossRef]
  36. Huang, L.; Wu, J.; Yan, L. Defining and measuring urban sustainability: A review of indicators. Landsc. Ecol. 2015, 30, 1175–1193. [Google Scholar] [CrossRef]
  37. He, B.J.; Zhao, D.X.; Zhu, J.; Darko, A.; Gou, Z.H. Promoting and implementing urban sustainability in China: An integration of sustainable initiatives at different urban scales. Habitat Int. 2018, 82, 83–93. [Google Scholar] [CrossRef]
  38. Sharifi, A.; Murayama, A. A critical review of seven selected neighborhood sustainability assessment tools. Environ. Impact Assess. Rev. 2013, 38, 73–87. [Google Scholar] [CrossRef]
  39. ISO 37120: 2018; Technical Committee ISO/TC 268. Sustainable Cities and Communities: Indicators for City Services and Quality of Life. International Organization for Standardization: Geneva, Switzerland, 2018.
  40. Vakili-Ardebili, A.; Boussabaine, A.H. Application of fuzzy techniques to develop an assessment framework for building design eco-drivers. Build. Environ. 2007, 42, 3785–3800. [Google Scholar] [CrossRef]
  41. Mensah, J. Sustainable development: Meaning, history, principles, pillars, and implications for human action: Literature review. Cogent Soc. Sci. 2019, 5, 1653531. [Google Scholar] [CrossRef]
  42. Moldan, B.; Janoušková, S.; Hák, T. How to understand and measure environmental sustainability: Indicators and targets. Ecol. Indic. 2012, 17, 4–13. [Google Scholar] [CrossRef]
  43. Esty, D.C.; Lubin, D.A. Toward a next generation of corporate sustainability metrics. In Values at Work: Sustainable Investing and ESG Reporting; Springer: Berlin/Heidelberg, Germany, 2020; pp. 97–108. [Google Scholar]
  44. Harris, N. Wastes, the environment and the international economy. Cities 1992, 9, 177–185. [Google Scholar] [CrossRef]
  45. Goodland, R. The concept of environmental sustainability. Annu. Rev. Ecol. Syst. 1995, 26, 1–24. [Google Scholar] [CrossRef]
  46. Ekins, P. Environmental sustainability: From environmental valuation to the sustainability gap. Prog. Phys. Geogr. 2011, 35, 629–651. [Google Scholar] [CrossRef]
  47. Eizenberg, E.; Jabareen, Y. Social sustainability: A new conceptual framework. Sustainability 2017, 9, 68. [Google Scholar] [CrossRef]
  48. Gupta, J.; Vegelin, C. Sustainable development goals and inclusive development. Int. Environ. Agreem. Politics Law Econ. 2016, 16, 433–448. [Google Scholar] [CrossRef]
  49. Temple, M. Studying the Built Environment; Palgrave Macmillan: Berlin, Germany, 2004. [Google Scholar]
  50. Folke, C.; Biggs, R.; Norström, A.V.; Reyers, B.; Rockström, J. Social-ecological resilience and biosphere-based sustainability science. Ecol. Soc. 2016, 21, 41. [Google Scholar] [CrossRef]
  51. Long, X.; Ji, X. Economic growth quality, environmental sustainability, and social welfare in China-provincial assessment based on genuine progress indicator (GPI). Ecol. Econ. 2019, 159, 157–176. [Google Scholar] [CrossRef]
  52. Spangenberg, J.H. Economic sustainability of the economy: Concepts and indicators. Int. J. Sustain. Dev. 2005, 8, 47–64. [Google Scholar] [CrossRef]
  53. Hussin, J.M.; Rahman, I.A.; Memon, A.H. The way forward in sustainable construction: Issues and challenges. Int. J. Adv. Appl. Sci. 2013, 2, 15–24. [Google Scholar] [CrossRef]
  54. Du Plessis, C. A strategic framework for sustainable construction in developing countries. Constr. Manag. Econ. 2007, 25, 67–76. [Google Scholar] [CrossRef]
  55. Soini, K.; Birkeland, I. Exploring the scientific discourse on cultural sustainability. Geoforum 2014, 51, 213–223. [Google Scholar] [CrossRef]
  56. Axelsson, R.; Angelstam, P.; Degerman, E.; Teitelbaum, S.; Andersson, K.; Elbakidze, M.; Drotz, M.K. Social and cultural sustainability: Criteria, indicators, verifier variables for measurement and maps for visualization to support planning. Ambio 2013, 42, 215–228. [Google Scholar] [CrossRef] [PubMed]
  57. Florida, R.; Mellander, C. Technology, talent and economic segregation in cities. Appl. Geogr. 2020, 116, 102167. [Google Scholar] [CrossRef]
  58. Leikuma-Rimicane, L.; Komarova, V.; Lonska, J.; Selivanova-Fyodorova, N.; Ostrovska, I. The role of talent in the economic development of countries in the modern world. Entrep. Sustain. Issues 2021, 9, 488. [Google Scholar] [CrossRef] [PubMed]
  59. Hu, Y.; Zhang, Y.W.; Xia, X.Y.; Li, Q.L.; Ji, Y.X.; Wang, R.H.; Li, Y.B.; Zhang, Y. Research on the evaluation of the livability of outdoor space in old residential areas based on the AHP and fuzzy comprehensive evaluation: A case study of Suzhou city, China. J. Asian Archit. Build. Eng. 2023, 1–18. [Google Scholar] [CrossRef]
  60. Ran, L.; Tan, X.D.; Xu, Y.; Zhang, K.Y.; Chen, X.Y.; Zhang, Y.T.; Li, M.Y.; Zhang, Y.P. The application of subjective and objective method in the evaluation of healthy cities: A case study in Central China. Sustain. Cities Soc. 2021, 65, 102581. [Google Scholar] [CrossRef]
  61. Perera, E.N.C.; Jayawardana, D.T.; Jayasinghe, P.; Ranagalage, M. Landslide vulnerability assessment based on entropy method: A case study from Kegalle district, Sri Lanka. Model. Earth Syst. Environ. 2019, 5, 1635–1649. [Google Scholar] [CrossRef]
  62. Zhao, M.; Ren, R.; Li, G. Method Based on Fuzzy Entropy-Entropy Weight for Hybird Multi-attribute Decision Making. Oper. Res. Manag. Sci. 2013, 22, 78. [Google Scholar]
  63. Wu, X.; Ramesh, M.; Howlett, M. Policy capacity: A conceptual framework for understanding policy competences and capabilities. Policy Soc. 2015, 34, 165–171. [Google Scholar] [CrossRef]
Figure 1. The identification process of the five assessment dimensions of the Urban Environmental Examination System.
Sustainability 16 03065 g001
Figure 2. The location of Qingdao and its districts.
Sustainability 16 03065 g002
Figure 3. Urban sustainability scores of Qingdao and its ten districts.
Sustainability 16 03065 g003
Figure 4. Sustainability score of the dimension D1 of Qingdao and its ten districts.
Sustainability 16 03065 g004
Figure 5. Sustainability scores of different indicators in the dimension D1.
Sustainability 16 03065 g005
Figure 6. Sustainability score of the dimension D2 of Qingdao and its ten districts.
Sustainability 16 03065 g006
Figure 7. Sustainability scores of different indicators in dimension D2.
Sustainability 16 03065 g007
Figure 8. Sustainability score of the dimension D3 of Qingdao and its ten districts.
Sustainability 16 03065 g008
Figure 9. Sustainability scores of different indicators in the dimension D3.
Sustainability 16 03065 g009
Figure 10. Sustainability score of the dimension D4 of Qingdao and its ten districts.
Sustainability 16 03065 g010
Figure 11. Sustainability scores of different indicators in the dimension D4.
Sustainability 16 03065 g011
Figure 12. Sustainability score of the dimension D5 of Qingdao and its ten districts.
Sustainability 16 03065 g012
Figure 13. Sustainability scores of different indicators in the dimension D5.
Sustainability 16 03065 g013
Figure 14. Indicators with the highest sustainability scores (no less than 1.5) across five dimensions in Qingdao.
Sustainability 16 03065 g014
Figure 15. Indicators gaining low sustainability scores (<1.5) across five dimensions in Qingdao.
Sustainability 16 03065 g015
Table 1. Assessment dimensions and indicators for the urban environment examination system.
DimensionsClarification on IndicatorsIndicators
Construction
(D1)
C 1 = b u i l t u p   a r e a s k m 2 t o t a l   d i s t r i c t   a r e a s k m 2
Development intensity of built-up areas
C 2 = N u m b e r   o f   p e r m a n e n t   r e s i d e n t s   i n   t h e   b u i l t u p   a r e a ( 10,000   p e o p l e ) L a n d   a r e a   o f   t h e   b u i l t u p   a r e a ( k m 2 )
Population density of built-up areas
C 3 = T o t a l   l e n g t h   o f   r o a d s   w i t h i n   d i s t r i c t k m b u i l t u p   a r e a k m 2
Density of road networks
C 4 = R e n o v a t i o n   a r e a   o f   o l d   r e s i d e n t i a l   a r e a s   w i t h i n   t h e   d i s t r i c t   i n   t h a t   y e a r ( m 2 ) N u m b e r   o f   p e r m a n e n t   r e s i d e n t s   i n   t h e   d i s t r i c t ( 10,000   p e o p l e )
Retrofitted areas of old residential communities
C 5 = N e w   c o m p l e t e d   c o m m e r c i a l   h o u s i n g   a r e a ( m 2 ) N e w   p e r m a n e n t   p o p u l a t i o n × M i n i m u m   h o u s i n g   a r e a   p e r   c a p i t a ( m 2 )
The ratio of the increasing areas of new residential building to the increasing population
C 6 = L a n d   a r e a   c o v e r e d   b y   f i r e   s t a t i o n ( k m 2 ) B u i l t u p   a r e a s ( k m 2 )
Fire station coverage rate
Economy and Industry (D2)C7Local gross domestic product (GDP) growth rate
C 8 = G r o s s   r e g i o n a l   p r o d u c t ( 10,000   R M B ) P e r m a n e n t   p o p u l a t i o n   w i t h i n   d i s t r i c t
Local GDP per capita
C 9 = O u t p u t   v a l u e   o f   t e r t i a r y   i n d u s t r y 10,000   R M B G r o s s   r e g i o n a l   p r o d u c t 10,000   R M B
Percentage of tertiary sector 1
C 10 = H i g h t e c h   i n d u s t r y   o u t p u t   v a l u e ( 10,000   R M B ) I n d u s t r i a l   o u t p u t   v a l u e   a b o v e   d e s i g n a t e d   s i z e ( 10,000   R M B )
Size of high-tech industries
C 11 = N e w   f i x e d   a s s e t   i n v e s t m e n t ( 10,000   R M B ) T o t a l   f i x e d   a s s e t   i n v e s t m e n t   i n   t h e   p r e v i o u s   y e a r ( 10,000   R M B )
Growth rate of fixed assets investment
C 12 = E l e c t r i c i t y   c o n s u m p t i o n   o f   t h e   w h o l e   s o c i e t y   i n   t h e   r e g i o n k W h G r o s s   r e g i o n a l   p r o d u c t 10,000   R M B
Electricity consumption per unit of GDP
Environment and Resource (D3)C13Average regional ambient noise 2
C 14 = N u m b e r   o f   d a y s   w i t h   e x c e l l e n t   a m b i e n t   a i r   q u a l i t y   t h r o u g h o u t   t h e   y e a r 365
Good air quality rate
C 15 = G r e e n i n g   a r e a   o f   b u i l t u p   a r e a s   w i t h i n   d i s t r i c t B u i l t u p   a r e a s   w i t h i n   t h e   d i s t r i c t
Greening coverage in built-up areas
C 16 = T h e   a r e a   o f   c u l t i v a t e d   l a n d   w i t h i n   t h e   d i s t r i c t L a n d   a r e a s   o f   t h e   d i s t r i c t
Percentage of cultivated land area
C 17 = E n e r g y   s a v i n g   a n d   e n v i r o n m e n t a l   p r o t e c t i o n   e x p e n d i t u r e   a m o u n t ( 10,000   R M B ) T o t a l   f i n a n c i a l   e x p e n d i t u r e ( 10,000   R M B )
Percentage of fiscal expenditure on energy conservation and environmental protection
C 18 = U t i l i z a t i o n   o f   u r b a n   s e w a g e   r e c y c l e d   w a t e r ( m 3 ) T o t a l   s e w a g e   t r e a t m e n t   v o l u m e ( m 3 )
Recycled water utilization rate
Municipal and Cultural Facilities (D4)
C 19 = N u m b e r   o f   b e d s   i n   e l d e r l y   s o c i a l   w e l f a r e   i n s t i t u t i o n s   w i t h i n   t h e   d i s t r i c t P e r m a n e n t   p o p u l a t i o n   w i t h i n   t h e   d i s t r i c t ( 10,000   p e o p l e )
Number of social welfare facilities per 10,000 people
C 20 = N u m b e r   o f   l i b r a r i e s   w i t h i n   t h e   d i s t r i c t P e r m a n e n t   p o p u l a t i o n   w i t h i n   t h e   d i s t r i c t 10,000   p e o p l e
Number of libraries per 10,000 people
C 21 = N u m b e r   o f   k i n d e r g a r t e n s   i n   t h e   d i s t r i c t P e r m a n e n t   p o p u l a t i o n   w i t h i n   t h e   d i s t r i c t 10,000   p e o p l e
Number of kindergartens per 10,000 people
C 22 = N u m b e r   o f   c o n v e n i e n t   s e r v i c e   f a c i l i t i e s   i n   t h e   d i s t r i c t P e r m a n e n t   p o p u l a t i o n   w i t h i n   t h e   d i s t r i c t 10,000   p e o p l e
Number of convenient service facilities 10,000 people 3
C 23 = N u m b e r   o f   e n e r g y   f a c i l i t i e s ( c h a r g i n g   s t a t i o n s   a n d   b a t t e r y   s w a p p i n g   s t a t i o n s ) B u i l t u p   a r e a s   w i t h i n   t h e   d i s t r i c t ( k m 2 )
Density of low-carbon energy facilities in built-up areas
C 24 = N u m b e r   o f   r e s i d e n t i a l   c o m m u n i t i e s   w i t h   p r o p e r t y   m a n a g e m e n t   c o m p a n i e s T o t a l   n u m b e r   o f   r e s i d e n t i a l   a r e a s ( m 2 )
Percentage of residential communities under professional property management
Development Potential (D5)
C 25 = T o t a l   m a l e   p o p u l a t i o n   i n   t h e   d i s t r i c t T o t a l   f e m a l e   p o p u l a t i o n   i n   t h e   d i s t r i c t
Gender ratio of the population
C 26 = N u m b e r   o f   e l d e r l y   p e o p l e   a g e d 60 a n d   a b o v e   i n   t h e   d i s t r i c t T o t a l   r e s i d e n t   p o p u l a t i o n   i n   t h e   d i s t r i c t 10,000   p e o p l e
Degree of aging
C 27 = N u m b e r   o f   p e o p l e   w i t h   h i g h e r   e d u c a t i o n   i n   t h e   d i s t r i c t T o t a l   r e s i d e n t   p o p u l a t i o n   i n   t h e   d i s t r i c t 10,000   p e o p l e
Proportion of population with tertiary education (or higher education)
C 28 = N u m b e r   o f   p r i m a r y   s c h o o l   s t u d e n t s   i n   s c h o o l T o t a l   r e s i d e n t   p o p u l a t i o n   i n   t h e   d i s t r i c t 10,000   p e o p l e
Elementary school students as a percentage of the resident population
C 29 = S c i e n c e   a n d   t e c h n o l o g y   e x p e n d i t u r e   a m o u n t T o t a l   a m o u n t   o f   f i n a n c i a l   e x p e n d i t u r e
Share of fiscal expenditure on science and technology
C 30 = N u m b e r   o f   h i g h t e c h   e n t e r p r i s e s   i n   t h e   d i s t r i c t T o t a l   r e s i d e n t   p o p u l a t i o n   i n   t h e   d i s t r i c t ( 10,000   p e o p l e )
Number of high-tech enterprises per 10,000 people 4
C 31 = T o t a l   a r e a   o f   c u l t u r a l   b u i l d i n g s   i n   t h e   d i s t r i c t ( m 2 ) T o t a l   r e s i d e n t   p o p u l a t i o n   i n   t h e   d i s t r i c t ( 10,000   p e o p l e )
Cultural building areas per 10,000 people 5
Note: 1 The primary industry refers to agriculture, forestry, animal husbandry, and fishery. Secondary industries include mining, manufacturing, electricity, heat, gas, and construction. Tertiary industry refers to industries other than primary and secondary industries. 2 Regional ambient noise means district-level ambient noise. 3 Convenient service facilities consist of daily life service facilities (e.g., convenience stores, supermarkets, and wet markets) and leisure and entertainment facilities (e.g., parks, squares, cultural activity centers, and gyms). 4 High-tech enterprise means the one continuously carries out research and development and transformation of technological achievements. 5 A cultural building is designed and built to provide a space for the education of talents, interests, and moral qualities among the general public, promoting the all-round development of human beings.
Table 2. Key information of Qingdao and its districts in 2022.
Land Area (km2)Urbanization LevelPopulation
(10,000)
Population Density
(/km2)
Qingdao11,293771034916
Cen130.011005518,333
Cen263.1810010216,155
Cen395.5100707328
Cen4389.380521336
Sub1222080190856
Sub2553.2801172114
Sub3172758120695
Out1121068103851
Out2316653118373
Out315225872473
Table 3. Weight distribution for evaluation dimensions and indicators.
DimensionsWeight for DimensionsIndicatorsWeight for Indicators
Construction
(D1)
0.2125C10.0232
C20.0196
C30.0119
C40.0544
C50.0541
C60.0491
Economy and Industry
(D2)
0.2153C70.0324
C80.0480
C90.0370
C100.0314
C110.0534
C120.0131
Environment and Resource
(D3)
0.1978C130.0359
C140.0238
C150.0153
C160.0512
C170.0268
C180.0447
Municipal and Cultural Facilities
(D4)
0.1876C190.0251
C200.0441
C210.0232
C220.0250
C230.0471
C240.0222
Development Potential
(D5)
0.1877C250.0223
C260.0320
C270.0370
C280.0158
C290.0356
C300.0206
C310.0244
Disclaimer/Publisher’s Note: The statements, opinions and data contained in all publications are solely those of the individual author(s) and contributor(s) and not of MDPI and/or the editor(s). MDPI and/or the editor(s) disclaim responsibility for any injury to people or property resulting from any ideas, methods, instructions or products referred to in the content.

