Article

Exploring the Impact of Digital Inclusive Finance on Agricultural Carbon Emissions: Evidence from the Mediation Effect of Capital Deepening

1
School of Finance, Inner Mongolia University of Finance and Economics, Hohhot 010070, China
2
School of Management, Tianjin University of Technology, Tianjin 300384, China
*
Author to whom correspondence should be addressed.
Sustainability 2024, 16(7), 3071; https://doi.org/10.3390/su16073071
Submission received: 3 March 2024 / Revised: 30 March 2024 / Accepted: 2 April 2024 / Published: 7 April 2024

Abstract

:
Carbon emissions from agriculture should not be underestimated. With the aim for carbon peaking and carbon neutralization and the help of digital inclusive finance, the effective reduction in carbon emissions in agriculture and animal husbandry production is crucial to achieving China’s carbon emission reduction goals. We used the balanced panel data of 31 provinces in China from 2011 to 2021 to study this issue. We empirically tested the impact, mechanism, and heterogeneity of digital inclusive finance on agricultural carbon emissions based on the systematic measurement of agricultural carbon emissions. The results revealed that (1) the development of digital inclusive finance has a significant inhibitory effect on agricultural carbon emissions, and it is an important path to reduce agricultural carbon emissions. (2) Through the intermediary effects’ analysis, it was found that capital deepening is an important transmission mechanism for the promotion of agricultural carbon emission reduction through digital inclusive finance. (3) Further analysis using the quantile regression model reveals that the impact of digital inclusive finance on agricultural carbon emissions is significantly negative at different quantiles. (4) Through the spatial Durbin model, digital inclusive finance has a space carbon enhancement effect. Finally, we put forward suggestions to promote the development of low-carbon agriculture by paying attention to the technical effect of digital inclusive finance, strengthening the connection and cooperation between various regions and promoting the carbon emission reduction role of capital deepening.

1. Introduction

Agriculture is one of the industries most severely affected by climate change and an important source of global greenhouse gas emissions. Developing low-carbon agriculture is an important strategic measure to reduce greenhouse gas emissions and adapt to climate change. According to the United Nations’ Food and Agriculture Organization reports (2022), the agricultural food system accounts for 21–37% of the total anthropogenic greenhouse gas emissions. China’s agricultural sector emits approximately 1.7 billion tons of carbon dioxide (CO2) annually, accounting for approximately 15% of all emissions. Therefore, China’s agriculture has a vast potential for energy conservation and carbon reduction. Carbon emissions from crop production and methane emissions from livestock farming are the primary sources of agricultural greenhouse gas emissions. Agriculture and animal husbandry play an important role in achieving carbon peaking and carbon neutrality. As one of the key industries for carbon reduction, although it is under severe resource and environmental constraints, agriculture must gradually shift toward high-quality, green, and low-carbon development to better assist rural revitalization. To achieve the dual carbon targets proposed by the Chinese government and the modernization of harmonious coexistence between humans and nature, agriculture must undergo a green technology transformation and change from high-energy consumption and low-efficiency production modes. Undoubtedly, this transformation process will consume large amounts of capital. The lack of funds is a major obstacle to the smooth progress of agricultural carbon reduction. Therefore, reducing agricultural carbon emissions will depend not only on economic growth, industrial structure adjustment, and government intervention but also on the effective development of financial markets, especially digital inclusive finance based on financial technology.
Digital inclusive finance relies on digital technology to provide more efficient financial products and services for rural populations, microenterprises, and other entities. Digital inclusive finance has expanded the coverage of traditional finance, making financial services more geographically penetrating and effectively filling the investment gap in agricultural carbon reduction. It has a good promoting effect on agricultural and rural modernization [1]. Digital inclusive finance also contributes to the reduction in carbon emissions by promoting green technology and upgrading industrial structures [2,3]. However, while some studies have pointed out that digital inclusive finance has led to an increase in social consumption and investment, resulting in more energy consumption and carbon emissions [4,5], others have found that there is no significant correlation between the two variables [6]. Therefore, as the most important resource-productive factor in agricultural development, can digital inclusive finance help to reduce agricultural carbon emissions? If this effect exists, what is the impact of the degree? What is the mechanism of action? Is there a spatial spillover effect? In addition, will differences in geographical locations and agricultural endowment conditions lead to heterogeneity in carbon emission reduction effects? These issues still require scientific discussion.
Based on the above questions, this study selects the balanced panel data of 31 provinces in China from 2011 to 2021 and empirically tests the impact of digital inclusive finance on agricultural carbon emissions and the transmission role of capital deepening in this relationship after theoretical analysis. We hope to provide new evidence for the relationship between digital inclusive finance and low-carbon agriculture transformation.

2. Literature Review

2.1. Financial Development and Carbon Emissions

Previous studies have paid sufficient attention to the impact of traditional financial development on carbon emissions. Currently, three views have generally been proposed in the literature. (1) Promoting effect. Financial development can improve the availability of financing and consumer credit, promoting production and consumption, which can lead to the growth of carbon emissions [7]. For example, building new production lines and purchasing large equipment, cars, household appliances, and other products will increase carbon emissions [8,9]. Moreover, financial development expands the production scale by accelerating economic growth and promoting investment, especially in polluting industries, which exacerbates energy consumption and leads to an increase in carbon emissions [10,11]. (2) Inhibitory effect. Financial development can provide financial support for green technology and clean environmental protection technology innovation in enterprises, which assists in the development of carbon reduction [12,13,14]. Financial development can also effectively reduce carbon emissions through industrial structure upgrading, changes in production factor inputs, carbon trading activities, and large-scale operations [15,16,17]. (3) Other effects. The impact of financial development on carbon emissions has different characteristics under different channels of action. Matar et al. found that financial development promotes and suppresses carbon emissions in the short and long term, respectively [18]. Yan et al. and Li et al. believe that the development of traditional finance has a converse-U nonlinear relationship with carbon emissions [19,20]. In addition, a few scholars believe that the inherent impact of traditional financial development on carbon emissions is positively and negatively offset [21].

2.2. Digital Inclusive Finance and Carbon Emissions

Digital inclusive finance results from the progress and development of traditional finance. Some scholars believe that digital inclusive finance enhances the availability of financing, thereby promoting technological progress and upgrading. They concluded that digital inclusive finance has a carbon reduction effect [22,23,24], which has a significant impact on primary, secondary, and tertiary industries [25,26]. Digital inclusive finance itself also has green attributes, such as online lending, digital payments, and paperless transactions, which indirectly prove its carbon reduction effect [27]. In addition to the above research results, some scholars have also proved that the carbon reduction effect of digital inclusive finance has an “inverted V-shaped” trend of first increasing and then decreasing [28].

2.3. Digital Financial Inclusion and Agricultural Carbon Emissions

However, there is relatively little research on the impact of digital inclusive finance on agricultural carbon emissions. On the one hand, the development of digital inclusive finance reduces the intensity of agricultural carbon emissions through two channels—farmers’ entrepreneurship effect and rural technological progress. On the other hand, digital inclusive finance promotes the growth of rural capital and increases the purchase of agricultural equipment and rural energy consumption. For example, a significant increase in electricity consumption has led to an increase in carbon emissions [29]. Agricultural equipment can better replace manual operations in agricultural production, accelerating the transformation of agricultural production methods. However, an increase in machinery and equipment leads to a further increase in agricultural carbon emissions [30].

2.4. Literature Summary

A few scholars have explored the impact of digital inclusive finance on agricultural carbon emissions, providing a good reference and guidance for this study. However, there are still some shortcomings. This article intends to expand on the following aspects: (1) A few articles have directly conducted a systematic analysis of the impact of digital inclusive finance on agricultural carbon emissions but do not involve research from the perspective of capital deepening. (2) There are certain differences in the specific calculation methods for agricultural carbon emissions in existing articles. The energy types selected from the perspective of various carbon sources mainly focus on six categories—fertilizers, pesticides, agricultural films, diesel, tillage, and irrigation—with few involving carbon emissions from animal husbandry, rice cultivation, and soil emissions. (3) In terms of heterogeneity analysis, most scholars only focused on the first level of heterogeneity analysis of digital inclusive finance, which includes the depth of use, breadth of coverage, and degree of digitization. There is little involvement in the second level of heterogeneity analysis of the mobile payment index, digital insurance index, monetary fund index, internet investment index, and internet credit index. (4) In terms of models, only a few articles have used quantile regression models to study the impact of digital inclusive finance on agricultural carbon emissions at different quantiles.

3. Theoretical Mechanism

As a resource-saving and environmentally friendly innovative financial service, digital inclusive finance has a strong green attribute [31]. In theory, digital inclusive finance can affect agricultural carbon emissions through technological, scale, and driving effects. First, regarding the technological effect, using technologies such as the internet, cloud computing, big data, and convenient financial loans, digital inclusive finance promotes new technologies, varieties, and concepts in agricultural production, such as optimizing agricultural production processes, improving management processes, improving environmental quality, promoting industrial structure upgrading, and improving agricultural production efficiency. These methods can reduce agricultural energy consumption and pollution emissions and can have technological innovation effects on current agricultural and animal husbandry production [32]. Moreover, digital inclusive finance relies on new technologies to analyze and explore the market demand for agricultural products and consumer demand preferences. For example, smart agriculture projects rely on wireless networks and other technologies to monitor, intelligently warn, and provide expert guidance for farmland and livestock pens. Further, it reduces the carbon emissions generated by manual flow. In addition, it innovates and optimizes agricultural production technology, resulting in carbon emission reduction effects. The study by Wei et al. strongly demonstrated that the development of digital inclusive finance can have a positive technological innovation effect on rural areas, especially areas with strong financial constraints [33].
Second, regarding the scale effect, digital inclusive finance belongs to financial services. According to the theory of endogenous growth, financial development promotes economic growth. Digital inclusive finance provides funds for small- and medium-sized enterprises and improves the availability of agricultural and animal husbandry capital. This can help to expand agricultural production. To achieve greater output, a growing number of agricultural resources and energy are used as input. More resource consumption increases the total output of agriculture, and animal husbandry increases with agricultural carbon emissions. Based on digital inclusive finance, Sun et al. claimed that, compared with the scale effect, the technology effect is the main factor that affects carbon emissions [34].
Third, regarding the driving effect, relying on the numerous environmental protection service platforms built by digital inclusive finance enhances rural residents’ environmental awareness, guides rural residents’ green consumption, drives the development of green industries, and promotes the transformation and upgrading of the rural economy to green [35]. Farmers can understand the concept of environmental protection and learn green finance and agricultural production technology knowledge through network virtualization technology. It also encourages farmers to conduct online environmental pollution complaints and other activities, which contributes to reducing agricultural carbon emissions. Thus, we propose the following hypothesis:
Hypothesis 1 (H1). 
The development of digital inclusive finance has a carbon reduction effect on agriculture.
We now analyze the impact of digital inclusive finance on deepening agricultural capital. Digital inclusive finance can reduce the financing constraints of enterprises and farmers, which is conducive to improving capital accessibility. An increase in capital factors helps enterprises to develop, increasing employment opportunities. Digital inclusive finance also provides financing and credit support to improve the employment ability of farmers to a greater extent. This further facilitates the nonagricultural transfer of rural labor and increases the ratio of capital to labor. Digital inclusive finance can reduce transaction costs for farmers by reducing information asymmetry, increasing financial literacy to encourage large-scale agricultural operations, and promoting the securitization of agricultural land assets. This will generate a demand for socialized agricultural machinery services in rural areas, thereby promoting the development of agricultural mechanization. In short, the development of digital inclusive finance leads to an increase in the availability of agricultural production capital, which promotes the deepening of agricultural capital by increasing the ratio of capital to labor and the mechanization level [36]. The impact of capital deepening on agricultural carbon emissions is mainly achieved through the promotion of technological progress and the alleviation of factor distortions.
In the process of deepening agricultural capital, an increase in nonagricultural income will stimulate agricultural producers to purchase advanced tools and machinery to invest in agricultural production. Capital deepening promotes the development of the agricultural sector toward new technological fields [37], strengthening the effectiveness of digital inclusive financial technology. Moreover, sustained high investment alleviates the long-standing problem of funding shortage and element distortion in rural areas. An increase in the capital utilization rate caused by capital deepening further effectively reduces agricultural carbon emissions. In addition, capital deepening leads to an increase in the proportion of capital replacing manpower, thereby reducing the carbon emissions caused by human activities in agricultural production. Based on the above analysis, we propose the following hypothesis:
Hypothesis 2 (H2). 
Digital inclusive finance has an indirect emission reduction impact on agricultural carbon emissions through capital deepening.
Most of the studies on agricultural carbon emissions were conducted in a single region. However, there are inseparable connections between different provinces, whether in the development of digital inclusive finance or the impact of agricultural carbon emissions. Taking agricultural carbon emissions as an example, there are spillover and agglomeration effects. It is difficult to control air pollutants such as carbon emissions, and neighboring provinces unavoidably influence each other through various channels. For instance, if the neighboring provinces of Province A have higher carbon emissions than it, the spatial spillover effect of carbon emissions will increase carbon emissions in Province A. Thus, the spillover effect will cause high carbon emission areas to appear in clusters, implying an agglomeration effect [38]. Further, to achieve rapid economic development, there may be a bottom-up effect on the environmental regulations of each province. Thus, every province pursues current economic benefits at the cost of sacrificing the environment. Provinces engage in comparative games of economic benefits, ultimately leading to environmental degradation and an increase in carbon emissions [39]. There is also the siphon effect. The development of each region mainly relies on gathering production factors from surrounding areas. Each province attracts capital, labor, and other resources from surrounding areas, thereby promoting the development of production. If a region develops more prosperously than its surrounding areas, it will further attract the inflow of surrounding factors, such as talent, technology, healthcare, and education. Taking Province A as an example, while the development of digital inclusive finance in surrounding areas is better than in A, it will attract the production factors of A, slowing down A’s development speed of science and technology. Here, the siphon effect hinders the technological progress of A, causing an increase in carbon emissions [40]. Based on the above theories, the following hypothesis is proposed:
Hypothesis 3 (H3). 
Digital inclusive finance has an increasing spatial carbon effect on agricultural carbon emissions.

4. Methodology and Data

4.1. Methodology

4.1.1. Benchmark Regression Model

This paper draws on the econometric model of Chao et al. and uses a fixed-effects model as the benchmark regression [41]. The benchmark regression model is as follows:
c p z i t = η 0 + η 1 i n d e x i t + η 2 X i t + μ i + ν i + ε i t
Here, c p z i t represents agricultural carbon emissions; i n d e x i t represents the digital inclusive finance index; and X i t represents different control variables. The province fixed effect, year fixed effect, and error terms are represented by μ i , ν i , and ε i t , respectively.

4.1.2. Mediation Effect Model

To explore the mediating effects of capital deepening, drawing on the econometric model of Wen et al., we set the following model [42]:
c p z i t = c i n d e x i t + e 1
k i t = a i n d e x i t + e 2
c p z i t = c i n d e x i t + b k i t + e 3
Here, k i t represents the mediating variable, and e 1 e 3 represents the residual term.

4.1.3. Quantile Regression Model

Based on the quantile regression model of Machado et al., we further analyze the impact of digital inclusive finance on agricultural carbon emissions at different quantiles [43]. Consider the following quantile regression model:
Q τ ( l n c p z ) = α + β i n d e x i t + δ X i t + z i + ξ i t
In the equation, τ represents the quantile, and three quantiles of 30%, 60%, and 90% are selected.

4.1.4. Spatial Durbin Model

Before using the spatial econometric model established by Anselin L, we first used the Moran index to investigate the spatial dependence of agricultural carbon emissions in 31 provinces from 2011 to 2021 [44]. The formula is as follows:
I = i = 1 n j = 1 n W i j ( x i x ¯ ) ( x j x ¯ ) S 2 i = 1 n j = 1 n W i j
Here, S 2 represents the variance of the data sample; W i j represents the spatial weight matrix; and i = 1 n j = 1 n W i j represents the sum of all spatial weights. If the variable passes the Moran test, the spatial Durbin model is used as follows:
c p z i t = ρ 0 W i j c p z i t + ρ 1 i n d e x i t + ρ 2 X i t + μ i + ν i + ε i t
This study uses a spatial adjacency matrix. ρ 0 is the spatial autoregressive coefficient, which represents the impact of adjacent regional digital inclusive finance indices on agricultural carbon emissions in a region. ρ 1 represents the coefficient of digital inclusive finance, and ρ 2 represents the coefficient of the control variable.

4.2. Variables

4.2.1. Dependent Variable

Referring to the study by Tian et al., the total agricultural carbon emissions of each province were derived from four aspects [45]. First, carbon emissions are caused by inputs of agricultural production materials and human activities, including six types—fertilizers, pesticides, agricultural film, agricultural diesel, agricultural tillage, and irrigation activities, and their carbon emission factors are 0.8956 kg/kg, 4.9341 kg/kg, 5.1800 kg/kg, 0.5927 kg/kg, 312.60 kg/km2, and 20.476 kg/hm2, respectively. Second, carbon emissions are caused by livestock and poultry breeding activities, including carbon emissions caused by animal intestinal fermentation and fecal management processes. Drawing on the study by He et al., the focus is on investigating various types of ruminants, such as cows, horses, donkeys, mules, and pigs [46]. Emission factors for intestinal fermentation and fecal management are presented in Table 1. Third, carbon emissions are caused by soil N2O emissions. Here, six main crops—rice, winter wheat, spring wheat, corn, soybeans, and vegetables—were selected, and their N2O emission coefficients were 0.24 kg/ha, 2.05 kg/ha, 0.40 kg/ha, 2.532 kg/ha, 0.77 kg/ha, and 4.21 kg/ha, respectively. Finally, carbon emissions are caused by rice cultivation. The CH4 emission coefficients of each province are presented in Table 2 [47].
Based on the above discussion, the calculation formula for agricultural carbon emissions is constructed as follows:
c p z = T i × δ i
In the formula, c p z represents the total amount of agricultural carbon emissions; T i represents the number of various carbon sources; and δ i represents the emission factors of various carbon sources.

4.2.2. Independent Variable

This article uses the provincial digital inclusive finance index of Peking University from 2011 to 2021 as the core explanatory variable, which comprehensively considers various aspects such as digitization degree, depth, and breadth, and comprehensively characterizes the development level of digital inclusive finance in China.

4.2.3. Mediating Variable

Taking capital deepening ( k i t ) as an intermediate mechanism variable, we use the capital–labor ratio to represent the degree of capital deepening. Referring to studies such as Xu et al., the annual capital stock is calculated using the constant price perpetual inventory method [48]:
K i t = K i t 1 + I i t D i t
Here, K i t represents the current primary industry capital stock of each region; K i t 1 represents the previous primary industry capital stock of each region; I i t represents the current fixed capital investment amount, which is represented in this article by the fixed capital investment amount in the primary industry; and D i t is capital depreciation. Referring to the study by Li et al., the capital depreciation rate is set at 5.42% [49]. The agricultural capital stock in the base year is represented by the fixed capital investment in the primary industry at 2011 constant prices. The capital–labor ratio ( k l ) can be expressed as follows:
k l i t = K i t / p o p
Here, p o p represents the number of employees in the primary industry in each region.

4.2.4. Other Variables

To eliminate the adverse effects of other factors on the measurement results, control variables at the primary industry and provincial levels were added to the econometric model. The primary industry-level control variables include the following six indicators: agricultural industry structure, rural education level, government intervention, mechanization level, degree of natural disasters, effective irrigation area of agriculture, and per capita agriculture–forestry–stockbreeding production. The provincial-level control variables include urbanization level, population situation, economic growth, and financial development level. The calculation method for each indicator is presented in Table 3.

4.3. Data Source

This study uses the balanced panel data of 31 provinces in China from 2011 to 2021 as the sample for analysis (excluding Hong Kong, Macao, and Taiwan). The original data are from the China Population Statistics Yearbook, the China Population and Employment Statistics Yearbook, the China Rural Statistical Yearbook, and the statistical yearbooks of provinces and cities. The index of digital inclusive finance was derived from reports of the Digital Finance Research Center of Peking University.

5. Current Situation Analysis

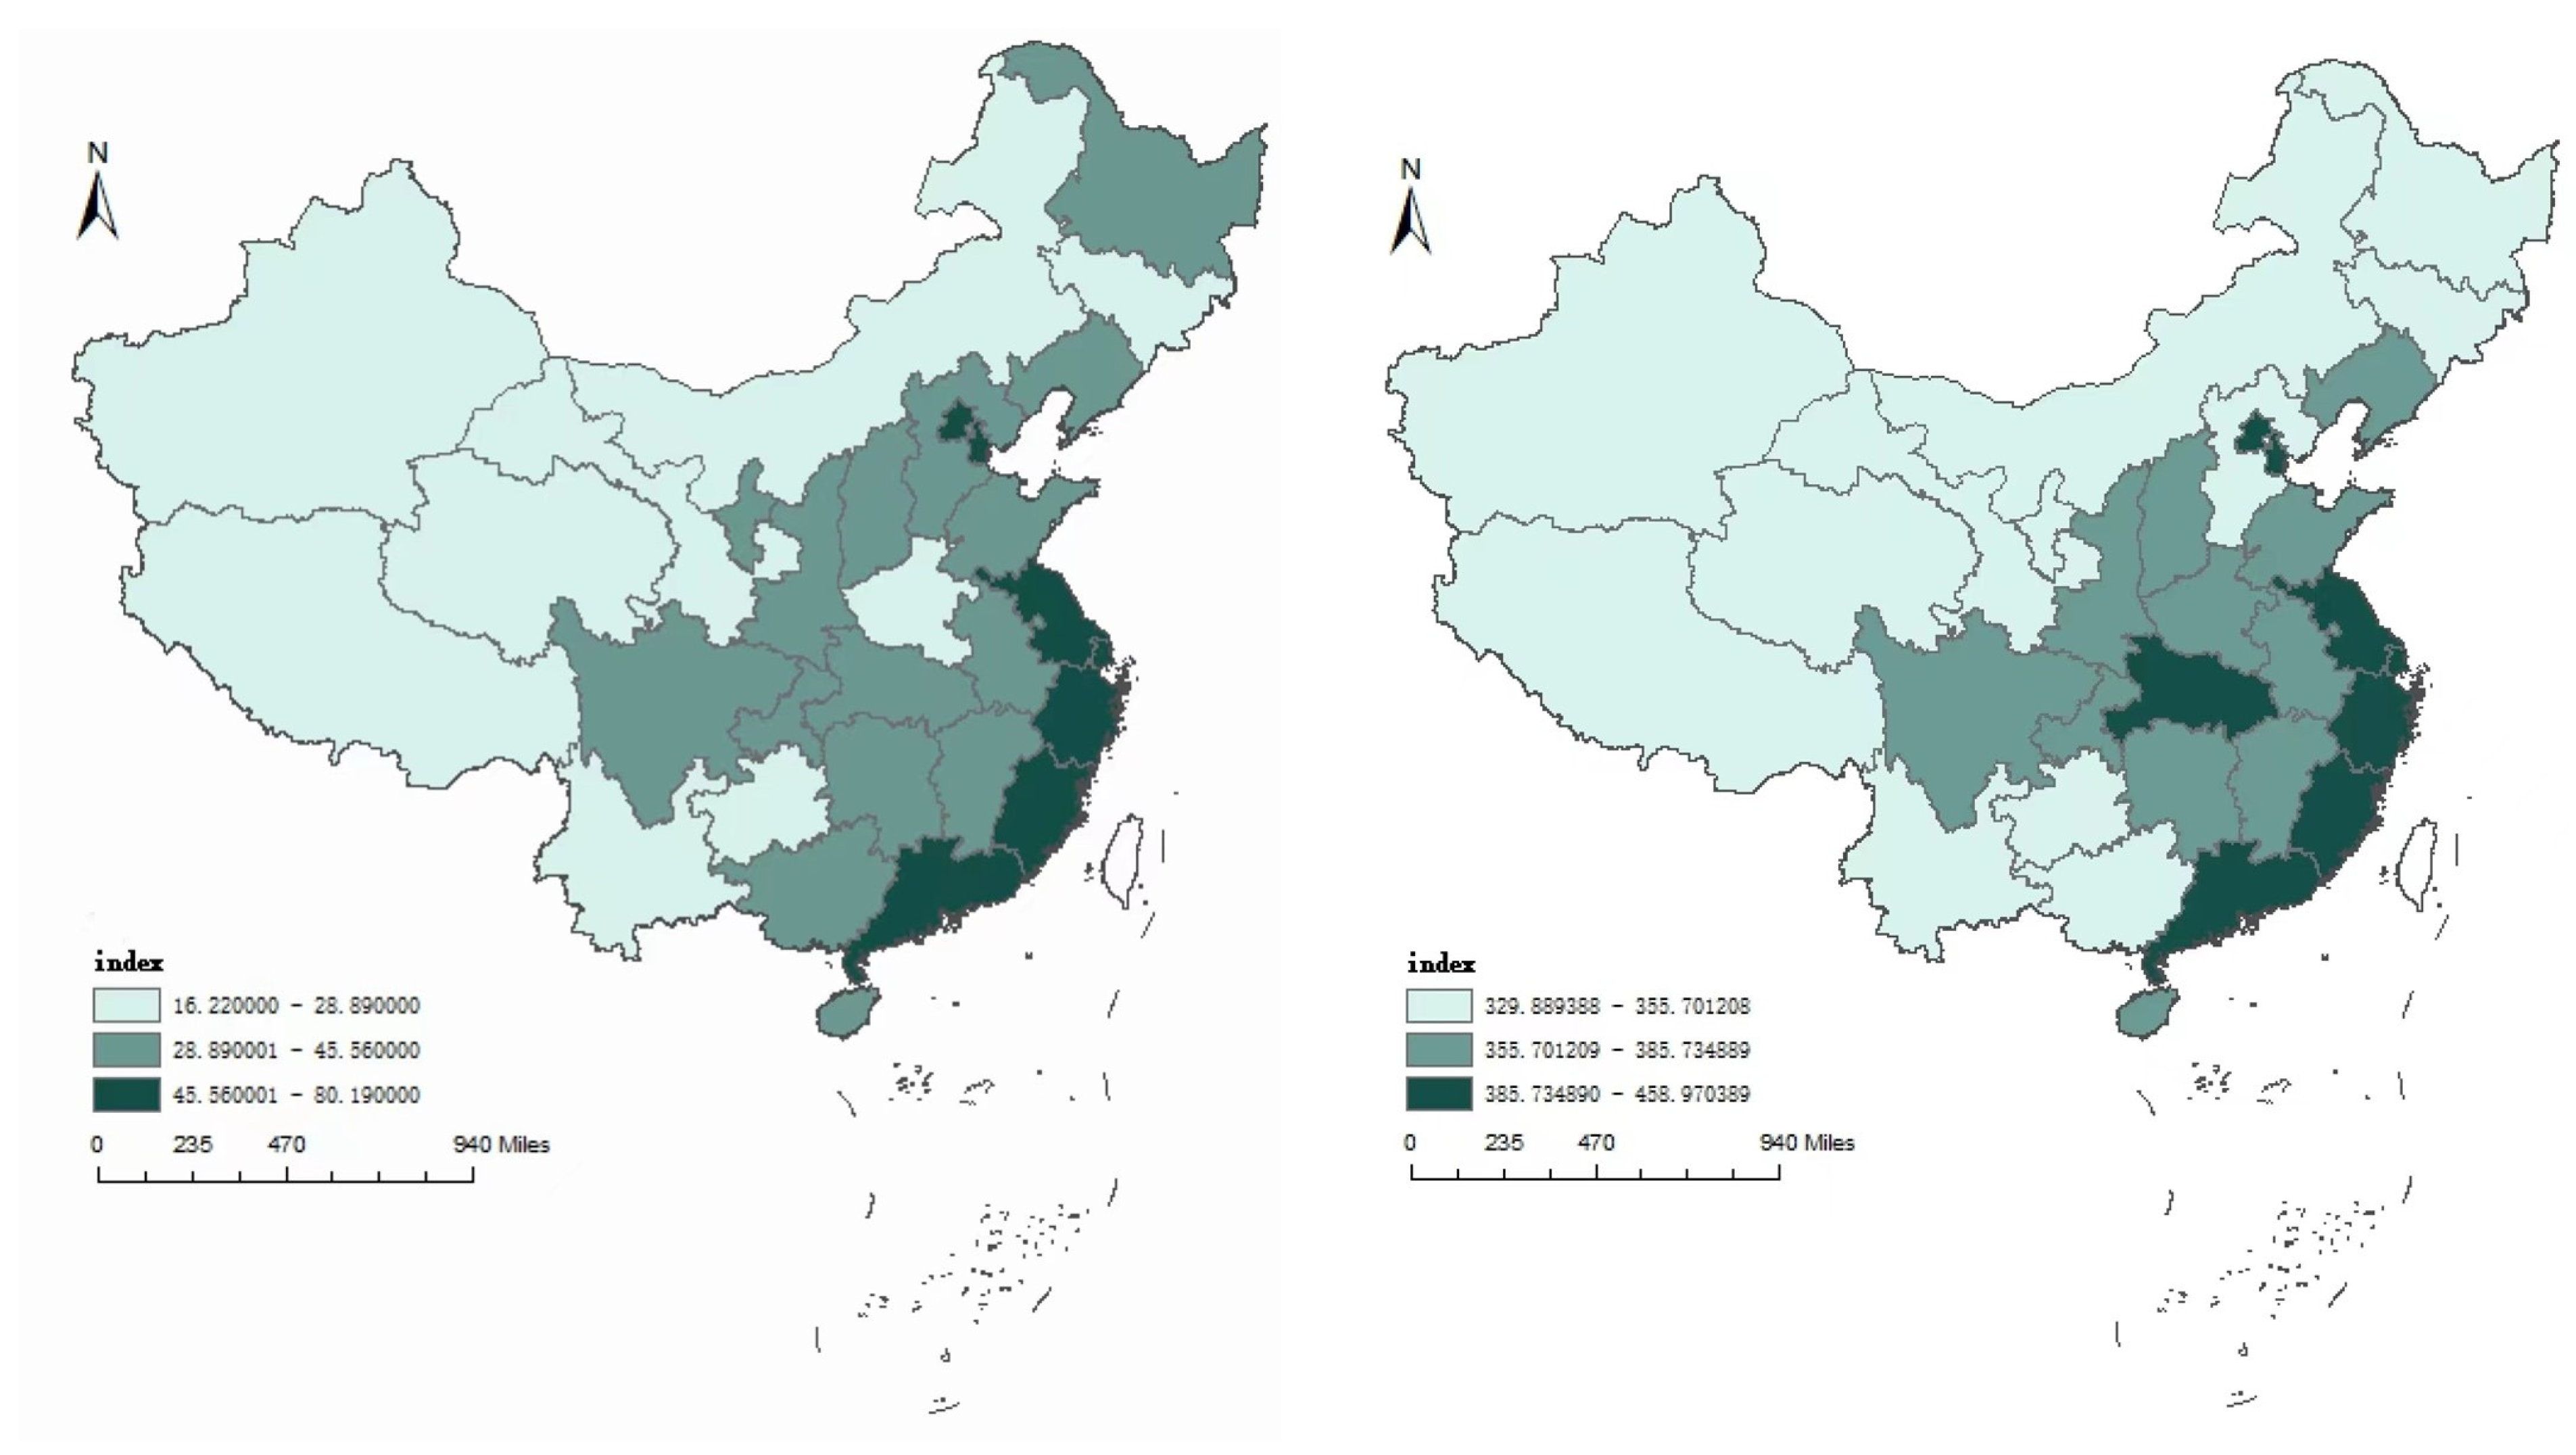
5.1. Spatial Distribution Characteristics of Digital Inclusive Finance

As shown in Figure 1, we group the samples based on 31 provinces and draw a distribution map of the digital inclusive finance index for each province. From a spatial distribution perspective, we select 2011 and 2021 as representative years, divide the digital inclusive finance index into three levels, and draw a spatial distribution map of digital inclusive finance. As depicted in the figure, the national digital inclusive finance index in 2021 is significantly higher than that in 2011, and the development of digital inclusive finance in the eastern coastal areas is higher than that in the central and western regions. Second, there is a spatial correlation among provinces with spatial agglomeration characteristics. The development level of digital inclusive finance in the northernmost provinces is relatively low, such as Inner Mongolia, Xinjiang, Heilongjiang, Jilin, Ningxia, and other regions. The development level of digital inclusive finance in central provinces and cities, such as Henan, Shaanxi, Sichuan, Hubei, and Hunan, is at an intermediate level. The development level of digital inclusive finance in eastern coastal provinces, such as Jiangsu, Zhejiang, Shanghai, and Guangdong, is at the forefront. The evolution of the spatial distribution map indicates that the digital inclusive finance index of a few provinces has evolved from a low to a medium level and from a medium to a high level.

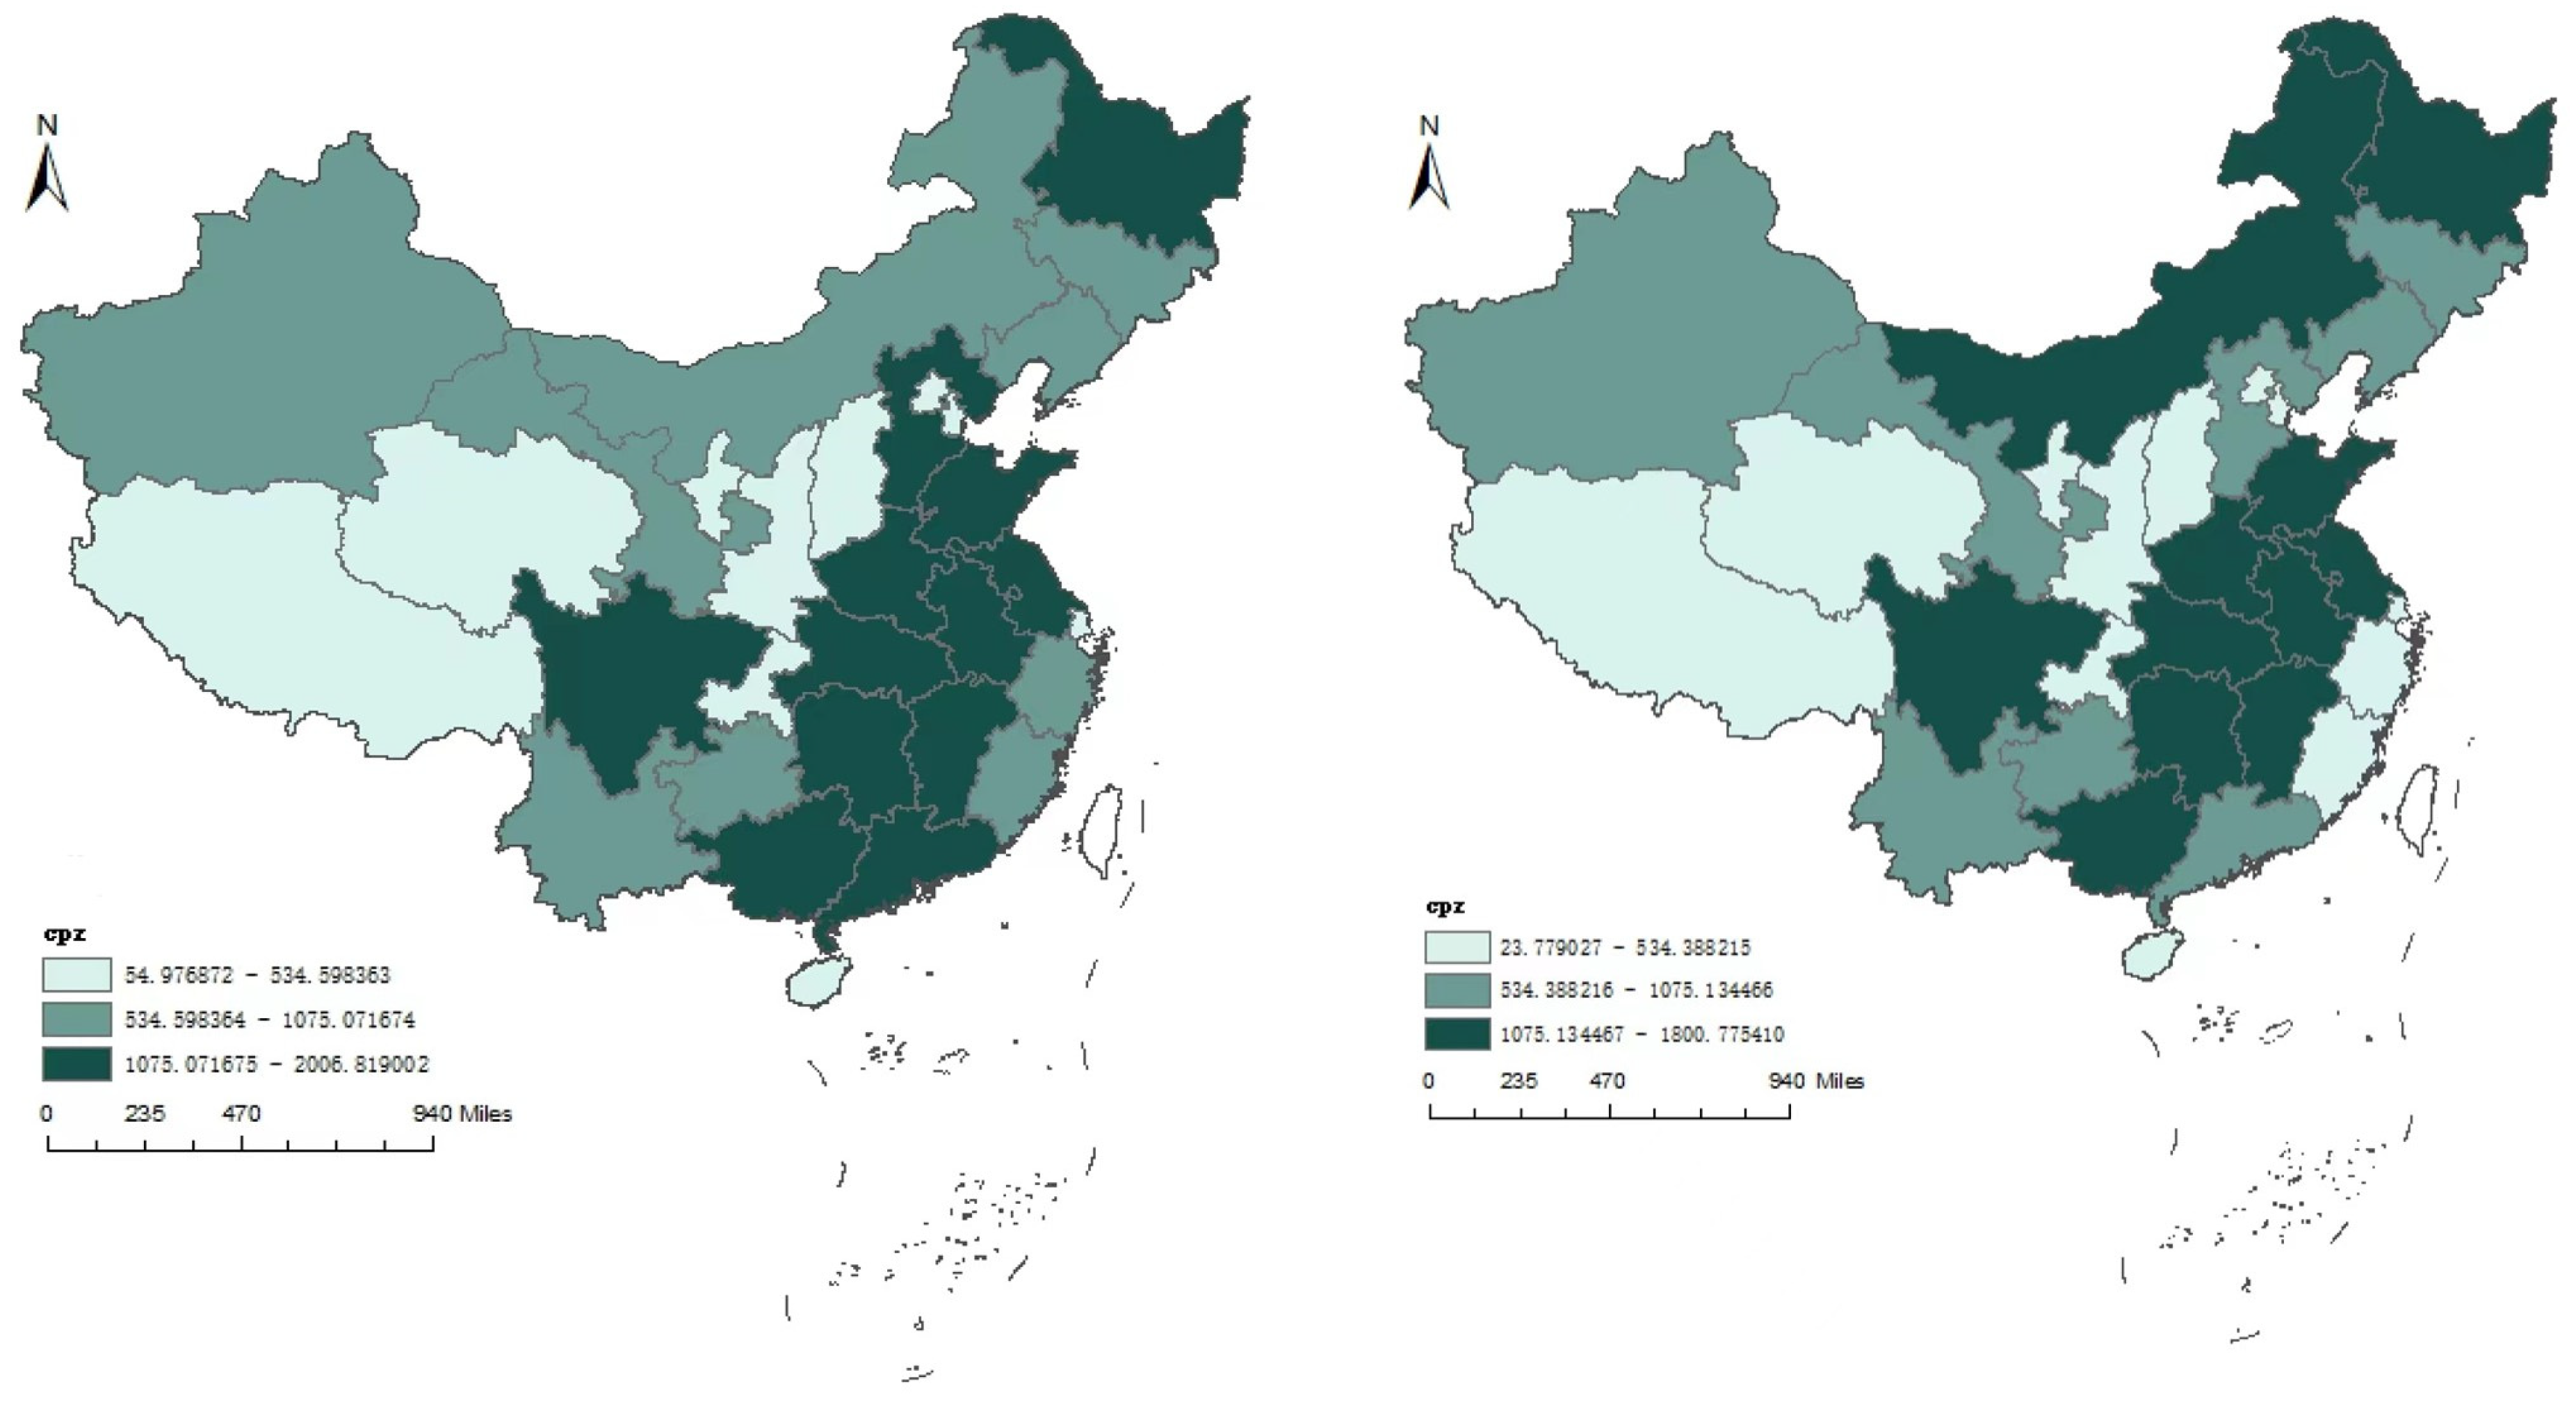
5.2. Spatial Distribution Characteristics of Agricultural Carbon Emissions

As shown in Figure 2, we group the samples based on 31 provinces and draw the annual distribution map of agricultural carbon emissions for each province. It was found that there was little difference in the total agricultural carbon emission and its distribution during the periods of 2011–2017 and 2018–2021. Total agricultural carbon emissions have declined but remained relatively high. Agricultural carbon emissions should not be underestimated, and there is huge scope for carbon reduction. The text only takes 2011 and 2021 as examples. According to the figure, there is a downward trend in agricultural carbon emissions in the central region of China and a clear spatial clustering feature of agricultural carbon emissions nationwide. Moreover, there is a large difference in the distribution of agricultural carbon emissions among provinces. Henan, Hunan, Hubei, and other provinces have high agricultural carbon emissions, whereas Beijing, Tianjin, Shanghai, and other provinces have low agricultural carbon emissions. From 2011 to 2021, the average agricultural carbon emission in Beijing was 37.26 and that in Henan Province was 1916.42, which is more than 50 times that in Beijing, indicating a large gap in agricultural carbon emissions among provinces. Against the background of the dual carbon target, agriculture urgently needs to undergo green transformation.

6. Empirical Analysis

6.1. Benchmark Regression Results

This study selects a panel fixed-effects model to analyze the impact of digital inclusive finance on changes in agricultural carbon emissions. As shown in Table 4, the coefficients of digital inclusive finance are all negative and significant. This means that the development of digital inclusive finance can reduce agricultural carbon emissions without considering spatial factors, supporting H1.

6.2. Robustness Tests

This study conducts robustness tests by replacing the core explanatory variable and replacing the dependent variable as follows:
(1)
Replacing the independent variable
This article uses the digital inclusive finance index with one phase lag to replace the digital finance index for regression analysis. According to the regression results in Table 5, the coefficients of the L.index are all negative and significant.
(2)
Replacing the dependent variable
The intensity of agricultural carbon emissions can reflect the regional carbon reduction effect; therefore, this article uses the ratio of agricultural carbon emissions to the actual gross domestic product of the primary industry to replace the dependent variable. According to the regression results, when the explanatory variable is replaced with carbon emission intensity, the coefficient of index is significantly negative.

6.3. Endogeneity Tests

Due to the possible existence of bidirectional causal relationships and the lack of some unobservable factors in the model, this article uses the two-stage least squares instrumental variable method for endogeneity testing, while taking the interaction term between the internet penetration rate and the distance from each province to Hangzhou as a variable. The interaction term has externalities, and it can represent the development of regional networks, correlates with digital inclusive finance, and does not directly affect agricultural carbon emissions. After introducing the interaction term between internet penetration rate and distance from various provinces to Hangzhou, the regression results revealed that the coefficient of digital inclusive finance passed the significance test, and the robustness of the conclusion was further confirmed through instrumental variables, as shown in Table 6.

6.4. Heterogeneity Tests

6.4.1. Regional Heterogeneity Tests

According to the results of the panel fixed model, digital inclusive finance has a carbon reduction effect. Based on this, the heterogeneity of the eastern, central, and western regions is examined as follows (Table 7):
Based on the heterogeneity regression results among the eastern, central, western regions, there is still a gap in the depth and breadth of digital inclusive finance popularization. The development of digital inclusive finance in the eastern region has a significant reduction effect on agricultural carbon emissions, whereas it does not have a significant impact in the midwestern regions, which have low popularity. The development level of digital inclusive finance in the eastern region is high; capital accumulation caused by digital inclusive finance has a more prominent effect on agricultural technology progress; and the reduction effect on carbon emissions in agriculture is more obvious. Therefore, the direct carbon emissions per unit operating area of agricultural machinery will significantly decrease.

6.4.2. Digital Inclusive Finance Heterogeneity Tests

To further explore the aspect of digital inclusive finance that has an impact on agricultural carbon emissions, we also selected three secondary dimension indicators of the digital inclusive finance index—coverage_breadth, usage_depth, and digitization_level—as core independent variables for regression. According to the analysis results in Columns (1) to (3) of Table 8, without controlling for other variables, the depth of use and degree of digitization of digital inclusive finance have a negative impact on agricultural carbon emissions. The depth of use of digital inclusive finance has the greatest inhibitory effect on agricultural carbon emissions, with a marginal effect of −0.343, and the regression results are significant at the 5% level. The marginal effect of digitalization on the selection of agricultural carbon emissions is −0.165, and the regression results are significant at the 5% level. The marginal effect of coverage breadth on agricultural carbon emissions is positive, but the regression results are not significant. According to the analysis results in Columns (4) to (6) of Table 8, when controlling for other variables, the regression results indicate that the marginal effect of the depth of digital inclusive finance on agricultural carbon emissions is −0.195. The regression results are significant at the 5% level, which is consistent with the practical characteristics of the development of digital inclusive finance in China. Thus, by expanding the depth of digital inclusive finance applications, carbon emissions can be effectively reduced. At present, the impact of the breadth and creditworthiness of China’s digital inclusive finance in addressing agricultural carbon emissions has not been manifested, so the impact of coverage breadth and digitalization level on agricultural carbon emissions is not significant.
Due to the highest level of significance in the depth of use of digital inclusive finance, further regression analysis was conducted using a three-level indicator of the depth of use of digital inclusive finance. According to the data in the Table 9, all six digital inclusive finance business indicators have a negative impact on agricultural carbon emissions. Among them, payment, insurance, investment, credit, and credit_investigation are significant, whereas monetary_fund is not significant. As demonstrated in the previous section, the impact of usage_depth on agricultural carbon emissions is significant, and the impact of usage_depth is reflected through the actual use of digital inclusive financial services. Therefore, an increase in the types of digital inclusive finance businesses has a significant impact on the popularization of agricultural-related technologies and green knowledge. The regression results indicate that digital inclusive finance has strengthened investment in agricultural technology innovation and enhanced the environmental awareness of rural residents, effectively reducing agricultural carbon emissions. In particular, the new digital inclusive financial products effectively meet the financial needs of farmers through third-party payments, monetary funds, consumer credit, online credit reporting, and other methods, promoting the carbon reduction effect of agriculture. Rural vulnerable groups previously excluded by traditional finance are also more likely to access financial services, thereby increasing investment in agricultural technology. However, the regression results in the Table 9 reveal that the marginal effects of payment, investment, and credit are relatively significant, whereas the marginal effects of insurance and credit_investigation are relatively small. The marginal effects of monetary_fund are not significant. The reason for this is that rural areas do not invest much in funds and are mainly concentrated in payment, insurance, investment, and other fields. At present, the penetration rate of the internet fund business among farmers is insufficient, and it has not fundamentally affected the supply of rural financial services, so its impact on farmers’ carbon emissions has not been highlighted.

6.4.3. Carbon Source Heterogeneity Tests

Based on the process of calculating agricultural carbon emissions in previous studies, the carbon emission sources in this article mainly include nine aspects, namely fertilizers, pesticides, agricultural films, diesel, tillage, irrigation, animal husbandry, rice cultivation, and soil emissions. Therefore, further exploration of the heterogeneous impact of digital inclusive finance on these nine types of carbon emissions is presented in Table 10. According to the heterogeneity test results, the development of digital inclusive finance in a region has a significant inhibitory effect on most types of carbon sources, except for rice cultivation. Among them, it has a significant inhibitory effect on five types of carbon sources—fertilizer, tillage, irrigation, animal husbandry, and soil. The development of digital inclusive finance has promoted technological progress in agricultural and animal husbandry production methods, significantly expanded the carbon reduction effect of agricultural technology innovation and agricultural machinery promotion, and thus had a significant inhibitory effect on the three types of carbon sources of tillage, irrigation, and animal husbandry. Moreover, based on the driving effect of digital inclusive finance, it has enhanced the environmental awareness of rural residents, popularizing and publicizing the harm of fertilizers, thus promoting the use of fertilizers. Carbon emissions from soil have a certain inhibitory effect, but the negative effects on other basic agricultural production materials, such as pesticides, agricultural films, and diesel, are not significant.

6.5. Mechanism Verification

To analyze the mechanism through which digital inclusive finance affects agricultural carbon emissions through capital deepening, we use the capital–labor ratio as a proxy variable for capital deepening. It represents the substitution ratio of capital to labor in agricultural production.The regression results are shown in Table 11. According to the regression result (8), the development of digital inclusive finance has significantly increased the agricultural capital–labor ratio and enhanced the degree of agricultural capital deepening. A comparison of the regression results (9) reveals that the coefficient of the mediation effect model ( c ) is significant, and both a b and c are negative. For the absolute value, c < c . There is a partial mediating effect. The development of digital inclusive finance has enhanced the depth of capital. The deepening of capital has reduced the carbon emissions caused by human activities, improved the degree of factor distortion in agricultural and animal husbandry production processes, gradually increased the level of green production technology in agriculture, promoted the development of production factors towards high marginal output and green environmental protection, and enhanced the carbon emission reduction effect. H2 is confirmed.

6.6. Further Analysis

6.6.1. Quantile Regression Model Regression Results

The quantile regression model was used for the analysis, and the results are presented in Table 12. As agricultural carbon emissions are a negative indicator, samples with high quantile agricultural carbon emissions indicate that this stage does not meet the development requirements of the dual carbon goals. The regression results indicate that the impact of digital inclusive finance on agricultural carbon emissions is significantly negative at different quantiles, and the impact varies at different quantiles.
From the perspective of the absolute impact, when the quantile increases from 30% to 60%, the absolute coefficient of the impact of digital inclusive finance on agricultural carbon emissions increases from 0.0376 to 0.0477, and the significance also increases. When the quantile increases from 60% to 90%, the absolute coefficient of the impact of digital inclusive finance on agricultural carbon emissions decreases from 0.0477 to 0.0466. As the quantile increases (30% → 60% → 90%), the absolute value of the quantile regression coefficient of digital inclusive finance first increases and then decreases (0.0376 → 0.0477 → 0.0466). This indicates that the impact of digital inclusive finance on the distribution of agricultural carbon emissions is smaller at both ends than in the middle.

6.6.2. Spatial Panel Durbin Model Regression Results

Using the spatial adjacency matrix of 31 provinces, a spatial effect test was conducted on agricultural carbon emissions for each year. The p-values of the Moran index (unilateral test) for each year were all less than 0.05, and the results were significant. The spatial correlation test was passed. Further analysis was conducted using the spatial panel Durbin model, and the regression results are presented in Table 13. The coefficient of index and Direct_index are significantly negative. This implies that the development of digital inclusive finance in a region will decrease agricultural carbon emissions. Thus, digital inclusive finance has a carbon reduction effect, supporting H1. Further, the coefficients of W×index and Indirect_index are significantly positive, supporting H3. Digital inclusive finance has a comprehensive inhibitory effect on local agricultural carbon emissions through technological, scale, and driving effects. It can further generate spatial carbon enhancement effects through channels such as spillover and agglomeration, bottom-up effects, and siphon effects. Thus, neighboring areas’ digital inclusive finance increases the agricultural carbon emissions in a region.

7. Discussion

7.1. Research Conclusions

This article first theoretically analyzes the mechanism of digital inclusive finance’s impact on agricultural carbon emissions and calculates and analyzes the spatial characteristics of agricultural carbon emissions based on carbon source data. Based on this, the panel fixed-effects model indicates that the development of digital inclusive finance has a carbon reduction effect on agriculture. After the endogeneity and robustness tests, this conclusion still holds. Selecting capital deepening for mechanism analysis, we found that capital deepening is an important transmission mechanism for digital inclusive finance to promote agricultural carbon reduction effects. Heterogeneity differences exist in the impact of digital inclusive finance on agricultural carbon emissions in various regions and carbon sources. Further analysis using quantile regression models reveals that the impact of digital inclusive finance on agricultural carbon emissions is significantly negative at different quantiles. Compared with provinces with lower and higher agricultural carbon emissions, digital inclusive finance has the greatest impact on provinces with moderate agricultural carbon emissions. The results of the spatial panel Durbin model indicate that digital inclusive finance has a spatial carbon-increasing effect on agricultural carbon emissions.

7.2. Suggestions

Based on the above conclusions, to assist in the low-carbon development of agriculture and animal husbandry, the following recommendations are proposed:
(1)
Leverage the technological effects of digital inclusive finance. According to the results of the panel fixed model, digital inclusive finance has a significant reduction effect on carbon emissions in agricultural and pastoral areas. Actively promoting the development of digital inclusive finance can help to expand agricultural production. Relying on China’s digital countryside and network construction, agricultural technology is gradually innovating and developing. To reduce carbon emissions in agricultural and pastoral areas, emphasis should be placed on leveraging the technological effects of digital inclusive finance, ensuring low-carbon upgrading of agriculture and animal husbandry while increasing production.
(2)
Give full play to the driving effect of digital inclusive finance. Make full use of various media to disseminate and promote new agricultural technologies so that farmers can learn more about new technology and use it in agricultural production. Integrating the various impacts of 5G, accelerate the construction of 5G base stations to realize faster platform information transmission for digital financial inclusion. Strengthen the construction and digital upgrading of rural broadband networks, mobile Internet, and other network information infrastructure; improve the communication quality of farmers; and expand the coverage of rural networks. Actively promote knowledge of digital inclusive finance and enhance its utilization in rural areas. Strengthen the promotion of digital inclusive finance in rural areas and improve the understanding and recognition of digital inclusive finance among farmers. Government and financial institution personnel should actively conduct digital inclusive finance education and training, promote the business products and characteristic services of digital inclusive finance, enable farmers and the public to understand more digital inclusive finance knowledge, master the application methods of various financial products, improve the financial literacy of agricultural operators, and gradually eliminate the digital divide.
(3)
Conduct product innovation by region and situation. According to the spatial clustering characteristics of agricultural carbon emissions, the regional clustering characteristics of agricultural carbon emissions are obvious, and the regional heterogeneity of digital inclusive finance has a significant impact. Moreover, the impact of digital inclusive finance on various carbon sources is different. Therefore, targeted product innovation should be conducted for different regions and carbon emission sources. Adapt to local conditions and develop digital inclusive finance based on the actual situation of each region, effectively reducing agricultural carbon emissions. Financial institutions should promote digital transformation; fully utilize big data and cloud computing technology; increase and innovate the types of financial service products; and develop more digital inclusive financial products with high operability, low transaction costs, and differentiation for rural areas in a targeted manner to improve the accuracy of financial service supply and demand matching.
(4)
Promote the emission reduction effect of capital deepening. Digital inclusive finance has promoted the development of capital deepening. Further, reduce the carbon emissions of agriculture and animal husbandry through the substitution of agricultural capital for human resources and the improvement of the technological level. Actively innovate agricultural technology based on actual investment and development of agricultural capital. Improve the development efficiency of digital inclusive finance, actively leverage the role of agricultural capital deepening in carbon reduction, and promote the reduction in agricultural carbon emissions. Continuously increase the amount of financial investment in agriculture and improve the quality of agricultural capital investment. According to the actual situation of provinces, counties, and townships, coordinate and integrate financial funds related to agriculture and ensure that the funds for the development of agricultural mechanization are used for the specified purposes.
(5)
Strengthen regional connections and cooperation. According to the results of the spatial econometric model, although the development of digital inclusive finance in a region plays a role in reducing agricultural carbon emissions, due to the spatial clustering characteristics of agricultural carbon emissions, surrounding areas can increase the agricultural carbon emissions in an area. Therefore, it is necessary to strengthen communication between the local and surrounding areas and ensure the effective implementation of carbon reduction work in the entire agricultural and animal husbandry industry through project cooperation or policy formulation. When developing development plans, the development of digital inclusive finance in adjacent areas should be included in the same planning system. On the one hand, strengthening the exchange and cooperation of digital inclusive finance-related activities between provincial regions and promoting regions with good development of digital inclusive finance will have a significant negative impact on agricultural carbon emissions in a region through knowledge and technology spillovers. On the other hand, measures should be taken to control the “siphon effect.” Resources should not be piled up in core development areas but should be reasonably allocated based on the advantages and characteristics of each region. If necessary, underdeveloped areas should be given a certain degree of tilt, thus forming a diversified, coordinated, and complementary digital development pattern.

Author Contributions

Conceptualization, H.H.; Methodology, H.H.; Software, H.H.; Validation, H.H.; Formal analysis, L.Z.; Investigation, L.Z.; Resources, L.Z.; Data curation, L.Z.; Writing—original draft, L.S.; Writing—review & editing, L.S.; Visualization, L.S.; Supervision, L.S.; Project administration, L.S.; Funding acquisition, L.Z. All authors have read and agreed to the published version of the manuscript.

Funding

This work was supported by the key program of the National Social Science Foundation of China (Grant No. 22AJY019), supported by the National Social Science Foundation of China (Grant No. 18BMZ134), supported by the Program for Innovative Research Team in Universities of Inner Mongolia Autonomous Region (Grant No. NMGIRT2201).

Institutional Review Board Statement

Not applicable.

Informed Consent Statement

Not applicable.

Data Availability Statement

The data presented in this study are available on request from the corresponding author.

Conflicts of Interest

The authors declare no conflicts of interest.

References

  1. Cheng, Q.W.; Xu, A.X.; Chen, Q. The Implementation Path of Agricultural Carbon Reduction under the Background of the “Dual Carbon” Goal—Based on the Verification of Digital Inclusive Finance. J. Southwest Univ. Natl. (Humanit. Soc. Sci. Ed.) 2022, 43, 115–126. [Google Scholar]
  2. Paramati, S.R.; Mo, D.; Gupta, R. The effects of stock market growth and renewable energy use on CO2 emissions: Evidence from g20 countries. Energy Econ. 2017, 66, 360–371. [Google Scholar] [CrossRef]
  3. Wang, J.; Wang, J.; Wang, Y.W. How does the development of digital finance affect the carbon intensity of manufacturing? China Popul. Resour. Environ. 2022, 32, 1–11. [Google Scholar]
  4. Chen, L.; Hu, W.T. A Study on the Synergistic Effects of Financial Development, Technological Progress, and Carbon Emissions: Based on VAR Analysis of Carbon Emissions in 30 Provinces in China from 2005 to 2017. Learn. Explor. 2020, 6, 117–124. [Google Scholar]
  5. Zhao, H. How does digital finance affect carbon emissions? Evidence from an emerging market. Sustainability 2021, 13, 12303. [Google Scholar] [CrossRef]
  6. Omri, A.; Daly, S.; Rault, C. Financial development, environmental quality, trade and economic growth: What causes what in MENA countries. Energy Econ. 2015, 48, 242–252. [Google Scholar] [CrossRef]
  7. Salahuddin, M.; Alam, K.; Ozturk, I.; Sohag, K. The effects of electricity consumption, economic growth, financial development and foreign direct investment on CO2 emissions in Kuwait. Renew. Sustain. Energy Rev. 2017, 81 Pt 2, 2002–2010. [Google Scholar] [CrossRef]
  8. Yessengali, O.; Murat, I. The impact of financial development on energy demand in transition economies. Glob. Econ. J. 2018, 18, 20180014. [Google Scholar] [CrossRef]
  9. Dasgupta, S.; Laplante, B.; Mamingi, N. Pollution and capital markets in developing countries. SSRN Electron. J. 1998, 42, 310–335. [Google Scholar] [CrossRef]
  10. Xiong, L.; Qi, S.Z. Financial Development and Regional Carbon Emissions in China: Based on the STIRPAT Model and Dynamic Panel Data Analysis. J. China Univ. Geosci. (Soc. Sci. Ed.) 2016, 16, 63–73. [Google Scholar]
  11. He, L.; Zhang, L.; Zhong, Z.; Wang, D.; Wang, F. Green credit, renewable energy investment and green economy development: Empirical analysis based on 150 listed companies of China. J. Clean. Prod. 2018, 208, 363–372. [Google Scholar] [CrossRef]
  12. Wang, W. County Finance and Green Total Factor Productivity Growth: Evidence from the Upper Reaches of the Yangtze River Economic Belt. Forum Stat. Inf. 2017, 32, 69–77. [Google Scholar]
  13. Shahbaz, M.; Solarin, S.A.; Mahmood, H. Does financial development reduce CO2 emissions in Malaysian economy? A time series analysis. Econ. Model. 2013, 35, 145–152. [Google Scholar] [CrossRef]
  14. Lee, K.H.; Min, B. Green R&D for eco-innovation and its impact on carbon emissions and firm performance. J. Clean. Prod. 2015, 108, 534–542. [Google Scholar]
  15. Liu, S.; Liu, M. Green Finance, Economic Growth, and Environmental Change—Is it possible for the Northwest Regional Environmental Index to achieve the “Paris Commitment”? Contemp. Econ. Sci. 2020, 42, 71–84. [Google Scholar]
  16. Yang, X.Q.; Cai, L.M.; Zhang, J.S. A Study on the Relationship between Financial Innovation, Industrial Structure Upgrading, and Carbon Emissions from a Spatial Perspective. J. Xi’an Univ. Sci. Technol. 2022, 42, 791–799. [Google Scholar]
  17. Dogan, E.; Seker, F. Determinants of co2 emissions in the european union: The role of renewable and non-renewable energy. Renew. Energy 2016, 94, 429–439. [Google Scholar] [CrossRef]
  18. Bekhet, H.A.; Matar, A.; Yasmin, T. CO2 emissions, energy consumption, economic growth, and financial development in gcc countries: Dynamic simultaneous equation models. Renew. Sustain. Energy Rev. 2017, 70, 117–132. [Google Scholar] [CrossRef]
  19. Yan, C.L.; Li, T.; Lan, W. Financial development, innovation, and carbon dioxide emissions. Financ. Res. 2016, 1, 14–30. [Google Scholar]
  20. Li, D.S.; Xu, H.F.; Zhang, S.Y. Financial Development, Technological Innovation, and Carbon Emission Efficiency: Theoretical and Empirical Research. Explor. Econ. Issues 2018, 2, 169–174. [Google Scholar]
  21. Zhu, D.B.; Ren, L.; Liu, Y. Inclusive Financial Development, Economic Growth, and Carbon Emissions in China. China Popul. Resour. Environ. 2018, 2, 66–76. [Google Scholar]
  22. Sun, Z.H.; Chen, Y.L. Analysis of Financial Support, Technological Progress, and Energy Efficiency Based on Carbon Emission Constraints. Bus. Res. 2017, 5, 58–66. [Google Scholar]
  23. Liu, G.C.; Zhang, J.; Feng, C. Financial System Reform and Economic Efficiency Improvement: Empirical Analysis from Provincial Panel Data. Manag. World 2017, 6, 9–22+187. [Google Scholar]
  24. Beck, T.; Levine, R. Stock markets, banks, and growth: Panel evidence. J. Bank. Financ. 2004, 28, 423–442. [Google Scholar] [CrossRef]
  25. Xu, Z.; Gao, Y.; Huo, Z.F. The pollution reduction effect of digital finance. Financ. Sci. 2021, 4, 28–39. [Google Scholar]
  26. He, M.B.; Yang, X.W. Digital inclusive finance, carbon emissions, and total factor productivity. Financ. Forum 2021, 26, 18–25. [Google Scholar]
  27. Shen, Y.; Tang, H.Y.; Zhou, P.F. Can digital inclusive finance improve agricultural total factor productivity—Empirical Testing Based on Provincial Panel Data. J. Shanghai Lixin Sch. Account. Financ. 2021, 33, 15–27. [Google Scholar]
  28. Luo, W.L.; Liu, S.T.; Wang, Y.P. The Development of Digital Inclusive Finance and Carbon Reduction: An Empirical Test Based on County Panel Data. Fujian Financ. 2022, 2022, 3–15. [Google Scholar]
  29. Hamdi, H.; Sbia, R.; Shahbaz, M. The nexus between electricity consumption and economic growth in Bahrain. Econ. Model. 2014, 38, 227–237. [Google Scholar] [CrossRef]
  30. Wang, B.Y.; Zhang, W.G. Interprovincial Differences and Influencing Factors of Agricultural Ecological Efficiency in China: Based on Panel Data Analysis of 31 Provinces from 1996 to 2015. China Rural Econ. 2018, 1, 46–62. [Google Scholar]
  31. Huang, Y.C.; Huang, Y.S.; Hu, S.L.; Jia, L. Can digital finance promote green and low-carbon development? J. Nanjing Univ. Financ. Econ. 2022, 4, 88–97. [Google Scholar]
  32. Xu, W.C.; Mao, Y.J.; Qu, X.S. Research on the Impact of Rural Financial Development on Agricultural Carbon Emissions: Taking 17 Provincial-level Cities in Henan Province as an Example. Credit Inf. 2022, 40, 86–92. [Google Scholar]
  33. Wei, W.; Changcun, W.; Qi, C. The Impact of Agricultural Technology Progress on Agricultural Energy Use and Carbon Emissions: Analysis Based on GTAP-E Model. Agric. Technol. Econ. 2018, 2, 30–40. [Google Scholar]
  34. Sun, C.W.; Liu, X.Y.; Lin, J. Research on the Measurement and Convergence of China’s Total Factor Productivity under Carbon Intensity Constraints. Financ. Res. 2010, 6, 17–33. [Google Scholar]
  35. Zheng, W.T.; Zhao, H.Y.; Zhao, M.C. Is the development of digital finance beneficial for environmental pollution control—Discussion on the Regulating Role of Local Resource Competition. Ind. Econ. Res. 2022, 1, 1–13. [Google Scholar]
  36. Zhang, Z.P.; Wang, Q. Does the development of digital inclusive finance have a capital substitution effect on agricultural production—Empirical Research Based on Peking University Digital Inclusive Finance Index and CFPS Data. Financ. Rev. 2021, 13, 98–116+120. [Google Scholar]
  37. Yan, H. Transformation of the Urbanization of China’s Western Region. Inq. Into Econ. Issues 2013, 2, 69–74. [Google Scholar]
  38. Guo, W.; Zeng, X.X. Has green credit improved industrial green total factor productivity—Empirical research based on spatial Durbin model. Econ. Issues 2021, 8, 44–55. [Google Scholar]
  39. Sun, S.H.; Liu, C.M.; Chen, X.N. Digital Countryside, Network Spillovers, and Agricultural Green Total Factor Productivity. Agric. Resour. Reg. China 2022, 6, 1–19. [Google Scholar]
  40. Zhang, M.; Peng, S.G.; Liu, X. Analysis of carbon emission effects of land intensive use from the perspective of spatial interaction. Resour. Dev. Mark. 2022, 38, 1296–1303+1313. [Google Scholar]
  41. Chao, X.; Xue, Z.; Sun, Y. How the New Digital Infrastructure Affects the Upgrading of Foreign Trade: Evidence from Chinese Cities. Sustainability 2020, 42, 46–59. [Google Scholar]
  42. Wen, Z.L.; Ye, B.J. Mediation Effects Analysis: Methodology and Model Development. Adv. Psychol. Sci. 2014, 22, 731–745. [Google Scholar] [CrossRef]
  43. Machado, J.A.F.; Silva, J.M.C.S. Quantiles Via Moments. J. Econom. 2019, 213, 145–173. [Google Scholar] [CrossRef]
  44. Anselin, L. Spatial Effects in Econometric Practice in Environmental and Resource Economics. Am. J. Agric. Econ. 2001, 83, 705–710. [Google Scholar] [CrossRef]
  45. Tian, Y.; Zhang, Y.L. Research on the Effectiveness Evaluation, Target Reconstruction, and Path Optimization of Carbon Emission Reduction in China’s Agriculture. Resour. Environ. Arid Areas 2019, 33, 1–7. [Google Scholar]
  46. He, Y.Q.; Chen, R.; Wu, H.Y. A Dynamic Study on the Spatial Pattern and Influencing Factors of Agricultural Carbon Emissions in China. Chin. J. Ecol. Agric. 2018, 26, 1269–1282. [Google Scholar]
  47. Min, J.S.; Hu, H. Estimation of greenhouse gas emissions from agricultural production in China. China Popul. Resour. Environ. 2012, 22, 21–27. [Google Scholar]
  48. Xu, X.X.; Zhou, J.M.; Shu, Y. Estimated Capital Stock of Three Industries in China’s Provinces and Regions. Stat. Res. 2007, 5, 6–13. [Google Scholar]
  49. Li, G.C.; Fan, L.X.; Feng, Z.C. Capital Accumulation, Institutional Changes, and Agricultural Growth: An Empirical Estimation of China’s Agricultural Growth and Capital Stock from 1978 to 2011. Manag. World 2014, 5, 67–79+92. [Google Scholar]
Figure 1. Spatial distribution of digital inclusive finance in 2011 (left). Spatial distribution of digital inclusive finance in 2021 (right). The two maps are based on the standard map downloaded from the National Bureau of Surveying and Mapping Geographic Information Standard Map Service website with the review number GS (2019) 1822 (the base map has not been modified).
Sustainability 16 03071 g001
Figure 2. Spatial distribution of agricultural carbon emissions in 2011 (left). Spatial distribution of agricultural carbon emissions in 2021 (right). The two maps are based on the standard map downloaded from the National Bureau of Surveying and Mapping Geographic Information Standard Map Service website with the review number GS (2019) 1822 (the base map has not been modified).
Sustainability 16 03071 g002
Table 1. Carbon Emission Factors of Various Ruminants (kg/head).
Intestinal Fermentation FactorsFecal Management Factors
Cows395.5624.55
Horses122.7611.18
Donkeys68.216.14
Mules68.216.14
Pigs6.8227.28
Goats34.111.16
Sheep34.111.02
Table 2. CH4 emission coefficients of early rice, late rice, and midseason rice. Unit: g (CH4)/m2.
ProvinceEarly RiceLate RiceMidseason Rice
Beijing0013.23
Tianjin0011.34
Hebei0015.33
Shanxi006.62
Inner Mongolia008.93
Liaoning009.24
Jilin005.57
Heilongjiang008.31
Shanghai12.4127.553.87
Jiangsu16.0727.653.55
Zhejiang14.3734.557.96
Anhui16.7527.651.24
Fujian7.7452.643.47
Jiangxi15.4745.865.42
Shandong0021
Henan0017.85
Hubei17.513958.17
Hunan14.7134.156.28
Guangdong15.0551.657.02
Guangxi12.4149.147.78
Hainan13.4349.452.29
Chongqing6.5518.525.73
Sichuan6.5518.525.73
Guizhou5.12122.05
Yunnan2.387.67.25
Tibet006.83
Shaanxi0012.51
Gansu006.83
Qinghai000
Ningxia007.35
Xinjiang0010.5
Table 3. Summary statistics.
VariablesDefinitionVariable CharacterizationObsMeanStd. Dev.
cpzAgricultural carbon emissionsTotal agricultural carbon emissions341854.3848548.615
indexDigital inclusive financeDigital inclusive finance index (100)3412.3046091.033629
klCapital labor ratioCapital stock/number of people in the primary industry3416.9665487.627917
strAgricultural industrial structureTotal agricultural production/agriculture–forestry–stockbreeding production3410.52794810.0877235
eduRural education level(Number of illiterates ×0+ number of primary school graduates ×6+ junior high school graduates ×9+ Number of high school and technical secondary school graduates ×12+ number of college and undergraduate graduates ×16/total population above 6 years3417.7031520.8280648
govGovernment interventionAgricultural, forestry, and water subsidies/total government expenditure3410.11578180.0339396
macMechanized degreeTotal power of the agricultural machinery3413332.9372921.85
disbProportion of natural disastersCrop disaster area/agricultural sowing area3410.14086180.1145498
rgdpActual per capita agriculture–forestry–stockbreeding production.Actual capita agriculture–forestry–stockbreeding production/number of people in the primary industry3414.0697682.066237
urbUrbanizationUrban population/rural population3411.8204671.635456
zpopPopulation situationPopulation growth rate (%)3410.50305841.004845
zrgdpEconomic growth situationReal per capita GDP growth rate (%)3418.0508622.966363
finFinancial development levelSum of deposit and loan balances of financial institutions/GDP3413.4545361.132274
Table 4. Panel Fixed Effect Model Results.
lncpz
index−0.0270−0.524 *−0.0579 *−0.295 *
(−1.81)(−2.43)(−2.66)(−2.21)
_cons6.470 ***6.630 ***5.327 ***4.968 ***
(188.02) (68.99)(5.85)(6.53)
Control variableNoNoYesYes
Province FEYesYesYesYes
Year FENoYesNoYes
R20.08310.29470.40470.5613
Note: *, *** represent significance levels of 10%, 1%, respectively.
Table 5. Robustness.
lncpzlncpzq
L.index−0.501 *−0.301 *
(−2.51)(−2.14)
index −0.133 ***−0.056 5 ***
(−11.90)(−4.97)
_cons6.621 ***4.933 ***−0.828 ***−0.966 *
(73.50)(6.28)(−32.22)(−2.42)
Control variableNoYesNoYes
Province FEYesYesYesYes
Year FEYesNoNoNo
R20.30890.55810.75480.8069
Note: *, *** represent significance levels of 10%, 1%, respectively.
Table 6. Endogeneity.
lncpz
2SLS Phase I2SLS Phase II2SLS Phase I2SLS Phase II
index −1.031 *** −0.477 **
(−6.64) (−2.85)
interaction term−0.042 *** −0.041 ***
(−6.70) (−6.34)
_cons1.312 ***4.608 ***0.3762.244 ***
(24.21)(26.72)(0.74)(5.59)
Control variableNoNoYesYes
Province FEYesYesYesYes
Year FEYesYesYesYes
R20.99620.99260.99610.9963
Note: **, *** represent significance levels of 5%, 1%, respectively.
Table 7. Regional Heterogeneity.
EasternCentralWestern
index−0.0669 **0.04290.0262
(-3.47)(2.13)(0.89)
_cons3.983 *8.791 ***6.218 ***
(3.07)(11.60)(6.18)
Control variableYesYesYes
Province FEYesYesYes
Year FENoNoYes
R20.71280.31380.3639
Note: *, **, and *** represent significance levels of 10%, 5%, and 1%, respectively.
Table 8. Regression results of heterogeneity in digital inclusive finance.
lncpz
(1)(2)(3)(4)(5)(6)
Coverage
_breadth
0.0586 −0.104
(0.40) (−0.62)
Usage_depth −0.343 ** −0.195 **
(−3.08) (−2.78)
Digitization
_level
−0.165 * −0.0678
(−2.20) (−1.97)
_cons6.400 ***6.581 ***6.496 ***4.879 ***4.836 ***5.037 ***
(111.39)(107.39)(132.43)(5.74)(6.78)(6.04)
Control variableNoNoNoYesYesYes
Province FEYesYesYesYesYesYes
Year FEYesYesYesYesYesYes
R20.15190.36540.24940.52440.57680.5378
Note: *, **, and *** represent significance levels of 10%, 5%, and 1%, respectively.
Table 9. Heterogeneity regression results of third-level indicators of digital inclusive finance.
lncpz
Payment−0.000508 *
(−2.69)
Insurance −0.000108 **
(−2.95)
Monetary
fund
−0.0000995
(−0.78)
Investment −0.000510 **
(−2.79)
Credit −0.000982 **
(−3.06)
Credit_
investigation
−0.000263 *
(−2.11)
_cons5.473 ***5.393 ***5.776 ***4.790 ***5.149 ***6.495 ***
(6.18)(6.13)(7.76)(5.61)(5.78)(6.23)
Control variableYesYesYesYesYesYes
Province FEYesYesYesYesYesYes
Year FEYesYesYesYesYesYes
R20.39540.37860.47700.45100.40940.4932
Note: *, **, and *** represent significance levels of 10%, 5%, and 1%, respectively.
Table 10. Carbon source heterogeneity test results.
FertilizersPesticidesAgriculture FilmAgriculture DieselAgriculture TillageIrrigation HusbandryRice PlantingSoil Emissions
index−0.309 **−0.212−0.06830.145−0.393 ***−0.154 *−1.005 ***−0.276−0.252 *
(−3.57)(−1.60)(−0.62)(0.71)(-3.84)(−2.13)(−4.23)(−0.98)(−2.50)
_cons3.720 ***1.4711.1830.637−1.438−0.08514.531 ***4.100 **3.361 ***
(6.33)(1.74)(1.74)(0.29)(−1.84)(−0.22)(4.68)(3.08)(4.98)
Control variableYesYesYesYesYesYesYesYesYes
Province FEYesYesYesYesYesYesYesYesYes
Year FEYesYesYesYesYesYesYesYesYes
R20.69320.72090.50930.35450.56450.44540.64460.14770.6152
Note: *, **, and *** represent significance levels of 10%, 5%, and 1%, respectively.
Table 11. Mechanism Verification.
lncpzlnkllncpz
(7)(8)(9)
index−0.295 *0.924 *−0.225 ***
(−2.21)(2.49)(−3.69)
lnkl −0.0757 ***
(−4.53)
_cons4.968 ***−0.1874.954 ***
(6.53)(−0.09)(12.69)
Control variableYesYesYes
Province FEYesYesYes
Year FEYesYesYes
R20.56130.88790.5937
Note: *, *** represent significance levels of 10%, 1%, respectively.
Table 12. Panel Quantile Model Results.
lncpz
q30q60q90
index−0.0376 *−0.0477 **−0.0466 **
(−2.16)(−3.05)(−3.12)
_cons2.042 *3.160 ***3.912 ***
(2.56)(4.48)(5.74)
Control variableYesYesYes
R20.94450.93530.9294
Note: *, **, and *** represent significance levels of 10%, 5%, and 1%, respectively.
Table 13. Results of the spatial panel Durbin model.
lncpz
Index−0.659 ***−0.415 ***
(−8.42)(−5.72)
W × index0.648 ***0.390 ***
(8.26)(5.22)
Direct_index−0.604 ***−0.389 ***
(−8.21)(−5.57)
Indirect_index0.572 ***0.349 ***
(7.65)(4.78)
Total_index−0.0327 **−0.0399
(−3.13)(−1.92)
rho0.646 ***0.371 ***
(13.41)(5.64)
Sigma2_e0.00455 ***0.00317 ***
(12.52)(12.86)
Control variableNoYes
R20.20700.5958
Log-likelihood414.4852491.2942
Note: **, *** represent significance levels of 5%, 1%, respectively.
Disclaimer/Publisher’s Note: The statements, opinions and data contained in all publications are solely those of the individual author(s) and contributor(s) and not of MDPI and/or the editor(s). MDPI and/or the editor(s) disclaim responsibility for any injury to people or property resulting from any ideas, methods, instructions or products referred to in the content.

