
Workplace Energy Culture Framework: A Mixed Methods Study Examining Differences in Energy Use and Behaviours within an Industrial Workplace


Abstract
:1. Introduction
2. Literature Review
2.1. Employee (Occupant) Behaviours
2.2. Organisational Culture and Corporate Sustainability
2.3. Barriers to Workplace Energy Efficiency
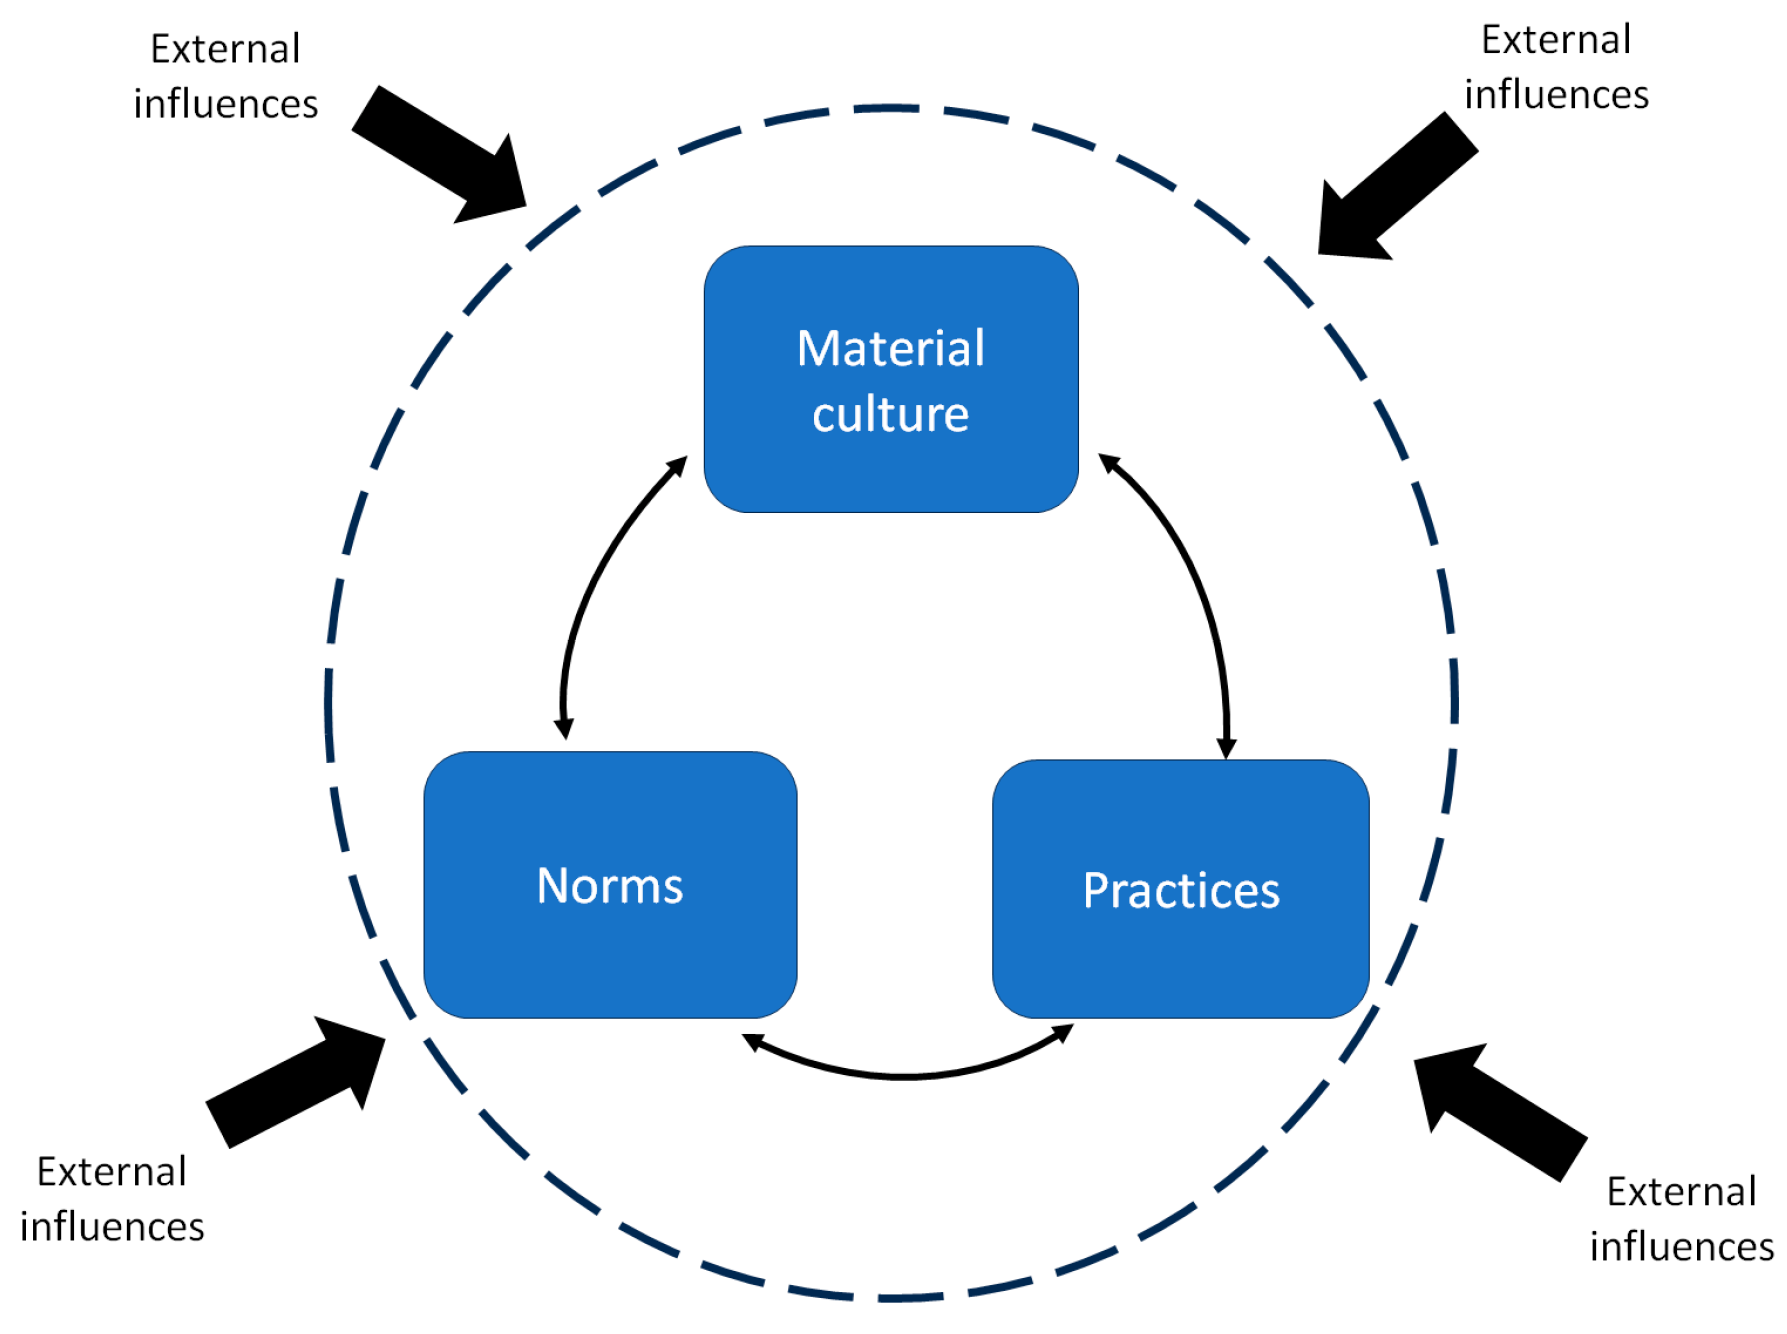
2.4. Existing Frameworks
Energy Culture Framework
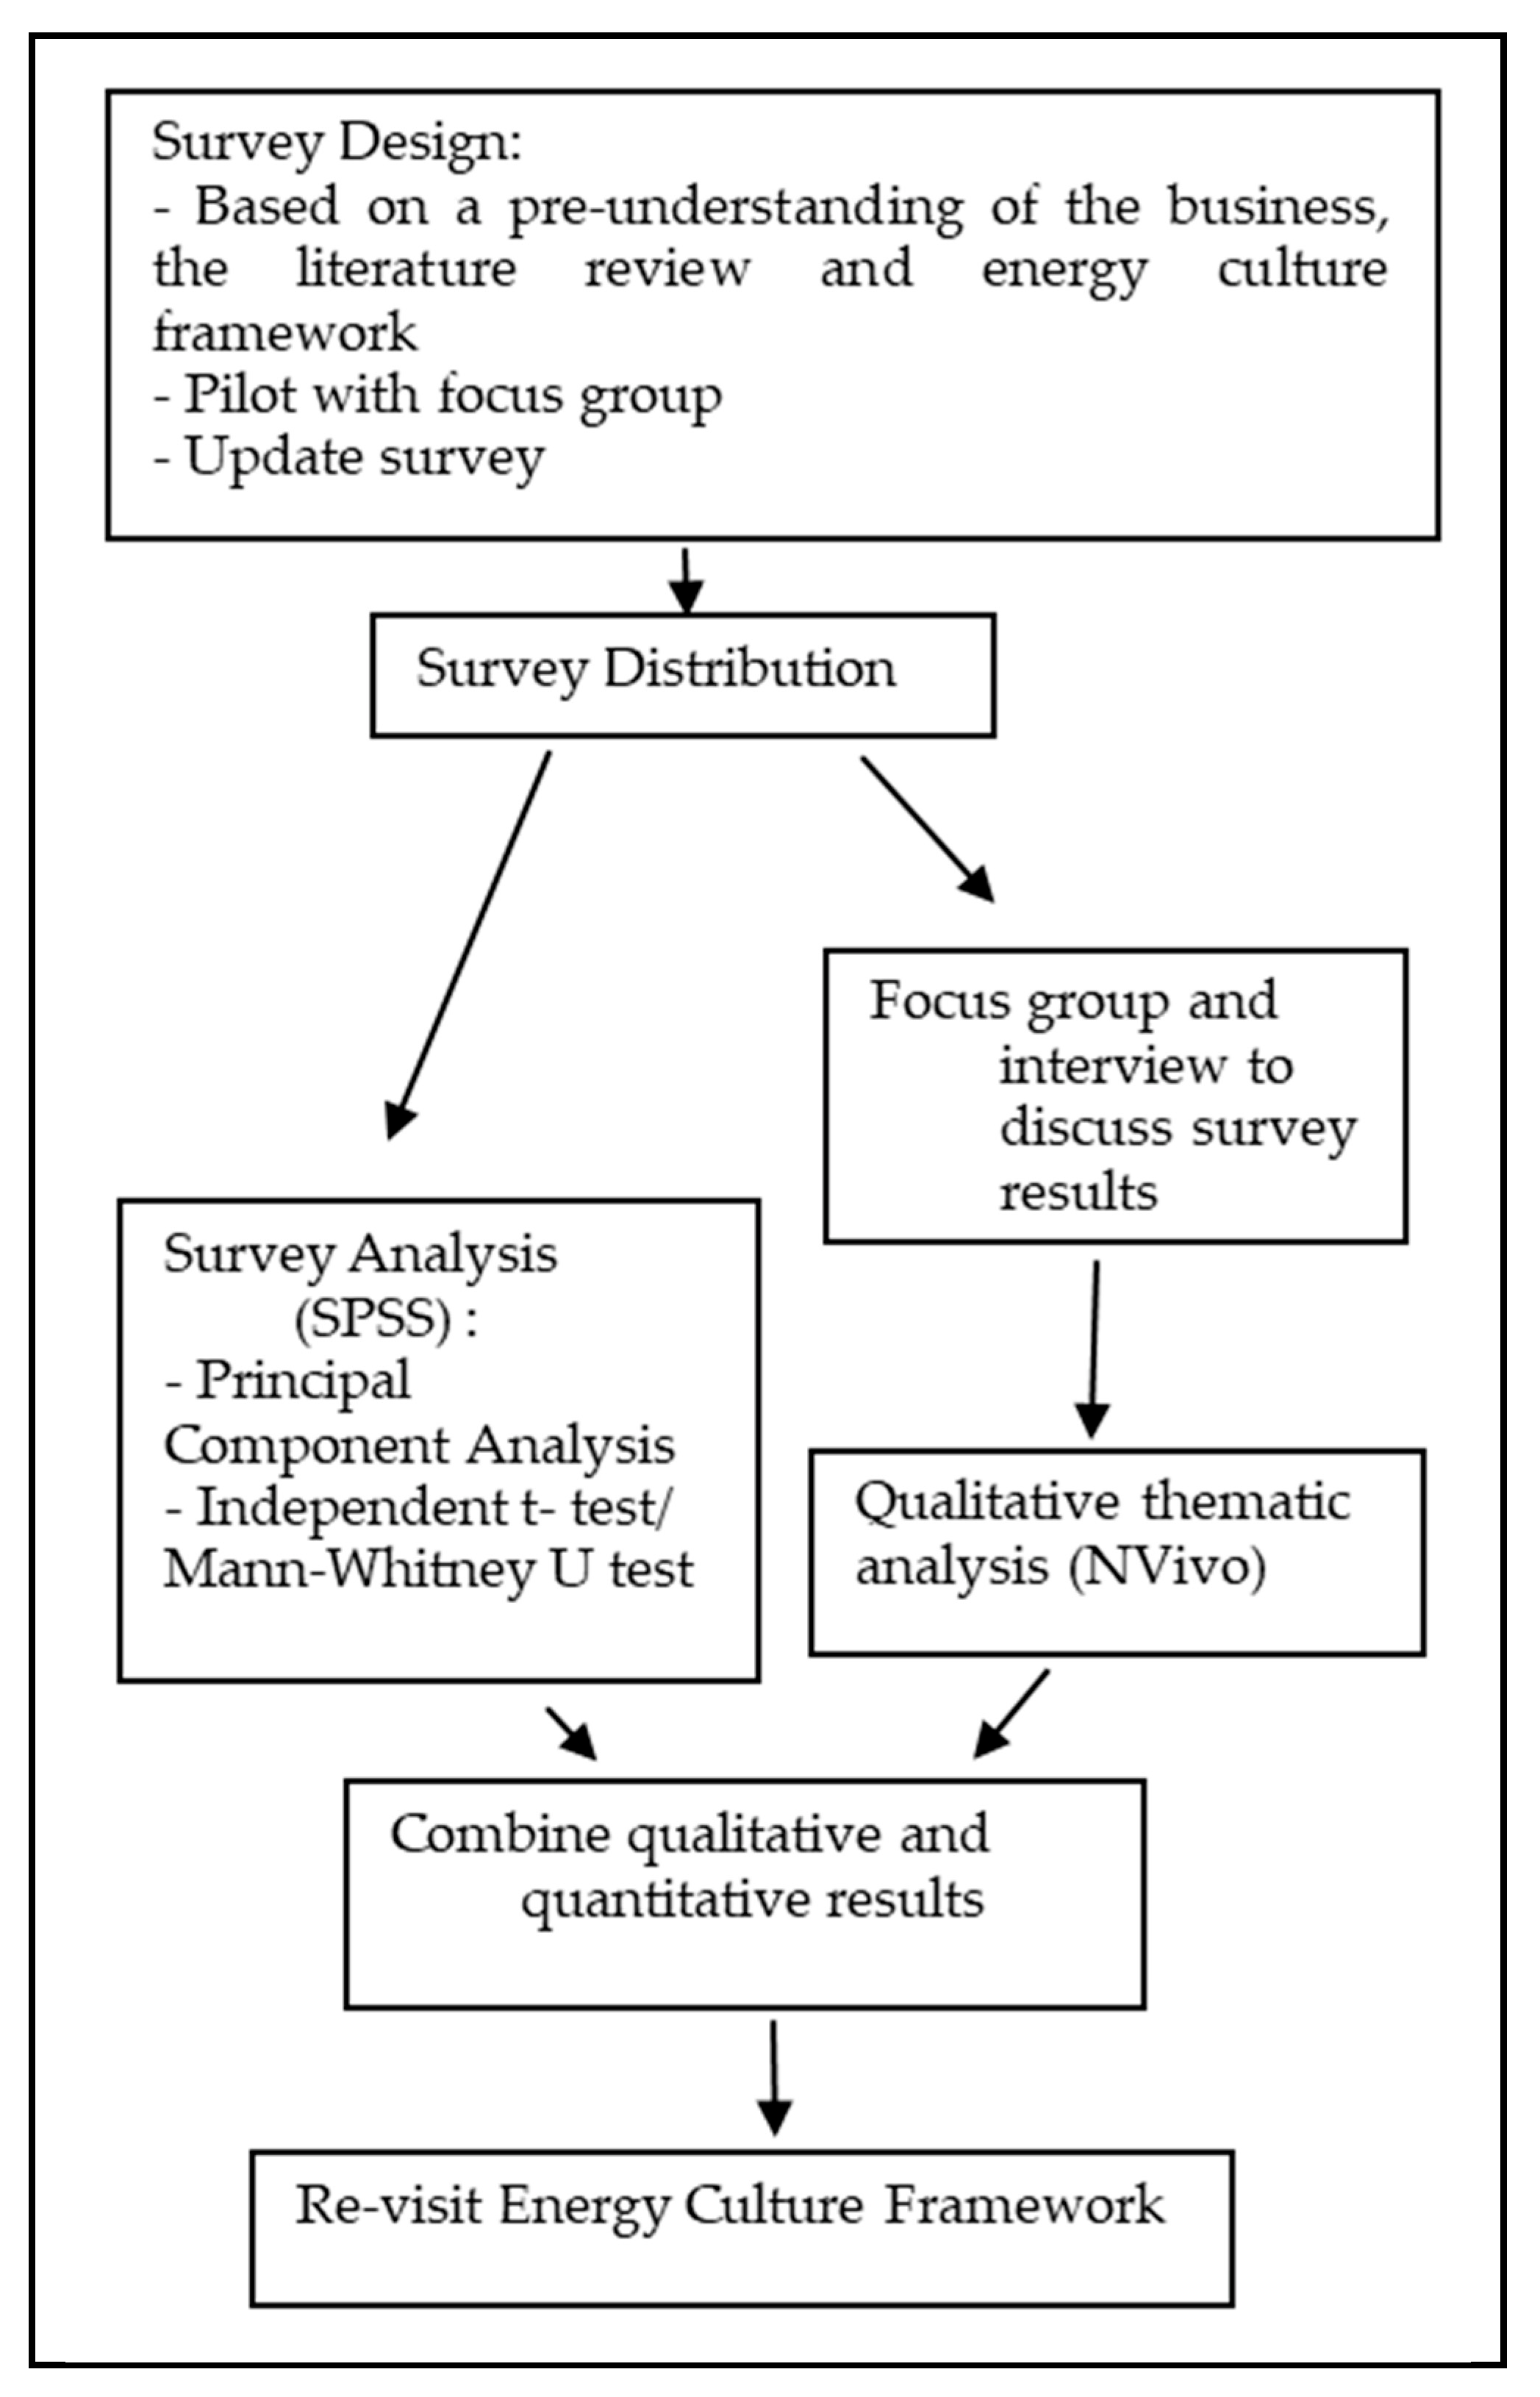
3. Method
3.1. Survey Design and Analysis
3.1.1. Survey Design, Measurement and Distribution
3.1.2. Survey Analysis and Principal Component Analysis
3.2. Focus Group and Interview
4. Results
4.1. Principal Component Analysis
4.2. Where Are There Differences: Findings from Survey Results
4.3. Why Differences Exist: Findings from Qualitative Results
4.3.1. Business Communication Strategy
‘[its] a less effective way of [communicating]…because you can’t guarantee [supervisors are] going to do it right… and you can’t guarantee they’re going to even do it’.
‘they (office areas) talk more around the flowery stuff like [energy]’.
‘All [manufacturing staff] do have access [to computers], they all have a log-on and stuff for doing online training and things like that, so some of them will log-on on a more regular basis than others’ (interview).
‘… [but] stuff doesn’t always get filtered through…we still get emails and stuff, but we don’t need to look, to access them everyday’ (focus group).
4.3.2. Work Tasks and the Physical Environment
‘There’s lots of things out of our control…the bigger stuff that consumers the most energy we have no input into them, things like light switches which are probably trivial compared to [that] kit’.
4.3.3. Investment and Job Security
‘Participant 1: we’re in a newish building …
Participant 2: This is a new building, and there’s a new culture, new build.
Participant 3: the investment’.
‘You’re going to find differences, we’ve got loads of investment and have orders for the rest of our careers… they [other manufacturing shed] don’t know what they’re going to be doing in the next few years’.
4.4. Wider External Influences On-Site Energy Culture (s)
Top-Down Structure, Nature of the Industry, Safety Culture and Government Agendas
‘Safety’s more at a local level’.
‘Different issues in different areas, [safety] has to be local, whereas energy use is a site one’.
‘the funding for us as a energy business just collapsed, so where sustainability was high on the agenda, and we could devote a little bit of money to it, we could no longer. The impact of the defence review was severe and we made a lot of people redundant as a result’ (Interview).
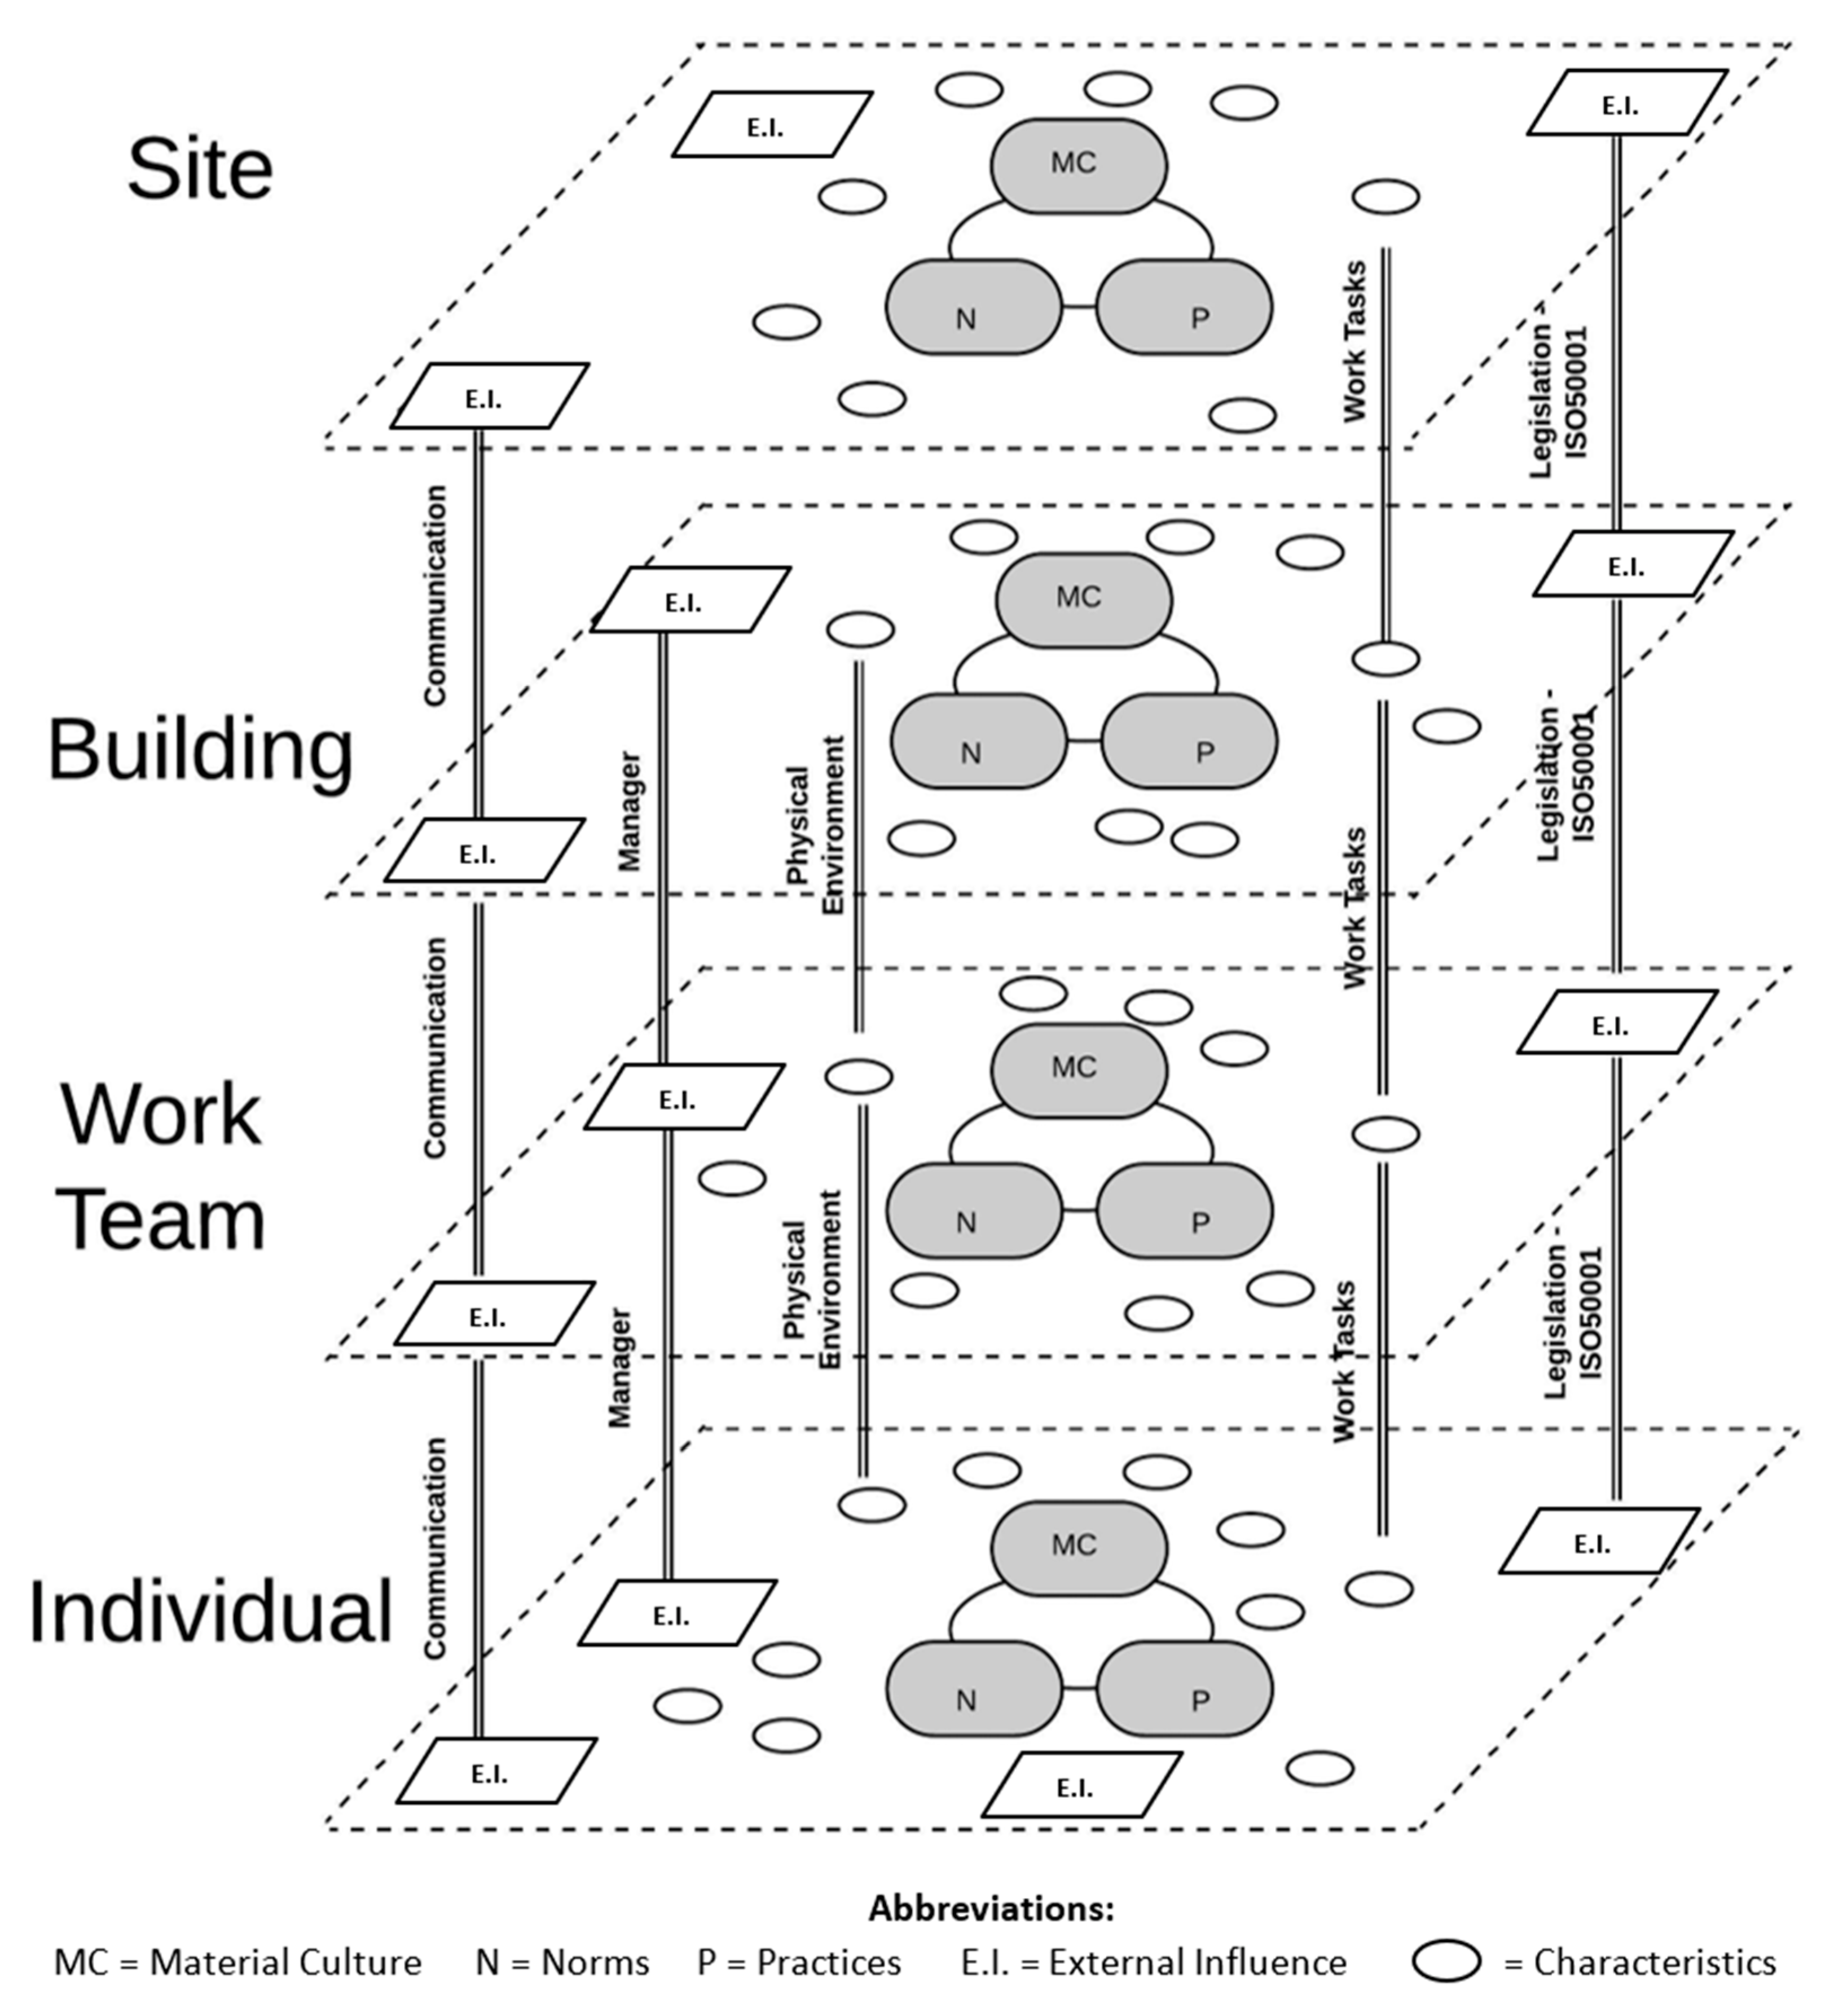
4.5. The Workplace Energy Culture Framework
5. Discussion and Implications
- (a)
- Office and manufacturing employees differ in their attitudes towards energy use, and have different energy cultures.
- (b)
- Workplace energy cultures can be examined at different spatial and temporal scales.
- (c)
- There is an interplay of cultures within an organisation.
6. Conclusions
Limitations and Areas for Future Research
Supplementary Materials
Funding
Institutional Review Board Statement
Informed Consent Statement
Data Availability Statement
Conflicts of Interest
References
- IPCC. Summary for Policymakers., Climate Change 2021: The Physical Science Basis. In Contribution of Working Group I to the Sixth Assessment Report of the Intergovernmental Panel on Climate Change; Cambridge University Press: Cambridge, UK, 2021. [Google Scholar]
- CCC, Progress in Reducing Emissions: 2021 Report to Parliament. 2021. Available online: https://www.theccc.org.uk/wp-content/uploads/2021/06/Progress-in-reducing-emissions-2021-Report-to-Parliament.pdf (accessed on 29 December 2023).
- Department for Energy Security and Net Zero. 2022 UK Greenhouse Gas Emissions, Final Figures. 2024. Available online: https://assets.publishing.service.gov.uk/media/65c0d15863a23d0013c821e9/2022-final-greenhouse-gas-emissions-statistical-release.pdf (accessed on 24 February 2024).
- Harputlugil, T.; de Wilde, P. The interaction between humans and buildings for energy efficiency: A critical review. Energy Res. Soc. Sci. 2021, 71, 101828. [Google Scholar] [CrossRef]
- Janda, K.B. Buildings don’t use energy: People do. Archit. Sci. Rev. 2011, 54, 15–22. [Google Scholar] [CrossRef]
- Andrews, R.N.; Johnson, E. Energy use, behavioral change, and business organizations: Reviewing recent findings and proposing a future research agenda. Energy Res. Soc. Sci. 2016, 11, 195–208. [Google Scholar] [CrossRef]
- Tverskoi, D.; Xu, X.; Nelson, H.; Menassa, C.; Gavrilets, S.; Chen, C.-F. Energy saving at work: Understanding the roles of normative values and perceived benefits and costs in single-person and shared offices in the United States. Energy Res. Soc. Sci. 2021, 79, 102173. [Google Scholar] [CrossRef]
- Carrico, A.R.; Riemer, M. Motivating energy conservation in the workplace: An evaluation of the use of group-level feedback and peer education. J. Environ. Psychol. 2011, 31, 1–13. [Google Scholar] [CrossRef]
- Dixon, G.N.; Deline, M.B.; McComas, K.; Chambliss, L.; Hoffmann, M. Saving energy at the workplace: The salience of behavioral antecedents and sense of community. Energy Res. Soc. Sci. 2015, 6, 121–127. [Google Scholar] [CrossRef]
- Staddon, S.C.; Cycil, C.; Goulden, M.; Leygue, C.; Spence, A. Intervening to change behaviour and save energy in the workplace: A systematic review of available evidence. Energy Res. Soc. Sci. 2016, 17, 30–51. [Google Scholar] [CrossRef]
- Maki, A.; Carrico, A.R.; Raimi, K.T.; Truelove, H.B.; Araujo, B.; Yeung, K.L. Meta-analysis of pro-environmental behaviour spillover. Nat. Sustain. 2019, 2, 307–315. [Google Scholar] [CrossRef]
- Zierler, R.; Wehrmeyer, W.; Murphy, R. The energy efficiency behaviour of individuals in large organisations: A case study of a major UK infrastructure operator. Energy Policy 2017, 104, 38–49. [Google Scholar] [CrossRef]
- Cibinskiene, A.; Dumciuviene, D.; Andrijauskiene, M. Energy Consumption in Public Buildings: The Determinants of Occupants’ Behavior. Energies 2020, 13, 3586. [Google Scholar] [CrossRef]
- Zou, P.X.; Xu, X.; Sanjayan, J.; Wang, J. A mixed methods design for building occupants’ energy behavior research. Energy Build. 2018, 166, 239–249. [Google Scholar] [CrossRef]
- Bulińska-Stangrecka, H.; Bagieńska, A. Culture-Based Green Workplace Practices as a Means of Conserving Energy and Other Natural Resources in the Manufacturing Sector. Energies 2021, 14, 6305. [Google Scholar] [CrossRef]
- Stephenson, J.; Barton, B.; Carrington, G.; Doering, A.; Ford, R.; Hopkins, D.; Lawson, R.; McCarthy, A.; Rees, D.; Scott, M.; et al. The energy cultures framework: Exploring the role of norms, practices and material culture in shaping energy behaviour in New Zealand. Energy Res. Soc. Sci. 2015, 7, 117–123. [Google Scholar] [CrossRef]
- Stephenson, J.; Barton, B.; Carrington, G.; Gnoth, D.; Lawson, R.; Thorsnes, P. Energy cultures: A framework for understanding energy behaviours. Energy Policy 2010, 38, 6120–6129. [Google Scholar] [CrossRef]
- Norton, T.A.; Parker, S.L.; Zacher, H.; Ashkanasy, N.M. Employee Green Behavior:A Theoretical Framework, Multilevel Review, and Future Research Agenda. Organ. Environ. 2015, 28, 103–125. [Google Scholar] [CrossRef]
- Lo, S.H.; Peters, G.Y.; Kok, G. Energy-Related Behaviors in Office Buildings: A Qualitative Study on Individual and Organisational Determinants. Appl. Psychol. 2011, 61, 227–249. [Google Scholar] [CrossRef]
- Andersson, L.; Jackson, S.E.; Russell, S.V. Greening organizational behavior: An introduction to the special issue. J. Organ. Behav. 2013, 34, 151–155. [Google Scholar] [CrossRef]
- Zhang, Y.; Wang, Z.; Zhou, G. Determinants and implications of employee electricity saving habit: An empirical study in China. Appl. Energy 2013, 112, 1529–1535. [Google Scholar] [CrossRef]
- Lee, Y.J.; De Young, R.; Marans, R.W. Factors Influencing Individual Recycling Behavior in Office Settings: A study of Office Workers in Taiwan. Environ. Behav. 1995, 27, 380–403. [Google Scholar] [CrossRef]
- Ajzen, I. The theory of planned behavior. Organ. Behav. Hum. Decis. Process. 1991, 50, 179–211. [Google Scholar] [CrossRef]
- Gao, L.; Wang, S.; Li, J.; Li, H. Application of the extended theory of planned behavior to understand individual’s energy saving behavior in workplaces. Resour. Conserv. Recycl. 2017, 127, 107–113. [Google Scholar] [CrossRef]
- Isaksson, C.; Hiller, C.; Lane, A.-L. Active, passive, non-existing or conditional? Social relations shaping energy use at workplaces. Energy Res. Soc. Sci. 2019, 51, 148–155. [Google Scholar]
- Wang, S.; Wang, J.; Ru, X.; Li, J.; Zhao, D. Understanding employee’s electricity conservation behavior in workplace: Do normative, emotional and habitual factors matter? J. Clean. Prod. 2019, 215, 1070–1077. [Google Scholar] [CrossRef]
- Ru, X.; Chen, M.; Wang, S.; Chen, Z. Does environmental concern fail to predict energy-saving behavior? A study on the office energy-saving behavior of employees of Chinese Internet companies. Environ. Dev. Sustain. 2021, 24, 12691–12711. [Google Scholar] [CrossRef]
- Xie, C.; Ding, H.; Zhang, H.; Yuan, J.; Su, S.; Tang, M. Exploring the psychological mechanism underlying the relationship between organizational interventions and employees’ energy-saving behaviors. Energy Policy 2021, 156, 112411. [Google Scholar] [CrossRef]
- Chen, C.-F.; Knight, K. Energy at work: Social psychological factors affecting energy conservation intentions within Chinese electric power companies. Energy Res. Soc. Sci. 2014, 4, 23–31. [Google Scholar] [CrossRef]
- Weerasinghe, A.S.; Rotimi, J.O.B.; Rasheed, E.O. Modelling of underlying social psychological effects on occupant energy-related behaviours. J. Affect. Disord. 2023, 231, 110055. [Google Scholar] [CrossRef]
- Li, D.; Xu, X.; Chen, C.-F.; Menassa, C. Understanding energy-saving behaviors in the American workplace: A unified theory of motivation, opportunity, and ability. Energy Res. Soc. Sci. 2019, 51, 198–209. [Google Scholar] [CrossRef]
- Ucci, M.; Domenech, T.; Ball, A.; Whitley, T.; Wright, C.; Mason, D.; Corrin, K.; Milligan, A.; Rogers, A.; Fitzsimons, D.; et al. Behaviour change potential for energy saving in non-domestic buildings: Development and pilot-testing of a benchmarking tool. Build. Serv. Eng. Res. Technol. 2012, 35, 36–52. [Google Scholar] [CrossRef]
- Dumitru, A.; De Gregorio, E.; Bonnes, M.; Bonaiuto, M.; Carrus, G.; Garcia-Mira, R.; Maricchiolo, F. Low carbon energy behaviors in the workplace: A qualitative study in Italy and Spain. Energy Res. Soc. Sci. 2016, 13, 49–59. [Google Scholar] [CrossRef]
- Johansson, M.T.; Thollander, P. A review of barriers to and driving forces for improved energy efficiency in Swedish industry– Recommendations for successful in-house energy management. Renew. Sustain. Energy Rev. 2018, 82, 618–628. [Google Scholar] [CrossRef]
- Linnenluecke, M.K.; Griffiths, A. Corporate sustainability and organizational culture. J. World Bus. 2010, 45, 357–366. [Google Scholar] [CrossRef]
- Van der Byl, C.A.; Slawinski, N. Embracing Tensions in Corporate Sustainability: A Review of Research From Win-Wins and Trade-Offs to Paradoxes and Beyond. Organ. Environ. 2015, 28, 54–79. [Google Scholar] [CrossRef]
- Erthal, A.; Marques, L. National culture and organisational culture in lean organisations: A systematic review. Prod. Plan. Control 2018, 29, 668–687. [Google Scholar] [CrossRef]
- Wijethilake, C.; Upadhaya, B.; Lama, T. The role of organisational culture in organisational change towards sustainability: Evidence from the garment manufacturing industry. Prod. Plan. Control 2021, 34, 275–294. [Google Scholar] [CrossRef]
- GLópez-Torres, C.; Garza-Reyes, J.A.; Maldonado-Guzmán, G.; Kumar, V.; Rocha-Lona, L.; Cherrafi, A. Knowledge management for sustainability in operations. Prod. Plan. Control 2019, 30, 813–826. [Google Scholar] [CrossRef]
- Lozano, R. Are Companies Planning their Organisational Changes for Corporate Sustainability? An Analysis of Three Case Studies on Resistance to Change and their Strategies to Overcome it. Corp. Soc. Responsib. Environ. Manag. 2012, 20, 275–295. [Google Scholar] [CrossRef]
- Mouro, C.; Duarte, A.P. Organisational Climate and Pro-environmental Behaviours at Work: The Mediating Role of Personal Norms. Front. Psychol. 2021, 12, 635739. [Google Scholar] [CrossRef]
- Ruparathna, R.; Hewage, K.; Sadiq, R. Improving the energy efficiency of the existing building stock: A critical review of commercial and institutional buildings. Renew. Sustain. Energy Rev. 2015, 53, 1032–1045. [Google Scholar] [CrossRef]
- Unsworth, K.L.; Davis, M.C.; Russell, S.V.; Bretter, C. Employee green behaviour: How organizations can help the environment. Curr. Opin. Psychol. 2020, 42, 1–6. [Google Scholar] [CrossRef]
- Wesselink, R.; Blok, V.; Ringersma, J. Pro-environmental behaviour in the workplace and the role of managers and organisation. J. Clean. Prod. 2017, 168, 1679–1687. [Google Scholar] [CrossRef]
- Blok, V.; Wesselink, R.; Studynka, O.; Kemp, R. Encouraging sustainability in the workplace: A survey on the pro-environmental behaviour of university employees. J. Clean. Prod. 2015, 106, 55–67. [Google Scholar] [CrossRef]
- Schleich, J. Barriers to energy efficiency: A comparison across the German commercial and services sector. Ecol. Econ. 2009, 68, 2150–2159. [Google Scholar] [CrossRef]
- Lane, A.-L.; Cehlin, M.; Thollander, P. Success Factors and Barriers for Facility Management in Keeping Nearly-Zero-Energy Non-Residential Buildings Energy-Efficient over Time. Buildings 2024, 14, 242. [Google Scholar] [CrossRef]
- Schleich, J. Do energy audits help reduce barriers to energy efficiency? An empirical analysis for Germany. Int. J. Energy Technol. Policy 2004, 2, 226. [Google Scholar] [CrossRef]
- Johansson, P.-E.; Thollander, P.; Moshfegh, B. Towards increased energy efficiency in industry: A manager’s perspective. In Proceedings of the World Renewable Energy Congress, Linkoping, Sweden, 8–13 May 2011. [Google Scholar]
- Cagno, E.; Worrell, E.; Trianni, A.; Pugliese, G. A novel approach for barriers to industrial energy efficiency. Renew. Sustain. Energy Rev. 2013, 19, 290–308. [Google Scholar] [CrossRef]
- Yuriev, A.; Boiral, O.; Francoeur, V.; Paillé, P. Overcoming the barriers to pro-environmental behaviors in the workplace: A systematic review. J. Clean. Prod. 2018, 182, 379–394. [Google Scholar] [CrossRef]
- Sorrell, S.; Schleich, J.; Scott, S.; O’Malley, E.; Trace, F.; Boede, U.; Ostertag, K.; Radgen, P. Barriers to Energy Efficiency in Public and Private Organisations; University of Sussex: Brighton, UK, 2000. [Google Scholar]
- Stern, P.C. New environmental theories: Toward a coherent theory of environmentally significant behavior. J. Soc. Issues 2000, 56, 407–424. [Google Scholar] [CrossRef]
- Schwartz, S.H. Normative Influences on Altruism. Adv. Exp. Soc. Psychol. 1977, 10, 221–279. [Google Scholar]
- Heydarian, A.; McIlvennie, C.; Arpan, L.; Yousefi, S.; Syndicus, M.; Schweiker, M.; Jazizadeh, F.; Rissetto, R.; Pisello, A.L.; Piselli, C.; et al. What drives our behaviors in buildings? A review on occupant interactions with building systems from the lens of behavioral theories. J. Affect. Disord. 2020, 179, 106928. [Google Scholar] [CrossRef]
- Dunlap, R.E.; Van Liere, K.D.; Mertig, A.G.; Jones, R.E. New trends in measuring environmental attitudes: Measuring endorsement of the New Ecological Paradigm: A revised NEP scale. J. Soc. Issues 2000, 56, 425–442. [Google Scholar] [CrossRef]
- Soorige, D.; Karunasena, G.; Kulatunga, U.; Mahmood, M.N.; De Silva, L. An Energy Culture Maturity Conceptual Framework on Adopting Energy-Efficient Technology Innovations in Buildings. J. Open Innov. Technol. Mark. Complex. 2022, 8, 60. [Google Scholar] [CrossRef]
- Jürisoo, M.; Serenje, N.; Mwila, F.; Lambe, F.; Osborne, M. Old habits die hard: Using the energy cultures framework to understand drivers of household-level energy transitions in urban Zambia. Energy Res. Soc. Sci. 2019, 53, 59–67. [Google Scholar] [CrossRef]
- Mazzone, A.; Cruz, T.; Bezerra, P. Firewood in the forest: Social practices, culture, and energy transitions in a remote village of the Brazilian Amazon. Energy Res. Soc. Sci. 2021, 74, 101980. [Google Scholar] [CrossRef]
- Hopkins, D.; Stephenson, J. Generation Y mobilities through the lens of energy cultures: A preliminary exploration of mobility cultures. J. Transp. Geogr. 2014, 38, 88–91. [Google Scholar] [CrossRef]
- Krietemeyer, B.; Dedrick, J.; Sabaghian, E.; Rakha, T. Managing the duck curve: Energy culture and participation in local energy management programs in the United States. Energy Res. Soc. Sci. 2021, 79, 102055. [Google Scholar] [CrossRef]
- Bach, L.; Hopkins, D.; Stephenson, J. Solar electricity cultures: Household adoption dynamics and energy policy in Switzerland. Energy Res. Soc. Sci. 2019, 63, 101395. [Google Scholar] [CrossRef]
- Tesfamichael, M.; Bastille, C.; Leach, M. Eager to connect, cautious to consume: An integrated view of the drivers and motivations for electricity consumption among rural households in Kenya. Energy Res. Soc. Sci. 2019, 63, 101394. [Google Scholar] [CrossRef]
- Klaniecki, K.; Duse, I.A.; Lutz, L.M.; Leventon, J.; Abson, D.J. Applying the energy cultures framework to understand energy systems in the context of rural sustainability transformation. Energy Policy 2020, 137, 111092. [Google Scholar] [CrossRef]
- Dew, N.; Aten, K.; Ferrer, G. How many admirals does it take to change a light bulb? Organizational innovation, energy efficiency, and the United States Navy’s battle over LED lighting. Energy Res. Soc. Sci. 2017, 27, 57–67. [Google Scholar] [CrossRef]
- Tseng, S.H.; Lee, C.; Higham, J. Managing academic air travel emissions: Towards system-wide practice change. Transp. Res. Part D Transp. Environ. 2022, 113, 103504. [Google Scholar] [CrossRef]
- Bell, M.; Carrington, G.; Lawson, R.; Stephenson, J. Socio-technical barriers to the use of energy-efficient timber drying technology in New Zealand. Energy Policy 2013, 67, 747–755. [Google Scholar] [CrossRef]
- Oksman, V.; Reda, F.; Karjalainen, S.; Rehman, H.; Fatima, Z. Towards sustainable energy culture in the industrial sector: Introducing an interdisciplinary method for understanding energy culture in business industries. Energy Sustain. Soc. 2021, 11, 28. [Google Scholar] [CrossRef]
- Tashakkori, A.; Johnson, R.B.; Teddlie, C. Foundations of Mixed Methods Research: Integrating Quantitative and Qualitative Approaches in the Social and Behavioral Sciences, 2nd ed.; Sage Publishing: London, UK, 2020. [Google Scholar]
- Weisner, T.S. Discovering Successful Pathways in Children’s Development: Mixed Methods in the Study of Childhood and Family Life; University of Chicago Press: Chicago, IL, USA, 2005. [Google Scholar]
- De Laine, M. Fieldwork, Participation and Practice; SAGE: London, UK, 2000. [Google Scholar]
- Bryman, A. Social Research Methods, 5th ed.; Oxford University Press: Oxford, UK, 2015. [Google Scholar]
- Brown, L. Energy Cultures: An Approach to Explore Workplace Energy Use at Multiple Scales. Ph.D. Thesis, University of Central Lancashire, Preston, UK, 2017. [Google Scholar]
- Bryman, A. Social Research Methods, 4th ed.; Oxford University Press: Oxford, UK, 2012. [Google Scholar]
- Tabachnick, B.G.; Fidell, L.S. Using Multivariate Statistics, 6th ed.; Pearson: London, UK, 2013. [Google Scholar]
- Field, A.; Gaitanou, C. Discovering Statistics Using SPSS; Sage Publications: London, UK, 2009; Volume 3. [Google Scholar]
- Comrey, A.L.; Lee, H.B. A First Course in Factor Analysis, 2nd ed.; Psychology Press: New York, NY, USA, 1992. [Google Scholar]
- Martin, J. Organizational Behaviour and Management, 3rd ed.; Thomson Learning: London, UK, 2005. [Google Scholar]
- Mullins, L. Management and Organisational Behaviour, 8th ed.; Prentice Hall Financial Times: Harlow, UK, 2007. [Google Scholar]
- Unsworth, K.L.; Dmitrieva, A.; Adriasola, E. Changing behaviour: Increasing the effectiveness of workplace interventions in creating pro-environmental behaviour change. J. Organ. Behav. 2012, 34, 211–229. [Google Scholar] [CrossRef]
- Geels, F.W. Technological transitions as evolutionary reconfiguration processes: A multi-level perspective and a case-study. Res. Policy 2002, 31, 1257–1274. [Google Scholar] [CrossRef]
- Tudor, T.; Barr, S.; Gilg, A. A Tale of Two Locational Settings: Is There a Link Between Pro-Environmental Behaviour at Work and at Home? Local Environ. 2007, 12, 409–421. [Google Scholar] [CrossRef]
- Axon, C.J.; Bright, S.J.; Dixon, T.J.; Janda, K.B.; Kolokotroni, M. Building communities: Reducing energy use in tenanted commercial property. Build. Res. Inf. 2012, 40, 461–472. [Google Scholar] [CrossRef]
- Stiles, S.; Ryan, B.; Golightly, D. Readiness to Change: Perceptions of Safety Culture up and down the Supply Chain. In Proceedings of the 20th Congress of the International Ergonomics Association (IEA 2018), Florence, Italy, 26–30 August 2018; Bagnara, S., Tartaglia, R., Albolino, S., Alexander, T., Fujita, Y., Eds.; Springer International Publishing: Cham, Switzerland, 2019; pp. 213–223. [Google Scholar]
- Musonda, I.; Lusenga, E.; Okoro, C. Rating and characterization of an organization’s safety culture to improve performance. Int. J. Constr. Manag. 2018, 21, 181–193. [Google Scholar] [CrossRef]
- Jean, M.S.; Zaleschuk, L.P. Safety Culture Assessment and Continuous Monitoring Approach. In Proceedings of the 2018 12th International Pipeline Conference, Calgary, AB, Canada, 24–28 September 2018. [Google Scholar]
- Lee, J. Safety culture evaluation model at construction site. Int. J. Eng. Res. Technol. 2019, 12, 1972–1977. [Google Scholar]
- Zwetsloot, G.I.J.M.; van Middelaar, J.; van der Beek, D. Repeated assessment of process safety culture in major hazard industries in the Rotterdam region (The Netherlands). J. Clean. Prod. 2020, 257, 120540. [Google Scholar] [CrossRef]


| Group | α | Questions | λ | % Cumulative Variance |
|---|---|---|---|---|
| 1—Employee attitudes and subjective norms | 0.89 | Q10b Within my specific work team we are conscious of our energy use | 0.77 | 20.60% |
| Q10d Within my work environment energy use and demand are discussed regularly | 0.72 | |||
| Q10e I discuss ways to reduce energy use and demand with my work colleagues | 0.70 | |||
| Q10c Within my specific work team we regularly try to reduce our energy use | 0.69 | |||
| Q10h I would be well thought of by my colleagues if I took action to save energy at work | 0.69 | |||
| Q10a My line manager influences my energy use | 0.64 | |||
| Q10g I would be well thought of by my line manager if I took actions to save energy at work | 0.63 | |||
| Q10f Colleagues within my work environment support the need to reduce energy use | 0.61 | |||
| 2—Employee energy suggestions and feedback | 0.97 | Q9h If I make a suggestion on how to reduce energy use and demand it will be taken seriously | 0.95 | 29.77% |
| Q9i If I make a suggestion, I will receive a response detailing any changes or reasons for not implementing the suggestion | 0.95 | |||
| Q9j Employees are encouraged to make suggestions which can reduce energy use and demand | 0.93 | |||
| Q9g If I have a suggestion on how to reduce energy use and demand at work I know who to speak to | 0.89 | |||
| 3—Concern of business energy use, demand and cost | 0.78 | Q9c Reducing energy demand should be a higher priority for the business | 0.73 | 38.44% |
| Q9a Energy demand is an important issue for the business | 0.69 | |||
| Q9d Reducing energy use should be a higher priority for the business | 0.69 | |||
| Q9b Energy use is an important issue for the business | 0.64 | |||
| Q13a I am concerned about the cost of energy to the business | 0.42 | |||
| 4—Home Energy Practices | 0.89 | Q14e At home I always make an effort to reduce energy use | 0.75 | 43.64% |
| Q14c At home I always leave electrical goods off at the mains socket when not in use | 0.63 | |||
| Q15a At home I am concerned about rising energy prices | 0.56 | |||
| Q14a At home I always turn lights off after I leave a room | 0.54 | |||
| Q13b I am concerned that rising energy costs will affect my day-to-day tasks | 0.46 | |||
| Q15b At home rising costs have affected my day-to-day tasks | 0.46 | |||
| 5—Workplace Energy Reduction Practices | 0.80 | Q12a At work I always turn equipment, which I personally use, off after I have finished using it | 0.85 | 48.06% |
| Q12b At work I always turn equipment off at the end of the day/shift | 0.81 | |||
| Q12d At work I always make an effort to reduce energy use within the workplace | 0.54 | |||
| Q12c At work, if I am the only person in an area, I always turn lights off after I leave that area | 0.44 | |||
| 6—Workplace Energy Reduction Knowledge | 0.70 | Q13f It is clear to me who is responsible for switching off the lights | 0.74 | 51.04% |
| Q13e It is clear to me who is responsible for switching machines/equipment off during downtimes | 0.60 | |||
| Q13g If I wanted to turn equipment/machines off in my work area I know where the relevant switches are | 0.44 | |||
| 7—Workplace Energy Approaches | 0.78 | Q8b I have received enough training on energy saving at work | 0.67 | 53.67% |
| Q8a I get enough supervision and guidance on saving energy at work | 0.65 | |||
| Q9f It is clear to me what the business are doing to reduce energy use and demand | 0.49 | |||
| Q8c I know the amount of energy my team/department use | 0.41 | |||
| 8—Role of the SHE function | 0.74 | Q1da The SHE function influence how I use energy in work | 0.68 | 56.21% |
| Q1db I associate energy related topics with the SHE function | 0.65 |
| Group | Area | SS Mean | SD | SEM | M | U | p | Z |
|---|---|---|---|---|---|---|---|---|
| 1—Employee attitudes and subjective norms | Office | 2.917 | 0.770 | 0.703 | 2.875 | n/a | n/a | n/a |
| Manufacturing | 2.710 | 0.574 | 0.049 | 2.750 | ||||
| 2—Employee energy suggestions and feedback | Office | 3.398 | 0.654 | 0.060 | 3.500 | 6049.5 | <0.001 | −3.602 |
| Manufacturing | 3.088 | 0.628 | 0.054 | 3.250 | ||||
| 3—Concern of business energy use, demand and cost | Office | 4.160 | 0.549 | 0.050 | 4.000 | 7269.5 | 0.128 | −1.521 |
| Manufacturing | 4.060 | 0.492 | 0.042 | 4.000 | ||||
| 4—Home Energy Practices | Office | 3.654 | 0.654 | 0.060 | 3.667 | 8407.0 | 0.675 | 0.419 |
| Manufacturing | 3.677 | 0.656 | 0.056 | 3.667 | ||||
| 5—Workplace Energy Reduction Practices | Office | 3.447 | 0.535 | 0.049 | 3.600 | 6966.0 | 0.041 | −2.043 |
| Manufacturing | 3.297 | 0.606 | 0.052 | 3.400 | ||||
| 6—Workplace Energy Reduction Knowledge | Office | 3.669 | 0.700 | 0.064 | 3.667 | 5846.5 | <0.001 | −3.972 |
| Manufacturing | 3.311 | 0.798 | 0.068 | 3.333 | ||||
| 7—Business approach to energy topics | Office | 2.971 | 0.649 | 0.062 | 3.000 | 5365.0 | <0.001 | −4.758 |
| Manufacturing | 2.538 | 0.630 | 0.054 | 2.500 | ||||
| 8—Role of the SHE function | Office | 3.492 | 0.855 | 0.078 | 3.500 | 5935.0 | <0.001 | −3.840 |
| Manufacturing | 3.337 | 0.782 | 0.067 | 3.000 |
Disclaimer/Publisher’s Note: The statements, opinions and data contained in all publications are solely those of the individual author(s) and contributor(s) and not of MDPI and/or the editor(s). MDPI and/or the editor(s) disclaim responsibility for any injury to people or property resulting from any ideas, methods, instructions or products referred to in the content. |
© 2024 by the author. Licensee MDPI, Basel, Switzerland. This article is an open access article distributed under the terms and conditions of the Creative Commons Attribution (CC BY) license (https://creativecommons.org/licenses/by/4.0/).
Share and Cite
Brown, L. Workplace Energy Culture Framework: A Mixed Methods Study Examining Differences in Energy Use and Behaviours within an Industrial Workplace. Sustainability 2024, 16, 3072. https://doi.org/10.3390/su16073072
Brown L. Workplace Energy Culture Framework: A Mixed Methods Study Examining Differences in Energy Use and Behaviours within an Industrial Workplace. Sustainability. 2024; 16(7):3072. https://doi.org/10.3390/su16073072
Chicago/Turabian StyleBrown, Llinos. 2024. "Workplace Energy Culture Framework: A Mixed Methods Study Examining Differences in Energy Use and Behaviours within an Industrial Workplace" Sustainability 16, no. 7: 3072. https://doi.org/10.3390/su16073072
APA StyleBrown, L. (2024). Workplace Energy Culture Framework: A Mixed Methods Study Examining Differences in Energy Use and Behaviours within an Industrial Workplace. Sustainability, 16(7), 3072. https://doi.org/10.3390/su16073072