Article

Differences in CEO Communication Strategies between High- and Low-Performing Firms in the Global Auto Parts Industry

1
Graduate School of Management of Technology, Sungkyunkwan University, Suwon 16419, Republic of Korea
2
Department of Systems Management Engineering, Graduate School of Management of Technology, Sungkyunkwan University, Suwon 16419, Republic of Korea
*
Author to whom correspondence should be addressed.
Sustainability 2024, 16(8), 3100; https://doi.org/10.3390/su16083100
Submission received: 24 February 2024 / Revised: 21 March 2024 / Accepted: 7 April 2024 / Published: 9 April 2024
(This article belongs to the Section Economic and Business Aspects of Sustainability)

Abstract

:
This study focuses on how global automotive suppliers manage innovation by analyzing keywords in CEO messages. Given that CEOs significantly shape innovation strategy, the intricate dynamics of open innovation and the role of CEO characteristics in its adoption warrant further investigation. Accordingly, the research unfolds in three stages: (1) extracting keywords related to innovation highlighted in CEO communications, (2) contrasting the deployment of these keywords between high-performing and low-performing companies, and (3) deciphering the nuances of innovation management by interpreting the underlying meaning and structure of these keywords. This comparative analysis between top and bottom performers underscores stark contrasts in keyword emphasis. Through eigenvector centrality, mapping open innovation’s success factors pinpointed provision of resources and governance as pivotal in top-performing firms. Notably, the preferred keywords among leading firms reflect their current challenges and innovative management direction. Thus, to embody agile and visionary leadership in open innovation, CEOs should strategically incorporate and highlight keywords aligned with critical factors of open innovation in their communications. These insights offer valuable benchmarks for less successful firms aiming to refine their approaches to innovation management, vision, and strategy.

1. Introduction

The chief executive officer (CEO) of a company is the organization’s leader, and the decisions and messages they deliver to the organization represent the company’s values, philosophy, and direction, and provide guidelines for employees to follow [1]. Since the CEO is responsible for the performance of the organization, they must make decisions and actually pursue their implementation to ensure its growth and development [2]. Therefore, CEOs are required to possess vision-setting, strategy-setting, and leadership competencies to achieve high performance [3].
Through the sustainability report, the CEO communicates messages to stakeholders about the organization’s current state and future strategic direction. The CEO also communicates the vision and long-term strategy the company intends to execute and defines its culture and values. The CEO’s message is a legally accountable document that represents the public company’s position, not the individual’s private opinions. These messages are carefully crafted and detailed, from the choice of keywords to the content they convey [4]. Furthermore, these messages are a great way to obtain a sense of the CEO’s leadership, management philosophy, and strategy [5].
Research on CEO messages has been conducted in various fields including finance, accounting, construction, insurance, and the automotive industry [6,7,8,9,10,11,12].
While earlier studies focused on analyzing the characteristics of individual keywords, recent research has examined both keywords and the networks they form. This approach involves visualizing and integrating these networks to analyze their interconnections and associations [13,14,15]. This is because recent improvements in software technology and algorithms have enabled research using text mining analysis methods [13].
The automotive industry, in particular, is undergoing a paradigm shift from a traditional internal combustion engine-centric manufacturing industry to a software-centric convergence industry due to the ongoing technological changes worldwide [16]. In addition, companies in other industries with software and ICT strengths continue to enter the market, as they look for the next growth engine in the automotive industry. Furthermore, the competition between companies is becoming more intense [17].
The upper echelon theory (UET) literature has shown that CEO perceptions are a critical component of a firm’s innovation strategy [18].
As such, CEOs seek to gain competitive advantage through technological innovation in the management of their companies, which can lead to sustained growth and improved business performance [19]. Studies have shown a positive relationship between technological innovation and firm value, managerial performance, and competitive advantage [20]. Accordingly, based on open innovation factors, this study aims to analyze CEO’s willingness and innovation management characteristics through mapping and classification.
Therefore, the flow of this study is as follows. First, CEO messages of global auto parts companies are collected, and the keywords of high-performing (upper group) and low-performing (lower group) companies are derived based on an eigenvector centrality analysis. Second, the characteristics of the upper and lower group keywords are compared with the keywords reflecting the actual business environment. Third, the extracted keywords are compared to the nine success factors of open innovation described in the existing literature [21] to visualize the network and analyze the performance of the upper and lower groups. Fourth, the characteristics of innovation management are compared by visualizing the network and implications and applications are suggested. This paper is structured as follows: Section 2 conducts a review of the literature, delineating the distinctions between previous studies and this research. Section 3 elaborates on the methodologies employed in this investigation, specifically text mining, network analysis, and factor mapping, encompassing stages from data collection to analysis. Section 4 unveils the findings, including centrality analysis results, a keyword list derived from weight-based classification, and visual representations to elucidate differences between the upper and lower performance groups. Section 5 explores the salient features of the identified keywords and their network configurations. Conclusively, Chapter 6 discusses the limitations encountered in this study and outlines avenues for subsequent research.

2. Literature Review

2.1. Trends in CEO Communication Research

This study on CEO messages aims to understand and characterize the relationship between the messages communicated and the firm’s business performance [10]. A comparative study between the upper- and lower-performing groups can provide significant implications for companies [10]. For example, Kohut et al. [22] analyzed the length of messages for 25 companies at the upper and lower ends of Fortune 500 companies, finding a significant correlation between high and low return on equity (ROE). Furthermore, Clatworthy et al. [23] analyzed CEO messages in the annual reports of 30 profitable and 30 unprofitable companies in the UK and examined the readability of each group. The more profitable companies tended to discuss acquisitions, divestitures, and performance, while the less profitable ones discussed board changes. Clatworthy et al. [24] also analyzed CEO messages from 100 high- and low-profit firms to examine the relationship between a firm’s financial statements and the textual characteristics of CEO messages. The results show that the CEOs of low-profit companies are more focused on communicating the company’s image and future rather than the current story. Similarly, Hammami [25] analyzed the annual reports of the upper 20 and lower 20 performers of 159 Italian companies. The results show that the lower-ranked companies overuse positive keywords and make intentional text choices. Laskin [26] analyzed the annual reports of six companies from each of the ten sectors (healthcare, telecommunications, etc.) in the S&P 500 to compare the narrative strategies of outperforming and underperforming companies [26]. Comparing the strategies of the upper and lower three firms, they found that both the upper- and lower-performing firms frame their messages with positive keywords.
Despite providing interesting insights into how certain executive characteristics manifest in innovation performance, research to date has often focused on a narrow set of CEO characteristics that constrain behavior to a limited range of innovation outcomes [27].
Keun-Hyo [4] studied the linguistic characteristics of CEO messages in sustainability reports and linked them to sustainability performance from various perspectives. He found that the lower the sustainability performance, the less readable the message, the more positive the language, and the more emphasis on future performance.
Similar studies have analyzed the network of CEO messages. These analyzed the frequency of occurrence of keywords used in speeches by politicians or presidential candidates, and the co-occurrence and association of keywords to investigate policies and strategies, core promises, and so on [28,29,30]. In the early studies, the meaning was mainly found by analyzing the characteristics of the keywords themselves, but as the amount of information gradually increased and software technology and various algorithms were developed, an integrated analysis was attempted using keyword analysis-based network analysis [14,15,22]. Network analysis can be more effectively judged and used when interpreting information and relationships with high visibility through visualization [31].

2.2. Trends in Innovation Management Research

Research related to innovation management extends to the definition and methods of open innovation, innovativeness, and firm performance related to open innovation [32]. Open innovation refers to the active utilization of external ideas and technologies and the transfer of internal technological resources to improve firm performance [33,34]. Open innovation activities are becoming an important strategy and means of differentiation for companies to gain a sustainable competitive advantage [35].
The CEO’s commitment to technological innovation plays an important catalytic role in driving innovation from the earliest stages. The CEO wants to lead technological innovation by leveraging the company’s technological capabilities to gain a sustainable competitive advantage in response to changes in the internal and external environment. Therefore, the CEO’s willingness to innovate has a significant impact on decision-making in the organization [36]. Technological innovation refers to the improvement of existing products or the creation of new products and services by applying new technologies to corporate activities [37]. To this end, firms introduce new products and processes to meet their customers’ needs, enhance their competitiveness, and improve the profitability of the firm [38]. Here, technological innovation is an important driving force to increase the valuation of a company and to achieve managerial performance by gaining a competitive advantage [39].
The CEO sets the vision and strategy for the company and focuses the organization’s efforts on technological innovation [40]. Prior research on CEOs’ strategic leadership in relation to technological innovation is dominated by studies that analyze the relationship between demographic variables and performance, relationship between CEO characteristics and decision-making, and components of strategic leadership [41]. Elenkov et al. [42] empirically found that the CEO’s exercise of strategic leadership increases the firm’s innovation activities and improves its performance, and that strategic leadership has a defining influence on technological innovation. Young-Joe [40] found that strategic leadership is the most influential factor in driving technological innovation.
Research on CEO attention shows that companies led by forward-thinking CEOs are quicker to spot technology and market trends and have higher and faster new product adoption rates [43].
Previous studies on the relationship between technological innovation and firm performance empirically investigated domestic firms to determine any relation between innovation and financial performance [44]. They found that corporate innovation can be considered an important factor affecting financial performance [45].

2.3. The Uniqueness of the Current Study

Based on a review of the existing literature, not many studies analyze the relationship between innovation management leadership and CEO messages. Thus, in this study, this relationship is analyzed from an innovation management perspective, differing from previous studies that focused on financial performance. Additionally, studies analyzing CEOs’ innovation management leadership have relied on qualitative research or survey methods.
In addition, while existing research on open innovation focuses on traditional innovation, such as internal R&D, there is still a lack of research on the impact of CEOs on openness.
Compared to previous studies, this one is characterized by the following features: (1) This study approached the innovation management aspect of the automotive industry, where there has been a lack of research on CEO messages; (2) to identify important keywords, those related to innovation were derived from CEO messages that reflect the actual business environment, rather than from the existing research literature; (3) data were collected by text mining and analyzed as a network; (4) to simplify and objectify the network analysis, the network was structured and analyzed by mapping between keywords and factors, deriving innovation management characteristics through a focus on factors rather than keywords; (5) open innovation factors with high impact and small factors, as well as structurally strong factors, are distinguished; (6) the innovation-related keywords derived from previous studies were compared with those emphasized by the CEOs of the analyzed companies.

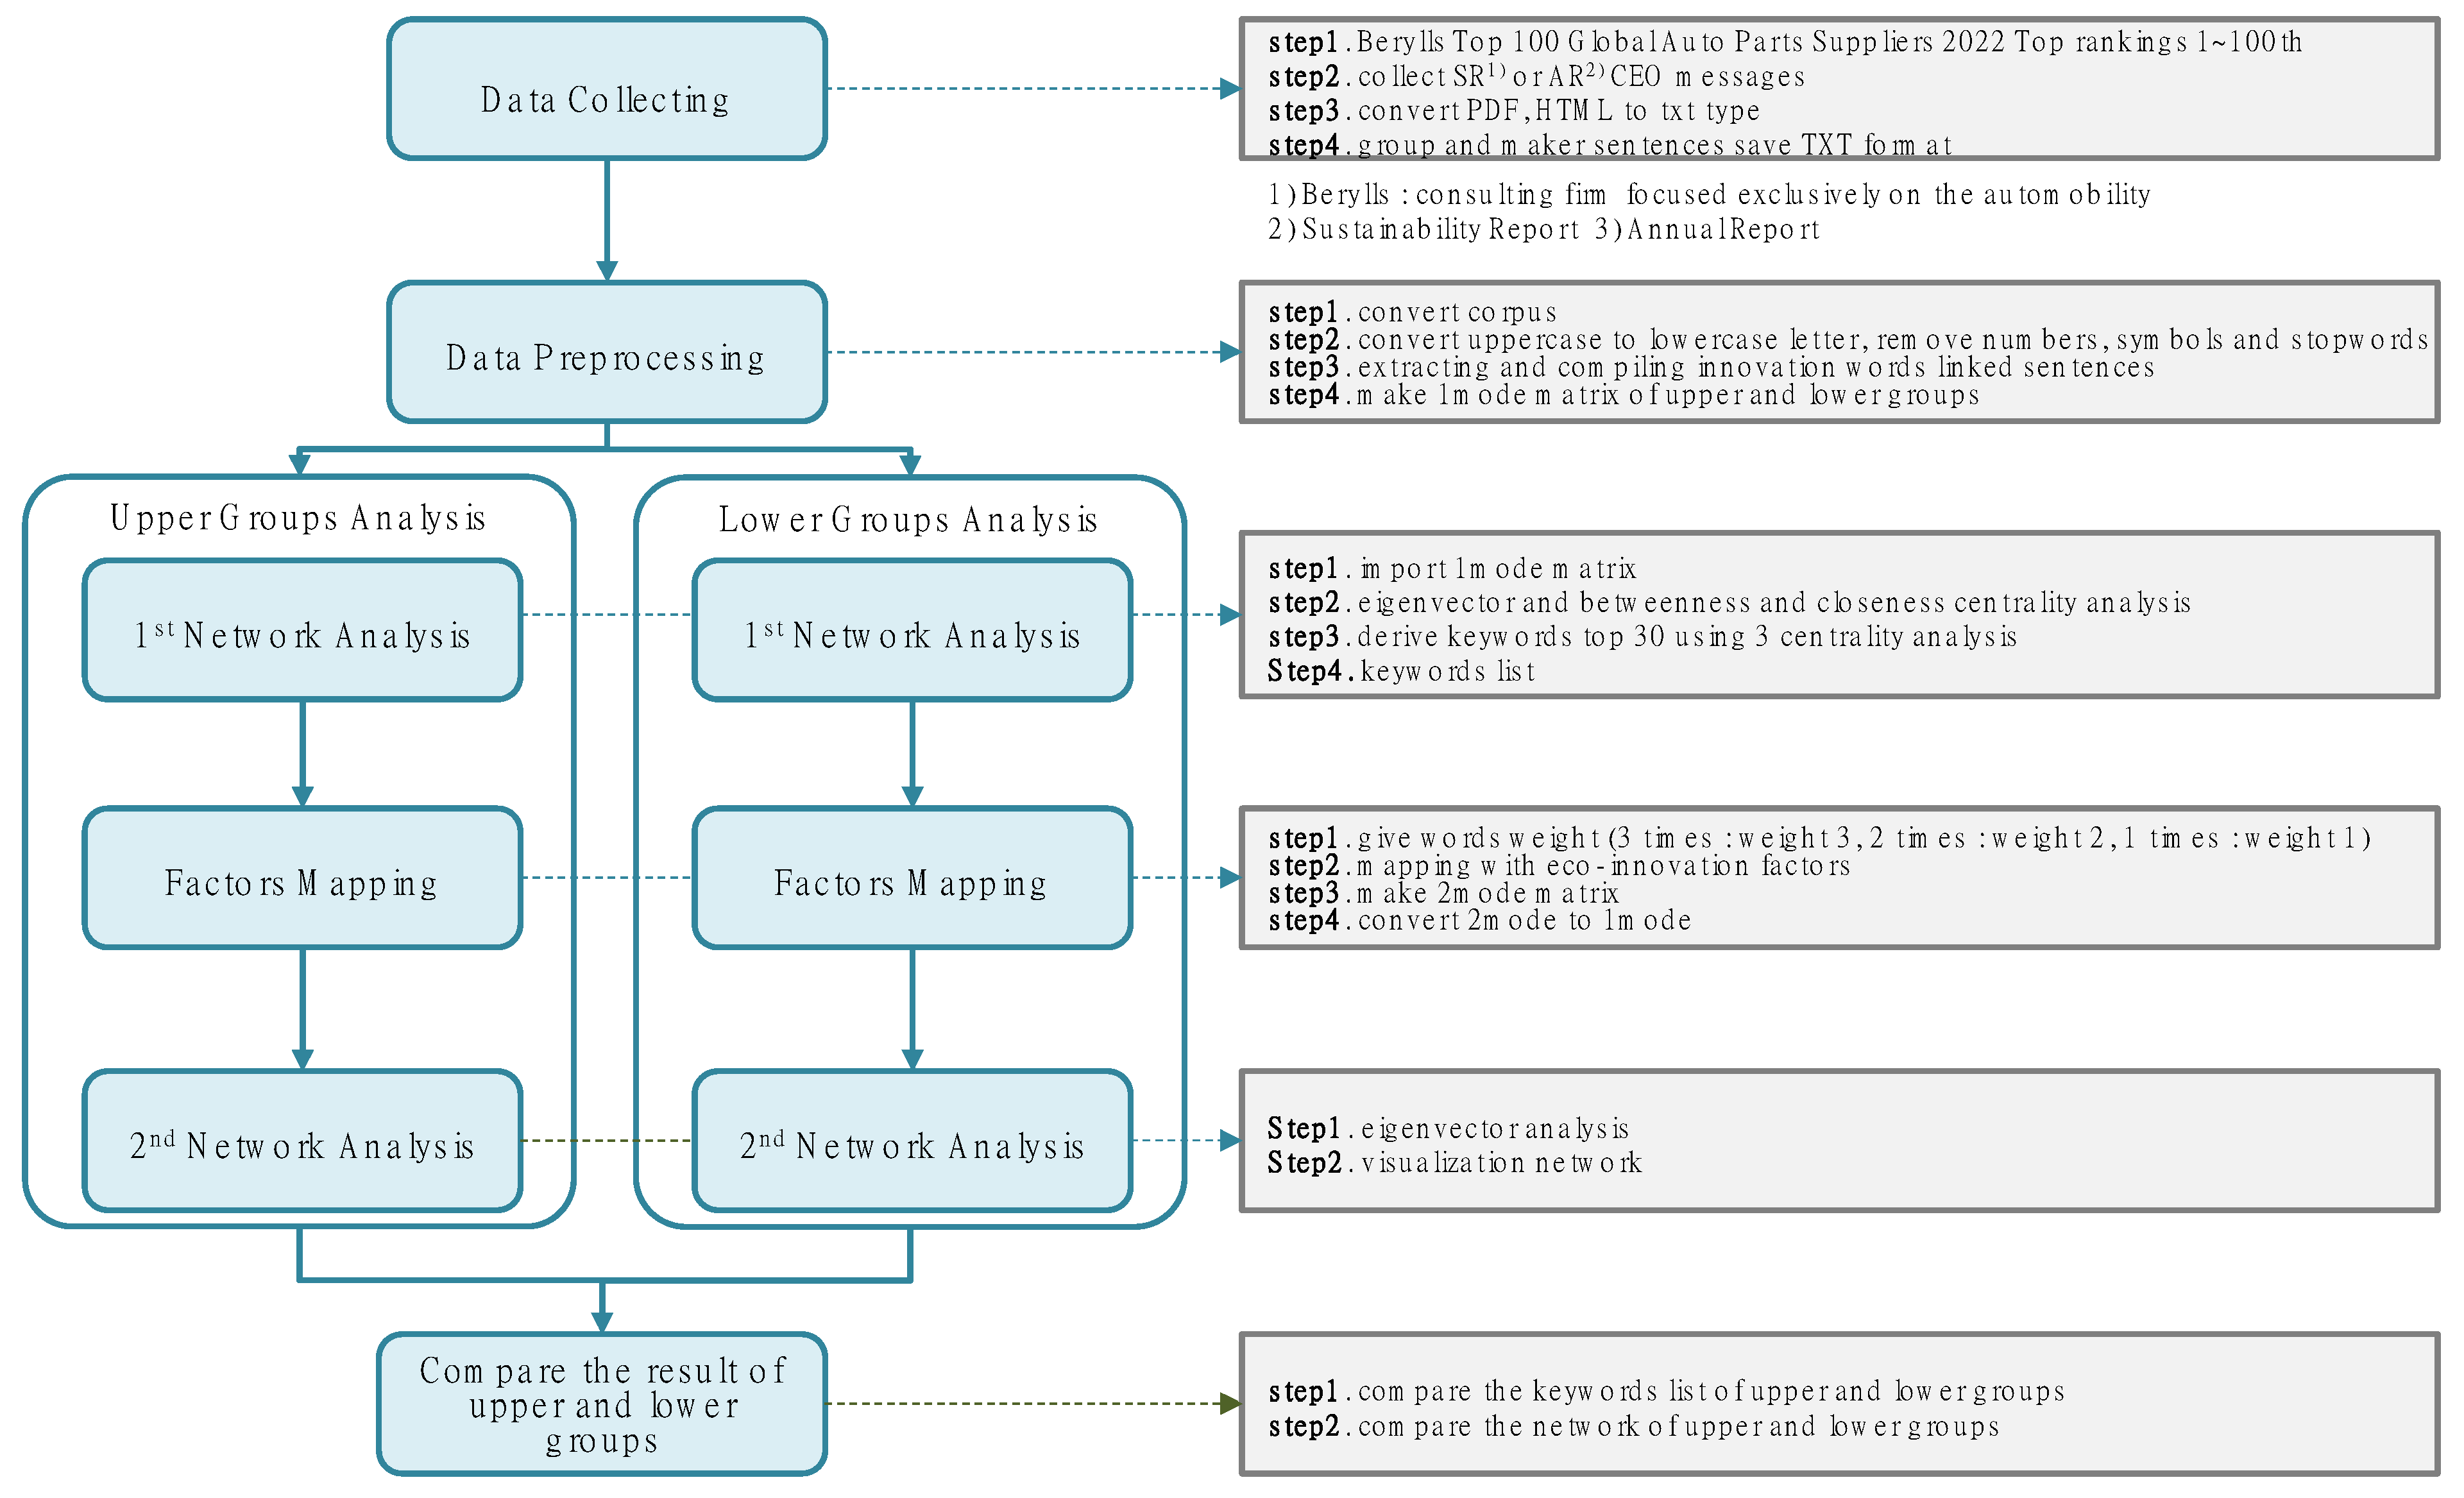
3. Materials and Methods

3.1. Data Collection

The global auto parts companies analyzed were selected from published data from Berylls, Germany. Berylls is a German-based consulting firm specializing in the automotive and mobility industry. Since 2012, Berylls has published a ranking of the top 100 global auto parts companies by revenue. Various studies on the auto parts industry have used these data. In addition, this study employs Berylls’ Top 100 list as a basis for selecting auto parts companies.
To collect CEO messages from this list of companies, two characteristics were considered. First, the CEO message should cover the company as a whole, so that it is not biased toward a specific area. Second, it was considered whether the CEO message was issued in light of the company’s recent business environment. We found that CEO messages in the first half of both the sustainability and annual report fulfill these characteristics [46,47]. The difference between the two reports is whether they include information on financial performance, although the overall characteristics are similar.
The CEO message provides a measure of the company’s economic, environmental, and social performance for the year in question, as well as on its position, strategy, and leadership [46,48]. It is written in language that is understandable to all to clearly convey the company’s financial and non-financial performance of the previous year and image [49]. Specifically, the sustainability report follows standardized reporting guidelines by the Global Reporting Initiative (GRI) to ensure that the positive and negative aspects of a company’s sustainability performance are not omitted [46].
Since the revenue performance of the Berylls Global Top 100 companies ranked in this study is based on the performance of 2021, the annual or sustainability report with the performance of 2021 was selected. Since publishing reports is not a legal requirement for companies, the sustainability, or annual reports available for each company were collected. The websites of each company were visited, and the full text of the CEO message from the annual or sustainability report was extracted. The PDFs were then converted to TXT format, and the process was repeated to create a full-text TXT file of the CEO’s message.
The upper and lower groups were distinguished based on Laskin’s study [26], using the condition of the entire sample data for the distinction. Based on the average sales of the Top 100 companies, 30 with higher sales than the overall average were selected as the upper group, and 70 with lower sales than the overall average as the lower group.

3.2. Data Preprocessing

Information collected in text format is unstructured data in the form of characters. To analyze unstructured data, they are preprocessed using text mining techniques [50]. In this study, the data analysis and preprocessing for text mining were conducted using R version 4.2.3, a widely utilized programming language renowned for its comprehensive data analysis capabilities. R offers an integrated environment that encompasses data manipulation, computational, and graphical functions, making it an ideal choice for building a robust data preprocessing and analysis framework for text mining. Essential to this study’s methodology are the natural language processing (NLP) package, which facilitates the processing of human language data, and the ‘tm’ package, specifically designed for text mining tasks. The ‘tm’ package notably supports the creation of a text corpus, enabling the reading and incorporation of documents in a variety of formats, including XML and PDF, among others [51].
In this study, R version 4.2.3 was used for data preprocessing with the tm package, which is based on natural language processing, which is mainly used for text mining.
First, we create a corpus of whole sentences word-by-word. The corpus is then converted into meaningful sentences by removing meaningless numbers and symbols; articles and prepositions such as “a”, “an”, “of”, and “for”; and modal verbs (will), adverbs (also, now, and even), and words with no analytic meaning. The Top 100 company names, “one”, “year”, “new”, and “zero” were excluded, because they were considered words without analytic meaning. In addition, “order”, “part”, and “terms” were used as idiomatic expressions (in order to, as part of, in terms of); thus, we excluded them as they have no analytical meaning [10].
Full sentences that included the term “innovation” or terms similar to “innovation” were identified and selected to broaden the scope of gathered terms. Lee and Yi [52] have identified “change” as terms that closely relate to “innovation”. Additionally, “change”, “reform”, and “revolution” were recognized to share a concept similar to “innovation.” Therefore, sentences featuring “innovation” or its synonyms “change”, “reform”, and “revolution” were singled out, leading to the creation of a unified TXT file. From this file, both keywords and their frequencies were extracted to produce comma-separated values (CSV) formatted as a data frame.
For the network analysis, we used as.matrix and TermDocumentMatrix to create a csv file in the form of a data frame by converting it into a one-mode matrix where both rows and columns are represented by words [53].

3.3. First Network Analysis

Language network analysis is an in-depth approach that goes beyond traditional text analysis techniques to explore the interrelationships between words and the structural patterns they form [53]. Instead of focusing on the frequency of occurrence of words, this method analyzes the hidden context of language through the connections between words. In network analysis, words are represented by nodes and the relationships between them by links, which is the same structure as social network analysis techniques. Centrality analysis is an important methodology for quantitatively measuring the influence and position of each word within a network [53]. This analysis is effective in identifying keywords located at the structural center of the network. High centrality of a word means it is relatively more mentioned in the network and has a close relationship with other words [54].
The software used for these analyses was Gephi Version 0.10.1, which has been used in many studies based on its strengths in visualization and open-source nature [55].
Since this study measures the relationship between and the importance of keywords in CEO message sentences, we do not analyze connection centrality, where only simple connections with nodes are considered. Rather, we focus on betweenness centrality, closeness centrality, and eigenvector centrality [54]. The extracted keywords were ranked from 1st to 30th based on the quantitative value of each centrality [10]. When deriving keywords from existing studies, the number of keywords is limited to less than 50. The top 30 keywords are extracted based on the centrality analysis, and duplicates are allowed to generate 47 keywords in the upper group and 46 in the lower group [10].

3.4. Factors Mapping

We derive keywords including duplicates by listing the top 30 values of betweenness, closeness, and eigenvector centrality, as mentioned. Then, based on the results of the three centrality analyses, words are weighted to measure the importance of a node. Words with all three centralities (betweenness, closeness, and eigenvector) are weighted 3, words with two centralities (betweenness and closeness, or betweenness and eigenvector, or closeness and eigenvector) are weighted 2, and words with one of the remaining three centralities are weighted 1.
After constructing a list of words with weights, we mapped and classified them with certain indicators to analyze the characteristics of the extracted words. The adoption of these metrics is based on the relevant research literature and trends and citation counts of Durst and Ståhle [21]. We adopted and employed the success factors for open innovation proposed by Durst and Ståhle [21]. There are nine of these success factors, listed as follows: (1) relational issues are general issues such as communication skills and trust; (2) the people involved in the open innovation process are the commitment and motivation of participants in the open innovation process; (3) governance is defined as the mechanism and structure of open innovation; (4) facilitator is defined as the role of facilitators to realize open innovation; (5) provision of resources refers to the allocation of time, manpower, and resources for open innovation; (6) strategy is the strategy for implementing open innovation; (7) open innovation process refers to the process of open innovation, which differs from that of closed innovation; (8) leadership refers to the leadership and management capabilities of the organization to drive open innovation; and finally, (9) culture refers to an organizational culture of open innovation, which differs from that of closed innovation.
We searched for sentences containing keywords and mapped the meaning of these keywords to open innovation factors by considering the dictionary meaning of the word and the context of the sentence before and after [12]. Each word was mapped to a maximum of three factors. If it was mapped to four or more factors, the factors with multiple mappings were prioritized to meet the three criteria. If multiple mappings did not lead to a priority, expert opinions were sought to meet the three criteria. To increase the objectivity of the factor mapping, we selected 6 experts with more than 10 years of experience in the domestic auto parts industry and open innovation roles and conducted interviews with them from 2 October to 29 November 2023. By synthesizing the mapping opinions of the experts, we finalized the factor mapping in order of priority.
The ultimate purpose of this study is to analyze the characteristics of innovation management by investigating the relationship between open innovation factors. Thus, for this, the different rows and columns in a binary matrix were transformed into a unitary matrix that can be classified as one object with the same rows and columns. This enabled the determining of their influence on each other using the “mmult” and TRANSPOSE functions of Microsoft Excel.

3.5. Second Network Analysis

In the first stage of network analysis, three centrality analyses were used to extract all the keywords that could be extracted in various ways such as being based on the central position of words in the network, association relationship, and proximity distance. In the second network analysis, eigenvector centrality was analyzed to identify the key nodes of open innovation factors. High eigenvector centrality indicates strong connectivity with the key nodes around it [56]. Similar studies attempted to use eigenvector centrality analysis to identify influential users based on data collected from Twitter [57]. They interpreted the networking and connectivity to key nodes for the nine success factors of open innovation. Eigenvector centrality analysis was used to visualize the characteristics of the success factors of open innovation and their relationships.

3.6. Results of the Upper and Lower Groups

We compared the keyword lists of the upper and lower groups based on eigenvector centrality. These results were visualized, and, finally, the relationship and main factors of innovation management characteristics, which is the ultimate purpose of this study, were compared through visual representation. Figure 1 illustrates the procedure and methodology of this study.

4. Results

Based on Laskin [26] and Choi and Cho [11] comparative studies of upper and lower groups, this study analyzed their frequency of innovation mentions, words claimed, and innovation management characteristics to identify and benchmark characteristics such as CEO disposition and willingness to innovate.
We extracted CEO messages from the annual and sustainability reports of 30 upper group and 70 lower group companies in each sample of the auto parts supply firms in our study.

4.1. Word-Based Network Analysis

In the upper group, 52 sentences contain the words “innovation”, “change”, “reform”, and “revolution”. Based on the analyses of betweenness, closeness, and eigenvector centrality, each high centrality value is listed up to the 30th position and summarized in Table 1. In total, 47 words were identified, excluding duplicates. Specifically, “mobility”, “future”, “sustainable”, and “technology” are the most important words, because their centrality values are in the top 10.
For the lower group, 46 sentences contain the words “innovation”, “change”, “reform”, and “revolution”. Based on the analyses of betweenness, closeness, and eigenvector centrality, each high centrality value is listed up to the 30th position and summarized in Table 2. In total, 46 words were derived, excluding duplicates. Most of the words ranked from 1 to 10 have all three centralities.

4.2. Weight Loading on the Words

For the upper group, we assigned weights based on the results of the centrality analysis of the derived words. Words with all three centralities in the top 30 were given weight 3, words with two centralities weight 2, and words with one of the three centralities weight 1 (Table 3).
For the lower groups, we also assigned weights based on the results of the centrality analysis of the derived words. Words with all three centralities in the top 30 were given weight 3, words with two centralities weight 2, and words with one of the three centralities weight 1 [10] (Table 4).

4.3. Mapping of Words with the Success Factors of Open Innovation

The factors in the upper group are weighted words. The results of mapping to the open innovation success indicators are shown in Table 5 for weight 3, Table 6 for weight 2, and Table 7 for weight 1.
The weighted words in the upper group and provision of resources were mapped 23 times, strategy 21 times, facilitators 19 times, and governance 18 times. The remaining factors were mapped 1–10 times, and all factors were mapped. The weight 3 factor mapping is dominated by the provision of resources and strategy factors.
The mapping of the lower group’s weighted words to the open innovation success factors is shown in Table 8 for weight 3, Table 9 for weight 2, and Table 10 for weight 1.
In the lower group, the weighted words process and leadership were mapped 23 times, strategy 18 times, governance 16 times, and facilitators 18 times. The remaining factors were mapped 1–10 times, and all factors were mapped. The weight 3 factor mappings are dominated by the leadership and strategy factors.

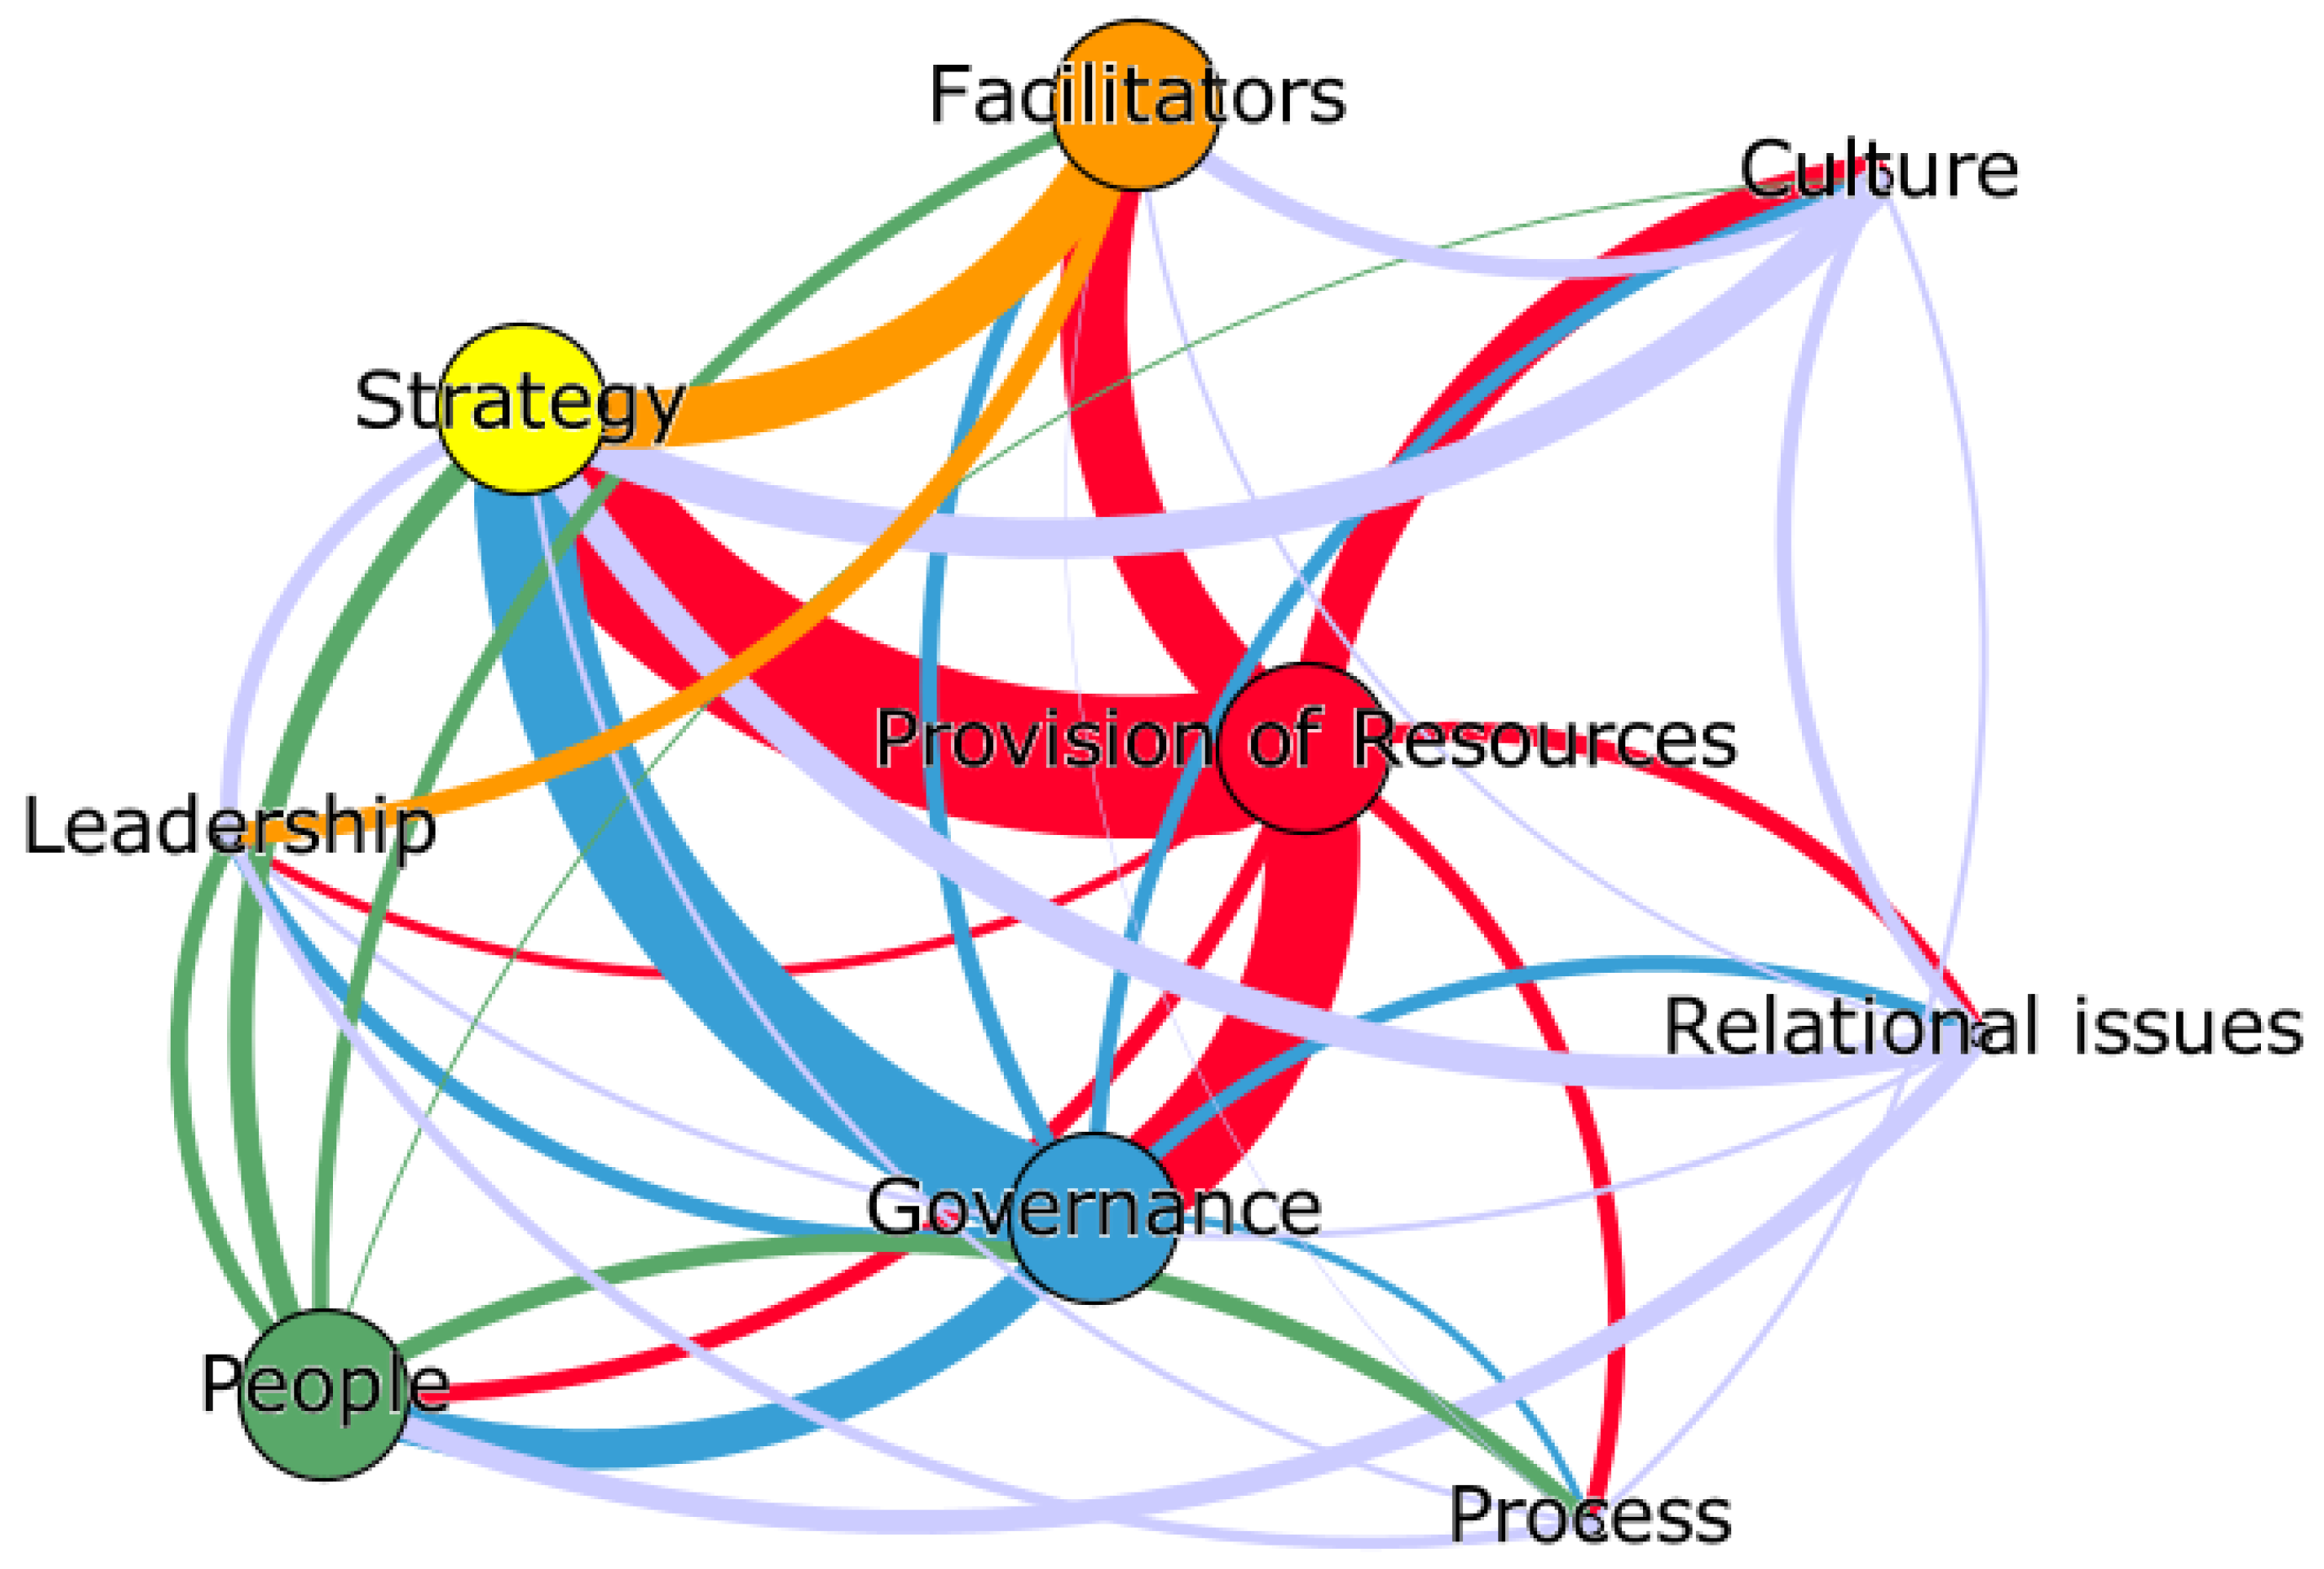
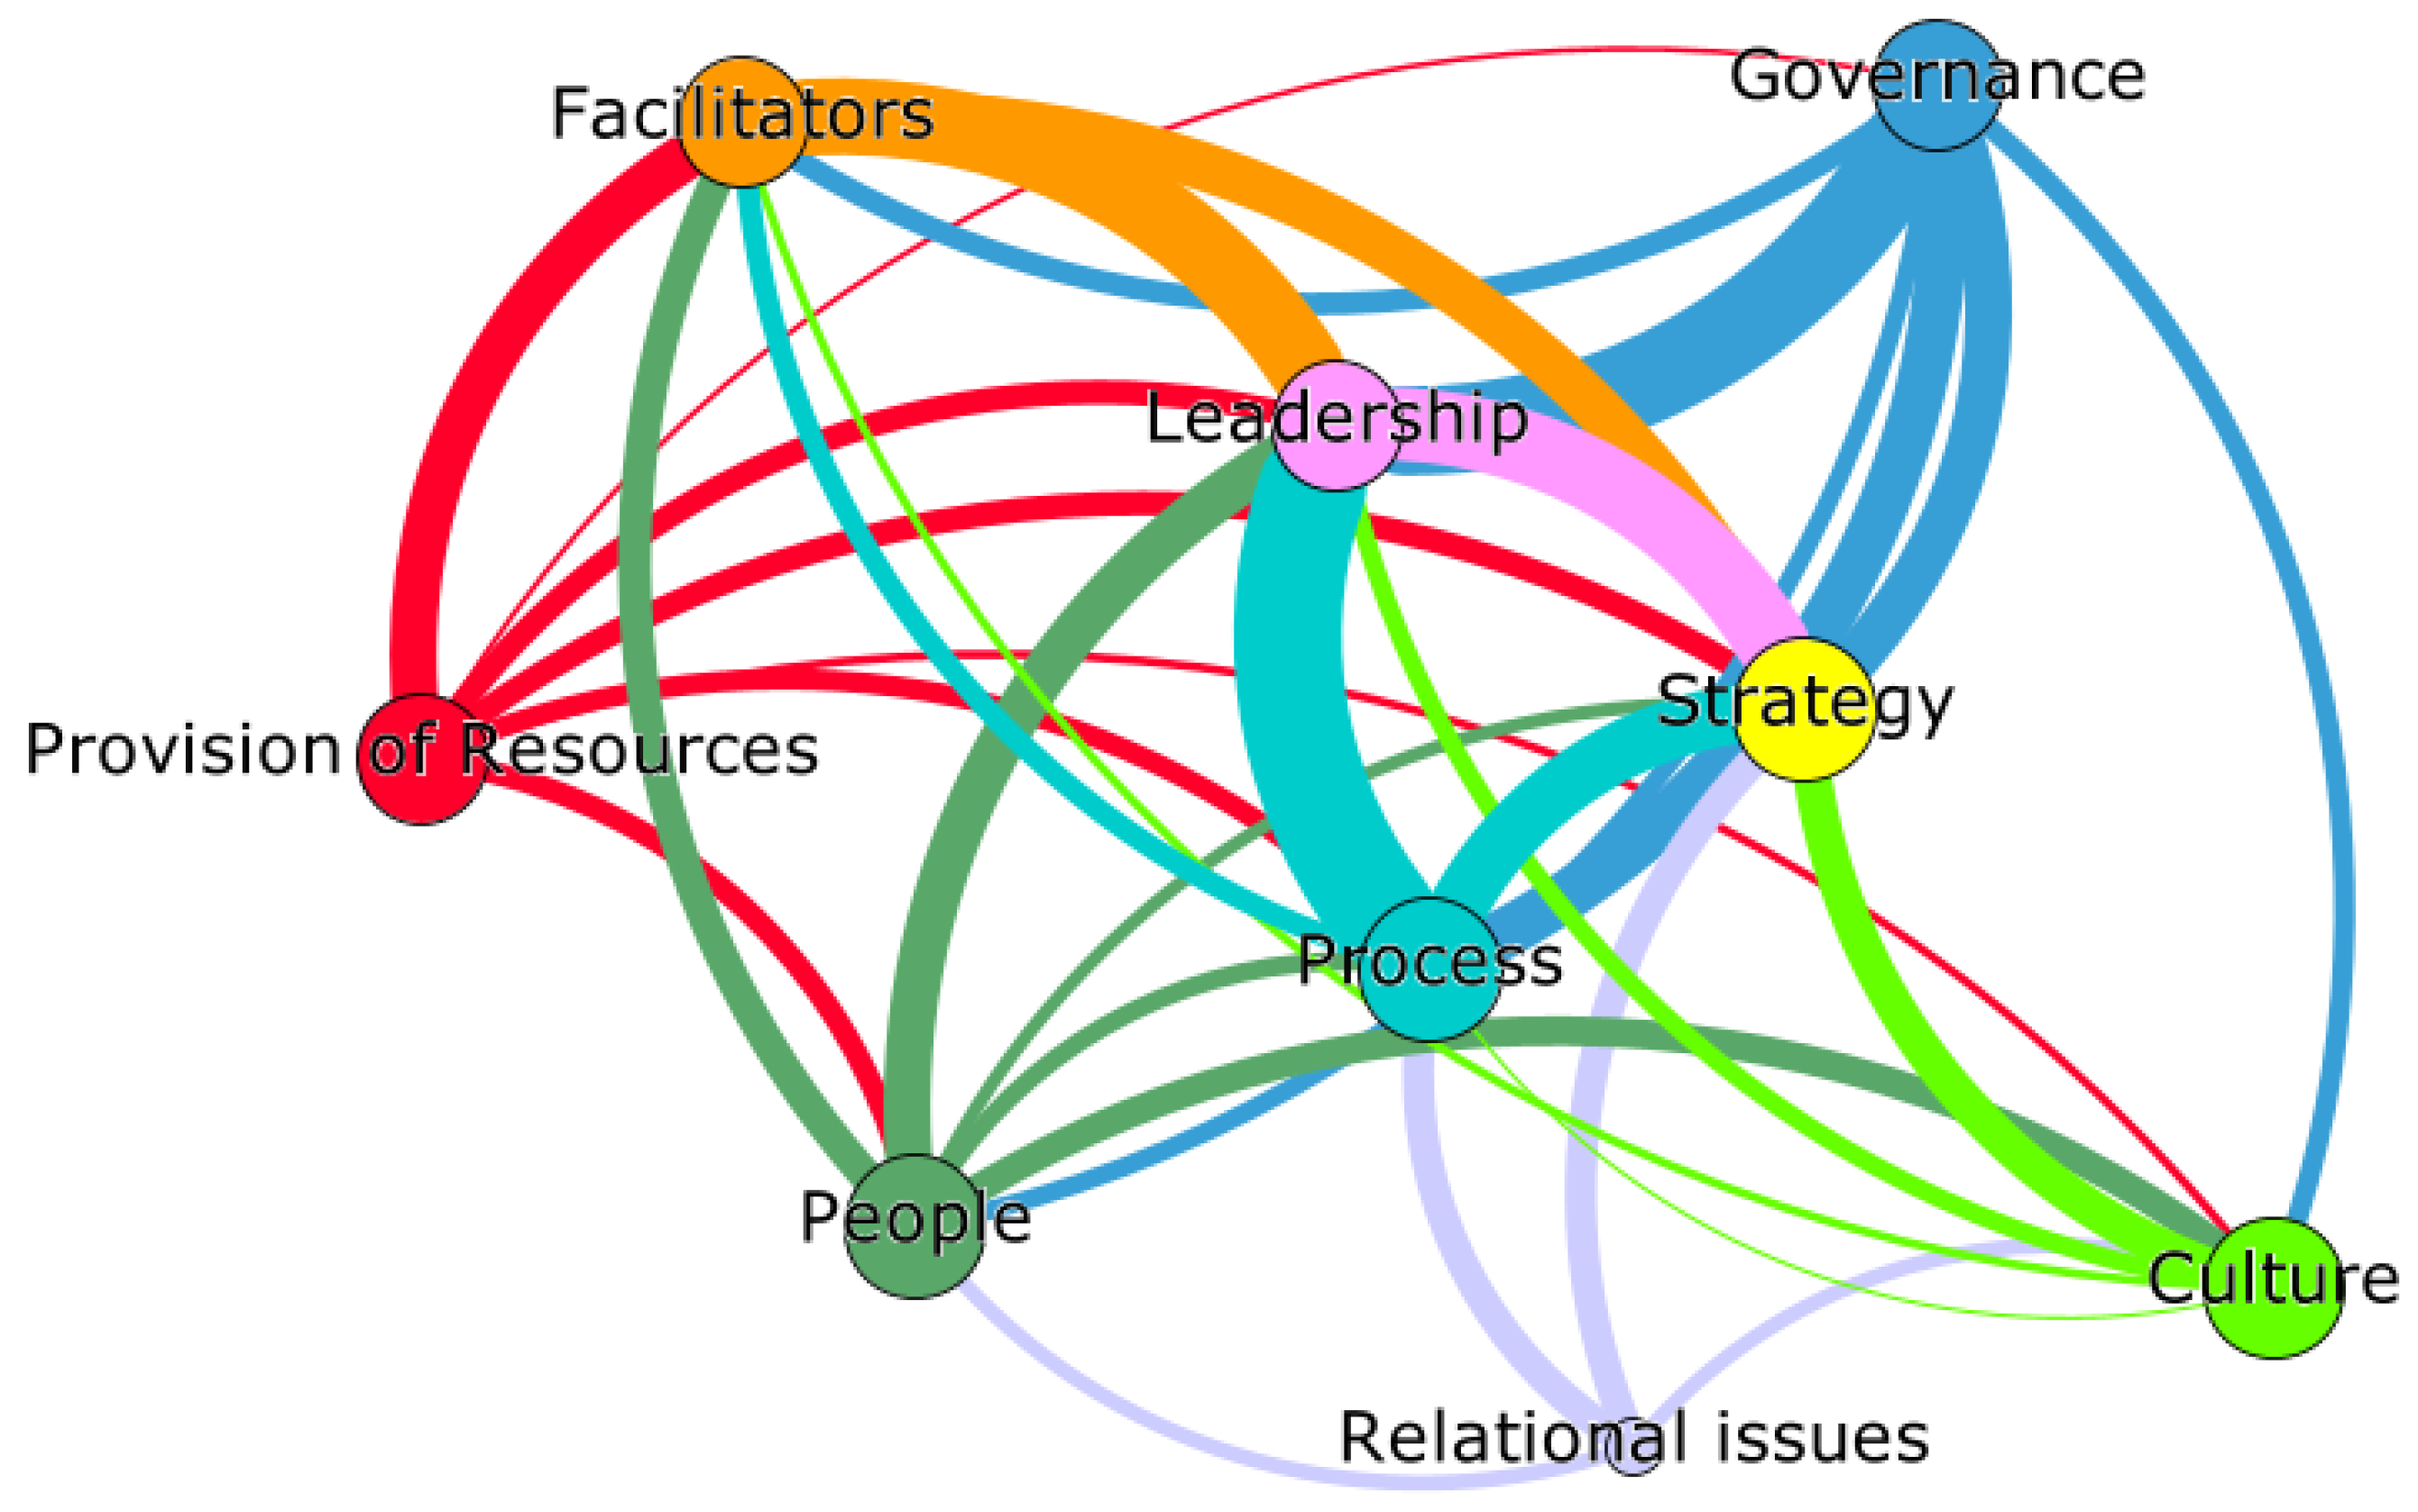
4.4. Factor-Based Network Analysis and Visualization

The network created based on the eigenvector centrality of the upper group is shown in Figure 2. The core nodes are the four bold nodes in the center of the network: provision of resources, governance, strategy, and facilitators. Looking at the structural relationships of the core nodes, provision of resources is strongly connected to governance, strategy, and facilitators. Governance is strongly connected to strategy and people. The non-core nodes are culture, relational issues, process, and leadership.
The network based on the eigenvector centrality of the lower group is shown in Figure 3. The core nodes are people, process, culture, and strategy, which have high eigenvector centrality. Looking at the structural relationships of the core nodes, process is strongly connected to leadership and strategy. “People” is strongly connected to facilitators, leadership, and culture. The non-core nodes are relational issues.

4.5. Comparison Analysis of Upper and Lower Groups

From the word-based network analysis, 47 words were extracted for the upper group and 46 for the lower group. In both groups, the top 10 keywords were identified based on the eigenvector centrality values of the 1st to 10th eigenvectors of the upper and lower groups.
The top 10 words in the upper and lower groups are shown in Figure 4. The four words “global”, “driving”, “solutions”, and “clear” are among the top 10 keywords in the upper group, while “transformation”, “electric”, “model”, and “successfully” are among the top 10 keywords in the lower group.
Comparing the open innovation success factor mapping results of the upper and lower groups, in the upper group, provision of resources and governance were key factors, while in the lower group, key factors were people and process.

5. Discussion

A CEO message presents the company’s vision to stakeholders and employees [28]. In corporate management, CEOs seek to gain competitive advantage through technological innovation, which can lead to sustainable growth and improved business performance [19]. Therefore, CEO messages have become the most fundamental tool of CEO communication to achieve corporate strategies and goals.
This study analyzes the differences in CEO message characteristics between upper and lower groups in the global auto parts industry. The CEO messages of upper group companies were identified based on sentences containing innovation-related words and recorded as a single TXT file. Those of the lower group were analyzed in the same way. Keywords were extracted using R, a text mining tool, and network analysis was performed using Gephi visualization software. The nine open innovation factors were used to analyze the differences in the CEO message characteristics of the upper and lower groups. Keywords extracted from each group were mapped to the corresponding factors, and eigenvector centrality analysis was used to identify the characteristics of innovative management [58].

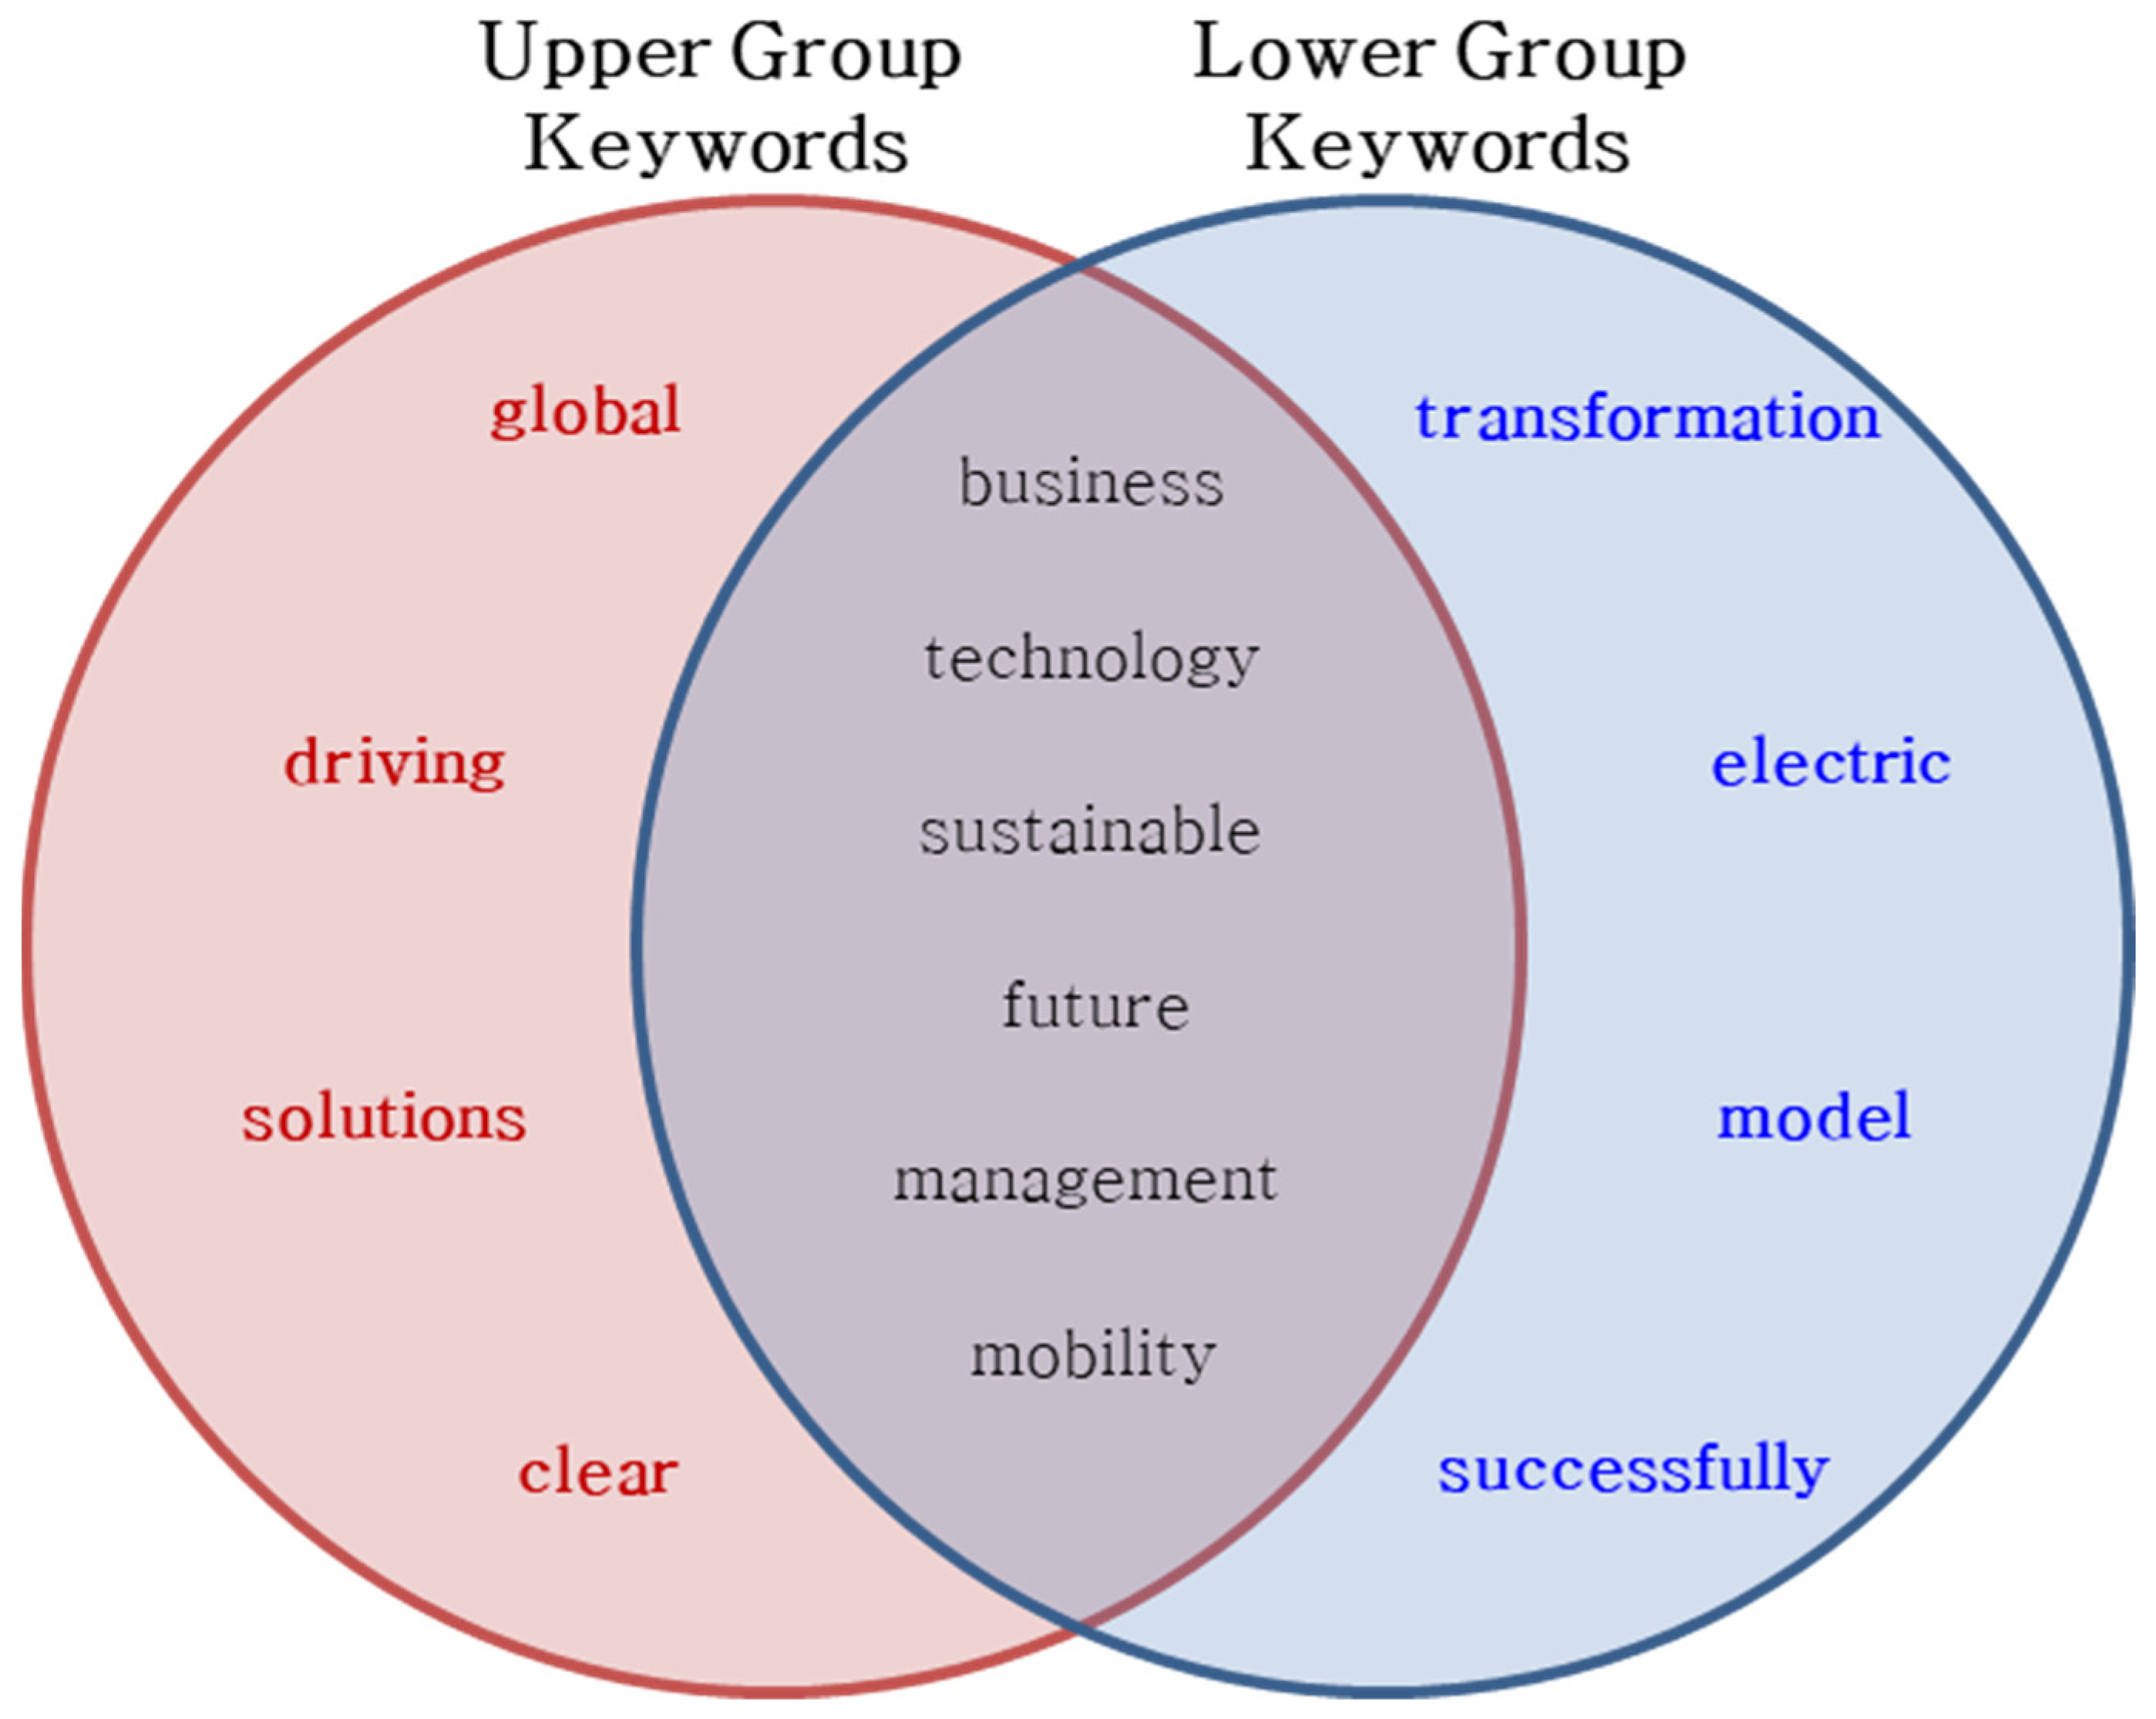
5.1. Comparison of Keyword Trends

In this study, based on centrality analysis, the core keywords related to innovation management were derived as 47 words in the upper group and 46 in the lower group, as shown in Table 1 and Table 2. The keywords were organized in the order of high eigenvector centrality [54]. The top 10 keywords belonging to the upper group only include “global”, “driving”, “solutions”, and “clear”. Taken together, the keywords of the upper group were perceived to imply a global-oriented strategy with a focus on leadership and proactive problem solving.
Keywords that belong only to the lower group include “transformation”, “electric”, “model”, and “successfully”. Taken together, these keywords suggest that the company is in a phase of transformation and adapting to new technologies and market trends. The emphasis on “successfully” suggests an ongoing effort to reposition itself in the market.
Comparing the keyword trends, those in the upper group emphasized global presence and are solution focused. Lower-ranked companies focused on innovation and electrotechnical keywords, which are perceived to reflect a catch-up or niche strategy as the industry changes.

5.2. Characteristics of Innovative Management

In this study, each keyword whose centrality was analyzed was mapped to the success factors of open innovation to identify the differences in the characteristics of open innovation management and the key nodes emphasized in the upper and lower groups. As Figure 2 shows, the innovation management of the upper group is characterized by the factors provision of resources and governance, which are recognized as key nodes. Provision of resources refers to risk management, customer exploration, responding to environmental changes, and value creation. In particular, the auto parts industry is actively embracing changes in the industrial ecosystem, such as eco-friendly technologies and mobility services, and creating new value based on them [16]. This can be interpreted as an intention to secure an advantage over competitors and provide new value to customers. Governance refers to the mechanism and structure of the open innovation process. Companies in the upper group can be perceived as having well-established systems for managing innovation. Good governance can be seen as contributing to a company’s ability to effectively manage and benefit from open innovation [21].
For the innovation management characteristics of the lower group, the people and process factors were recognized as key nodes. “People” refers to recognizing the importance of acquiring and developing competent human resources to carry out innovation activities. “Process” suggests a possible focus on improving or developing open innovation methodologies.
Thus, companies in the upper group focus on technological innovation and external collaboration to capture future markets, while those in the lower group emphasize acquiring talented people, creating a culture of collaboration, and building efficient processes.

6. Conclusions

This study represents a significant advancement in the academic examination of innovation management within the auto parts industry by shifting the analytical focus from traditional methodologies, such as surveys and interviews with CEOs, to the analysis of formal CEO communications. This shift not only diverges from previous keyword-based comparative analyses but also extends the theoretical framework by incorporating the success factors of open innovation theory into the context of the auto parts sector specifically. This approach yields novel empirical insights into the practical emphasis of open innovation facets by industry leaders, marking a clear departure from prior studies.
Moreover, the study deepens the understanding of leadership roles in fostering corporate sustainability. By examining how CEOs articulate innovation strategies, it highlights the profound impact leadership has on guiding both environmental and technological advancements within their organizations. This insight enhances our comprehension of the pivotal role leaders play in steering their companies toward sustainability.
The methodological innovation of this research deserves special mention. By integrating text mining with network analysis, the study expands the methodological toolkit available for examining sustainability within corporate contexts. This innovative approach not only broadens the scope of research methodologies but also sets a new benchmark for future scholarly endeavors aimed at dissecting the intricate web of corporate communications and their impact on sustainable innovation.
On a practical level, the insights derived from this study offer actionable intelligence on the strategic priorities and characteristics of open innovation management among industry leaders. For companies aspiring to achieve such status, these findings provide a valuable benchmark for shaping their innovation management strategies, visions, and objectives. The study emphasizes the critical role of strategic communication in aligning corporate practices with overarching sustainability goals, underscoring the potential for advancing sustainable business models across the global marketplace.
Policy implications emerging from this analysis suggest that recognizing the innovation management traits of leading firms can inform the formulation of supportive policies and guidelines. Such measures would encourage open innovation and foster an ecosystem conducive to sustainable growth within the auto parts industry—a sector currently at the forefront of transformation due to the advent of electric vehicles, autonomous driving technologies, and the concept of connected cars.
Lastly, the study underscores the importance of CEO messages as reflections of both the current challenges confronting the organization and the strategic direction of innovation management. The diversity of innovation-related terms within these communications signals the CEOs’ intentions and strategic focus on innovation to stakeholders, including employees and customers. This emphasis on strategic narrative underscores the necessity for CEOs to exhibit agile and forward-looking leadership, particularly in an era of rapid industry evolution.
In addition, we highlight the following implications of our findings. CEO messages contain words that indicate the current situation facing the organization and the direction of innovation management. This is significant in terms of identifying the CEO’s intentions and disposition toward innovation management. The CEO’s message contains a variety of words related to innovation, which is meaningful for presenting the direction of innovation management to stakeholders, customers, and employees.
The auto parts industry is undergoing rapid change with the advent of electric vehicles, autonomous driving, and connected car technologies [16]. To reflect agile and forward-thinking leadership in open innovation in their formal messaging, CEOs must include and emphasize keywords that correspond to the open innovation key factors of the upper group.
This study is primarily concerned with the analysis of global auto parts companies, which inherently limits the applicability of its conclusions to other industrial sectors. It is essential to recognize that CEO communications may emphasize different keywords across various industries, indicating a significant area for future investigation.
Moreover, this research does not explore the potential differences in strategic orientation manifest in communications beyond direct CEO messages, presenting an opportunity for more comprehensive research on CEO communication strategies across a wider range of industries.
Further research could beneficially delve into the communications of CEOs from companies that consistently achieve top rankings in the global auto parts industry. The publication of the annual Top 100 companies list, which ranks firms based on their sales performance and includes changes in rankings from the previous year, suggests that continuous top-tier performance is indicative of sustainable management practices.
An analysis of CEO messages from companies that have remained in the top tier for three years or more offers a promising research direction. These communications, reflecting a commitment to sustainability and innovation, may provide valuable insights into the strategic approaches these firms employ to adapt to shifting market dynamics and technological advancements within the auto parts sector.
Moreover, research could expand to consider additional or alternative success factors not covered by Durst and Ståhle [21], particularly those emerging from recent trends in open innovation.
In conclusion, an in-depth analysis of the strategies and hurdles faced by lower-ranking companies could illuminate the obstacles to effective innovation management and potential strategies for overcoming these challenges.

Author Contributions

Conceptualization, Y.H.; methodology, Y.H.; software, Y.H.; validation, K.C.; formal analysis, Y.H.; writing—original draft preparation, Y.H.; writing—review and editing, Y.H. and K.C.; supervision, K.C. All authors have read and agreed to the published version of the manuscript.

Funding

This research received no external funding.

Institutional Review Board Statement

Not applicable.

Informed Consent Statement

Not applicable.

Data Availability Statement

The original contributions presented in the study are included in the article material, further inquiries can be directed to the corresponding authors.

Conflicts of Interest

The authors declare no conflicts of interest.

References

  1. Bai, L.; Yan, X.; Yu, G. Impact of CEO media appearance on corporate performance in social media. N. Am. J. Econ. Financ. 2019, 50, 100996. [Google Scholar] [CrossRef]
  2. Chah, D. A study of recent research on CEO leadership. Korean J. Hum. Resour. Manag. 2005, 29, 205–258. [Google Scholar]
  3. Hambrick, D.C.; Fukutomi, G.D. The seasons of a CEO’s tenure. Acad. Manag. Rev. 1991, 16, 719–742. [Google Scholar] [CrossRef]
  4. Yook, K.H. CEOs Talk about Social Responsibilities and Sustainable Performance: Applications of Text Mining Approach. Korean Account. J. 2018, 27, 253–279. [Google Scholar] [CrossRef]
  5. Mahmoudi, S.; Ghasemi, F.; Mohammadfam, I.; Soleimani, E. Framework for continuous assessment and improvement of occupational health and safety issues in construction companies. Saf. Health Work 2014, 5, 125–130. [Google Scholar] [CrossRef] [PubMed]
  6. Gupta, R.; Gill, N.S. Financial statement fraud detection using text mining. Int. J. Adv. Comput. Sci. Appl. 2012, 3. [Google Scholar] [CrossRef]
  7. Shirata, C.Y.; Takeuchi, H.; Ogino, S.; Watanabe, H. Extracting key phrases as predictors of corporate bankruptcy: Empirical analysis of annual reports by text mining. J. Emerg. Technol. Account. 2011, 8, 31–44. [Google Scholar] [CrossRef]
  8. Charteris-Black, J.; Ennis, T. A comparative study of metaphor in Spanish and English financial reporting. Engl. Specif. Purp. 2001, 20, 249–266. [Google Scholar] [CrossRef]
  9. Humphery-Jenner, M.L.; Powell, R.G. Firm size, takeover profitability, and the effectiveness of the market for corporate control: Does the absence of anti-takeover provisions make a difference? J. Corp. Financ. 2011, 17, 418–437. [Google Scholar] [CrossRef]
  10. Choi, Y.G.; Cho, K.T. Analysis of Safety Management Characteristics Using Network Analysis of CEO Messages in the Construction Industry. Sustainability 2020, 12, 5771. [Google Scholar] [CrossRef]
  11. Choi, Y.; Cho, K.T. Analysis of Environmental Management Characteristics Using Network Analysis of CEO Communication in the Automotive Industry. Sustainability 2021, 13, 11987. [Google Scholar] [CrossRef]
  12. Kim, H.J.; Cho, K.T. Analysis of Changes in Innovative Management of Global Insurers in the Pre- and Post-COVID-19 Eras. Sustainability 2022, 14, 9976. [Google Scholar] [CrossRef]
  13. Drieger, P. Semantic network analysis as a method for visual text analytics. Procedia-Soc. Behav. Sci. 2013, 79, 4–17. [Google Scholar] [CrossRef]
  14. Kim, S.; Lee, W.S. Network text analysis of medical tourism in newspapers using text mining: The South Korea case. Tour. Manag. Perspect. 2019, 31, 332–339. [Google Scholar] [CrossRef]
  15. Xie, K.; Di Tosto, G.; Lu, L.; Cho, Y.S. Detecting leadership in peer-moderated online collaborative learning through text mining and social network analysis. Internet High. Educ. 2018, 38, 9–17. [Google Scholar] [CrossRef]
  16. Cho, S.H. A Few Thoughts on Changes in Automotive Industry and R&D Strategy. Auto J. Korean Soc. Automot. Eng. 2020, 42, 52–56. [Google Scholar]
  17. Seok-Kwan, K.; Byung-Sam, C.; Il-Young, C.; Jung-Sup, Y.; Mi-Jung, U.; Soo-Jung, S.; Soo-Kyung, J.; Hee-Tae, Y.; Je-Young, L.; Du-Won, C.; et al. Surviving Radical Innovation: Paradigm Shifts in Automobile Industry and Korea’s Strategy. Policy Res. 2022, 1, 1–334. [Google Scholar]
  18. Hambrick, D.C. Upper echelons theory: An update. Acad. Manag. Rev. 2007, 32, 334–343. [Google Scholar] [CrossRef]
  19. Zahra, S.A.; Ireland, R.D.; Hitt, M.A. International expansion by new venture firms: International diversity, mode of market entry, technological learning, and performance. Acad. Manag. J. 2000, 43, 925–950. [Google Scholar] [CrossRef]
  20. Dierickx, I.; Cool, K. Asset stock accumulation and the sustainability of competitive advantage: Reply. Manag. Sci. 1989, 35, 1514. [Google Scholar] [CrossRef]
  21. Durst, S.; Ståhle, P. Success factors of open innovation-a literature review. Int. J. Bus. Res. Manag. 2013, 4, 111–131. [Google Scholar]
  22. Kohut, G.F.; Segars, A.H. The president’s letter to stockholders: An examination of corporate communication strategy. J. Bus. Commun. (1973) 1992, 29, 7–21. [Google Scholar] [CrossRef]
  23. Clatworthy, M.; Jones, M.J. The effect of thematic structure on the variability of annual report readability. Account. Audit. Account. J. 2001, 14, 311–326. [Google Scholar] [CrossRef]
  24. Clatworthy, M.A.; Jones, M.J. Differential patterns of textual characteristics and company performance in the chairman’s statement. Account. Audit. Account. J. 2006, 19, 493–511. [Google Scholar] [CrossRef]
  25. Hammami, H. Accounting narratives’ characteristics and firm performance in the MD&As of listed Italian companies. Int. J. Account. Financ. 2011, 3, 72–86. [Google Scholar]
  26. Laskin, A.V. The Narrative Strategies of Winners and Losers: Analyzing Annual Reports of Publicly Traded Corporations. Int. J. Bus. Commun. 2018, 55, 338–356. [Google Scholar] [CrossRef]
  27. Kiss, A.N.; Cortes, A.F.; Herrmann, P. CEO proactiveness, innovation, and firm performance. Leadersh. Q. 2022, 33, 101545. [Google Scholar] [CrossRef]
  28. Bournois, F.; Point, S. A letter from the president: Seduction, charm and obfuscation in French CEO letters. J. Bus. Strategy 2006, 27, 46–55. [Google Scholar] [CrossRef]
  29. Amernic, J.H.; Craig, R.J. Guidelines for CEO-speak: Editing the language of corporate leadership. Strategy Leadersh. 2007, 35, 25–31. [Google Scholar] [CrossRef]
  30. Amernic, J.; Craig, R. Improving CEO-Speak: The CPA as communications adviser. J. Account. 2007, 203, 65. [Google Scholar]
  31. Butts, C.T. Social network analysis: A methodological introduction. Asian J. Soc. Psychol. 2008, 11, 13–41. [Google Scholar] [CrossRef]
  32. de las Heras-Rosas, C.; Herrera, J. Research trends in open innovation and the role of the university. J. Open Innov. Technol. Mark. Complex. 2021, 7, 29. [Google Scholar] [CrossRef]
  33. Chesbrough, H.W. Open Innovation: The New Imperative for Creating and Profiting from Technology; Harvard Business Press: Boston, MA, USA, 2003. [Google Scholar]
  34. Kim, S.; Jang, B.; Lee, Y.; Song, J.; An, D.; Lee, K.; Choi, J. Open Innovation: Theory, Practices, and Policy Implications; STEPI: Seoul, Republic of Korea, 2008. [Google Scholar]
  35. Yang, C.H. An Empirical Study on the Success Factor and Performance of Management Innovation. J. Ind. Econ. Bus. 1999, 12, 63–84. [Google Scholar]
  36. Schumpeter, J.A. The theory of economic development, translated by Redvers Opie. Harv. Econ. Stud. 1934, 46, 0404. [Google Scholar]
  37. Schumpeter, J. The Theory of Economic Development. A Galaxy Book; Springer: New York, NY, USA, 1961. [Google Scholar] [CrossRef]
  38. Zahra, S.A.; Bogner, W.C. Technology strategy and software new ventures’ performance: Exploring the moderating effect of the competitive environment. J. Bus. Ventur. 2000, 15, 135–173. [Google Scholar] [CrossRef]
  39. Eisenhardt, K.M.; Martin, J.A. Dynamic capabilities: What are they? Strateg. Manag. J. 2000, 21, 1105–1121. [Google Scholar] [CrossRef]
  40. Kim, Y.J. An Empirical Study on the Impacts of Strategic Leadership, R&D Investment, and Human Resource Management Practices on Innovation Performance. J. Organ. Manag. 2007, 31, 49–83. [Google Scholar]
  41. Chae, J.S.; Park, S.S. The Relationship between Strategic Leadership and Innovation Performance of CEOs of SMEs: The Mediating Effect of Willing to Technological Innovation. J. Prof. Manag. 2019, 22, 1–24. [Google Scholar]
  42. Elenkov, D.S.; Judge, W.; Wright, P. Strategic leadership and executive innovation influence: An international multi-cluster comparative study. Strateg. Manag. J. 2005, 26, 665–682. [Google Scholar] [CrossRef]
  43. Nadkarni, S.; Chen, J. Bridging yesterday, today, and tomorrow: CEO temporal focus, environmental dynamism, and rate of new product introduction. Acad. Manag. J. 2014, 57, 1810–1833. [Google Scholar] [CrossRef]
  44. Hwang, S.-J.; Shin, J.-K. Top Management Characteristic, Organizational Structure, Market Competition, Technology Innovation and Financial Performance. Korean J. Bus. Adm. 2009, 22, 987–1011. [Google Scholar]
  45. McEvily, S.K.; Eisenhardt, K.M.; Prescott, J.E. The global acquisition, leverage, and protection of technological competencies. Strateg. Manag. J. 2004, 25, 713–722. [Google Scholar] [CrossRef]
  46. Cong, Y.; Freedman, M.; Park, J.D. Tone at the top: CEO environmental rhetoric and environmental performance. Adv. Account. 2014, 30, 322–327. [Google Scholar] [CrossRef]
  47. Craig, R.; Tourish, D. Measuring and Assessing Tone at the Top Using Annual Report CEO Letters; The Institute of Chartered Accountants of Scotland: Edinburgh, UK, 2010. [Google Scholar]
  48. Barkemeyer, R.; Comyns, B.; Figge, F.; Napolitano, G. CEO statements in sustainability reports: Substantive information or background noise? Account. Forum 2014, 38, 241–257. [Google Scholar] [CrossRef]
  49. Oliver, S. Message from the CEO: A three-minute rule? Corp. Commun. Int. J. 2000, 5, 158–167. [Google Scholar] [CrossRef]
  50. Kim, J.Y.; Kim, D.S. A Study on the Method for Extracting the Purpose-Specific Customized Information from Online Product Reviews based on Text Mining. J. Soc. E-Bus. Stud. 2016, 21, 151–161. [Google Scholar] [CrossRef]
  51. Feinerer, I.; Hornik, K.; Meyer, D. Text mining infrastructure in R. J. Stat. Softw. 2008, 25, 1–54. [Google Scholar] [CrossRef]
  52. Lee, H.; Yi, C. New Discussion of the Conceptual Definition of Technology Innovation. J. Korea Technol. Innov. Soc. 2021, 24, 777–798. [Google Scholar] [CrossRef]
  53. Lee, S.-S. A content analysis of journal articles using the language network analysis methods. J. Korean Soc. Inf. Manag. 2014, 31, 49–68. [Google Scholar] [CrossRef]
  54. Hong, J.-H.; Yun, H.-J. Presidential candidate’s speech based on network analysis: Mainly on the visibility of the words and the connectivity between the words. J. Korea Contents Assoc. 2014, 14, 24–44. [Google Scholar] [CrossRef]
  55. Hussain, S.; Muhammad, L.; Yakubu, A. Mining social media and DBpedia data using Gephi and R. J. Appl. Comput. Sci. Math. 2018, 12, 14–20. [Google Scholar] [CrossRef]
  56. Valente, T.W.; Coronges, K.; Lakon, C.; Costenbader, E. How correlated are network centrality measures? Connections 2008, 28, 16. [Google Scholar]
  57. Howlader, P.; Sudeep, K. Degree centrality, eigenvector centrality and the relation between them in Twitter. In Proceedings of the 2016 IEEE International Conference on Recent Trends in Electronics, Information & Communication Technology (RTEICT), Bangalore, India, 20–21 May 2016; pp. 678–682. [Google Scholar]
  58. Bonacich, P. Technique for analyzing overlapping memberships. Sociol. Methodol. 1972, 4, 176–185. [Google Scholar] [CrossRef]
Figure 1. Research procedure and methodology.
Sustainability 16 03100 g001
Figure 2. Network visualization of innovation management characteristics (upper group).
Sustainability 16 03100 g002
Figure 3. Network visualization of innovation management characteristics (lower group).
Sustainability 16 03100 g003
Figure 4. Comparison of top 10 keywords: upper and lower groups.
Sustainability 16 03100 g004
Table 1. List of centrality analysis results for deducing words (upper group).
RankWordEigenvector
Centrality
WordBetweenness
Centrality
WordCloseness Centrality
1technology1.0000sustainable12,701.4417technology0.5326
2business0.9011mobility11,996.6673mobility0.5289
3transformation0.8947technology11,302.0859sustainable0.5235
4electric0.8425global9414.1763global0.5129
5model0.7841future8522.7594future0.5044
6mobility0.7577business7038.6797business0.5039
7sustainable0.6177solutions5382.6431driving0.4941
8future0.5529driving4811.3258committed0.4678
9successfully0.5108sense4470.0000forward0.4654
10management0.4801market3118.5781management0.4598
11autonomous0.4664world2994.8506solutions0.4588
12vehicle0.4526management2933.1825value0.4584
13connectivity0.4523clear2763.0458core0.4561
14emerging0.4429forward2737.5581market0.4534
15research0.4366committed2602.8658ahead0.4476
16market0.4366development2255.2363innovative0.4459
17connected0.4324ahead2196.1277increase0.4446
18energy0.4042progress2148.8364create0.4428
19industry0.3963create2132.3760transformation0.4428
20customers0.3959COVID2128.4957growing0.4424
21investments0.3767transformation2084.9057products0.4403
22resources0.3749products1931.8836development0.4394
23markets0.3732improve1819.2911electric0.4344
24efficiency0.3671integration1792.2086making0.4332
25existing0.3666innovative1785.8900chain0.4307
26supplier0.3615move1721.4808supply0.4307
27changes0.3598problems1670.5208foundation0.4303
28sharing0.3595making1550.3880developing0.4303
29ability0.3568green1463.3742strength0.4299
30automobile0.3532value1435.7484connectivity0.4283
Table 2. List of centrality analysis results for deducing words (lower groups).
RankWordEigenvector
Centrality
WordBetweenness
Centrality
WordCloseness
Centrality
1technology1.0000technology11,736.6871technology0.5485
2business0.8569customers8654.2862transformation0.5122
3transformation0.8073sustainable7834.0871electric0.5035
4electric0.8069electric6253.9494business0.4924
5model0.7417transformation5112.7607model0.4863
6mobility0.6918business5070.6213sustainable0.4830
7sustainable0.5873mobility4256.5945future0.4811
8future0.5280model3655.1029management0.4697
9successfully0.5106management3392.0409autonomous0.4623
10management0.4970emerging3287.0418connectivity0.4611
11autonomous0.4808innovative2684.2703mobility0.4588
12vehicle0.4619research2293.2357customers0.4529
13connectivity0.4611market2251.7969industry0.4529
14emerging0.4610energy1977.8700connected0.4512
15research0.4472human1931.8682emerging0.4501
16market0.4293better1874.7084vehicle0.4472
17connected0.4272future1657.0551energy0.4461
18energy0.4239ability1364.1813automotive0.4400
19industry0.4021products1361.3674market0.4390
20customers0.4004providing1333.7525research0.4384
21investments0.3944connected1289.3044providing0.4373
22resources0.3944industry1239.6656sharing0.4341
23markets0.3935together1165.3894investments0.4320
24efficiency0.3634successfully1120.0803resources0.4320
25existing0.3634value1111.5754growth0.4274
26supplier0.3632resolve1028.6694efficiency0.4274
27changes0.3533stakeholders1026.9737existing0.4274
28sharing0.3502strive1026.9737advantages0.4253
29ability0.3461effective986.9394consolidate0.4253
30automobile0.3368vehicle938.8430embraced0.4253
Table 3. Weighted words classified according to the results of centrality analysis (upper group).
ClusterWord
Weight 3Value, solutions, market, business, technology, committed, management, create, mobility, driving, sustainable, forward, transformation, future, global, innovative
Weight 2Ahead, core, foundation, COVID, products, increase, supply, making, clear, chain, development
Weight 1Developing, growing, external, green, improve, inclusion, electric, sense, companies, strength, world, progress, possible, accelerate, makes, culture, move, connectivity, problems, integration
Table 4. Weighted words classified according to the results of centrality analysis (lower group).
ClusterWord
Weight 3Technology, mobility, management, business, research, connected, vehicle, customers, market, electric, model, emerging, sustainable, energy, transformation, future, industry
Weight 2Existing, successfully, autonomous, providing, efficiency, ability, connectivity, resources, sharing, investments
Weight 1Value, automotive, better, products, together, growth, effective, human, supplier, resolve, advantages, automobile, markets, innovative, consolidate, stakeholders, embraced, strive, changes
Table 5. Mapping list of words to success factors and weight 3 words (upper group).
WordABCDEFGHI
ValueOO O
Solution O O O
MarketO O O
BusinessO O O
TechnologyO O O
Committed OOO
ManagementO O O
CreateO O
Mobility O O
DrivingO O O
SustainableOO O
Forward OOO
TransformationOO O
Future O O O
GlobalOO O
InnovativeO O O
A: provision of resources, B: governance, C: relational issues, D: people, E: culture, F: process, G: facilitators, H: leadership, I: strategy.
Table 6. Mapping list of words to success factors and weight 2 words (upper group).
WordABCDEFGHI
AheadOO O
Core OO O
FoundationOO O
COVIDOO O
ProductsOO O
Increase OO
SupplyO O
Making O O O
Clear O O O
Chain OO O
Development O O O
A: provision of resources, B: governance, C: relational issues, D: people, E: culture, F: process, G: facilitators, H: leadership, I: strategy.
Table 7. Mapping list of words to success factors and weight 1 words (upper group).
WordABCDEFGHI
DevelopingO O O
GrowingO O
External O O O
Green O O
ImproveOO O
Inclusion OO O
ElectricO O O
SenseOO O
Companies O O O
StrengthO O O
World O O
Progress O OO
Possible OO O
Accelerate O O O
Makes O OO
Culture O O
Move O O
ConnectivityO O O
Problems OO O
Integration O O
A: provision of resources, B: governance, C: relational issues, D: people, E: culture, F: process, G: facilitators, H: leadership, I: strategy.
Table 8. Mapping list of words to success factors and weight 3 words (lower group).
WordABCDEFGHI
Technology O OO
Mobility OO O
Management O O O
BusinessO O O
Research O OO
ConnectedO O O
Vehicle OOO
Customers O O O
Market O OO
Electric O OO
Model O O O
Emerging O O O
Sustainable OO O
EnergyO O O
Transformation O O O
Future O OO
A: provision of resources, B: governance, C: relational issues, D: people, E: culture, F: process, G: facilitators, H: leadership, I: strategy.
Table 9. Mapping list of words to success factors and weight 2 words (lower group).
WordABCDEFGHI
Industry O O O
ExistingO O O
Successfully O O O
Autonomous OOO
ProvidingO O O
Efficiency O O O
AbilityO OO
Connectivity O O O
Resources OOO
Sharing OO O
Investments OOO
A: provision of resources, B: governance, C: relational issues, D: people, E: culture, F: process, G: facilitators, H: leadership, I: strategy.
Table 10. Mapping list of words to success factors and weight 1 words (lower group).
WordABCDEFGHI
Value O O O
AutomotiveOO O
Better OO O
Products OO O
Together O O O
Growth OOO
Effective O O O
HumanOO O
Supplier OOO
Resolve OO
Advantages OO O
AutomobileOO O
Markets O OO
InnovativeO OO
Consolidate OO
Stakeholders O OO
Embraced OO O
Strive OO
ChangesO O O
A: provision of resources, B: governance, C: relational issues, D: people, E: culture, F: process, G: facilitators, H: leadership, I: strategy.
Disclaimer/Publisher’s Note: The statements, opinions and data contained in all publications are solely those of the individual author(s) and contributor(s) and not of MDPI and/or the editor(s). MDPI and/or the editor(s) disclaim responsibility for any injury to people or property resulting from any ideas, methods, instructions or products referred to in the content.

