Article

Identification of Aggregates Quarries via Computer Vision Analysis as a Tool for Sustainable Aggregates Management and Land Planning

by
Francisco J. López-Acevedo
1,2,
María J. Herrero
1,*,
José I. Escavy
3 and
Miguel A. Peláez Fernández
2
1
Departamento de Petrología y Mineralogía, Facultad de Ciencias Geológicas, Universidad Complutense de Madrid (UCM), Calle José Antonio Nováis, 12, 28040 Madrid, Spain
2
Indra Sistemas, Av. de Bruselas, 35, Alcobendas, 28108 Madrid, Spain
3
Escuela Técnica Superior de Ingenieros de Caminos, Canales y Puertos, Universidad Politécnica de Madrid (UPM), Calle Profesor Aranguren s/n, 28040 Madrid, Spain
*
Author to whom correspondence should be addressed.
Sustainability 2024, 16(8), 3099; https://doi.org/10.3390/su16083099
Submission received: 11 March 2024 / Revised: 1 April 2024 / Accepted: 3 April 2024 / Published: 9 April 2024
(This article belongs to the Section Sustainable Materials)

Abstract

:
The mineral raw materials industry is crucial for European industry, with the European Economic and Social Committee estimating that 70% of the industry relies directly or indirectly on its supply. In the context of a decarbonized and digitalized economy, the new European industrial model requires carbon-neutral raw materials and production processes. The crucial role of aggregates mining, as the primary construction material, emerges as a key supplier in this paradigm. Aggregates are the main component of the built environment and are a social and economic engine in most countries. Quarries of this type include a wide range of sizes and exploitation methods and use characteristic mining and processing equipment. Quarries are commonly close to their processing plants, which transform natural rock into crushed and ground materials with different grain sizes depending on the future uses. The quarry itself and the presence of certain equipment and facilities help distinguish it from mining sites that exploit other materials. Effective management of aggregates quarries is important in promoting circular economy practices, ensuring efficient management, reuse, and recycling of diverse wastes, including the recovery of high-value components and the production of recycled aggregates, and addressing construction and demolition waste (DCW) management. As aggregates become a progressively scarcer resource due to the increasing demand from developing countries, it is essential to provide reliable and comprehensive information on their potential to the public, policymakers, and other stakeholders to promote their use. This study focuses on employing artificial intelligence and computer vision analysis to automatically identify aggregates quarries from satellite images within continental Spain. A model has been trained to detect aggregates quarries from satellite images by computer vision. The model permits the detection of mining exploitation and the objects located at the interior, which permits determination of the type of mine and the activity status of it. The findings highlight the ability of artificial vision to discern quarries and distinguish whether the observed feature is an aggregates quarry. Additionally, the technology allows for the determination of the quarry’s operational status, distinguishing between active and abandoned quarries. The ability to detect the locations of quarries and assess their activity statuses is of significant value for resource exploration initiatives and location-allocation assessments. It can be a valuable tool for authorities involved in land planning, activities monitoring, and early detection of potential illegal mining activities. This analytical approach demonstrates substantial potential for various stakeholders, including mining companies, mining authorities, policymakers, and land use planners in both the private and public sectors.

1. Introduction

Aggregates play a crucial role within the global economy since they represent the main building material, with a global average consumption exceeding six tons per person annually [1]. They are a type of rock material consisting of clasts with high sphericity. Primary aggregates originate from quarries or mines, whereas secondary aggregates are derived from the reuse or recycling of previously employed construction materials [2,3]. The construction sector is the main consumer of aggregates, but it is also one of the main generators of waste materials (around 35% of the total waste generation in the EU), representing an important economic impact on society [4]. In the aggregates sector, several strategies can be used to move toward a more circular economy. Promoting the recycling and reuse of aggregates from construction and demolition waste would reduce the demand for natural resources, but this is not the only measure toward sustainability. Optimizing the use of raw materials by reducing waste and maximizing the useful life of resources is another alternative. This would involve improving quarry management, minimizing overburden, and maximizing the recovery of usable materials during processing. Digitalization can help develop technologies to optimize resource management and identify opportunities for efficiency improvements, and companies can mitigate environmental impacts.
Aggregates serve as a fundamental component of infrastructure and are the main component of various construction materials, including concrete, mortars, and asphalt mixes [2,5,6]. They are the second most consumed product globally after water [2,7,8]. Furthermore, the annual production volume of aggregates positions it as the leading sector in the non-energy extractive mining industries [2,3]. It is the largest extractive industry worldwide in terms of both the production tonnages and the number of mining sites [1].
Currently, the increasing demand for natural aggregates is reaching a critical point where the exploitation of this resource will exceed its natural renewal rate [9]. This increased demand is exacerbated by inadequate governance in several countries, leading to unsuitable extraction practices that adversely affect the environment.
Furthermore, mining legislation in numerous countries, originally designed with a focus on metallic minerals, tends to overlook the crucial role of aggregates in the planning of sustainable development [10]. Despite their increasing importance in many economies, aggregates are often overlooked in policy planning. They play a vital role in providing access to housing and infrastructure, but their impact on society and the environment has not been analyzed in detail. Furthermore, the development of proper policies related to their extraction and environmental and socioeconomic influence, as with other raw materials, requires the definition of how much of them is needed and supplied [8,11]. This will also serve to establish potential sustainable policies and determine realistic recycling possibilities.

1.1. Aggregates as an Industry

The aggregates mining industry is a social and economic development engine in most countries. Although the worldwide production of aggregates is unknown, the Global Aggregates Information Network (GAIN) estimates an annual production of 50 billion tons from around half a million quarries and pits worldwide [1]. The extractive industry in Spain is composed of about 2700 active exploitations, of which 10 are metal mining, 165 are related to the extraction of industrial minerals, 439 are ornamental rock quarries, and around 2100 are aggregates quarries [12]. The extraction of aggregates and their consumption is generating a challenge related to climate impact and sustainability that must be balanced with the fact that these mineral materials represent important incomes for the economies of developing countries [13].

1.2. Aggregates Quarries Inventories

The size of quarries and mines producing aggregates can vary widely, ranging from small mining operations along roadsides to large open-pit mines employing heavy machinery. Typically, smaller quarries rely on larger ones, where processing plants convert excavated rocks into crushed or ground materials of varying sizes according to the intended uses. This process involves specialized equipment, such as excavators and bulldozers for the extraction and loading into trucks, as well as conveyor belts to transport granular materials within the processing plants.
Governments and authorities in most countries oversee aggregates exploitation sites, maintaining inventories of mining operations [2], with a focus on keeping up-to-date records. These inventories serve the purpose of identifying quarry and pit locations, providing general information on exploitation limits, ownership details, resource and reserve estimates, operation dates, associated mining rights, and more [2]. However, many quarry databases lack completeness and feature outdated or incomplete information. In some cases, information may be dispersed across different databases, requiring consultation from various sources, as seen in Spain [2].
Outdated records compromise the validity of information related to these exploitations, potentially affecting tax management, monitoring their evolution over time, or simply determining the number and locations of active quarries. Furthermore, unchecked overexploitation or illegal extraction poses risks to the environment and leads to socioeconomic and political problems [14]. This concern extends beyond the logistics of production (environmental impact of quarries and material transport) to control issues related to undeclared or directly illegal mining activities (e.g., extraction at abandoned sites or uncontrolled openings in protected areas). Achieving sustainable extraction requires the design and implementation of methodologies that consider ecosystems and social variables and strike a proper balance between societal demand and production [14].
Inappropriate extraction practices often occur illegally or informally, particularly among small-scale operators, making them challenging to locate due to technical barriers or lack of resources. This situation is exacerbated in developing and the least developed countries, where the inventory is nonexistent or, if present, is not updated frequently or lacks relevant information.

1.3. Use of Artificial Intelligence to Improve Quarries Inventories

To address the data scarcity concerning aggregates quarries and pits, and to rectify the issue of outdated records, there is a need to devise a method capable of swiftly and reliably detecting the locations of quarries and monitoring their temporal evolution. Furthermore, the restoration and effective management of nature in times of rapid environmental changes require access to site-specific data, which are often either not publicly available or scattered across diverse repositories and databases. To establish comprehensive knowledge of active quarries, assess their suitability in specific locations, determine the necessity for new activities based on socioeconomic variables, or identify illegal activities, the application of artificial intelligence (AI) and remote sensing emerges as a potential solution.
Defining artificial intelligence (AI) is a challenging task, but an approximation comes from John McCarthy, who characterizes it as science and engineering dedicated to creating intelligent machines. McCarthy’s focus is on developing intelligent computer programs, where intelligence is viewed as the computational aspect of the ability to achieve goals [15]. IBM offers a more straightforward definition, describing AI as a discipline that merges computer science with robust datasets to facilitate problem solving [16]. The realm of artificial intelligence encompasses various fields of study and application, including computer vision techniques [15].
The use of remote sensing could play a crucial role in providing detailed geographic information on construction materials and quarries. In the realm of remote sensing image analysis, satellite- and drone-captured images are used to observe the Earth’s surface [17]. The captured images will be assigned semantic labels based on the extraction of features and their categorization. This procedure unfolds step by step, beginning with the formulation of a classification scheme for the intended images. Subsequently, the images undergo preprocessing, which includes image clustering, enhancement, and scaling. Specific areas within the images are chosen, leading to the generation of initial clusters. Following this, an algorithm is applied to achieve the desired classification and, subsequently, corrective actions are taken in the post-processing phase.
In this study, computer vision (CV) and its detection capabilities, a field of AI application, have been used to analyze information derived from digitalized images [18]. The use of this technology is increasingly gaining popularity in various domains [19], both serving as a research tool and finding applications in the public and private sectors. Examples of computer vision applications include object extraction in photogrammetry [20], medical research [21,22], road tracking using aerial images [23,24], animal ecology [25], early fire detection [26], player tracking and ball tracking in sports [27], and in the building and construction industry [28].
Computer vision has been used to train a model for detecting aggregates quarries and pits from images obtained through satellite images, which is the main source of geographic data (Mehmood et al., 2022) [29]. The model can detect a quarry or pit within an image, mask the mining exploitation by its perimeter, and analyze its interior to look for crushing and screening facilities, converters, water bodies, or heavy equipment such as bulldozers, which are typical elements found in this type of exploitation.
This methodology has the potential to maintain updates on existing quarries [30], discover new exploitations, save time [23], and establish comprehensive and accurate quarry inventories at a low cost, improving safety by minimizing fieldwork, which could be a problem in certain countries. Additionally, it enables the integration of quarry locations, making them accessible to social, political, and economic practitioners, facilitating the establishment of appropriate extraction policies focusing on demand satisfaction while respecting nature conservation.

2. Materials and Methods

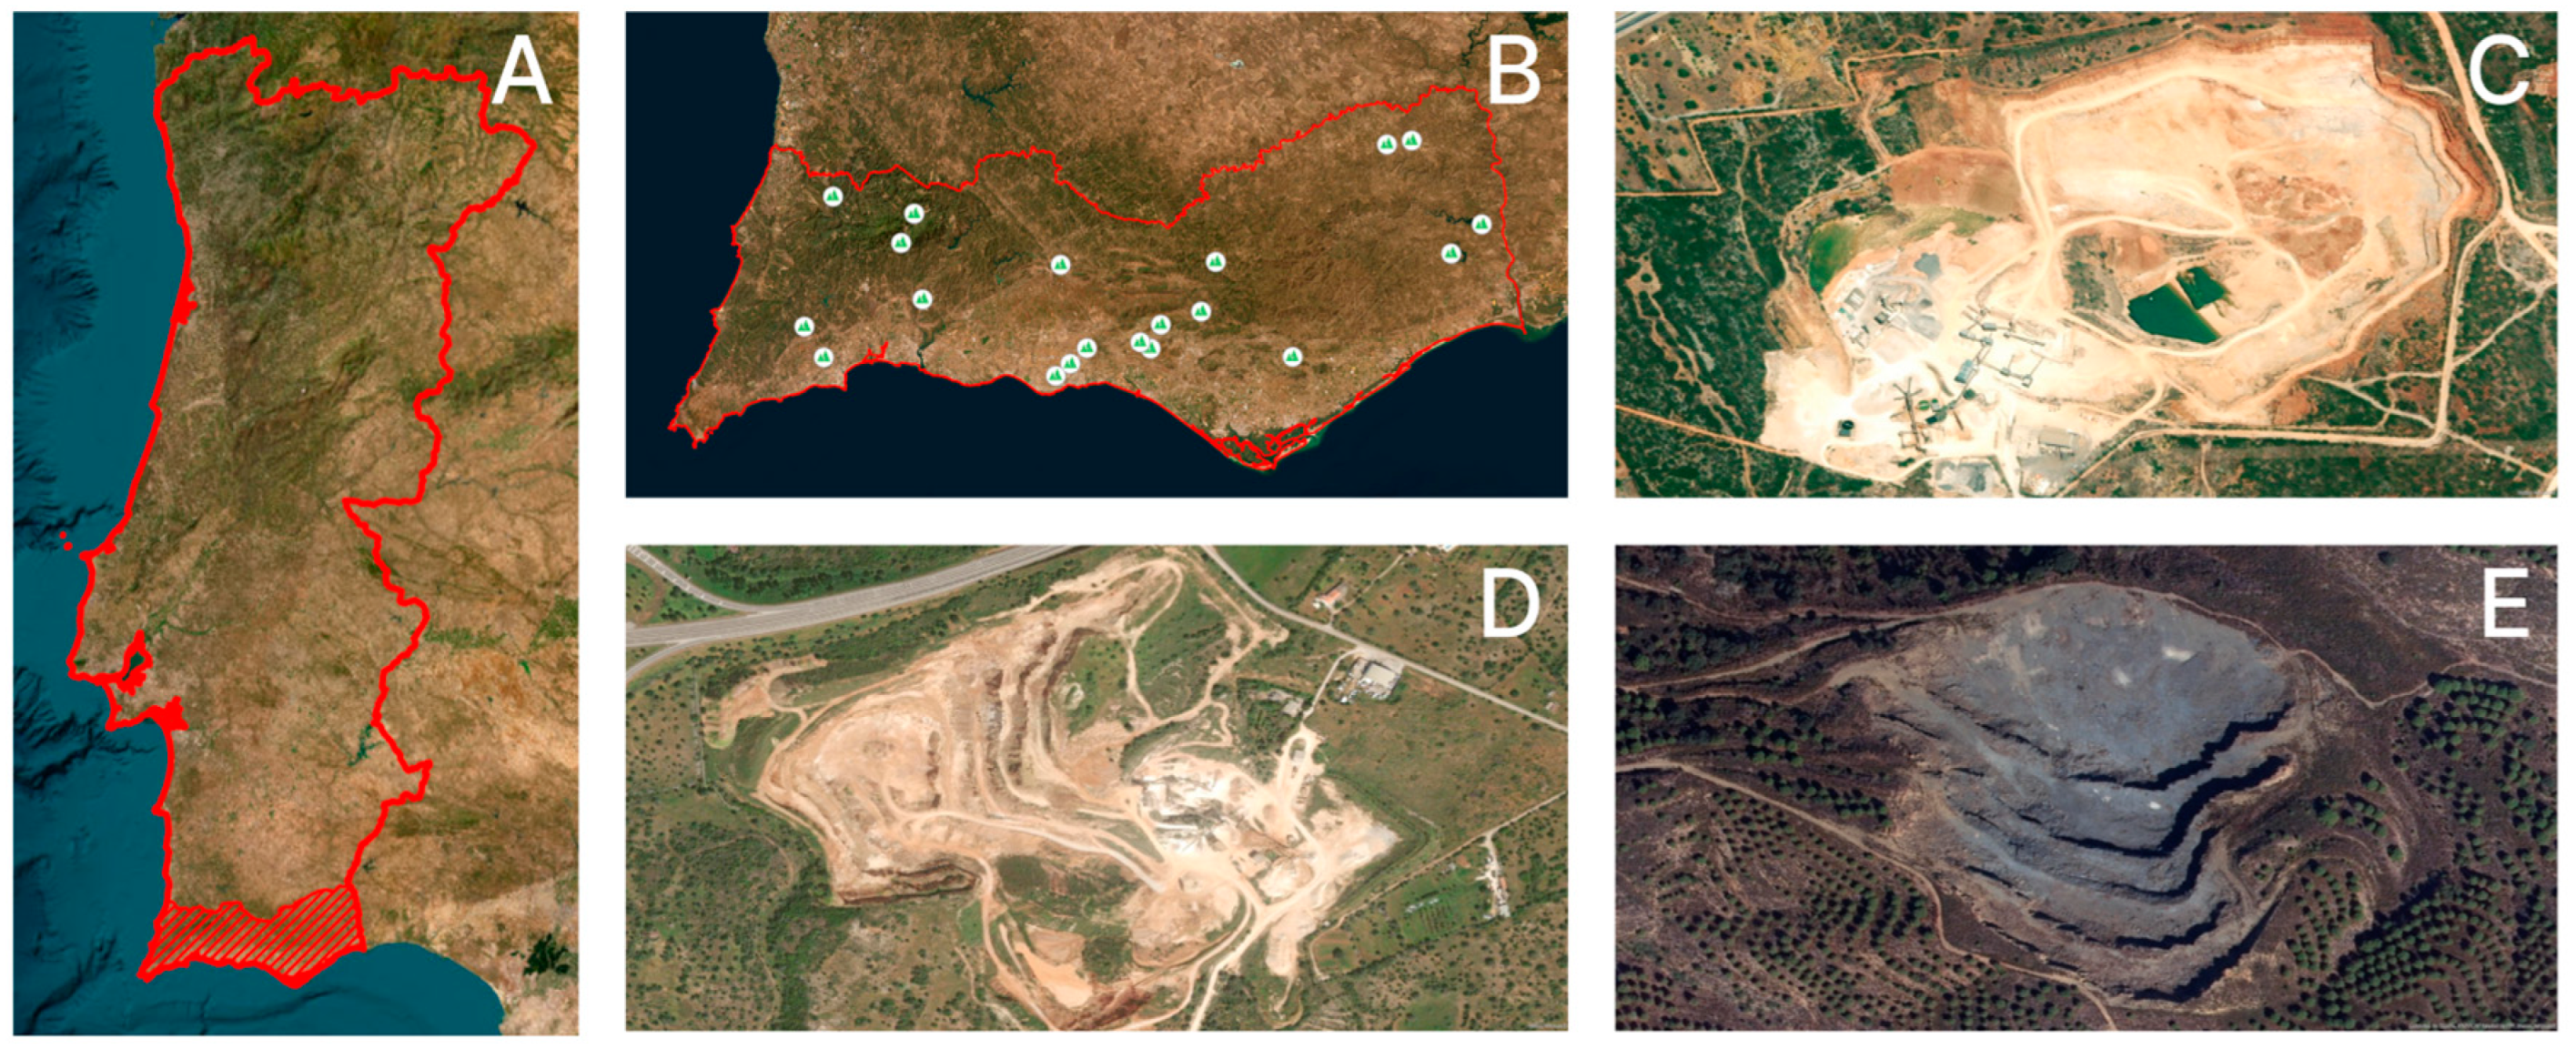
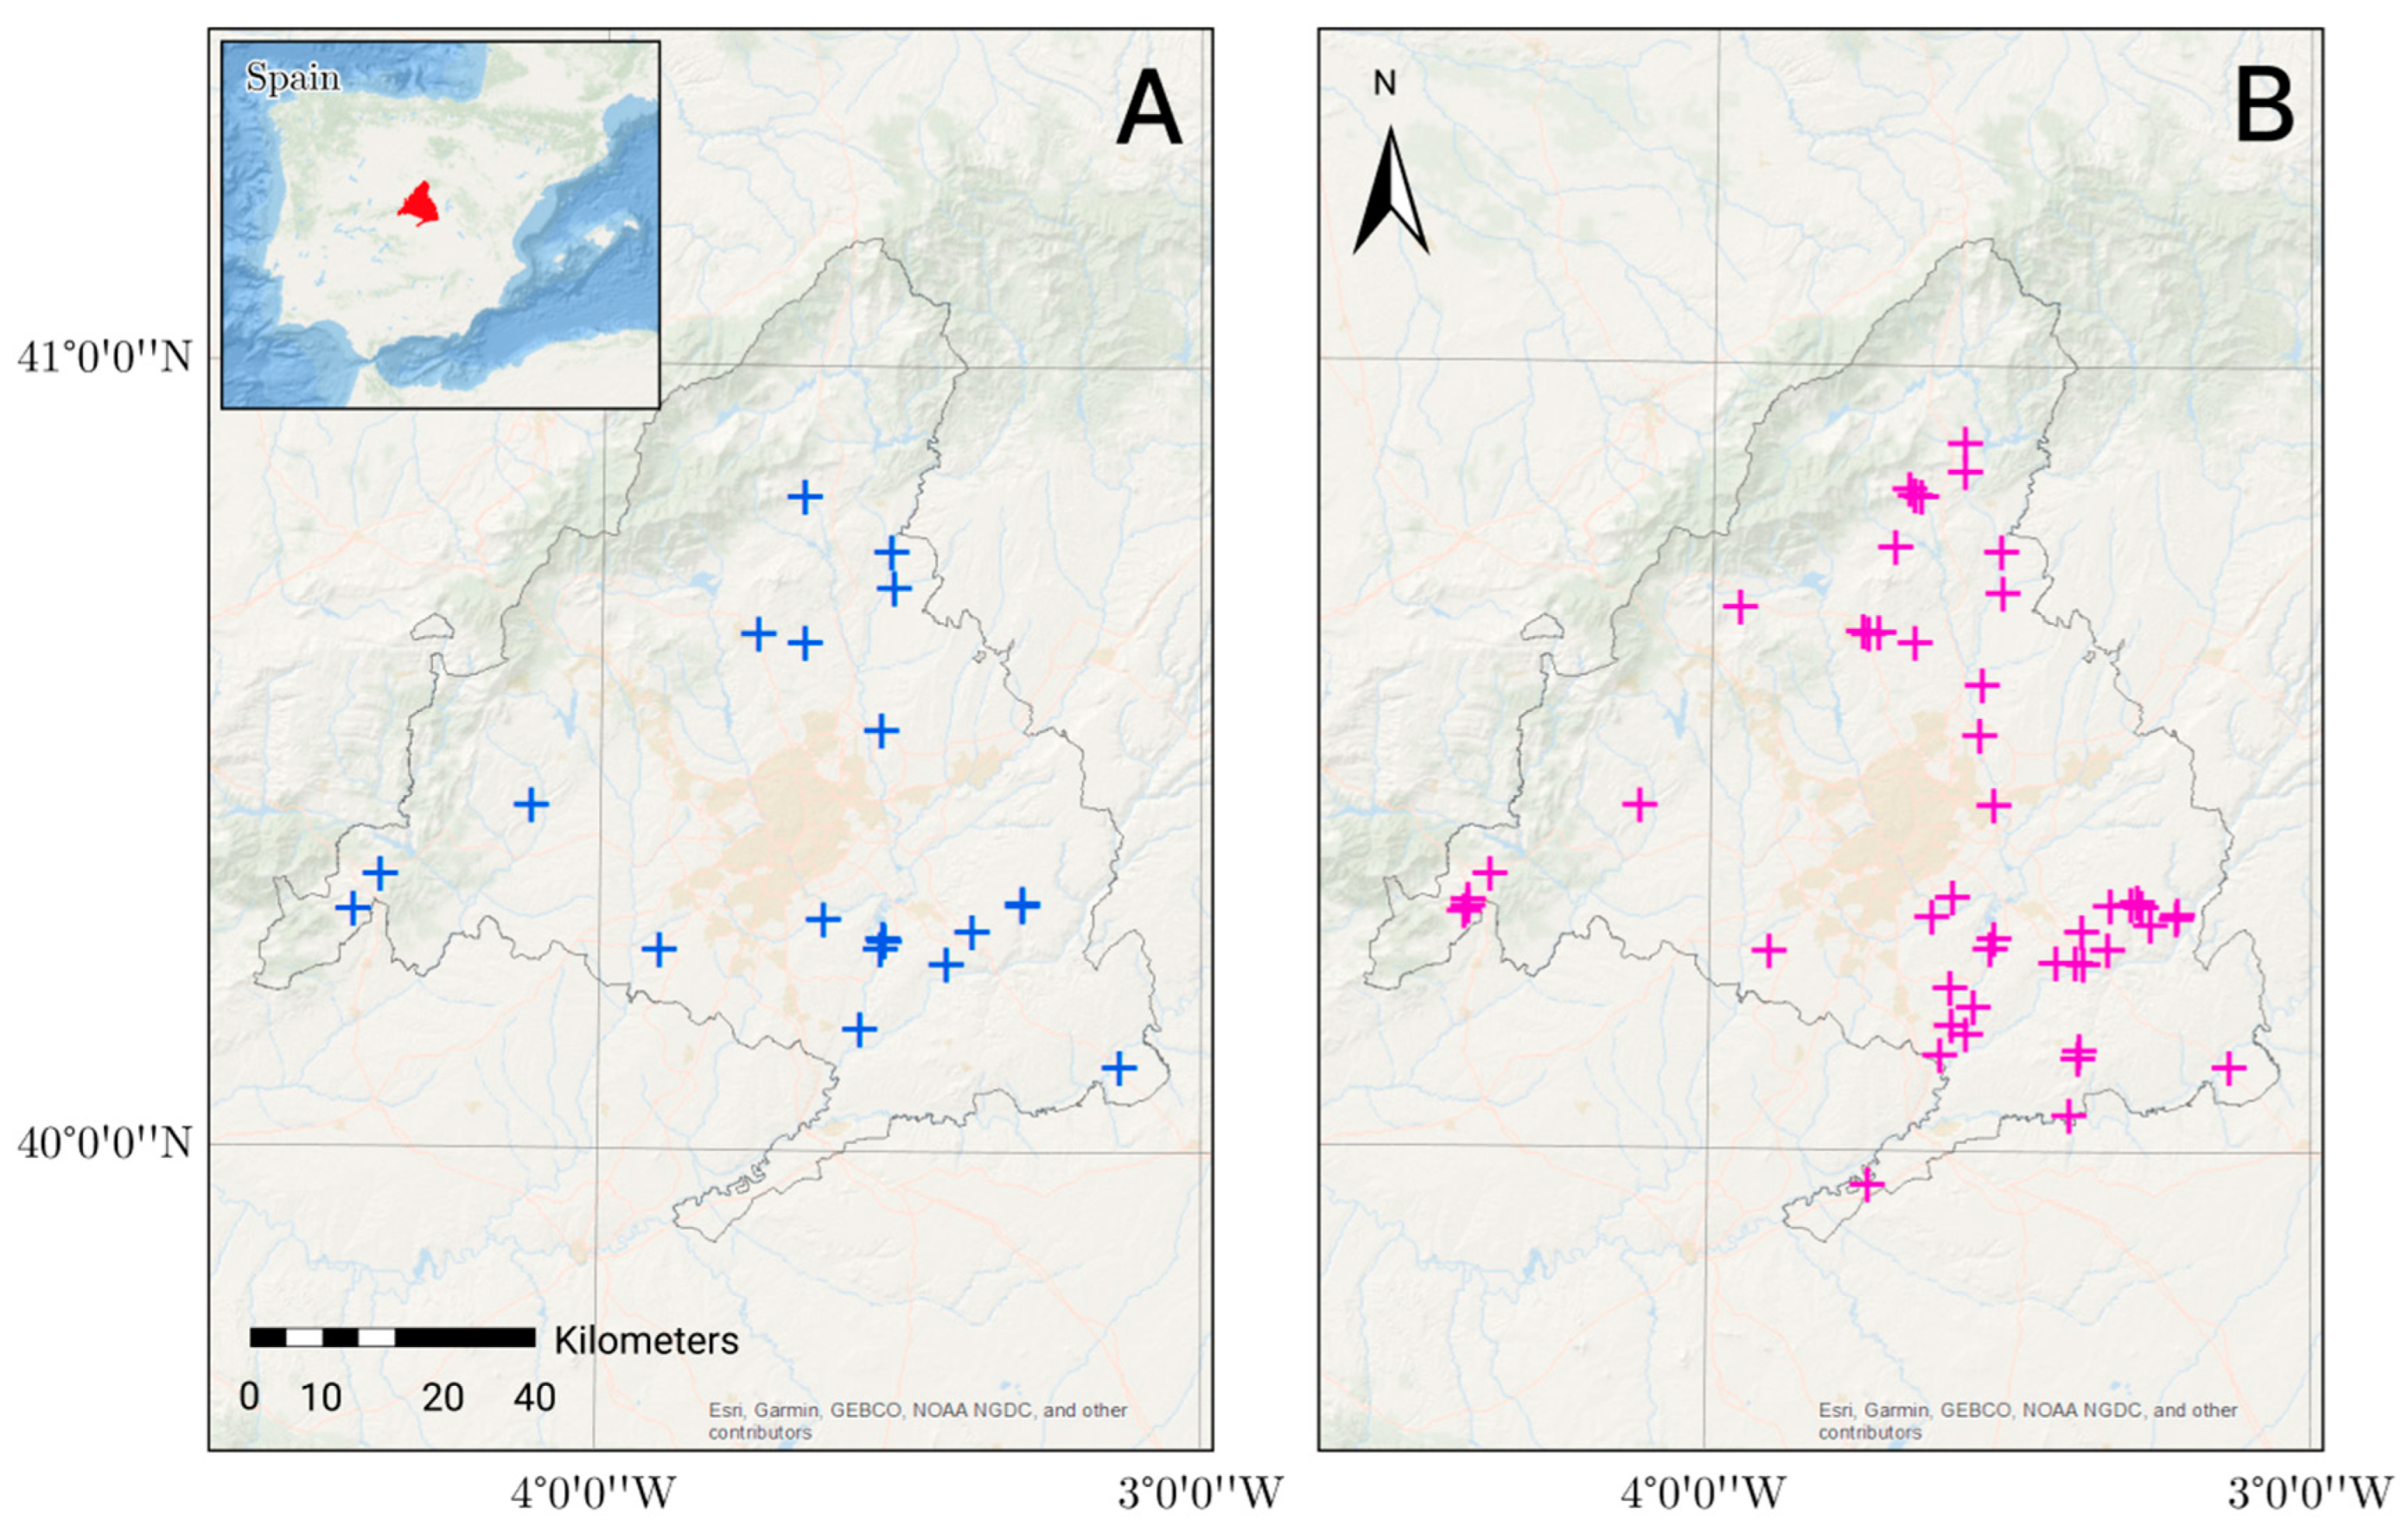
2.1. Materials and Environments
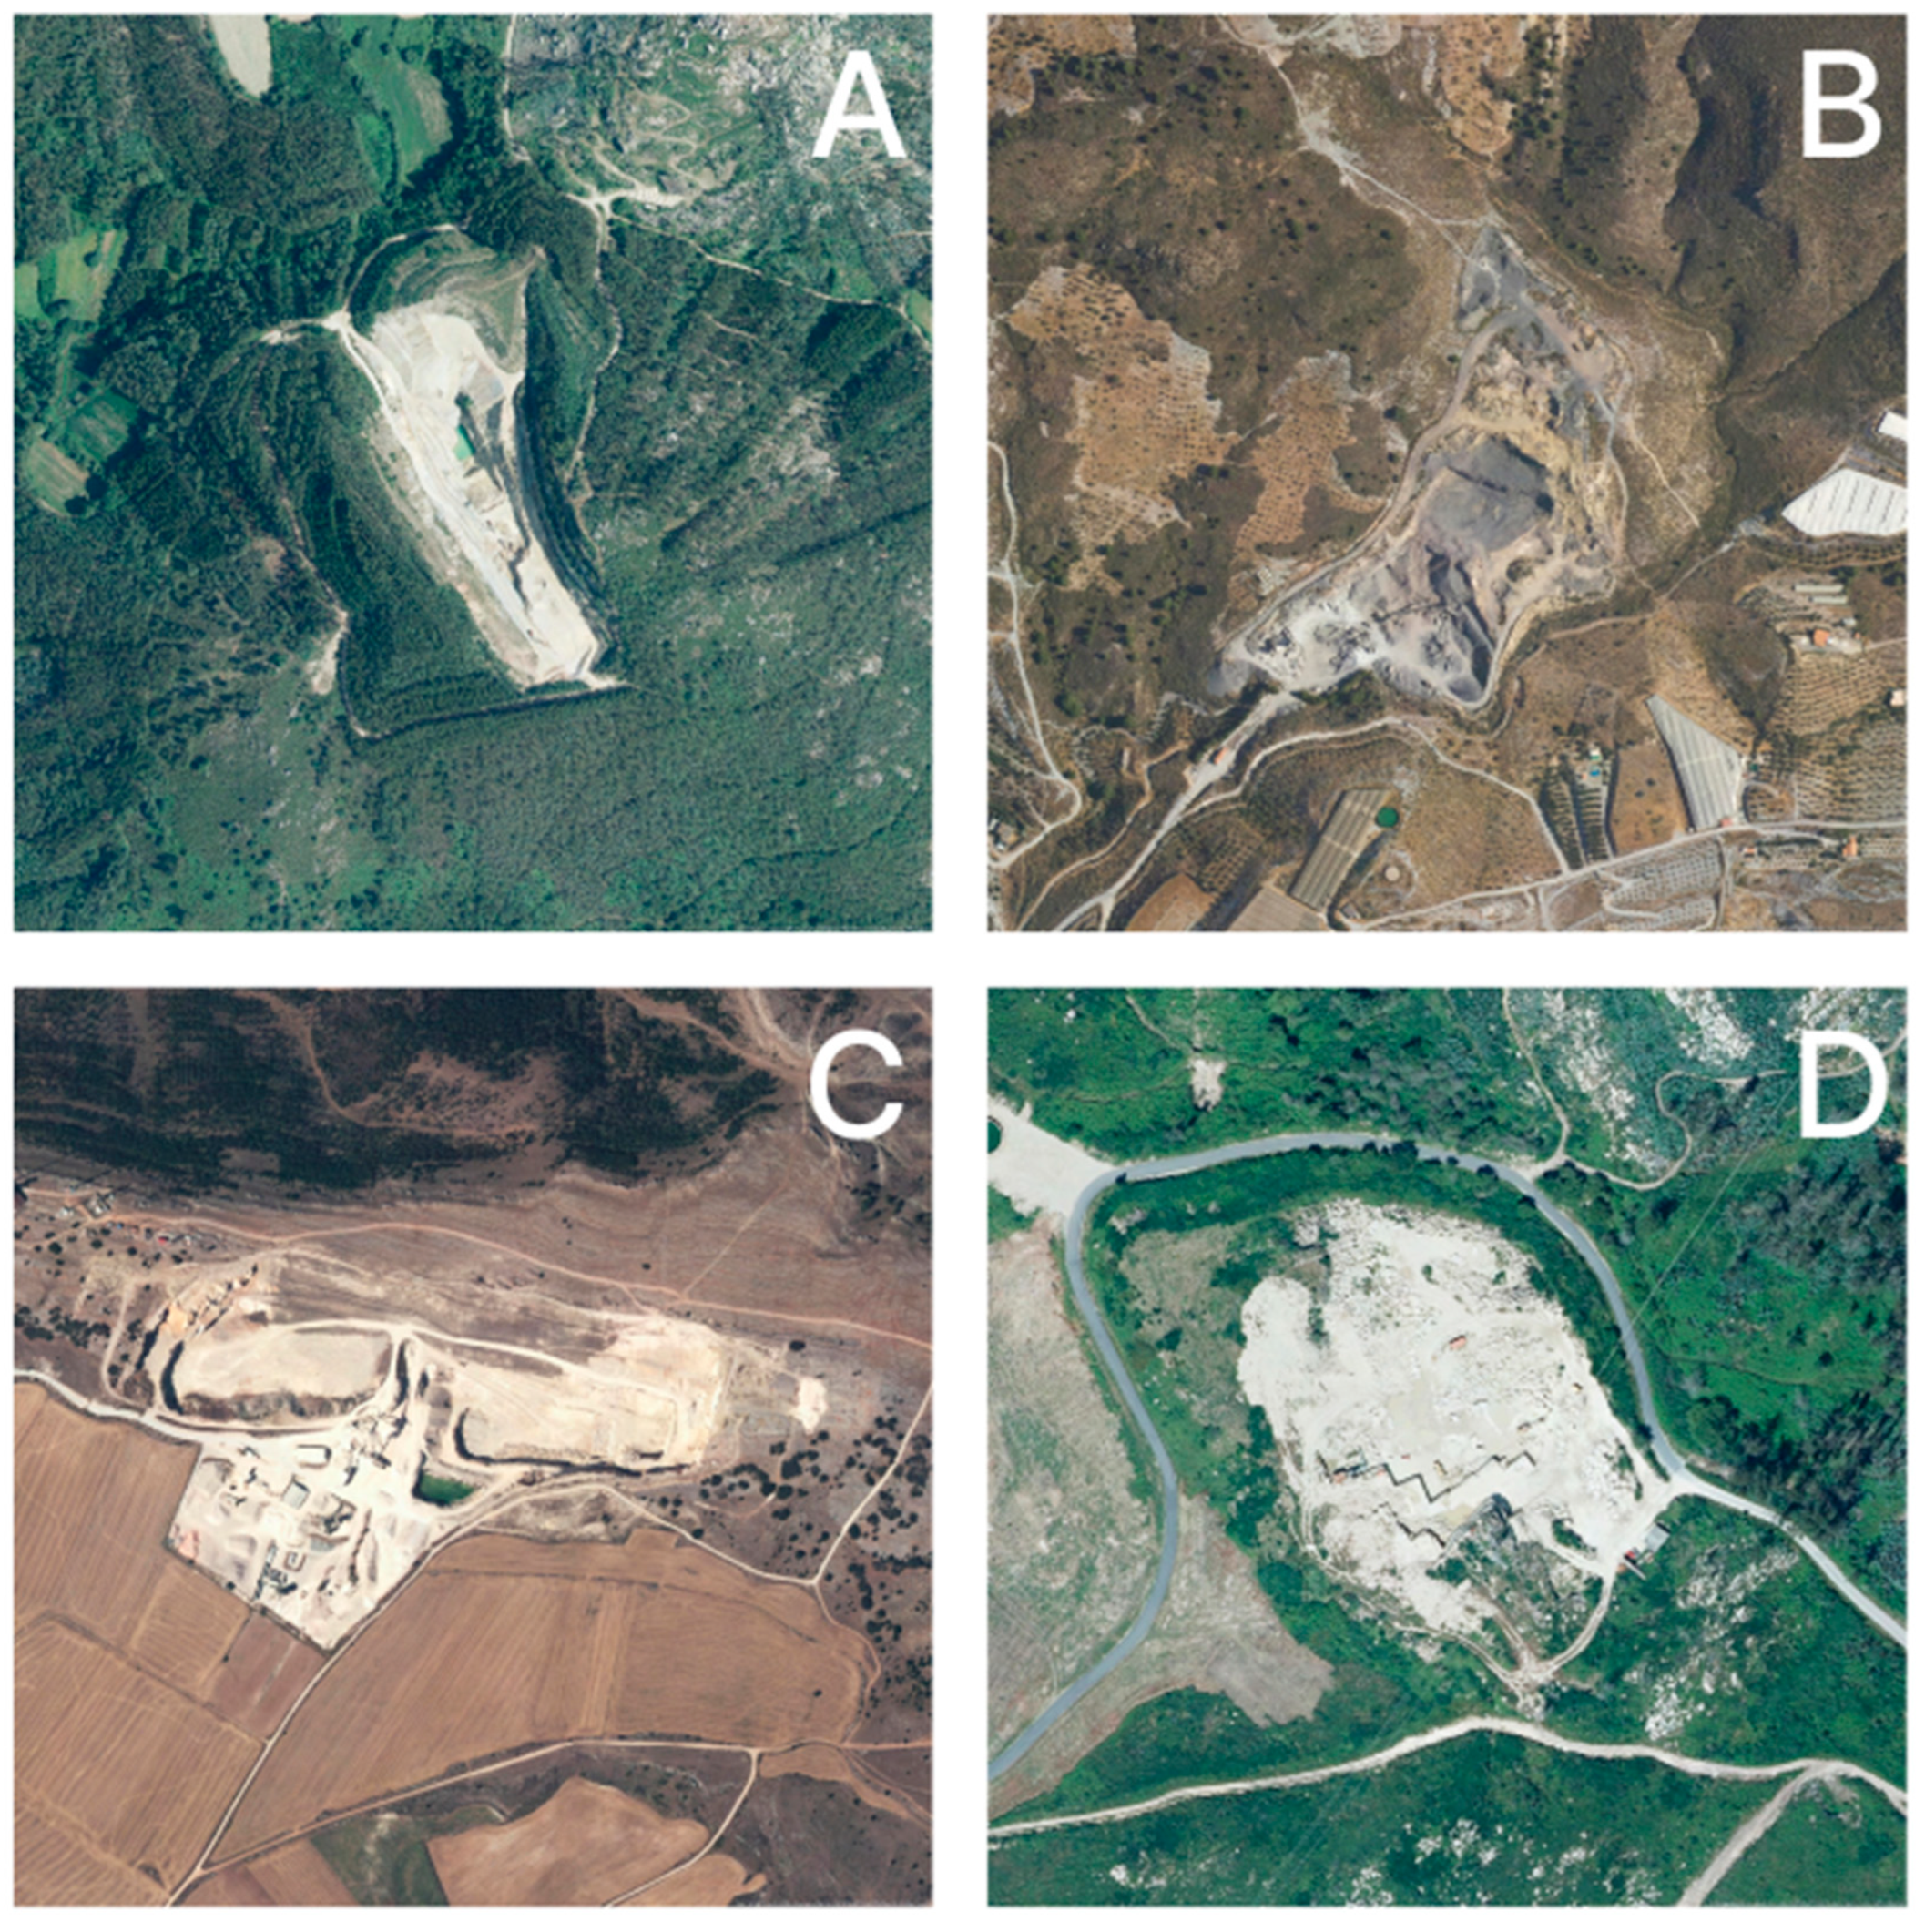
To perform the training and image analysis, a computer desktop PC with an Intel Core i5-3570 processor with 3.4 GHz (Intel, Santa Clara, CA, USA), 16 GB DDR3 RAM (Corsair Gaming, Inc., Fremont, CA, USA) and a GPU NVIDIA GeForce RTX 2070 (Nvidia Corporation, Santa Clara, CA, USA) with CUDA v11.7.64 was used. The artificial vision learning was conducted in virtual environments using Anaconda [31] and with its necessary software libraries. The version of Python 3.7.9 [32] was used.

2.2. Images Dataset

The first step taken to perform the learning models was the generation of the image dataset. The locations of the quarries in continental Spain were downloaded from the available sources, such as government and public administration databases, local databases, and even manual digitalization of the newest quarries that are not included in databases. All these quarries were processed and stored in a geodatabase using ESRI ArcCatalog [33]. From the total localized quarries, only those classified as active according to their status in the official documentation were considered for the study, resulting in 1010 aggregate quarries.
Once located, a detailed analysis was performed to determine the quality of the positioning data, and each of them was manually labeled using ESRI ArcMap [34], with a rectangle that contained the entire perimeter of the quarry used to obtain its bounding box (bbox). To automate the process of generating the image dataset, several scripts were created in Python 2.7 [32] using the ESRI ArcPy library for Python [35]. These scripts iterate over each quarry using satellite imagery from ESRI as a basemap [36], framing each of them using its bounding boxes and obtaining a high-resolution image in JPG format. The resulting images were named as the quarries’ unique ID values, allowing a fast link between the original and the produced data [2].
After obtaining the image dataset, all the images were labeled using a software called LabelMe [37]. For each image, the perimeter of the quarry was labeled and classified as a polygon, and each recognizable object inside the quarry was annoyed with a rectangle and classified in its corresponding class, logging up to 13 different object classes. A JavaScript Object Notation (JSON) file was created that stored the labeling data (geometries, screen coordinates, classes, and names).
For training purposes, another batch of 1010 images was prepared, in this case without any quarries on the images. To achieve different types of empty and quarry-like lands, each image corresponded to a variation of a few hundred meters from where a quarry was located. In this batch of images, no labeling task had to be carried out.

2.3. Image Classification Training

The second step taken to develop the analysis was to establish the image classification that leads to identifying what an image represents [38]. Learning training was carried out using a PyTorch-based library for image recognition [39] created by Anil Sathyan [40]. The image dataset was divided into a relation of about 80-10-10; 1616 images for training (808 positives and 808 negatives), 176 for testing (88 positives and 88 negatives) and 228 for validation (114 positives and 114 negatives).
The learning model was trained using Anil Sathyan’s Image Classification model [40]. After cloning the library repository with CUDA support, all the necessary main libraries (Numpy, Torch, TorchVision, TorchSummary) were updated to their latest versions. The default train file of the library was customized and configured with a batch size of 64, number of epochs of 60, and number of classes of 2, and multiprocessing was disabled as some operating problems were found. Custom training was carried out with three different models, ResNet18, VGG11 and Mobilenet12, obtaining the best test results with ResNet18. To automate the image classification, a script was created that takes an image folder as the input, analyzing all the images within it and generating a JSON file with the results.

2.4. Image Segmentation Training

After establishing the image classification, image segmentation was performed with the aim of dividing each image into different zones or regions. This process is based on the characteristics of pixels that permit identification of the boundaries of the quarries to simplify the images and analyze them in a more efficient way.
To perform the image segmentation, a script was created in Python using the TensorFlow machine learning and artificial intelligence library [41], adapting a Jupyter Notebook created by Zaid Alyafeai [42] to develop the image segmentation using a convolutional neural network (U-Net) [43].
To continue with the training process, all the images with quarries (1010) and their corresponding JSON files were used. As only the contours were necessary, a script was developed to clear the JSON files, leaving only the data corresponding to the quarries, removing the rest of the data. Additionally, as the segmentation library required the use of PNG masks of the contours for training, all the JSON files were processed to create images using a script with the Pillow library functionalities [44]. The dataset was split into a relation of 95-5; 960 images were used for training and 50 images for testing.

2.5. Object Detection Training

Object detection is based on a mathematical regression applied to the bounding boxes spatially separated between them and to the associated object class probabilities [45]. This step is necessary to help identify elements within a quarry. This way, common quarry objects, such as bulldozers, water bodies, crushing facilities, etc., are detected and lead to the determination with a higher probability that the quarry is a real aggregate quarry, and moreover, that it is an active aggregate quarry.
To perform the object detection, an open-source engine-based library of Convolutional Neural Networks (CNNs) [46] was used: Darknet [47]. It was decided to use CNNs because these networks are widely used for image classification due to their ability to learn local and global features in images [29]. The engine was configured to be used with CUDA, which is a programming model and computing platform created by NVIDIA in 2006 that allows using graphics processing units (GPUs) for processing computation [48]. This library also uses OpenCV, an open-source computer vision and machine learning software library that allows real-time computer vision to be performed [49].
As Darknet is a supervised learning algorithm, its training requires labeled data input [29]. In this case, only quarries with labeled objects were used for training. As object training requires a long computation time, the different classes were reduced to only three: spider-like structures (crushing and screening facilities with radially departing conveyor belts), excavators, and water bodies. To keep only information about these three classes, the JSON files of those images were filtered. The total number of objects used for training was 342 spider-shaped labels, 1452 excavator labels, and 1786 water bodies.

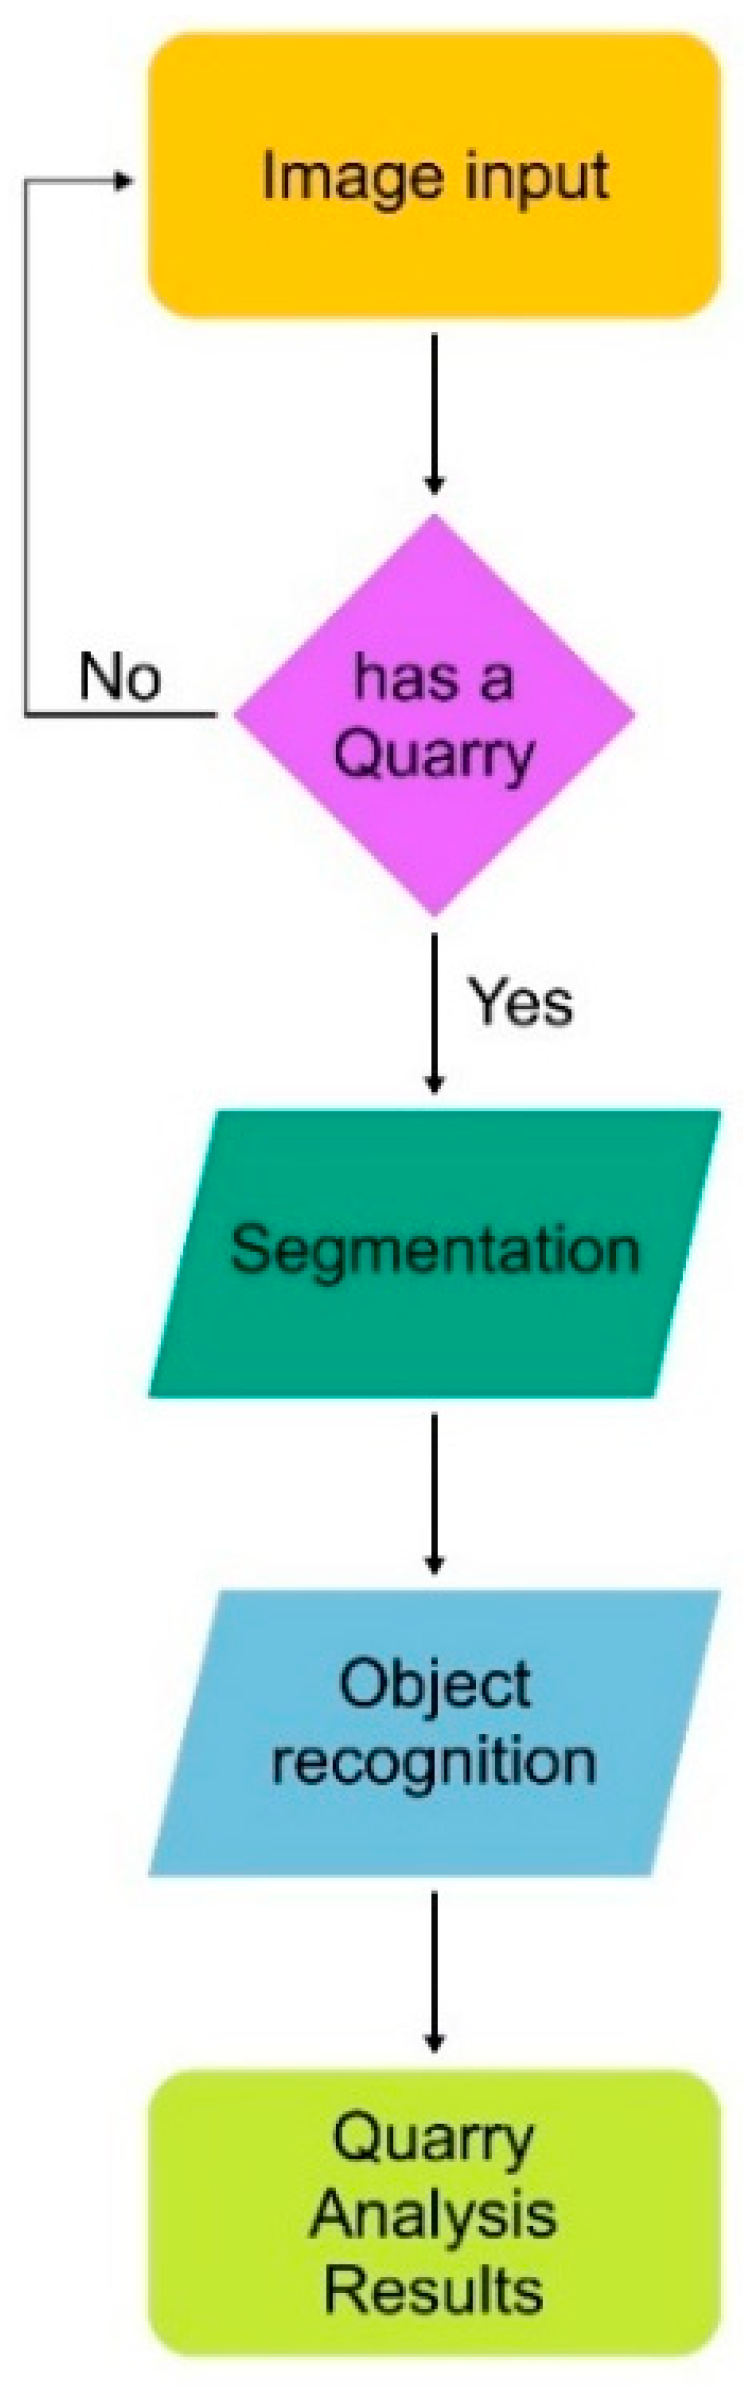
2.6. Assembly of the Code

After the three training models were finished and working, to carry out all the detection, a walkthrough was developed to follow a working methodology (Figure 1). First, it checks if the image contains a quarry or not (as explained in Section 2.3); then, if the detection is positive, it generates the segmentation of the image (Section 2.4) and afterwards detects the objects within the image (Section 2.5).

3. Results

3.1. Quarry Classification

The image classification results demonstrate a highly favorable outcome, as evidenced by the recall value of the model of approximately 98% and a closely matching F1 score of 96.2%. Assessing the true positives and false positives, the model achieves a precision of 94.7%. This precision is particularly noteworthy considering the inherent challenges posed by the diverse nature of the quarries. Despite the shared characteristics, such as whitish extraction areas and the potential presence of water bodies or common mining structures, quarries exhibit significant variability. This diversity is determined by having different shapes, influenced by the deposit morphology, extraction permits, and various other factors (Figure 2). Furthermore, the quarries differ in the surrounding environments and excavation methods, evident in the dissimilarities between the extraction of aggregates (Figure 2A–C) and the excavation of ornamental rock (Figure 2D).
Even in the absence of quarries in the images, the results remain promising, with an accuracy of nearly 93%. False positives in such cases can be attributed to surfaces that share properties akin to aggregate quarries, such as small glacial cirques, open fields on light-colored materials (mostly sedimentary), or covered surfaces that present a whitish appearance in the satellite image due to reflection.
It is important to note that these false positives, although present, do not raise significant concerns. Subsequent image segmentation and object classification become essential, allowing for a more nuanced analysis to differentiate between actual quarries and potential false positives. Therefore, these results contribute valuable information to discern the true nature of the depicted features, aiding in decision-making processes about quarry identification.

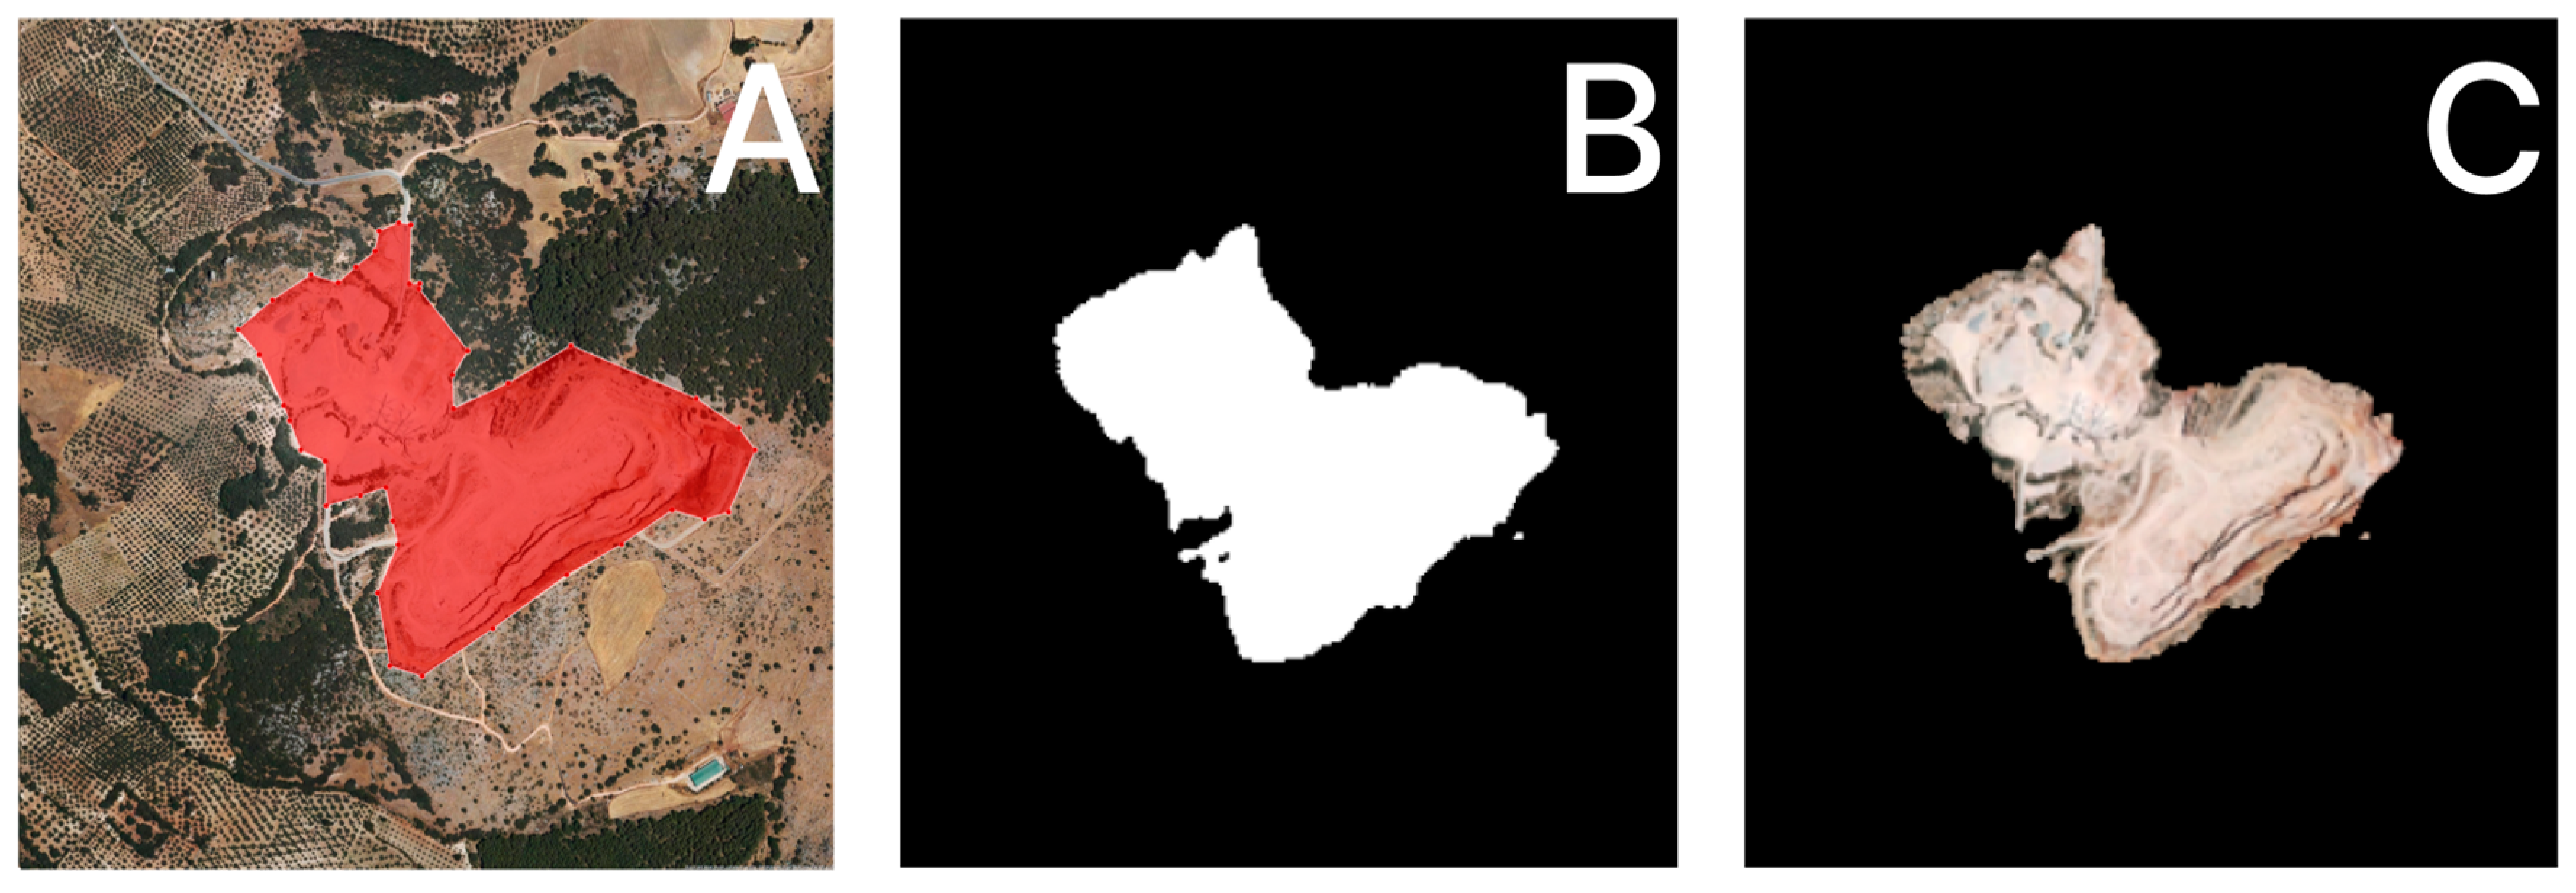
3.2. Quarry Segmentation

The results derived from the quarry segmentation show promise, with the mean value of the intersection over union (IoU) for the validation dataset approaching 78%. This achievement is noteworthy and can be deemed satisfactory for training purposes, as reported by Hasty [50].
In contrast to segmenting other objects, such as traffic signs [51] or geometric shapes [52], quarries present a unique challenge due to their inherent variability. Unlike objects with standardized shapes, each quarry and pit differ from the others, lacking a singular pattern in terms of the shape and perimeter. Despite this complexity, the results are notably positive, showcasing a comprehensive segmentation of various quarries (Figure 3).
It should be noted that certain limitations are observed along the edges and in the segmentation of some internal quarry components, particularly those that include vegetation or buildings with roofs. However, these limitations have a negligible impact on the subsequent step of object detection.

3.3. Quarry Object Detection

Although the detection and segmentation of the quarries have yielded favorable results, the object detection aspect proved less conclusive. Initially, despite attempting to differentiate up to 13 distinct classes of objects, the training process was time intensive. Consequently, it was decided to focus on three classes for practical application. Specifically, the training focused on objects commonly found within aggregate quarries: bodies of water, excavators, and grinding and screening facilities featuring radially departing conveyor belts.
The precision results from the detection model for these three classes reveal an intersection over union (IoU) of 31%, surpassing the acceptable threshold for false positives and negatives. In particular, the detection accuracy varies between specific classes, with extraction buildings and bodies of water achieving a 40% accuracy, while objects resembling excavators exhibit a lower accuracy of 13%.
The primary explanation for these results is rooted in the scale of the satellite images, which impacts both the training and detection models. Given that the training dataset for the quarry images presupposes the presence of a quarry in each image, the varying scales of individual quarries pose a challenge. Some objects are well-defined in certain instances, while their resolution diminishes in others. Although object detection models can be configured to account for different scales during training, this requires an extensive dataset containing diverse examples in various sizes.
Despite these challenges, the current utility of the system lies in its ability to detect objects within quarries. Adjusting the detection confidence ranges allows the identification of objects, acknowledging the presence of false positives. Figure 4 illustrates this detection process, showcasing the bounding boxes of objects (Figure 4A) and the program’s detection results (Figure 4B).
Some deficiencies in the identification process are evident in the case of abandoned or non-operational aggregate quarries at the time of the satellite image capture due to the absence of vehicles or structures. Although the image is classified as a quarry, the model may erroneously indicate a lack of content, leading to a potentially lower detection assessment for what is, or was, an aggregate quarry. To address this problem, a potential solution involves broadening the range of structures to be detected. This could include features such as internal dirt roads, pathways that lead away from the quarry, and the presence or absence of vegetation. Methods for achieving this could involve training the model to recognize vegetation types, calculating the Normalized Difference Vegetation Index (NDVI) in remote sensing, or assessing the percentage of colors within the quarries, adjusted for seasonal variations.

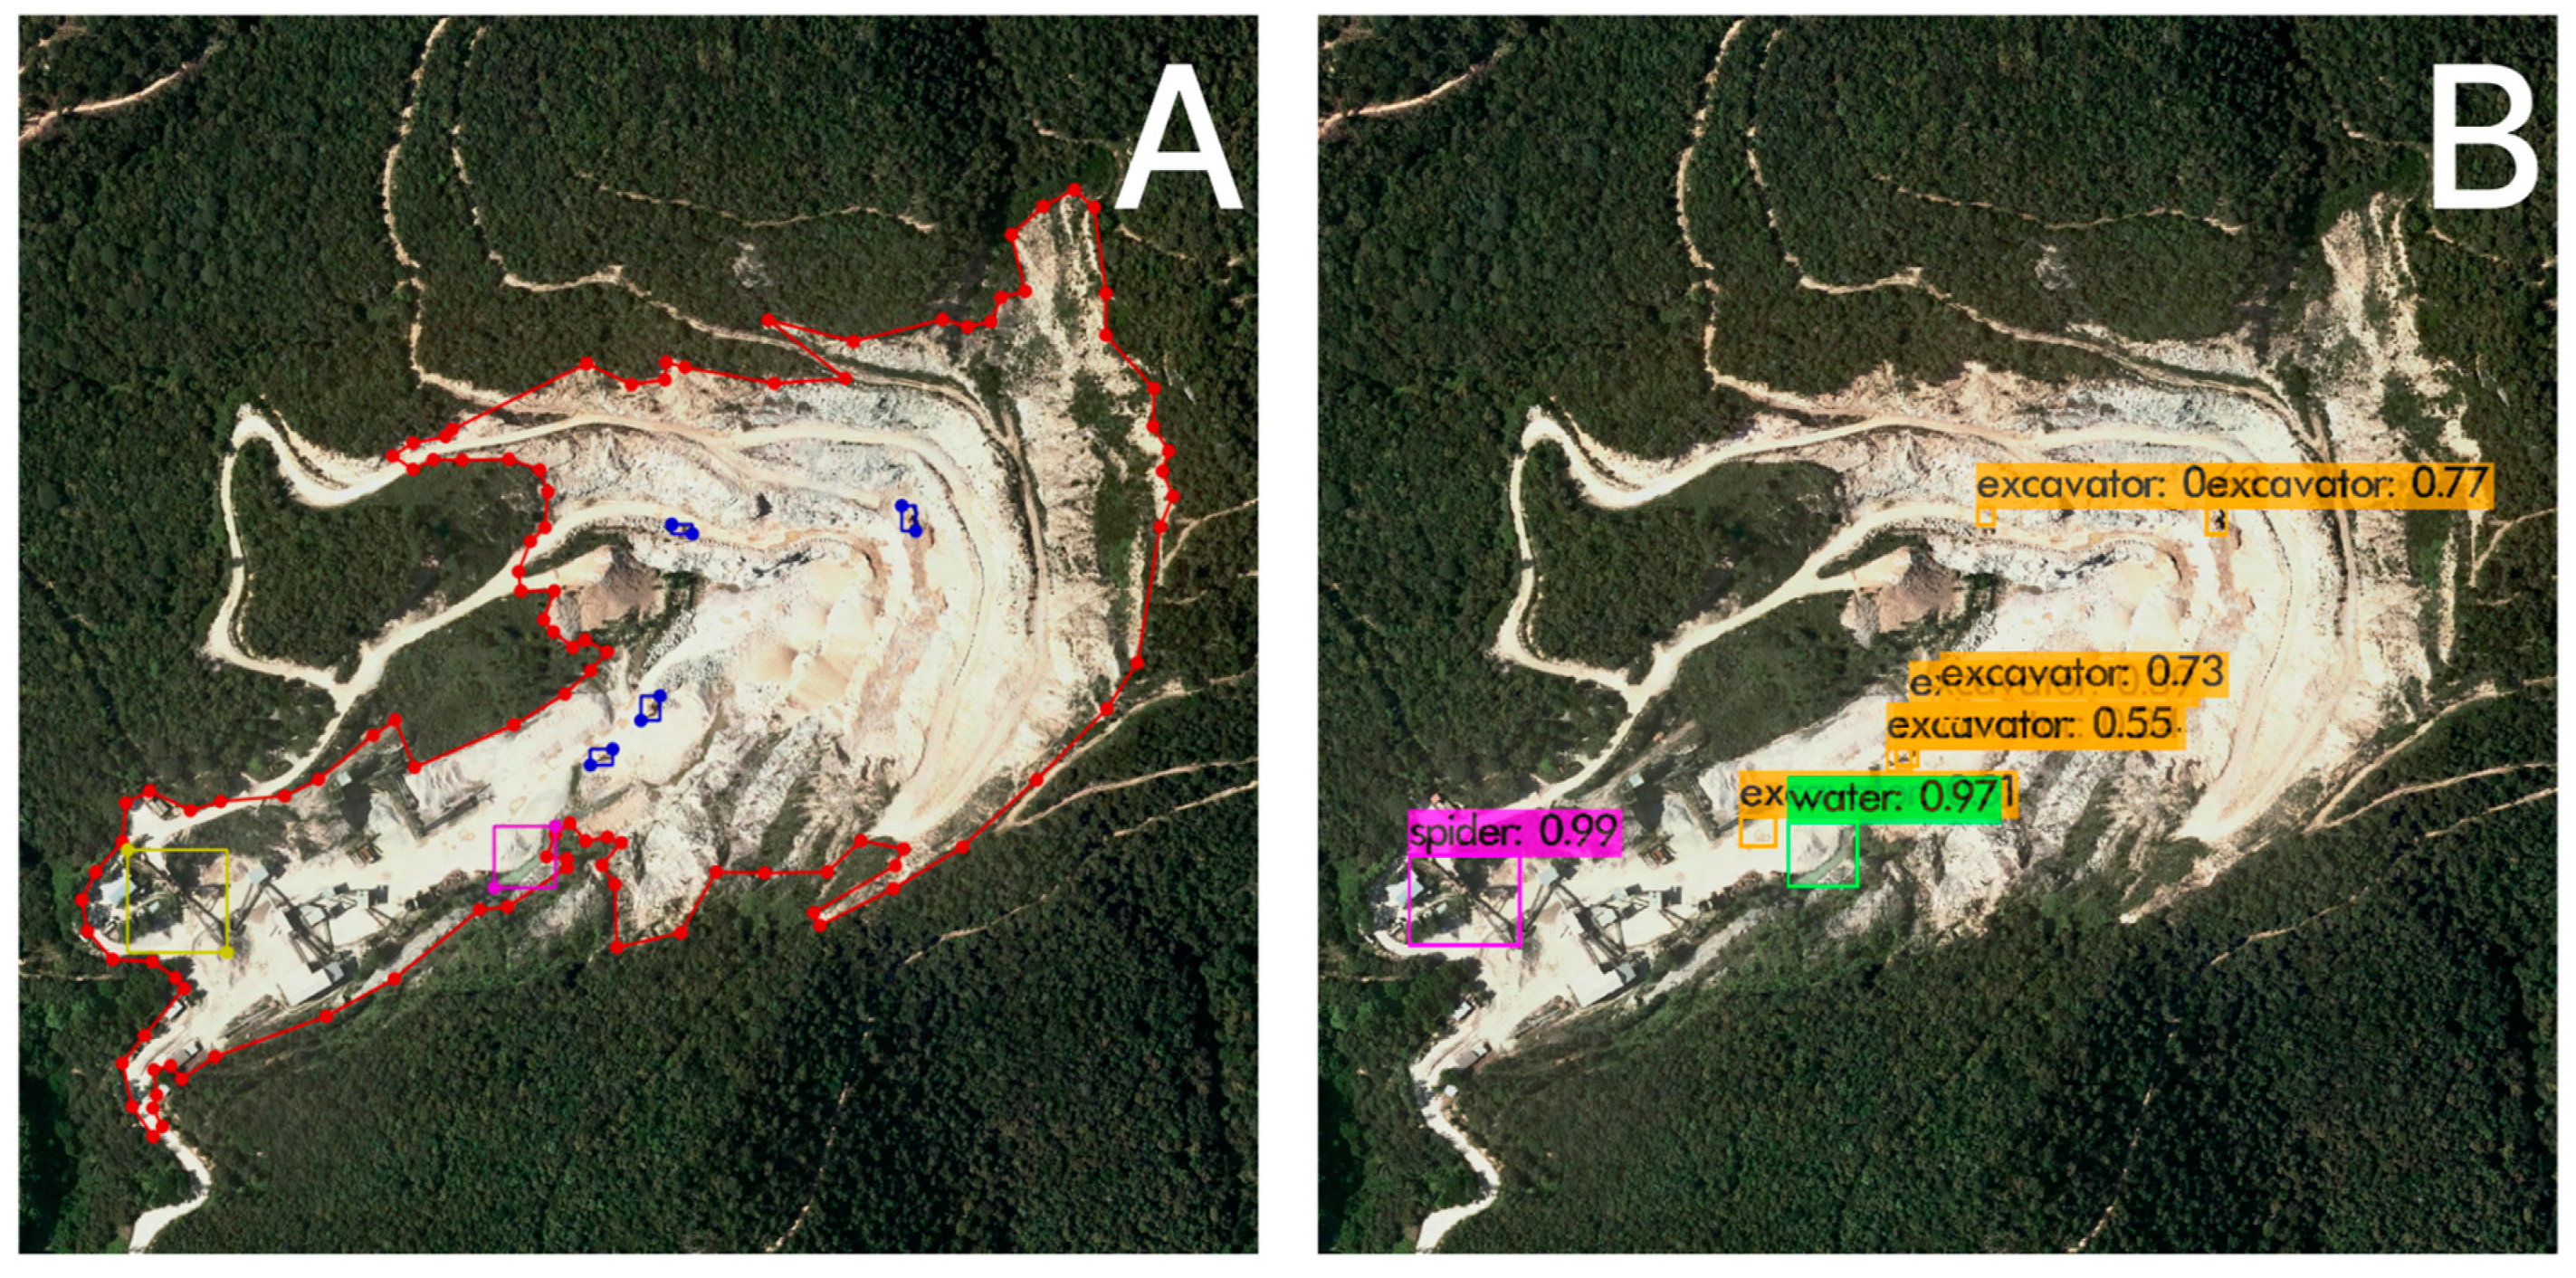
3.4. Validation of the Methodological Approach: Additional Case Study

Although a portion of the image dataset is typically reserved for testing models and assessing their accuracy during training, a practical evaluation was performed to determine the effectiveness of the applied model under real usage conditions in southern Portugal.
The Faro district, located in the southern part of mainland Portugal, has been used to validate the performance of the methodology. Of the 21 quarries present in the district (Figure 5), the model detected 19 of them, obtaining their masks and detecting objects inside those that had excavators, bodies of water, or crushing and screening facilities. In the case of the two undetected quarries, one of them was abandoned and its surface was darkened by vegetation, and the other was closed and under restoration, the slopes covered with dark tarpaulins and vegetation.

4. Discussion

The significance of aggregates for sustainable resource management lies in their role as a key contributor to resource productivity within the European Union. However, aggregates extraction requires the development of efficient methods to mitigate environmental impacts [53]. In terms of the sheer volume, the aggregates industry emerges as the most resource-intensive sector across Europe. Sustainability, in this context, involves maintaining a constant natural capital stock of a resource over time [54].
Furthermore, the life cycle of aggregates extraction and production has significant environmental implications, highlighting the need for measurements to inform policy actions and the formulation of national regulations. In aggregates exploitation, the location of the quarries and the quality of the produced material are key factors, both linked to geological considerations. The extraction process leads to alterations in the landscape and groundwater, although the land occupied by aggregates quarries is very low compared to the total territory of a country. In Germany, for example, which is the country with the highest aggregate production, it uses only 0.005% of its total area for mining aggregates. Anyhow, this land cannot be easily repurposed for other uses for a long period of time [53].
In some cases, these territories exhibit irreversible alterations to the terrain, resulting, for example, in the destruction of habitats and biodiversity. Restoration efforts, on the other hand, can contribute to enhancing and compensating the surrounding environments, thereby positively influencing biodiversity in accordance with national and European directives. Another negative environmental impact is related to the transportation and trade of this raw material. Aggregates costs depend on their transport length, meaning they are high place-value material [55], producing the energy-intensive and CO2 emission, increased through their use in the manufacturing of concrete, mortar, and cement.
The importance of evaluating the expected demand for aggregates is of environmental relevance. Extraction, waste generation, uses, and recycling measures, together with socioeconomic analyses, lead to the proper establishment of sustainable management of this natural resource, both locally and regionally, and policymakers can focus on their direct environmental impacts. Determining the location and quantification of quarries in a region and whether they are active or not can be used to establish sustainable policies regarding resource needs in a specific area, for quick and straightforward assessments and control of quarry inventories, or even for locating illegal mining activities.
To assess the suitability of this analysis, a comparison has been made between the number of quarries inventoried in the province of Madrid, Spain, and the number of quarries that can be detected using this new approach (Figure 6). This allows the evaluation of its suitability, efficiency, and potential for use in other initiatives.
The number of quarries inventoried in the province of Madrid (Figure 6A) is 20 [2]. The results of the image recognition of the quarries indicate that there are currently 48 active aggregates quarries in the same area (Figure 6B). The differences in number between both datasets are mainly due to the lack of actualization of information within the official inventories. In other cases, in the inventories appear exploitations and not quarries, and the same exploitation may be composed of various quarries. Moreover, some small-size quarries appear dependent on other larger-size quarries and therefore they do not appear in inventories, while these types of data should be included as additional information within the inventories.
There are two quarries that show anomalies, mainly due to their size or abundant vegetation, but overall, the study allows the detection of quarries that have stopped operations or even those not inventoried. This establishes the suitability of the method developed in this work and its utility in countries with less control due to various socioeconomic issues. It also assesses the efficiency of the method and the possibility of quickly establishing sustainability policies based on the raw material needs depending on the demands of each region.
The prospects of using computer vision for quarry detection are promising. In developed countries with regularly updated orthoimage cartography, the maintenance of current quarry records becomes feasible, allowing the swift identification of new exploitations and monitoring activity at closed or abandoned sites. Mining companies can use this technology to detect areas with concentrated mining operations during prospectivity studies.
Aggregates quarries involve managing operations in a manner that balances economic viability with social responsibility and environmental supervision. The detection of quarries and the correct control of their use will help to implement efficient quarry management practices that lead to optimizing the extraction of aggregates while minimizing environmental impacts, including the possibility of developing better land restoration strategies, restoration, and conservation of biodiversity. Detecting quarries with water accumulation could serve to minimize the pollution of water bodies, develop strategies such as recycling water, or minimize runoff and sedimentation. Furthermore, detecting abandoned quarries could help reclaim mined areas for productive land use after extraction.
In the context of developing or undeveloped countries, both government agencies and nongovernmental organizations (NGOs) can rapidly establish mining records without the need for extensive on-site travel. This approach offers time and cost savings, along with enhanced security advantages in specific regions [56]. Automation in quarry detection allows for almost real-time control of quarry inventories, facilitating the updating of crucial databases for various analyses and related studies. This ensures that the models’ results can adapt to a more realistic scenario.
In addition, the accurate evaluation and control of aggregates quarries as actors in the circular economy are crucial for managing, reusing, and recycling various wastes. This ranges from the recovery of high-value components to the production of recycled aggregates and the management of construction and demolition waste (CDW). Additionally, promoting actions to improve efficiency in managing mineral raw material resources, reducing waste volume, improving existing waste management plans, and, where applicable, emphasizing reuse, recovery, and recycling are essential components of sustainable resource management.

5. Conclusions

This study demonstrates the feasibility of the automatic detection of aggregates quarries using computer vision analysis of satellite images. Through training on a personal computer, the model achieved a high probability of detecting quarries, generating masks to outline quarry limits and performing object detection within them. This approach, obtained on a relatively low budget, suggests that computers can be used for artificial vision training, producing high-resolution image datasets from satellite providers with great results.
The proposed methodology offers diverse applications. In developed countries, it enables rapid quarry detection and monitoring by maintaining up-to-date quarry records, identifying new exploitations, and monitoring closed or abandoned sites. It facilitates efficient quarry inventories, allowing quick assessments, control, and anomaly detection even in regions with less control due to socioeconomic issues. Furthermore, the methodology leads to significant cost and time savings for government agencies and NGOs in developing or undeveloped countries, allowing rapid establishment of mining records without extensive travel to the site and improving human security.
Automation in quarry detection permits fast and efficient control of quarry inventories in real time, facilitating crucial database updates for analyses and studies. Accurate evaluation and control of aggregate quarries also contribute to the circular economy by managing, reusing, and recycling various wastes, aligning with broader sustainability goals. Policymakers are encouraged to focus on the direct environmental impacts highlighted by this study to achieve sustainable resource management. By integrating sustainability principles into aggregates quarrying operations, companies can mitigate environmental impacts, enhance the social license to operate, and contribute to the long-term viability of the industry.
The technical feasibility of aggregates quarry detection opens avenues for both research and practical applications. The adaptability of the methodology to various needs and resources makes it versatile and its extension to quarries of other materials is plausible.

Author Contributions

Methodology, M.J.H.; Software, F.J.L.-A. and M.A.P.F.; Validation, M.A.P.F.; Formal analysis, F.J.L.-A. and M.A.P.F.; Investigation, F.J.L.-A. and M.J.H.; Resources, M.J.H. and J.I.E.; Writing–original draft, F.J.L.-A. and M.J.H.; Writing–review & editing, J.I.E.; Supervision, M.J.H. and J.I.E.; Funding acquisition, M.J.H. and J.I.E. All authors have read and agreed to the published version of the manuscript.

Funding

This work received financial support from Project 4159352, “Petrología y Geoquímica de materiales sedimentarios” and Project 4156596 “Caracterización de los materiales empleados en la restauración de graveras en el río Jarama, both from Fundación General UCM; and Project 62.09.22 “Aplicación de la Inteligencia Artificial a la gestión de los recursos geológicos”, Fundación Agustín de Betancourt, Universidad Politécnica de Madrid (UPM).

Institutional Review Board Statement

Not applicable for studies not involving humans or animals.

Informed Consent Statement

Not applicable.

Data Availability Statement

The data presented in this study are available on request from the corresponding author.

Acknowledgments

The authors would like to acknowledge the Universidad Complutense de Madrid, Universidad Politécnica and Indra Sistemas.

Conflicts of Interest

Authors Francisco J. López-Acevedo and Miguel A. Peláez Fernández were employed by the company Indra Sistemas. The remaining authors declare that the research was conducted in the absence of any commercial or financial relationships that could be construed as a potential conflict of interest.

References

  1. GAIN. Global Aggregates Information Network. Available online: https://www.gain.ie/ (accessed on 12 January 2023).
  2. López-Acevedo, F.J.; Escavy, J.I.; Herrero, M.J. Application of Spatial Data Mining to national mines inventories for exploration and land planning of high place-value mineral resources. The case of aggregates in Spain. Resour. Policy 2022, 79, 103096. [Google Scholar] [CrossRef]
  3. Union Européenne des Producteurs de Granulats (UEPG). Available online: https://uepg.eu/ (accessed on 12 January 2023).
  4. Gherman, I.-E.; Lakatos, E.-S.; Clinci, S.D.; Lungu, F.; Constandoiu, V.V.; Cioca, L.I.; Rada, E.C. Circularity Outlines in the Construction and Demolition Waste Management: A Literature Review. Recycling 2023, 8, 69. [Google Scholar] [CrossRef]
  5. Aquino, C.; Inoue, M.; Miura, H.; Mizuta, M.; Okamoto, T. The effects of limestone aggregate on concrete properties. Constr. Build. Mater. 2010, 24, 2363–2368. [Google Scholar] [CrossRef]
  6. Bustillo Revuelta, M. Construction Materials: Geology, Production and Applications; Springer: Cham, Switzerland, 2021; Volume IX, p. 602. [Google Scholar] [CrossRef]
  7. UNEP Global Environmental Alert Service. Sand, Rarer Than One Thinks; United Nations Environment Programme (UNEP): Nairobi, Kenya, 2014; p. 15. Available online: https://wedocs.unep.org/bitstream/handle/20.500.11822/8665/GEAS_Mar2014_Sand_Mining.pdf (accessed on 12 January 2023).
  8. Escavy, J.I.; Herrero, M.J.; Trigos, L.; Sanz-Pérez, E. Demographic vs economic variables in the modelling and forecasting of the demand of aggregates: The case of the Spanish market (1995–2016). Resour. Policy 2020, 65, 101537. [Google Scholar] [CrossRef]
  9. Sverdrup, H.U.; Koca, D.; Schlyter, P. A Simple System Dynamics Model for the Global Production Rate of Sand, Gravel, Crushed Rock and Stone, Market Prices and Long-Term Supply Embedded into the WORLD6 Model. Biophys. Econ. Resour. Qual. 2017, 2, 8. [Google Scholar] [CrossRef]
  10. Escavy, J.I.; Herrero, M.J.; Lopez-Acevedo, F.; Trigos, L. The progressive distancing of aggregate quarries from the demand areas: Magnitude, causes, and impact on CO2 emissions in Madrid Region (1995–2018). Resour. Policy 2022, 75, 102506. [Google Scholar] [CrossRef]
  11. Herrero, M.J.; Escavy, J.I.; Bustillo, M. The Spanish building crisis and its effect in the gypsum quarry production (1998–2012). Resour. Policy 2013, 38, 123–129. [Google Scholar] [CrossRef]
  12. Ministerio para la Transición Ecológica y el Reto Demográfico. Spanish Mining Statistics Data. Available online: https://www.miteco.gob.es/es/energia/mineria-explosivos.html (accessed on 20 December 2023).
  13. Franks, D.M. Reclaiming the neglected minerals of development. Extr. Ind. Soc. 2020, 7, 453–460. [Google Scholar] [CrossRef]
  14. Torres, A.; Brandt, J.; Lear, K.; Liu, J. A looming tragedy of the sand commons. Science 2017, 357, 970–971. [Google Scholar] [CrossRef] [PubMed]
  15. McCarthy, J. From here to human-level AI. Artif. Intell. 2007, 171, 1174–1182. [Google Scholar] [CrossRef]
  16. IBM. What is artificial intelligence (AI)? Available online: https://www.ibm.com/topics/artificial-intelligence (accessed on 12 January 2023).
  17. Herrero, M.J.; Pérez-Fortes, A.P.; Escavy, J.I.; Insua-Arévalo, J.M.; De la Horra, R.; López-Acevedo, F.; Trigos, L. 3D model generated from UAV photogrammetry and semi-automated rock mass characterization. Comput. Geosci. 2022, 163, 105121. [Google Scholar] [CrossRef]
  18. IBM. What Is Computer Vision? Available online: https://www.ibm.com/topics/computer-vision (accessed on 12 January 2023).
  19. Karn, A. Artificial Intelligence in Computer Vision. Int. J. Eng. Appl. Sci. Technol. 2021, 6, 249–254. [Google Scholar] [CrossRef]
  20. Mayer, H. Object extraction in photogrammetric computer vision. ISPRS J. Photogramm. Remote Sens. 2008, 63, 213–222. [Google Scholar] [CrossRef]
  21. Razeghi, O.; Solis-Lemus, J.A.; Lee, A.W.C.; Karim, R.; Corrado, C.; Roney, C.H.; de Vecchi, A.; Niederer, S.A. CemrgApp: An interactive medical imaging application with image processing, computer vision, and machine learning toolkits for cardiovascular research. SoftwareX 2020, 12, 100570. [Google Scholar] [CrossRef] [PubMed]
  22. Eyiokur, F.I.; Kantarci, A.; Erakin, M.E.; Damer, N.; Ofli, F.; Imran, M.; Krizaj, J.; Salah, A.A.; Waibel, A.; Struc, V.; et al. A survey on computer vision based human analysis in the COVID-19 era. Image Vis. Comput. 2023, 130, 104610. [Google Scholar] [CrossRef] [PubMed]
  23. Zhou, J.; Bischof, W.F.; Caelli, T. Road tracking in aerial images based on human–computer interaction and Bayesian filtering. ISPRS J. Photogramm. Remote Sens. 2006, 61, 108–124. [Google Scholar] [CrossRef]
  24. Wang, W.; Yang, N.; Zhang, Y.; Wang, F.; Cao, T.; Eklund, P. A review of road extraction from remote sensing images. J. Traffic Transp. Eng. (Engl. Ed.) 2016, 3, 271–282. [Google Scholar] [CrossRef]
  25. Weinstein, B.G. A computer vision for animal ecology. J. Anim. Ecol. 2018, 87, 533–545. [Google Scholar] [CrossRef] [PubMed]
  26. Onesait Platform. Early Fire Detection System. Available online: https://blog.onesaitplatform.com/en/2022/12/21/early-fire-detection-system/ (accessed on 12 January 2023).
  27. Thomas, G.; Gade, R.; Moeslund, T.B.; Carr, P.; Hilton, A. Computer vision for sports: Current applications and research topics. Comput. Vis. Image Underst. 2017, 159, 3–18. [Google Scholar] [CrossRef]
  28. Baduge, S.K.; Thilakarathna, S.; Perera, J.S.; Arashpour, M.; Sharafi, P.; Teodosio, B.; Shringi, A.; Mendis, P. Artificial intelligence and smart vision for building and construction 4.0: Machine and deep learning methods and applications. Autom. Constr. 2022, 141, 104440. [Google Scholar] [CrossRef]
  29. Mehmood, M.; Shahzad, A.; Zafar, B.; Shabbir, A.; Ali, N.; Ahmad, A. Remote Sensing Image Classification: A Comprehensive Review and Applications. Math. Probl. Eng. 2022, 2022, 5880959. [Google Scholar] [CrossRef]
  30. Sowmya, A.; Trinder, J. Modelling and representation issues in automated feature extraction from aerial and satellite images. ISPRS J. Photogramm. Remote Sens. 2000, 55, 34–47. [Google Scholar] [CrossRef]
  31. Anaconda Inc. Anaconda Software Distribution. Available online: https://docs.anaconda.com/ (accessed on 12 January 2023).
  32. Python. Python Software Foundation. 2020. Available online: http://www.python.org/ (accessed on 12 January 2023).
  33. ESRI. ArcGIS Desktop ArcCatalog, 10.5; Environmental Systems Research Institute: Redlands, CA, USA, 2016; Available online: https://desktop.arcgis.com/en/arcmap/latest/manage-data/using-arccatalog/what-is-arccatalog-.htm/ (accessed on 12 January 2023).
  34. ESRI. ArcGIS Desktop ArcMap, 10.5; Environmental Systems Research Institute: Redlands, CA, USA, 2016; Available online: https://desktop.arcgis.com/en/arcmap/latest/map/main/what-is-arcmap-.htm/ (accessed on 12 January 2023).
  35. ESRI. ArcGIS Arcpy; Environmental Systems Research Institute: Redlands, CA, USA, 2016; Available online: https://desktop.arcgis.com/en/arcmap/10.5/analyze/arcpy/what-is-arcpy-.htm (accessed on 12 January 2023).
  36. ESRI. World Imagery; ESRI (ArcGIS Services): Redlands, CA, USA, 2023. [Google Scholar]
  37. Wada, K.; mpitid; Buijs, M.; Zhang, C.N.; Narumi; Kubovčík, M.; Myczko, A.; latentix; Zhu, L.; Yamaguchi, N.; et al. Labelme: Image Polygonal Annotation with Python, 4.6.0. 2021; Available online: https://zenodo.org/records/5711226 (accessed on 12 January 2023).
  38. Boesch, G. A Complete Guide to Image Classification in 2023. Available online: https://viso.ai/computer-vision/image-classification/ (accessed on 27 February 2023).
  39. Paszke, A.; Gross, S.; Massa, F.; Lerer, A.; Bradbury, J.; Chanan, G.; Killeen, T.; Lin, Z.; Gimelshein, N.; Antiga, L.; et al. PyTorch: An Imperative Style, High-Performance Deep Learning Library. In Proceedings of the 33rd Conference on Neural Information Processing Systems (NeurIPS 2019), Vancouver, BC, Canada, 8–14 December 2019. [Google Scholar]
  40. Sathyan, A. Anilsathyan7/Pytorch-Image-Classification: First Release of Pytorch Image Classification (v1.0.0). 2021. Available online: https://zenodo.org/record/4429503 (accessed on 12 January 2023).
  41. Google. TensorFlow, a Free and Open-Source Software Library for Machine Learning and Artificial Intelligence, 2.11th ed. 2022. Available online: https://www.tensorflow.org/ (accessed on 12 January 2023).
  42. Alyafeai, Z. The U-Net Model Is a Simple Fully Convolutional Neural Network That IS Used for Binary Segmentation i.e., Foreground and Background Pixel-Wise Classification. In This Notebook We Use It to Segment Cats and Dogs from Arbitrary Images. 2020. Available online: https://colab.research.google.com/github/zaidalyafeai/Notebooks/blob/master/unet.ipynb (accessed on 12 January 2023).
  43. Ronneberger, O.; Fischer, P.; Brox, T. U-net: Convolutional networks for biomedical image segmentation. In Proceedings of the Medical Image Computing and Computer-Assisted Intervention–MICCAI 2015: 18th International Conference, Munich, Germany, 5–9 October 2015; Proceedings, Part III 18. pp. 234–241. [Google Scholar]
  44. Clark, A. Pillow, 9.4.0. 2023. Available online: https://pillow.readthedocs.io/en/stable/ (accessed on 12 January 2023).
  45. Redmon, J.; Divvala, S.; Girshick, R.; Farhadi, A. You Only Look Once: Unified, Real-Time Object Detection. In Proceedings of the 2016 IEEE Conference on Computer Vision and Pattern Recognition (CVPR), Las Vegas, NV, USA, 26 June–1 July 2016; pp. 779–788. [Google Scholar]
  46. O’Shea, K.; Nash, R. An introduction to convolutional neural networks. arXiv 2015, arXiv:1511.08458. [Google Scholar]
  47. Redmon, J. Darknet: Open Source Neural Networks in C. 2013. Available online: https://pjreddie.com/darknet/ (accessed on 12 January 2023).
  48. Oh, F. What Is CUDA? Available online: https://blogs.nvidia.com/blog/what-is-cuda-2/ (accessed on 27 February 2023).
  49. OpenCV. About OpenCV. Available online: https://opencv.org/about/ (accessed on 27 February 2023).
  50. Hasty.ai. Intersection over Union (IoU). Available online: https://hasty.ai/docs/mp-wiki/metrics/iou-intersection-over-union (accessed on 7 February 2023).
  51. Wu, Z. Computer Vision-Based Traffic Sign Detection and Extraction: A Hybrid Approach Using GIS And Machine Learning. Master’s Thesis, Georgia Southern University, Statesboro, GA, USA, 2019. [Google Scholar]
  52. Aleqabie, H.J. Recognition of Primary Geometric Shapes Using Image Segmentation and Blobs. Eur. Acad. Res. 2014, 2, 6067–6075. [Google Scholar]
  53. Bleischwitz, R.; Bahn-Walkowiak, B. Aggregates and Construction Markets in Europe: Towards a Sectoral Action Plan on Sustainable Resource Management. Miner. Energy-Raw Mater. Rep. 2007, 22, 159–176. [Google Scholar] [CrossRef]
  54. Neumayer, E. Does the “Resource Curse” hold for Growth in Genuine Income as Well? World Dev. 2004, 32, 1627–1640. [Google Scholar] [CrossRef]
  55. Escavy, J.; Herrero, M. The use of location–Allocation techniques for exploration targeting of high place-value industrial minerals: A market-based prospectivity study of the Spanish gypsum resources. Ore Geol. Rev. 2013, 53, 504–516. [Google Scholar] [CrossRef]
  56. Traeger, C.; Haski-Leventhal, D.; Alfes, K. Extending organizational socialization theory: Empirical evidence from volunteer work for refugees in France and Australia. Hum. Relat. 2021, 75, 1140–1166. [Google Scholar] [CrossRef]
Figure 1. Workflow of the process developed for the aggregates quarry detection.
Sustainability 16 03099 g001
Figure 2. Examples of different types of active aggregates quarries. (A) Quarry located within a forest in the north of Spain, with a restored zone on the left side of the quarry. (B) Quarry in a dryland area in the south of Spain. (C) Quarry near a hill, in the central part of Spain. (D) Quarry for ornamental rocks (aggregates are in this case a by-product).
Sustainability 16 03099 g002
Figure 3. Process of segmentation of an aggregate quarry. (A) Satellite image where a quarry has been digitized. (B) Mask calculated with the machine learning model. (C) The aggregates quarry resulting from clipping the satellite imagery with the mask proposed by the model.
Sustainability 16 03099 g003
Figure 4. Example of object detection within a quarry. (A) Image of a quarry, where the red line represents the limits of the quarry, and the bounding boxes (blue and pink) indicate the locations of different types of objects within an aggregates quarry. This image and its content are used for the training, so dotted points are the input used for the training. (B) After computer vision analysis, the objects inside the quarry are identified, with a detection value confidence expressed as per unit.
Sustainability 16 03099 g004
Figure 5. Location of the area (South Portugal) used to validate the methodology developed in this study. (A) Boundaries of mainland Portugal (red line) and the location of the Faro district in the southern part of the country (red area). (B) District of Faro and aggregates quarries locations (dots with icons). (C,D) Examples of two aggregates quarries detected by computer vision by the model in the Faro area. (E) Image of an undetected abandoned quarry presenting darker colors due to the weathering of the rocks.
Sustainability 16 03099 g005
Figure 6. Location of the Madrid province within continental Spain. (A) Location of the main aggregates quarries within the province of Madrid (blue cross symbols) based on data obtained from official data sources. (B) Location of aggregate quarries (pink cross symbols) obtained by the computer vision software developed in this study. It is observed how the amount and accuracy of data are improved after the present analysis.
Sustainability 16 03099 g006
Disclaimer/Publisher’s Note: The statements, opinions and data contained in all publications are solely those of the individual author(s) and contributor(s) and not of MDPI and/or the editor(s). MDPI and/or the editor(s) disclaim responsibility for any injury to people or property resulting from any ideas, methods, instructions or products referred to in the content.

